 Longyu Li1,2
 Tao Liu1*
 Hui Huang1,2
 Hong Song1
 Shuangyan He1,2
 Peiliang Li1,2*
 Yanzhen Gu1,2
 Jiawang Chen1,2
- 1Ocean College, Zhejiang University, Zhoushan, China
- 2Hainan Institute, Zhejiang University, Sanya, China
Starfish have a wide range of feeding habits, including starfish, sea urchins, sea cucumbers, corals, abalones, scallops, and many other marine organisms with economic or ecological value. The starfish outbreak in coastal areas will lead to severe economic losses in aquaculture and damage the ecological environment. However, the current monitoring methods are still artificial, time-consuming, and laborious. This study used an underwater observation platform with multiple sensors to observe the starfish outbreak in Weihai, Shandong Province. The platform could collect the temperature, salinity, depth, dissolved oxygen, conductivity, other water quality data, and underwater video data. Based on these data, the paper proposed an early warning model for starfish prevalence (EWSP) based on multi-sensor fusion. A deep learning-based object detection method extracts time-series information on the number of starfish from underwater video data. For the extracted starfish quantity information, the model uses the k-means clustering algorithm to divide the starfish prevalence level into four levels: no prevalence, mild prevalence, medium prevalence, and high prevalence. Correlation analysis concluded that the water quality factors most closely related to the starfish prevalence level are temperature and salinity. Therefore, the selected water quality factor and the number of historical starfish are inputted. The future starfish prevalence level of the starfish outbreak is used as an output to train the BP (back propagation) neural network to build EWSP based on multi-sensor fusion. Experiments show that the accuracy rate of this model is 97.26%, whose precision meets the needs of early warning for starfish outbreaks and has specific application feasibility.
1 Introduction
Starfish are one of the most common carnivorous echinoderms in coastal areas. It has robust reproductive and regeneration capabilities and uses shellfish and corals as food sources. The characteristics and feeding habits of starfish enable them to reproduce rapidly in a suitable environment, forming a large-scale starfish outbreak disaster and causing significant damage to shellfish farming and coral ecosystems (Babcock et al., 2020; Wang et al., 2021). In coral ecosystems on the Great Barrier Reef in Australia, Acanthaster planci (Crown-of-Thorn Starfish, COTS) outbreaks are one of the most prominent factors in coral degradation (Pratchett et al., 2019; Westcott et al., 2020). In marine ranching, predatory starfishes such as Japanese common starfish and Asterias rubens (sugar starfish) are the main predators of farmed shellfish (Miyoshi et al., 2019; Agüera et al., 2021). The main food of adult Asterias amurensis and Patiria pectinifera are bivalve mollusks. A large-scale outbreak of the population will have a huge impact on the population of shellfish, especially the Ruditapes philippinarum. It is of great significance to protect coral ecosystems and marine pastures by monitoring the scale of starfish aggregation and assessing the possibility of starfish prevalence to take management measures to reduce the losses caused by starfish outbreaks. In 2012, Kayal et al. developed the SCUBA-tow technology based on Manta-tow and SCUBA to track the distribution and density of starfish aggregations (Kayal et al., 2012). Suzuki et al. used a DNA barcoding approach to describe the distribution of COTS larvae in Sekisei Lagoon, Ryukyu Archipelago, Japan (Suzuki et al., 2016). Saponari et al. used snorkeling at shallow depths (0–5 m) and scuba diving at greater depths (5–30 m) to monitor and assess starfish outbreaks in Ari Atoll, Republic of Maldives, over 2 years (Saponari et al., 2018). Dumas et al. adopted the method of citizen science to monitor starfish outbreaks, effectively increasing the observation range and detection quantity (Dumas et al., 2020). Uthicke et al. developed an eDNA method to detect the density of crown-of-thorns starfish early in the outbreak (Uthicke et al., 2022). Rogers et al. used an empirically tuned, individual-based simulation model to investigate how density and aggregation influence COTS reproductive success, and quantified a threshold level of density and aggregation above which reproductive success will increase dramatically (Rogers et al., 2017). Ecological analysis methods also informed management targets for the culling of starfish to prevent coral decline (Plagányi et al., 2020). Besides ecology-based methods, image-processing techniques are also used for starfish detection. Gesú et al. proposed three feature indicators for identifying starfish from starfish video sequences based on the unique shape of starfish (Gesú et al., 2003). Clement et al. developed a local binarization method based on texture features to automatically detect starfish images (Clement et al., 2005). Smith and Dunbabin developed a novel shape recognition algorithm to classify the Northern Pacific Sea Star autonomously (Smith & Dunbabin, 2007). Gobi demonstrated using local invariant features, specifically SIFT features, in the visual recognition and identification of starfish (Gobi, 2010). Dayoub et al. proposed a method based on a random forest classifier (RFC) to train images to assist underwater robotic systems in the detection and tracking of crown-of-thorns starfish (COTS) (Dayoub et al., 2015).
However, the methods, including SCUBA-tow technology and DNA barcoding technology, are all implemented in the form of on-the-spot surveys, which have problems of poor timeliness and high cost and have high requirements for human resources and material resources. Methods based on traditional image processing technology have the problem of poor generalization, and it is easy to reduce processing precision due to scene transformation. To overcome the above difficulties, image-processing techniques based on deep learning have been gradually applied to starfish detection in recent years. Liu et al. released a large-scale, annotated underwater image dataset, called the CSIRO dataset, from a COTS outbreak area on the GBR, to encourage research on Machine Learning and AI-driven technologies to improve the detection, monitoring, and management of COTS populations at reef scale (Liu et al., 2021). Based on the CSIRO dataset, Truong proposed a deep learning model based YOLOv5 (YOU ONLY LOOK ONCE version 5) algorithm to automatically detect the COTS to prevent the outbreak and minimize coral mortality in the Reef (Truong, 2022). Nguyen applied advanced data augmentation methods for enhancing the quality and quantity of the CSIRO dataset to train and evaluate the COTS detection model with the YOLOv5 algorithm, which is used for embedded systems and mobile devices (Nguyen, 2022). Heenaye-Mamode Khan et al. proposed a novel approach for the automatic detection of COTS-based Convolutional Neural Network (CNN) with an enhanced attention module (Heenaye-Mamode Khan et al., 2023). Sheth and Prajapati detected COTS using various deep learning models and compared their accuracies to find the best model based on its performance (Sheth & Prajapati, 2022).
It is plausible that environmental conditions affecting starfish larvae’s survival and development act similarly on each species of the same type (Yamaguchi, 1973). Temperature and salinity are very important for the survival of COTS larvae. Larvae die quickly at temperatures above 32°C and slowly at lower temperatures. Therefore, COTS larvae are widely distributed in the waters of the Great Barrier Reef, where the maximum water temperature is 27–28°C. The study also showed that larvae developed faster in low-salinity conditions (Lucas, 1973). Kashenko researched the lower limit of seawater desalination tolerance range of A. amurensis and P. pectinifera (blue bat star). The results showed that the P. pectinifera has a higher tolerance to salinity, under 18‰ still alive, while the A. amurensis is 22‰ (Kashenko, 2003). Caballes et al. studied the environmental critical points of each link in the development of the COTS. The results showed that gametes, fertilization, and embryos have a wide range of adaptability to temperature, salinity, and pH. Then, they proposed that compared with the early developmental stages, the scope of environmental adaptation may be narrowed during ontogeny in the later stage (Caballes et al., 2017). Novia Arinda Pradisty et al. evaluated more than 10 environmental parameters and determined the environmental parameters with a more significant correlation with starfish survival through redundancy analysis (RDA), including salinity, turbidity, and dissolved inorganic nitrogen (Pradisty et al., 2020). Chen et al. found that environmental (nutrient concentration) and oceanic factors (ocean currents) played an essential role in the genetic feature and larval dispersal of starfish populations (Chen et al., 2021b). In recent years, multi-sensor fusion methods that integrate multiple data sources have been widely used. Manzione and Castrignanò have used a multi-source data fusion method based on multivariate geostatistics to predict the depth of groundwater levels (Manzione & Castrignanò, 2019). Nti et al. fused data from different sensors to predict the stock market (Nti et al., 2021). Hou et al. proposed a multi-source spatiotemporal data fusion model for sea surface temperature prediction (Hou et al., 2022). Jiang et al. proposed a deep learning method based on multi-sensor fusion to predict the water quality of urban sewage pipe networks (Jiang et al., 2021). To promote the monitoring and prediction of harmful algal blooms, a multi-element fusion prediction (MEFP) method for cyanobacteria bloom was proposed (X. Chen et al., 2022). Tang et al. created a multisource hybrid dataset for deep learning model training to predict harmful algal bloom events in Lake Okeechobee (Tang et al., 2022).
In the past, the impact of environmental factors on starfish was mainly the result of laboratory experiments or long-term scattered collection results. However, no intensive collection of environmental factors was taken. The data source of environmental factors used in this paper comes from the in situ intensive collection method of the multi-parameter water quality meter. The amount of data is larger, which is significant for accurately identifying environmental factors related to starfish outbreaks and early warning research. The data used in this paper come from the underwater observation platform arranged in the marine ranch in Weihai, Shandong Province, which mainly breeds sea cucumbers. Limited by the location of the platform, the research object of this paper is P. pectinifera. Although it poses no threat to coral or shellfish farming, it is an important predator of sea cucumbers (Lambert, 1997; Popov et al., 2014); P. pectinifera has been observed by the platform. Based on the platform and machine learning algorithm, the starfish disaster situation in the target sea area was subdivided. A starfish disaster warning was established—EWSP. The following describes the overall framework of the model first and then describes the implementation steps of each sub-module. Finally, the performance of the model is evaluated.
2 Materials and methods
The data used to study the early warning model for starfish outbreak disasters (EWSP) include starfish number, temperature, salinity, depth, and dissolved oxygen. Among them, the number of starfish was calculated according to the maximum value per hour, and the temperature, salinity, depth, and dissolved oxygen were calculated according to the average value per hour. Figure 1 shows the entire process from raw data acquisition to the final EWSP. The process was mainly divided into four parts.
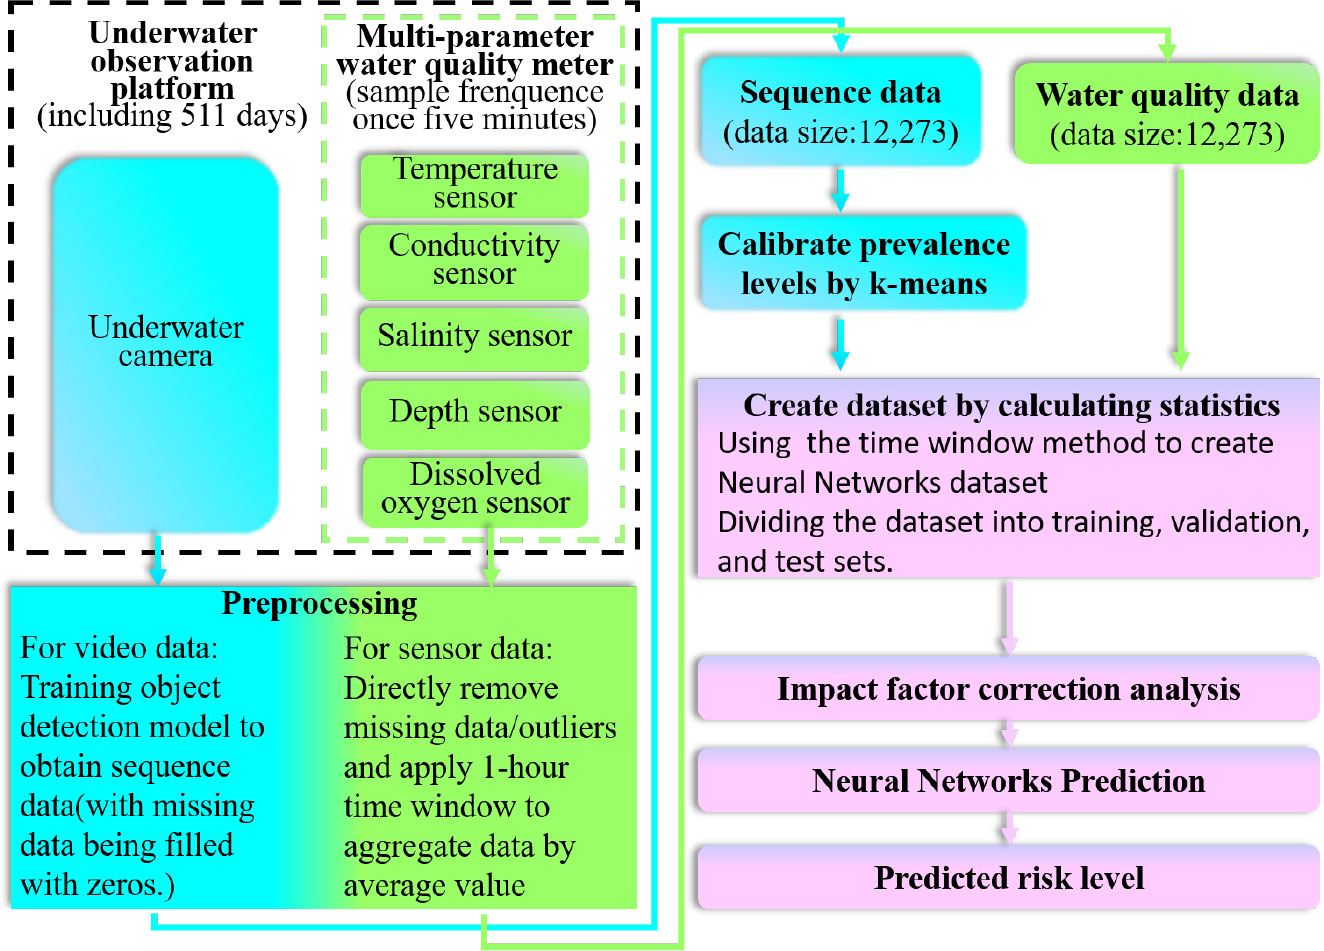
Figure 1 Schematic diagram of the EWSP.
2.1 The data preprocessing section
This section described the method of processing video data into starfish numbers and the preprocessing operation of water quality parameters.
2.2 The calibration section of the starfish prevalence level
This section used a clustering algorithm to calibrate the starfish prevalence level.
2.3 Parameter selection section
This part combined the correlation analysis between the water quality parameters and the starfish prevalence level to obtain the influence of the water quality parameters. It selected the data corresponding to the parameters with a more significant impactful than the training data.
2.4 Neural networks training and prediction section
The parameters with significant correlation and the historical number of starfish were the input, and the future starfish prevalence level was the output. A starfish early warning model was established using a BP neural network based on deep learning.
2.5 Data source
The data were collected from the underwater observation platform located in the marine ranching in the northern part of Weihai, China, as shown in Figure 2. The platform was placed 13 m underwater and measures 2 m long, 2 m wide, and 1 m high. The platform is equipped with various sensors, including underwater cameras and multi-parameter water quality sensors, to provide underwater video data and various water quality parameters such as temperature, salinity, depth, dissolved oxygen, and conductivity. The underwater camera used in this platform is a ROS-C 600 marine high-definition color camera with 30× optical zoom and 80° ultra-wide angle. The multi-parameter water quality sensor configured on the platform is the UMI-OT series, which can simultaneously observe multiple water quality parameters. The sensor parameters are shown in Table 1. The period of video and water quality parameter data used in this study is from May 2020 to October 2021. Eight kinds of marine life can be detected in the video, such as P. pectinifera, Gymnocorymbus ternetzi, Stichopus japonicus, and Scophthalmus maximus, and obtained 278 days of data between May 2020 and October 2021; the missing part was concentrated in December 2020 to June 2021 and October 2020, the main reason for which is that the water body is completely turbid, leading to video that cannot be used or video that cannot be saved owing to hard disk failure.
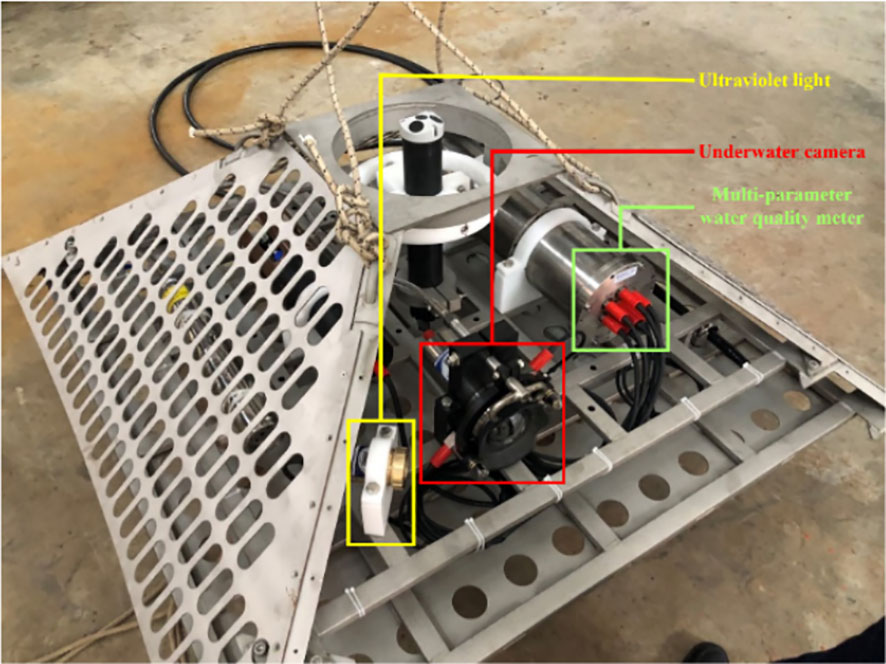
Figure 2 Underwater observation platform.
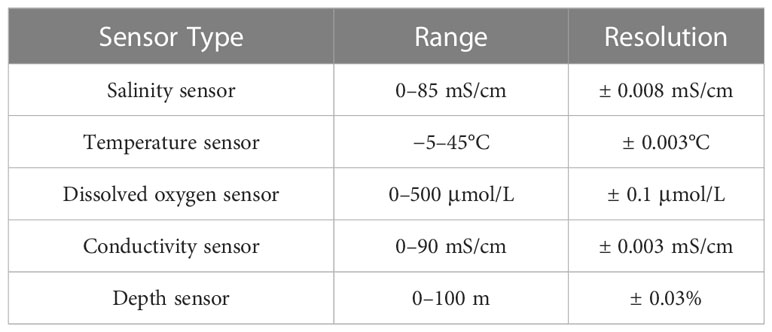
Table 1 Sensor parameters.
2.6 Data preprocessing
2.6.1 Preprocessing of video
In this study, 800,000 images were extracted at fixed intervals from the video data from May 2020 to October 2021, and 5,349 images were selected as a dataset and labeled. The selection principles were as follows:
2.6.1.1 Principle 1
The number of pictures selected each month is as close as possible. Because the turbidity of the water body varies slightly in each month, this can prevent the data distribution from shifting and the object detection model can only be used in certain months and is not robust.
2.6.1.2 Principle 2
Do not select pictures that are close in time because the P. pectinifera, as a slow-moving echinoderm, will not have a big difference in the distribution in a short time.
2.6.1.3 Principle 3
Pick images with better lighting conditions that will be more conducive to labeling.
The selected pictures were divided into the training set, testing set, and validation set according to the commonly used ratio of 6:2:2. In a total of 5,349 images, 3,209 images are selected as the training data, 1,070 images are chosen as the testing data randomly, and the remaining 1,070 images are used as the testing data. The training set was used to train the detection model. The validation set was used to reflect the training process. The testing set was used to test the generalization ability of the detection model.
The detection model used in this study was the yolov5 algorithm based on deep learning. The detection model was constructed through the target detection algorithm, the target in the image was recognized, and the number of the same category is counted. Using 5,349 pictures to obtain a trained detection model, the detection model had an accuracy rate of 95% for the primary research target starfish. The detection model was applied to all videos from May 2020 to October 2021. The sequence data of the number of starfish over time resulted from preprocessing of the video. The sequence data were divided by taking the maximum value every hour, with missing data being filled with zeros. This method resulted in 12,273 data samples corresponding to 12,273 h of data.
2.6.2 Water quality data preprocessing
Water quality data of the multi-parameter water quality meter used in this study include five parameters: temperature, conductivity, depth, dissolved oxygen, and salinity. Sensors that provide raw data may experience various malfunctions that result in missing values or outliers that are significantly different from other values. For such data, we adopt the method of direct discarding to remove them from our analysis. The sensor sampling frequency was once every 5 min. To align the water quality data with the sequence data in time, the following operations are performed: firstly, the missing values and outliers are directly deleted, and then the moving average method with a window size of 1 h is used to calculate each average value over the hour. The water quality data were divided into 12,273 subsets at 1-h intervals.
2.6.3 Data normalization
Data normalization is an essential operation in data preprocessing. In this study’s data analysis process, the units and magnitudes of various data are vastly different because the data come from different sensors. The data normalization method is used to scale the original data and eliminate the effect of the unit. It is calculated as follows:
where wij is the value of the ith water quality parameter at the jth moment.
2.7 Calibration of starfish prevalence level
The starfish prevalence level is often determined according to the number of starfish. Owing to starfish’s different survival and development statuses in different sea areas, it was difficult to define a unified standard (Hughes et al., 2014). When people classify starfish prevalence levels, they usually draw a rough classification standard based on the damage caused by starfish outbreaks to the local ecological environment. However, the description of the boundary between different levels was often vague, and a large area of uncertainty is prone to appear. In this study, we used the self-supervised method. The K-means clustering algorithm, which often was used for level classification, was used to classify starfish outbreak disasters, which can calibrate the number of different starfish to as many levels as possible to maximize the interval between samples (Hartigan & Wong, 1979; Li et al., 2016; Rifa et al., 2020).
2.7.1 Initial point selection
The interval between different calibration results is determined according to the data distribution, avoiding human subjectivity. The results of the k-means algorithm largely depend on the position of the initial point, which means that the results have great randomness (Erisoglu et al., 2011). Because of the random selection of the initial point, the calculation results will be different each time, and this error cannot be avoided. There are specific errors in any clustering algorithm. To reduce the error caused by randomness, this study will select multiple random initial points, calculate the similarity between classification results, and select the one with the highest similarity with other classification results. The classification result is the final level calibration result. The calculation of the similarity refers to Eq. 2 in Section 2.8.1.
2.7.2 Hyperparameter selection
To begin with, the sequence data are first aggregated using a time window of size s and a step size of 1 day. This process results in a three-dimensional feature point for each aggregation part, including data statistics within the calculation window. The three statistics included in the feature point are the average value, maximum value, and standard deviation. Choose k value as the number of clusters in the k-means algorithm and the number of classifications of the starfish prevalence level. The specific meanings of k and s are shown in Table 2.
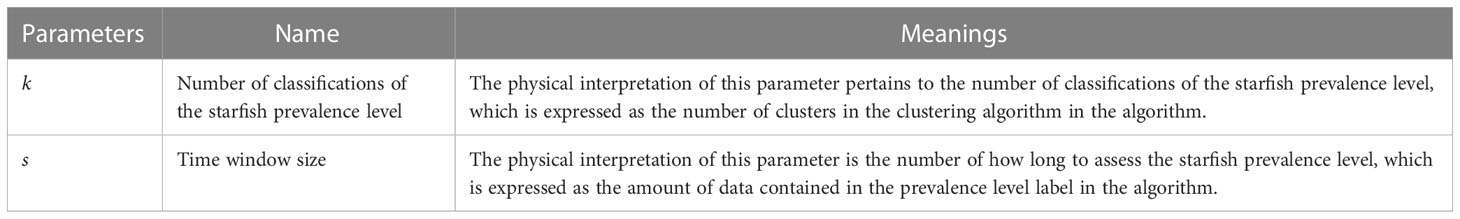
Table 2 Specific meanings of k and s.
Therefore, two hyperparameters, k and s, need to be selected in the steps of using this algorithm. The specific selection method is as follows: give a set of commonly used k values and a set of s values, combine them, and give each feature point a feature label through the k-means algorithm. In the complete dataset, according to the time series, select the feature label to which the nearest feature center in time belongs. The new feature label sequence obtained by combining each kind of k and s is calculated according to the correlation between the corresponding time and the original data sequence of the number of starfish. Then, the k and s values are determined by comprehensively considering the actual engineering situation and the correlation. Table 3 shows the classification of marine biological prevalence levels by countries around the world. It can be seen from the table that the classification of marine animal prevalence level in practice is mainly divided into two to five levels, with three levels and four levels being the most common. Therefore, a set of k = [2,3,4,5] is selected.
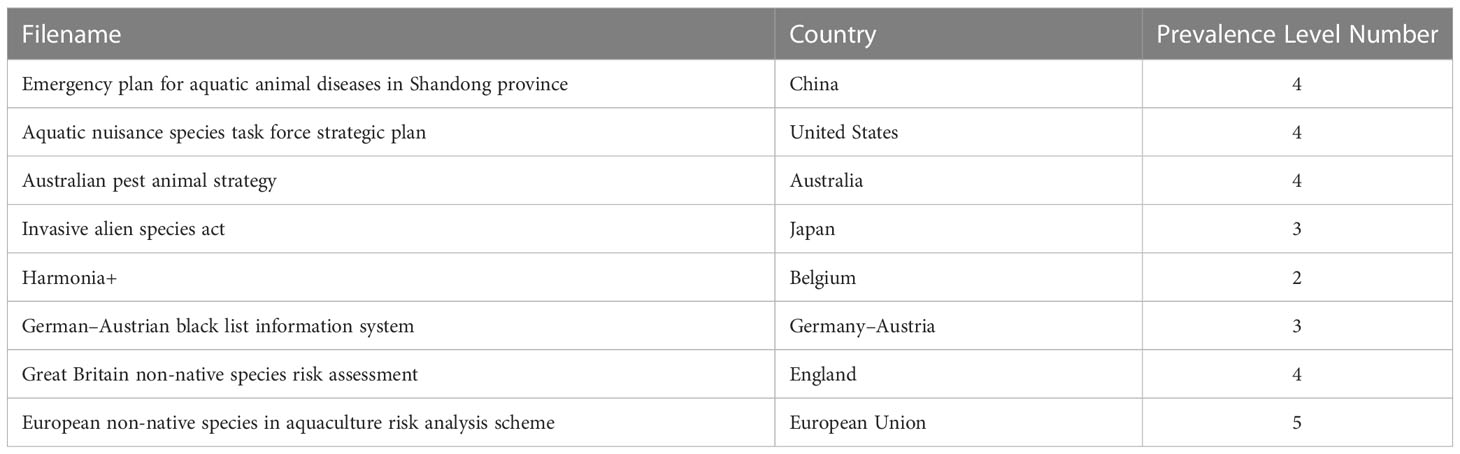
Table 3 Marine biological prevalence management file.
At the same time, according to some China official documents, such as “the notice on establishing and improving the marine ecological early warning and monitoring system by the ministry of natural resources”, “the emergency response plan for storm surge, waves, tsunamis and sea ice”, and “the provision on national marine warning report consultation”, weekly and monthly periods are common reporting cycles for marine disaster warning reports. Therefore, a set of s = 7–30 was selected.
2.8 Parameter selection
It is necessary to select parameters to reduce the complexity of the EWSP model, reduce the prevalence of overfitting, and enhance the generalization ability.
2.8.1 Linear correlation analysis
To describe the qualitative relationship between the factors affecting the starfish outbreak disaster and the starfish prevalence level and to screen out water quality parameters that are more relevant to the starfish prevalence level, it is necessary to calculate the correlation between each parameter and the starfish prevalence level (Chen et al., 2021a). We use the Pearson correlation coefficient during the feature selection process (Li et al., 2016; Jayaweera & Aziz, 2018). The Pearson correlation coefficient is usually used to measure the degree of linear correlation between two variables. The larger the absolute value, the higher the correlation, and positive or negative represents the positive or negative correlation, respectively. It is calculated as follows:
where ri is the Pearson correlation coefficient between the ith water quality parameter and the starfish prevalence level (−1≤ ri ≤ 1), is the average of the numerical sequence corresponding to the ith water quality parameter, lj is the calibration value of the starfish prevalence level at the jth moment, and j is the average value of the calibration value of the starfish prevalence level.
2.8.2 Nonlinear correlation analysis
There are some disadvantages to using only the Pearson correlation coefficient analysis. The Pearson correlation coefficient can well characterize the linear relationship between two variables, but when there is a nonlinear relationship between them, this ability to represent it will be significantly reduced. Therefore, this paper uses the Spearman correlation coefficient to measure the nonlinear correlation between parameters and quantities (Paul et al., 2017; Cai et al., 2019). Here, we briefly explain the Spearman correlation coefficient. The Spearman correlation coefficient is the Pearson correlation coefficient between grade variables. Its original calculation formula is similar to the Pearson correlation coefficient calculation formula. The difference is that the original data are converted into grade data, and the original data are based on their average. The descending position is given a corresponding rank. The absolute value of Spearman’s coefficient indicates the degree of dependence. The larger the absolute value, the higher the monotonic correlation. Its calculation formula can be simplified as:
epi is the Spearman correlation coefficient between the ith water quality parameter and the starfish prevalence level (−1≤pi≤1), R(wij) and Rlj respectively represent the ranking of the value of the ith water quality parameter at the jth moment in its numerical sequence in descending order and the ranking of the starfish prevalence level calibration value at the jth moment in its numerical sequence in descending order, and n is the sample size of the numeric sequence.
2.8.3 Correlation parameter selection
The Pearson correlation coefficient is mainly used to measure the linear correlation between two variables, so it is susceptible to outliers. Compared with the Pearson correlation coefficient, the Spearman correlation coefficient is a correlation coefficient based on the rank of the data. Since the amount of data directly manipulated is rank, the coefficient is robust to outliers and can reflect nonlinear relationships. Therefore, the selection of high-correlation parameters in this paper should consider both. The calculation method of the parameter selection evaluation index pi is as follows (Cai et al., 2019):
where pi is the selection evaluation index of the ith water quality parameter (0≤pi≤2). According to its calculation formula and range, the category of parameters defined here with a pi greater than 1.5 will be selected as BP neural network model’s input features.
2.9 Training based on BP neural network model
2.9.1 Structure of the BP neural network model
A multilayer perceptron BP neural network model is established as the early warning model for starfish outbreak disasters. The output is the average of the starfish prevalence level in the next period. The structure of the BP neural network model is shown in Figure 3, which includes an input layer, three hidden layers, and an output layer. The input layer receives a tuple, and after the activation of three hidden layers, a probability tuple is an output in the output layer.
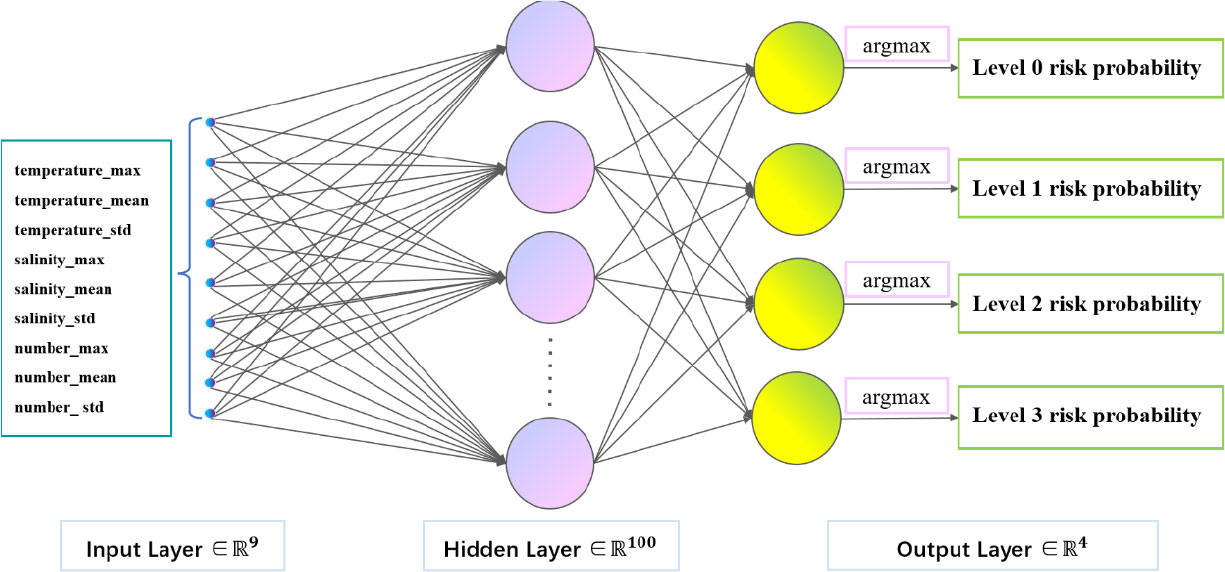
Figure 3 The BP neural network structure.
2.9.2 Dataset of the BP neural network model
To construct the BP neural network dataset, the time window method was used with a step size of 1 h. Specifically, the dataset feature part consists of 336 consecutive hours of the water quality data and sequence data statistics, including mean, maximum, and standard deviation values. The dataset label part consists of the corresponding maximum prevalence level occurring in the next 72 h after the 336 h. The dataset contains 11,864 data samples, which are divided into three parts: 7,118 for training, 2,374 for validation, and 2,372 for testing, in a ratio of 6:2:2.
3 Results and discussion
3.1 Prevalence level calibration
This study used the K-means algorithm to divide the starfish prevalence level. The division method is based on the actual number of starfish. To divide results more relevant and robust to the number of starfish, a set of commonly used k = [2,3,4,5] was set, and according to the observations widely used in actual engineering interval s = 7 – 30. Among them, k was the number of classification of starfish prevalence levels in this method, and s was the length of the sub-dataset after division. According to the ecological prevalence level classification standard commonly used in marine engineering practice and the requirement that the calibration results be robust to the number of oceans, we set k to 4 and s to 14 as the model hyperparameters among the parameter combination results. After choosing the hyperparameters, 18 random selections are made to determine the initial point, and the correlation between each clustering result and other results is calculated and summed. The result with the highest correlation sum is used as the final initial point. The dataset used in this model contains 511 days of data. After data aggregation with s = 14, 482 feature points are obtained for clustering. The clustering results are interpreted as follows: Each feature point is represented by three statistics (average value, maximum value, and standard deviation) as the coordinate axes, and the resulting clustering is visualized in Figure 4A. Figure 4B shows the results of calibrating the clustering results to each sequence data according to the date, including 12,273 data.
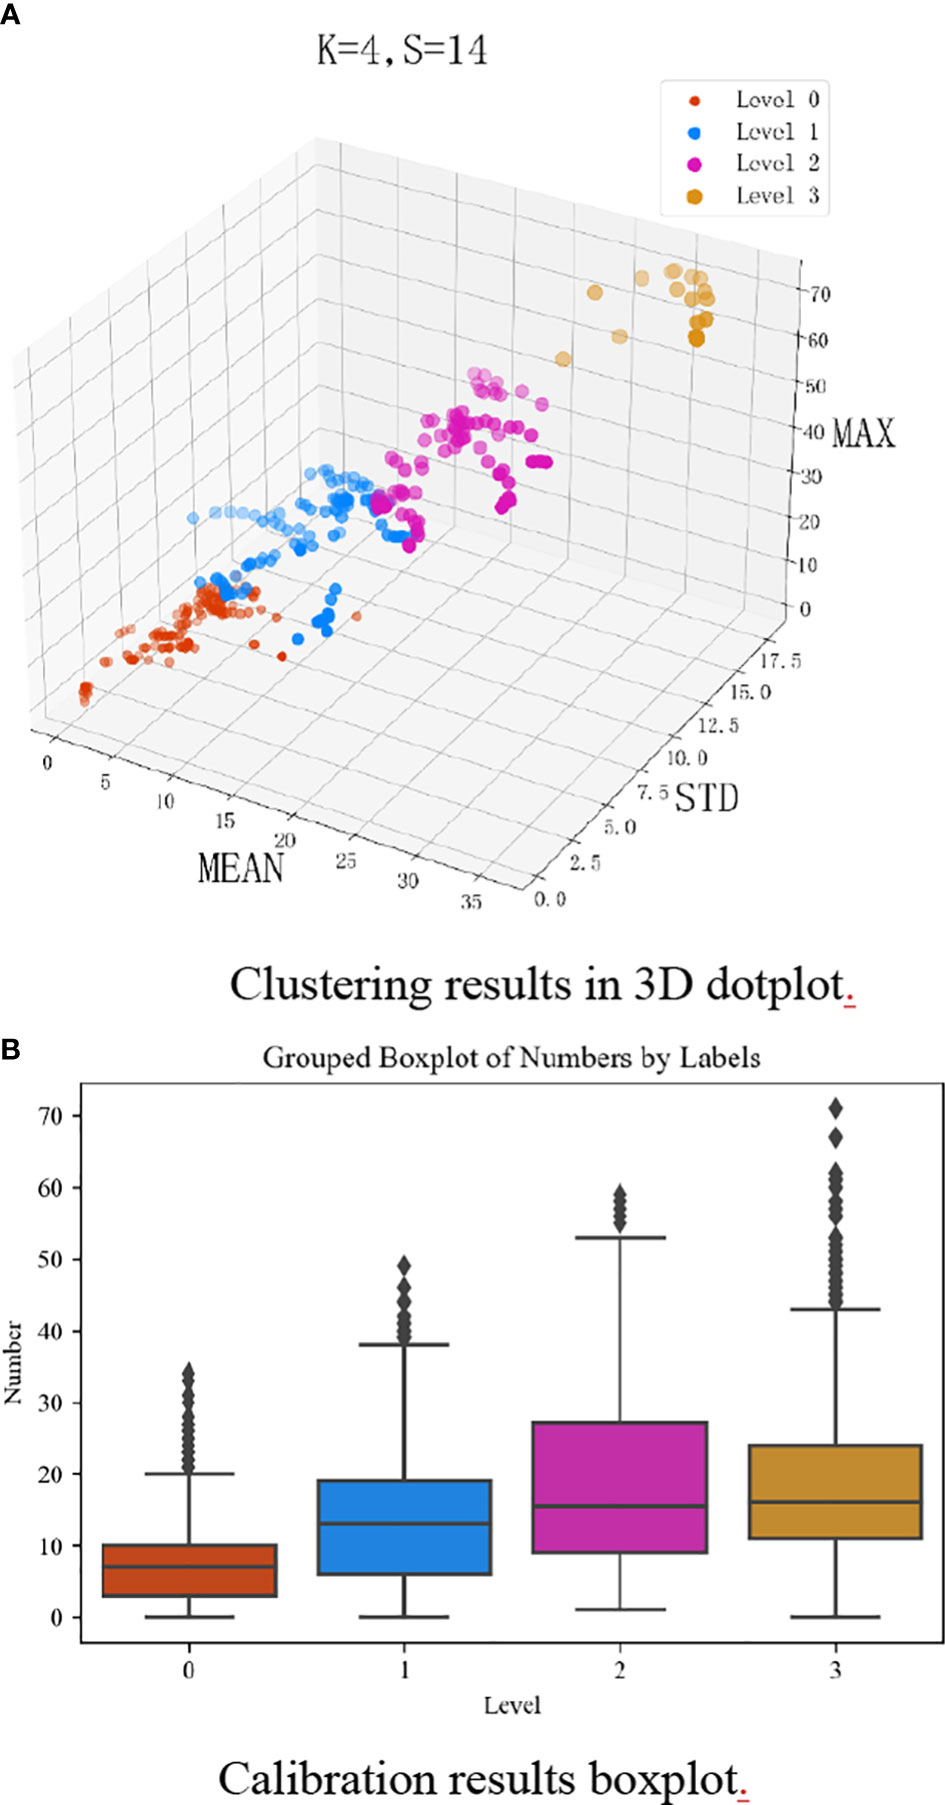
Figure 4 (A) Visualization of clustering results for different prevalence levels when k = 4 and s = 14. (B) The dotplot illustrates the clustering of data points, while the annotated boxplot presents the corresponding results.
The specific meaning of Figure 4 is as follows: Level 0 feature points are mostly concentrated in areas where the average, maximum, and standard deviation are relatively small, indicating that in this prevalence level, the target waters are likely to maintain a stable and low number of starfish. Feature points with level 1 have the characteristics of a small mean, small maximum, and large standard deviation, indicating that the number of starfish in the target waters at this prevalence level will fluctuate greatly and may return to a stable state of low numbers, but there is also a possibility of a sudden increase in number. Prevalence level 2 feature points have the characteristics of a small mean, large maximum, and large standard deviation, indicating that the number of starfish at this prevalence level is likely to reach a level of excessive aggregation that poses a threat to the ecology of the target waters. In prevalence level 3, the maximum, mean, and standard deviation are all very large, and the number is in a range that needs urgent control and is likely to continue to aggregate in the future. For the clustering results under s = 14,k = 4, we can give the description of the prevalence level division in Table 4.
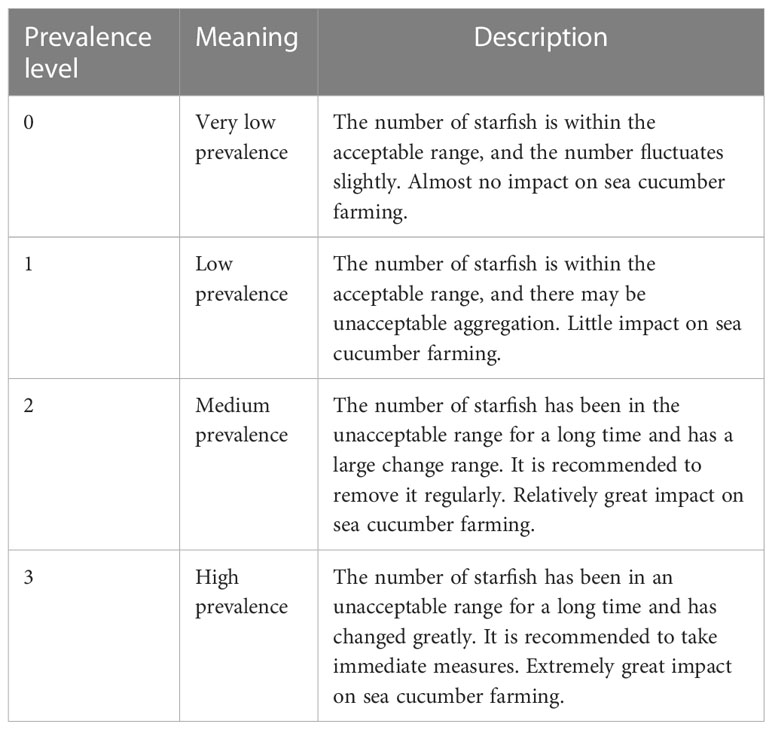
Table 4 Different prevalence level specific meanings and description.
3.2 Impactful factor selection
This study used the Pearson correlation coefficient and the Spearman correlation coefficient to calculate the parameters related to the starfish habitat collected by the sensors. Firstly, the Pearson correlation coefficient was used to calculate the correlation between the temperature, depth, salinity, electrical conductivity, dissolved oxygen, and the starfish prevalence level. Among them, depth and dissolved oxygen are negatively correlated with the starfish prevalence level, and other indicators are positively correlated with the starfish prevalence level. Secondly, the Spearman correlation coefficient is used to calculate the correlation between the temperature, depth, salinity, electrical conductivity, dissolved oxygen, and the starfish prevalence level. Among them, temperature and electrical conductivity have a more significant correlation with the starfish prevalence level, indicating that they have a more impactful effect on the occurrence of disasters.
After obtaining the calculation results of Pearson’s and Spearman’s correlation coefficients, we use the parameter selection evaluation index to evaluate each impactful factor. The results are shown in Table 5. It can be seen from the table that salinity and temperature are the two most impactful factors according to the calculation method of this evaluation index. Therefore, the input feature group of the starfish outbreak disaster-grade BP neural network model should include temperature and salinity.

Table 5 Calculation results of parameter selection evaluation index pi.
3.3 Parameters of the BP neural network
The BP neural network used in this paper is a three-layer BP neural network model, with 9 nodes in the input layer, 1,000 nodes in the hidden layer, and 4 nodes in the output layer. The input vector includes the average, standard deviation, and maximum value of historical temperature, salinity, and the number of starfish. The output results represent the predicted probabilities of the four prevalence levels. The activation function adopts the relu function. The essence of predicting the prevalence level is a multi-classification problem. The loss function uses cross-entropy loss. Figure 5 shows the number of starfish and their predictions over time.
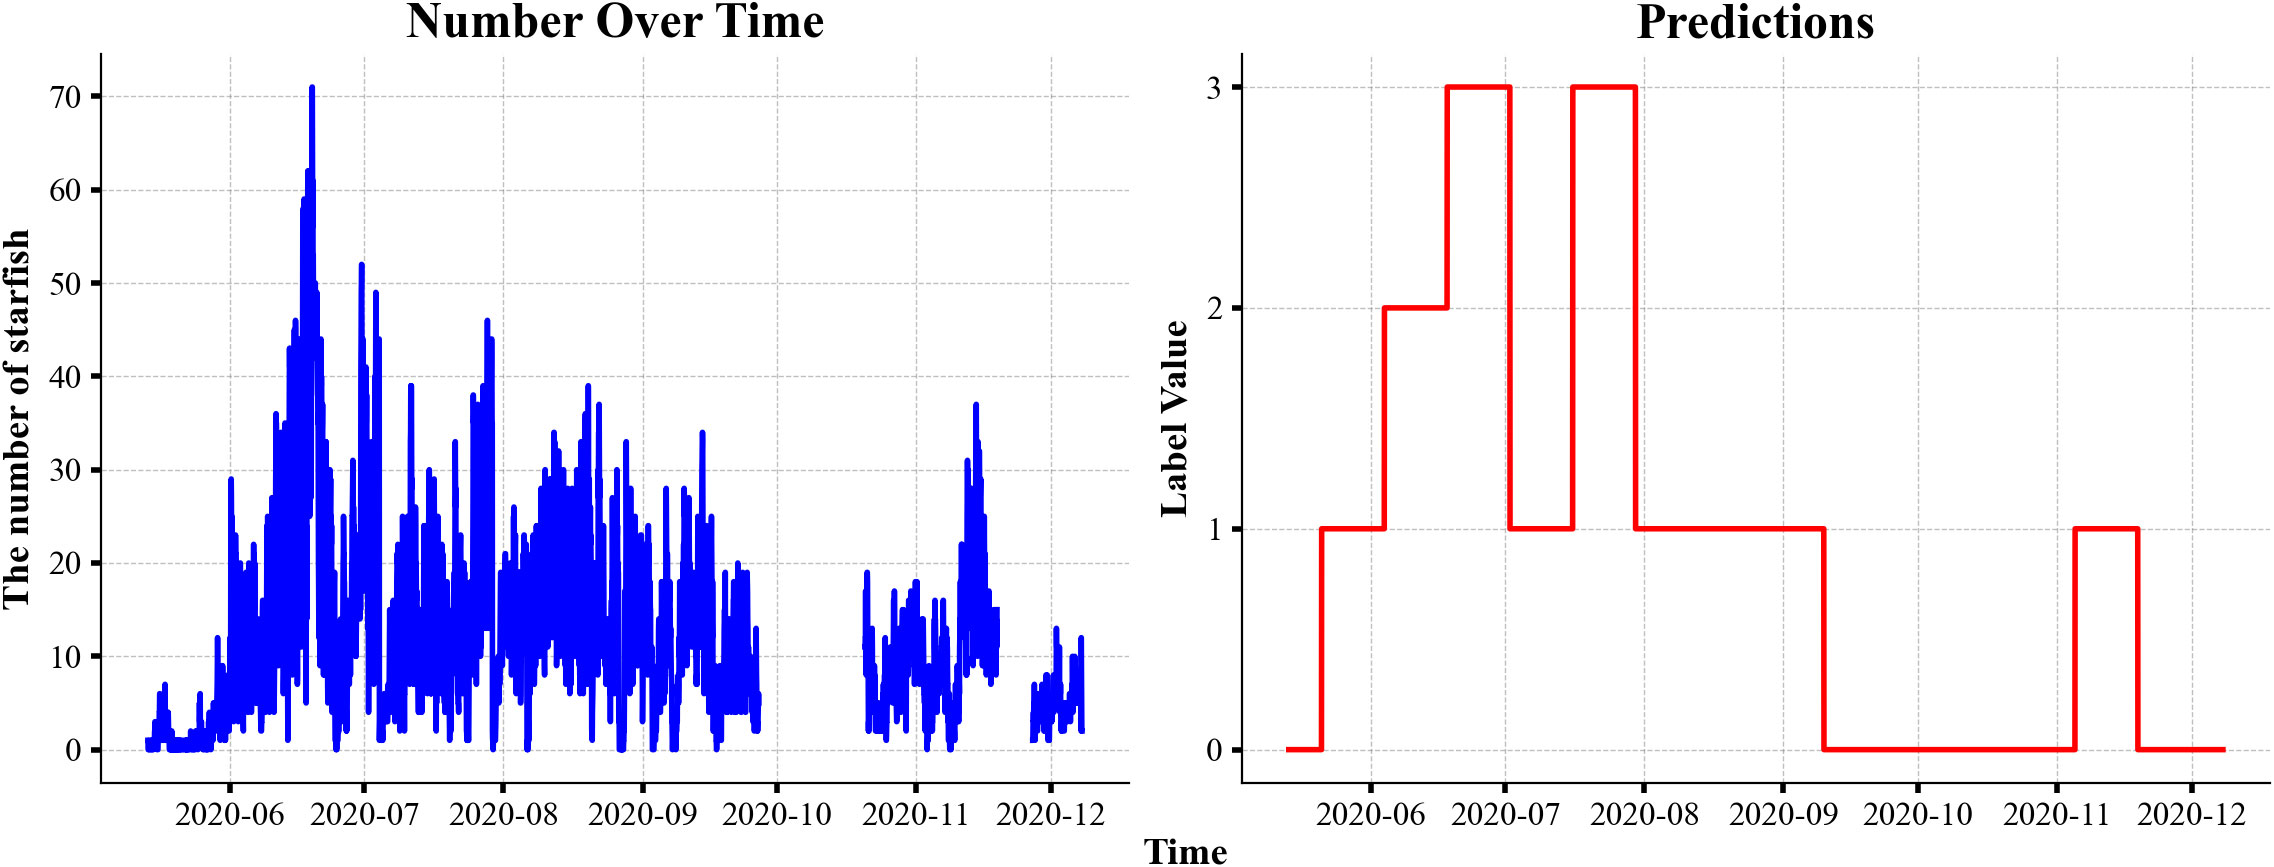
Figure 5 The number of starfish and its predictions over time.
3.4 Testing of early warning model effect
Use 20% of the data in the total dataset as a test set to evaluate the effect of the EWSP. A total of 2,372 data samples were tested, and the confusion matrix is shown in Figure 6.
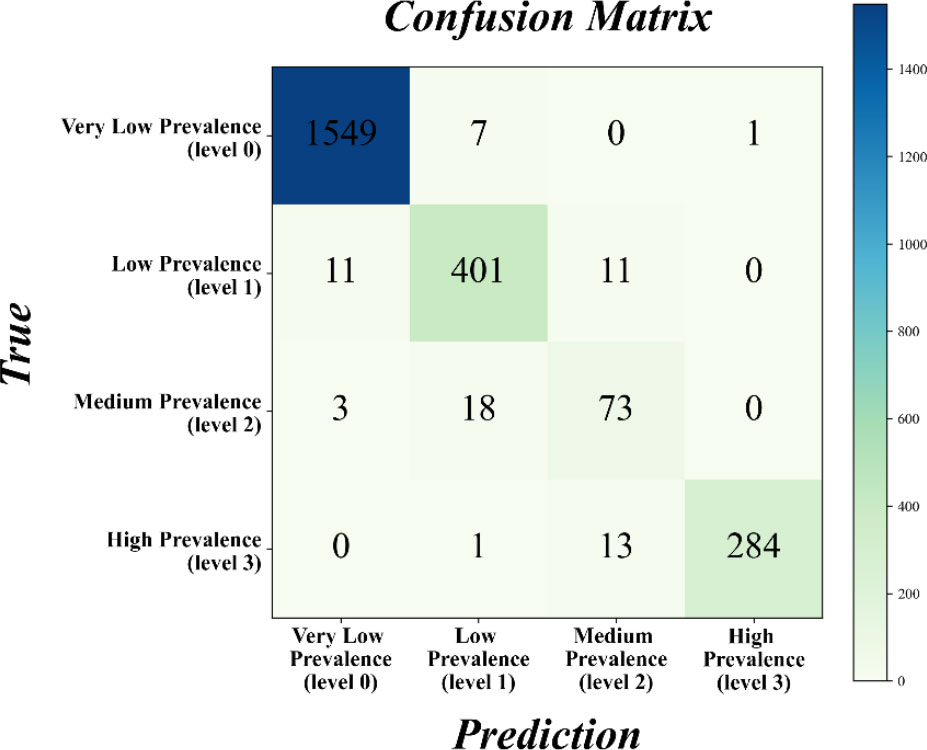
Figure 6 Confusion matrix of early warning results.
For the starfish outbreak disaster early warning model, the historical temperature, salinity, and the number of starfish are selected as input tuples. The predicted results were compared with the actual results. Levels 0–3 represent four starfish prevalence levels: very low prevalence, low prevalence, medium prevalence, and high prevalence. Among the 2,372 prevalence data, 2,307 were correctly predicted, and 65 were wrongly predicted; for low prevalence, 401 were correctly predicted, 11 were wrongly predicted as low prevalence, 11 were predicted as very low prevalence, but no case was wrongly predicted as high prevalence; 73 out of 94 medium prevalence are correctly predicted; 284 out of 298 high prevalence are correctly predicted. The accuracy rate and the precision rate of four kinds of starfish prevalence level are 0.99, 0.95, 0.78, and 0.95, and the recall rates are 0.99, 0.94, 0.75, and 0.99, respectively; The F1-scores are 0.99, 0.94, 0.76, and 0.97 respectively. From the results of accuracy, the EWSP is good at predicting the prevalence level of starfish, especially for the early warning of lower prevalence levels. The early warning model has a very high accuracy rate.
The main errors in analyzing the early warning model come from many aspects. One is due to the error in the data itself, that is, the data collection process of the water quality sensors and the underwater camera. For example, the water quality sensor is affected by underwater attachments, or the water body is severely turbid, causing the camera to lose sight. This paper uses a simple method for missing values and outliers in raw data. The method of direct discarding makes the dataset lose a lot of original information; second, the biological aggregation characteristics of starfish in the sea area led to unbalanced sample categories. For example, in July, the concentration of starfish in the entire month was significantly more than in other months. In addition, the water quality sensor parameters used in this study only include five types, and after selection, only two parameters are used as input components, which belong to a small number of categories. This research assumes that this situation is also the cause of the error in the early warning model. The final result is that the accuracy of the EWSP is 0.9726.
4 Conclusions
This study used a deep learning-based object detection model and clustering algorithm to preprocess the dataset. The linear and nonlinear correlation coefficients are used to calculate the correlation of each water quality participating in the starfish prevalence level. Combining the number of historical starfish, water quality parameters, and starfish prevalence levels, select the highly correlated parameters and extract the data corresponding to the impactful factors and the number of starfish. The number of starfish, critical parameters, and starfish prevalence level are used as the training data of the neural network model. Finally, the early warning model for starfish outbreak disasters is obtained. In the Table 6, Judging from the prediction results of the four starfish prevalence levels, the accuracy rates of the 0, 1, 2, and 3 starfish prevalence levels predicted by the model are 0.99, 0.95, 0.74, and 0.95, respectively. The sample data are all from the natural underwater environment of marine ranching. The actual underwater environment parameter data ensure that the predictions are closer to the nature scene. At the same time, the training data selection can be adjusted, and the model architecture is simple and flexible. The neural network has a strong nonlinear fitting ability and exhibits excellent predictive performance in the case of sufficient data. At the same time, the research can be further expanded. In the future, if the natural enemies or food of starfish appear in the field of view of the underwater camera, the types of input data or the number of water quality parameters can be added to the model. For other starfishes related to shellfish farming or coral protection, such as COTS, underwater images containing COTS (such as the CSIRO dataset) can be added to the object detection model. The experimental results show that the EWSP in marine ranching has high precision, which has a specific application value for the regular operation of marine ranching, and EWSP can help to reduce the damage of starfish outbreak disaster time to marine ranching.
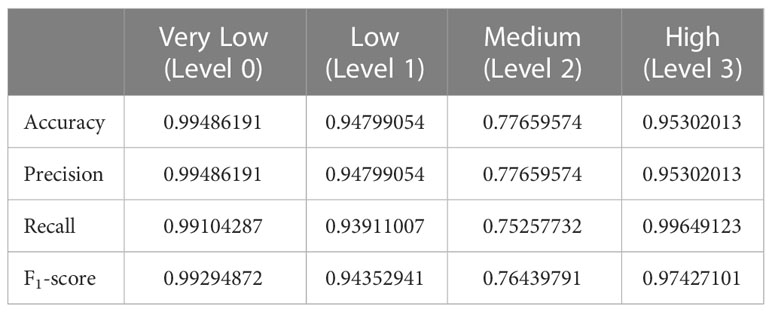
Table 6 Metrics of early warning results.
Data availability statement
The raw data supporting the conclusions of this article will be made available by the authors, without undue reservation.
Author contributions
All authors wrote the parts of various sections of the manuscript and contributed to the manuscript revision, read, and approved the submitted version.
Funding
This study was funded by Finance science and technology project of Hainan province (Grant No: ZDKJ202019), Scientific and technological projects of Zhoushan (Grant No: 2022C81010), and Hainan Provincial Joint Project of Sanya Yazhou Bay Science and Technology City (Grant No: 2021CXLH0020).
Acknowledgments
The authors are grateful for support from the science and technology projects in the “seed breeding, deep-sea and aerospace” industries, the Key Research and Development Plan of Zhejiang, the Major Science and Technology Project of Sanya, the High-level Personnel of Special Support Program of Zhejiang Province, and the Hainan Provincial Joint Project of Sanya Yazhou Bay Science and Technology. Thanks for data provided by Hainan Provincial Observatory of Ecological Environment and Fishery Resource in Yazhou Bay.
Conflict of interest
The authors declare that the research was conducted in the absence of any commercial or financial relationships that could be construed as a potential conflict of interest.
Publisher’s note
All claims expressed in this article are solely those of the authors and do not necessarily represent those of their affiliated organizations, or those of the publisher, the editors and the reviewers. Any product that may be evaluated in this article, or claim that may be made by its manufacturer, is not guaranteed or endorsed by the publisher.
References
Agüera A., Saurel C., Møller L. F., Fitridge I., Petersen J. K. (2021). Bioenergetics of the common seastar asterias rubens: a keystone predator and pest for European bivalve culture. Mar. Biol. 168 (4), 48. doi: 10.1007/s00227-021-03854-7
Babcock R. C., Plagányi É.E., Condie S. A., Westcott D. A., Fletcher C. S., Bonin M. C., et al. (2020). Suppressing the next crown-of-thorns outbreak on the great barrier reef. Coral Reefs 39 (5), 1233–1244. doi: 10.1007/s00338-020-01978-8
Caballes C., Pratchett M., Raymundo M., Rivera-Posada J. (2017). Environmental tipping points for sperm motility, fertilization, and embryonic development in the crown-of-Thorns starfish. Diversity 9 (1), 10. doi: 10.3390/d9010010
Cai J., Xiao D., Lv L., Ye Y. (2019). An early warning model for vegetable pests based on multidimensional data. Comput. Electron. Agric. 156, 217–226. doi: 10.1016/j.compag.2018.11.019
Chen X., Fu Y., Zhou H. (2022). An approach of multi-element fusion method for harmful algal blooms prediction. Environ. Sci. Pollut. Res. 30 (11), 32083–32094. doi: 10.1007/s11356-022-23944-3
Chen P., Li F., Wu C. (2021a). Research on intrusion detection method based on Pearson correlation coefficient feature selection algorithm. J. Physics: Conf. Ser. 1757 (1), 12054. doi: 10.1088/1742-6596/1757/1/012054
Chen B., Yu K., Yao Q., Liao Z., Qin Z., Yu X., et al. (2021b). Insights into the environmental impact on genetic structure and larval dispersal of crown-of-Thorns starfish in the south China Sea. Front. Mar. Sci. 8. doi: 10.3389/fmars.2021.728349
Clement R., Dunbabin M., Wyeth G. (2005). Toward robust image detection of crown-of-thorns starfish for autonomous population monitoring. Proceedings of the 2005 Australasian conference on robotics and automation (Australian Robotics and Automation Association), 1–8.
Dayoub F., Dunbabin M., Corke P. (2015). “Robotic detection and tracking of crown-of-Thorns starfish,” in 2015 IEEE/RSJ International Conference on Intelligent Robots and Systems (IROS) (IEEE), 1921–1928. doi: 10.1109/IROS.2015.7353629
Dumas P., Fiat S., Durbano A., Peignon C., Mou-Tham G., Ham J., et al. (2020). Citizen science, a promising tool for detecting and monitoring outbreaks of the crown-of-thorns starfish acanthaster spp. Sci. Rep. 10 (1), 291. doi: 10.1038/s41598-019-57251-8
Erisoglu M., Calis N., Sakallioglu S. (2011). A new algorithm for initial cluster centers in k-means algorithm. Pattern Recognition Lett. 32 (14), 1701–1705. doi: 10.1016/j.patrec.2011.07.011
Gesú V. D., Tegolo D., Isgró F., Trucco E. (2003). “A Low Level Image Analysis Approach to Starfish Detection” in Image: e-Learning, Understanding, Information Retrieval, Medical, 132–139.
Gobi A. F. (2010). “Towards generalized benthic species recognition and quantification using computer vision,” in 2010 Fourth Pacific-Rim Symposium on Image and Video Technology (IEEE), 94–100. doi: 10.1109/PSIVT.2010.23
Hartigan J. A., Wong M. A. (1979). Algorithm AS 136: a K-means clustering algorithm. Appl. Stat 28 (1), 100. doi: 10.2307/2346830
Heenaye-Mamode Khan M., Makoonlall A., Nazurally N., Mungloo- Dilmohamud Z. (2023). Identification of crown of thorns starfish (COTS) using convolutional neural network (CNN) and attention model. PloS One 18 (4), e0283121. doi: 10.1371/journal.pone.0283121
Hou S., Li W., Liu T., Zhou S., Guan J., Qin R., et al. (2022). MUST: a multi-source spatio-temporal data fusion model for short-term sea surface temperature prediction. Ocean Eng. 259, 111932. doi: 10.1016/j.oceaneng.2022.111932
Hughes R. N., Hughes D. J., Smith I. P. (2014). Limits to understanding and managing outbreaks of crown-of-thorns starfish (Acanthaster spp.). Oceanogr. Mar. Biol.: Ann. Rev. 52, 133–200.
Jayaweera C., Aziz N. (2018). “Reliability of principal component analysis and Pearson correlation coefficient, for application in artificial neural network model development, for water treatment plants,” in IOP Conference Series: Materials Science and Engineering, (IOP Publishing), Vol. 458. 012076. doi: 10.1088/1757-899X/458/1/012076
Jiang Y., Li C., Sun L., Guo D., Zhang Y., Wang W. (2021). A deep learning algorithm for multi-source data fusion to predict water quality of urban sewer networks. J. Cleaner Production 318, 128533. doi: 10.1016/j.jclepro.2021.128533
Kashenko S. D. (2003). The reaction of the starfish Asterias amurensis and Patiria pectinifera (Asteroidea) from Vostok Bay (Sea of Japan) to a salinity decrease. Russ. J. Mar. Biol. 29, 110–114. doi: 10.1023/A:1023952524166
Kayal M., Vercelloni J., Lison de Loma T., Bosserelle P., Chancerelle Y., Geoffroy S., et al. (2012). Predator crown-of-Thorns starfish (Acanthaster planci) outbreak, mass mortality of corals, and cascading effects on reef fish and benthic communities. PloS One 7 (10), e47363. doi: 10.1371/journal.pone.0047363
Lambert P. (1997). Sea Cucumbers of British Columbia, southeast Alaska and puget sound The Royal British Columbia museum handbook.
Li C., Sun L., Jia J., Cai Y., Wang X. (2016). Risk assessment of water pollution sources based on an integrated k-means clustering and set pair analysis method in the region of shiyan, China. Sci. Total Environ. 557–558, 307–316. doi: 10.1016/j.scitotenv.2016.03.069
Liu J., Kusy B., Marchant R., Do B., Merz T., Crosswell J., et al. (2021) The CSIRO crown-of-Thorn starfish detection dataset. Available at: http://arxiv.org/abs/2111.14311.
Lucas J. S. (1973). Reproductive and larval biology of acanthaster planci (L.) in great barrier reef waters. Micronesica 9 (2), 197–203.
Manzione R. L., Castrignanò A. (2019). A geostatistical approach for multi-source data fusion to predict water table depth. Sci. Total Environ. 696, 133763. doi: 10.1016/j.scitotenv.2019.133763
Miyoshi K., Kuwahara Y., Chiba S. (2019). Interactions between predatory sea stars ( Asterias amurensis and Distolasterias nipon ) and Japanese scallops ( Mizuhopecten yessoensis ) and implications for scallop seeding in mariculture. Aquacult Res. 50 (9), 2419–2428. doi: 10.1111/are.14195
Nguyen Q. T. (2022). Detrimental starfish detection on embedded system: a case study of YOLOv5 deep learning algorithm and TensorFlow lite framework. J. Comput. Sci. Institute 23, 105–111. doi: 10.35784/jcsi.2896
Nti I. K., Adekoya A. F., Weyori B. A. (2021). A novel multi-source information-fusion predictive framework based on deep neural networks for accuracy enhancement in stock market prediction. J. Big Data 8 (1), 17. doi: 10.1186/s40537-020-00400-y
Paul D., Su R., Romain M., Sébastien V., Pierre V., Isabelle G. (2017). Feature selection for outcome prediction in oesophageal cancer using genetic algorithm and random forest classifier. Comput Med Imaging Graph 60, 42–49. doi: 10.1016/j.compmedimag.2016.12.002
Plagányi É.E., Babcock R. C., Rogers J., Bonin M., Morello E. B. (2020). Ecological analyses to inform management targets for the culling of crown-of-thorns starfish to prevent coral decline. Coral Reefs 39 (5), 1483–1499. doi: 10.1007/s00338-020-01981-z
Popov R. S., Avilov S. A., Silchenko A. S., Kalinovsky A. I., Dmitrenok P. S., Grebnev B. B., et al. (2014). Cucumariosides F1 and F2, two new triterpene glycosides from the sea cucumber eupentacta fraudatrix and their LC-ESI MS/MS identification in the starfish patiria pectinifera, a predator of the sea cucumber. Biochem. Systematics Ecol. 57, 191–197. doi: 10.1016/j.bse.2014.08.009
Pradisty N. A., Ampou E. E., Hanintyo. R. (2020). Water quality assessment in the occurrence of acanthaster spp. (Crown-of-Thorns starfish, CoTS) on coral reefs in menjangan island, Bali, Indonesia. Makara J. Sci. 24 (3), 8. doi: 10.7454/mss.v24i3.1016
Pratchett M. S., Lang B. J., Matthews S. (2019). Culling crown-of-thorns starfish (Acanthaster cf. solaris) on australia’s great barrier reef: rationale and effectiveness. Aust. Zoologist 40 (1), 13–24. doi: 10.7882/AZ.2018.021
Rifa I. H., Pratiwi H., Respatiwulan R. (2020). CLUSTERING OF EARTHQUAKE RISK IN INDONESIA USING K-MEDOIDS AND K-MEANS ALGORITHMS. Media Statistika 13 (2), 194–205. doi: 10.14710/medstat.13.2.194-205
Rogers J., Pláganyi É., Babcock R. (2017). Aggregation, allee effects and critical thresholds for the management of the crown-of-thorns starfish acanthaster planci. Mar. Ecol. Prog. Ser. 578, 99–114. doi: 10.3354/meps12252
Saponari L., Montalbetti E., Galli P., Strona G., Seveso D., Dehnert I., et al. (2018). Monitoring and assessing a 2-year outbreak of the corallivorous seastar acanthaster planci in ari atoll, republic of Maldives. Environ. Monit. Assess. 190 (6), 344. doi: 10.1007/s10661-018-6661-z
Sheth S., Prajapati D. J. (2022). “Recognition of underwater starfishes using deep learning,” in 2022 Second International Conference on Next Generation Intelligent Systems (ICNGIS). (IEEE), 1–5. doi: 10.1109/ICNGIS54955.2022.10079811
Smith D., Dunbabin M. (2007). “Automated counting of the northern pacific Sea star in the Derwent using shape recognition,” in 9th Biennial Conference of the Australian Pattern Recognition Society on Digital Image Computing Techniques and Applications (DICTA 2007). (IEEE), 500–507. doi: 10.1109/DICTA.2007.4426838
Suzuki G., Yasuda N., Ikehara K., Fukuoka K., Kameda T., Kai S., et al. (2016). Detection of a high-density brachiolaria-stage larval population of crown-of-Thorns Sea star (Acanthaster planci) in sekisei lagoon (Okinawa, Japan). Diversity 8 (4), 9. doi: 10.3390/d8020009
Tang Y., Feng Y., Fung S., Xomchuk V. R., Jiang M., Moore T., et al. (2022). Spatiotemporal deep-Learning-Based algal bloom prediction for lake Okeechobee using multisource data fusion. IEEE J. Selected Topics Appl. Earth Observations Remote Sens. 15, 8318–8331. doi: 10.1109/JSTARS.2022.3208620
Uthicke S., Robson B., Doyle J. R., Logan M., Pratchett M. S., Lamare M. (2022). Developing an effective marine eDNA monitoring: EDNA detection at pre-outbreak densities of corallivorous seastar (Acanthaster cf. solaris). Sci. Total Environ. 851, 158143. doi: 10.1016/j.scitotenv.2022.158143
Wang G., Guan X. X., Shi Y. H. (2021). SIMULATION STUDY ON THE ARTIFICIAL ECOSYSTEM OF MARINE RANCHING AT DALIAN ZHANGZI ISLAND. Appl. Ecol. Environ. Res. 19 (1), 525–548. doi: 10.15666/aeer/1901_525548
Westcott D. A., Fletcher C. S., Kroon F. J., Babcock R. C., Plagányi E. E., Pratchett M. S., et al. (2020). Relative efficacy of three approaches to mitigate crown-of-Thorns starfish outbreaks on australia’s great barrier reef. Sci. Rep. 10 (1), 1–12. doi: 10.1038/s41598-020-69466-1
Keywords: starfish disaster, multi-sensor fusion, early-warning model, self-supervised model, feature selection
Citation: Li L, Liu T, Huang H, Song H, He S, Li P, Gu Y and Chen J (2023) An early warning model for starfish disaster based on multi-sensor fusion. Front. Mar. Sci. 10:1167191. doi: 10.3389/fmars.2023.1167191
Received: 16 February 2023; Accepted: 31 May 2023;
Published: 15 June 2023.
Edited by:
Takafumi Hirata, Hokkaido University, JapanReviewed by:
Ronald Petie, Wageningen University and Research, NetherlandsLiwei Wang, Guangxi University, China
Copyright © 2023 Li, Liu, Huang, Song, He, Li, Gu and Chen. This is an open-access article distributed under the terms of the Creative Commons Attribution License (CC BY). The use, distribution or reproduction in other forums is permitted, provided the original author(s) and the copyright owner(s) are credited and that the original publication in this journal is cited, in accordance with accepted academic practice. No use, distribution or reproduction is permitted which does not comply with these terms.
*Correspondence: Tao Liu, bGl1dGFvMDhAemp1LmVkdS5jbg==; Peiliang Li, bGlwZWlsaWFuZ0B6anUuZWR1LmNu