 Qiang Shi
 Jong Sung Kim
 Douglas W. Wallace
- 1Department Oceanography, Dalhousie University, Halifax, NS, Canada
- 2Department of Community Health and Epidemiology, Dalhousie University, Halifax, NS, Canada
- 3Department of Occupational and Environmental Health, The University of Iowa, Iowa City, IA, United States
We report a long-term (4.5 year) time-series with weekly resolution of iodide and iodate measurements made at 4 depths within the Bedford Basin: a 70 m deep, seasonally stratified, coastal fjord located near Halifax, Nova Scotia, Canada. The subsurface data (60 m) reveal strong inverse correlations of both iodide and total dissolved iodine (TDI) with dissolved oxygen and indicate that there is in-situ reduction of iodate in subsurface waters (in the presence of oxygen) as well as an additional external source of iodide from the remineralization of sinking organic matter, a flux from sediments, or both. Surface water (<10 m) iodide concentrations increase gradually from spring (70 nmol L-1) through fall (120-150 nmol L-1) and are not well represented by the current empirical parameterizations used to predict surface water iodide levels globally. The vertical gradient of iodide between subsurface and surface waters increases over the summer as a result of subsurface processes and, together with diapycnal mixing, may contribute to the seasonal accumulation of iodide in surface water. Examination of a global surface water iodide data compilation reveals an inverse relationship with subsurface oxygen concentrations which suggests that subsurface remineralization and sediment-water fluxes coupled with vertical mixing may also contribute to surface water iodide variability on a global scale.
1 Introduction
Iodine (I) is a bioactive element which is subject to complex biogeochemical reactions in the ocean including redox-related transformations between inorganic species (e.g., iodide and iodate), acid-base chemistry (e.g., of HOI), occurrence of numerous volatile gaseous forms, both organic (e.g., CH3I) and inorganic (e.g., I2), and nutrient-like behavior involving uptake by organisms into particles, particulate transport and remineralization at depth and in sediments. The ocean is the major reservoir of iodine at the earth’s surface, and most iodine within the atmosphere or in food (Hatch-mcchesney and Lieberman, 2022) is derived, directly or indirectly, from the oceanic reservoir. Hence, interest in the oceanic distribution and speciation of iodine arises from of a variety of considerations including: a) the important role that iodine plays for tropospheric (Davis et al., 1996; McFiggans et al., 2000; Carpenter et al., 2013) and, in some cases, stratospheric chemistry (Tegtmeier et al., 2013) including ozone destruction (Saiz-Lopez and Von Glasow, 2012); b) significance as a pathway for radiological hazards (e.g., via 131I (Kawamura et al., 2011)); c) its essential role for human and animal health, including for synthesis of thyroid hormones in humans and other organisms including fish and fish larvae used for aquaculture (Witt et al., 2009); d) the potential of iodine-containing species or isotopes as tracers, for example as a proxy of paleo-redox conditions (e.g. (Raisbeck and Yiou, 1999)) or for tracking ocean circulation (use of 129I; Casacuberta et al., 2018; A. M. Wefing et al., 2019; Anne Marie Wefing et al., 2021).
In a recent review, Carpenter et al. (2021) noted that the cycling of iodine, including its release to the atmosphere and effect on atmospheric chemistry and ozone, is likely to be changing as a consequence of climate change. Yet, despite its broad importance, and several decades of research (Carpenter et al., 2021), understanding of the processes that control transformations of iodine within the ocean, or exchanges with the atmosphere or sediments, remains incomplete. For example, there remains incomplete understanding of the processes that control concentrations of iodide in surface seawater (Carpenter et al., 2021; R. Chance et al., 2014) and the processes by which iodide is re-oxidized to iodate (iodine’s thermodynamically stable state in oxic seawater). Several empirical parameterizations of surface iodide concentrations have been developed but do not necessarily correspond well with the distribution of iodine monoxide (IO) in the atmosphere (Carpenter et al., 2021). Even the iodine to carbon ratio involved in transport of iodine between surface and deep ocean waters via particles, appears uncertain (Elderfield and Truesdale, 1980; Carpenter et al., 2021). Carpenter et al. (2021) notes that the gaps in understanding include that we have little or no characterizations of the seasonal variation of iodine species, even of sea-surface iodide concentrations, anywhere in the ocean.
Haas et al. (2021) pointed out that multi-disciplinary time-series can be key to elucidation of biogeochemical processes, such as nitrification in coastal waters, that often involve complex interactions between the physical environment with microbial populations. Shi and Wallace (2018) made the same point, specifically with respect to cycling of iodine. They argued that understanding of iodine cycling could best be advanced through the combination and co-location of: a) comprehensive measurement of various iodine species with high temporal resolution; b) repeated experimentation in the context of the time-series (Shi et al., 2014) and c) biogeochemical modelling. A barrier to this comprehensive approach is the logistical effort required to sustain the three components, over the long term. Hence most iodine-related research remains opportunistic and typically takes advantage of occasional research cruises and other opportunities for sampling, as they arise.
We present here the results of time-series measurement of iodine speciation (mainly iodide and iodate) which were made in the context of a broader time-series of biogeochemical, microbial and physical properties, in Bedford Basin (BB), Nova Scotia, Canada. The time-series data are used to shed light on potential mechanisms of iodine cycling and to develop hypotheses that can be addressed by further targeted experimentation and modelling.
2 Methods and sampling
2.1 Collection of samples
Time-series observations of physical, chemical and biological parameters have been carried out in the Bedford Basin (44.69°N, -63.63°E) near Halifax, Canada since 1992 (Li, 1998). Additional information about the sampling has been reported by Shi and Wallace (2018) and Haas et al. (2021). Samples for inorganic iodine analysis were collected weekly with 10-L Niskin bottles attached to a rosette sampler at 1, 5, 10 and 60 m, in the center of the Bedford Basin.
Each bottle was rinsed twice with the sample water prior to collection. After filtration through a 0.45 μm membrane nylon filter (on board), all samples (50ml in high-density polyethylene (HDPE) bottles) were stored at 4 °C in a refrigerator prior to analysis.
We have divided the inorganic iodine time-series into two periods: a) pre-pandemic (May 2018 to March 2020) and b) post-pandemic (July 2021 to December 2022). Some samples from the pre-pandemic period were stored for more than half a year before analysis, due to work being conducted, simultaneously, on the improvement of analytical methods and precision. Methods were settled during the pandemic and during the post-pandemic period, samples were stored for a maximum of 3 weeks and benefitted from improved precision.
2.2 Analytical method for iodine analysis
The concentration of iodide (I-) was determined by high pressure ion chromatography (HPIC, Dionex ICS-5000, Thermo Fisher Seicentific) using the method of Sanz Rodriguez et al., 2016. The concentration of iodate (IO3−) was determined with the same method, by difference, after quantitative reduction to iodide using ascorbic acid in the presence of hydrochloric acid (HCl) (Campos, 1997; Brandao, 2001). Here we note that dissolved organic iodine (DOI) can also be transformed to iodide with this treatment. Hence our reported concentrations of total dissolved iodine (TDI) represent [I-] + [IO3−] + [DOI]. However, DOI concentrations in seawater are generally much lower than iodate, and typically range from 10 to 40 nmol L-1 (Wong and Cheng, 1998; Truesdale et al., 2001). We checked the DOI levels in samples collected at three depths in Bedford Basin in both November 2022 and April 2023, using the three-step procedure of Jones et al. (2023) which involves addition of Ca(ClO)2, Na2SO3 and NH2OH–HCl. These samples covered seasons with both high (April 2023) and low (November 2022) oxygen concentrations. The tests confirmed that our reduction with ascorbic acid does convert DOI to iodide, however the measured DOI levels were in the range expected (37 ± 12 nmol L-1) and did not vary significantly between the two sampling periods.
The HCl (37%, Fisher Chemical) was diluted using Milli-Q water (MQW) to prepare a 6 M HCl solution. L-ascorbic acid (>99%, ACROS Organics) was used to prepare the required 0.2 M aqueous solution. Both were stored in glass bottles at 4 °C.
For calibration, stock solutions of iodide and iodate (0.45 M and 0.05 M, respectively) were prepared by dissolving potassium iodide (99.5%, Sigma) and sodium iodate (99.5%, Sigma) in MQW. They were stored in HDPE containers at 4 °C and newly prepared every three months. Working standard solutions of 9.04 μmol L-1 iodide and 5.31μmol L-1 iodate were freshly prepared by diluting 10 μL and 50 μL of each of these stock solutions, respectively, with 500 ml MQW. Calibration standards between 0.03 and 0.64 μmol L-1 (5-point calibration curve) were prepared by dilution of the working standard solutions in artificial seawater (2019-2020) or Milli-Q water (2018, 2021-2022). The artificial seawater was prepared according to the recipe of Strickland and Parsons (1972). The calibration solutions were prepared every two days.
For samples and standards alike, the procedure before injection involved adding 25 μl of 6M HCl solution and 15 μl of 0.2 M L-ascorbic acid solution to 4960 μl of seawater sample followed by mixing by vortex for more than 1 minute (Sanz Rodriguez et al., 2016). Aliquots of either 25 μl (2019-2020) or 125 ul (2021-2022) were injected via a Dionex AS Autosampler (Thermo Fisher Scientific) into a Dionex ICS-3000 IC system coupled with a UV detector (VWD-variable wavelength detector, Thermo Fisher Scientific). The initial sample aliquot size of 25 μl, was increased to 125 μl for samples analyzed since 2020. The instrument was equipped with an EGG-KOH cartridge, a column heater a guard column (Dionex IonPac AG20,50×4.0 mm ID, particle size 11 μm), and a separator column (Dionex IonPac AS 20, 250×4.0 mm ID, particle size 7.5 μm). The UV detector was operated at 226 nm. The 25 or 125 μl samples were injected onto the column and KOH was used as the eluent at a flow rate of 1.0 ml/min with a gradient program starting from 13 nmol L-1 (hold 1 min) to 35 nmol L-1 at 2 min then to 70 nmol L-1 at 14 min (hold 2 min) before returning to 13 nmol L-1. The total run time was 26 min, and the analysis were carried out at 30 °C. Every sample was analysed in triplicate. The standard deviation (SD) of triplicate measurements (integrated peak area) was<10%. Blanks of Milli-Q water were run between all sample analyses. Due to salt buildup, the separation column needed to be cleaned at least every three months. Dirty columns caused peak shifts and peak shape changes and reduced precision. In this study, each data point for iodine shown in the graphs represents the results of the average of three replicate measurements.
2.3 Measurement of open ocean profiles
In order to test this method’s comparability with other methods used historically, we analyzed samples from offshore profiles collected on the Scotian Shelf and over the continental slope of the NW Atlantic (the HUD2020063 Fall AZMP Mission (Atlantic Zone Monitoring Program)). The two locations are shown on the map (Figure 1). These profiles (Figure S1) were highly consistent with results from prior open ocean work. For example, total dissolved iodine (TDI) in deep water averaged 479.1 nmol L-1 (± 13.4 nmol L-1), consistent with values measured elsewhere in the North Atlantic Ocean (Campos et al., 1996). Surface iodide was ca. 60-80 nmol L-1, which is also comparable to values measured previously at similar latitudes and depths (Chance et al., 2014; Chance et al., 2019; Carpenter et al., 2021).
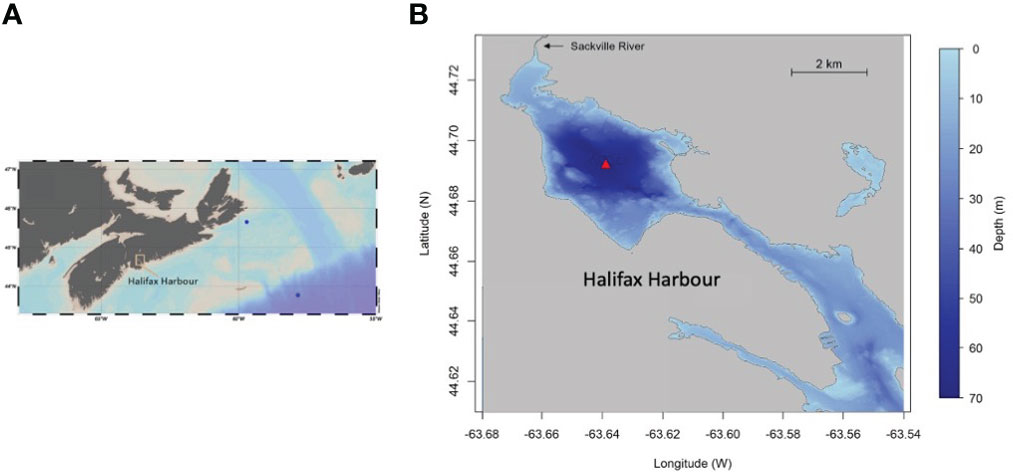
Figure 1 (A) Map of Nova Scotia, Canada and the Scotian Shelf, showing two locations (blue circles) where samples were collected over the continental shelf and slope for quality assurance (Supplemental Materials 1.1); (B) Bathymetric map of Bedford Basin and Halifax Harbour showing location (red triangle) of the time-series measurements; the map is adapted from that shown in Rakshit et al., 2023).
3 Results
3.1 Environmental variables in the bedford basin
The time-series of temperature, salinity, dissolved oxygen, fluorescence/Chl a and total dissolved inorganic nitrogen (DIN = [NH4+] + [NO2-] + [NO3-]) at 4 depths are presented in Figures 2, 3. Near-surface temperatures start to rise above winter values of 3 °C, and stratified conditions develop, around early April with temperatures reaching ca. 21 °C by the end of August (Figures 2A and 3A). Salinity ranges from 26 to 31 through the entire water column, with the lowest salinities occurring very close to the surface (Figures 2B and 3B blue line). The near-surface stratification varies seasonally, primarily due to summertime heating.
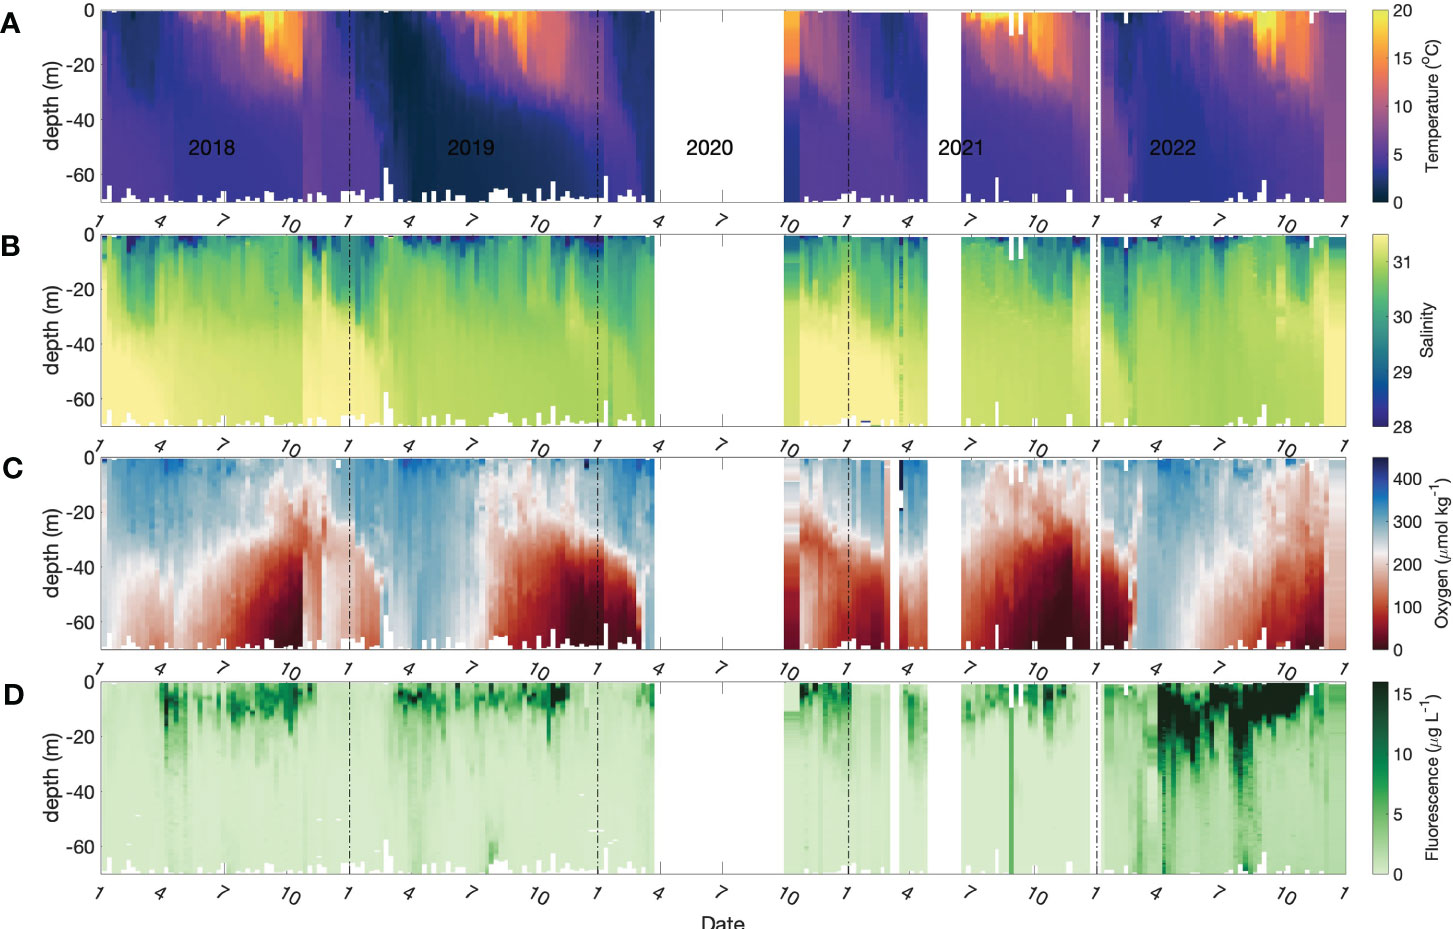
Figure 2 Seasonal patterns of environmental and biological variables in Bedford Basin from January 2018 to Dec 2021. (A) temperature; (B) salinity (C) dissolved oxygen; (D) chlorophyll fluorescence. The data gap in 2020 was the result of cessation of the time-series due to COVID-19 restrictions.
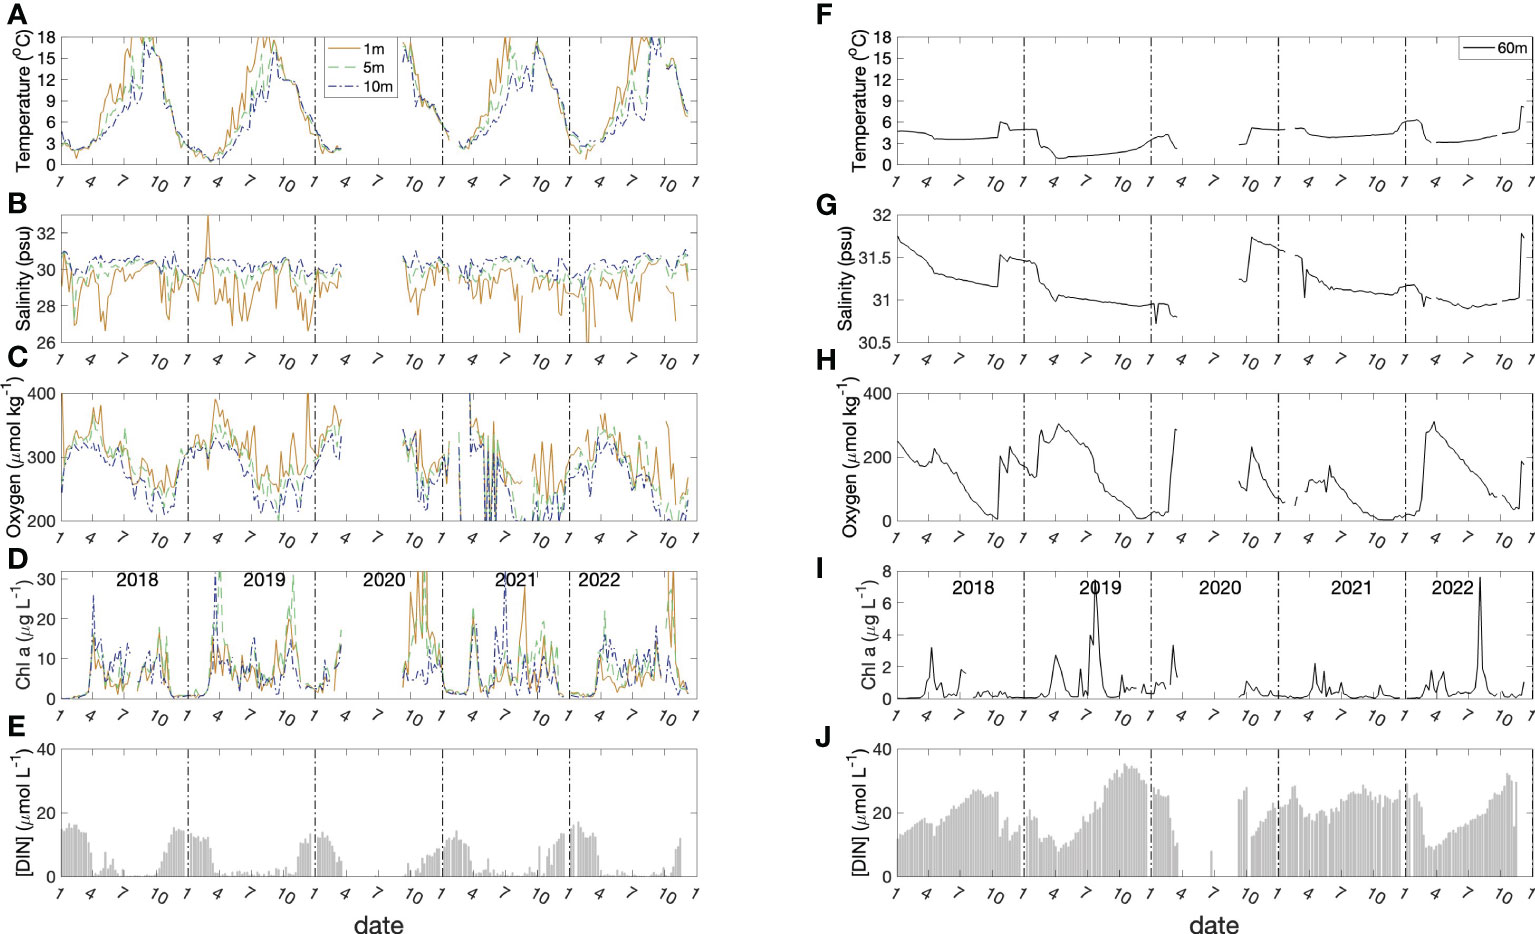
Figure 3 Seasonal variation of physical and biological parameters at 1, 5,10 meters (left panel; A–E) and 60 meters (right panel; F–J). The data gap in 2020 was the result of cessation of the time-series due to COVID-19 restrictions.
The dissolved oxygen time-series (Figures 2C and 3C) shows the effect of temperature-dependent solubility variations in surface waters as well as intrusions and late-winter vertical mixing in deeper water (Rakshit et al., 2023). For instance, in October 2018 the salinity of bottom water increased from 31.2 to 31.6 (Figure 3G), and oxygen concentration increased from 25 μmol kg-1 to 210 μmol kg-1 (Figure 3I), reflecting the arrival of an “intrusion” of shelf water. In surface waters, the highest O2 concentrations occurred between March and April in association with the lowest seawater temperatures. The vertical gradient of O2 concentration was, generally, smallest towards the end of April as a result of vertical mixing. Sub-surface O2 concentrations (>30 m) decreased in summer due to respiration unless interrupted by an intrusion. In most winters, intense vertical mixing coupled with gas exchange replenished bottom water oxygen levels to near-saturation levels (300 μmol kg-1). However, winter mixing was weaker than normal in 2020/2021 compared with previous years, so that oxygen levels did not get fully replenished and did not exceed 150 μmol kg-1 at the end of winter. This led to an unusual 5-month period of near anoxic conditions late in 2021 (Figure 3H) compared with more typical ca. 2-to-3-month hypoxic periods during the previous decade. During this unusual 5-month hypoxic period, iodide concentration reached the highest value (496.9 nmol L-1) measured during the entire observation period.
Two blooms (spring and autumn) were observed typically, each year, in the time-series of chlorophyll a concentration in surface water (Figures 2D and 3D). The seasonal variation of dissolved inorganic nitrogen (sum of [NH4+], [NO2-], [NO3-]) in surface water is plotted in Figure 3E. In winter, when chlorophyll a levels are low due to light limitation, DIN concentrations reach ca. 18 μmol L-1 but are drawn down to low levels (< 1 μmol L-1) after the spring bloom (Figure 3E). Summertime chlorophyll a levels are moderate but variable (3 to 15 μg L-1), likely reflecting continuing nutrient input (e.g. from runoff and/or sewage treatment plants). In the bottom water, DIN concentrations (mean: 20 μmol L-1) were higher than the concentrations in surface water (Figure 3J) throughout most of the year. The DIN composition in bottom water showed a clear progression due to nitrification from ammonium to nitrate, with occasional accumulation of low levels (< 0.5 μmol L-1) of nitrite. The timing of the onset of nitrification is variable from year to year in response to variations in the intensity and duration of winter mixing which dilutes the population of nitrifiers in bottom water to variable extents (Haas et al., 2021).
3.2 Variation of iodine concentration in bedford basin
Figure 4 shows that although Bedford Basin receives considerable freshwater input, there was no significant relationship observed between TDI and salinity, likely because the salinity range was too restricted in the centre of the Basin (usually from 28.5 to 31). Our measurements of the Sackville River, the major freshwater source to Bedford Basin, confirmed that the freshwater endmember concentration was very low (TDI: 40.1 ± 4.5 nmol L-1; n=3). The average total dissolved iodine concentration (TDI) when “rationalized” to a standard salinity of 35 (Truesdale, 1994; Truesdale, 1995; Truesdale et al., 2001) was 428 ± 76 nmol L-1 (n = 478) for near-surface water samples. However, from now on, because the correlation with salinity is not significant at the time-series location, we discuss measured concentrations, without rationalization.
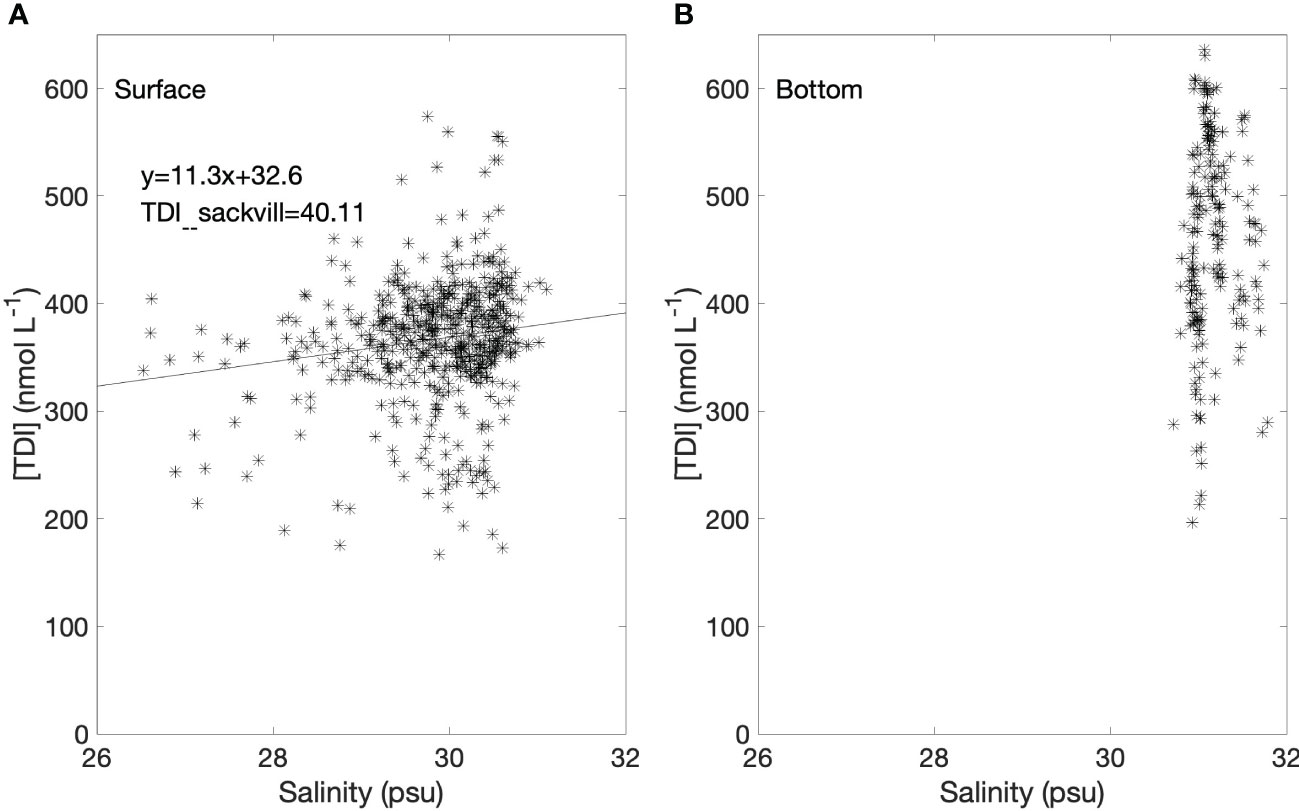
Figure 4 (A) Total dissolved iodine (TDI) in surface water (1, 5 and 10 m) versus salinity. The linear regression line is also shown (slope: 11.3, intercept: 32.6, R2: 0.21). (B) TDI in subsurface (60 m) versus salinity.
The long-term, temporal variations of iodide, iodate, and total dissolved iodine are shown in Figure 5. Iodide in surface water (1, 5 and 10 m) ranged between 10 to 200 nmol L-1 over the entire time-series (mean: 83 ± 34 nmol L-1, except for a few samples with >200 nmol L-1) whereas iodate varied from 100 to 600 nmol L-1 (mean: 283± 65 nmol L-1). The TDI concentration was 366 ± 67 nmol L-1 for near-surface samples. However, variability was considerably smaller during Period 2 of the time-series when analytical precision was better (see methods). The means and other summary statistics for iodide, iodate and TDI in the upper 10 m and at 60 m are given for the two time periods in Table 1.
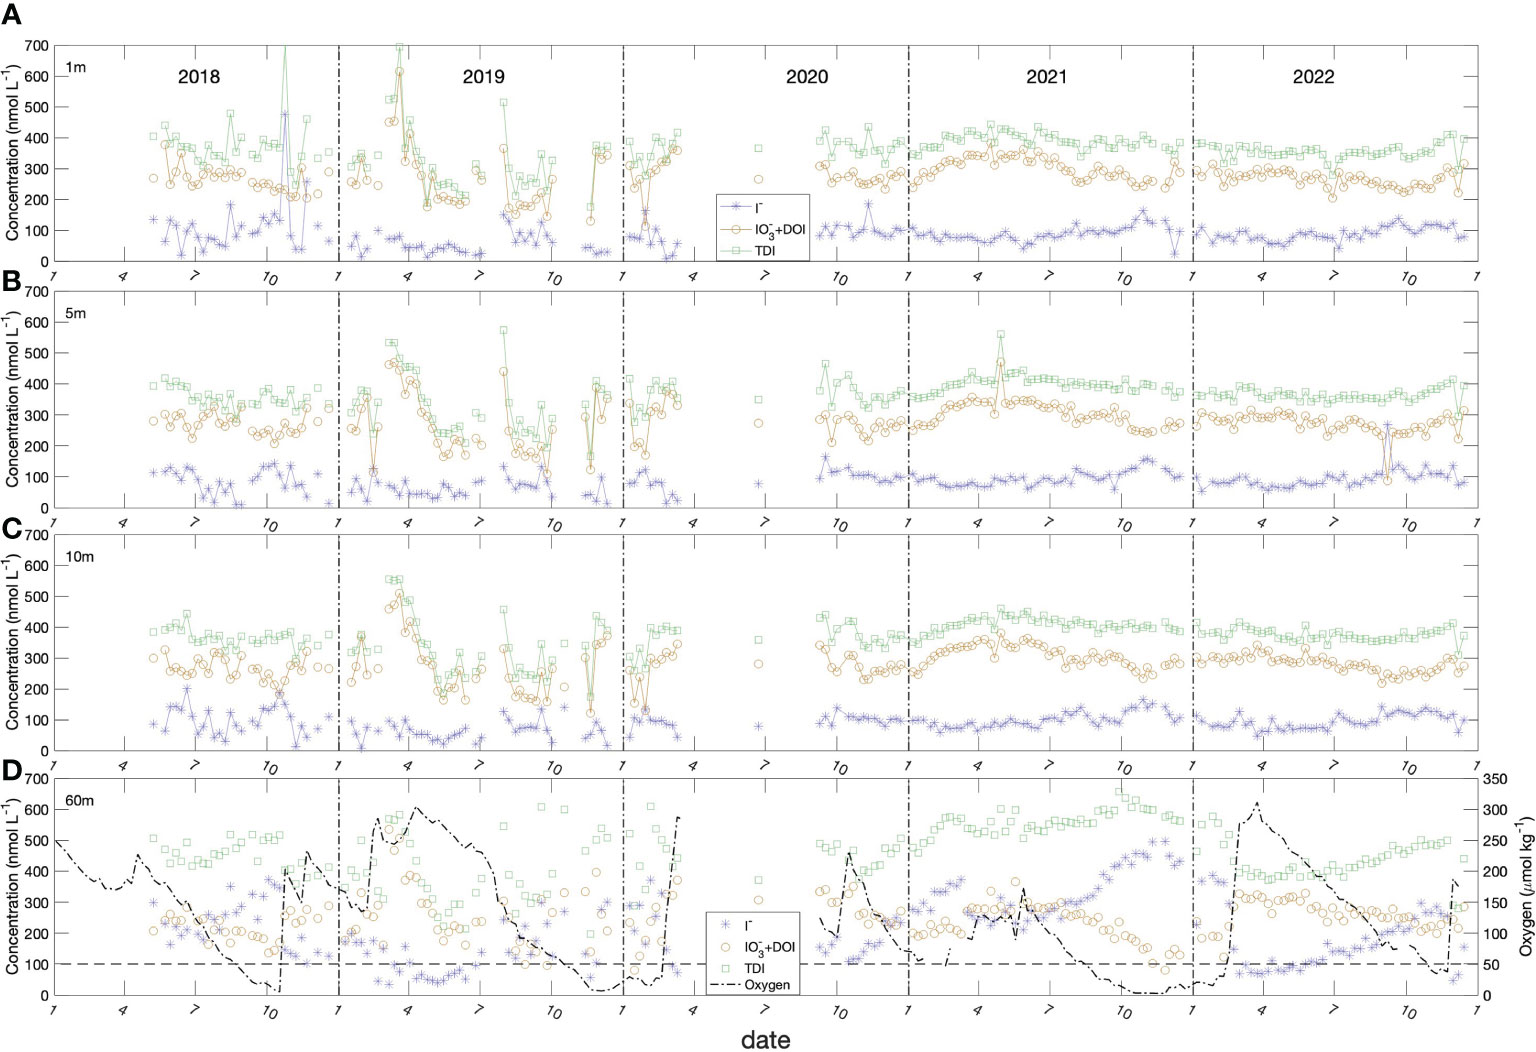
Figure 5 Seasonal variation of iodide (blue stars), iodate + DOI (dark yellow circles, DOI levels were in the range of 37 ± 12 nmol L-1), TDI (green diamonds) in the Bedford Basin at (A) 1 m, (B) 5 m, (C) 10 m and (D) 60 m. Also shown in panel (D) is the oxygen concentration. The average standard deviations (SD) of triplicate measurements were I- of ± 9 nmol L-1; TDI of ± 14 nmol L-1 and IO3- + DOI of ± 22 nmol L-1.
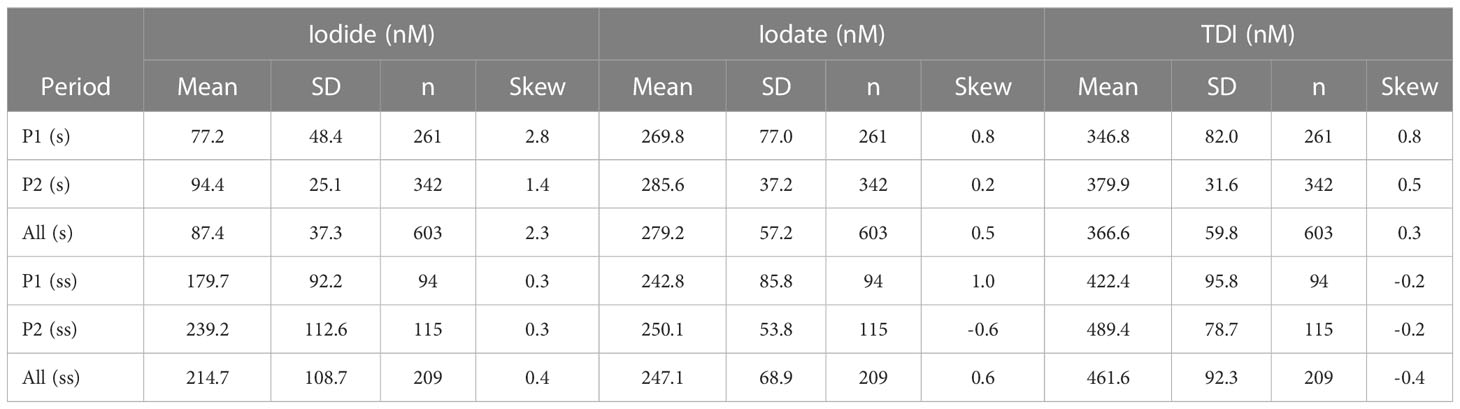
Table 1 Overall statistics for iodide, iodate and TDI in the upper 10m (s: surface water) and at 60 m (ss: subsurface water) during the two sampling periods referred to in the text.
The data from Period 2 reveal gradual accumulation of iodide in surface water (1, 5, 10 m) over spring and summer, from lowest values of ca. 70 nmol L-1 in spring (March, April, May) to maximum concentrations of ca. 120 to 150 nmol L-1 in fall (October, November). The noisier data from Period 1 show similar trends, with a decline from maximum concentrations in fall 2018 to minimum values in spring 2019 (ca. 30-50 nmol L-1), followed by an apparent increase over the subsequent summer.
Iodide behaved very differently at 60 m, with generally higher concentrations (ca. 3 times higher) and much larger amplitude variability (50 to 550 nmol L-1). Iodide at 60 m also showed a strong inverse correlation with oxygen, so that it increased from the onset of stratification in April to when the water column convectively overturned in February/March unless interrupted by a shelf water intrusion, which reset values to ca. 50 nmol L-1.
Total dissolved iodine (TDI: iodide + iodate + DOI) in surface waters had levels averaging 367.8 ± 64.2 nmol L-1 over the entire time period and 387.5 ± 30.9 nmol L-1 during the better characterized Period 2. However, TDI increased systematically over the year in deep (60 m) water, following the onset of stratification and, again, had an inverse correlation with oxygen. The mean TDI concentration (511 ± 72.4 nmol L-1; n=83) (Figure 5D) was significantly higher than the surface water concentration at the 95% confidence interval. Unless interrupted by shelf water intrusions, TDI increased from minimum values of 371 nmol L-1 in late winter to maxima of 657 nmol L-1 in the fall or early winter and were anti-correlated with dissolved oxygen.
Overall, iodate concentrations were always higher than iodide concentrations in near-surface waters. However, this picture was reversed in the bottom water, where iodide concentrations were generally, higher than iodate concentrations, especially when oxygen concentrations dropped below 130-140 μmol kg-1 (Figure 5D, horizontal dash line).
4 Discussion
Time-series have the potential to reveal underlying mechanisms and controls of complex biogeochemical transformations. Here we discuss the observations from Bedford Basin in connection with inorganic iodine transformations that have been discussed, inconclusively to-date, in the literature.
4.1 Magnitude and controls of surface iodide concentrations
As noted by Carpenter et al. (2021) and Wadley et al. (2020), the potential for iodide to impact atmospheric chemistry on global scales, and for its impact to change as a result of global environmental change, necessitates mechanistic understanding (and a model) of iodide formation in near-surface water. However to date, models used in atmospheric chemistry rely mainly on empirical relationships to represent spatial and temporal variations of sea surface iodide. There is no certainty that the selected, correlated parameters are related mechanistically to iodide production, or that the correlations will remain invariant in the future (e.g. in the context of climate change).
In Figures 6A, B we compare iodide levels predicted by three published empirical and statistical relationships, with concentrations observed in the upper 10 m during the Bedford Basin time-series. The observed levels are notably higher than predicted by all of the empirical relationships. In the case of the temperature-dependent relationships of Chance et al. (2014) and Macdonald et al. (2014) by factors of 2-4 and 5-15, respectively. The nitrate-based parameterizations derived from Campos et al. (1999) bracket the average observed concentrations (in summer), especially during Period 2 (Figure 5B) but do not capture the seasonal accumulation. A random-forest regression approach (Sherwen et al., 2019) predicts global average values comparable to those of Chance et al. (2014). Based on Figure 6 in Sherwen et al. (2019), their prediction of annual average concentrations for NW Atlantic coastal waters appears to be in the range 60-100 nmol L-1, which is consistent with our observations.
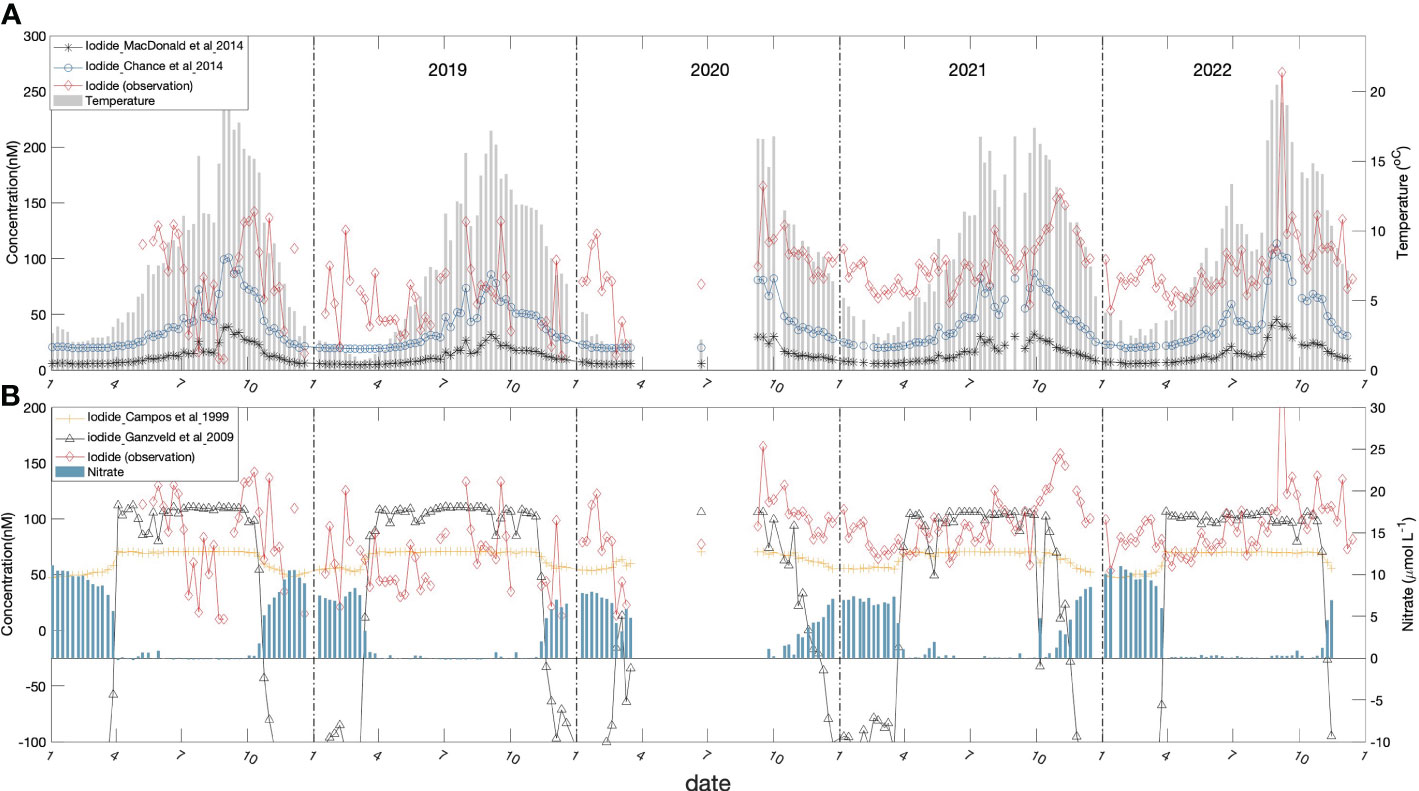
Figure 6 Sea-surface iodide predicted from empirical parameterizations (for 5 m in Bedford Basin) plotted against the observed concentrations (red line): (A) iodide predicted based on the empirical relationships with sea surface temperature of Macdonald et al. (2014) (black closed circles and line) and Chance et al. (2014) (blue open circles and line); also plotted is sea surface temperature (grey bar). (B) predictions of iodide (nmol L-1) at 5 m depth from empirical relationships with nitrate for regions inside ([I-] = 106 – 29 x [NO3-]; black line) and outside ([I-] = 70.4 – 2.12 x []; green line) the South Atlantic sub-tropical gyre as derived by Ganzevald et al., 2009 from the relationships reported by Campos et al. (1999). Also shown are the variation of nitrate (blue bars).
There appears to be consensus in the literature that a biologically-mediated reduction process operating within the surface layer is responsible for the presence of iodide in surface water. Campos et al. (1996) proposed that iodide reduction was proportional to primary production, however data collected subsequently from the South Atlantic and Weddell Sea (Campos et al., 1999) appeared inconsistent with this hypothesis. The mechanisms responsible for production of iodide in surface waters remain unresolved. Two distinct mechanisms for iodate reduction in the surface layer have been proposed: a) through the action of nitrate reductase (Hung et al., 2005); b) by reaction with reduced metabolites, such as reduced sulfur compounds, that are released from phytoplankton cells upon senescence (Bluhm et al., 2010). Campos et al. (1999) noted a general increase of iodide as nitrate concentrations decreased along a N-S transect in the South Atlantic. They postulated reduced iodide production in the presence of high nitrate as a result of “chemical competition”, under the assumption that nitrate reductase was responsible. They reported a range of empirical inverse correlations with surface nitrate which have been summarized and applied by Ganzeveld et al. (2009) (see Figure 6B). Macdonald et al. (2014) proposed empirical correlations with sea surface temperature on the basis that increased temperature and, hence, stratification allows iodate to be reduced to iodide in the surface layer by either blocking of iodate replenishment from below or by facilitating reduction through the prolonged isolation of surface water.
The temporal variability of surface iodide may provide clues about underlying processes and controls. For example, the trends shown in Figure 6 do not appear consistent with the temperature-only parameterizations, because concentrations continue to rise in the fall, even as temperature is dropping. As noted earlier, the overall pattern appears to be of gradual accumulation, starting in April/May and changing sign in October/November. This period of accumulation coincides with the period when nitrate is depleted in surface waters (Figure 6B) and is therefore consistent with either, or both of the proposed biological mechanisms for in-situ iodate-reduction. Nitrate depletion could promote cell senescence and increase the potential for leakage of reduced species that can react with iodate (Bluhm et al., 2010). Alternatively, iodide could be produced by nitrate reductase as noted above, especially when competition from ambient nitrate for active sites is reduced (Campos et al., 1999; Hung et al., 2005). However, the empirical correlations with nitrate taken from the open ocean do not represent the gradual build-up of iodide over the summer through fall (Figure 6B) and either under-predict concentrations in summer or in winter, depending on the relationship used.
It is not possible to choose between alternative biological production mechanisms based on our time-series data alone. Manipulative experiments conducted in the context of the time-series (e.g., using manipulation of, for example, nitrate reductase activity (Waite and Truesdale, 2003)) might allow elucidation of specific hypothesised mechanisms and controlling factors.
4.2 Iodide accumulation in the bottom water
During stratified periods, the bottom water of Bedford Basin was relatively isolated from near-surface waters and hence from exchange with the atmosphere, and was marked by steady declines of oxygen. During these periods, iodide increased monotonically and iodate decreased, unless interrupted by intrusions (such as at the end of October 2018) or by wintertime vertical mixing (typically in late February/March) both of which caused oxygen to increase. In Figure 7, the periods with different oxygen trends (decreasing, increasing and stable) are denoted with shading. The rates of iodide accumulation and iodate decrease calculated for the periods with decreasing oxygen are presented in Table 2.
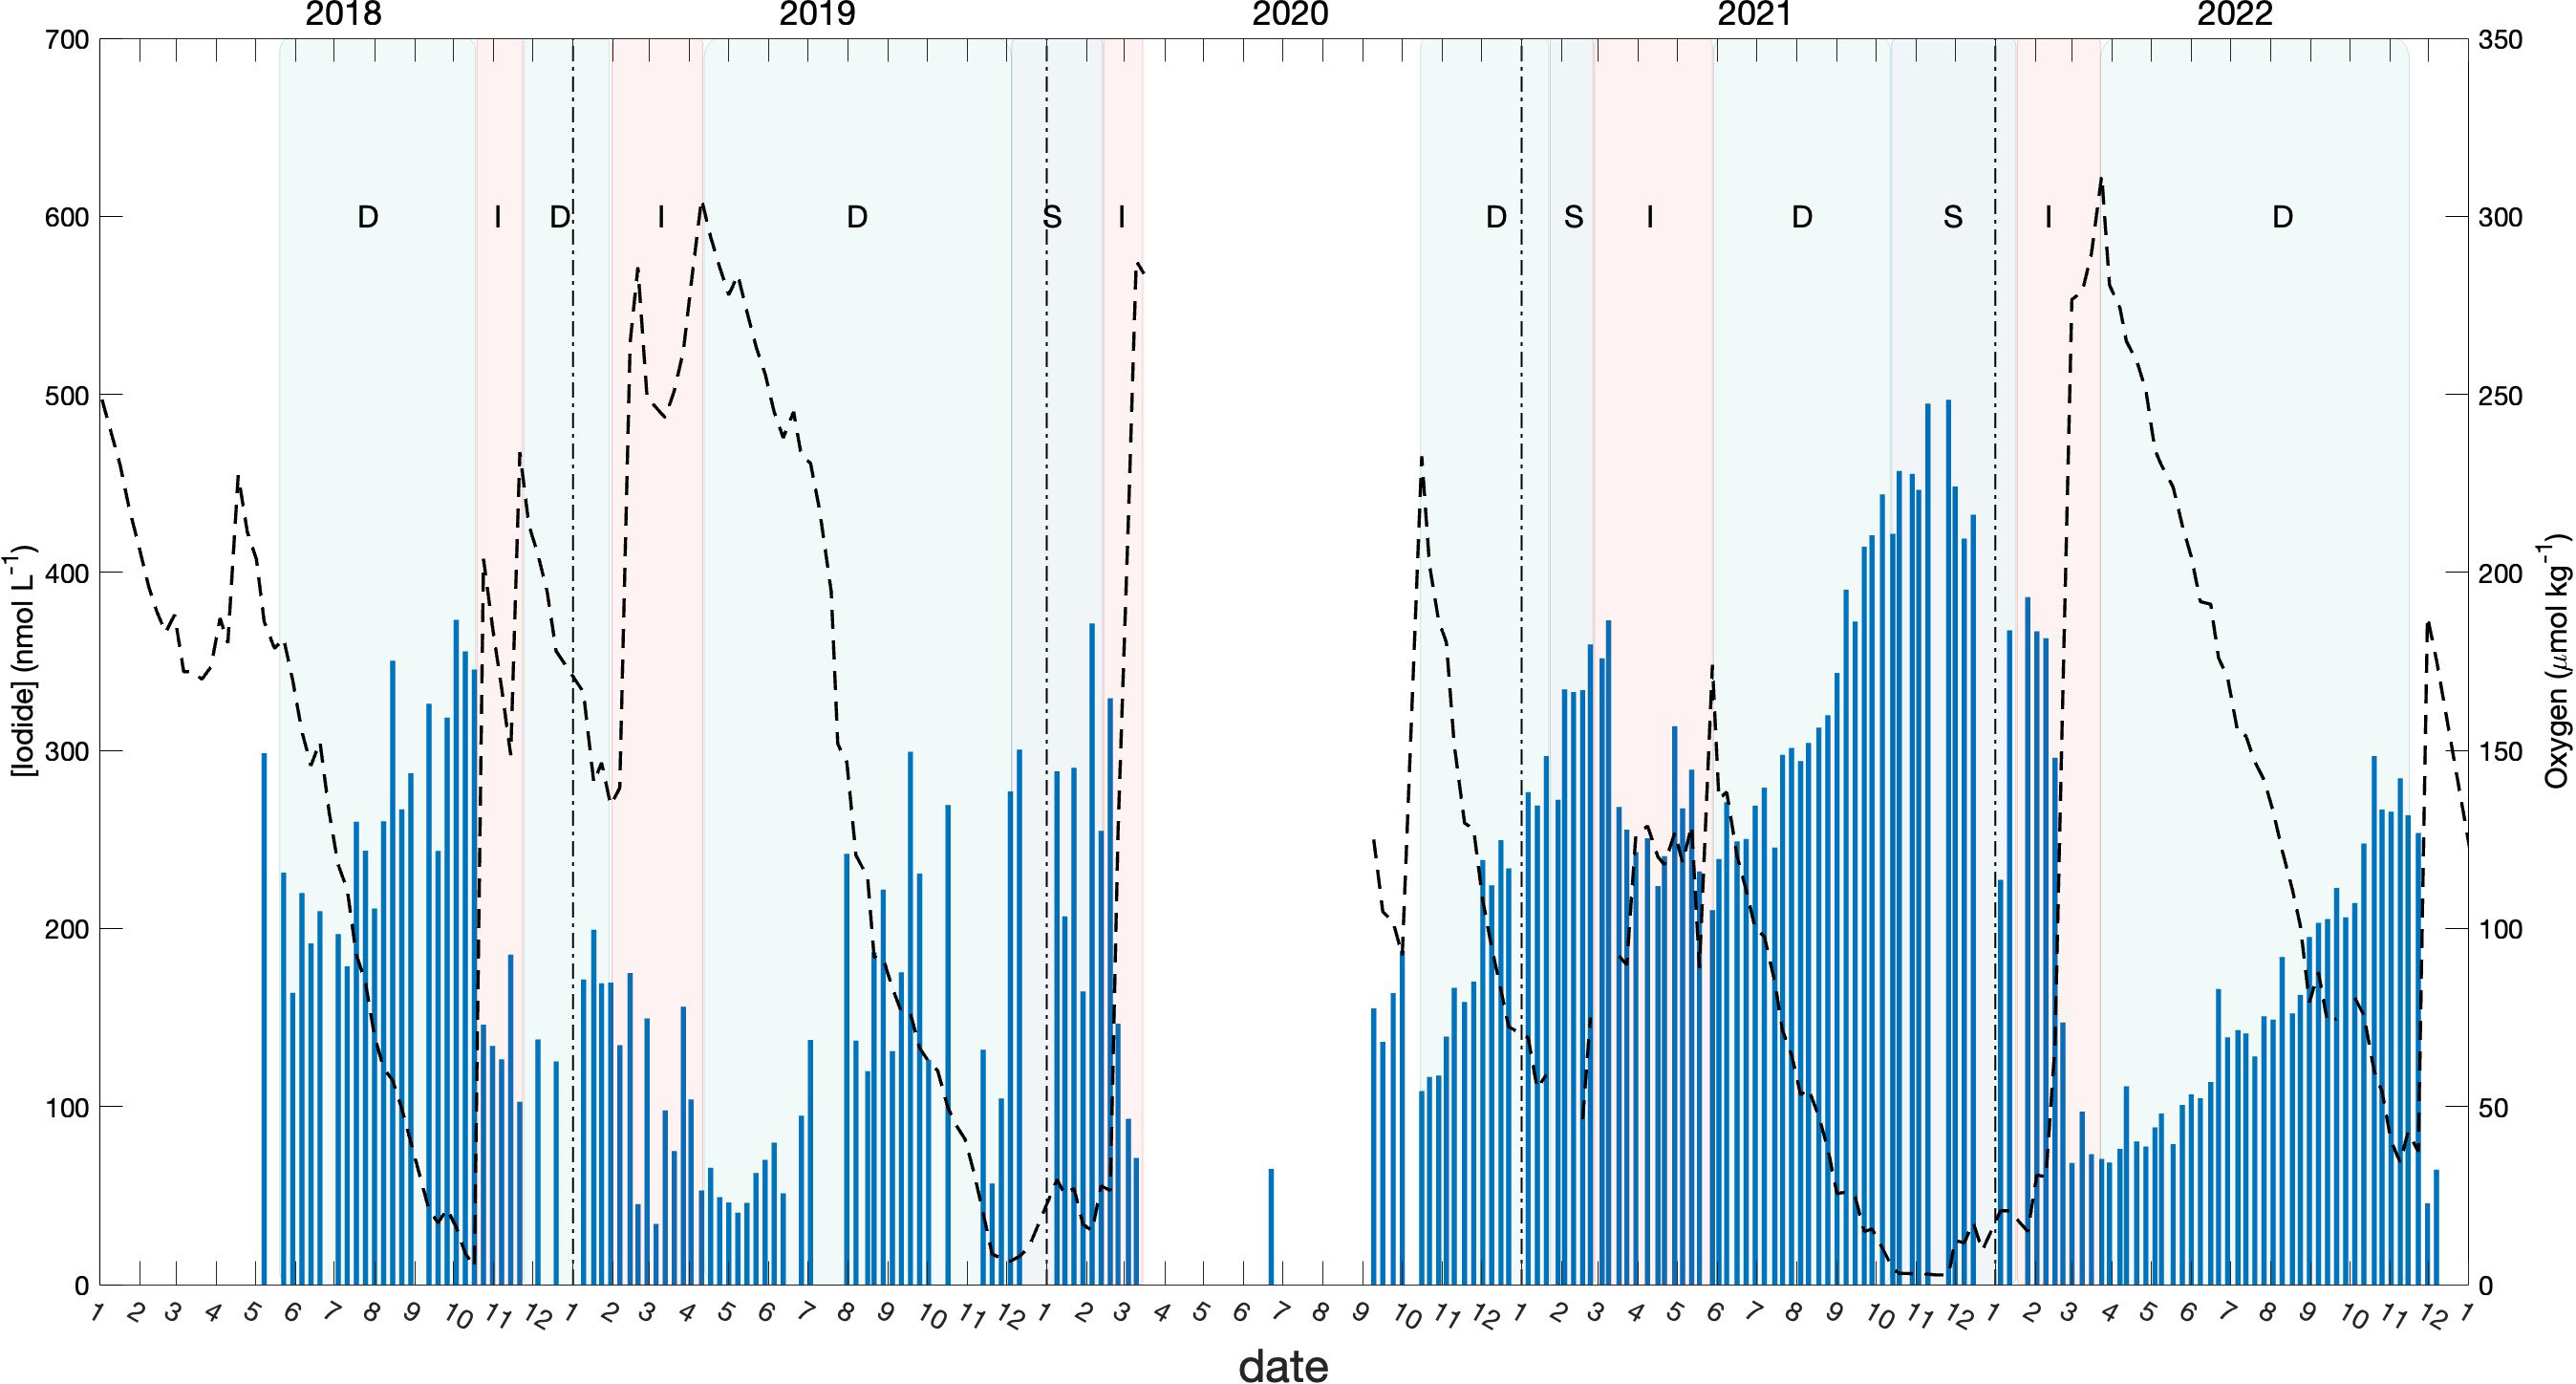
Figure 7 Seasonal variation of iodide in the bottom water (blue bars) with the variation of oxygen (dashed lines). Light green shading denotes periods when the oxygen concentration was decreasing in the bottom water (“D”), red shading denotes period when the oxygen concentration was increasing (“I”), and grey shading represents period when the oxygen concentration was stable (varied between 0 to 25 μmol kg-1).
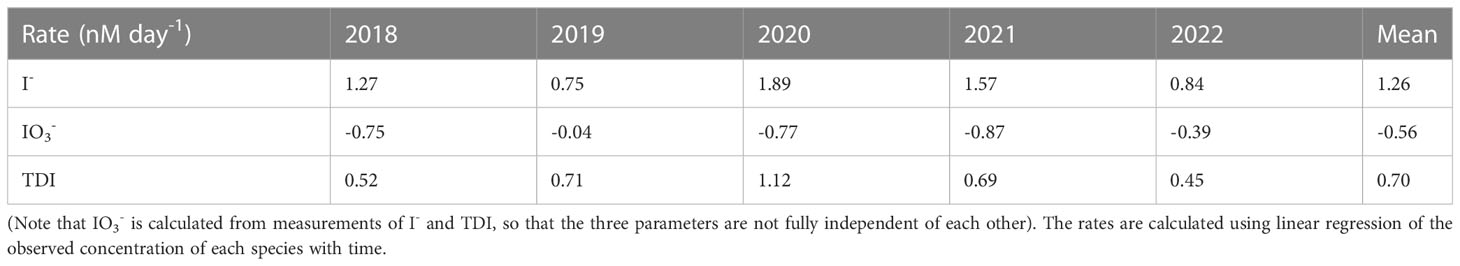
Table 2 Rates (nmol day-1) of iodine accumulation in Bedford Basin bottom water during periods of decreasing oxygen concentrations.
The average accumulation rate of iodide in subsurface water (60 m) for the period with decreasing oxygen was 1.26 nmol day-1. This is 4 times higher than the accumulation observed in surface waters over the summer (ca. 60 nmol L-1 over 7 months) and also 3-5 times higher than net rates of iodide accumulation (and iodate depletion) of 0.27 to 0.55 nmol day-1 observed in the surface ocean over 78 days by Chance et al. (2010). Further, because the rate of iodide increase is consistently higher than the corresponding rate of iodate decrease (typically by a factor of 2), our data show that accumulation of iodide in BB bottom water is not only from in-situ reduction of iodate, but also involves a source of iodine that is external to the bottom water itself.
Both iodide and TDI had strong, inverse correlations with oxygen at 60 m as shown in Figure 8, whereas there were no significant correlations in near surface waters. Oxygen at 60 m can vary due to a) biogeochemical processes (including respiration/oxidation of organic material within the water-column or loss to underlying sediments via sediment-water exchange) and b) physical transport (mixing with surface waters or shelf-water intrusions). In addition to physical processes, the biogeochemical processes affecting inorganic iodine speciation include the “internal” or in-situ reduction of dissolved iodate to iodide within the water column (increases iodide but leaves TDI unchanged) and “external” supply from/to sediments and via remineralization from sinking organic material, both of which change both iodide and TDI. External supply processes are most likely to alter iodine concentrations significantly when bottom waters are isolated, and both mixing and intrusions would drive a linear relationship between iodide and oxygen during periods of increasing oxygen concentration. On the other hand, reduction of iodate to iodide, remineralization of sinking organic material, or fluxes of iodine from the sediments, would also result in correlations with oxygen, in this case during periods of decreasing oxygen. The latter could even be non-linear if the process was dependent on oxygen concentrations (Lu et al., 2010).

Figure 8 Linear regressions of (A) TDI and (B) iodide against dissolved oxygen in bottom water of Bedford Basin (60 m). Black stars represent data from periods when the oxygen concentration was decreasing in the bottom water and both iodide and TDI were accumulating; red circles represent data from periods when the oxygen concentration was increasing due to physical processes such as vertical mixing and/or intrusions; blue diamonds represent other periods (mainly when oxygen concentrations were not changing).
We therefore examined correlations of oxygen separately for periods of decreasing and increasing oxygen (i.e., between the “D” and “I” periods in Figure 7). Figures 8A, B shows that the regression slopes for [I-]:[O2] are statistically indistinguishable between periods when oxygen was increasing or decreasing, whereas the TDI vs O2 correlation was steeper during periods of decreasing oxygen, reflecting the accumulation of iodine from external sources during periods when the bottom water was isolated. Overall, the slopes of the [I-]:[O2] regressions were steeper than those for [TDI]:[O2] which must be due to in-situ reduction of iodate. We also examined patterns of residuals but could detect no patterns suggestive of non-linear relationships with oxygen.
Here we assume that the observed increase of iodide at 60 m (Δ[I-]Obs) has a source from in-situ reduction of iodate (Reyes-Umana et al., 2022), Δ[I-]redn, and an external source (Δ[I-]ext) that could represent either release from sinking particulate material and/or from sediments:
As noted, in-situ reduction of iodate does not increase [TDI] so that
and:
If Δ[I-]ext is assumed to be due to release during remineralization of sinking particles (Δ[I-]part) it can also be related to the sinking carbon flux and consumption of oxygen via the respiratory quotient (RQ = ΔC/-Δ[O2]) for marine organic material and the I:C ratio in marine particulate matter:
Where estimates of RQ range widely (see (Robinson, 2019) for review). Using a median value for RQ of 0.88 from field studies, the (I/C)part can be estimated from:
Our regression results give Δ[TDI]/Δ[O2] of 5.8 x 10⁻⁴ which implies an I:C ratio of 5 x 10⁻⁴. This value is of the same order of magnitude but higher than several estimates in the literature: for example, Elderfield and Truesdale (1980) estimated I:C to be 1.4 x 10⁻⁴, and Farrenkopf et al. (1997) also suggested a value of 1 x10⁻⁴. Wadley et al. (2020) chose a base value of 3 x 10⁻⁴ for use in their global model of iodine cycling, based on a literature survey.
Our I:C estimate, together with those cited above, is much higher than some other estimates based on studies of iodine uptake by phytoplankton which inferred I:C ratios as low as 10-8 to 10-6 (Moriyasu et al., 2020). On the other hand, the I:C ratios in oxic sediments are even higher, of order 10-3 (Moriyasu et al., 2020). Wadley et al. (2020) assumed a base value of 3 x 10⁻⁴ in their model but experimented with ratios ranging from 4.7 x 10⁻⁶ to 1.2 x 10⁻³ which they noted covered the range of literature estimates. Allowing the I:C ratio to vary regionally helped to improve the fit of their model to surface water iodide observations at the global scale.
On the other hand, the external supply of iodide to BB deep water might involve release from reducing sediments. Our sampling depth at 60 m is approximately 10 m above the seafloor. From Figure 3C, we can see that the layer of low oxygen concentration extends to about 40m depth in summer. Ullman and Aller (1980) reported fluxes of iodide from coastal sediments ranging from ca. 5 to 41 μmol m-2 day-1 under anoxic conditions. If we assume that this iodide flux is added to a 30 m thick bottom layer (40 m to 70 m), the iodide accumulation rate would be between 0.2 to 1.4 nmol day-1. This represents either a small fraction or all of the observed accumulation rate of 1.25 nmol day-1. The nature of the external source of iodide to BB bottom waters therefore requires further resolution. This might best be achieved using pore-water profiles and/or benthic chamber studies. A very preliminary, limited study with core incubations of BB sediment (see Supplementary Material S1.3) gave estimates of the flux of iodide from sediment ranging from ca. 19.2 to 43.8 μmol m-2 day-1 in November (2 weeks after an intrusion), and -2.7 to 8.2 μmol m-2 day-1 in May. The associated iodide accumulation rates for a 30 m thick bottom layer would be -0.1 to 1.5 nmol day-1. These preliminary flux estimates are therefore consistent with the flux rates of iodide reported by Ullman and Aller (1980). Here we should note that the core incubations shortly after an intrusion of shelf water may have been impacted by altered redox conditions, so that rates may not be representative of long-term averages.
Based on the accumulation rates of TDI and the loss rates of iodate summarized in Table 1, it can be concluded that the observed iodide accumulation is supported to approximately equal extent by in-situ reduction of iodate and external inputs. Some of the external input is likely due to shallow remineralization of sinking organic matter within the water column, as suggested based on open ocean time-series measurements made off Bermuda by Campos et al. (1996). However, the relative importance of the remineralization source vs. a sediment source in Bedford Basin requires further definition.
4.3 Fate of subsurface iodide
The time-series data show that high-levels of iodide accumulate in shallow (< 60 m), subsurface waters, even in the presence of significant quantities of oxygen. The accumulated iodide is “reset” to levels more typical of surface waters as a result of displacement of bottom water by intrusions of saltier shelf waters in summer and by convective mixing in winter. Given that iodide oxidation is known to be very slow (Luther et al., 1995), both mechanisms imply an upward transport of accumulated iodide which could, potentially, contribute to elevation of surface levels of iodide over the year. The effect of specific mixing events or intrusions on surface levels is not typically visible in our time-series, however, likely because the weekly sampling frequency misses the signature of such episodic, sudden events. Clearly, even with weekly sampling, key processes affecting near-surface iodide are not resolved.
While episodic upward transport of iodide due to convection and/or intrusions was not captured, the more rapid accumulation of iodide in subsurface waters raises the possibility that the gradual accumulation of iodide in surface waters over the summer and fall is a consequence of vertical (diapycnal) mixing acting on a steadily increasing vertical gradient of iodide.
Based on the observed iodide vs oxygen correlation at 60 m (Figure 8B) and assuming this applies to the vertical concentration profile of iodide, we have used continuous CTD profiles of oxygen to reconstruct vertical iodide profiles over the stratified period (not shown). Based on this, we estimate that the vertical gradient of iodide (below the sill depth of 20 m) increased from ca. 1 nmol L-1 m-1 in early summer (April) to ca. 4 nmol L-1 m-1 in Fall (October). Assuming a constant vertical eddy diffusivity, this implies that the upward flux of iodide into the surface layer increases by a factor of 4 over the summer and fall. It is therefore possible that the gradual, seasonal accumulation of iodide in surface waters over the summer and fall is not due only to in-situ formation within the surface layer as commonly assumed, but rather reflects a steadily increasing upward flux associated with more rapid iodide accumulation in subsurface waters due to shallow remineralization.
Further modelling of iodide distributions, including the effect of tidal exchanges with shelf waters through “the Narrows”, would be required to evaluate this contribution to the surface water iodide budget more quantitatively. However, the conceptual picture of iodine cycling emerging from the time-series in a high productivity, coastal basin, has some differences from the generally assumed view which generally considers mixing with subsurface waters as a sink for iodide produced in the surface layer. For example, based on this perspective, the computational scheme used in the first global-scale model of iodine cycling (Wadley et al., 2020) has iodide produced exclusively in the euphotic zone in connection with primary productivity, with convective mixing in winter representing a loss for surface-produced iodide. No account is taken of the potential for iodate reduction in subsurface waters with less oxygen, and where remineralization of organic matter takes place. Significantly, the model invokes a loss for iodide due to oxidation via nitrification (ammonium oxidation) that controls iodide levels in the surface layer.
Our results, on the other hand, show that iodide accumulates in surface waters when nutrient concentrations are low, but that iodide is produced to a much greater extent in waters immediately beneath the euphotic zone, including via reduction of iodate at oxygen levels that are well above zero. The accumulation of iodide in the subsurface, dark waters was also contributed to by external inputs such as release of iodide from sinking organic matter or from sediments. In Bedford Basin, deepening of the mixed-layer therefore represents a source of iodide to the surface layer rather than a sink, as assumed in the model formulation of Wadley et al. (2020).
While we are not claiming that the processes involved in cycling of iodine in Bedford Basin are the same as those affecting broad regions of the open ocean, we suggest that given the paucity of time-series, globally, additional mechanisms should be considered and evaluated. We therefore examine the global relation of surface iodide to subsurface oxygen in section (4.4) below.
A further key uncertainty relates to the processes and timescales of iodide oxidation. Chemical oxidation kinetics are slow (Luther et al., 1995), so oxidation and loss of iodide via a biologically-mediated mechanism has been suggested as a sink for iodide. One suggestion is that the oxidation of iodide is connected with ammonium oxidation during nitrification. Hughes et al. (2021) demonstrated that ammonium oxidising bacteria can mediate iodide oxidation to iodate during culture incubations with added excess iodide. Wadley et al. (2020) built this process into their global model of iodine cycling where surface layer nitrification played a key role as a “fast” sink for iodide, especially in sub-tropical waters. They noted, however, that there were trade-offs between their choice of I:C ratios and oxidation timescales and/or mechanisms, in terms of goodness of fit of modelled and observed iodide concentrations in surface waters at the global scale.
Bedford Basin has notably high and variable rates of nitrification in subsurface waters as seen in the accumulation of nitrate shown in Figure 9. Haas et al. (2021) has shown that the activity and growth of ammonia oxidisers is significant but varies interannually depending on the intensity of wintertime mixing. Nevertheless, very large concentrations of ammonium are oxidised seasonally as evidenced by the seasonal appearance of nitrate (see Figure 9B).
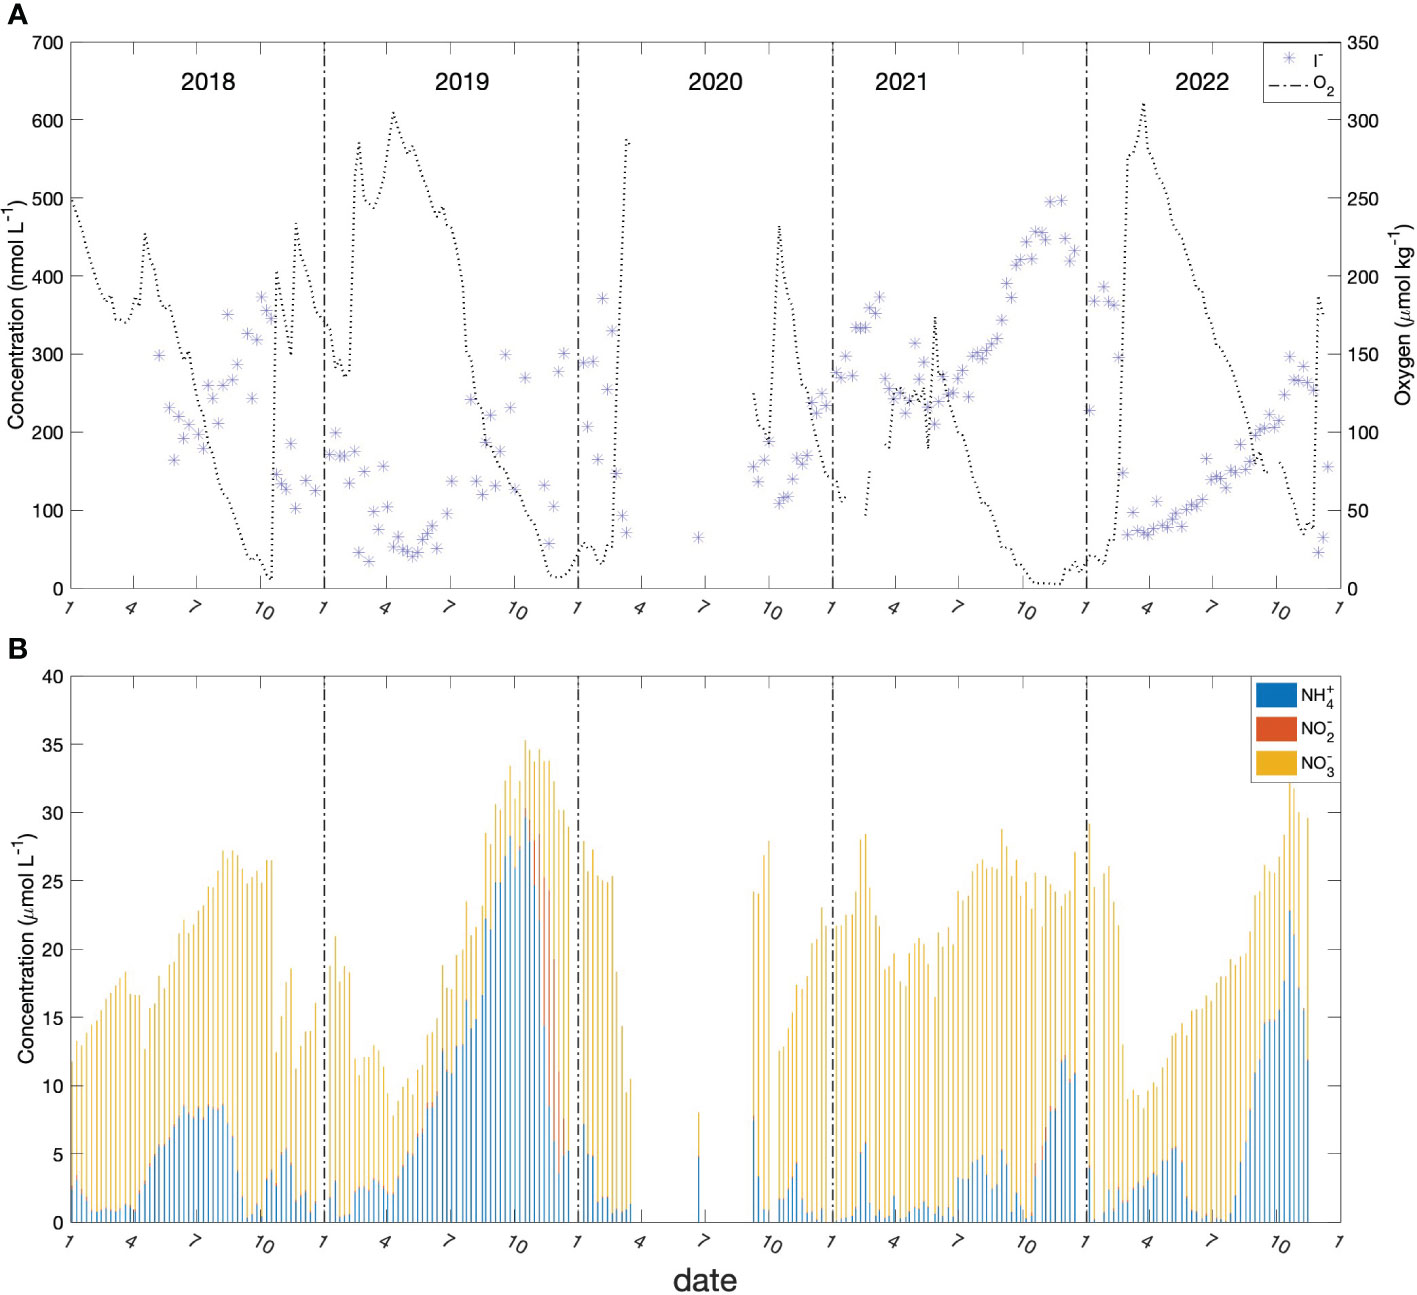
Figure 9 Time series of biogeochemical observations at 60m depth in BB from 2018 to 2022. (A) iodide (blue stars) and oxygen (dash line); (B) NH4+ (blue bar); NO2- (red bar) and NO3- (yellow bar).
In our time-series data (Figure 9 and Supplementary Material Figure S2), nitrification is correlated with the reduction of iodate rather the oxidation of iodide, which appears to contradict the finding from studies with microbial cultures that ammonia oxidation is a sink for iodide (Hughes et al., 2021). However, despite the correlation, our results should not be taken to imply that nitrification is responsible for the increase of iodide. It is possible that both iodate reduction and iodide oxidation can be mediated by ammonia oxidizers or that the effect of oxidation via nitrification is masked by even stronger reduction of iodate that occurs simultaneously in the subsurface waters of Bedford Basin.
4.4 Empirical parameterizations of surface iodide: role of subsurface oxygen
We showed in section 4.1 that the current empirical relationships used to predict surface iodide concentrations do not capture the levels and variability of iodide observed in surface waters of Bedford Basin. The Bedford Basin data point to a strong source of iodide immediately below the euphotic zone that might impact surface water levels via upward vertical/diapycnal mixing. Given this, we examined the global database of surface iodide levels from the open ocean (as compiled by Chance et al., 2019) and compared near surface iodide concentrations with subsurface concentrations of oxygen at 100 m depth (referred to here as [O2]@100m) that were extracted for the same locations as the iodide data from the World Ocean Atlas (https://www.ncei.noaa.gov/access/world-ocean-atlas-2018f/bin/woa18oxnuf.pl?parameter=o). The relationship is shown in Figures 10A, B. The overall data set is noisy, and data density is variable, both geographically and in relation to subsurface oxygen concentrations. We therefore smoothed the relationship using a LOESS fit (Figure 10A) to illustrate the general relationship and binned the data into 25 μmol kg-1 intervals for the box-whisker plot shown in Figure 10B.
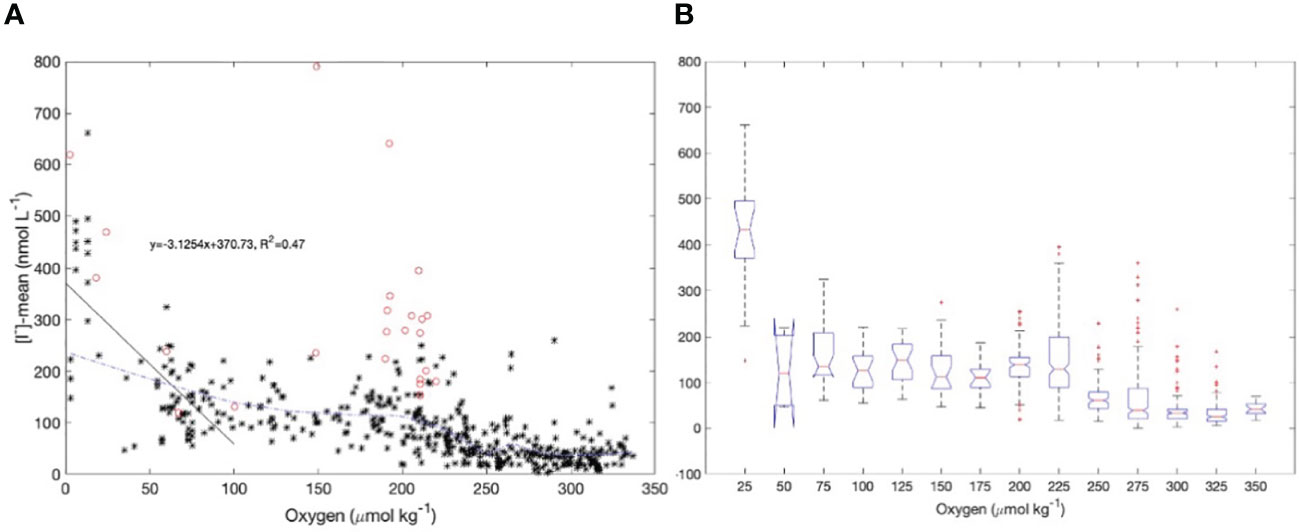
Figure 10 (A) LOESS fit (blue dashed line) of the global database of surface iodide levels (Chance et al., 2019) from the open ocean and subsurface oxygen concentrations (at 100 m depth) that were extracted for the same locations from the World Ocean Atlas. Data reported by Cutter et al. (2018) from the eastern Pacific (red circles) were excluded from the fit. A linear regression (black solid line) was calculated for data where the subsurface oxygen concentrations were less than 100 μmol kg-1; (B) box-whisker plot between surface iodide levels and subsurface oxygen concentrations using the same data set. The bin size is 25 μmol kg-1 in oxygen concentration.
Although the choice of parameters for the LOESS fit is subjective, it is notable that all very high surface iodide concentrations in the dataset are from regions where [O2]@100m<25 μmol kg-1 and the lowest surface iodide concentrations are found where [O2]@100m is high. A regression between surface iodide and [O2]@100m is highly significant for the subset of data with O2@100m< 100 μmol kg-1. However there is notable scatter in the relationship in the range 160< [O2]@100 m< 240. Much of these data are from the eastern tropical Pacific (coloured symbols) and were excluded when calculating the LOESS fit. These data were collected from a cruise which focussed on sampling upper ocean waters that are strongly impacted by the “shelf to basin shuttle” of reduced species (Severmann et al., 2008; Evans et al., 2020). These waters have been advected offshore from continental shelves with very low oxygen concentrations which are also impacted by sediment-water exchange of reduced species. These surface waters have been shown to have chemical characteristics (e.g., distributions of longer-lived, reduced species) that reflect their low-oxygen origins even if gas exchange has subsequently replenished the oxygen levels. In other words, in some regions, the concentrations of long-lived reduced species such as iodide are under kinetic control, allowing for advection far from the locations and conditions where they are formed (Hawco et al., 2016; Cutter et al., 2018).
The formulation of a new empirical parameterization for surface iodide is well beyond the scope of this paper; however, the overall relationship with subsurface oxygen shown in Figure 10 suggests that subsurface oxygen levels and/or the oxygen history of surface water might be a useful predictor of near-surface iodide, both temporally (as in Bedford Basin) and globally. In general, our results are consistent with the use of iodine-to-calcium ratios (I/Ca) in shallow carbonates as a proxy of seawater redox conditions throughout Earth history (Lu et al., 2010; Hardisty et al., 2014). The underlying mechanistic bases for an empirical relationship with oxygen exist, however, the non-local role of the “shelf-to-basin shuttle” will need to be considered explicitly in some regions. Further quantitative studies, including measurements made deliberately across gradients of subsurface oxygen, and including use of biogeochemical modelling, will be required to develop this hypothesis further.
5 Conclusions and next steps
We have presented a description of an unusually long (4.5 year), highly-resolved (weekly) time-series of inorganic iodine speciation from a seasonally hypoxic coastal fjord. The data revealed strong inverse correlations of both iodide (I-) and total dissolved iodine (TDI= [I-]+ [IO3-]+[DOI]) with dissolved oxygen in subsurface waters of the fjord (i.e., at 60 m). Our limited characterization of DOI is that its concentration remained relatively low (mean of 37 nmol L-1) and did not vary greatly over the year. The observed relationships suggest that there is a seasonal cycle of subsurface TDI driven by external sources such as remineralization of sinking organic particles and/or releases from the sediment. There is also clear seasonality of subsurface iodide, with roughly 50% of the iodide increase originating from in-situ reduction of iodate in the water column (apparently at all oxygen levels) and the remainder added via external sources such as from sinking particles and/or sediment-water exchange.
The near-surface iodide concentrations were relatively low throughout the year but showed a weak build-up (from 70 nmol L-1 to 150 nmol L-1) over summer and through late fall. The magnitude and temporal variability of the iodide concentration in surface waters was not well-predicted by current empirical parameterizations that have been developed on the basis of surface iodide measurements on a global scale.
The key features observed in the time-series data are also not, necessarily, consistent with mechanisms, parameterizations and assumptions that form the basis of an initial mechanistic model used to predict surface iodide on a global scale. Notably, the subsurface ocean appears to act as a source rather than a sink for surface iodide, and nitrification in subsurface waters was positively correlated with the reduction of iodate to iodide, even though studies with microbial cultures have shown that nitrification (ammonia oxidation) acts as a sink for iodide.
Based on qualitative examination of the time-series, we hypothesis that the seasonal build-up of iodide in surface waters is at least partly a consequence of seasonal production of iodide in sub-surface waters, coupled with vertical mixing. Examination of the global surface ocean data set for iodide, suggests there is an overall relationship between oxygen concentrations underlying the surface layer and iodide concentrations in surface water which may be consistent with this process and might contribute to future parameterizations and/or model representations of iodine cycling.
Overall, the time-series study in Bedford Basin shows again the power and potential of multi-disciplinary time-series for revealing complex mechanisms and testing hypotheses concerning the physical-biogeochemical interactions responsible for element speciation in the ocean. Next steps are to conduct experimental studies and manipulations to test hypothesised mechanisms of iodine cycling (including better characterization of sediment-water exchange) in the context of the time-series and to examine iodine cycling, quantitatively, using models.
Data availability statement
The original contributions presented in the study are included in the article/Supplementary Material. Further inquiries can be directed to the corresponding authors.
Author contributions
QS and DW conceptualized the study. QS analyzed the samples with guidance of JK. QS and DW wrote the manuscript. DW and JK contributed to detailed discussions. All authors contributed to the article and approved the submitted version.
Acknowledgments
This work was funded by the Canada Excellence Research Chair in Ocean Science and Technology at Dalhousie University, a Seed Fund of the Ocean Frontier Institute, and the MEOPAR Network of Centres of Excellence. Sampling of the Bedford Basin time-series was supported by MEOPAR’s Observation Core, Bedford Basin Monitoring Program (BBMP) and Department of Fisheries and Ocean, Canada (DFO). The authors thank Richard Davies, Magdalena Walclawik and the crew of the Sigma-T for assistance with sampling and logistics. The assistance and guidance in the laboratory from Claire Normandeau, Anadiuska Rondon Vivas and Erin Keltie is also acknowledged. We thank Subhadeep Rakshit for conducting the core incubations and for discussions.
Conflict of interest
The authors declare that the research was conducted in the absence of any commercial or financial relationships that could be construed as a potential conflict of interest.
Publisher’s note
All claims expressed in this article are solely those of the authors and do not necessarily represent those of their affiliated organizations, or those of the publisher, the editors and the reviewers. Any product that may be evaluated in this article, or claim that may be made by its manufacturer, is not guaranteed or endorsed by the publisher.
Supplementary material
The Supplementary Material for this article can be found online at: https://www.frontiersin.org/articles/10.3389/fmars.2023.1171999/full#supplementary-material
References
Bluhm K., Croot P., Wuttig K., Lochte K. (2010). Transformation of iodate to iodide in marine phytoplankton driven by cell senescence. Aquat. Biol. 11 (1), 1–15. doi: 10.3354/ab00284
Brandao A. C. (2001). Iodine Distribution in the Australian Sector of the Southern Ocean and Its Relation to New Production and Water Masses (Thesis, University of Tasmania).
Campos M. (1997). New approach to evaluating dissolved iodine speciation in natural waters using cathodic stripping voltammetry and a storage study for preserving iodine species. Mar. Chem. 57 (1–2), 107–117. doi: 10.1016/S0304-4203(96)00093-X
Campos M., Farrenkopf A. M., Jickells T. D., Luther G. W. (1996). A comparison of dissolved iodine cycling at the Bermuda Atlantic time-series station and Hawaii ocean time-series station. Deep Sea Res. Part II: Topical Stud. Oceanogr. 43 (2–3), 455–466. doi: 10.1016/0967-0645(95)00100-X
Campos M. L. A. M., Sanders R., Jickells T. (1999). The Dissolved Iodate and Iodide Distribution in the South Atlantic from the Weddell Sea to Brazil. Mar. Chem. (65), 167–175. doi: 10.1016/S0304-4203(98)00094-2
Carpenter L. J., Chance R. J., Sherwen T., Adams T. J., Ball S. M., Evans M. J., et al. (2021). Marine iodine emissions in a changing world, proceedings of the royal society a: mathematical. Phys. Eng. Sci. A 477 (20200824). doi: 10.1098/rspa.2020.0824
Carpenter L. J., MacDonald S. M., Shaw M. D., Kumar R., Saunders R. W., Parthipan R., et al. (2013). Atmospheric iodine levels influenced by sea surface emissions of inorganic iodine. Nat. Geosci. 6 (2), 108–111. doi: 10.1038/ngeo1687
Casacuberta N., Christl M., Vockenhuber C., Wefing A. M., Wacker L., Masqué P., et al. (2018). Tracing the three Atlantic branches entering the Arctic ocean with 129I and 236U. J. Geophys. Res.: Oceans 123 (9), 6909–6921. doi: 10.1029/2018JC014168
Chance R., Baker A. R., Carpenter L., Jickells T. D. (2014). The distribution of iodide at the sea surface. Environ. Sci.: Processes Impacts 16 (8), 1841–1859. doi: 10.1039/c4em00139g
Chance R. J., Tinel L., Sherwen T., Baker A. R., Bell T., Brindle J., et al. (2019). Global sea-surface iodide observations 1967-2018. Sci. Data 6 (1), 286. doi: 10.1038/s41597-019-0288-y
Chance R., Weston K., Baker A. R., Hughes C., Malin G., Carpenter L., et al. (2010). Seasonal and interannual variation of dissolved iodine speciation at a coastal Antarctic site. Mar. Chem. 118 (3–4), 171–181. doi: 10.1016/j.marchem.2009.11.009
Cutter G. A., Moffett J. G., Nielsdóttir M. C., Sanial V. (2018). Multiple oxidation state trace elements in suboxic waters off Peru: In situ redox processes and advective/diffusive horizontal transport. Mar. Chem. 201 (March 2017), 77–89. doi: 10.1016/j.marchem.2018.01.003
Davis D., Crawford J., Liu S., McKeen S., Bandy A., Thornton D., et al. (1996). Potential impact of iodine on tropospheric levels of ozone and other critical oxidants. J. Geophys. Res.: Atmospheres 101 (D1), 2135–2147. doi: 10.1029/95JD02727
Elderfield H., Truesdale V. W. (1980). On the biophilic nature of iodine in seawater. Earth Planet. Sci. Lett. 50 (1), 105–114. doi: 10.1016/0012-821X(80)90122-3
Evans N., Boles E., Kwiecinski J. V., Mullen S., Wolf M., Devol A. H., et al. (2020). The role of water masses in shaping the distribution of redox active compounds in the Eastern tropical north pacific oxygen deficient zone and influencing low oxygen concentrations in the eastern pacific ocean. Limnol. Oceanogr. 65 (8), 1688–1705. doi: 10.1002/lno.11412
Farrenkopf A. M., Luther G. W., Truesdale V. W., van der Weijden C. H. (1997). Sub-Surface iodide maxima: evidence for biologically catalyzed redox cycling in Arabian Sea OMZ during the SW intermonsoon. Deep Sea Res. Part II: Topical Stud. Oceanogr. 44 (6–7), 1391–1409. doi: 10.1016/S0967-0645(97)00013-1
Ganzeveld L., Helmig D., Fairall C. W., Hare J., Pozzer A. (2009). Atmosphere-ocean ozone exchange: a global modeling study of biogeochemical, atmospheric, and waterside turbulence dependencies. Global Biogeochem. Cycles 23 (4), 1–16. doi: 10.1029/2008GB003301
Haas S., Robicheau B. M., Rakshit S., Tolman J., Algar C. K., LaRoche J., et al. (2021). Physical mixing controls and decouples nitrification via biomass dilution. Proc. Natl. Acad. Sci. 118 (18), e2004877118 doi: 10.1073/pnas.2004877118
Hardisty D. S., Lu Z., Planavsky N. J, Bekker A., Philippot P., Zhou X. (2014). An Iodine Record of Paleoproterozoic Surface Ocean Oxygenation. Geology 42 (7), 619–22.
Hatch-mcchesney A., Lieberman H. R. (2022). ). iodine and iodine Deficiency: a comprehensive review of a re-emerging issue. Nutrients 14 (17). doi: 10.3390/nu14173474
Hawco N. J., Ohnemus D. C., Resing J. A., Twining B. S., Saito M. A. (2016). A dissolved cobalt plume in the oxygen minimum zone of the eastern tropical south pacific. Biogeosciences 13 (20), 5697–5717. doi: 10.5194/bg-13-5697-2016
Hughes C., Barton E., Hepach H., Chance R., Pickering M. D., Hogg K., et al. (2021). Oxidation of iodide to iodate by cultures of marine ammonia-oxidising bacteria. Mar. Chem. 234 (June). doi: 10.1016/j.marchem.2021.104000
Hung C. C., Wong G. T. F., Dunstan W. M. (2005). Iodate reduction activity in nitrate reductase extracts from marine phytoplankton. Bull. Mar. Sci. 76 (1), 61–72.
Jones M. R., Chance R., Dadic R., Hannula H. R., May R., Ward M., et al. (2023). Environmental iodine speciation quantification in seawater and snow using ion exchange chromatography and UV spectrophotometric detection. Anal. Chimica Acta 1239 (November 2022), 340700. doi: 10.1016/j.aca.2022.340700
Kawamura H., Kobayashi T., Furuno A., In T., Ishikawa Y., Nakayama T., et al. (2011). Preliminary numerical experiments on oceanic dispersion of 131 I and 137 Cs discharged into the ocean because of the fukushima daiichi nuclear power plant disaster. J. Nucl. Sci. Technol. 48 (11), 1349–1356. doi: 10.1080/18811248.2011.9711826
Li W. K. W. (1998). Annual average abundance of heterotrophic bacteria and Synechococcus in surface ocean waters. Limnol. Oceanogr. 43 (7), 1746–1753. doi: 10.4319/lo.1998.43.7.1746
Lu Z., Jenkyns H. C., Rickaby R. E. M. (2010). Iodine to calcium ratios in marine carbonate as a paleo-redox proxy during oceanic anoxic events. Geology 38 (12), 1107–1110. doi: 10.1130/G31145.1
Luther G. W., Wu J., Cullen J. B. (1995). Redox chemistry of iodine in seawater: frontier molecular orbital theory considerations. Aquat. Chem. 135–155. doi: 10.1021/ba-1995-0244.ch006
Macdonald S. M., Gómez Martín J. C., Chance R., Warriner S., Saiz-Lopez A., Carpenter L. J., et al. (2014). A laboratory characterisation of inorganic iodine emissions from the sea surface: dependence on oceanic variables and parameterisation for global modelling. Atmospheric. Chem. Phys. 14 (11), 5841–5852. doi: 10.5194/acp-14-5841-2014
McFiggans G., Plane J., Allan B. J., Carpenter L. J., Coe H., O’Dowd C. (2000). A modeling study of iodine chemistry in the marine boundary layer. J. Geophys. Res.: Atmospheres 105 (D11), 14371–14385. doi: 10.1029/1999JD901187
Moriyasu R., Evans Z. C., Bolster K. M., Hardisty D. S., Moffett J. W. (2020). The distribution and redox speciation of iodine in the Eastern tropical north pacific ocean. Global Biogeochem. Cycles 34 (2), 1–23. doi: 10.1029/2019gb006302
Raisbeck G. M., Yiou F. (1999). 129I in the oceans: origins and applications. Sci. Total Environ. 237–238, 31–41. doi: 10.1016/S0048-9697(99)00122-9
Rakshit S., Dale A. W., Wallace D. W., Algar C. K. (2023). Sources and sinks of bottom water oxygen in a seasonally hypoxic fjord. Front. Mar. Sci. 10, 1148091. doi: 10.3389/fmars.2023.1148091
Reyes-Umana V., Henning Z., Lee K., Barnum T. P., Coates J. D. (2022). Genetic and phylogenetic analysis of dissimilatory iodate-reducing bacteria identifies potential niches across the world’s oceans. ISME J. 16 (1), 38–49. doi: 10.1038/s41396-021-01034-5
Robinson C. (2019). Microbial respiration, the engine of ocean deoxygenation. Front. Mar. Sci. 5 (JAN). doi: 10.3389/fmars.2018.00533
Saiz-Lopez A., Von Glasow R. (2012). Reactive halogen chemistry in the troposphere. Chem. Soc. Rev. 41 (19), 6448. doi: 10.1039/c2cs35208g
Sanz Rodriguez E., Setiawan A. N., Pope S., Haddad P. R., Nesterenko P. N., Paull B. (2016). A simple and sensitive method for the determination of iodide and iodate in raw, ultraviolet- and ozone-treated aquacultural seawater samples using ion chromatography coupled to an ultraviolet detector. Anal. Methods 8 (28), 5587–5595. doi: 10.1039/c6ay01381c
Severmann S., Lyons T. W., Anbar A., McManus J., Gordon G. (2008). Modern iron isotope perspective on the benthic iron shuttle and the redox evolution of ancient oceans. Geology 36 (6), 487–490. doi: 10.1130/G24670A.1
Sherwen T., Chance R. J., Tinel L., Ellis D., Evans M. J., Carpenter L. J. (2019). A machine-learning-based global sea-surface iodide distribution. Earth Syst. Sci. Data 11 (3), 1239–1262. doi: 10.5194/essd-11-1239-2019
Shi Q., Petrick G., Quack B., Marandino C., Wallace D. W. R. (2014). A time series of incubation experiments to examine the production and loss of CH3I in surface seawater. J. Geophys. Res. Oceans 2, 1022–1037. doi: 10.1002/2013JC009415
Shi Q., Wallace D. (2018). A 3-year time series of volatile organic iodocarbons in Bedford basin, Nova Scotia: a northwestern Atlantic fjord. Ocean Sci. 14 (6), 1385–1403. doi: 10.5194/os-14-1385-2018
Strickland J. D. H., Parsons T. R. (1972). The journal of higher education: A practical handbook of seawater analysis. Canada:Fisheries research board of Canada Ottawa.
Tegtmeier S., Krüger K., Quack B., Atlas E., Blake D. R., Boenisch H., et al. (2013). The contribution of oceanic methyl iodide to stratospheric iodine. Atmospheric Chem. Phys. 13 (23), 11869–11886. doi: 10.5194/acp-13-11869-2013
Truesdale V. W. (1994). Distribution of dissolved iodine in the Irish Sea, a temperate shelf Sea, estuarine. Coast. Shelf Sci. 38 (5), 435–446. doi: 10.1006/ecss.1994.1030
Truesdale V. W. (1995). The distribution of dissolved iodine in hebridean waters during mid-winter. Mar. Environ. Res. 40 (3), 277–288. doi: 10.1016/0141-1136(94)00147-H
Truesdale V. W., Nausch G., Baker A. (2001). ). the distribution of iodine in the Baltic Sea during summer. Mar. Chem. 74 (2–3), 87–98. doi: 10.1016/S0304-4203(00)00115-8
Ullman W. J., Aller R. C. (1980). Dissolved iodine flux from estuarine sediments and implications for the enrichment of iodine at the sediment water interface. Geochimica Cosmochimica Acta 44 (8), 1177–1184. doi: 10.1016/0016-7037(80)90071-X
Wadley M. R., Stevens D. P., Jickells T. D., Hughes C., Chance R., Hepach H., et al. (2020). A global model for iodine speciation in the upper ocean. Global Biogeochem. Cycles 34 (9). doi: 10.1029/2019GB006467
Waite T. J., Truesdale V. W. (2003). Iodate reduction by isochrysis galbana is relatively insensitive to de-activation of nitrate reductase activity - are phytoplankton really responsible for iodate reduction in seawater? Mar. Chem. 81 (3–4), 137–148. doi: 10.1016/S0304-4203(03)00013-6
Wefing A. M., Casacuberta N., Christl M., Gruber N., Smith J. N. (2021). Circulation timescales of Atlantic water in the Arctic ocean determined from anthropogenic radionuclides. Ocean Sci. 17 (1), 111–129. doi: 10.5194/os-17-111-2021
Wefing A. M., Christl M., Vockenhuber C., Rutgers van der Loeff M., Casacuberta N. (2019). Tracing Atlantic waters using 129 I and 236 U in the fram strait in 2016. J. Geophys. Res.: Oceans 124 (2), 882–896. doi: 10.1029/2018JC014399
Witt E. M., Laidley C. W., Liu K. K. M., Hirano T., Grau E. G. (2009). Correlation between environmental iodide concentrations and larval growth, survival, and whole body concentrations of thyroid hormones and cortisol in pacific threadfin (Polydactylus sexfilis). Aquaculture 289 (3–4), 357–364. doi: 10.1016/j.aquaculture.2009.01.024
Keywords: ocean time series, iodide, iodate, biogeochemistry, fjord, total dissolved iodine
Citation: Shi Q, Kim JS and Wallace DW (2023) Speciation of dissolved inorganic iodine in a coastal fjord: a time-series study from Bedford Basin, Nova Scotia, Canada. Front. Mar. Sci. 10:1171999. doi: 10.3389/fmars.2023.1171999
Received: 22 February 2023; Accepted: 09 June 2023;
Published: 29 June 2023.
Edited by:
Dalton Hardisty, Michigan State University, United StatesReviewed by:
Peng Lin, University of Georgia, United StatesNatalya Evans, University of California Santa Barbara, United States
Copyright © 2023 Shi, Kim and Wallace. This is an open-access article distributed under the terms of the Creative Commons Attribution License (CC BY). The use, distribution or reproduction in other forums is permitted, provided the original author(s) and the copyright owner(s) are credited and that the original publication in this journal is cited, in accordance with accepted academic practice. No use, distribution or reproduction is permitted which does not comply with these terms.
*Correspondence: Qiang Shi, cXNoaUBkYWwuY2E=; Douglas W. Wallace, RG91Z2xhcy5XYWxsYWNlQERhbC5DYQ==