 Michael H. Academia
 Bryan D. Watts
- Center for Conservation Biology, College of William & Mary, Williamsburg, VA, United States
The Atlantic States Marine Fisheries Commission (ASMFC), the governing body responsible for managing fisheries on the U.S. East Coast, formally adopted the use of Ecological Reference Points (ERPs) for Atlantic menhaden, Brevoortia tyrannus. Scientists and stakeholders have long recognized the importance of menhaden and predators such as ospreys, Pandion haliaetus, that support the valuable ecotourism industry and hold cultural significance. Landings in the reduction fishery are at their lowest levels and menhaden is facing potential localized depletion. Mobjack Bay, located within the lower Chesapeake Bay, has been a focus of osprey research since 1970 and represents a barometer for the relationship between osprey breeding performance and the availability of their main prey, menhaden. Since local levels of menhaden abundance were not available, we conducted a supplemental menhaden feeding experiment on osprey pairs during the 2021 breeding season. Our main objective was to determine if the delivery rate of menhaden had an influence on nest success and productivity. Nest success (χ2 = 5.5, df = 1, P = 0.02) and productivity (β = 0.88, SE = 0.45, CI = 0.049, 1.825, P = 0.048) were significantly higher within the treatment group. Reproductive rates within the control group were low and unsustainable suggesting that current menhaden availability is too low to support a demographically stable osprey population. Menhaden populations should be maintained at levels that will sustain a stable osprey population in which they are able to produce 1.15 young/active nest to offset mortality.
1 Introduction
World fisheries landings since the late 1980s have been steadily declining (Pauly and Zeller, 2016, FAO, 2020). With mounting concern over the state of our fisheries, management strategies have shifted focus from single-species to ecosystem-based objectives (Pauly et al., 2008). This style of management attempts to integrate ecological, economic, and social factors to secure and protect the sustainability of our fisheries and the ecosystems within which they reside (Einoder, 2009). Thus, United States federal policy firmly reinforces the implementation of Ecosystem-Based Fisheries Management (EBFM) which is an approach that considers trophic interactions and aims to promote the health and resilience of the ecosystem (McLeod and Leslie, 2009; Link, 2010, NMFS (National Marine Fisheries Service), 2016). Apex predators are essential indicators within this management approach and may provide more sensitive measures of changing fish populations because of their dietary dependencies (Furness, 1982; Diamond and Devlin, 2003). Monitoring fish-eating bird populations may be both more cost effective and better suited to the problem of understanding fish populations within an ecosystem (Cairns, 1988). Bird metrics may play an increasing role in the assessment of prey availability, especially in areas where conventional fisheries data are insufficient (Cairns, 1988). Bird populations may serve as an early warning system for changes in fish populations that have ecosystem implications (Kabuta and Laane, 2003; Cury et al., 2005).
The Atlantic States Marine Fisheries Commission (ASMFC), the governing body responsible for managing fisheries on the U.S. East Coast, formally adopted the use of Ecological Reference Points (ERPs) for Atlantic menhaden, Brevoortia tyrannus. Historical estimates of menhaden were limited and the harvest effects did not produce sufficient information on important predator species. Therefore, the ASMFC developed an interest in establishing ERPs to set quotas and evaluate menhaden’s status and role as a forage species (Drew et al., 2021). Scientists and stakeholders have long recognized the importance of predators, such as bottlenose dolphins, Tursiops truncates, and humpback whales, Megaptera novaeanglia, that support a valuable ecotourism industry and hold cultural significance (Gannon and Waples, 2004; Glass and Watts, 2009; Butler et al., 2010; Smith et al., 2015; Drew et al., 2021).
Atlantic menhaden are a schooling fish that can be found along nearshore coasts along the Atlantic Ocean from Nova Scotia, CAN, to Florida, USA and go through large age- and size-dependent seasonal migrations (Dryfoos et al., 1973; Nicholson, 1978; Liljestrand et al., 2019). As indeterminate spawners, adults are capable of spawning multiple times in a season and inhabit estuarine and coastal areas such as Chesapeake Bay (Ahrenholz, 1991, Southeast Data Assessment and Review [SEDAR], 2020). As juveniles, they spend their first spring and summer in estuaries and by late fall, they join with other subadults and adults and migrate to nearshore coastal waters (Southeast Data Assessment and Review [SEDAR], 2020; Anstead et al., 2021).
Menhaden support the largest fishery in the U.S. East Coast by volume and is used for bait and reduced to fish oil and meal which are used for animal feed, fertilizer, and human health supplements (Anstead et al., 2021). The reduction fishery began in the mid-1800s with the use of purse seine gear and peaked in 1956 with over 20 menhaden reduction factories along the Atlantic Coast (Southeast Data Assessment and Review [SEDAR], 2020). Currently, landings in the reduction fishery are at their lowest levels (Southeast Data Assessment and Review [SEDAR], 2020) and at Chesapeake Bay, populations of menhaden are facing potential localized depletion. ASMFC defined localized depletion in Chesapeake Bay “as a reduction in menhaden population density below the level of abundance that is sufficient to maintain its basic ecological, economic, and social/cultural functions” (Annis et al., 2009). Localized depletion has not been officially defined or evaluated by managers because estimates of the standing stock within Chesapeake Bay have been unavailable and thresholds for exploitation cannot be resolved.
Known as the fish hawk, we selected the osprey as an appropriate non-finfish ERP to evaluate localized depletion of menhaden and food limitation within Chesapeake Bay. The ERP Work Group emphasized the research need for diet data collection and demographic responses of non-finfish predators (Atlantic States Marine Fisheries Commission [ASMFC], 2017). According to Buccheister et al. (2017), the nearshore piscivorous birds such as ospreys are sensitive to the overfishing of menhaden. Ecologically, ospreys are generalized specialists (Beirregaard et al., 2014). Specialized in that they are obligate piscivores and generalized in that they predate upon many species of fish. Ospreys surface plunge at a maximum depth of one meter and are more susceptible to a decrease in fish density than other birds such as pursuit divers that search for prey while swimming on the water surface and dive to deeper depths (Ashmole, 1971; Cramp and Simmons, 1979). Piscivory and plunge diving influences an ecological indicator’s response to fish supply perturbations (Einoder, 2009). Reduced prey availability and fluctuations in environmental conditions are more evident in the foraging behavior and breeding success of a specialist (Furness and Ainley, 1984; Montevecchi, 1993). Moreover, shallow divers and surface feeders are more vulnerable, are considered more sensitive indicators than pursuit divers, and show greater variation in breeding performance (Montevecchi, 1993, Monaghan et al., 1994; Scott et al., 2006). As one of the more recognized raptors, ospreys have been used as an ecotoxicological sentinel species of environmental health due to their reproductive responses to natural and anthropogenic pressures and life history traits (Henny et al., 2008; Johnson et al., 2008; Grove et al., 2009). Ospreys exhibit strong nest fidelity and their reproductive status is observable by ground, boat, or aerial surveys which makes them a valuable and efficient sentinel of the ecosystem (Ogden et al., 2014) and an appropriate ERP for menhaden (Buccheister et al., 2017).
The Chesapeake Bay supports one of the largest osprey breeding populations in the world (Henny, 1983; Watts and Paxton, 2007). As with many similar populations, ospreys in the Chesapeake Bay experienced dramatic declines in the post-World War II era due to reproductive suppression (Truitt, 1969; Kennedy, 1971; Wiemeyer, 1971; Reese, 1977) induced by environmental contaminants (Via, 1975; Wiemeyer et al., 1975). The population sustained a low point by 1973 when Henny et al. (1974) estimated its size to be 1,450 breeding pairs. From 1973 to 1995, the population more than doubled in size to nearly 3,500 pairs (Watts et al., 2004) and believed to be between 8,000-10,000 pairs in 2020. However, the population has experienced spatial variation in recovery (Watts et al., 2004; Watts and Paxton, 2007). For example, average doubling time for the population on low-salinity, upper reaches of tributaries, was less than four years while doubling time on higher-salinity reaches of the lower Chesapeake Bay exceeded 40 years (Watts et al., 2004). This variation reflects the extent of the earlier decline, immigration from other regions of the Chesapeake Bay, and the local demography of pairs that may have been influenced by prey availability.
Mobjack Bay has been a focus of osprey research since 1970 and represents a barometer for the relationship between osprey breeding performance and menhaden availability (Glass, 2008). During the mid-1970s, there was little evidence of food limitation reflected in osprey reproductive performance and brood sizes within the higher salinity zones of the lower Chesapeake Bay (Stinson, 1976). However by the early 2000s, the proportion of menhaden in the diet had dropped by 40% and reproductive rates had dropped to precarious levels (Glass, 2008). We conducted a supplemental feeding experiment for osprey pairs nesting in Mobjack Bay during the 2021 breeding season. A clear barrier in resolving the relationship between osprey productivity and menhaden consumption is the lack of menhaden abundance data that can be scaled down to the local level. If such data were available, we could monitor osprey foraging, provisioning, and productivity, and assess the functional response to available menhaden. Since such data are not available, a food manipulative experiment in the wild was performed (Piatt et al., 2007). Our secondary objective was to determine prey composition and the dietary importance of menhaden.
2 Methods
2.1 Study species
Ospreys are large, long-winged raptors with a nearly global distribution that feed exclusively on fish (Poole, 2019). Most osprey populations across North America are migratory, spend the winter months in Central or South America and begin breeding at the age of three (Henny & Wight, 1969) Age-at-first-reproduction in Chesapeake Bay ospreys was recorded from 4 years (Kinkead, 1985) to 5.7 years (Poole, 1989; Poole et al., 2002). As the population reaches carrying capacity, age-at-first-reproduction increases (Spitzer, 1980; Poole, 1989). Poole (1989) estimated that pairs within the Chesapeake Bay must produce 1.15 young per year in order to offset adult mortality. On average, if the population consistently meets or exceeds this rate (demographic source) then the population would be expected to be stable to increasing (Pulliam, 1988). If the reproductive rate consistently falls below this threshold (demographic sink) the population would be expected to decline in the absence of compensatory immigration.
2.2 Food addition experiment
We established treatment (fish addition) and control (no fish addition) nests to assess the effect of increased provisioning on demography. We added 472 g ± 7.9 (SE) of menhaden every 3.5d ± 0.2 to treatment nests from the time of hatching to six weeks of age. We delivered menhaden to nests using a telescopic pole with a mounted delivery device. We sourced fresh or previously frozen menhaden from a local fishing supply company and the fish were counted, weighed, coded, and separated into packages for easy deployment. We selected study nests based on accessibility and randomly assigned accessible nests to treatments. We conducted an initial survey (late March to mid-April) of the study area for osprey nests (N = 114) and recorded location (latitude, longitude), accessibility by boat, nesting stage, nest substrate, height over water, and water depth. We screened nests for initial inclusion in the study based on accessibility, height over water (to allow for ready access to the nest) and water depth (to allow for boat access and maneuverability). We only included nests within the study that survived to hatching stage. We monitored all nests included within the initial draw until clutches hatched. Nests that hatched eggs were randomly assigned to two treatment groups (Figure 1) including a control group (N = 15) and a food addition group (N = 16). The nests in the East River were limited in boat accessibility and therefore assigned to the control group.
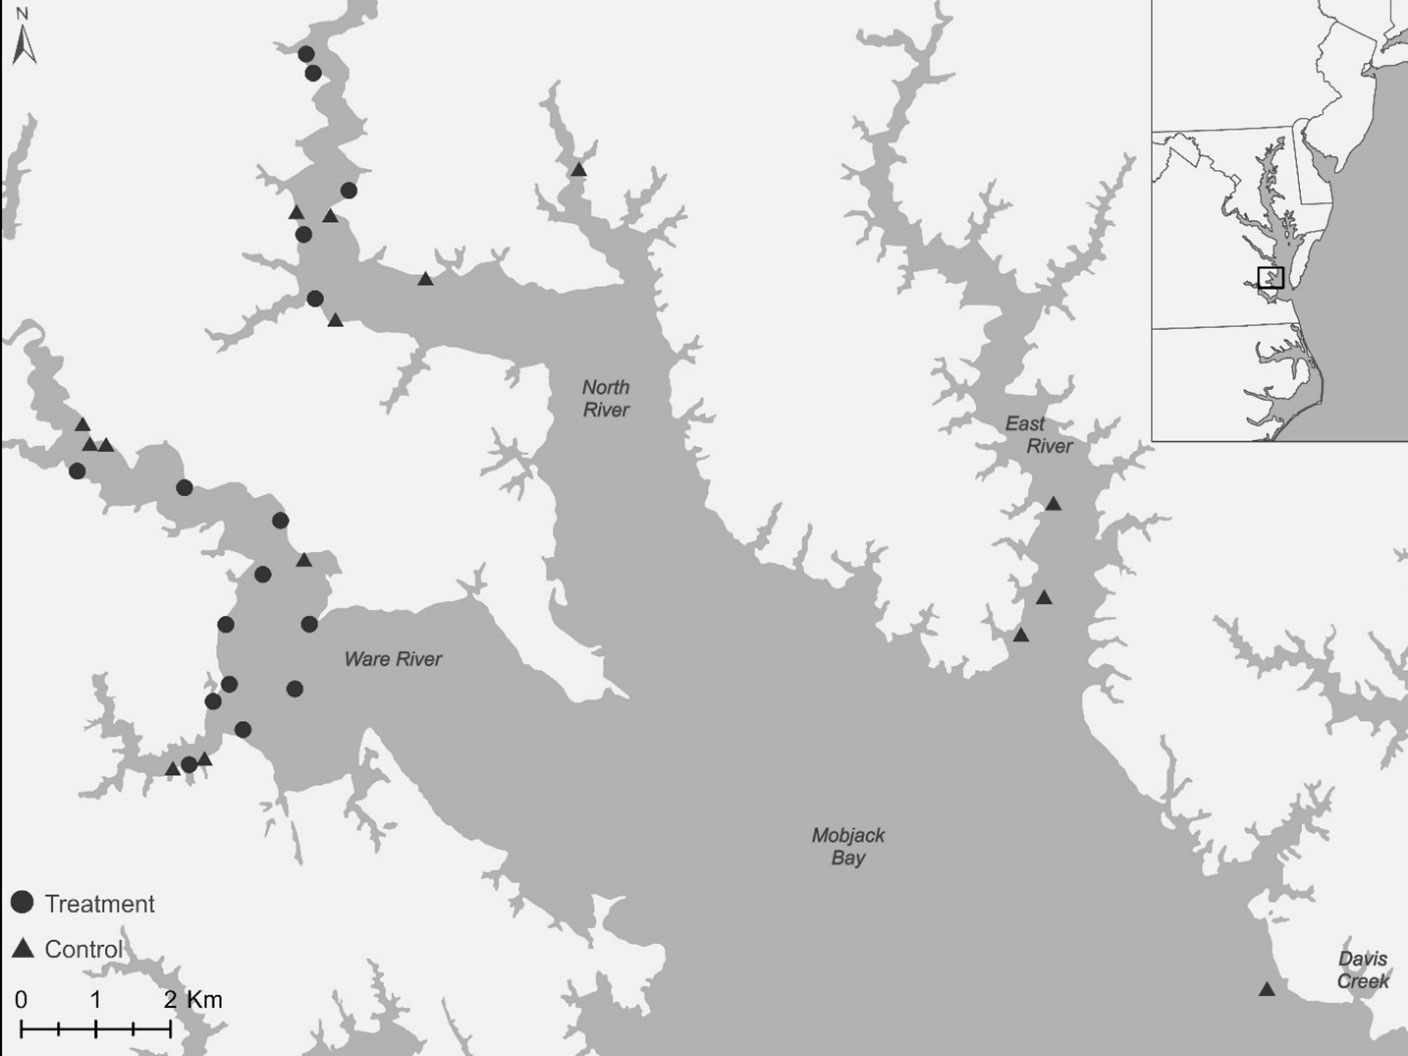
Figure 1 Map of the experimental area of Mobjack Bay on the lower eastern region of Chesapeake Bay, VA, USA. The locations of the control group (N = 15) represented by black triangles and the food addition group (N = 16) represented by black circles.
2.3 Demography
We monitored nests twice per week from clutch completion to fledging to quantify demographic parameters including clutch size, brood size, and the number of young fledged. From observations, we determined brood reduction (number of young lost between hatching and fledging). We noted the age that nestlings died and the stage when nests failed. We consider a nest to be successful if the pair produced at least one young to fledging age. We consider productivity to be the number of young that reached fledging age (7 wks) per active nest (Steenhof and Newton, 2007). We used a telescopic mirror pole to facilitate the examination of nest contents for nests that were >2 m above the water line.
2.4 Provisioning
We used trail cams (Browning Strike Force HD Pro X - BTC-5HDPX) to quantify nest provisioning rates including the average number of fish (n/day), biomass (g/day) and energy (kcal/day) for a subsample of treatment (N = 7) and control (N = 4) nests. We deployed cameras on nest structures that would accommodate them. We fastened trail cams to 1.91 cm (3/4 inch) diameter conduit and mounted conduit to the nesting structure such that cameras were positioned approximately 1 m above the nest. Cameras were programmed to record an image every 5 min during daylight hours (05:00 to 22:00). We extracted images from the photo set that depicted fish delivered to nests and identified all fish to the lowest taxonomic level possible. Most fish were identified to the species level but others could only be identified to the genus or family level. We estimated fish length from photos within an image processing program, ImageJ with Java (https://imagej.nih.gov/ij/index.html) and compared to known lengths from reference structures (Poole et al., 2002) including adult bill (male =32.5, female = 34.6 mm) and talon (male = 28.9, female = 30.0 mm). We estimated the biomass (g) of each fish using species-specific length-mass equations from published literature and FishBase (https://fishbase.in/, Appendix 2). We converted biomass to energy (kcal) using published species-specific energy density values (Appendix 3). For species that could not be identified to species, we used length-mass equations and energy density from a representative species of the taxonomic group. We consider the provisioning of control nests to include fish provided by adults and for treatment nests to include fish provided by adults and menhaden that we added to nests. It is important to note that treatment nests that did not have trail cameras were observed by boat and consumption of supplemented fish by the adults and young were verified.
2.5 Statistical analysis
Data were not independent, not normally distributed, and non-homogenous therefore, we used appropriate tests. We investigated the influence of treatment (control vs food addition) on demographic parameters including nest success, clutch size, the number of young hatched, brood reduction, and productivity. We constructed a two-by-two contingency table and used Pearson’s Chi-squared analysis to compare the relationship between treatment type and nest success. We used Generalized Linear Models (GLMs) to determine if there were the average differences in clutch size, the number of young hatched, brood reduction, and productivity between the treatment types. For provisioning (fish/d, biomass/d, energy content/d), we analyzed data from trail cameras to evaluate the relationship between provisioning and demographic parameters. It is important to note that our models were based on totals and/or average provisioning rates including naturally provisioned and supplemental fish.
We used Generalized Linear Mixed Models (GLMMs) with a negative binomial distribution and log link, nest and treatment type as the random effects, and food addition and total provisioning (natural and supplemented) as the fixed effects. For the influence of provisioning on demographics, we used GLMs with a negative binomial distribution and log link and compared the effects of the mean fish/d, biomass/d, and energy content/d (natural and supplemented) on productivity (both treatment groups combined, N = 11). We calculated the supplemented average biomass/d/nest and energy content/d/nest threshold needed for the production of 1.15 fledglings per nest-season (estimated break-even rate). All analyses were performed in RStudio 4.02 and we used the MASS and glmmTMB packages for model development and validated by the DHARMa package for residual diagnostics on hierarchical regression models (Venables and Ripley, 2002; Brooks et al., 2017; R Core Team, 2020; Hartig, 2021).
3 Results
3.1 Food addition and demography
For the food addition group, 13 of the 16 nests (81%) succeeded with an average productivity rate of 1.13 + 0.18 (SE) young/active nest. The three nests that failed in this group failed on average during the first 1.38 + 0.5 wks. or when young were 10 d old. For the control group, five of the 15 nests (33%) succeeded with an average productivity rate of 0.47 young/active nest. The ten nests that failed in this group failed on average during the first 2.2 + 0.5 wks. The age at failure (d) between the food addition and control groups was not statistically significantly different (β = -0.47, SE = 0.41, P = 0.25). The age at failure for the control group ranged from 3 - 42 d with the highest mortality experienced during the first 15.5 d + 3.4 of the nestling period. Nest success and productivity were significantly different between the control and food addition groups (Table 1, Figure 2). Clutch size, the number of young hatched, and brood reduction were not significantly different between the control and food addition groups (Table 2).

Table 1 Two-way contingency table used for the Pearson’s Chi-squared analysis that summarizes the relationship between treatment types and nest success during the 2021 osprey breeding season in the lower Chesapeake Bay, VA, USA (χ2 = 5.5, df = 1, P = 0.02).
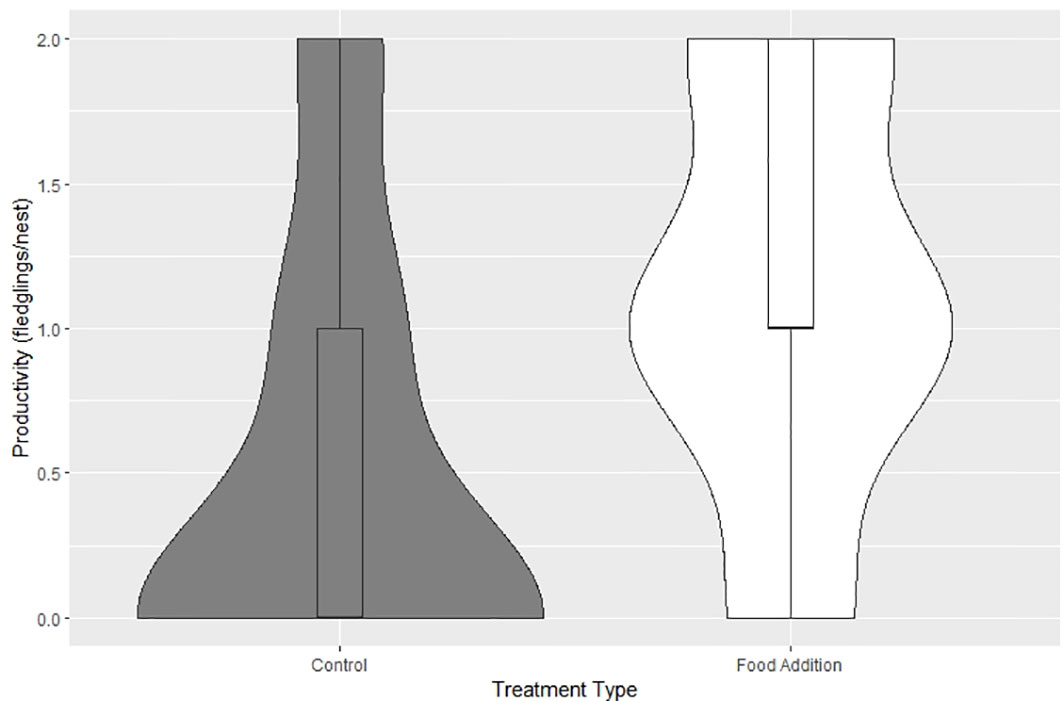
Figure 2 Productivity between the control group (N = 15) and the treatment group (N = 16) of ospreys during the 2021 breeding season in the lower Chesapeake Bay, VA, USA (β = 0.88, SE = 0.45, pseudo R2 = 0.14, CI =0.049, 1.825, P= 0.048). Violin shapes represent the density of data distribution and the middle horizonal line of the box plots represent the median values.
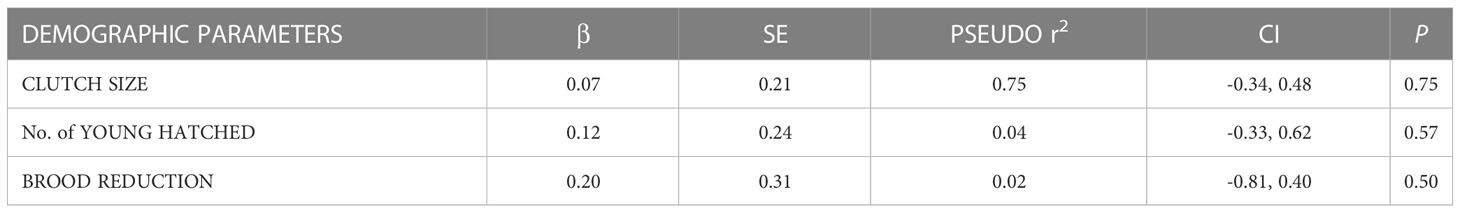
Table 2 Results for GLMs used to compare demographic parameters between treatment types during the 2021 osprey breeding season in the lower Chesapeake Bay, VA, USA.
3.2 Provisioning and productivity
Food supplementation had a significant influence on the number of fish and amount of energy available to osprey broods (Table 3). A total of 241 Atlantic menhaden was supplemented to the food addition group and contributed 32,384 g that represented an estimated 61,206 kcal. This increased the average total prey biomass and energy content within the food addition group to 226.5 g/d/nest and 396.2 kcal/d/nest. The average biomass that was delivered to the control group was 166.8 g/d/nest and the average energy content was 242.2 kcal/d/nest (Appendix 1). For the control group, adult osprey delivered an average of 1.2 fish/d/nest compared to 1.1 fish/d/nest for the supplemented group.
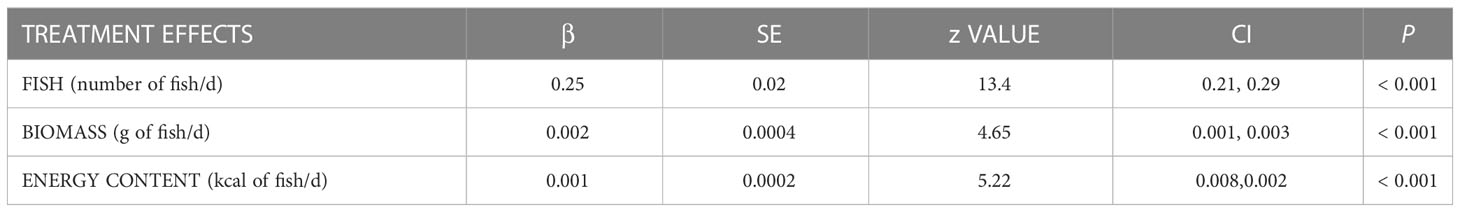
Table 3 Results of GLMMs with treatment effects on provisioning rates per d of nests under trail camera surveillance (N = 11) during the 2021 osprey breeding season in the lower Chesapeake Bay, VA, USA.
Food supplementation had a significant influence on the likelihood that pairs reached the threshold reproductive rate of 1.15 young/nest (Figure 3). The estimated average fish biomass and energetic content needed for a pair to produce the threshold reproductive rate was 202.7 g/d and 338.6 kcal/d respectively. Within the study area, pairs required supplementation of 63.4 g/d of menhaden or 121 kcal/d in order to reach the productivity threshold.
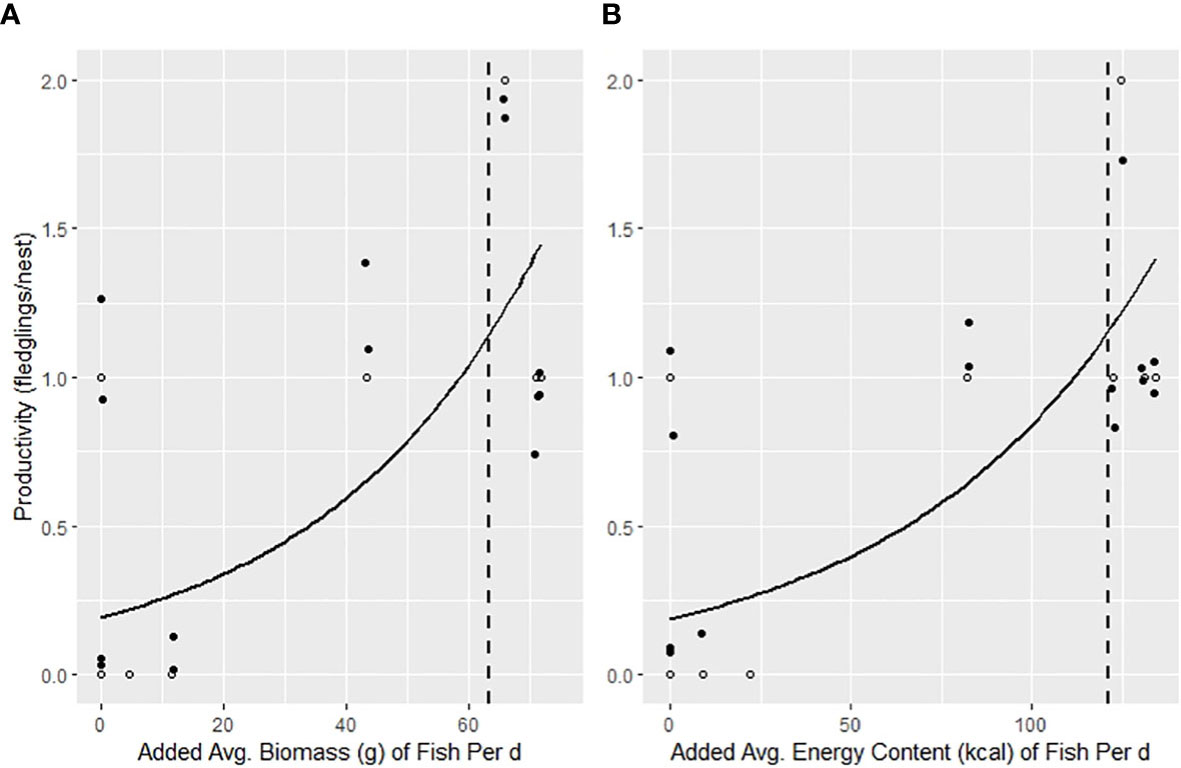
Figure 3 GLM’s of the influence of the added (A) avg. biomass/d/nest (β = 0.03, SE = 0.01, Pseudo R2 = 0.60, CI = 0.01, 0.05, P = 0.02) and (B) avg. energy content/d/nest (kcal) (β = 0.02, SE = 0.005, Pseudo R2 = 0.64, CI = 0.006, 0.03, P = 0.02) for osprey pairs under trail camera surveillance after seven weeks post hatch of the first egg in 2021 breeding season in the lower Chesapeake Bay, VA, USA. The data points represented by white circles have been “jittered” along with random points represented in black circles for improved visibility of model fit. The dotted lines indicate the supplemented average biomass (63.4 g) and energy content (121 kcal) thresholds needed per d to produce 1.15 young per nest-season.
Diet composition included a diverse list of fish species (Appendix 1). A total of 600 fish were documented as prey by ospreys in which 81% of taxa were identified to 21 species or to at least family. Atlantic menhaden (39%) dominated prey composition. Other known species included Atlantic herring (Clupea harengus) (10.3%), Atlantic croaker (Micropogonias undulatus) (5.8%), gizzard shad (Dorosoma cepedianum) (5.7%), and spot (Leiostomus xanthurus) (5%).
4 Discussion
Supplementation of osprey nests with menhaden had a significant influence on the ability of nesting pairs to reach reproductive rates required for population maintenance. Our study shows that productivity was food limited as previous studies have substantiated (Simons and Martin, 1990; Richner, 1992; Wiehn and Korpimaki, 1997; Ferrer et al., 2018). Osprey pairs that did not receive supplementation had reproductive rates (0.47 young/nest) that were less than half of threshold levels. Within Mobjack Bay, productivity rates have shifted from reproductive surplus to reproductive deficit since the 1980s. For example, populations at various locations along the main stem of Chesapeake Bay were considered strongholds (McLean, 1986; Byrd, 1988). During 1983 and 1984, the average reproductive rate was 1.39 young/pair (Byrd, 1987). By 1988 and 1990, average productivity had dropped to 0.91 young/pair (Byrd, 1988, Byrd, 1990) and by 2005 and 2006 productivity had dropped further to 0.75 young/pair (Glass, 2008). If fishing pressure on menhaden within Chesapeake Bay persists, osprey productivity rates could decline precipitously, threaten population stability, and eventually lead to widespread population collapse. Menhaden populations should be maintained at levels that will sustain a stable osprey population in which they are able to produce 1.15 young/active nest to offset mortality.
Our research suggests that food addition significantly influenced osprey provisioning rates and these rates impacted reproductive performance. Specifically, daily average biomass and energy content of the prey composition significantly influenced productivity. Lind (1976) used a model developed by Wiens and Innis (1974) and calculated that each adult osprey required 286 kcal/d and each nestling at 11-16 d old needed at least 113 – 170 kcal/d. Based on calculations in which fish with an energy content of 1 kcal/g, a nest with two young plus the female would require 794 g of fish/d in order to successfully fledge and a nest with three young would require 1048 g of fish/d (Winberg, 1960). Along the U.S. Eastern Coast, Poole (1982) determined that male ospreys delivered 816 – 1426 g/d to nests that had young and nests that produced three – four young. In our study, menhaden consisted of 39% of the total diet composition and these fish have a high energy content of 1.89 kcal/g (June and Nicholson, 1964). Based on the calculations of Winberg (1960), if a nest fledged two young that was supplied with 39% or 309.7 g/d or 585.3 kcal/d of menhaden, the estimated additional biomass and energy content required would be 648.2 g/d or 1,225.1 kcal/d. Similarly if a nest fledged three young and was supplied with 39% or 408.7 g/d or 772.4 kcal/d of menhaden, the estimated additional biomass and energy content required would be 855.5 g/d or 1,616.9 kcal/d. For the nests in our study, the added average biomass and energetic threshold needed for a nest to reach the reproductive break-even point are 63.4 g/d and 121 kcal/d which would be a total average of 208.1 g/d and 347.6 kcal/d (Figure 3).
When we directly compared the provisioning rates in this study to historical studies in Mobjack Bay and the higher salinity areas of Chesapeake Bay, declines in daily fish deliveries were made evident. In 1975 and 1985, the fish delivery rate was 0.53 fish/hr/nest and 0.35 fish/hr/nest (McLean and Byrd, 1991). In 2006 and 2007, ospreys in the higher salinity areas delivered an average of 0.26 fish/h/nest (Glass, 2008). Our study revealed that in 2021, the fish delivery rate diminished to a mean of 0.11 fish/hr/nest. The average daily biomass delivered per nest fell from 237.1g and 172.3g in 1975 and 2007 to 144.7g in 2021 (Appendix 1, McLean and Byrd, 1991; Glass, 2008).
Brood reduction has been an effective parameter linking reproductive performance to food limitation in osprey (Glass, 2008). In a 5-yr study, Reese (1977) determined nestling loss rates in the upper Chesapeake Bay ranged from 8-23%. Nestling mortality rates were 47% and 78% for the supplementation and control groups respectively in this study. Poole (1984) conducted a 4-yr study in New England and determined that 75% of nestling mortality was caused by starvation. Glass and Watts (2009) determined that brood reduction was highly significant between nests in the lower estuarine sites compared to the higher estuarine sites and these data suggested that ospreys in the higher salinity areas were experiencing more food limitation than the lower salinity areas. Brood reduction has generally been linked with the lack of food availability in other study areas (Poole, 1982; Jamieson et al., 1983; Eriksson, 1986; Hagan, 1986; Forbes, 1991; Glass and Watts, 2009). Although brood reduction was higher in the control group, differences were not found to be significant in our study. This discrepancy could have been attributed to treatment effects in which the timing and intensity of the protocol was not strong enough to detect a significant signal. Perhaps if we supplemented more fish in greater frequency, we would have observed significant differences in the average brood reduction between the experimental groups.
The most compelling explanation for lower provisioning and productivity rates is localized depletion of the primary prey base. Although proximate causes of lower productivity may include storms, inter- and intraspecies competition, predation, as well as age-related care by parents, the ultimate cause of lower productivity may often be food shortage (Steenhof and Newton, 2007). Atlantic menhaden has a higher lipid content compared to other species with a nearly a 2:1 energy content/biomass ratio (June and Nicholson, 1964). Ospreys depend on menhaden and their reproductive performance is inextricably linked to the availability and abundance of this fish. In fact, previous studies have substantiated that menhaden are a vital prey item for ospreys during the breeding season particularly in the mid-Atlantic and northeastern United States (Spitzer and Poole, 1980; Poole, 1989; McLean and Byrd, 1991, Steidl et al., 1991, Glass and Watts, 2009). In 1985, this fish species consisted of 75% of the prey composition of ospreys in the lower Chesapeake Bay (McLean and Byrd, 1991). Then in 2006 and 2007, menhaden declined to 32% of the prey composition (Glass, 2008). In our study menhaden comprised of 39% of the total prey composition (Appendix 1). Assuming that the prey composition of ospreys reflects prey availability on a local level (Greene et al., 1983; Edwards, 1988; Glass, 2008), the current percentage of menhaden could indicate that this species has diminished in availability compared to the later portion of the 20th century.
Potential localized depletion of menhaden populations is one of the major sources of concern and conflict within Chesapeake Bay. According to the ASMFC, the coastwide stock assessment has determined that menhaden is not overfished and that no overfishing is occurring (Southeast Data Assessment and Review [SEDAR], 2020). However, a coastwide assessment does not capture spatial variation in menhaden availability for locations with persistent depletion such as Chesapeake Bay. Seine surveys of juvenile menhaden in Maryland and Virginia indicate that low levels of abundance and recruitment have been happening since the early 1990’s and 2000’s (Atlantic States Marine Fisheries Commission [ASMFC], 2004, Southeast Data Assessment and Review [SEDAR], 2020). Our data suggests that the reliable metric that links osprey population decline and food limitation is the osprey productivity rate. During the population decline in northern Florida, Bowman et al. (1989) determined that the productivity rate was 0.56 young/nest and this was due to insufficient food availability. When the Florida Bay population was healthy and food was abundant (Henny and Ogden, 1970), the productivity rate was 1.22 young/nest which is similar to the rate acquired by the food addition group of our study at 1.13 young/nest.
5 Conclusion
EBFM evolves when ERPs are consistently monitored (Pikitch et al., 2004). According to Amendment 3 of the Interstate Fishery Management Plan (FMP) for Atlantic menhaden (Southeast Data Assessment and Review [SEDAR], 2020; Anstead et al., 2021), ERPs are described as “a method to assess the status of menhaden not only with regard to the sustainability of human harvest, but also with the regard to their interaction with predators and the status of other prey species.” The ERP working group is tasked with developing ERPs that are menhaden-specific that can account for the abundance of menhaden and their species role as a forage fish (Amendment 3 to the FMP, Anstead et al., 2021). Ospreys are non-finfish predators and can serve the ERP role which can allow management to practice informed decisions to develop harvest targets, assess menhaden’s role as prey for upper trophic levels, and advance an ecosystem approach to fisheries management (EAFM) which considers multiple components of the ecosystem than just the target species (Patrick and Link, 2015). The menhaden population within Mobjack Bay is not currently adequate to sustain the osprey breeding population and we recommend that industrial purse seine fishing occur outside Chesapeake Bay.
Data availability statement
The original contributions presented in the study are included in the article/Supplementary Material. Further inquiries can be directed to the corresponding author.
Ethics statement
The animal study was reviewed and approved by Institutional Animal Care and Use Committee (IACUC-2021-05-03-14981-bjpaxt).
Author contributions
MA and BW designed and conducted the research. MA and BW performed the experiment, statistical analysis, and wrote the paper. All authors contributed to the article and approved the submitted version.
Funding
Funding was provided by the Center for Conservation Biology, International Osprey Foundation, Virginia Society of Ornithology, Coastal Virginia Wildlife Observatory, Williamsburg Bird Club, and The College of William and Mary.
Acknowledgments
We thank Marie Pitts and Bart Paxton with the Center for Conservation Biology. They provided logistical support and technical assistance that made this project possible. Special thanks to Melissa Collins, Matthias Leu, Sarah Glosson, John Swaddle, and Mary Fabrizio.
Conflict of interest
The authors declare that the research was conducted in the absence of any commercial or financial relationships that could be construed as a potential conflict of interest.
Publisher’s note
All claims expressed in this article are solely those of the authors and do not necessarily represent those of their affiliated organizations, or those of the publisher, the editors and the reviewers. Any product that may be evaluated in this article, or claim that may be made by its manufacturer, is not guaranteed or endorsed by the publisher.
Supplementary material
The Supplementary Material for this article can be found online at: https://www.frontiersin.org/articles/10.3389/fmars.2023.1172787/full#supplementary-material
References
Ahrenholz D. W. (1991). Population biology and life history of the north. Mar. Fisheries Rev. 53, 3.
Annis E., Friedland K., Uphoff J. (2009). Ecosystem-based fisheries management for Chesapeake bay: menhaden background and issue briefs. Maryland Sea Grant UMSGTS-2009-08, M/2–M/9.
Anstead K. A., Drew K., Chagaris D., Schueller A. M., McNamee J. E., Buchheister A., et al. (2021). The path to an ecosystem approach for forage fish management: a case study of Atlantic menhaden. Front. Mar. Sci. 8, 491. doi: 10.3389/fmars.2021.607657
Ashmole P. (1971). “Sea Bird ecology and the marine environment,” in Avian biology, vol. 1 . Eds. Farner D. S., King J. R. (New York: Academic Press).
Atlantic States Marine Fisheries Commission [ASMFC] (2017). Atlantic Menhaden stock assessment update (Arlington, VA: ASMFC). Available at: http://www.asmfc.org/files/commissionerManual/ISFMP/MenhadenAssessmentOverview_Aug2017.pdf.
Atlantic States Marine Fisheries Commission [ASMFC] (2004). “Atlantic menhaden stock assessment report for peer review,” in Atlantic states marine fisheries commission, stock assessment report no. 04-01 (Supplement) (Arlington, VA: Atlantic States Marine Fisheries Commission), 145.
Bierregaard R. O., Poole A. F., Washburn B. E. (2014). Ospreys (Pandion haliaetus) in the 21st century: populations, migration, management, and research priorities. J. Raptor Res. 48 (4), 301–308.
Bowman R., Powell G. V. N., Hovis J. A., Kline N. C., Wimers T. (1989). Variations in reproductive success between subpopulations of the osprey (Pandion haliaetus) in south Florida. Bull. Mar. Sci. 44 (1), 245–250.
Brooks M. E., Kristensen K., Van Benthem K. J., Magnusson A., Berg C. W., Nielsen A., et al. (2017). glmmTMB balances speed and flexibility among packages for zero-inflated generalized linear mixed modeling. R J. 9 (2), 378–400. doi: 10.32614/RJ-2017-066
Buchheister A., Miller T. J., Houde E. D. (2017). Evaluating ecosystem-based reference points for atlantic menhaden. Mar. Coast. Fisheries 9 (1), 457–478.
Butler C. M., Rudershausen P. J., Buckel J. A. (2010). Feeding ecology of Atlantic bluefin tuna (Thunnus thynnus) in north Carolina: diet, daily ration, and consumption of Atlantic menhaden (Brevoortia tyrannus). Fishery Bull. 108 (1), 56–59.
Byrd M. A. (1987). “Osprey population studies,” in Virginia Nongame and endangered wildlife investigations (Richmond, Virginia: Virginia Commission of Game and Inland Fisheries).
Byrd M. A. (1988). “Osprey population studies,” in Virginia Nongame and endangered wildlife investigations (Richmond, Virginia: Virginia Commission of Game and Inland Fisheries).
Byrd M. A. (1990). “Osprey population studies,” in Virginia Nongame and endangered wildlife investigations (Richmond, Virginia: Virginia Commission of Game and Inland Fisheries).
Cairns D. K. (1988). Seabirds as indicators of marine food supplies. Biol. Conserv. 5, 261–271. doi: 10.1080/01965581.1987.10749517
Cramp S., Simmons K. E. L. (Eds.) (1979). The birds of the western palearctic Vol. 11 (Oxford: Oxford University Press).
Cury P., Shannon L. J., Roux J. P., Daskalov G. M., Jarre A., Moloney C. L., et al. (2005). Trophodynamic indicators for an ecosystem approach to fisheries. ICES J. Mar. Sci. 62, 430–442. doi: 10.1016/j.icesjms.2004.12.006
Diamond A. W., Devlin C. M. (2003). Seabirds as indicators of changes in marine ecosystems: ecological monitoring on machias seal island. Environ. Monit. Assess. 8, 153–175. doi: 10.1023/A:1025560805788
Drew K., Cieri M., Schueller A. M., Buchheister A., Chagaris D., Nesslage G., et al. (2021). Balancing model complexity, data requirements, and management objectives in developing ecological reference points for Atlantic menhaden. Front. Mar. Sci. 53. doi: 10.3389/fmars.2021.608059
Dryfoos R. L., Cheek R. P., Kroger R. L. (1973). Preliminary analysis of Atlantic menhaden, brevoortia tyrannus, migrations, population structure, survival and exploitation rates, and availability as indicated from tag returns. Fish. Bull. 71, 719–734.
Edwards T. C. (1988). Temporal variation in prey preference patterns of adult ospreys. Auk 105, 244–251. doi: 10.2307/4087485
Einoder L. D. (2009). A review of the use of seabirds as indicators in fisheries and ecosystem management. Fisheries Res. 95, 6–13. doi: 10.1016/j.fishres.2008.09.024
Eriksson M. O. G. (1986). Fish delivery, production of young, and nest density of osprey (Pandion haliaetus) in southwest Sweden. Can. J. Zoology 64, 1961–1965. doi: 10.1139/z86-295
FAO (2020). “The state of world fisheries and aquaculture 2020,” in Brief. sustainability in action(Rome: THE STATE OF THE WORLD series of the Food and Agriculture Organization of the United Nations). doi: 10.4060/ca9231en
Ferrer M., Morandini V., Baguena G., Newton I. (2018). Reintroducing endangered raptors: a case study of supplementary feeding and removal of nestlings from wild populations. J. Appl. Ecol. 55, 1360–1367. doi: 10.1111/1365-2664.13014
Forbes L. S. (1991). Hunger and food allocation among nestlings of facultatively siblicidal ospreys. Behav. Ecol. Sociobiology 29 (3), 189–195. doi: 10.1007/BF00166400
Furness R. W. (1982). Competition between fisheries and seabird communities. Adv. Mar. Biol. 20, 225–309. doi: 10.1016/S0065-2881(08)60141-8
Furness R. W., Ainley D. G. (1984). Threat to seabird populations presented by commercial fisheries (Cambridge, UK: ICBP).
Gannon D. P., Waples D. M. (2004). Diets of coastal bottlenose dolphins from the US mid Atlantic coast differ by habitat. Mar. Mammal Sci. 20 (3), 527–545. doi: 10.1111/j.1748-7692.2004.tb01177.x
Glass K. A. (2008). “Broad spatial trends in osprey provisioning, reproductive success, and population growth within lower Chesapeake bay,” in Dissertations, theses, and masters projects (Virginia, USA: William & Mary. Paper), 1539626869. doi: 10.21220/s2-1n55-ph30
Glass K. A., Watts B. D. (2009). Osprey diet composition and quality in high and low salinity areas of lower Chesapeake bay. J. Raptor Res. 43, 27–36. doi: 10.3356/JRR-08-22.1
Greene E. P., Greene A. E., Freedman B. (1983). Foraging behavior and prey selection by ospreys in coastal habitats in Nova Scotia, Canada in biology and management of bald eagles and ospreys. Ed. Bird D. M. (Ste. Anne de Bellevue, Quebec: Harpell Press), Pp. 257–267.
Grove R. A., Henny C. J., Kaiser J. L. (2009). Osprey: worldwide sentinel species for assessing and monitoring environmental contamination in rivers, lakes, reservoirs, and estuaries. J. Toxicol. Environ. Health Part B 12, 1,15–1,44. doi: 10.1080/10937400802545078
Hagan J. M. (1986). Temporal patterns in pre-fledging survival and brood reduction in an osprey colony. Condor 88, 200–205. doi: 10.2307/1368916
Hartig F. (2021). “DHARMa: residual diagnostics for hierarchical (Multi-level / mixed) regression models,” in R package version 0.4.4. Available at: https://CRAN.Rproject.org/package=DHARMa.
Henny C. J. (1983). “Distribution and abundance of nesting ospreys in the united states,” in Biology and management of bald eagles and ospreys (Quebec, Canada: Harpell Press).
Henny C. J., Grove R. A., Kaiser J. L. (2008). Osprey distribution, reproductive success and contaminant burdens (OC pesticides, PCBs, PCDDs, PCDFs and mercury) along lower Columbia river 1997/1998 vs 2004. Arch. Environ. Contam. Toxicol. 54, 525–534. doi: 10.1007/s00244-007-9041-1
Henny C. J., Ogden J. C. (1970). Estimated status of osprey populations in the united states. J. Wildlife Manage. 1, 214–217. doi: 10.2307/3799513
Henny C. J., Smith M. M., Stotts V. D. (1974). The 1973 distribution and abundance of breeding ospreys in the Chesapeake bay. Chesapeake Sci. 15 (3), 125–133. doi: 10.2307/1351027
Henny C. J., Wight H. M. (1969). An endangered osprey population: estimates of mortality and production. Auk 86 (2), p.188–p.198. doi: 10.2307/4083495
Jamieson I. G., Seymour N. R., Bancroft R. P., Sullivan R. (1983). Sibling aggression in nestling ospreys in Nova Scotia. Can. J. Zoology 61, 466–469. doi: 10.1139/z83-063
Johnson B. L., Kaiser J. L., Henny C. J., Grove R. A. (2008). Prey of nesting ospreys on the Willamette and Columbia rivers, Oregon and Washington. Northwest Sci. 82 (3), 229–236. doi: 10.3955/0029-344X-82.3.229
June F. C., Nicholson W. R. (1964). Age and size composition of the menhaden catch along the Atlantic coast of the united states 1958: with a brief review of the commercial fishery. Special Scientific Report-Fisheries 446, 1–26.
Kabuta S. H., Laane R. W. P. M. (2003). Ecological performance indicators in the north Sea: development and application. Ocean Coast. Manage. 46, 277–297. doi: 10.1016/S0964-5691(03)00009-7
Kennedy R. S. (1971). Population dynamics of ospreys in tidewater, Virginia 1970 1971. M.A (Williamsburg, VA: College of William and Mary), pp.83.
Kinkead T. P. (1985). Age structure and dispersal of Chesapeake bay ospreys. Dissertations, Theses, and Masters Projects (William & Mary: Virginia, USA). Paper 1539625299. doi: 10.21220/s2-byss-qr76
Liljestrand E. M., Wilberg M. J., Schueller A. M. (2019). Estimation of movement and mortality of Atlantic menhaden during 1966–1969 using a Bayesian multi-state mark recovery model. Fisheries Res. 210, 204–213. doi: 10.1016/j.fishres.2018.10.015
Lind G. S. (1976). Production, nest site selection, and food habits of ospreys on deschutes national forest, oregon. M.S (Corvallis, OR, USA: Oregon State University).
Link J. (2010). Ecosystem-based fisheries management: confronting tradeoffs (Cambridge, UK: Cambridge University Press).
McLean P. K. (1986). The feeding ecology of the Chesapeake bay ospreys and the growth and behavior of their young (Williamsburg, VA USA: The College of William and Mary).
McLean P. K., Byrd M. A. (1991). Feeding ecology of Chesapeake bay ospreys and growth and behavior of their young. Wilson Bull. 103, 105–111.
McLeod K. L., Leslie H. M. (2009). “Why ecosystem-based management” in Ecosystem-based management for the oceans. (Washington DC, USA: Island Press), pp. 3–12.
Monaghan P., Walton P., Wanless S., Uttley J. D., Bljrns. M. D. (1994). Effects of prey abundance on the foraging behaviour, diving efficiency and time allocation of breeding guillemots uria aalge. Ibis 136 (2), 214–222.
Montevecchi W. A. (1993). “Birds as indicators of change in marine prey stocks,” in Birds as monitors of environmental change. Eds. Furness R. W., Greenwood J. J. D. (London: Chapman and Hall), 217–265.
Nicholson W. R. (1978). Movements and population structure of Atlantic menhaden indicated by tag returns. Estuaries 1 (3), 141–150. doi: 10.2307/1351455
NMFS (National Marine Fisheries Service) (2016). “Ecosystem-based fisheries management policy of the national marine fisheries service national oceanic and atmospheric administration,” in NMFS policy directive 01-120 (USA). Available at: www.nmfs.noaa.gov/op/pds/index.html.
Ogden J. C., Baldwin J. D., Bass O. L., Browder J. A., Cook M. I., Frederick P. C., et al. (2014). Waterbirds as indicators of ecosystem health in the coastal marine habitats of southern Florida: 1. selection and justification for a suite of indicator species. Ecol. Indic. 44, 148–163. doi: 10.1016/j.ecolind.2014.03.007
Patrick W. S., Link J. S. (2015). Myths that continue to impede progress in ecosystem based fisheries management. Fisheries 40 (4), 155–160. doi: 10.1080/03632415.2015.1024308
Pauly D., Alder J., Booth S., Cheung W. W. L., Christensen V., Close C., et al. (2008). Fisheries in large marine ecosystems: descriptions and diagnoses. the UNEP large marine ecosystem report: a perspective on changing conditions in LMEs of the world’s regional seas. UNEP Regional Seas Rep. Stud. 182), 23–40.
Pauly D., Zeller D. (2016). Comments on FAOs state of world fisheries and aquacultur (SOFIA 2016) marine policy. Marine Policy 77, 2017, 176–181. doi: 10.1016/j.marpol.2017.01.006
Piatt J. F., Harding A. M., Shultz M., Speckman S. G., Van Pelt T. I., Drew G. S., et al. (2007). Seabirds as indicators of marine food supplies: cairns revisited. Mar. Ecol. Prog. Ser. 352, 221–234. doi: 10.3354/meps07078
Pikitch E. K., Santora C., Babcock E. A., Bakun A., Bonfil R., Conover D. O., et al. (2004). Ecosystem based fishery management. Science 305 (5682), 346–347. doi: 10.1126/science.1098222
Poole A. F. (1982). Brood reduction in temperate and sub-tropical ospreys. Oecologia 53 (1), 111–119. doi: 10.1007/BF00377144
Poole A. F. (1984). Reproductive limitations in coastal ospreys: an ecological and evolutionary perspective (Boston, MA: Unpubl. Ph.D. diss. Boston University).
Poole A. F. (1989). Ospreys: a natural and unnatural history (Vol. 246) (Cambridge, UK: Cambridge University Press).
Poole A. F., Bierregaard R. O., Martell M. S. (2002). Osprey. birds of north America, no 683, ser. Eds. Poole A. F., Gill F. (Philadelphia, PA: Birds of North America, Inc).
Prevost Y. A. (1983). “Osprey distribution and subspecies taxonomy,” in Biology and management of bald eagles and ospreys. Ed. Bird D. M. (Montreal: Raptor Research Foundation), 157–174.
Pulliam H. R. (1988). Sources, sinks, and population regulation. Am. Nat. 132 (5), 652–661. doi: 10.1086/284880
R Core Team (2020). R: a language and environment for statistical computing (Vienna, Austria: R Foundation for Statistical Computing). Available at: https://www.R-project.org/.
Reese J. G. (1977). Reproductive success of ospreys in central Chesapeake bay. Auk 94 (2), 202–221. doi: 10.1093/auk/94.2.202
Richner H. (1992). The effect of extra food on fitness in breeding carrion crows. Ecology 73, 330–335. doi: 10.2307/1938744
Scott B. E., Sharples J., Wanless S., Ross O. N., Frederiksen M., Daunt F. (2006). “The use of biologically meaningful oceanographic indicies to separate the effects of climate and fisheries on seabird breeding success,” in Top predators in marine ecosystems. Eds. Boyd I. L., Wanless S., Camphuysen C. J. (Cambridge: Cambridge University Press), 45–62.
Simons L. S., Martin T. E. (1990). Food limitation of avian reproduction an experiment with the cactus wren. Ecology 71, 869–876. doi: 10.2307/1937358
Smith C. R., Glover A. G., Treude T., Higgs N. D., Amon D. J. (2015). Whale-fall ecosystems: recent insights into ecology, paleoecology, and evolution. Annu. Rev. Mar. Sci. 7, 571–596. doi: 10.1146/annurev-marine-010213-135144
Southeast Data Assessment and Review [SEDAR] (2020). SEDAR 69 – Atlantic menhaden benchmark stock assessment report (North Charleston SC: SEDAR).
Spitzer P. R. (1980). Dynamics of a discrete coastal breeding population of ospreys (Pandion haliaetus) in the northeastern united states during a period of decline and recovery 1969-1978 (New York: Cornell Univ.).
Spitzer P. R., Poole A. F. (1980). Coastal ospreys between new York city and Boston: a decade of reproductive recovery 1969-1979. Am. Birds. 34, 233–242.
Steenhof K., Newton I. (2007). Assessing raptor nest success and productivity, in raptor research and management techniques. Eds. Bird D. M., Bildstein K. L. (Canada: Hancock House, Surrey, BC), 193–220.
Steidl R. J., Griffin C. R., Niles L. J. (1991). Contaminant levels of osprey eggs and prey reflect regional differences in reproductive success. J. Wildlife Manage. 601–608.
Stinson C. H. (1976). The evolutionary and ecological significance of the clutch size of the osprey (Virginia: College of William and Mary. Williamsburg).
Venables W. N., Ripley B. D. (2002). “Random and mixed effects,” in Modern applied statistics with s (New York, NY: Springer), 271–300.
Via J. W. (1975). Eggshell thinning and pesticide residues in ospreys from the lower Chesapeake bay (Virginia: College of William and Mary. Williamsburg).
Watts B. D., Byrd M. A., Watts M. U. (2004). Status and distribution of breeding ospreys in breeding ospreys in Chesapeake bay: 1995-1996. J. Raptor Res. 38, 47–54.
Watts B. D., Paxton B. J. (2007). Ospreys of the Chesapeake Bay: population recovery ecological requirements, and current threats. Waterbirds, 39–49. doi: 10.1675/1524-4695(2007)030[0039:OOTCBP]2.0.CO;2
Wiehn J., Korpimaki E. (1997). Food limitation on brood size: experimental evidence in the Eurasian kestrel. Ecology 78, 2043–2050. doi: 10.1890/0012-9658(1997)078[2043:FLOBSE]2.0.CO;2
Wiemeyer S. N. (1971). Reproductive success of potomac river ospreys–1970. Chesapeake Sci. 12 (4), 278–280. doi: 10.2307/1350918
Wiemeyer S. N., Spitzer P. R., Krantz W. C., Lamont T. G., Cromartie E. (1975). Effects of environmental pollutants on Connecticut and Maryland ospreys. J. Wildlife Manage. 1, 124–139. doi: 10.2307/3800475
Wiens J. A., Innis G. S. (1974). Estimation of energy flow in bird communities: a population bioenergetics model. Ecology 55, 730–746. doi: 10.2307/1934410
Keywords: osprey, Pandion haliaetus, menhaden, Brevoortia tyrannus, localized depletion, ecological reference points, food supplementation
Citation: Academia MH and Watts BD (2023) Food supplementation increases reproductive performance of ospreys in the lower Chesapeake Bay. Front. Mar. Sci. 10:1172787. doi: 10.3389/fmars.2023.1172787
Received: 23 February 2023; Accepted: 11 April 2023;
Published: 20 April 2023.
Edited by:
Salvatore Siciliano, Fundação Oswaldo Cruz (Fiocruz), BrazilReviewed by:
Carlos Matias, Federal Rural University of Rio de Janeiro, BrazilMiguel Ferrer, Spanish National Research Council (CSIC), Spain
Flavio Monti, University of Siena, Italy
Copyright © 2023 Academia and Watts. This is an open-access article distributed under the terms of the Creative Commons Attribution License (CC BY). The use, distribution or reproduction in other forums is permitted, provided the original author(s) and the copyright owner(s) are credited and that the original publication in this journal is cited, in accordance with accepted academic practice. No use, distribution or reproduction is permitted which does not comply with these terms.
*Correspondence: Michael H. Academia, bWFjYWRlbWlhQHdtLmVkdQ==