 Orestis Stavrakidis-Zachou
 Nikos Papandroulakis
 Konstadia Lika2
- 1Institute of Marine Biology, Biotechnology and Aquaculture, Hellenic Centre for Marine Research, Heraklion, Crete, Greece
- 2Department of Biology, University of Crete, Heraklion, Crete, Greece
Pinpointing thermal tolerance thresholds for commercially important species, such as aquaculture finfish, under acute and chronic thermal stress is becoming increasingly relevant in the context of climate change. While experimental research, traditionally quantified by the determination of the Critical Thermal Maximum (), offers valuable insights, it is necessary to further develop appropriate tools to provide predictions and shed light on the underlying mechanisms of thermal tolerance. Bioenergetic models have long been used to study the effects of temperature on fish metabolism under chronic, but rarely under acute, scales. In this study, we present a modelling approach based on the Dynamic Energy Budget (DEB) theory that describes the tolerance limits of fish under acute thermal stress in bioenergetics terms. It adopts the notion of an energy-dependent tolerance to stress and defines acute tolerance limits at the intersection of fundamental energy fluxes, namely those relating to the mobilization of energy and to maintenance costs. To showcase this approach, DEB models for two finfish, the European sea bass (Dicentrarchus labrax) and the meagre (Argyrosomus regius) were used to run acute thermal challenge simulations and study shifts in the critical temperature achieved by the fish. The results suggest that the model can adequately capture the general tolerance patterns observed experimentally for the two species as well as pinpoint the parameters that may influence them. In particular, the simulations showed a positive relation between acclimation temperature and tolerance while the opposite stands for the body size of the fish, with smaller fish achieving higher critical temperatures than their larger counterparts. Also, tolerance limits were affected by the state of internal reserves, with well-fed fish exhibiting higher values. Finally, the potential application of this modelling approach on higher taxonomic scales was evaluated, by running simulations on species belonging to major fish orders. The preliminary results suggest that the method can capture differences among groups that are consistent with literature, suggesting it may be a realistic mechanistic approach for studying thermal tolerance in ectotherms.
1 Introduction
Climate change is increasingly recognized, under the framework of the United Nations, as one of the most important challenges for humanity in the 21st century, especially in relation to the marine environment. According to the latest carbon emission scenarios (Shared Socioeconomic Pathways, SSPs) adopted by the Intergovernmental Panel on Climate Change (IPCC) in its sixth assessment report (AR6), an increase in mean sea temperature of between 2°C and 3.7°C is projected by 2100 compared to the 1990-2014 reference period (van Vuuren et al., 2011; Stocker et al., 2014; Sarà et al., 2018; Lotze et al., 2019; Tebaldi et al., 2021). In fact, reports indicate that carbon emissions have already exceeded the threshold set for the mildest of those scenarios, making the more pessimistic ones increasingly relevant (Teske, 2019). Additionally, the increase in both the frequency and intensity of heat wave events in the future, may be as important as the increase in average temperature. Although these events have not been extensively studied, they can have dramatic impacts on ecosystems with numerous studies reporting changes in physiology and mass mortality in organisms such as fish, invertebrates, and mammals (Garrabou et al., 2019; Smale et al., 2019; Smith et al., 2021). Admittedly, describing these extremes and defining the temperature thresholds that characterize them is challenging, and although many approaches have been tried (Hobday et al., 2016), predictions about their future evolution under climate change remain an area of scientific uncertainty. However, historical evidence suggests that over the past century, marine heat waves have increased not only in frequency (by 34%) but also in duration (by 17%) (Oliver et al., 2018). This implies an overall increase of 54% in the number of days classified as heatwave days globally and the trend is expected to continue in the future. In particular, it is predicted that by the end of the century, and depending on the climate scenario under consideration, heatwave days at sea will increase by a factor of 16 - 23, causing temperature anomalies exceeding 2.5°C in intensity and lasting over 100 days (Frölicher et al., 2018).
In this context, global warming may have extended ramifications on important sectors of human activity such as aquaculture (Rosa et al., 2012; Reid et al., 2019), which is the fastest growing agricultural sector(Kobayashi et al., 2015). Compared to fisheries, whose production has remained relatively stable over the last 30 years, aquaculture has experienced rapid growth rates, with its contribution to total fish consumption now exceeding 50% (FAO, 2020). It is also noteworthy that of the total global annual aquaculture production of 82 million tonnes, two-thirds involves fish production in either terrestrial or marine facilities, making fish farming the most important aquaculture sector (FAO, 2020). In recent years, the concept of ‘Precision Farming’ has been increasingly adopted, i.e. the use of methods and tools to increase production, improve the accuracy of farming methods, integrate automation and ensure fish welfare (Føre et al., 2017; Antonucci and Costa, 2020; Macaulay et al., 2021). In this context, the development of models that reliably describe fish metabolism is an integral part. Indeed, given the inevitable consequences of climate change, the need to incorporate temperature effects such as exposure to heatwaves on metabolism into these models is becoming increasingly urgent. Moreover, many authors have put forward the notion that fish models studying effects of environmental phenomena such as climate change should be mechanistic and incorporate established physiological mechanisms (Koenigstein et al., 2016; Lefevre et al., 2017; Sarà et al., 2018). However, while a plethora of models simulating growth, food requirements, and nutritional needs under different thermal environments have been used in fish research (Dumas et al., 2010; Brigolin et al., 2014; Zhou et al., 2018; Chahid et al., 2022), models dedicated to addressing thermal tolerance and thresholds are generally missing from literature. While some mechanistical models exist, such those presented in Martin et al. (2017), which introduce biophysical mechanisms to model the oxygen supply and demand on fish eggs, the majority of existing fish models are empirical or semi-empirical models that lack a strong mechanistic background.
The basis for developing realistic and robust such models is understanding the mechanisms that govern the metabolism of fish in relation to temperature. Because fish are ectotherms, temperature plays a crucial role in their cellular processes and therefore, has a significant impact on all levels of biological organization including physiology and their overall performance (Crozier and Hutchings, 2014; Islam et al., 2020). For each species, there are specific temperatures within which it performs optimally. As we move away from this range, performance tends to decrease and eventually diminishes when critical temperature thresholds are exceeded. These critical temperatures define the tolerance range of a species, i.e. the temperature range over which it can survive and perform metabolically (Pörtner et al., 2017). Indeed, thermal thresholds not only differ between species, but also appear to be influenced by factors such as the size and developmental stage of the organism, the presence of stressors, and previous thermal history (Di Santo and Lobel, 2017; Sunday et al., 2019; Zhou et al., 2019). However, regardless of the factors influencing thermal limits, specific behaviours at the extremes of physiological limits, such as the onset of muscle spasms and inability to move, are universal in nature and thus allow them to be defined for different species and under a variety of conditions. Typically, thermal tolerance has been studied dynamically via the determination of the Critical thermal maximum and minimum (, ). is defined as “the thermal point at which motor activity becomes disorganized and the animal loses its ability to escape from conditions that will rapidly lead to its death” (Cowles et al., 1944). In recent decades, protocols have been developed to standardise the method, particularly with regards to the rate of heating, in order to achieve sufficient equilibration of the water temperature with that of the fish without allowing the fish to acclimatise to the new conditions. Usually this rate ranges between 0.3 - 1.5°C per minute (Di Santo and Lobel, 2017; Kır et al., 2017; Azra et al., 2020). During an acute thermal stress challenge, fish experience a sequence of symptoms including loss of dorso-ventral orientation (Loss of Equilibrium, LoE), sudden onset of muscle spasms, and eventually muscle rigidity, coma and death. Depending on the choice of any of the above symptoms as the endpoint of the test, the determination of and shows differences, although the LoE is usually the endpoint chosen. Moreover, the time required to reach the endpoint is known as resistance time. Because this method offers accuracy and repeatability across taxa, it has advantages in terms of welfare and non-killing of experimental animals, and is faster than the other methods, it is the most established and reliable method for determining thermal tolerance thresholds in fish (Lutterschmidt and Hutchison, 1997; Moyano et al., 2017; Yanar et al., 2019).
The Dynamic Energy Budget (DEB) theory constitutes a mechanistic framework that describes the energy balance of an organism under dynamically changing conditions (Kooijman, 2010) and has widespread applications across many taxonomic groups (Lavaud et al., 2020; Gergs and Baden, 2021; Dong et al., 2022). The central idea of DEB theory is the principle of conservation of energy and mass, and its goal is to formulate a coherent background that allows the quantification of the bioenergetic requirements of an organism throughout its life cycle. Based on simple physiological mechanisms describing energy uptake and use, the theory allows the construction of individual models (DEB models) that can quantify important organismal processes such as feeding, energy assimilation, growth, maintenance and reproduction. In fact, the ability of this framework to describe changes in the metabolism of organisms as a function of dynamic changes in their environment, such as temperature and available food, has established the DEB theory as a widely accepted and reliable approach for studying fish metabolism (Pecquerie et al., 2009; Serpa et al., 2013; Føre et al., 2017) as well as for studying climate change impacts (Sarà et al., 2018; Stavrakidis-Zachou et al., 2021a).
Taking the above into account, it is evident that enhancing our understanding on the thermal tolerance of key commercial species as well as developing tools such as mechanistic models with predictive power is crucial for adapting to climate change. While experimental work studying the thermal tolerance of various fish species has been instrumental in defining critical temperature thresholds such as the , modelling approaches to quantify those limits are generally lacking or are missing a strong mechanistic background. The aim of the present work is to offer a mechanistic approach of quantifying tolerance thresholds during acute warming by using the modelling framework of the DEB theory. As will be described in the following sections, the approach adopts the notion of an energy-dependent tolerance to stress in order to define critical thermal tolerance thresholds, akin to those traditionally determined in experimental research. For the purposes of demonstrating this approach, we will use the specific examples of DEB models developed for two key aquaculture finfish, the European sea bass (Dicentrarchus labrax) and the meagre (Argyrosomus regius). Investigations will also be performed at higher taxonomic levels aiming to contribute towards a mechanistic understanding of thermal tolerance using strictly bioenergetic terms with wider application.
2 Methods
2.1 Model development
2.1.1 The dynamic Energy Budget model
A fundamental concept of DEB theory is that the biomass of an organism consists of structure, expressed either as structural volume (the volume occupied by the structural mass, structural body volume, ) or as structural length (1/3) and reserves (). In addition, in the case of adult individuals, it also receives contributions from a reproductive reserve () associated with gamete production and the reproductive process. Each of these biomass components consists of a mixture of organic compounds that form generalised compounds of stable composition. Structure (), reserves (), reproductive reserve () and maturity (), which is defined as the cumulative energy invested in the development of the organism, are the state variables defined by DEB theory. Based on a set of physiological rules for the uptake of food by organisms and its use for functions that ensure their survival, the theory allows the processes of feeding, digestion, maintenance, growth, and reproduction to be modelled through fluxes of energy (denoted by ‘ ‘) or mass with which the various substrates are used by the organism. Feeding relates to the size of the organism and the availability of food in the environment. In the DEB framework, a functional response relationship is assumed to exist between food intake and food availability. In particular, the functional response , represents a measure of food intake of an individual as a fraction of the maximum food intake for its size and therefore takes values between 0 and 1. The food consumed is then digested and its energy becomes available to the organism which stores it in its reserves through the process of assimilation (). The subsequent mobilization of this energy (mobilization, ) allows for (a) growth () which is the increase in structural mass, (b) somatic maintenance () and maturity maintenance (), that is, the collection of energy demanding processes required to sustain life excluding all production processes, and (c) maturation or reproduction (), which corresponds to further energy investment for genetic maturation and gamete production. In addition, a fraction of this energy is dissipated into the environment in the form of heat (). A fixed fraction of the mobilised reserve is allocated to somatic functions, which include somatic maintenance and growth, with maintenance having priority, while the remaining is used for maturation or reproduction, after subtracting the energy costs associated with maturation maintenance. The variables of the DEB model and the relationships between them are summarised in Table 1 while a list and a description of the parameters are given in the Supplementary Material. For further details on DEB theory we refer to Kooijman (2010).
Table 1 The state variables, fluxes and dynamics of the DEB model.
2.1.2 Quantifying temperature effects
Biological reactions are catalysed by enzymes and are therefore temperature dependent. In DEB theory the effect of temperature is quantified by the Arrhenius equation which uses the species-specific parameter (Arrhenius temperature). According to this, and for a species-specific temperature range, the rate of a physiological process at temperature is given as: , where is the rate at a chosen reference temperature (here = 293Κ). Based on this, a temperature correction factor (Equation 1) can be defined which expresses the change of a biological rate at temperature compared to that on a reference temperature .
As the temperature approaches the tolerance limits, biological rates progressively decrease and eventually reach zero with the death of the organism. Based on the assumption that the quaternary structure of enzymes that catalyze cellular reactions can switch to an inactive form under very high or low temperatures, Sharpe and DeMichele (1977), formulated an extended form of the Arrhenius equation to describe the decrease in metabolic rates at the extremes of the tolerance range. According to this, the various physiological rates decrease on either side of the thermal tolerance range because these enzymes are gradually deactivated under extreme temperature conditions in a process that is reversible once the organism is removed from these temperatures. The temperatures beyond which this occurs are denoted by and for the lower and upper limits of the thermal tolerance range, respectively. Thus, the decrease in rates at low and high temperatures is quantified by multiplying the biological rate by the fraction of the enzyme that remains in the active state at temperature.
Specifically, for temperature correction at low temperatures the fraction with which the correction factor is multiplied is with
while at high temperatures it is with
where and are the species-specific Arrhenius temperatures for the rate of decrease in and , respectively (Sharpe and DeMichele, 1977). Consequently, for correction over the entire thermal tolerance range, the fraction becomes with given by Equation 4, with the terms and applying for and respectively.
2.1.3 Modeling acute thermal stress
This section presents an approach of describing the maximum thermal limits of fish in bioenergetic terms. Central to this approach is the concept of energy-limiting stress tolerance. This is an established bioenergetic concept regarding chronic stress and the effects of energy balance on the fitness of organisms, which in turn reflects the suitability of the adaptations they have evolved for the particular environment in which they live (Sokolova et al., 2012; McCue et al., 2017; Haider et al., 2020). Here, this reasoning is extended to acute stress conditions to describe upper limits of thermal tolerance. Specifically, the argument put forward and justified extensively below in light of relevant literature is that the upper temperature tolerance during acute thermal stress is located at the intersection of the energy requirements for maintenance and the energy supply capacity of the organism (available energy).
With respect to the energy supply, it is critical to review the cellular changes that occur during acclimation. The ability of enzymes to catalyse metabolic reactions depends on their geometry and in particular on the structure of the enzyme active site where they come into contact with the substrates of the reaction. Oftentimes, organisms carry several versions of an enzyme (isoenzymes) that catalyse the same reaction, but differ in their three-dimensional configuration (tertiary structure) and exhibit different thermosensitivity (Alster et al., 2016). During thermal acclimation, organisms can adapt their enzyme capacity by changing the geometry of their enzymes, i.e. by upregulating those isoenzymes that have better thermal sensitivity to the acclimation temperature (Somero, 2004; Jones et al., 2020; Maffucci et al., 2020). However, this process requires a significant amount of time ranging from days to weeks. In the case of a thermal stress of short duration, in the order of minutes, the organism does not have time to adapt its enzymatic mechanisms, and therefore its ability to perform metabolic work is limited by the state it was in at the onset of the thermal challenge. Taking this into account, it is assumed here that during the short duration of the acute thermal stress challenge, the ability to mobilise energy from reserves remains constant and depends entirely on the acclimation temperature. In other words, the energy reserve mobilization flux during this challenge amounts to (Equation 5):
where is the reserve mobilization flux at the reference temperature and is the constant temperature correction factor at the acclimation temperature . It is important to note that is defined for the interval since acclimation can occur only for temperatures that sustain life long-term; a condition constrained by the lower an upper thermal tolerance limits.
On the other hand, energy requirements during acute thermal stress rely largely on the cellular damage caused by heat and the cost of the respective protective and repair mechanisms. Under stressful conditions, such as those of a rapid temperature increase, organisms employ a variety of behavioural, cellular, and physiological mechanisms to cope with the negative effects of stress and maintain their homeostasis. At the cellular level, this induces a set of responses that include DNA damage repair, protein repair, cell cycle arrest or even cell apoptosis, removal of stress-damaged cellular and molecular components, and generally an overall transition from a state of cellular growth to cellular repair (Kültz, 2005; Kassahn et al., 2009; Sokolova et al., 2012). At the whole organism level, compensatory mechanisms may also include escape behaviour and acceleration of gill movement, heart rate and oxygen uptake. However, while these compensatory processes of cells and the whole organism are essential for survival, they are energetically costly and tend to divert energy flow from functions related to growth and reproduction to processes such as maintenance and repair, which is highly relevant for the argument presented here. Thus, an organism’s response and its tolerance limits to chronic stress depend on available energy reserves as has been shown for many groups of organisms such as polychaetes (Madeira et al., 2021), insects (Klepsatel et al., 2016) and fish (Eldridge et al., 2015). A subset of this framework is the OCLTT (Oxygen and Capacity Limited Thermal Tolerance) hypothesis (Pörtner et al., 2017; Javal et al., 2019), as it identifies the available energy as the determinant of thermal tolerance in ectotherms. The main difference is that energy requirements are expressed through the oxidative capacity of organisms and therefore, aerobic potential (oxygen availability) is used as a measure of energy supply. Indeed, modelling work on Chinook salmon has shown that applying an oxygen supply-demand biophysical framework can provide testable predictions (Martin et al., 2017). Here, we use the mobilization flux, , as such a measure of energy supply, assuming that for short time scales it is more representative than the total reserve energy, which is not readily available.
During acute thermal stress, the energy requirements for basal metabolism increase exponentially with temperature. As indicated by numerous studies, the standard metabolic rate (SMR), which reflects these requirements, increases exponentially with temperature up to the upper thermal limits of organisms, where their physiology collapses (Claireaux et al., 2006; Tirsgaard et al., 2015; Christensen et al., 2020; Beuvard et al., 2022; Leonard and Skov, 2022). In contrast, as these thresholds are approached, the Maximum Metabolic Rate reaches a plateau or may even decline (Pörtner et al., 2017; Leonard and Skov, 2022), which is due to a temporary cessation of energy-consuming processes such as growth and reproduction in an attempt by organisms to divert energy to conservation and self-maintenance processes. The observation that the standard metabolic rate continues to increase with temperature in a fashion resembling Equation 1 rather than Equation 4, is central to the approach presented here and is related to the energy needs SMR represents. That is, regardless of the organism’s ability to repair temperature-induced damage (such as DNA damage, protein denaturation, free radical formation), the induction of such damage increases exponentially with temperature and the energy required to repair it increases accordingly. Based on the above, and in parallel with the observed trends in SMR, for simulating acute thermal stress we will assume that the effect of temperature on the maintenance costs is described by the standard form of the Arrhenius equation (Equation 1). Thus, the maintenance cost during such a thermal challenge will be
where and are the somatic and maturation maintenance fluxes at the reference temperature while is the temperature correction factor, which will increase as the simulation progresses with increasing temperature.
During simulated thermal stress, the continuous increase in temperature causes an increase in the cost of maintenance and inevitably leads to zero available energy (Equation 5) when the sum of all maintenance costs equals the mobilized energy (Equation 8).
This signals the inability of the individual to power any more of its essential metabolic functions. The temperature at which that happens is therefore a threshold value of interest, which we define here as the critical temperature . The relation of with common measures of thermal tolerance such as the will be explored later on.
2.2 Simulations
2.2.1 The E. sea bass and meagre case
For testing this approach, we performed acute thermal stress simulations using the DEB models for two aquaculture finfish, the E. sea bass (Dicentrarchus labrax) and meagre (Argyrosomus regius), as an example. The work is based on the DEB models that have been presented in Stavrakidis-Zachou et al. (2019; Stavrakidis-Zachou et al. 2021a) whose parametrization has been updated here including experimental data on the higher end of the thermal tolerance range. In brief, the procedure for estimating the parameters entails the simultaneous estimation of all parameters, including core DEB parameters as well as auxiliary parameters such as the five Arrhenius parameters, from point data (Tables S1-S2) and complete (Figures S1-S4) data sets on the basis of minimizing a symmetric bounded loss function. The procedure is detailed in Marques et al. (2018); Stavrakidis-Zachou et al. (2019) and the AmP manual (http://www.debtheory.org/wiki) while all the data used for the current model parametrization as well information on the resulting goodness of fit are provided in the Supplementary Material. Apart from their importance for fish farming, the reason for using them to showcase this approach was the availability of data on acute thermal stress from previous trials (Stavrakidis-Zachou et al., 2021b; Stavrakidis-Zachou et al., 2022), which can provide means of evaluating its performance. Specifically, in those trials the was determined at different acclimation temperatures within the 24 - 33°C range. Here, the protocol details of those experiments (acclimation temperature, weight of the fish, heating rate) were used as model input to simulate the challenge and evaluate whether, and to what extent the critical temperatures defined here bares resemblance to traditional measures such as the . While for the details of the above trials we refer to the original papers (Stavrakidis-Zachou et al., 2021b; Stavrakidis-Zachou et al., 2022), in brief, they were performed after a three month acclimation time at different temperatures for each species, during which period the fish were fed daily to satiation and allowed to grow. Specifically, at the time of determination, E. seabass weight was 208, 217, and 128g for acclimation temperatures 24, 28, and 32°C while for meagre the respective values were 379 and 318g at 24 and 29°C. These values of weight and acclimation temperature, along with a heating rate of 0.5°C per minute, were used as input for the simulations performed here. For initialization, the individuals were assumed to be well fed (while during the simulation of the acute thermal challenge, the functional response was set to zero to indicate that the fish were not feeding or assimilating energy. This was also applied in all subsequent simulations. It should be highlighted at this point, that data were not used for model parameterization (as seen from the complete list of datasets provided in the Supplementary Material), but were rather used as independent datasets for evaluating and validating the approach.
Additionally, an investigation of the factors affecting the ability of fish to cope with acute heat stress was carried out. Specifically, we run simulations to detect the influence of the simulation inputs on the critical temperature reached by the fish during the induction of acute thermal stress. The inputs that were tested where namely the acclimation temperature, the size of the fish, the feeding state (via the functional response ), and finally, the rate of temperature increase during the challenge. The procedure followed for the simulations included the following steps. First, a reference scenario was selected, with initial parameter values within the range that is common practice in the experimental determination of the maximum critical temperature in fish. In particular, the reference scenario concerns fish of 100g weight acclimated to the reference temperature (= 293K) under optimal feeding conditions () and subjected to acute thermal stress at a rate of temperature increase of 0.5°C per minute. Then, for the four input effects that were tested, simulations were performed and the critical temperature was calculated. The values of the reference scenario were kept constant and only the values of the parameter under study allowed to vary each time. The example in Figure 1 shows schematically the point at which critical temperature is reached for different values of one of these parameters (here, the fish size).
Figure 1 Example of a schematic representation of DEB fluxes as a function of time during an acute thermal stress challenge. The intersection of the mobilization and maintenance fluxes (circles) represents the resistance time (the time point at which the critical temperature is reached) in each simulation (N = 6), for different values of an input parameter (here, the fish size).
2.2.2 Sensitivity analysis
The effect of key DEB parameters on the critical temperature was investigated through model sensitivity analysis performed on the reference scenario. Specifically, we evaluated how changes in the DEB parameters affect the value of the critical temperature based on the OAT (One-at-a-Time) methodology (Douglas-Smith et al., 2020). For each and every one of the model parameters (as described in Table S1), values representing ± 10% of the original (Razavi and Gupta, 2015) were given, while the rest of the parameters were held constant, and the critical temperature was determined. The relative difference (RD) of the critical temperature with respect to the reference value was then calculated as .
2.2.3 Multi-species comparison
The Add-My-Pet database is an online, open access platform that hosts the DEB parameters for thousands of species (AmP collection, 2023), and as such, is a useful resource for comparing the bioenergetics for different species or exploring patterns across the parameters and properties of the various models. In the present study, we evaluated our approach on thermal tolerance by downloading from the AmP database the DEB parameters of many farmed finfish to perform a multi-species comparison. Specifically, the analysis considered all the species for which DEB parameters were available that belonged to taxonomic groups of importance for fish farming. In total, the analysis included 89 species belonging to the orders Salmoniformes, Spariformers, Moroniformes, Sciaeniformes, Cypriniformes, and Siluriformes, thus, representing most major aquaculture fish groups from salmonids, breams and basses to carps and catfish. For each species, an acute thermal stress challenge was simulated at the typical temperature for the species and the critical temperature was calculated following the procedure, parameters, and equations of sections 2.1.2 and 2.1.3. It should be noted, however, that the extended five parameter temperature correction (Equation 4) was available for only some of the species; an issue that will be further addressed in the discussion. Like in the previous section, the simulations were performed for optimally fed fish () while the rate of heating was 0.5°C per minute.
3 Results
3.1 Patterns in critical temperature: the E. sea bass and meagre case
Overall, the acute thermal stress simulations performed here showed that the model can not only capture the pattern of thermal tolerance that is typically reported for fish but can also detect inter-specific differences that are in agreement with experimental data. Specifically, it was shown that the critical temperatures predicted by the model for different acclimation temperatures closely match experimental observations of the for E. sea bass and meagre (Figure 2A). In fact, in most instances the predictions fell within the uncertainty (error bars) of the observations while the differences between predictions and real data did not exceed 1.3 οC in all cases. Considering that was not explicitly modelled here but rather a bioenergetic approach was applied to describe thermal thresholds, this is an observation of importance for the validity of the method which will be discussed later on. In addition, as seen from the observations, the thermal history of a fish plays a significant role in its thermal tolerance which tends to positively correlate with the acclimation temperature. Indeed, the model was able to capture this trend and was positively correlated with the acclimation temperature for temperatures up to the upper limit of the tolerance range () beyond which it decreased as dictated by the bell-shaped curve of the Arrhenius function (Figure 2B). Finally, as shown by the experimental data of Figure 2B, the model could capture well the quantitative differences in thermal tolerance among the two studied species, with the E. sea bass generally exhibiting higher values.
Figure 2 Simulations of critical temperature on E sea bass and meagre: (A) comparison of model simulated critical temperature with experimental data on from Stavrakidis-Zachou et al., 2021b; Stavrakidis-Zachou et al., 2022 at different acclimation temperatures, (B) simulated critical temperature as a function of acclimation temperature for the reference scenario.
Apart from the thermal history, simulations with different initial weights showed that animal size also affects the ability of the animal to cope with acute thermal stress (Figure 3A). In particular, for both species, the critical temperature was negatively correlated with weight, with higher critical temperatures being achieved for small fish, while a progressive decrease was observed for larger fish. This trend stems from the increase in maintenance costs associated with size, which consequently decreases the time at which the available energy reaches zero () for larger fish. In addition, the functional response, which is a measure of feeding and therefore the state of an animal’s energy reserves, was positively correlated with the critical temperature (Figure 3B). Considering that the energy mobilization flux is proportional to the amount of energy reserves, the above pattern is explained by the larger amounts of energy available to the fish with higher values of functional response. It is important to note, that the trends in critical temperature observed for the above parameters are the same for both species. However, the curves for meagre are shifted downwards, suggesting that the species generally has a lower capacity to respond to acute thermal stress compared to E. sea bass.
Figure 3 Simulated critical temperature as a function of weight (A) and functional response (B) for E sea bass and meagre.
Finally, the intensity of thermal stress, expressed here through the rate of temperature increase during the acute thermal challenge, also affects the response of fish. Although the critical temperature per se is not affected (Figure 4A), the time in which it is reached (resistance time) is determined by the heating rate. Specifically, there is an exponential decrease in resistance time with increasing temperature (Figure 4B), which in essence means a rapid decrease in survival time under conditions of high thermal stress.
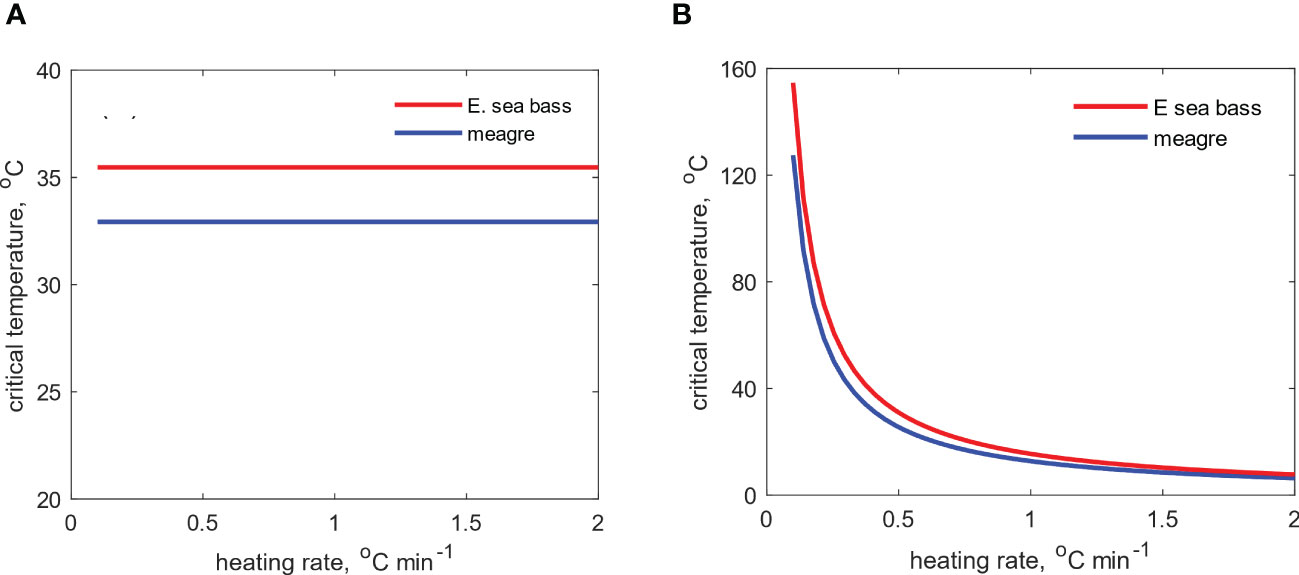
Figure 4 Effects of the heating rate on the (A) critical temperature (B) and resistance time for E sea bass and meagre during simulation of an acute thermal stress challenge.
3.2 Sensitivity analysis
Regarding the sensitivity analysis of the DEB model parameters to the critical temperature predictions, nine parameters were found to have a notable effect on the critical temperature and are shown hierarchically in Figure 5, excluding those that had a negligible effect. Of these, , , and had the smallest effect in determining the critical temperature, , , and had intermediate effects, and , , and had the largest. The fact that the model has the highest sensitivity to changes in Arrhenius temperature is not surprising, given that the temperature correction factor affects the flows of both mobilized reserves and maintenance costs. It appears that an increase in implies a decrease in critical temperature, which is consistent with the parameters of the two species, since meagre, which generally showed lower tolerance to acute thermal stress compared to sea bass, also has the highest value.
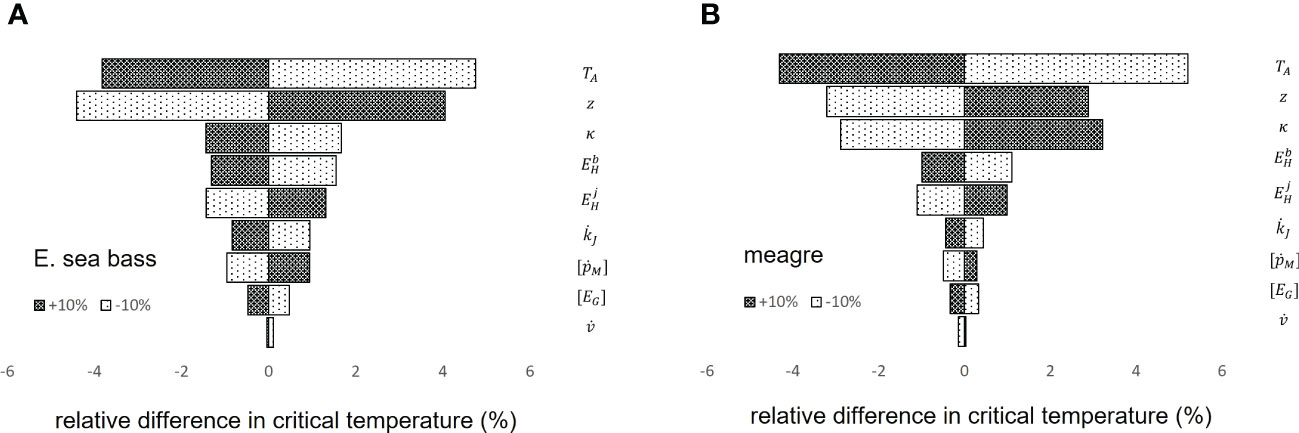
Figure 5 Model sensitivity analysis on DEB parameters for E sea bass (A) and meagre (B). The bars depict the Relative Difference (%) in critical temperature for a ± 10% change in DEB parameter values.
3.3 Multi-species comparison
Acute thermal challenge simulations were performed for 89 finfish belonging to the major fish orders used in aquaculture. The method yielded predictions for the critical temperature that ranged between 7.1 - 35.4°C (Figure 6B), thus providing estimates of thermal tolerance within a sensical temperature window for fish. Moreover, the method detected differences between the fish groups as is seen in conjunction with Figure 6A. Specifically, the Salmoniformes exhibited the lowest values of while the Siluriformes the highest. The rest of the groups showed intermediate values while the Cypriniformes exhibited the highest variability among its species. Finally, the shown in Figure 5B is sorted according to the weight at ultimate size for the species. While an overall pattern is difficult to discern, it appears that there is mild trend for fish of smaller ultimate size to exhibit higher values of and this is mostly evident along the groups of the Spariformes and Cypriniformes. This is consistent with the bioenergetic relation between size and thermal tolerance outlined previously (3.1).
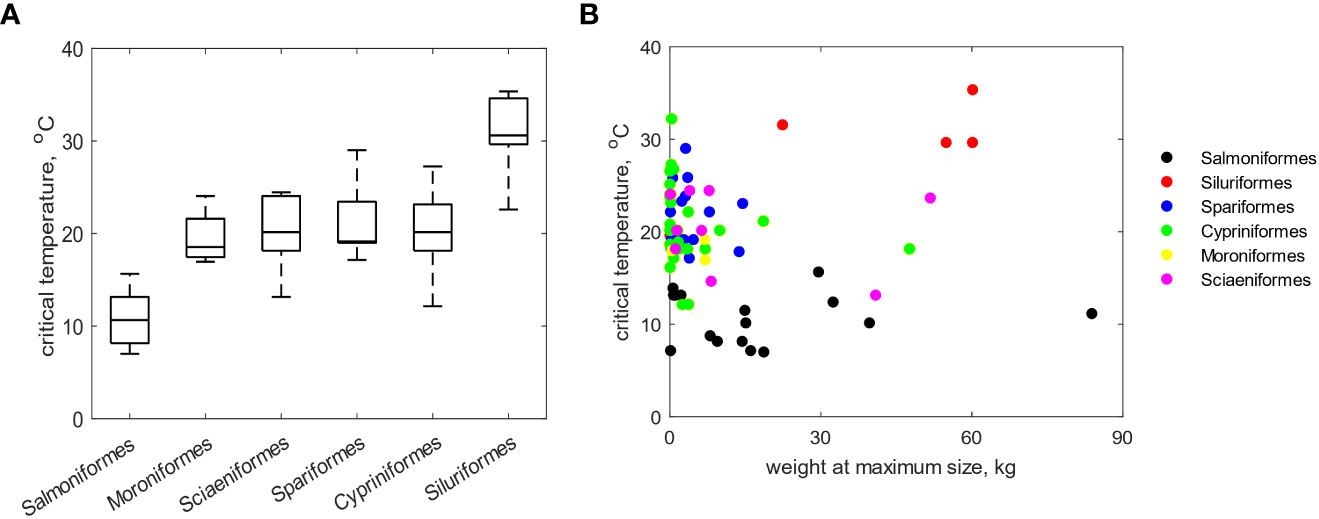
Figure 6 Simulated critical temperatures for 89 fish species from six major fish orders: (A) boxplots representing the across each group with the horizontal line denoting the median and the whiskers the minimum and maximum values, (B) as a function of the weight (kg) at the ultimate size for each species.
4 Discussion
In this study, we presented a modelling approach based on the Dynamic Energy Budget (DEB) theory that describes the tolerance limits of fish under acute thermal stress in bioenergetics terms. The method was demonstrated predominantly using the E. sea bass and meagre as examples but results at multi-species level were also presented.
An interesting observation about the tolerance limits modelled here is that their mathematical description did not require the introduction of additional parameters or modules to the existing fish models, thus underlining the generality of the DEB framework. Instead, the thermal limits were derived by adopting assumptions on physiological observations and thermodynamic principles and then performing simulations. In fact, it should be clarified that apart from the assumptions justified in detail in 2.1.3 and the delineation of the parameter critical temperature () and its derivation, all other parameters and equations presented here are part of the established DEB modelling framework (Kooijman, 2010). The result of the method was to define and estimate temperature thresholds () at the intersection of energy mobilization and maintenance fluxes, thus allowing the description of thermal boundaries in strictly bioenergetic terms. It is emphasized, however, that in developing this approach we did not assume a complete identification of with , which stems from the uncertainty surrounding the mechanisms describing . In particular, although correlations have been made between and the effects of thermal stress on membrane function in neurons (Andreassen et al., 2020), the mechanisms describing the collapse of physiology at remain generally unknown (Jutfelt et al., 2019; Claunch et al., 2021). In addition, the point at which is defined can vary between studies (loss of equillibrium, muscle spasms, coma, death) (Beitinger and Lutterschmidt, 2011), and methodological elements such as the rate of heating appear to influence the results, further complicating the identification of underlying mechanisms (Brauner and Richards, 2020). In the present study, it was hypothesized that regardless of what the actual physiological mechanism describing is, the loss of homeostasis is due to the inability to mobilize sufficient energy to meet increasing maintenance needs (such as removal of damaged molecules and free radicals, repair of cellular structures, etc.). The fact that with this assumption it was possible to simulate thermal thresholds akin to in both absolute values and trends in the two species considered here, is a remarkable finding of this approach and possibly constitutes a realistic bioenergetic interpretation of the mechanism governing .
Regarding the factors affecting tolerance thresholds of fish under acute thermal stress, it appears that their temperature history plays a crucial role. This has been experimentally documented by the shift in at different acclimation temperatures, as reported in numerous fish studies (Zhou et al., 2019; Yilmaz et al., 2020; Penny and Pavey, 2021; Sakurai et al., 2021; Stavrakidis-Zachou et al., 2021b; Stavrakidis-Zachou et al., 2022). It is, however, important to critically interpret such results. The use of indices such as is an established practice in the study of thermal tolerance (Moyano et al., 2017; Yanar et al., 2019; Azra et al., 2020) because it is characterized by high repeatability and thus allows for intra- and inter-species comparisons. However, upon exposure to acute thermal stress, the survival of an organism is time-dependent, i.e. determined by the intensity of the stress (the temperature value), and by the time exposure to it (Kingsolver and Umbanhowar, 2018). For this reason, considering such indices as absolute limits of thermal tolerance is a misconception that unfortunately has wide appeal in thermal biology studies (Santos et al., 2011; Rezende et al., 2014; Pörtner et al., 2017). An alternative perspective is to consider these boundaries as potential points of the ‘thermal landscape’ (Nowakowski et al., 2018; Garcia and Clusella-Trullas, 2019); a multidimensional space in which thermal boundaries depend on many factors, including the intensity of thermal stress, exposure time, the thermal history of the organisms (acclimation temperature), the size of the animals, and their health status (Rezende et al., 2014). Indeed, Turko et al. (2020) studied the parameters affecting in red mullet (Clinostomue elongates) and observed that thermal tolerance is influenced by the season (acclimation temperature), the size and the body condition of the fish. Specifically, in their experiments, was positively correlated with acclimation temperature and negatively correlated with fish size. Also, fish fed a reduced ration were characterised by a low robustness and consequently depleted energy reserves. These fish also scored significantly lower values compared to the control group. The same size-tolerance relation has been reported for several salmonid species (Recsetar et al., 2012; Hines et al., 2019) although it is important to note that non-significant results have been presented for some of them (Recsetar et al., 2012).
These trends were also reflected in the simulations performed here. Specifically, critical temperature was negatively correlated with fish weight, while the functional response, which is a measure of trophic conditions and thus the status of an animal’s energy reserves, was positively correlated. The bioenergetic reason why this is the case is that the flux of mobilised reserve is directly proportional to the density of reserves and therefore fish living in poor trophic conditions will not only have fewer reserves but also a reduced ability to mobilise them. Indeed, it is worth noting that reduced thermal capacity under low trophic conditions has also been observed in other ectotherms such as beetles (Chidawanyika et al., 2017) and ants (Bujan and Kaspari, 2017). The interpretations given from the above authors mainly focus on the combination of scarce food and high energy requirements. That is, they hypothesize that their combination leads to a rapid depletion of energy reserves, which then renders the organisms unable to regulate their protective mechanisms. The above observations on the correlations of thermal thresholds, size, and food are consistent with the simulations performed here, showing not only that the model captures the basic trends recorded experimentally, but also that its mechanism can be interpreted by bioenergetics. Indeed, the model suggests that the reduction in thermal tolerance under low trophic conditions does not depend on the reduction of these energy reserves per se, but on their mobilization capacity, which depends secondarily on their density. This in turn is a suggestion that needs experimental investigation and is an example of how theory can induce experimental research (Kooijman, 2017).
Another interesting finding of the present study is that the method was able to depict patterns in thermal tolerance among wider taxonomic groups of fish that align with our general understanding of the differences among the groups. Admittedly, this first attempt to discern tolerance patterns across species requires further investigation and validation, and therefore the results should be critically interpreted. For instance, model predictions have not been compared against experimental observations and it is thus, unknown to what extent they deviate from reality. Moreover, the models of the 89 species used here bare various levels of completion and robustness which decreases confidence in predictions while they also incorporate different versions of the Arrhenius function. However, as shown in the sensitivity analysis, the determination of the critical temperature is greatly affected by the parameter , but it is insensitive to changes in the other four temperature parameters. While it may be unintuitive that parameters such as and affect minimally, the interpretation lies in that all simulations were run for acclimation temperatures typical for the species. For such temperatures, the extended correction factor stemming from Equation 4 practically reduces to Equation 1, thus also resolving potential issues of comparing species that may use different versions of the Arrhenius function. That being said, some general patterns could be drawn from the analysis. For instance, salmonids (Salmoniformes) which are cold water species were found to have lower thermal tolerance than other fish groups and this is consistently reported in literature (Anttila et al., 2013; Chen et al., 2015; Hines et al., 2019). On the other hand, the catfish (Siluriformes) which are known to have high thermal tolerance with typically reported values in the range of 30 – 45 οC (Vasal and Sundararaj, 1978; Debnath et al., 2006; Dalvi et al., 2009; Stewart and Allen, 2014) scored the highest in our analysis. In addition, our simulations suggest a negative correlation of thermal tolerance with the species ultimate size, which has also been reported for different species of salmonids (Hines et al., 2019). The agreement of experimental observations with the model simulations regarding these general trends is contributing to the validity of the method and constitutes an encouraging finding for further exploring patterns across taxa.
Given the close relation between temperature and fish metabolism, the pressures resulting from global warming are expected to have enormous impacts on fish with particular emphasis on farmed species since they are spatially restricted by their rearing environment and therefore cannot escape the adverse environmental conditions stemming from climate change (Marbà et al., 2015; Barange et al., 2018; Smale et al., 2019). In that regard, developing tools such as models to study and predict the tolerance limits and responses of farmed species is crucial for the aquaculture industry, as it allows predicting future impacts and making informed strategic decisions for climate change adaptation (Pham et al., 2021). In turn, this may lead to suggestions on management practices that may be favoured in the future, such as changing the timing of production initiation, selecting different commercial sizes or even changing the rearing area, thus highlighting the power of these models as both study and management tools (Varga et al., 2020; Stavrakidis-Zachou et al., 2021c). For instance, as indicated by experimental data and the simulations performed here, tolerance limits are generally negatively correlated with fish size. From this observation, among other things, management recommendations could be derived that minimize the impact of heatwave episodes by synchronizing the summer rearing months with fish of smaller sizes. Similar recommendations could be derived for adjusting feeding regimes based on the simulation outputs that suggest increased thermal tolerance for optimally fed individuals. Finally, as shown by the multi-species comparison performed here, tentative conclusions on thermal tolerance can be drawn for a large number of species found in the AmP collection (AmP collection, 2023), irrespective of the completeness level of the respective models. Therefore, another potential application of this method could be the preliminary assessment of candidate species with respect to their suitability in farming or the theoretical exploration of tolerance patterns across taxonomic groups.
5 Conclusions
Overall, our simulations showed that the modelling approach presented in this study can adequately capture the general tolerance patterns of the species that were considered as well as pinpoint factors that may influence them. Although further investigation and validation is required to increase the robustness of the method, the framework described here offers promising results towards a mechanistic interpretation of thermal tolerance in bioenergetic terms during acute thermal stress which is missing from the literature. In addition, as outlined previously, it may have practical applications in fish farming since it provides predictive power to simulating and quantifying thermal tolerance. This is increasingly relevant in expectation of higher heatwave intensity and frequency in the future, and therefore it has potential to contribute to the development of tools and recommendations towards climate change adaptation.
Data availability statement
The original contributions presented in the study are included in the article/Supplementary Material. Further inquiries can be directed to the corresponding author.
Author contributions
OS-Z, NP, and KL contributed to conception and design of the study. KL contributed to model development. OS-Z wrote the first draft of the manuscript. All authors contributed to manuscript revision, read, and approved the submitted version.
Conflict of interest
The authors declare that the research was conducted in the absence of any commercial or financial relationships that could be construed as a potential conflict of interest.
Publisher’s note
All claims expressed in this article are solely those of the authors and do not necessarily represent those of their affiliated organizations, or those of the publisher, the editors and the reviewers. Any product that may be evaluated in this article, or claim that may be made by its manufacturer, is not guaranteed or endorsed by the publisher.
Supplementary material
The Supplementary Material for this article can be found online at: https://www.frontiersin.org/articles/10.3389/fmars.2023.1173358/full#supplementary-material
References
Alster C. J., Baas P., Wallenstein M. D., Johnson N. G., von Fischer J. C. (2016). Temperature sensitivity as a microbial trait using parameters from macromolecular rate theory. Front. Microbiol. 7. doi: 10.3389/fmicb.2016.01821
AmP collection. (2023). Add-my-Pet collection, online database of DEB parameters, implied properties and referenced underlying data. Available at: xlink:href="https://debtheory.fr/add_my_pet/>https://www.bio.vu.nl/thb/deb/deblab/ add my pet/https://debtheory.fr/add_my_pet/ (Accessed 1.5.2023).
Andreassen A. H., Hall P., Khatibzadeh P., Jutfelt F., Kermen F. (2020). Neural dysfunction at the upper thermal limit in the zebrafish. bioRxiv, 2020.12.28.424529. doi: 10.1101/2020.12.28.424529
Antonucci F., Costa C. (2020). Precision aquaculture: a short review on engineering innovations. Aquacult Int. 28, 41–57. doi: 10.1007/s10499-019-00443-w
Anttila K., Dhillon R. S., Boulding E. G., Farrell A. P., Glebe B. D., Elliott J. A. K., et al. (2013). Variation in temperature tolerance among families of atlantic salmon (Salmo salar) is associated with hypoxia tolerance, ventricle size and myoglobin level. J. Exp. Biol. 216, 1183–1190. doi: 10.1242/jeb.080556
Azra M. N., Mohamad A., Hidir A., Taufik M., Abol-Munafi A. B., Ikhwanuddin M. (2020). Critical thermal maxima of two species of intertidal crabs, Scylla olivacea and thalamita crenata at different acclimation temperatures. Aquaculture Rep. 17, 100301. doi: 10.1016/j.aqrep.2020.100301
Barange M., Bahri T., Beveridge M. C. M., Cochrane K. L., Funge-Smith S., Poulain F. (2018). Impacts of climate change on fisheries and aquaculture: synthesis of currrent knowledge, adaptation and mitigation options. FAO Fisheries Aquaculture Tech. Paper (FAO) Eng. no. 627.
Beitinger T. L., Lutterschmidt W. I. (2011). “Temperature | measures of thermal tolerance,” in Encyclopedia of fish physiology. Ed. Farrell A. P. (San Diego: Academic Press), 1695–1702. doi: 10.1016/B978-0-12-374553-8.00200-8
Beuvard C., Imsland A. K. D., Thorarensen H. (2022). The effect of temperature on growth performance and aerobic metabolic scope in Arctic charr, salvelinus alpinus (L.). J. Thermal Biol. 104, 103117. doi: 10.1016/j.jtherbio.2021.103117
Brauner C. J., Richards J. G. (2020). “Chapter 3 - physiological performance in aquaculture: using physiology to help define optimal conditions for growth and environmental tolerance,” in Fish physiology, aquaculture. Eds. Benfey T. J., Farrell A. P., Brauner C. J. (Academic Press), 83–121. doi: 10.1016/bs.fp.2020.10.001
Brigolin D., Meccia V., Venier C., Tomassetti P., Porrello S., Pastres R. (2014). Modelling biogeochemical fluxes across a Mediterranean fish cage farm. Aquaculture Environ. Interact. 5, 71–88. doi: 10.3354/aei00093
Bujan J., Kaspari M. (2017). Nutrition modifies critical thermal maximum of a dominant canopy ant. J. Insect Physiol. 102, 1–6. doi: 10.1016/j.jinsphys.2017.08.007
Chahid A., N’Doye I., Majoris J. E., Berumen M. L., Laleg-Kirati T.-M. (2022). Fish growth trajectory tracking using q-learning in precision aquaculture. Aquaculture 550, 737838. doi: 10.1016/j.aquaculture.2021.737838
Chen Z., Devlin R. H., Farrell A. P. (2015). Upper thermal tolerance of wild-type, domesticated and growth hormone-transgenic coho salmon oncorhynchus kisutch. J. Fish Biol. 87, 763–773. doi: 10.1111/jfb.12736
Chidawanyika F., Nyamukondiwa C., Strathie L., Fischer K. (2017). Effects of thermal regimes, starvation and age on heat tolerance of the parthenium beetle zygogramma bicolorata (Coleoptera: chrysomelidae) following dynamic and static protocols. PloS One 12, e0169371. doi: 10.1371/journal.pone.0169371
Christensen E. A. F., Svendsen M. B. S., Steffensen J. F. (2020). The combined effect of body size and temperature on oxygen consumption rates and the size-dependency of preferred temperature in European perch perca fluviatilis. J. Fish Biol. 97, 794–803. doi: 10.1111/jfb.14435
Claireaux G., Couturier C., Groison A.-L. (2006). Effect of temperature on maximum swimming speed and cost of transport in juvenile European sea bass (Dicentrarchus labrax). J. Exp. Biol. 209, 3420–3428. doi: 10.1242/jeb.02346
Claunch N. M., Nix E., Royal A. E., Burgos L. P., Corn M., DuBois P. M., et al. (2021). Body size impacts critical thermal maximum measurements in lizards. J. Exp. Zoology 335, 96–107. doi: 10.1002/jez.2410
Cowles R. B., Raymond B., Bogert C. M., Charles M. (1944). A preliminary study of the thermal requirements of desert reptiles. bulletin of the AMNH. Reptile Thermal Requirements 83, 261–206.
Crozier L. G., Hutchings J. A. (2014). Plastic and evolutionary responses to climate change in fish. Evolutionary Appl. 7, 68–87. doi: 10.1111/eva.12135
Dalvi R. S., Pal A. K., Tiwari L. R., Das T., Baruah K. (2009). Thermal tolerance and oxygen consumption rates of the catfish horabagrus brachysoma (Günther) acclimated to different temperatures. Aquaculture 295, 116–119. doi: 10.1016/j.aquaculture.2009.06.034
Debnath D., Pal A. K., Sahu N. P., Baruah K., Yengkokpam S., Das T., et al. (2006). Thermal tolerance and metabolic activity of yellowtail catfish pangasius pangasius (Hamilton) advanced fingerlings with emphasis on their culture potential. Aquaculture 258, 606–610. doi: 10.1016/j.aquaculture.2006.04.037
Di Santo V., Lobel P. S. (2017). Body size and thermal tolerance in tropical gobies. J. Exp. Mar. Biol. Ecol. 487, 11–17. doi: 10.1016/j.jembe.2016.11.007
Dong S., Wang F., Zhang D., Yu L., Pu W., Shang Y. (2022). Growth performance and ecological services evaluation of razor clams based on dynamic energy budget model. J. Environ. Manage. 306, 114392. doi: 10.1016/j.jenvman.2021.114392
Douglas-Smith D., Iwanaga T., Croke B. F. W., Jakeman A. J. (2020). Certain trends in uncertainty and sensitivity analysis: an overview of software tools and techniques. Environ. Model. Softw. 124, 104588. doi: 10.1016/j.envsoft.2019.104588
Dumas A., France J., Bureau D. (2010). Modelling growth and body composition in fish nutrition: where have we been and where are we going? Aquaculture Res. 41, 161–181. doi: 10.1111/j.1365-2109.2009.02323.x
Eldridge W. H., Sweeney B. W., Law J. M. (2015). Fish growth, physiological stress, and tissue condition in response to rate of temperature change during cool or warm diel thermal cycles. Can. J. Fisheries Aquat. Sci. 72, 1527–1537. doi: 10.1139/cjfas-2014-0350
FAO (2020). The state of world fisheries and aquaculture 2020 (Rome, Italy: FAO). doi: 10.4060/ca9229en
Føre M., Frank K., Norton T., Svendsen E., Alfredsen J. A., Dempster T., et al. (2018). Precision fish farming: A new framework to improve production in aquaculture. Biosystems Engineering, Advances in the Engineering of Sensor-based Monitoring and Management Systems for Precision Livestock Farming 173, 176–193. doi: 10.1016/j.biosystemseng.2017.10.014
Frölicher T. L., Fischer E. M., Gruber N. (2018). Marine heatwaves under global warming. Nature 560, 360–364. doi: 10.1038/s41586-018-0383-9
Garcia R. A., Clusella-Trullas S. (2019). Thermal landscape change as a driver of ectotherm responses to plant invasions. Proc. R. Soc. B: Biol. Sci. 286, 20191020. doi: 10.1098/rspb.2019.1020
Garrabou J., Gómez-Gras D., Ledoux J.-B., Linares C., Bensoussan N., López-Sendino P., et al. (2019). Collaborative database to track mass mortality events in the Mediterranean Sea. Front. Mar. Sci. 6. doi: 10.3389/fmars.2019.00707
Gergs A., Baden C. U. (2021). A dynamic energy budget approach for the prediction of development times and variability in spodoptera frugiperda rearing. Insects 12, 300. doi: 10.3390/insects12040300
Haider F., Timm S., Bruhns T., Noor M. N., Sokolova I. M. (2020). Effects of prolonged food limitation on energy metabolism and burrowing activity of an infaunal marine bivalve, mya arenaria. Comp. Biochem. Physiol. Part A: Mol. Integr. Physiol. 250, 110780. doi: 10.1016/j.cbpa.2020.110780
Hines C. W., Fang Y., Chan V. K. S., Stiller K. T., Brauner C. J., Richards J. G. (2019). The effect of salinity and photoperiod on thermal tolerance of Atlantic and coho salmon reared from smolt to adult in recirculating aquaculture systems. Comp. Biochem. Physiol. Part A: Mol. Integr. Physiol. 230, 1–6. doi: 10.1016/j.cbpa.2018.12.008
Hobday A. J., Alexander L. V., Perkins S. E., Smale D. A., Straub S. C., Oliver E. C. J., et al. (2016). A hierarchical approach to defining marine heatwaves. Prog. Oceanography 141, 227–238. doi: 10.1016/j.pocean.2015.12.014
Islam M. J., Kunzmann A., Bögner M., Meyer A., Thiele R., James Slater M. (2020). Metabolic and molecular stress responses of European seabass, dicentrarchus labrax at low and high temperature extremes. Ecol. Indic. 112, 106118. doi: 10.1016/j.ecolind.2020.106118
Javal M., Thomas S., Lehmann P., Barton M. G., Conlong D. E., Du Plessis A., et al. (2019). The effect of oxygen limitation on a xylophagous insect’s heat tolerance is influenced by life-stage through variation in aerobic scope and respiratory anatomy. Front. Physiol. 10. doi: 10.3389/fphys.2019.01426
Jones B. J., Iii R. L. E., Mylrea N. J., Chaudhury D., Luo C., Guan B., et al. (2020). Larger active site in an ancestral hydroxynitrile lyase increases catalytically promiscuous esterase activity. PloS One 15, e0235341. doi: 10.1371/journal.pone.0235341
Jutfelt F., Roche D. G., Clark T. D., Norin T., Binning S. A., Speers-Roesch B., et al. (2019). Brain cooling marginally increases acute upper thermal tolerance in Atlantic cod. J. Experimental Biol. 222 (19), jeb208249. doi: 10.1242/jeb.208249
Kassahn K. S., Crozier R. H., Pörtner H. O., Caley M. J. (2009). Animal performance and stress: responses and tolerance limits at different levels of biological organisation. Biol. Rev. Camb Philos. Soc. 84, 277–292. doi: 10.1111/j.1469-185X.2008.00073.x
Kingsolver J. G., Umbanhowar J. (2018). The analysis and interpretation of critical temperatures. J. Exp. Biol. 221, jeb167858. doi: 10.1242/jeb.167858
Kır M., Sunar M. C., Altındağ B. C. (2017). Thermal tolerance and preferred temperature range of juvenile meagre acclimated to four temperatures. J. Thermal Biol. 65, 125–129. doi: 10.1016/j.jtherbio.2017.02.018
Klepsatel P., Gáliková M., Xu Y., Kühnlein R. P. (2016). Thermal stress depletes energy reserves in drosophila. Scintific Rep. 6, 33667. doi: 10.1038/srep33667
Kobayashi M., Msangi S., Batka M., Vannuccini S., Dey M. M., Anderson J. L. (2015). Fish to 2030: the role and opportunity for aquaculture. Aquaculture Economics Manage. 19, 282–300. doi: 10.1080/13657305.2015.994240
Koenigstein S., Mark F. C., Gößling-Reisemann S., Reuter H., Poertner H.-O. (2016). Modelling climate change impacts on marine fish populations: process-based integration of ocean warming, acidification and other environmental drivers. Fish Fisheries 17, 972–1004. doi: 10.1111/faf.12155
Kooijman S. A. L. M. (2010). Dynamic energy budget theory for metabolic organisation (Cambridge, UK: Cambridge University Press).
Kooijman S. A. L. M. (2017). Models in stress research. Ecological Complexity 34, 161–177. doi: 10.1016/j.ecocom.2017.07.006
Kültz D. (2005). Molecular and evolutionary basis of the cellular stress response. Annu. Rev. Physiol. 67, 225–257. doi: 10.1146/annurev.physiol.67.040403.103635
Lavaud R., Filgueira R., Nadeau A., Steeves L., Guyondet T. (2020). A dynamic energy budget model for the macroalga ulva lactuca. Ecol. Model. 418, 108922. doi: 10.1016/j.ecolmodel.2019.108922
Lefevre S., McKenzie D. J., Nilsson G. E. (2017). Models projecting the fate of fish populations under climate change need to be based on valid physiological mechanisms. Global Change Biol. 23, 3449–3459. doi: 10.1111/gcb.13652
Leonard J. N., Skov P. V. (2022). Capacity for thermal adaptation in Nile tilapia (Oreochromis niloticus): effects on oxygen uptake and ventilation. J. Thermal Biol. 105, 103206. doi: 10.1016/j.jtherbio.2022.103206
Lotze H. K., Tittensor D. P., Bryndum-Buchholz A., Eddy T. D., Cheung W. W. L., Galbraith E. D., et al. (2019). Ensemble projections of global ocean animal biomass with climate change. Proc. Natl. Acad. Sci. U. S. A. 116, 12907–12912. doi: 10.1073/pnas.1900194116
Lutterschmidt W. I., Hutchison V. H. (1997). The critical thermal maximum: history and critique. Can. J. Zoology 75, 1561–1574. doi: 10.1139/z97-783
Macaulay G., Bui S., Oppedal F., Dempster T. (2021). Challenges and benefits of applying fish behaviour to improve production and welfare in industrial aquaculture. Rev. Aquaculture 13, 934–948. doi: 10.1111/raq.12505
Madeira D., Fernandes J. F., Jerónimo D., Martins P., Ricardo F., Santos A., et al. (2021). Salinity shapes the stress responses and energy reserves of marine polychaetes exposed to warming: from molecular to functional phenotypes. Sci. Total Environ. 795, 148634. doi: 10.1016/j.scitotenv.2021.148634
Maffucci I., Laage D., Sterpone F., Stirnemann G. (2020). Thermal adaptation of enzymes: impacts of conformational shifts on catalytic activation energy and optimum temperature. Chem. – A Eur. J. 26, 10045–10056. doi: 10.1002/chem.202001973
Marbà N., Jorda G., Agusti S., Girard C., Duarte C. M. (2015). Footprints of climate change on Mediterranean Sea biota. Front. Mar. Sci. 2. doi: 10.3389/fmars.2015.00056
Marques G. M., Augustine S., Lika K., Pecquerie L., Domingos T., Kooijman S. A. L. M. (2018). The AmP project: comparing species on the basis of dynamic energy budget parameters. PloS Comput. Biol. 14, e1006100. doi: 10.1371/journal.pcbi.1006100
Martin B. T., Pike A., John S. N., Hamda N., Roberts J., Lindley S. T., et al. (2017). Phenomenological vs. biophysical models of thermal stress in aquatic eggs. Ecol. Lett. 20, 50–59. doi: 10.1111/ele.12705
McCue M. D., Terblanche J. S., Benoit J. B. (2017). Learning to starve: impacts of food limitation beyond the stress period. J. Exp. Biol. 220, 4330–4338. doi: 10.1242/jeb.157867
Moyano M., Candebat C., Ruhbaum Y., Álvarez-Fernández S., Claireaux G., Zambonino-Infante J.-L., et al. (2017). Effects of warming rate, acclimation temperature and ontogeny on the critical thermal maximum of temperate marine fish larvae. PloS One 12, e0179928. doi: 10.1371/journal.pone.0179928
Nowakowski A. J., Frishkoff L. O., Agha M., Todd B. D., Scheffers B. R. (2018). Changing thermal landscapes: merging climate science and landscape ecology through thermal biology. Curr. Landscape Ecol. Rep. 3, 57–72. doi: 10.1007/s40823-018-0034-8
Oliver E. C. J., Donat M. G., Burrows M. T., Moore P. J., Smale D. A., Alexander L. V., et al. (2018). Longer and more frequent marine heatwaves over the past century. Nat. Commun. 9, 1324. doi: 10.1038/s41467-018-03732-9
Pecquerie L., Petitgas P., Kooijman S. A. L. M. (2009). Modeling fish growth and reproduction in the context of the dynamic energy budget theory to predict environmental impact on anchovy spawning duration. J. Sea Research Metab. organization: 30 years DEB Appl. Developments 62, 93–105. doi: 10.1016/j.seares.2009.06.002
Penny F. M., Pavey S. A. (2021). Increased acute thermal tolerance and little change to hematology following acclimation to warm water in juvenile striped bass, morone saxatilis. Environ. Biol. Fishes 104, 489–500. doi: 10.1007/s10641-021-01088-6
Pham T. T. T., Friðriksdóttir R., Weber C. T., Viðarsson J. R., Papandroulakis N., Baudron A. R., et al. (2021). Guidelines for co-creating climate adaptation plans for fisheries and aquaculture. Climatic Change 164, 62. doi: 10.1007/s10584-021-03041-z
Pörtner H.-O., Bock C., Mark F. C. (2017). Oxygen- and capacity-limited thermal tolerance: bridging ecology and physiology. J. Exp. Biol. 220, 2685–2696. doi: 10.1242/jeb.134585
Razavi S., Gupta H. V. (2015). What do we mean by sensitivity analysis? the need for comprehensive characterization of “global” sensitivity in earth and environmental systems models. Water Resour. Res. 51, 3070–3092. doi: 10.1002/2014WR016527
Recsetar M. S., Zeigler M. P., Ward D. L., Bonar S. A., Caldwell C. A. (2012). Relationship between fish size and upper thermal tolerance. Trans. Am. Fisheries Soc. 141, 1433–1438. doi: 10.1080/00028487.2012.694830
Reid G. K., Gurney-Smith H. J., Marcogliese D. J., Knowler D., Benfey T., Garber A. F., et al. (2019). Climate change and aquaculture: considering biological response and resources. Aquaculture Environ. Interact. 11, 569–602. doi: 10.3354/aei00332
Rezende E. L., Castañeda L. E., Santos M. (2014). Tolerance landscapes in thermal ecology. Funct. Ecol. 28, 799–809. doi: 10.1111/1365-2435.12268
Rosa R., Marques A., Nunes M. (2012). Impact of climate change in Mediterranean aquaculture. Rev. Aquaculture 4, 163–177. doi: 10.1111/j.1753-5131.2012.01071.x
Sakurai G., Takahashi S., Yoshida Y., Yoshida H., Shoji J., Tomiyama T. (2021). Importance of experienced thermal history: effect of acclimation temperatures on the high-temperature tolerance and growth performance of juvenile marbled flounder. J. Thermal Biol. 97, 102831. doi: 10.1016/j.jtherbio.2020.102831
Santos M., Castañeda L. E., Rezende E. L. (2011). Making sense of heat tolerance estimates in ectotherms: lessons from drosophila. Funct. Ecol. 25, 1169–1180. doi: 10.1111/j.1365-2435.2011.01908.x
Sarà G., Gouhier T. C., Brigolin D., Porporato E. M. D., Mangano M. C., Mirto S., et al. (2018). Predicting shifting sustainability trade-offs in marine finfish aquaculture under climate change. Global Change Biol. 24, 3654–3665. doi: 10.1111/gcb.14296
Serpa D., Ferreira P. P., Ferreira H., da Fonseca L. C., Dinis M. T., Duarte P. (2013). Modelling the growth of white seabream (Diplodus sargus) and gilthead seabream (Sparus aurata) in semi-intensive earth production ponds using the dynamic energy budget approach. J. Sea Res. 76, 135–145. doi: 10.1016/j.seares.2012.08.003
Sharpe P. J., DeMichele D. W. (1977). Reaction kinetics of poikilotherm development. J. Theor. Biol. 64, 649–670. doi: 10.1016/0022-5193(77)90265-x
Smale D. A., Wernberg T., Oliver E. C. J., Thomsen M., Harvey B. P., Straub S. C., et al. (2019). Marine heatwaves threaten global biodiversity and the provision of ecosystem services. Nat. Climatic Change 9, 306–312. doi: 10.1038/s41558-019-0412-1
Smith K. E., Burrows M. T., Hobday A. J., Sen Gupta A., Moore P. J., Thomsen M., et al. (2021). Socioeconomic impacts of marine heatwaves: global issues and opportunities. Science 374, eabj3593. doi: 10.1126/science.abj3593
Sokolova I. M., Frederich M., Bagwe R., Lannig G., Sukhotin A. A. (2012). Energy homeostasis as an integrative tool for assessing limits of environmental stress tolerance in aquatic invertebrates. Mar. Environ. Res. 79, 1–15. doi: 10.1016/j.marenvres.2012.04.003
Somero G. N. (2004). Adaptation of enzymes to temperature: searching for basic “strategies”. Comp. Biochem. Physiol. Part B: Biochem. Mol. Biology Special Issue Dedicated to Memory Peter W. Hochachka 1937-2002)139, 321–333 doi: 10.1016/j.cbpc.2004.05.003
Stavrakidis-Zachou O., Lika K., Anastasiadis P., Papandroulakis N. (2021a). Projecting climate change impacts on Mediterranean finfish production: a case study in Greece. Climatic Change 165, 67. doi: 10.1007/s10584-021-03096-y
Stavrakidis-Zachou O., Lika K., Pavlidis M., Asaad M. H., Papandroulakis N. (2022). Metabolic scope, performance and tolerance of juvenile European sea bass dicentrarchus labrax upon acclimation to high temperatures. PloS One 17, e0272510. doi: 10.1371/journal.pone.0272510
Stavrakidis-Zachou O., Lika K., Pavlidis M., Tsalafouta A., Mohamed A. H., Nikos P. (2021b). Thermal tolerance, metabolic scope and performance of meagre, argyrosomus regius, reared under high water temperatures. J. Thermal Biol. 100, 103063. doi: 10.1016/j.jtherbio.2021.103063
Stavrakidis-Zachou O., Papandroulakis N., Lika K. (2019). A DEB model for European sea bass (Dicentrarchus labrax): parameterisation and application in aquaculture. J. Sea Research Ecosystem based Manage. Biosphere: New phase DEB Res. 143, 262–271. doi: 10.1016/j.seares.2018.05.008
Stavrakidis-Zachou O., Sturm A., Lika K., Wätzold F., Papandroulakis N. (2021c). ClimeGreAq: a software-based DSS for the climate change adaptation of Greek aquaculture. Environ. Model. Softw. 143, 105121. doi: 10.1016/j.envsoft.2021.105121
Stewart H. A., Allen P. J. (2014). Critical thermal maxima of two geographic strains of channel and hybrid catfish. North Am. J. Aquaculture 76, 104–111. doi: 10.1080/15222055.2013.856827
Stocker T. F., Qin D., Plattner G.-K., Tignor M. M. B., Allen S. K., Boschung J., et al. (2014). Climate change 2013: the physical science basis. contribution of working group I to the fifth assessment report of IPCC the intergovernmental panel on climate change. Eds. Stocker T. F., Qin D., Plattner G.-K., Tignor M. M. B., Allen S. K., Boschung J., Nauels A., Xia Y., Bex V., Midgley P. M. (Cambridge: Cambridge University Press). doi: 10.1017/CBO9781107415324
Sunday J., Bennett J. M., Calosi P., Clusella-Trullas S., Gravel S., Hargreaves A. L., et al. (2019). Thermal tolerance patterns across latitude and elevation. Philos. Trans. R. Soc. B: Biol. Sci. 374, 20190036. doi: 10.1098/rstb.2019.0036
Tebaldi C., Debeire K., Eyring V., Fischer E., Fyfe J., Friedlingstein P., et al. (2021). Climate model projections from the scenario model intercomparison project (ScenarioMIP) of CMIP6. Earth System Dynamics 12, 253–293. doi: 10.5194/esd-12-253-2021
Teske S. (2019). Achieving the Paris climate agreement goals: global and regional 100% renewable energy scenarios with non-energy GHG pathways for +1.5°C and +2°C (Cham: Springer International Publishing). doi: 10.1007/978-3-030-05843-2
Tirsgaard B., Svendsen J. C., Steffensen J. F. (2015). Effects of temperature on specific dynamic action in Atlantic cod gadus morhua. Fish Physiol. Biochem. 41, 41–50. doi: 10.1007/s10695-014-0004-y
Turko A. J., Nolan C. B., Balshine S., Scott G. R., Pitcher T. E. (2020). Thermal tolerance depends on season, age and body condition in imperilled redside dace clinostomus elongatus. Conserv. Physiol. 8, coaa062. doi: 10.1093/conphys/coaa062
van Vuuren D. P., Edmonds J., Kainuma M., Riahi K., Thomson A., Hibbard K., et al. (2011). The representative concentration pathways: an overview. Climatic Change 109, 5–31. doi: 10.1007/s10584-011-0148-z
Varga M., Berzi-Nagy L., Csukas B., Gyalog G. (2020). Long-term dynamic simulation of environmental impacts on ecosystem-based pond aquaculture. Environ. Model. Software 134, 104755. doi: 10.1016/j.envsoft.2020.104755
Vasal S., Sundararaj B. I. (1978). Thermal tolerance and preference of the Indian catfish heteropneustes fossilis. Environ. Biol. Fish 3, 309–315. doi: 10.1007/BF00001458
Yanar M., Erdoğan E., Kumlu M. (2019). Thermal tolerance of thirteen popular ornamental fish species. Aquaculture 501, 382–386. doi: 10.1016/j.aquaculture.2018.11.041
Yilmaz H. A., Turkmen S., Kumlu M., Eroldogan O. T., Perker N. (2020). Alteration of growth and temperature tolerance of european sea bass (Dicentrarchus labrax linnaeus 1758) in different temperature and salinity combinations. Turkish J. Fisheries Aquat. Sci. 20, 331–340. doi: 10.4194/1303-2712-v20_5_01
Zhou L.-Y., Fu S.-J., Fu C., Ling H., Li X.-M. (2019). Effects of acclimation temperature on the thermal tolerance, hypoxia tolerance and swimming performance of two endangered fish species in China. J. Comperative Physiol. B 189, 237–247. doi: 10.1007/s00360-018-01201-9
Keywords: climate change, aquaculture, thermal tolerance, DEB, modeling, acute stress
Citation: Stavrakidis-Zachou O, Papandroulakis N and Lika K (2023) A bioenergetics approach to modelling tolerance limits under acute thermal stress in farmed finfish. Front. Mar. Sci. 10:1173358. doi: 10.3389/fmars.2023.1173358
Received: 24 February 2023; Accepted: 05 May 2023;
Published: 22 May 2023.
Edited by:
Tillmann Benfey, University of New Brunswick Fredericton, CanadaReviewed by:
Romain Lavaud, Louisiana State University Agricultural Center, United StatesDavid Deslauriers, Université du Québec à Rimouski, Canada
Copyright © 2023 Stavrakidis-Zachou, Papandroulakis and Lika. This is an open-access article distributed under the terms of the Creative Commons Attribution License (CC BY). The use, distribution or reproduction in other forums is permitted, provided the original author(s) and the copyright owner(s) are credited and that the original publication in this journal is cited, in accordance with accepted academic practice. No use, distribution or reproduction is permitted which does not comply with these terms.
*Correspondence: Orestis Stavrakidis-Zachou, b3N0YXZyYWtAaGNtci5ncg==