 Xin Tang1
 Changyan Xu
 Chuanxu Wang
 Jingyao Song
- 1School of Economics and Management, Shanghai Maritime University, Shanghai, China
- 2College of Foreign Languages, Shanghai Maritime University, Shanghai, China
The optimization of empty container repositioning nets has become an essential problem in low-carbon port cooperation. This paper proposed three optimization models of multi-port low-carbon empty container repositioning considering threshold under input and output of empty containers as random variables. Non repositioning strategy means the highest threshold, and complete-repositioning strategy means the lowest threshold; threshold-repositioning strategy is in the middle. The probability of empty-container inventory in each port and the storage cost, repositioning cost, lease cost, and carbon emission cost of empty containers are calculated. This paper mainly compares each cost of three models. The results have shown that: (1) Compared with the non repositioning strategy, the threshold-repositioning strategy and complete-repositioning strategy can reduce the ports storage costs and lease costs of empty containers and also reduce carbon emissions. The lower the repositioning threshold of empty containers between ports is, the more obvious the advantages of the threshold-repositioning strategy become. (2) When the cost of storage per empty container increases, under three strategies, the total cost, storage cost, lease cost, and carbon emission cost of the port will all increase. The ports proportion of dependence on its own empty-container storage will decrease, and the proportion of dependence on other ports and leasing companies will both increase.
1 Introduction
The shipping industry plays an important role in the development of international trade, and more than 80% of international freight is completed by sea (UNCTAD, 2018). International shipping is one of the main modes of international cargo transportation (Xu et al., 2023). However, due to the imbalance of regional trade, improper management of container operations, and many other reasons, the number and flow of containers in the actual operation process also have a certain imbalance. For example, as the world’s largest exporter and the world’s manufacturing center, China mainly exports groceries and dry bulk cargoes, which are large in size but low in value. However, Europe and the USA, as China’s main target markets, also send domestic goods to China, but they mainly export high-tech products with small sizes but high value (Chen et al., 2020). Coupled with the imbalance of international trade, ships often leave with full loads from China but return empty. This has resulted in the accumulation of containers on one side and the lack of containers on the other. A shortage of containers will lead to extra costs. The cost of container storage is mainly due to shipping companies’ necessity to rent containers to meet customer needs or the cost of losing customers due to a shortage of containers. On the other hand, overstocking containers will lead to storage costs and management costs in the storage yard, which all add unnecessary operating costs to shipping companies (Xu et al., 2021a). In order to meet a balance between the supply and demand of containers in both destinations, the most cost-effective method is empty-container repositioning. The demand for empty containers originates from the consignor’s demand for shipment. The inland cargo distribution points near the consignor will transfer empty containers to the consignor’s location. If the quantity of empty containers at the port of shipment cannot meet the needs of the consignor, it is necessary to consider repositioning containers from other nearby ports or to rent containers from local container leasing companies. When the consignor’s empty-container demand is met, the empty containers are loaded with the goods and transported to the port, which is then transported to the destination port by ship and further delivered to the consignee (Yang et al., 2021). As the core node of the port and shipping logistics supply chain, the ports gather a large number of upstream and downstream node information, most of which is container flow information. Therefore, if the port participates in the empty-container repositioning of the shipping company, it can improve the efficiency of the empty-container repositioning by virtue of the advantage of the port information intersection.
With the rapid development of the shipping industry, serious environmental problems have been brought about by economic advances, according to the report of the International Maritime Organization (2014). Global marine transportation consumes about 300 million tons of fuel oil every year. These fuels will emit a large amount of tail gas during the combustion process, including SO2, NOx, CO2, and particulate matter (Wang et al., 2022a; Xiao and Cui, 2023). In particular, the carbon emissions of the shipping industry and their impact on the global environment have been widely discussed (Xiao et al., 2023). Building a low-carbon port and a low-carbon shipping network has become a hot topic in the shipping industry as well as in academia. Building a low-carbon container port characterized by resource conservation, environmental friendliness, low energy consumption, and low pollution has become one of the primary tasks of the construction of world-class ports, and the study of energy conservation and emission reduction strategies for container ports has become an urgent need for the construction and development of low-carbon container ports (Trozzi and Vaccaro, 2000). The production and operation of the port are long processes with large total emissions and serious total pollution. The operation process includes all links in the operating system, such as the ships’ entry and exit operations, the dock front operation, the yard operation, and the gate operation (Peng et al., 2018a), involving energy consumption and emission sources such as the ships, the quay bridge, the yard bridge, the container truck, etc. Therefore, the accumulation of too many empty containers in the port will also cause carbon emissions, thus calling for studies on the optimization strategy of empty-container repositioning so as to reasonably arrange all the links of empty-container repositioning and smooth the process of container circulation. Such research will have important implications for global container transportation operators, brokers, consigners, and port owners, and at the same time will be conducive to the construction of a low-carbon and highly efficient port network (Ercan, 2022).
2 Literature review
The statistical results have shown that the shortage of containers will cause obvious losses to trade, and even the USA suffers a weakening in the competitiveness of enterprises in foreign markets due to port congestion and container shortages (Department of Agricultural and Resource Economics, 2022; Xu et al., 2021b). Empty-container repositioning can be completed by both road transportation and sea transportation, mainly with the participation of ports, shipping companies, and leasing companies to reasonably allocate and dispatch empty containers (Shintani et al., 2007; Imai et al., 2009). The traditional studies on empty-container repositioning have mostly focused on the intercontinental empty-container repositioning between the origin port and destination port caused by trade imbalance, which belongs to the interregional empty-container repositioning between the supply and the demand sides, and the repositioning mode is solely sea transportation. Therefore, relevant studies are mainly focused on empty-container inventory and empty-container repositioning optimization. Luo (Luo and Chang, 2019) studied the problem of container inventory management when customer demands change under a multimodal transportation system and discusses the impact of empty-container repositioning on the optimal inventory level. Poo (Poo and Yip, 2019) carried out a dynamic control of the empty-container inventory cost and empty-container dispatching cost in regional transportation and formulated dynamic strategy of empty-container inventory control for shipping companies. Chen et al. (2022) proposed a port empty-container allocation model to optimize the number of self-owned empty containers and leased containers at each inland freight station, and a differential evolution algorithm was developed to solve their simplified model. In the aspect of optimizing empty-container repositioning, Chen (1998) also built a two-stage dynamic stochastic network model for empty-container repositioning by sea, aiming to address the deficiencies of previous research results on the optimization of empty-container repositioning on land. This model divided the empty-container dispatching decision into two steps to operate, which is closer to the actual decision-making situation than the previous deterministic models. In the first stage, the supply and demand of empty containers and the remaining empty-container capacity on board are regarded as deterministic variables. In the second stage, these parameters are changed into random and dynamic variables. Cheang and Lim (2004) dynamically considered the problem of empty-container repositioning in combination with the third-party leasing strategy. They provided a decision support system to solve the problem of empty-container repositioning by using the basic method of network flow. Wang (2017) integrated the inventory cost of containers into the existing liner route network design and studied the inventory cost and empty-container repositioning network. Xie et al. (2017) studied the empty-container repositioning strategy with mutual cooperation between a port and a railway and pointed out that empty-container sharing and cooperation can bring benefits to both sides. Yu (Yu et al., 2018) studied the problem of empty-container repositioning between the port and the hinterland, which is composed of a maritime container terminal and an inland container terminal. The study shows that the supply of empty containers at the port through inland empty-container resource sharing can alleviate the situation of an empty-container shortage at the port. Dong et al. (2020) endeavored to determine the route of each voyage and control the inventory of empty containers at the port of call within a reasonable range. Zhou (Zhou et al., 2020) constructed a two-stage stochastic programming model for empty-container repositioning, and a separable piecewise linear learning algorithm is designed to effectively solve large-scale empty-container repositioning problems. Misra (Misra et al., 2020) proposed a hybrid time discretization method combined with the rolling time domain strategy to solve the complex multi-period marine inventory routing problem. Song (Song et al., 2022) established a two-stage particle swarm optimization algorithm to compare parameters such as the total cost of the empty container, storage costs, lease costs, and optimal storage of empty containers in ports under a repositioning strategy and a nonrepositioning strategy. Zhang et al. (2022) introduced the structural hole theory, using the port of Las Palmas as an example, proving that the port occupying the position of the structural hole can become a regional hub by acting as a connecting bridge, which provides a basis for the repositioning decision-making of shipping companies and ports from a new perspective. Yoonjea and Gwang (2023) proposed a new integer linear programming model for the location problem of reliable facilities for folding containers in order to reduce the repositioning of empty containers and achieve cost savings and low-carbon transportation and operation profits for ports. The inventory of empty containers at the port is an important factor influencing the selection of an empty-container repositioning strategy at ports. However, these papers do not consider the impact of changes in the storage volume of empty containers at ports on the repositioning strategy.
The construction of low-carbon ports is the key to energy conservation and emission reduction in the shipping industry (Rajasekar et al., 2014; Wang et al., 2022b). At present, many scholars have studied port management from different angles and obtained some meaningful results. Port operation is a typical research direction in the shipping industry, and its decision-making includes berth allocation (Xu et al., 2022), quayside bridge dispatching and distribution (Correcher et al., 2018), field bridge dispatching and distribution (Galle et al., 2018; Peng et al., 2018b), and internal card dispatching (Tang et al., 2014). For example, based on the top-down model and taking into account factors such as engine power, load factor, and fuel emission factor, it is found that the carbon dioxide emissions from ship berthing activities account for the majority of the total emissions of container port ships (Muhammad et al., 2022). On the basis of considering fuel consumption and emissions, relevant studies on low-carbon port operations still follow the same academic ideas as traditional port operations and focus on the abovementioned decision-making issues. On the other hand, the optimized dispatching of container trucks is an important way to achieve energy conservation and emission reduction in ports. The optimized dispatching of container trucks is an important way to achieve energy conservation and emission reduction in ports. Taking a container port as an example, Esmer et al. (2010) used the method of system simulation to study the optimal configuration of container trucks in the yard to achieve the low-carbon and energy-saving requirements of the port. Li et al. (2018) also wielded the method of system simulation to study the optimal scheduling and management of the trucks to reduce the waiting time of the truck queue and then reduce the carbon emissions of trucks. Chen (Chen et al., 2013), taking the arrival quantity and waiting time of container trucks as the optimization objective, studied the influence of the arrival pattern of container trucks on pollution emissions by using queuing theory and mathematical programming methods. Schulte et al. (2017) deployed a mathematical programming method to optimize the booking arrival model of container trucks to reduce the CO2 emissions of empty-container trucks. By using the simulation method, Peng et al. (2018b) calculated the optimal configuration of trucks and concluded that CO2 can be reduced when the ratio of quayside bridge to truck reaches the optimum. Based on GA and PSO, a hybrid optimization algorithm is designed to solve the joint scheduling problem of the quayside bridge, internal truck, and field bridge. The goal is to avoid ship delays and minimize energy consumption in the operation process (He et al., 2015). Zhao et al. (2018), taking the cost of carbon emissions into account, studied the impact of random demand and supply changes on empty-container repositioning in the context of sea-rail intermodal transport. Liu et al. (2019) established a system dynamics model for modular operation. Taking the line from Caofeidian Port to Tangshan City as an example, through a series of process interventions, the long-term impact of the collection and distribution system under different environmental policies was evaluated, and effective suggestions for reducing environmental pollution were put forward. Tao and Wu (2021) introduced “yard-door-port” into a generalized analytical framework to analyze the carbon emissions from the movement of loaded containers and the repositioning of empty containers. Guo et al. (2022) constructed a carbon emission estimation model of a container multimodal transport network based on the hinterland and carried out a case study of Shanghai Port and the hinterland of the Yangtze River Delta. Olgay (2023) estimated the total carbon emissions generated by container handling equipment used in container port operations and planned carbon emission reduction strategies related to climate change adaptation policies. Container repositioning and storage are important sources of carbon emissions at ports. In the process of implementing a low-carbon development strategy for ports, empty-container transportation and storage should be considered. Currently, there are few documents that study this convenience.
Generally speaking, after combing so much literature, we can conclude that most of the studies on ports’ low-carbon empty-container repositioning mainly focused on multimodal transport, coordination between seaports and dry ports, truck allocation, etc., rarely paying attention to the relationship between port empty-container input and output or to the impact of empty-container inventory changes and empty-container repositioning on port operating efficiency and carbon emissions. Moreover, strengthening the cooperation in empty-container repositioning, the port group should also consider the restrictions on other ports to carry out empty-container repositioning in order to meet their own empty-container demand. Having summed up the existent studies, in our work, we consider the input and output of containers as random variables under the goal of low-carbon port construction. The port determines the optimal upper limit of empty-container storage and sets up a repositioning threshold for empty containers, with the goal of the lowest total cost. The total cost includes the storage cost, repositioning cost, lease cost, and carbon emission cost of empty containers. Therefore, our work is helpful to optimize the port container repositioning network and to promote the low-carbon development of the port. At present, we have not found any paper that considers the optimization of an empty-container repositioning network at a threshold or involves the probability of a change in empty-container storage capacity at the port. Therefore, this work attempts to bridge a gap on this issue.
3 Model formulation
3.1 Model of port empty containers under threshold-repositioning strategy
3.1.1 Problem description
The goal of ports is to minimize the total cost of empty containers, which includes storage costs, repositioning costs, leasing costs, and carbon emission costs. When there is a shortage of containers in the port, the nearest port will be preferred as the source of empty containers. When all the cooperating ports are unable to transfer empty containers, this port can only rent empty containers from the leasing company. For example, if the port encounters a lack of containers, set as the xth source port of port , then will first turn to port to send an empty-container repositioning request. If the empty-container storage capacity in port is higher than , then empty-container repositioning to can be carried out. If it is lower than , port will turn to to send an empty-container repositioning request, etc. When all ports are unable to help port , it can only seek help from the empty-container leasing company. The abovementioned specific steps are shown in Figure 1.
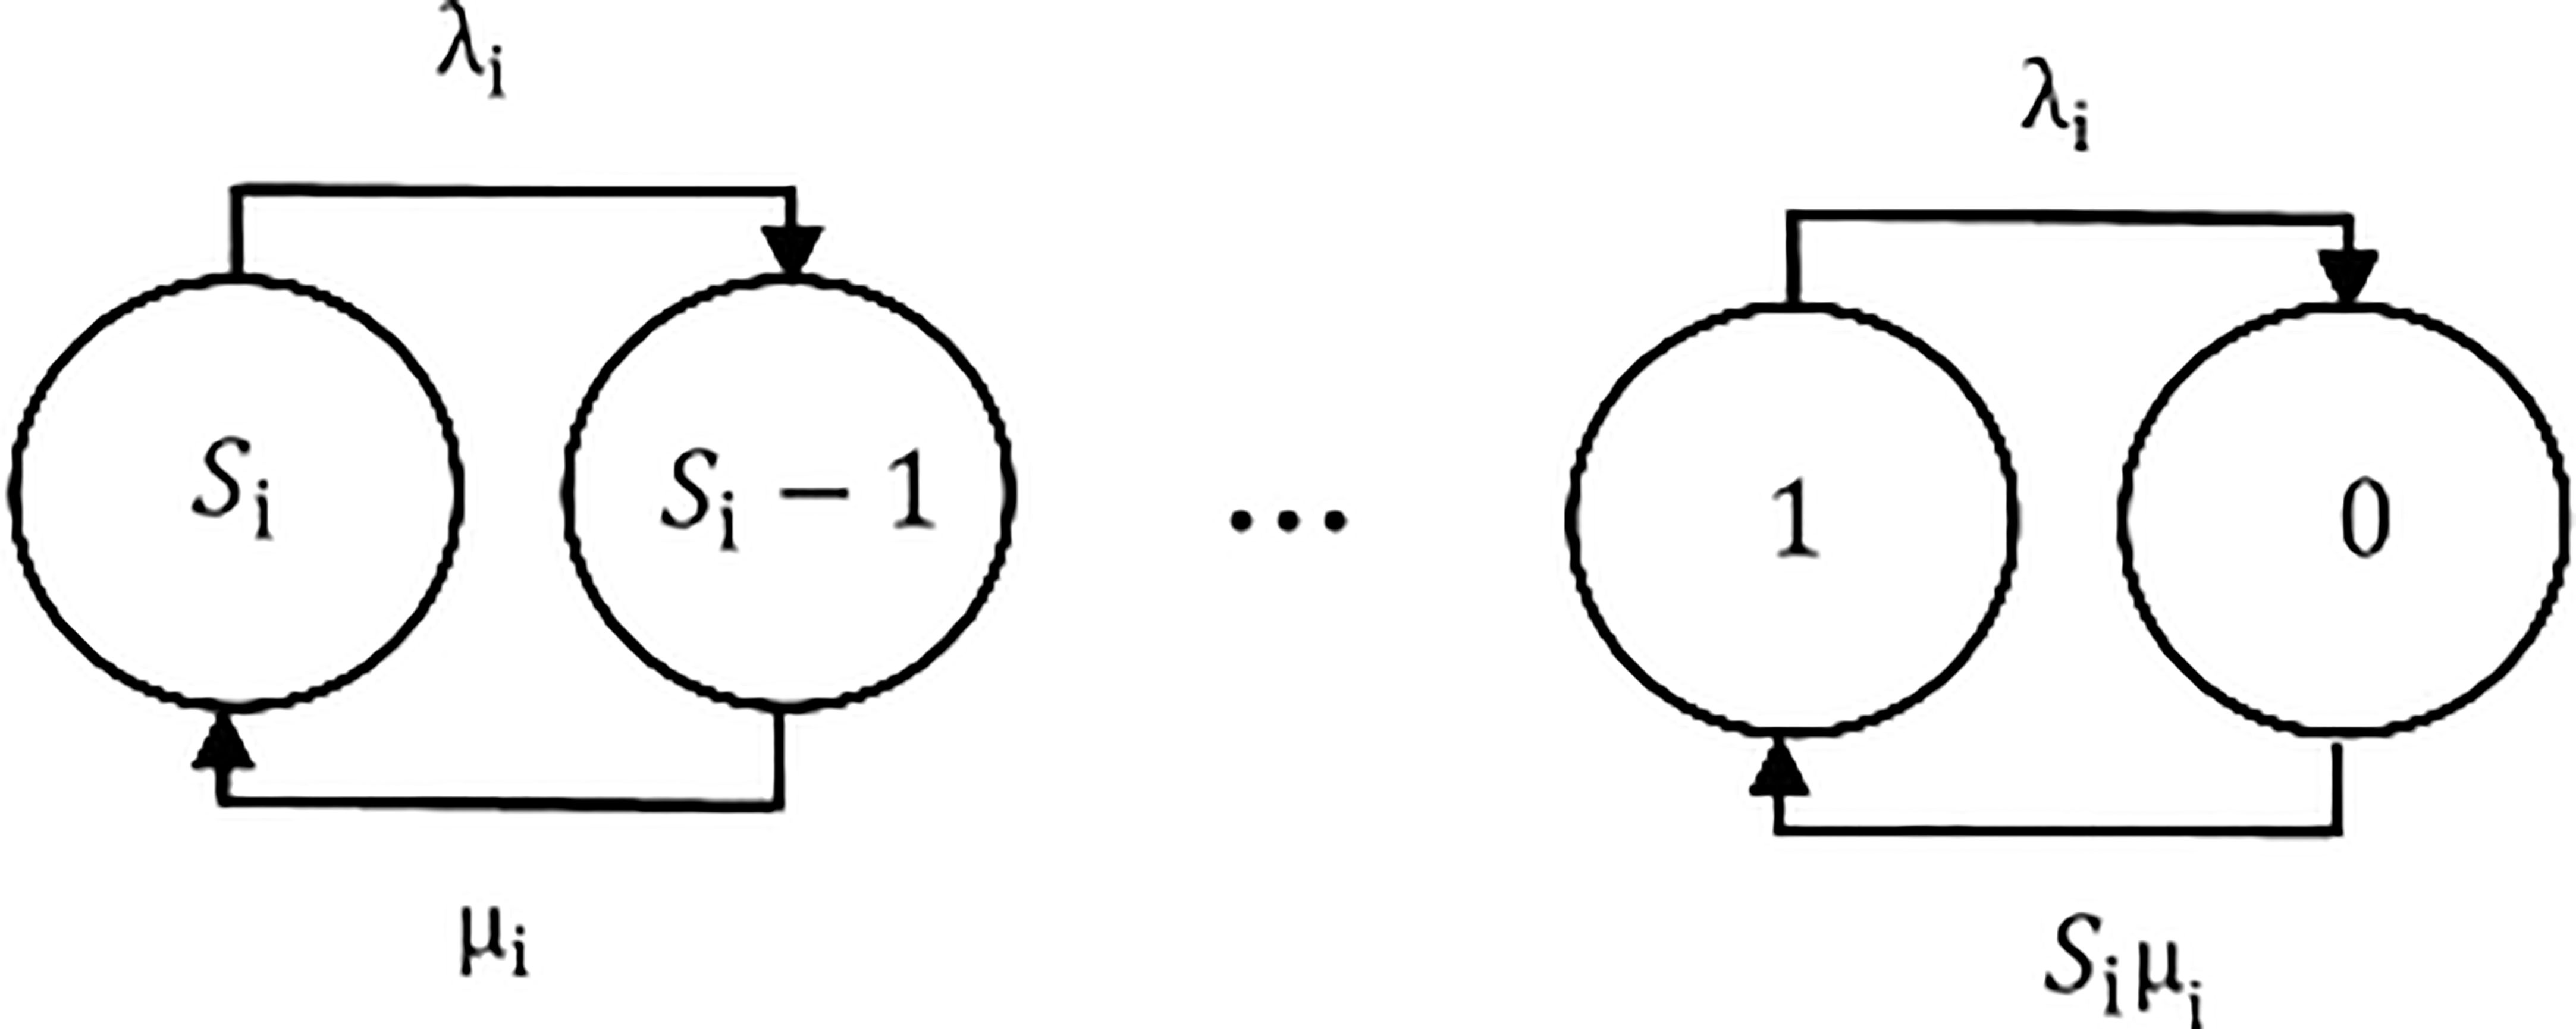
Figure 1 Empty-container repositioning order of port i.
Before starting the calculation, we define our variables and parameters first as follows:
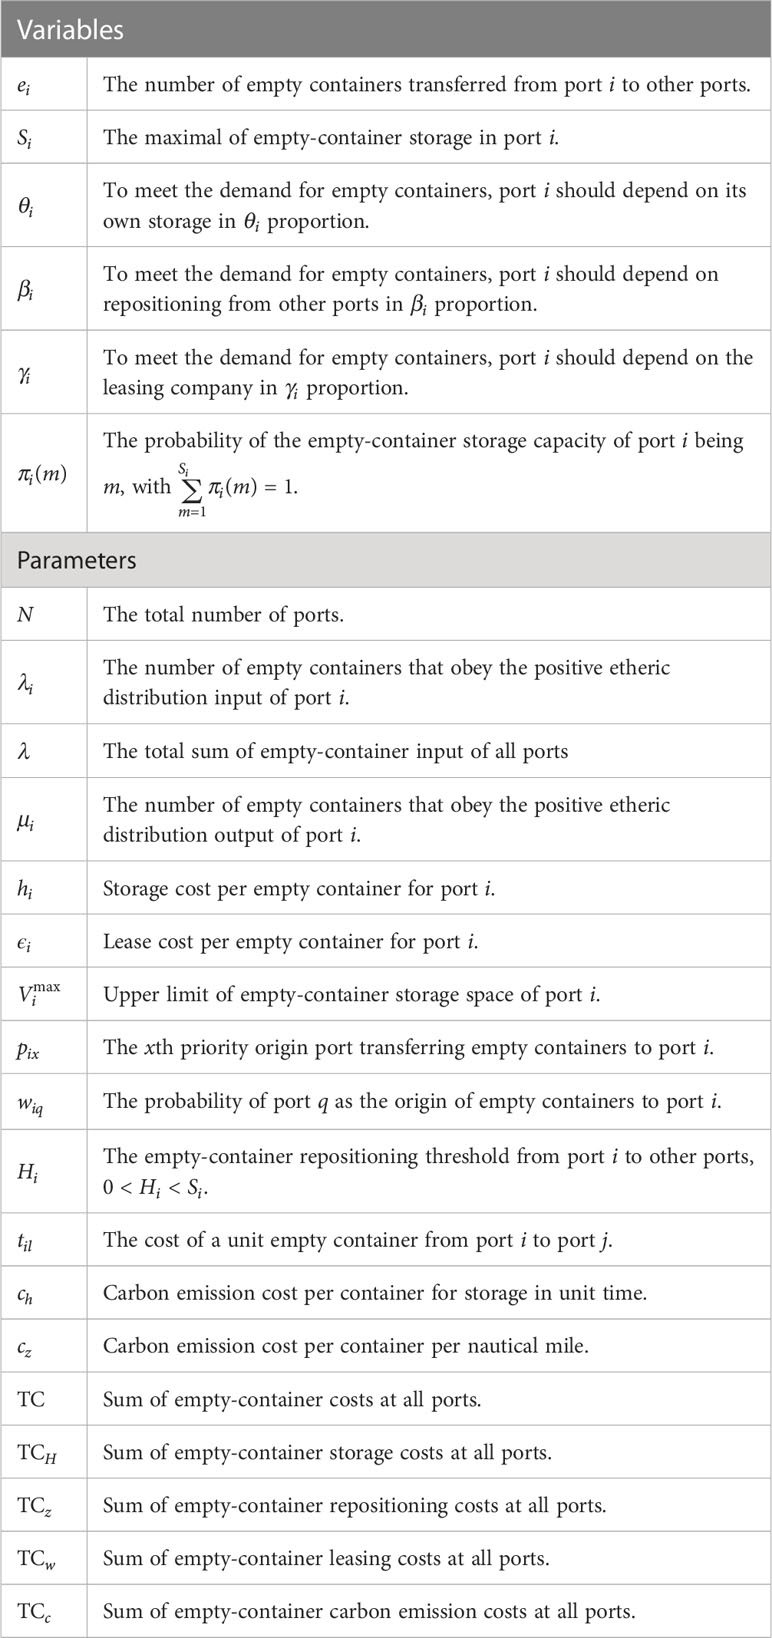
This study brings up three basic assumptions:
(1) The storage costs are the same inside and outside the yard of ports.
(2) Every port has one single empty-container leasing company.
(3) The repositioning per empty container between ports is proportional to the distance.
(4) The empty container is TEU, which is 20 HP.
Next, we calculate , , and and every cost of each port. For port i, its empty containers are continuously in input and output. So when the empty-container storage status of port i is D, it is influenced by both D+1 and D−1. When the empty-container storage of port i is higher than , repositioning of empty containers can be carried out, and when it is lower than , to meet the future need of itself, port i will stop the repositioning to other ports. Under the threshold-repositioning strategy, the change of empty-container storage in port i is shown in Figure 2:
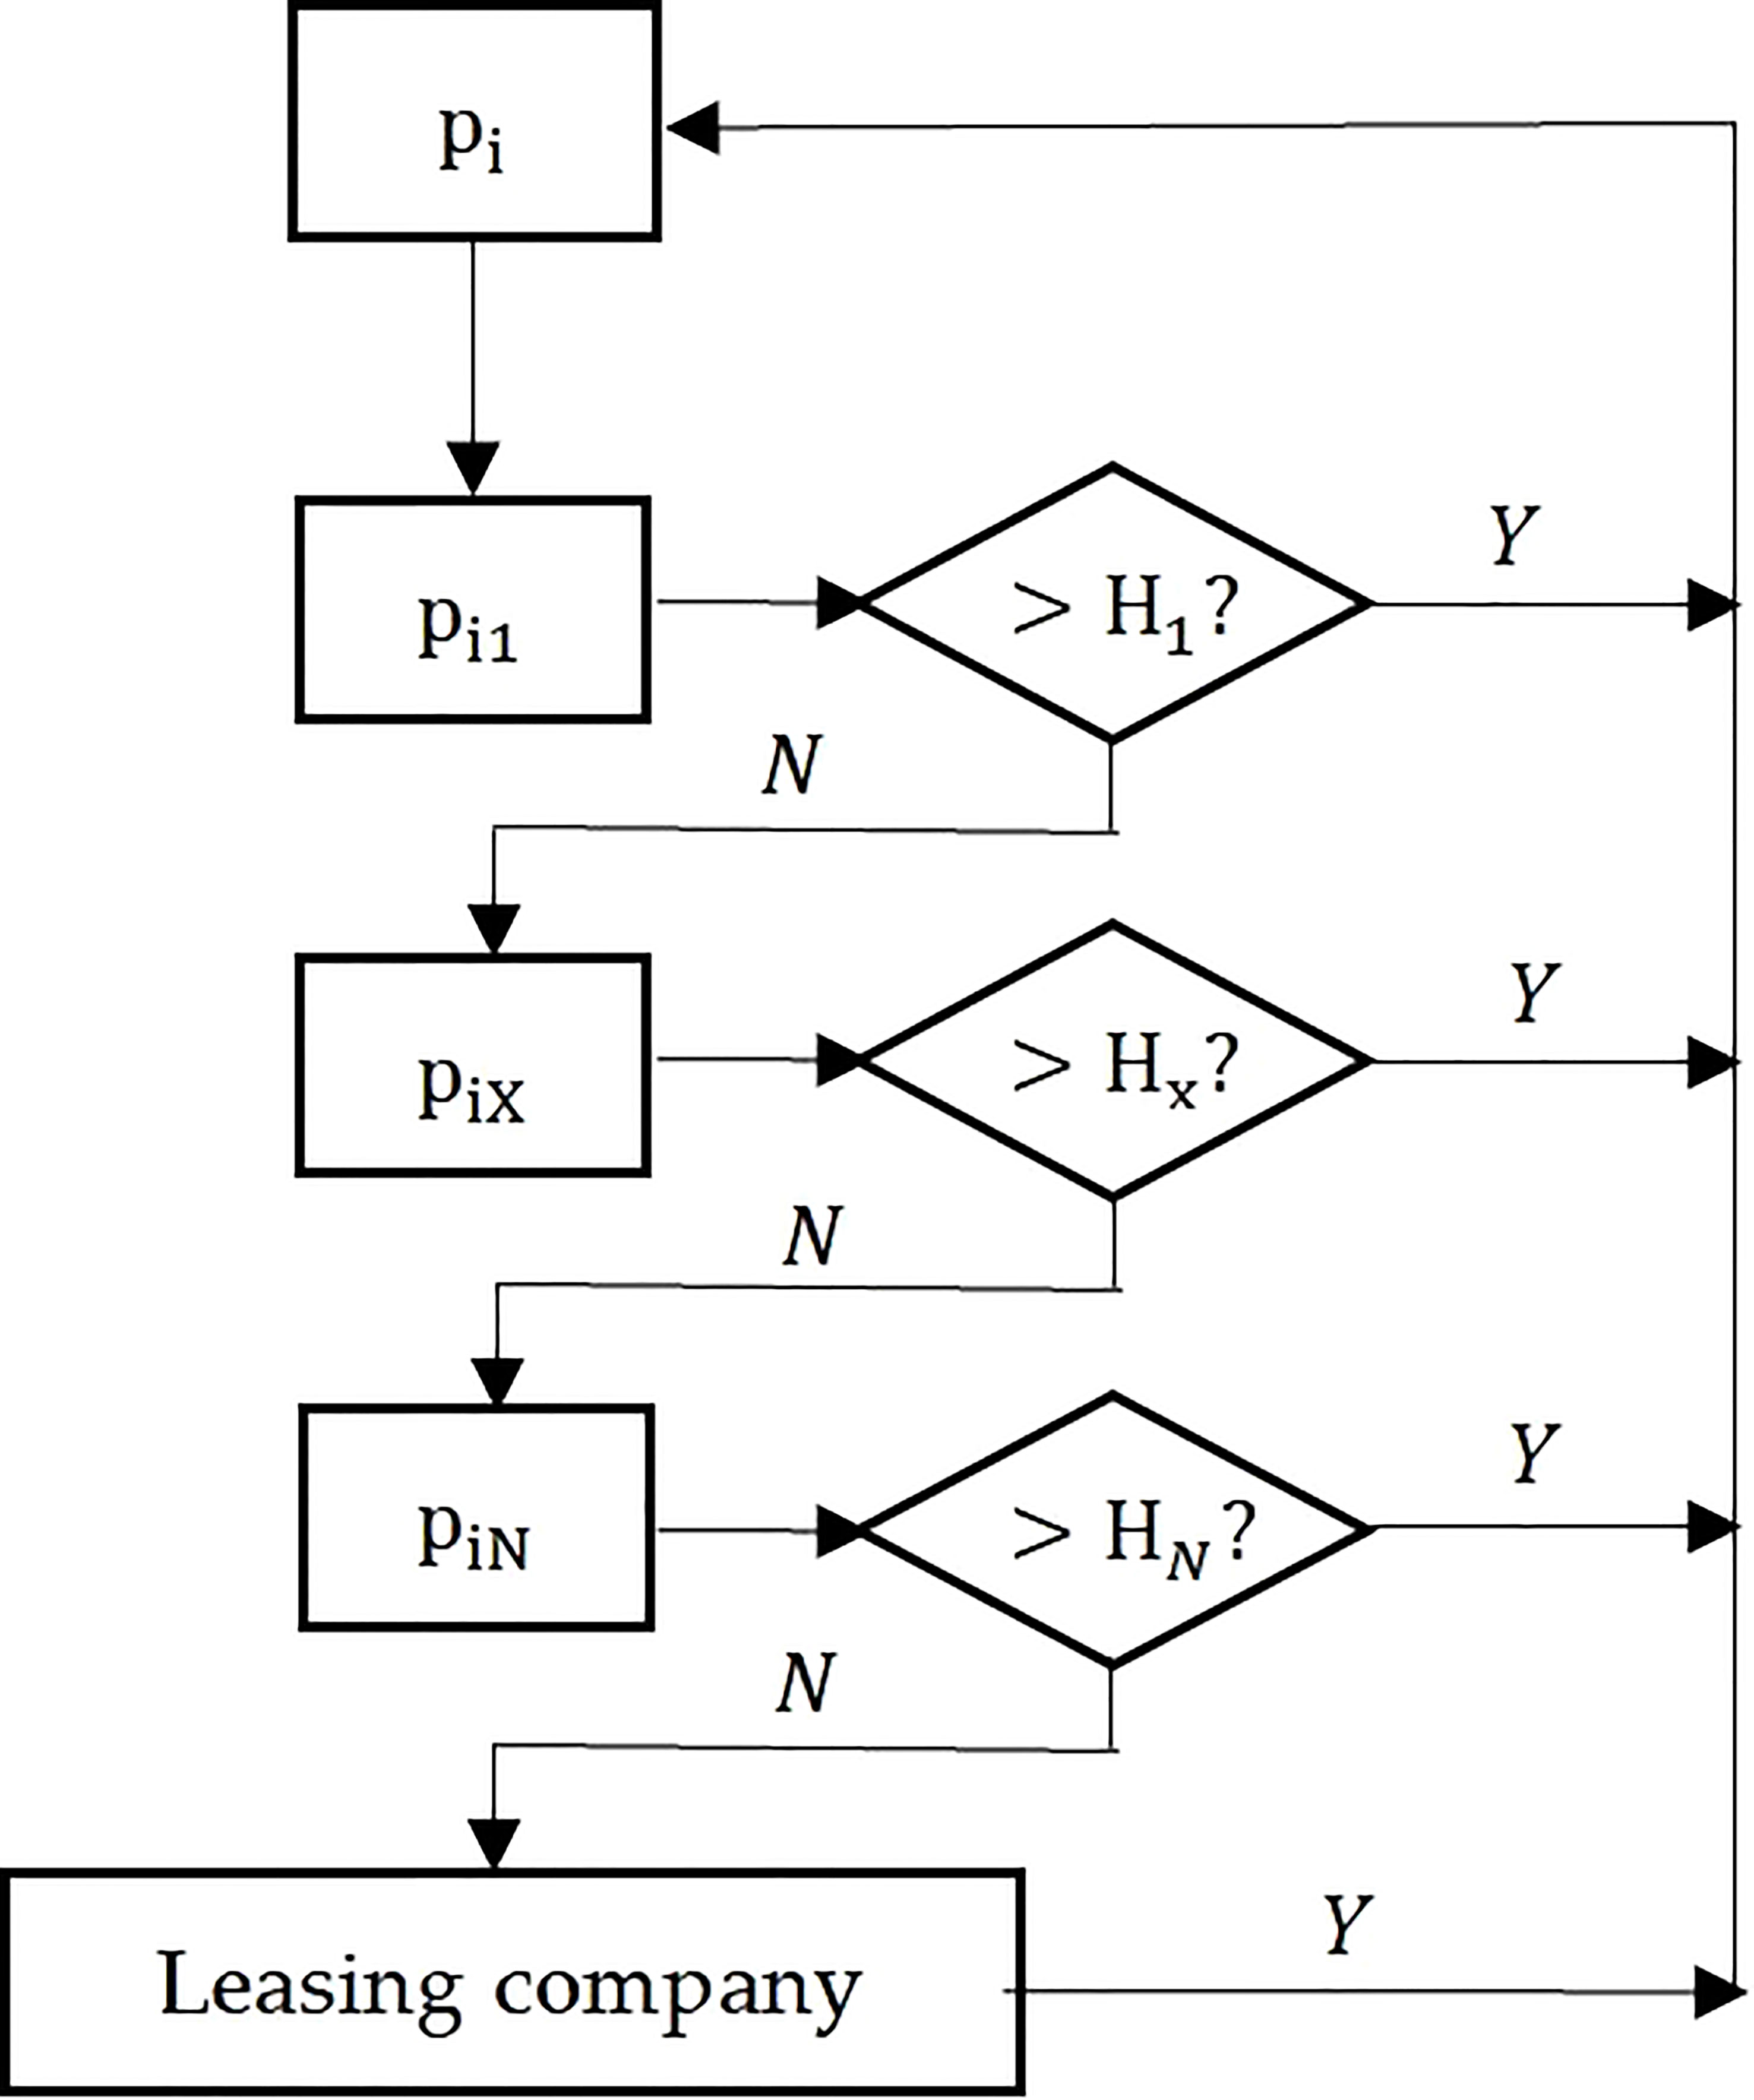
Figure 2 Change of empty-container storage in port i under the threshold-repositioning strategy.
For the convenience of calculation, setting as the total sum of empty-container input of all ports, then . The empty-container input of port i takes a ratio of in all ports, and . So we have:
At the same time, . As shown in Figure 2, we can calculate that:
Using formulas (2)–(6), it is then easy to get:
Since , it can be acquired that:
When the empty-container storage in port i is higher than 0, it can meet the demand for empty containers by itself, so we have:
Because all the ports will take threshold-repositioning strategy in priority, obviously only when all the ports have a 0 storage of empty containers will they decide to rent them from a leasing company. We get . Set to be the sum of empty-container input from all the ports, to be the sum of empty-container output from all the ports, and to be the sum of empty-container storage of all the ports, then:
Because , .
As for the total costs of empty containers in a port, they include storage cost, repositioning cost, lease cost, and carbon emission cost, which we will calculate in the following.
The empty-container storage cost of port i is correlated to the storage volume as well as its probability, which in detail is . So the sum of empty-container storage at all ports is calculated as:
The repositioning cost of port i is determined by repositioning volume and transferring the cost from port i to l is , so the repositioning cost of port i is . Thus, the repositioning cost of all ports is:
The empty-container lease volume of port i is , so the lease cost of port i is , from which we can get the total empty-container lease cost of all ports:
The empty-container carbon emission cost of port i is , and the carbon emission cost from empty-container repositioning between ports is , so the empty-container carbon emission cost at all ports is:
Therefore, the total cost model of all ports’ empty-container repositioning under the threshold-reposition strategy is as follows:
s.t.
3.2 Model of port empty containers under nonrepositioning strategy
If the ports do not adopt the cooperation mode of empty-container mutual repositioning, they can only meet the empty-container demand through their own empty-container inventory or through an empty-container leasing company. Compared with the threshold-repositioning strategy, the change of empty-container storage in the port is also relatively simple. See Figure 3 for the specific change:
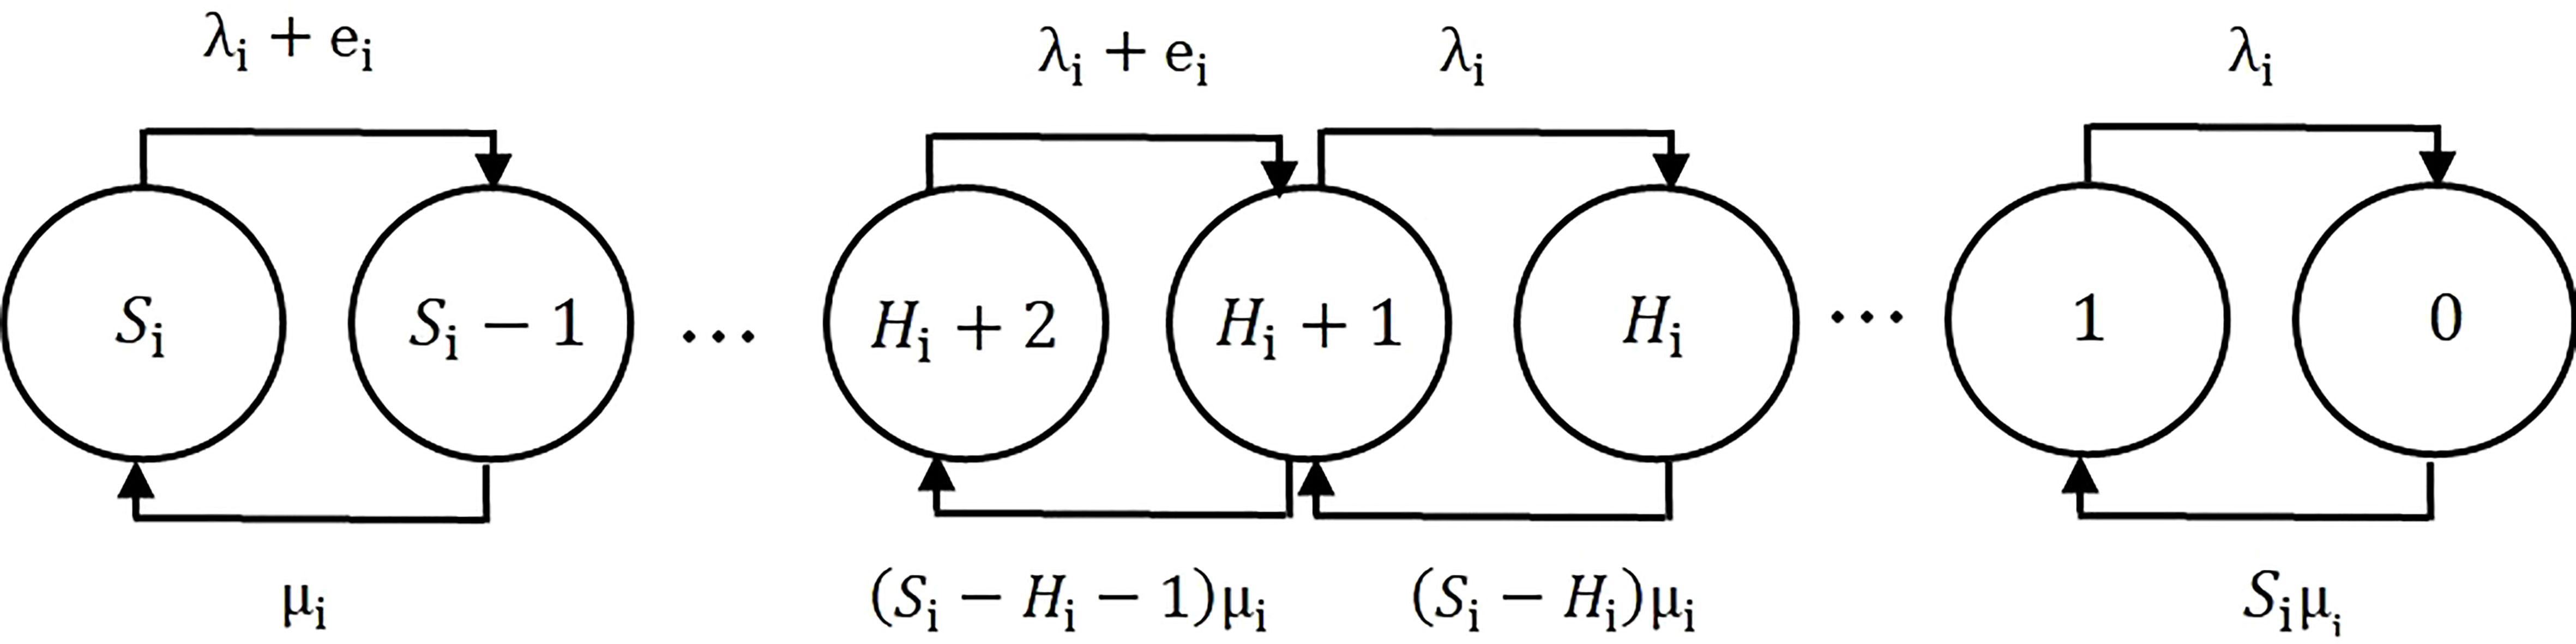
Figure 3 The change of port i empty-container storage under the nonrepositioning strategy.
Similar to the situation under the threshold-repositioning strategy:
According to formulas (28), (29), and (30), since , it can be acquired:
Also similar to that under the threshold-repositioning strategy, when the empty-container storage of port i is higher than 0, the need for an empty container can be met through the port’s own storage, so . When the empty-container storage of port i is 0, it can rent empty containers through a leasing company, so and . The total cost model of ports’ empty containers under the nonrepositioning strategy is as follows:
Min
s.t.
3.3 Model of port empty containers under complete-repositioning strategy
In this section, we propose a third strategy: the complete-repositioning strategy. Compared to the threshold-repositioning strategy, ports under the complete-repositioning strategy do not have a threshold for repositioning, which means that even if there is only one empty container in storage in a port when another port sends a request, the port will transfer this single empty container out anyway. Under this strategy, the change in empty-container storage of the port can be seen in Figure 4.
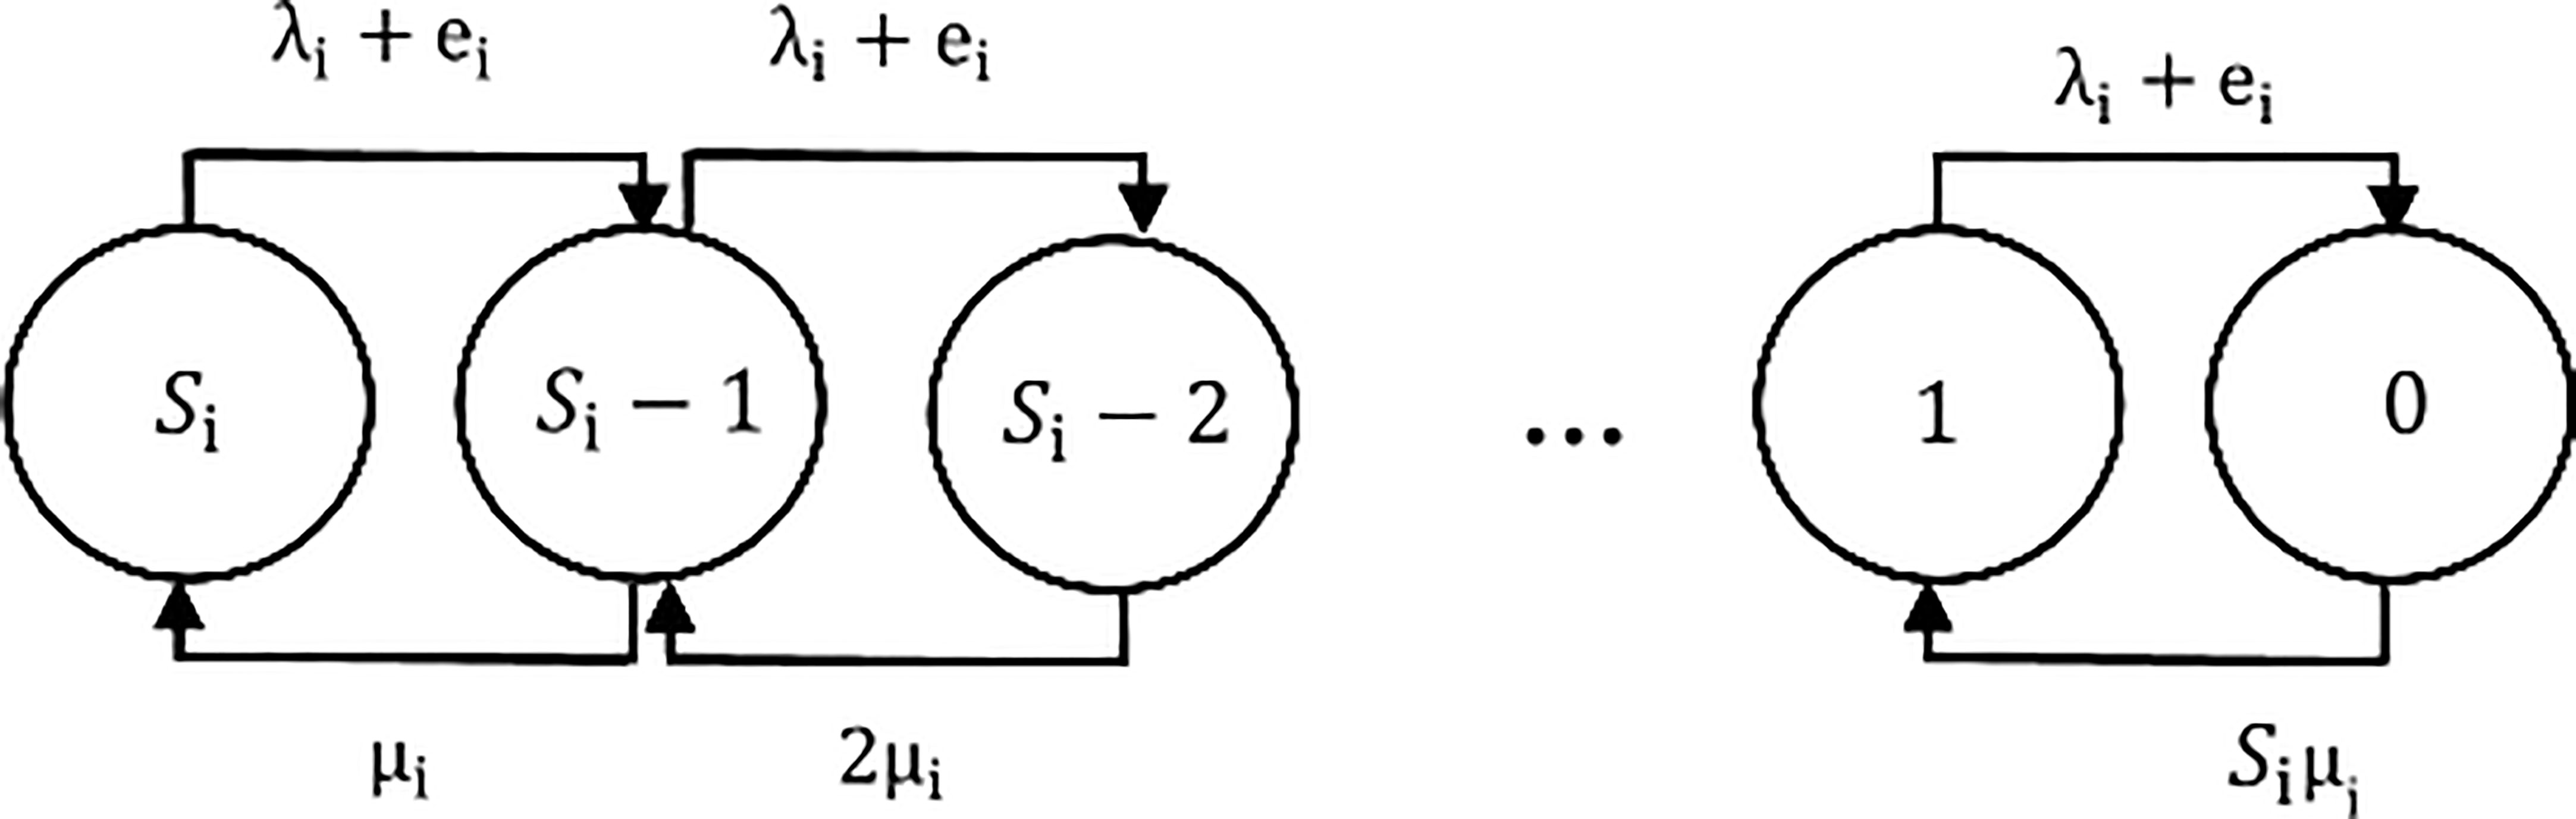
Figure 4 Change of empty-container storage in port i under the complete-repositioning strategy.
According to formulas (2), (3), and (4), it is known that:
The total cost model of ports’ empty containers under the complete-repositioning strategy is as follows:
Min
s.t.
Theorem 1: Port i depends more on its own storage to meet the demand for empty containers under the nonrepositioning strategy, followed by the threshold-repositioning strategy, and finally the complete-repositioning strategy.
Prove: If ct represents the complete-repositioning strategy, tr represents the repositioning strategy, and nt represents the nonreposition strategy, we can deduce from formulas (31) and (32) that:
Therefore, when . When , and we know that
Because , we have , and , so .
According to theorem 1, we know that the higher the repositioning threshold, the higher the dependence of the port on its own empty-container inventory. The lower the repositioning threshold is, the more help other ports can provide, which requires a higher degree of cooperation between port groups.
4 Model solving
For threshold-repositioning strategy and complete-repositioning strategy, the calculations of , , , and are quite complicated. Taking threshold-repositioning strategy for an example, according to formula (1), it can be known that the calculation of requires the definition of and . However, to get and , we should first clarify . However, the expression of includes . Therefore, this study decided to use the cycle computation method to acquire , , , and . Also, the same method is used in the calculations of the complete-repositioning strategy’s parameters. The specific steps are as follows:
Step 1: Initialize .
Step 2: Set a big enough positive integer, Maximum, and a minimal integer, , and start cycle computation.
For (l = 1; l<= Maximum; l++) {
if () {break}; }
5 Computational experiment
5.1 Data setting
We take China’s Yingkou Port, Dalian Port, and Yantai Port as the actual research cases. These three ports are all located in Bohai Bay, and there is a cooperative relationship between the three ports for empty-container repositioning. In 2022, the container throughput of the three ports will be 5.00 million, 4.46 million, and 412 million TEU, respectively, and the average monthly throughput will be 416.7, 371.7, and 353.3 K TEU. The upper limit of empty-container storage can be set to 1/2 of the monthly throughput. Ships are used for empty-container repositioning between ports, and the freight rate is $0.5/n mile. See Table 1 for the distances among the three ports and the repositioning costs.
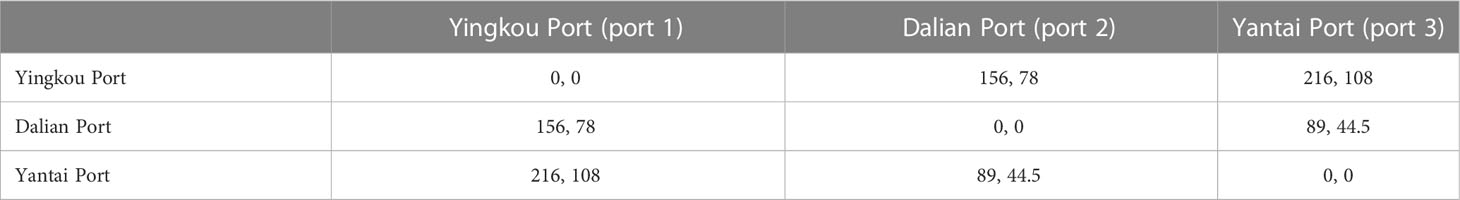
Table 1 Distances and repositioning costs among three ports (n mile ($)).
The empty-container storage charge in each port is $0.1/h, and generally, the storage period is 10 days, so the storage charge is $24. According to the statistics of Container xChange in December 2022, the rental fee for empty containers is $804, and the general round-trip time of the route is 40 days, so the rental fee within 10 days is $201. The upper limit of the total scale of the port’s front yard and the rear yard is one-twelfth of the annual throughput. Set , in which , =1$/TEU, =0.5$/TEU.
The other data of the three ports are shown in Table 2:
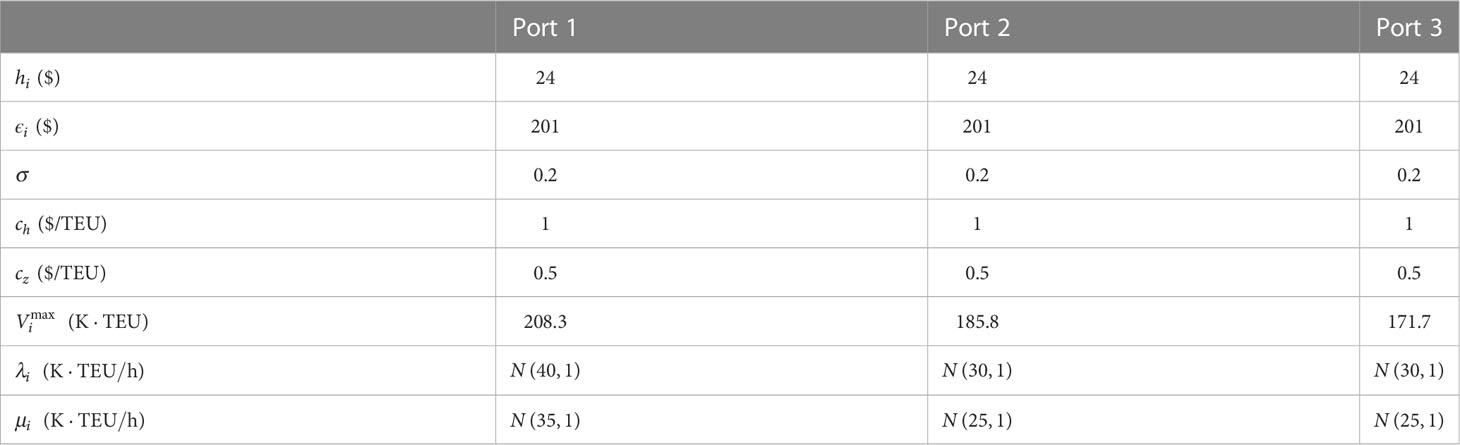
Table 2 Other data of the three ports.
Because of the complexity of this model, we chose the genetic algorithm as our method. Using MATLAB 2018, the results are shown in Table 3:
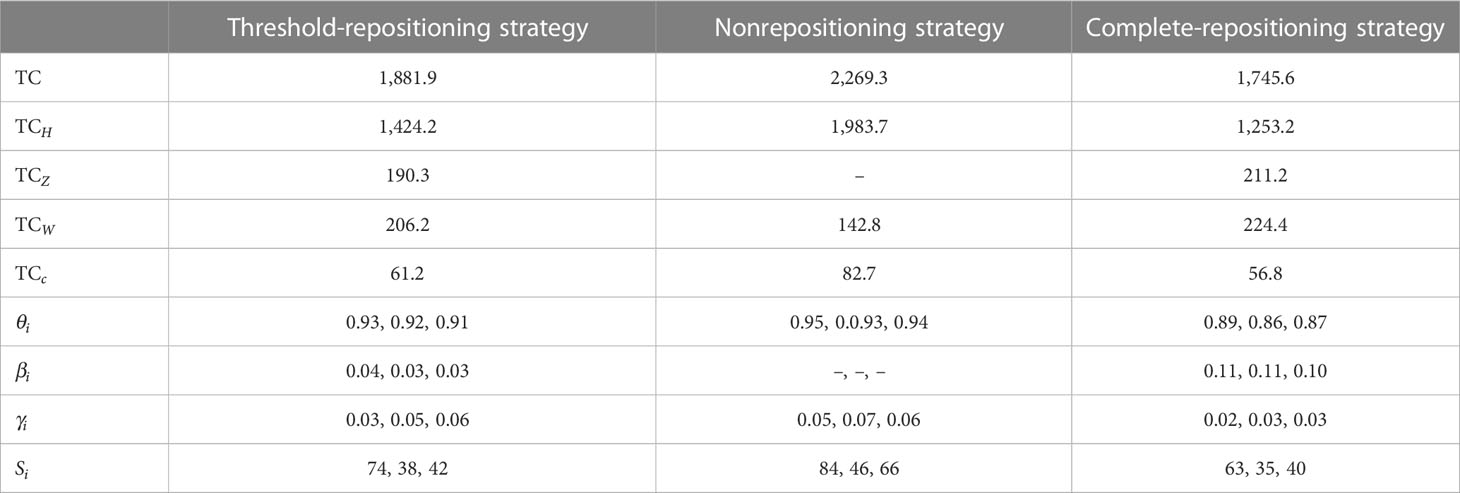
Table 3 Results from two strategies.
According to Table 3, it can be seen that under the complete-repositioning strategy, the total cost, carbon emission cost, and empty-container storage are all at the lowest level, while they are higher under the threshold-repositioning strategy and the highest under the nonrepositioning strategy. This is because, under both repositioning strategies, the port can reduce its own storage by sharing empty containers, thus realizing the target of reducing storage costs and sharing the risk of lacking containers. Since under the threshold-repositioning strategy and complete-repositioning strategy, the empty-container storage is lower than that under the nonrepositioning strategy, the ports need to meet the demand for empty containers more through leasing and repositioning means, so the lease cost and repositioning cost will both surpass those under nonrepositioning strategy. Simultaneously, the proportion of meeting demand through the ports’ own storage under the nonrepositioning strategy is the highest among the three strategies, which proves Theorem 1.
5.2 Data analysis
The key variables that influence the port’s choice of repositioning strategy are and , so in this section, we try to analyze them. The influence of the change of on three strategies are shown in Table 4:
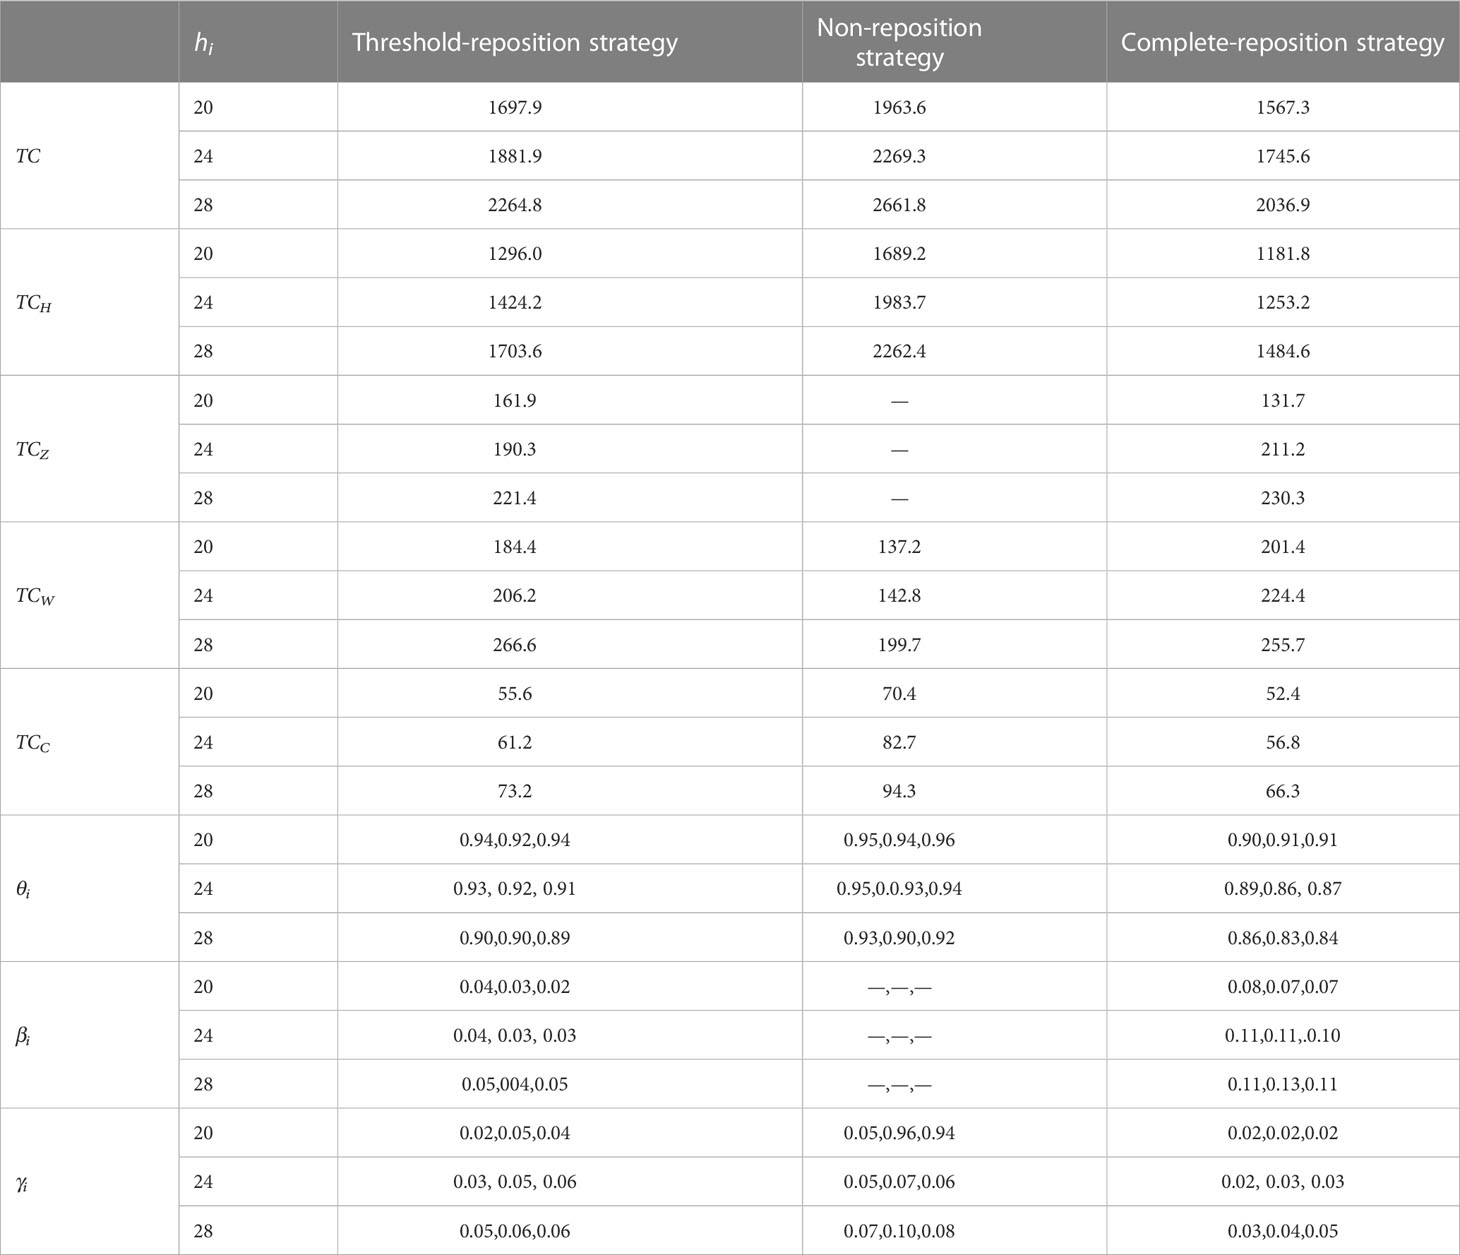
Table 4 Analysis of the influence of the change of hi‘s on three strategies.
The increase of means the increase in the storage cost of unit empty containers in ports. In terms of Table 4, with the increase of , the total cost, storage cost, lease cost, and carbon emission cost of ports will all increase under the three strategies. For the proportion of empty-container sources, that depending on the port’s own storage will decrease, yet those depending on other ports as well as on leasing companies will both increase because when the storage cost of a unit empty-container increases, the port has to reduce its own storage, thus enhancing its dependence on other ports and on the leasing company.
The influence of ‘s change on three strategies is shown in Table 5:
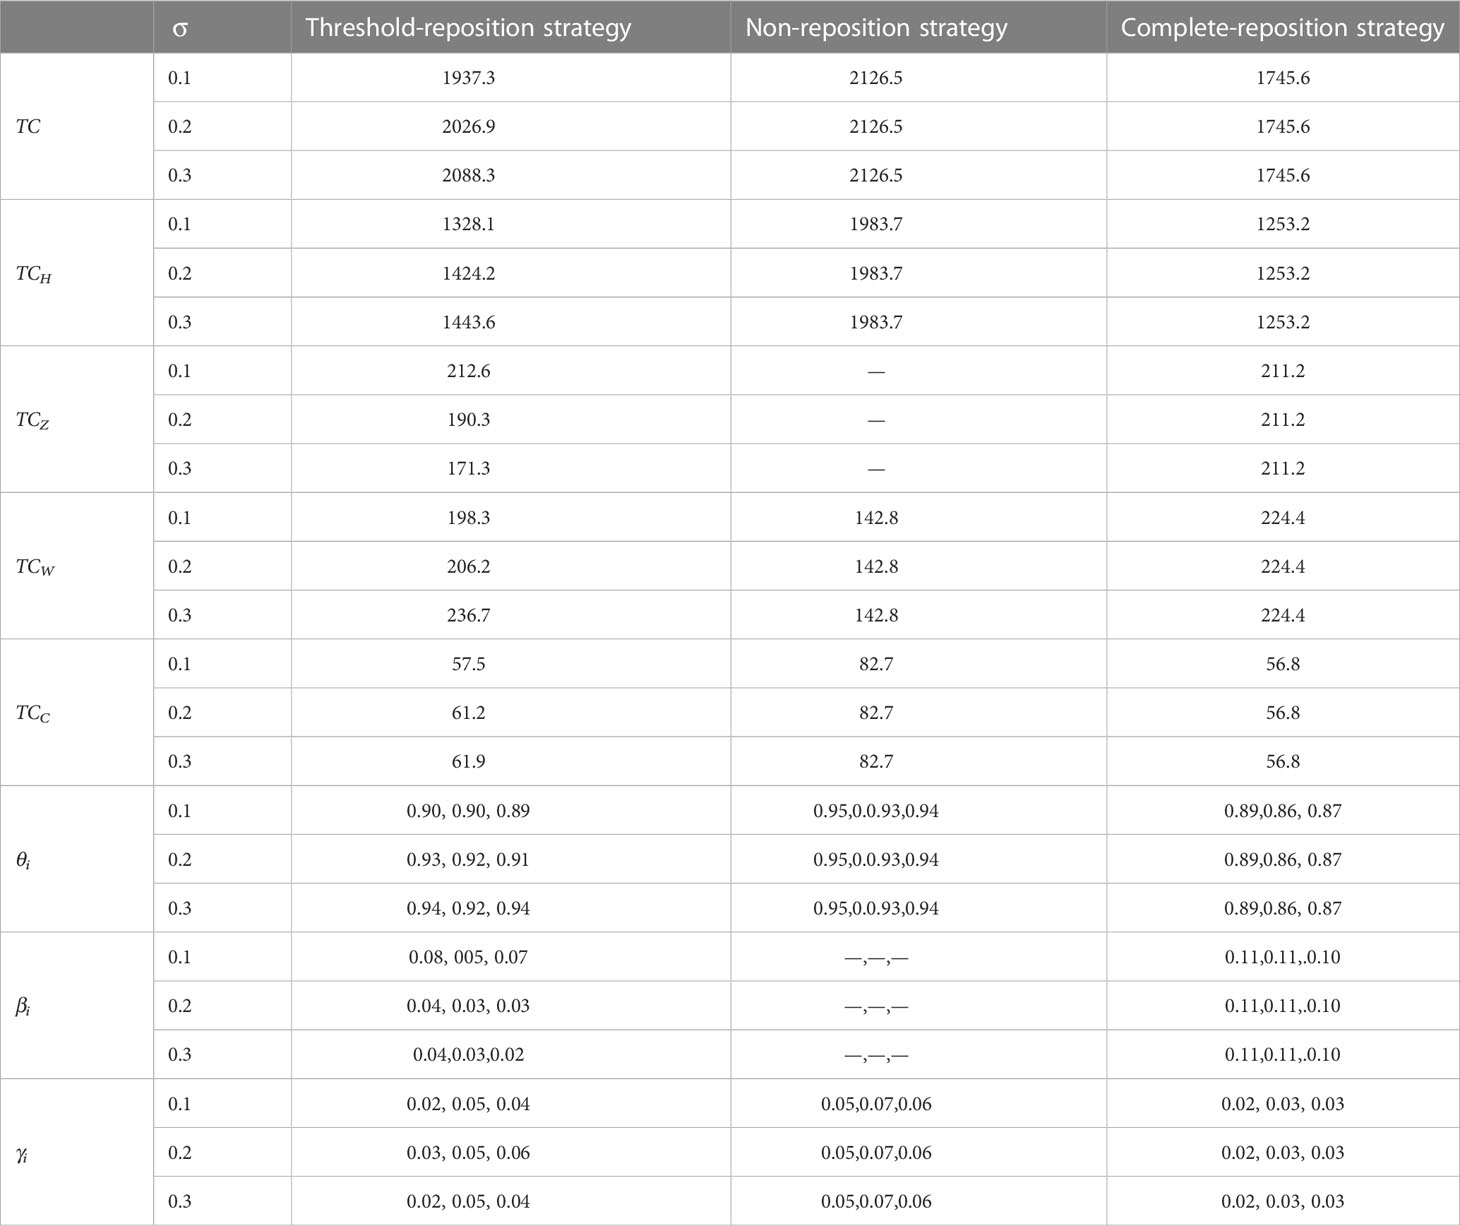
Table 5 Analysis of the influence of σ ‘s change on three strategies.
The higher is, the higher becomes, which means a higher barrier between ports for empty-container repositioning. According to Table 5, with the increase of , the total cost, storage cost, lease cost, and carbon emission cost of ports will all increase under the threshold-repositioning strategy. As to the proportion of empty-container sources, those depending on their own storage and ports will increase, while those depending on leasing companies will decrease. This is due to the fact that the higher the repositioning barrier, the advantage of the threshold-repositioning strategy becomes less obvious compared to the nonrepositioning strategy.
6 Conclusion
The unbalanced distribution of empty containers among ports has become one of the most important adverse factors affecting the normal operation of ports. Strengthening the cooperation of empty-container repositioning between ports is of great significance for improving port efficiency and is also conducive to the construction of low carbon ports. We have built three optimization models for empty-container repositioning between multiple ports, taking into account that the input and output of empty containers are random variables and that there is a threshold for the port to transfer empty containers. We calculated the probability of the empty-container inventory of each port, calculated the probability that the port depends on its own empty-container inventory, on other ports, and on leasing companies, respectively, to meet the empty-container demand, and calculated the costs of port empty-container storage, repositioning, leasing, and carbon emission. The port costs under the threshold-repositioning strategy, nonreposition strategy, and complete-repositioning strategy were also compared. The main conclusions of this paper are as follows:
(1) For the costs of ports, the empty-container storage of the port is the lowest under the nonrepositioning strategy, followed by the threshold-repositioning strategy. So the port can only lease more empty containers or meet the demand through repositioning from other ports, causing higher leasing costs; repositioning costs under the complete-repositioning strategy are the highest among the three strategies. However, the total cost of the port is the lowest under the complete-repositioning strategy. The increase in unit empty-container storage cost of the port will lead to an increase in total cost, storage cost, lease cost, and carbon emission cost under three strategies. Also, the higher the barrier blocking empty-container repositioning between ports is, the higher the total cost, storage cost, repositioning cost, and carbon emission cost there will be.
(2) For the probability that the port will choose each kind of empty-container source, under the nonrepositioning strategy, it will depend more on its own storage and leasing company than under the threshold-repositioning strategy and complete-repositioning strategy. When the unit empty-container storage cost increases, the ports will depend less on their own storage and more on other ports as well as the leasing company. Also, the higher the barrier for repositioning is, the less the port will depend on its own storage and on other ports, while depending more on the leasing company.
From the above, we can conclude that the repositioning strategy can efficiently reduce the total cost of empty containers for the port and reduce carbon emissions. The lower the repositioning barrier between ports is, the more obvious the advantages of the repositioning strategy become.
The study in this paper still has some limitations. For example, in the calculation of empty-container storage cost, we take the storage charge as a constant, yet it is actually not so in reality. As a matter of fact, the ports will often give some days without charging and then take charges after a certain period of time, which is not indicated in this study. We have not considered the time limit for empty-container repositioning between ports. In practice, due to strict shipment date constraints, empty-container repositioning at the port should have a time window. In future research, we hope to carry out further exploration in the following aspects: First, consider the time of the empty container stored in the port, because the storage charge is relevant to the time. Second, to include the shipping company in our optimization model of empty-container repositioning, adding a repositioning responding time limit to the situation of the sailing date. Third, it should be reflected in the model that, according to carbon-reducing policies, only when the carbon emissions exceed a certain level will the government levy a carbon tax on ports.
Data availability statement
The original contributions presented in the study are included in the article/supplementary material. Further inquiries can be directed to the corresponding author.
Author contributions
XT designed the study and performed the research. CX performed the data analysis. CW performed the validation. JS wrote the manuscript. All authors contributed to the article and approved the submitted version.
Funding
This research was funded by the National Natural Science Foundation of China, grant number 71974123.
Conflict of interest
The authors declare that the research was conducted in the absence of any commercial or financial relationships that could be construed as a potential conflict of interest.
Publisher’s note
All claims expressed in this article are solely those of the authors and do not necessarily represent those of their affiliated organizations, or those of the publisher, the editors and the reviewers. Any product that may be evaluated in this article, or claim that may be made by its manufacturer, is not guaranteed or endorsed by the publisher.
References
Cheang B., Lim A. (2004). A network flow based method for the distribution of empty containers. Int. J. Comput. Appl. Technology. 1 (4), 20–22. doi: 10.1504/IJCAT.2005.006957
Chen C. Y. (1998). A two-stage stochastic network model and solution methods for the dynamic empty container allocation problem. Transport. Sci. 32 (2), 142–162. doi: 10.1287/trsc.32.2.142
Chen G., Govindan K., Golias M. M. (2013). Reducing truck emissions at container terminals in a low carbon economy: proposal of a queueing-based bi-objective model for optimizing truck arrival pattern. Transport. Res. Part E: Logistics Transport. Rev. 55, 3–22. doi: 10.1016/j.tre.2013.03.008
Chen K., Lu Q. Y., Xin X., Yang Z. Z., Zhu L. Q., Xue Q. (2022). Optimization of empty container allocation for inland freight stations considering stochastic demand. Ocean Coast. Management. 230, 106366. doi: 10.1016/j.ocecoaman.2022.106366
Chen K., Xu S., Haralambides H. (2020). Determining hub port locations and feeder network designs: the case of China-West Africa trade. Transport Policy. 86, 9–22. doi: 10.1016/j.tranpol.2019.12.002
Correcher J. F., Alvarez-Valdes R., Tamarit J. M. (2018). New exact methods for the time-invariant berth allocation andquay crane assignment problem. Eur. J. Operation. Res. 275 (1), 80–92. doi: 10.1016/j.ejor.2018.11.007
Department of Agricultural and Resource Economics (2022). Port congestion, container shortages and U.S. foreign trade. Eco. Lett. 213, 110392. doi: 10.1016/j.econlet.2022.110392
Dong B., Christiansen M., Fagerholt K., Bektas T. (2020). Combined maritime fleet deployment and inventory management with port visit flexibility in roll-on roll-off shipping. Transport. Res. Part E: Logistics Transport. Rev. 140, 101988. doi: 10.1016/j.tre.2020.101988
Ercan K. (2022). Optimizing inland container logistics through dry ports: A two-stage stochastic mixed-integer programming approach considering volume discounts and consolidation in rail transport. Comput. Ind. Engineering. 174, 108768. doi: 10.1016/j.cie.2022.108768
Esmer S., Ceti I. B., Tuna O. (2010). A simulation for optimum terminal truck number in a Turkish port based on lean and green concept. Asian J. Shipping Logistics. 26 (2), 277–296. doi: 10.1016/S2092-5212(10)80006-9
Galle V., Barnhart C., Jaillet P. (2018). Yard crane scheduling for container storage, retrieval, and relocation. Eur. J. Operational Res. 271 (1), 288–316. doi: 10.1016/j.ejor.2018.05.007
Guo X., He J., Lan M., Yu H., Yan W. (2022). Modeling carbon emission estimation for hinterland-based container intermodal network. J. Cleaner Production. 378, 134593. doi: 10.1016/j.jclepro.2022.134593
He J., Huang Y., Yan W., Wang S. (2015). Integrated internal truck, yard crane and quay crane scheduling in a container terminal considering energy consumption. Expert Syst. Applications. 42 (5), 2464–2487. doi: 10.1016/j.eswa.2014.11.016
Imai A., Shintani K., Papadimitriou S. (2009). Multi-port vs. hub-and-Spoke port calls by containerships. Transport. Res. Part E: Logistics Transport. Rev. 45 (5), 740–757. doi: 10.1016/j.tre.2009.01.002
International Maritime Organization (2014). Third IMO GHG study 2014: Executive summary and final report.
Li N., Chen G., Govindar K., Jin Z. H. (2018). Disruption management for truck appointment system at a container terminal: a green initiative. Transport. Res. Part D: Transport Environment. 61, 261–273. doi: 10.1016/j.trd.2015.12.014
Liu P., Liu C., Du J. B., Mu D. (2019). A system dynamics model for emissions projection of hinterland transportation. J. Cleaner Production. 218, 591–600. doi: 10.1016/j.jclepro.2019.01.191
Luo T., Chang D. F. (2019). Empty container repositioning strategy in intermodal transport with demand switching. Advanced Eng. Informatics. 40, 1–13. doi: 10.1016/j.aei.2019.02.008
Misra S., Kapadi M., Gudi R. D. (2020). Hybrid time-based framework for maritime inventory routing problem. Ind. Eng. Chem. Res. 59 (46), 20394–20409. doi: 10.1021/acs.iecr.0c03186
Muhammad A. B., Muhammad R. H., Takesh S. (2022). Estimation of CO2 emissions for ship activities at container port as an effort towards a green port index. Sci. Direct. Energy Rep. 8, 229–236. doi: 10.1016/j.egyr.2022.10.090
Olgay O. (2023). Carbon emission strategies for container handling equipment using the activity-based method: A case study of ambarlı container port in turkiye. Mar. Policy 149, 105480. doi: 10.1016/j.marpol.2023.105480
Peng Y., Li X. D., Wang W. Y., Liu K., Li C. (2018a). A simulation based research on carbon emission mitigation strategies for green container terminals. Ocean Engineering. 163, 288–298. doi: 10.1016/j.oceaneng.2018.05.054
Peng Y., Wang W. Y., Liu K., Li X. D., Tian Q. (2018b). The impact of the allocation of facilities on reducing carbon emissions from a green container terminal perspective. Sustainability 10 (6), 1813. doi: 10.3390/su10061813
Poo M. C. P., Yip T. L. (2019). An optimization model for container inventory management. Ann. Operations Res. 273 (1/2), 433–453. doi: 10.1007/s10479-017-2708-8
Rajasekar T., Deo M., Ke R. (2014). An exploration in to the causal relationship between performance inputs and traffic of major ports in India: A panel data analysis. Int. J. Eco. Financial Manage. 2 (2), 72–81. doi: 10.12691/ijefm-2-2-3
Schulte F., Llla-ruiz E., Gonzalez-ramires R. G., Voss S. (2017). Reducing port-related empty truck emissions: mathematical approach for truck appointments with collaboration. Transport. Res. Part E: Logistics Transport. Rev. 105, 195–212. doi: 10.1016/j.tre.2017.03.008
Shintani K., Imai A., Nishimura E., Papadimitriou S. (2007). The container shipping network design problem with empty container repositioning. Transport. Res. Part E: Logistics Transport. Rev. 43 (1), 39–59. doi: 10.1016/j.tre.2005.05.003
Song J. Y., Tang X., Wang C. X., Xu C. Y., Wei J. Y. (2022). Optimization of multi-port empty container repositioning under uncertain environments. Sustainability 14 (20), 13255. doi: 10.3390/su142013255
Tang L., Zhao J., Liu J. (2014). Modeling and solution of the joint quay crane and truck scheduling problem. Eur. J. Operational Res. 236 (3), 978–990. doi: 10.1016/j.ejor.2013.08.050
Tao X., Wu Q. (2021). Energy consumption and CO2 emissions in hinterland container transport. J. Cleaner Production. 279, 123394. doi: 10.1016/j.jclepro.2020.123394
Trozzi C., Vaccaro R. (2000). “Environmental impact of port activities,” in Maritime engineering and ports II. Eds. Brebbia C. A., Olivella J. (Southampton: WIT Press), 151–161.
UNCTAD (The United Nations Conference on Trade and Development) (2018). Review of maritime transportation (New York and Geneva).
Wang S. A. (2017). Formulating cargo inventory costs for liner shipping network design. Maritime Policy &Management. 44 (1), 62–80. doi: 10.1016/j.rsma.2022.102371
Wang C., Yu S., Xu L. (2022a). Decisions on sailing frequency and ship type in liner shipping with the consideration of carbon dioxide emissions. Reg. Stud. Mar. Sci. 52, 102371. doi: 10.1080/03088839.2016.1245879
Wang L., Wang C., Huang R. (2022b). Port‑based supply chain decisions considering governmental pollution tax. Operation. Res. 22, 47694800. doi: 10.1007/s12351-022-00704-2
Xiao G. N., Cui W. Y. (2023). Evolutionary game between government and shipping companies based on shipping cycle and carbon quota. Front. Mar. Science. 10, 1132174. doi: 10.3389/fmars.2023.1132174
Xiao G. N., Wang T., Luo Y. H., Yang D. Q. (2023). Analysis of port pollutant emission characteristics in united states based on multiscale geographically weighted regression. Front. Mar. Science. 10, 1131948. doi: 10.3389/fmars.2023.1131948
Xie Y. Y., Liang X. Y., Ma L. J. (2017). Empty container management and coordination in intermodal transport. Eur. J. Operational Res. 257 (1), 223–232. doi: 10.1016/j.ejor.2016.07.053
Xu L., Di Z., Chen J. H. (2021a). Evolutionary game of inland shipping pollution control under government co-supervision. Mar. Pollut. Bulletin. 171, 112730. doi: 10.1016/j.marpolbul.2021.112730
Xu L., Shi J., Chen J. H. (2021b). Platform encroachment with price matching: introducing a self-constructing online platform into the sea-cargo market. Comput. Ind. Engineering. 156, 107266. doi: 10.1016/j.cie.2021.107266
Xu L., Shi J., Chen J. H. (2022). Agency encroachment and information sharing: cooperation and competition in freight forwarding market, maritime policy and management. Maritime Pol. Manage. 50 (3). doi: 10.1080/03088839.2021.1990428
Xu L., Yang Z. H., Chen J. H., Zou Z. Y. (2023). Impacts of the COVID-19 epidemic on carbon emissions from international shipping. Mar. Pollut. Bulletin. 189, 114730. doi: 10.1016/j.marpolbul.2023.114730
Yang R., Yu M., Lee C. Y., Du Y. (2021). Contracting in ocean transportation with empty container repositioning under asymmetric information. Transport. Res. Part E: Logistics Transport. Rev. 145, 102173. doi: 10.1016/j.tre.2020.102173
Yoonjea J., Gwang K. (2023). Reliable design of container shipping network with foldable container facility disruption. Transport. Res. Part E: Logistics Transport. Rev. 169, 102964. doi: 10.1016/j.tre.2022.102964
Yu M. Z., Fransoo J. C., Lee C. Y. (2018). Detention decisions for empty containers in the hinterland transportation system. Transport. Res. Part B: Methodological. 110, 188–208. doi: 10.1016/j.trb.2018.02.007
Zhang Q., Pu S. H., Luo L. L., Liu Z. C., Xu J. (2022). Revisiting important ports in container shipping networks: A structural hole-based approach. Transport Policy. 126, 239–248. doi: 10.1016/j.tranpol.2022.07.020
Zhao Y., Xue Q. W., Zhang X. (2018). Stochastic empty container repositioning problem with CO2 emission considerations for an intermodal transportation system. Sustainability 10 (11), 4211–4234. doi: 10.3390/su10114211
Keywords: reposition threshold, empty container reposition, low carbon, port cooperation, uncertain environment
Citation: Tang X, Xu C, Wang C and Song J (2023) A study on the influence of reposition threshold on low-carbon empty container repositioning strategy under an uncertain environment. Front. Mar. Sci. 10:1174395. doi: 10.3389/fmars.2023.1174395
Received: 26 February 2023; Accepted: 27 March 2023;
Published: 26 April 2023.
Edited by:
Jihong Chen, Shenzhen University, ChinaReviewed by:
Hui Li, Guangxi Minzu University, ChinaXiaoxia Jia, University of Shanghai for Science and Technology, China
Rong Ke, Shanghai University of International Business and Economics, China
Copyright © 2023 Tang, Xu, Wang and Song. This is an open-access article distributed under the terms of the Creative Commons Attribution License (CC BY). The use, distribution or reproduction in other forums is permitted, provided the original author(s) and the copyright owner(s) are credited and that the original publication in this journal is cited, in accordance with accepted academic practice. No use, distribution or reproduction is permitted which does not comply with these terms.
*Correspondence: Changyan Xu, c2lsdTM2OUAxMjYuY29t