 Yafei Wang
 Hongmei Lin1†
 Ranran Huang
 Weidong Zhai
- 1Institute of Marine Science and Technology, Shandong University, Qingdao, China
- 2Frontier Research Center, Southern Marine Science and Engineering Guangdong Laboratory (Zhuhai), Zhuhai, China
The study of marine microbial communities is crucial for comprehending the distribution patterns, adaptations to the environment, and the functioning of marine microorganisms. Despite being one of the largest biomes on Earth, the bacterioplankton communities in the Northwest Pacific Ocean (NWPO) remain understudied. In this research, we aimed to investigate the structure of the surface bacterioplankton communities in different water masses of the NWPO. We utilized metagenomic sequencing techniques and cited previous 16S rRNA data to explore the distribution patterns of bacterioplankton in different seasons. Our results revealed that Cyanobacteria, Proteobacteria, Bacteroidetes, and Actinobacteria dominated the microbial communities, accounting for over 95% of the total. During spring, we observed significant differentiation in community structure between the different water masses. For instance, Prochlorococcus and Pseudoalteromonas were primarily distributed in the nutrient-deficient subtropical countercurrent zone, while Flavobacteriaceae and Rhodobacteraceae were found in the Kuroshio-Oyashio mixing zone. During summer, the surface planktonic bacteria communities became homogenized across regions, with Cyanobacteria becoming the dominant group (68.6% to 84.9% relative abundance). The metabolic processes of the microorganisms were dominated by carbohydrate metabolism, followed by amino acid transport and metabolism. However, there was a low relative abundance of functional genes involved in carbohydrate metabolism in the Kuroshio-Oyashio mixing zone. The metagenomic data had assembled 37 metagenomic-assembled genomes (MAGs), which belong to Proteobacteria, Bacteroidetes, and Euryarchaeota. In conclusion, our findings highlight the diversity of the surface bacterioplankton community composition in the NWPO, and its distinct geographic distribution characteristics and seasonal variations.
Introduction
The ocean represents the largest ecosystem on the planet and microorganisms are ubiquitous in the marine environment. There are about 104 to 106 cells per milliliter of seawater (Sunagawa et al., 2015), such a high biomass, coupled with a high turnover rate and the complexity of the marine environment make marine microorganisms have diversified characteristics. Microorganisms and the communities they form, play a pivotal role in biogeochemical processes, driving and responding to changes in the environment, including temperature, carbon chemistry, nutrient, and oxygen content associated with climate change, as well as ocean stratification and ocean current change (Doney et al., 2012), etc. Investigating the diversity and distribution patterns of marine microbes is critical to understanding the evolution of contemporary biodiversity, ecological processes and monitoring the response of marine ecosystems to environmental change. In recent years, advances in next-generation sequencing technologies have allowed for large-scale exploration of the taxonomic diversity and geographic distribution of marine microbes. The sequencing of microbial gene sequences using high-throughput sequencing and metagenomic techniques has been applied to characterize genetic diversity, and community composition (Díez et al., 2016; West et al., 2016; Zorz et al., 2019; Kong et al., 2020).
At present, numerous studies have been conducted using high-throughput sequencing to assess the diversity and functional structure of marine microbes, including some of the large-scale global surveys of marine microbes. For example, The Sorcerer II Global Ocean Sampling Expedition (GOS) survey project (Wilhelm et al., 2007; Yooseph et al., 2007; Yutin et al., 2007; Rusch et al., 2010), and the Tara Oceans Global Microbial Survey project (Brum et al., 2015; de Vargas et al., 2015; Pesant et al., 2015; Sunagawa et al., 2015; Carradec et al., 2018). Partial results of these studies suggested that the distribution of microorganisms is environmentally restricted and the community composition is highly heterogeneous (Suh et al., 2014; Sunagawa et al., 2015; Li et al., 2018a). However, some bacteria have a wider latitudinal range than other taxa (West et al., 2016), suggesting that some bacteria may migrate to, or emigrate from adjacent regions through such mechanisms as thermohaline circulation and oceanic currents (Suh et al., 2014). These researches have advanced the study of microbial genetic diversity in the world’s oceans and have made a significant step forward in our understanding of marine biogeochemical processes.
The Northwest Pacific Ocean (NWPO) is one of the largest oligotrophic areas in the world (Polovina et al., 2008; Moore et al., 2013), and represents the largest ocean current on Earth. It is inhabited by phytoplankton and heterotrophic bacteria that have adapted to the oligotrophic environment. Despite low productivity, these microbes significantly impact global biogeochemical cycles. While studies have been conducted on phytoplankton diversity and seasonal variation (Fujiki et al., 2016), phytoplankton diversity and metabolic function (Li et al., 2018a; Wang et al., 2022), pico-eukaryotic microbial community diversity and community structure (Wang et al., 2018a) and patterns of relative and quantitative abundances of bacteria in surface water (Kong et al., 2020) in the NWPO, the area remains understudied (outside the scope of GOS and Tara Oceans studies). There is a need for further investigation into the diversity and community structure of bacterioplankton communities in the region.
Here, we investigated the diversity and community structure of bacterioplankton communities on the surface of the NWPO using metagenomic techniques and compared the distribution patterns of bacterioplankton between different water masses in different seasons by referring to historical data, to provide a reference for microbial studies in the NWPO and improve the understanding of the spatial distribution of marine microorganisms.
Methods and materials
Sample collection and analytical testing
The study investigated environmental parameters in the NWPO (21°N ~ 39°N, 123°E ~ 150°E) and collected sea surface microbial community samples during the August cruise to analyze the community structure and related environmental data. To integrate the analysis of the seasonal distribution patterns of surface bacterioplankton communities in the NWPO, the results of 16S rRNA data of sea surface microorganisms in the same sea area reported (Li et al., 2018b) were discussed in this research. The relevant voyage information is summarized in Table S1.
From August 16, 2018, to September 15, 2018, surface seawater (about 5 m) from 10 sites was collected in the NWPO. In each site, the navigation pump was used to extract about 300L of surface seawater and collected water samples were transferred into 15-L HCl-rinsed buckets. The seawater was pre-filtered through a membrane with a pore size of 1μm (293mm diameter mixed fiber membrane) to remove particles and microorganisms with larger diameters and then passed through a membrane with a 0.2μm pore size (293mm diameter mixed Fiber membrane) to collect microorganisms with a particle size range of 0.2~1μm. All filter membranes were stored frozen in liquid nitrogen and then stored at -80°C until further analysis. The in-situ temperature and salinity of different sites on the surface layer use the data of the navigation probe on board (SBE21).
Physicochemical parameters were also collected on the May 2018 voyage and the August 2018 voyage (Li et al., 2022), including temperature, salinity, dissolved oxygen, pH, nutrients (nitrate, phosphate, and silicate), dissolved inorganic carbon (DIC), and total alkalinity (TA). Temperature and salinity data were obtained using data from the conductivity-temperature-depth/pressure (CTD) probes (SBE911 plus, Sea-Bird Scientific, USA). Dissolved oxygen was sampled, fixed, and titrated to complete the assay on board according to the classical Winkler method. Dissolved oxygen saturation (DO%) is the ratio of measured DO values to DO saturation values at atmospheric equilibrium, where atmospheric equilibrium DO saturation values were calculated by equation(Benson and Krause, 1984), using temperature, salinity, and atmospheric pressure on site. The nutrient concentration was determined using a reorganized Syslyzer III analyzer (Systea S.P.A. Co., Italy). The pH (total hydrogen ion scale) data was calculated by inputting inorganic carbon and alkalinity data into CO2SYS.XLS (Version 24) (Lewis and Wallace, 1998), specifical the steps of quality control of parameter selection and data referred to the literature (Zhai et al., 2014). Water samples for DIC and TA analyses were collected and stored in 250 mL borosilicate glass bottles. Before being sealed with greased (Apiezon-L) ground-glass stoppers, 1 mL of seawater was removed from each sample bottle to allow for thermal expansion, and 100 µL of saturated HgCl2 was mixed into the water samples to halt biological activity. Samples were then preserved at room temperature until determination. DIC was measured using an infrared CO2 detector-based DIC analyzer (AS-C3, Apollo SciTech Inc., United States), and TA was determined at 25°C by Gran acidimetric titration using a semiautomated titrator (AS-ALK2, Apollo SciTech Inc., United States). The physical and chemical parameters of all sampling points were summarized in Table S2.
DNA extraction, sequencing, and metagenomic analysis
Microbial genomic DNA was extracted using a PowerSoil DNA Isolation Kit (QIAGEN, United States), according to the manufacturer’s instructions. For seawater samples, the 0.2 μm-mesh membranes were cut into 0.2 cm pieces with flame-sterilized scissors and added to a PowerBead Tube (Zhang et al., 2018). Sequencing was performed on the Illumina Hiseq2000 platform by Magi Gene Company (Guangdong, China), resulting in 10 sampling points of raw data in Fastq format (around 10G per sample).
The original sequencing data were separated based on the sample’s barcode and then processed with Trimmomatic (Bolger et al., 2014) to eliminate adapters and low-quality sequences (the length of the forward and reverse sequence is 20~150bp, the average quality>30). The quality of the trimmed sequences was checked by FastQC (http://www.bioinformatics.babraham.ac.uk/projects/fastqc/), after which the sequences were assembled with MEGAHIT (Li et al., 2015) for further binning, gene prediction, and functional annotation. The assembled sequences were evaluated with QUAST(Gurevich et al., 2013) statistics and species annotated with Kraken(Wood and Salzberg, 2014). Classification and functional annotation were performed based on high-quality reads. The number of raw reads, average length, number of extracted eligible sequences, average length, and average GC content for each sample were counted in Table S3. The predicted genes were aligned against the Kyoto Encyclopedia of Genes and Genomes (KEGG) (Kanehisa et al., 2017) to determine the best annotation results (the level 1 and level 2 were counted and analyzed). Genes encoding carbohydrate metabolizing enzymes were identified by using the predicted genes against the Carbohydrate-Active enZYmes (CAZY) public database(Cantarel et al., 2009) with the same filtration mechanism. Three methods were used for CAZymes annotation: the first used HMMER to annotate against the HMMs database of dbCANh CAZyme, the second used DIAMOND for fast annotation against the CAZy database, and the third used Hotpep to annotate against the short conservative sequences of the PPR database. The clustering analysis was performed using the function pheatmap in R package (version 3.6.1).
To further annotation of Metagenome-Assembled Genomes (MAGs), MetaBAT2 (Kang et al., 2019), MaxBin2 (Wu et al., 2016), and Concoct (Alneberg et al., 2014) were used to perform initial binning, and the results were evaluated using CheckM (Parks et al., 2015). The species annotation of the metagenome-assembled genomes was performed using Taxator-tk (Dröge et al., 2015), which was based on the NCBI_nt and NCBI_tax databases, and the species classification was estimated accordingly. The average nucleotide similarity with published genomes was calculated using FastANI (ANI: Average Nucleotide Identity) (Jain et al., 2018). MinHash-style sketches were generated to classify genomes and metagenomes based on a database of known species. The species classification of the assembled genomes was identified by searching the published metagenome-based species-level assembled genome database using PhyloPhlAn2 (Segata et al., 2013). The assembled contigs were run through a local installation of the antiSMASH pipeline (version 6.0.1) for identifying the BGCs (Blin et al., 2021).
16S rRNA data analysis
The research on bacterial diversity and taxa associated with nitrogen metabolism in the surface layer (5-10 m) was conducted by the literature (Li et al., 2018b) from March 30 to May 10, 2015, in the NWPO. The original 16S rRNA data were obtained from the NCBI (BioProject ID PRJNA434503) and processed using Qiime2 (version 2019.7.0) (Bolyen et al., 2019) for denoising, clustering, and annotation by SILVA rRNA database (version 132) (Quast et al., 2012). The denoising process resulted in the acquisition of 15,000-22,000 sequences, which were annotated to reveal 375 microbial species (Table S4). In addition, our study listed the physical and chemical parameters of sampling points for the 2015 spring voyage in Table S2.
Results
Environmental characteristics
The study area was in the subtropical Northwest Pacific Ocean from 20°N to 40°N (Figure 1), with the Kuroshio Extension recirculation gyre (KERG) region around 25°N to 35°N (orange boxed area in Figure 1B) (Kitamura et al., 2016; Cheng et al., 2017). ST5, ST6, B1, and A6 (Figure 1B) were located in mixed Kuroshio extensions and oyashio (hereafter Kuroshio-oyashio mixing zone) with low temperature and salinity (Li et al., 2018b; Wang et al., 2018a) and high nutrient concentrations, with NOx-concentrations reaching up to 5.78 μM (Table S2). Salinity in spring (34.3 to 34.7) was higher than in summer (33.8 to 34.2) (Figures 2A, B), and in the region north of 35°N sea surface temperatures were below 17°C in spring and 24.6°C to 27.3°C in summer (Figures 2C, D). Sea surface temperatures could be divided into three zones from north to south in spring, but by August, the sea surface temperatures in the region south of 35°N had increased to around 30°C. ST11 was located in the mixed Kuroshio-East China Sea, which is another region of relatively low temperature and salinity except for north of 35°N, and with higher salinity in spring (34.2 to 34.7) than in summer (33 to 34.2) (Figures 2A, B), the sea surface temperatures of 20°C to 25°C in spring and 28°C to 29.2°C in summer (Figures 2C, D). In the Kuroshio countercurrent zone, ST4, ST7, ST8, K6, B9, B4, and B5 showed low nutrient salinity and NOx- concentrations (0.05 to 0.14 μM) (Table S2), with sea surface salinity of around 34.5 (Figures 2A, B) and sea surface temperatures increasing from 20.9°C to 24.7°C in spring to 27°C to 29.6°C in summer (Figures 2C, D). ST9 and ST10 in the east of the Kuroshio basin, situated in the subtropical countercurrent zone, mainly influenced by the Kuroshio. ST1, ST3, K1, and K3 were located in the southernmost subtropical inversion zone, which had low nutrient concentrations (Table S2) and high salinity at around 34.5 (Figures 2A, B). Due to the low latitude, temperatures were the highest of the three regions, around 27°C to 30°C all year (Figures 2C, D).
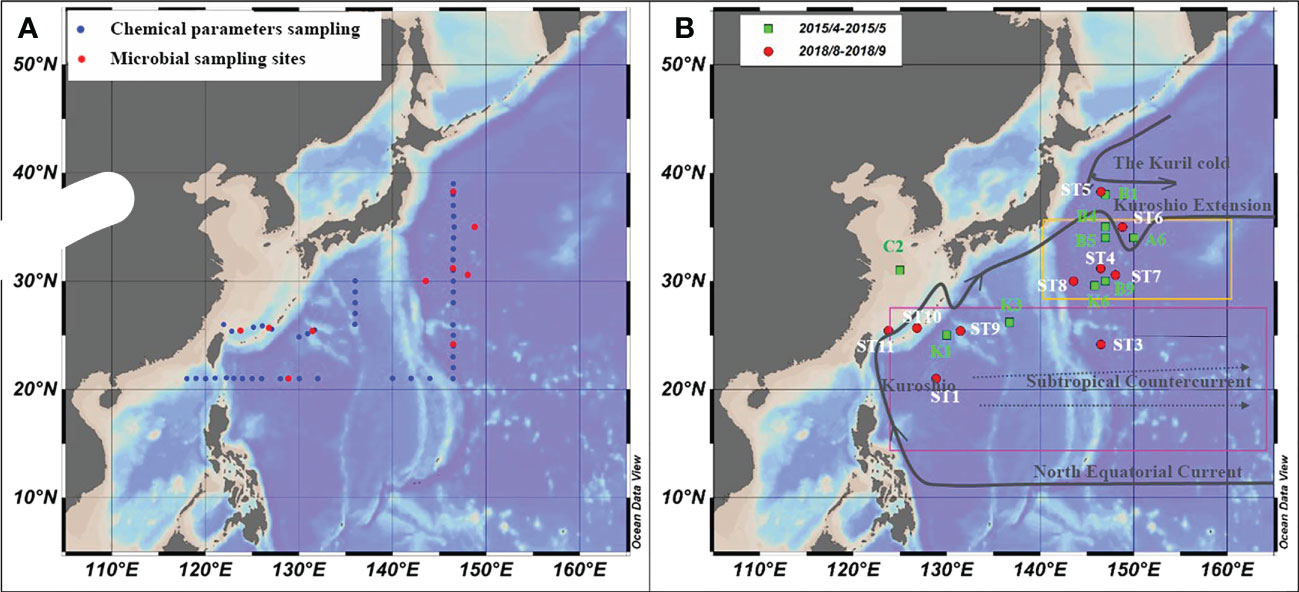
Figure 1 Microbial sampling sites and ocean currents in the study area. (A) Chemical parameter (blue) and microbial samples sampling stations in the NWPO from August to September 2018; (B) The microbial sampling stations in April-May 2015(green dots) and in August-September 2018 (red dots), and ocean current distribution.
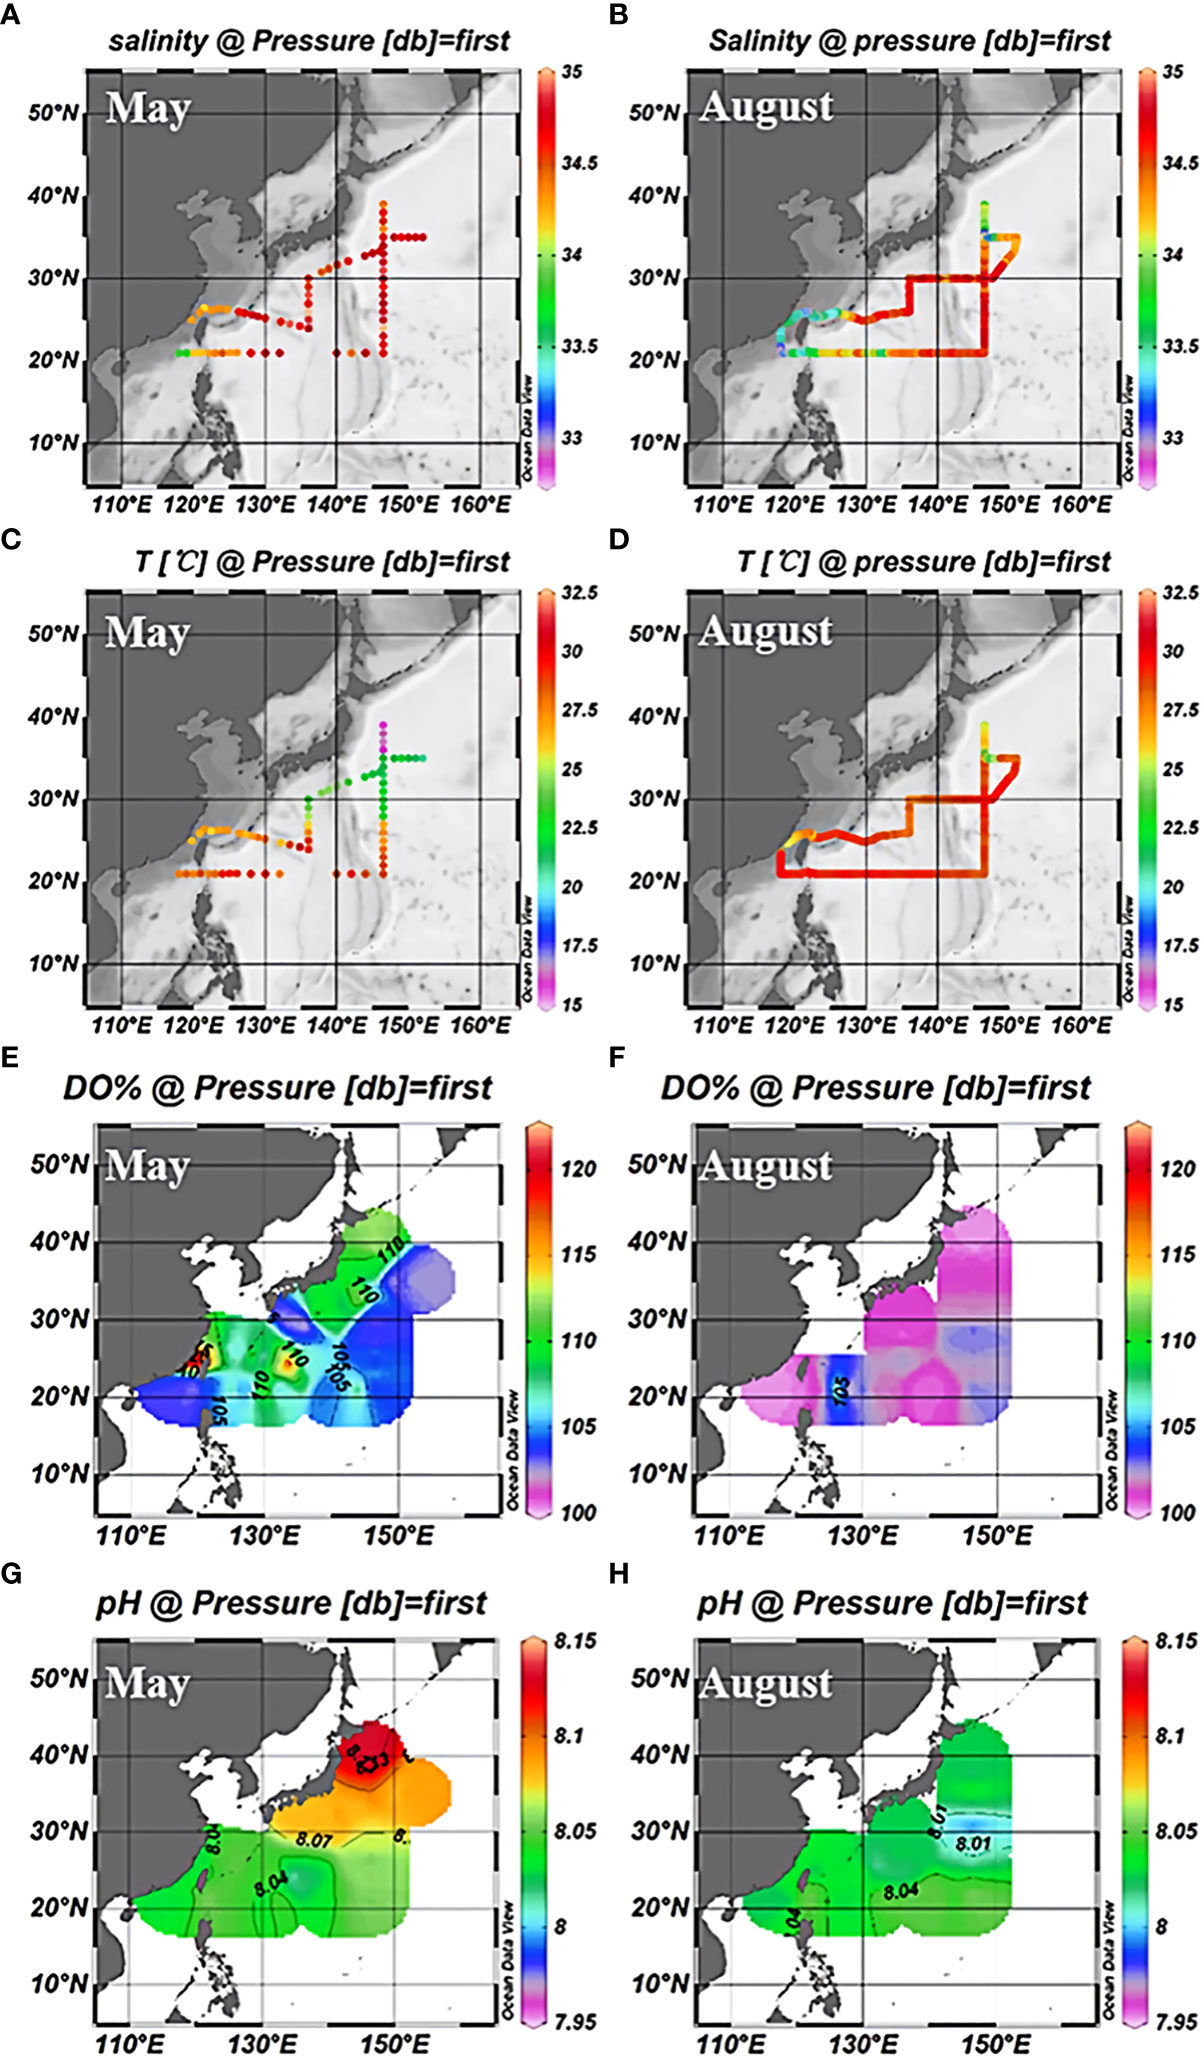
Figure 2 Surface distribution of salinity (A), temperature (C), dissolved oxygen saturation (E), and pH (G) in the northwest Pacific in May 2018; Salinity (B), temperature (D), dissolved oxygen saturation (F), and pH (H) surface distribution in August 2018.
In addition, due to the vigorous growth of phytoplankton during the spring survey (Fujiki et al., 2014; Fujiki et al., 2016; Matsumoto et al., 2021), the dissolved oxygen saturation in the entire NWPO was higher than the atmospheric equilibrium value. In summer, the dissolved oxygen was in equilibrium with the atmosphere (Figures 2E, F). The pH gradually increased from south to north and was lower in summer than in spring (Figures 2G, H). This was caused by the low surface seawater temperature in the high latitude region (spring). Moreover, phytoplankton growth and reproduction were more vigorous in spring than in summer, and the amount of CO2 absorbed by phytoplankton through photosynthesis was higher than in summer. As a consequence, the pH was higher in spring than in summer, and the pH was lower in the low-latitude region than in the high-latitude sea (Zhai et al., 2014; Fujiki et al., 2016).
Correlation analysis of bacterioplankton communities
A metagenomic library of 10 surface samples was established for determining the composition and abundance of planktonic bacterial communities during the summer cruise survey (August to September 2018). The results were compared with the 16S rRNA data published in May 2015 (Li et al., 2018b). The abundance difference between the microbial species in different sampling areas was used to calculate the correlation coefficient between the two sampling areas, and the heat map analysis was performed to study the relationship between the prokaryotic communities in the NWPO.
The sampling sites for both studies were divided into three groups (Figure 3), based on ocean currents, water masses, and environmental conditions, from south to north: The Subtropical countercurrent zone (STCC), which was characterized by high temperature and high salinity, with an annual surface nutrient (N and P) concentration close to 0 and low surface pH; The Kuroshio extension countercurrent zone (KE), which was characterized by high salinity, high seasonal variation in temperature and surface nutrient concentrations close to 0 throughout a year, and higher surface pH than the subtropical countercurrent zone; The Kuroshio Extension-oyashio Mixed Area(MIX) (hereafter referred to as the Kuroshio-oyashio Mixing Zone) was characterized by low temperature, low salinity, high pH. The nutrient concentrations were slightly higher than the other two zones, but also close to 0 in summer.
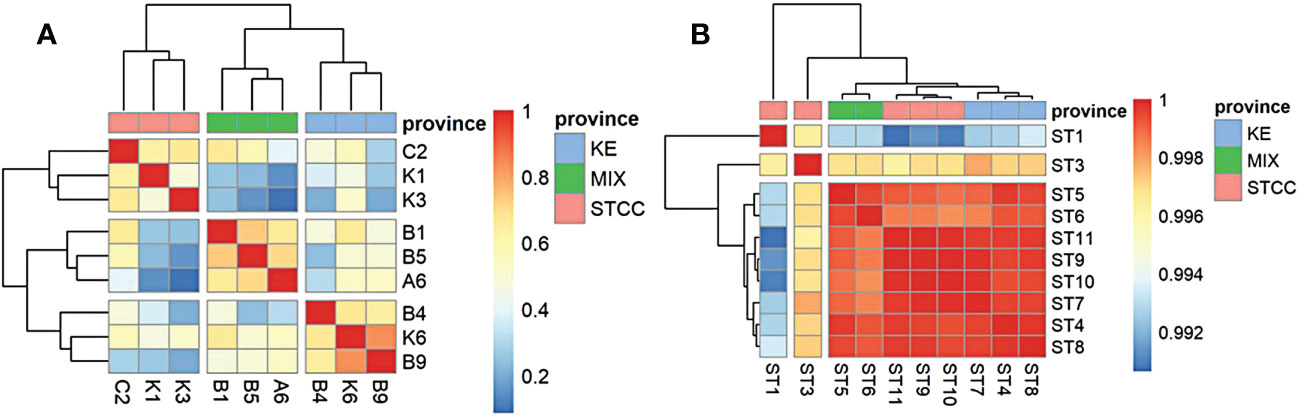
Figure 3 Correlation heat map analysis between two sampling cruises based on the relative abundance calculation of the top 20 species. (A) the genus level data of spring cruise in 2015. (B) the species level data of summer cruise in 2018. Pink represents STCC (Subtropical countercurrent), Blue represents KE (Kuroshio extension countercurrent), and green represents MIX (the Kuroshio-Oyashio mixing zone).
In addition, the surface marine environmental conditions were relatively homogeneous in August due to an overall increase in sea surface temperature and a decrease in the north-south temperature difference, showing very little variation in various physical-chemical parameters between different regions. The surface bacterioplankton communities in the NWPO showed very little structural differences (correlation coefficients were all above 0.99 (Figure 3B)) and can be considered as almost one ecological community.
Analysis of planktonic bacterial diversity and community structure in the summer surface
To investigate the structure of the bacterioplankton community in the Northwest Pacific Ocean, we used metagenomic sequencing to analyze surface bacterioplankton from August to September 2018. A total of 127,457,399 available reads were annotated and revealed the presence of over 40 bacterial phyla and over 6000 microorganisms. The most abundant phylum was Cyanobacteria, with an average relative abundance of 78.9%, followed by Proteobacteria (16.2%), Bacteroidetes (1.7%), and Firmicutes (1.1%) (Figure 4A). The dominant species within Cyanobacteria was Prochlorococcus, accounting for 77.6% of the total, while Synechococcus had a relative abundance of only 1.2%, much lower than that of Prochlorococcus, but it had a high abundance in Kuroshio-Oyashio mixing zone (Figure 4B). The Proteobacteria was further divided into alpha-proteobacteria (12.9%) and gamma-proteobacteria (2.2%), with the highest relative abundance and diversity in the subtropical countercurrent area where nutrient concentrations were lower (Figure 4A). The most common alpha-proteobacteria was SAR11 (Pelagibacter), with species ranked within the top 20 in relative abundance including Candidatus Pelagibacter sp. RS39, Candidatus Pelagibacter sp. RS40, Candidatus Pelagibacter sp. HIMB1321, alpha proteobacterium HIMB5, Candidatus Pelagibacter ubique, alpha proteobacterium HIMB59, Candidatus Pelagibacter sp. IMCC9036. The mean relative abundances of Candidatus Pelagibacter sp. RS39 and Candidatus Pelagibacter sp. RS40 ranged from 1.9% to 7.4% and were higher in subtropical countercurrent area, especially at the more southern sites ST1 and ST3. The species with high relative abundance in gamma-proteobacteria was the Vibrio harveyi group, whose relative abundance ranged from 0.2% to 1.1%, and had the highest relative abundance at the ST1 site in the subtropical countercurrent area (Figure 4B). Bacteroidetes, the third most abundant taxon, was mainly distributed in the Kuroshio extension recirculation gyre and the Kuroshio-Oyashio mixing zone, with the highest relative abundance of Flavobacterium found in ST5 in the Kuroshio-Oyashio mixing zone, amounting to 2.1%.
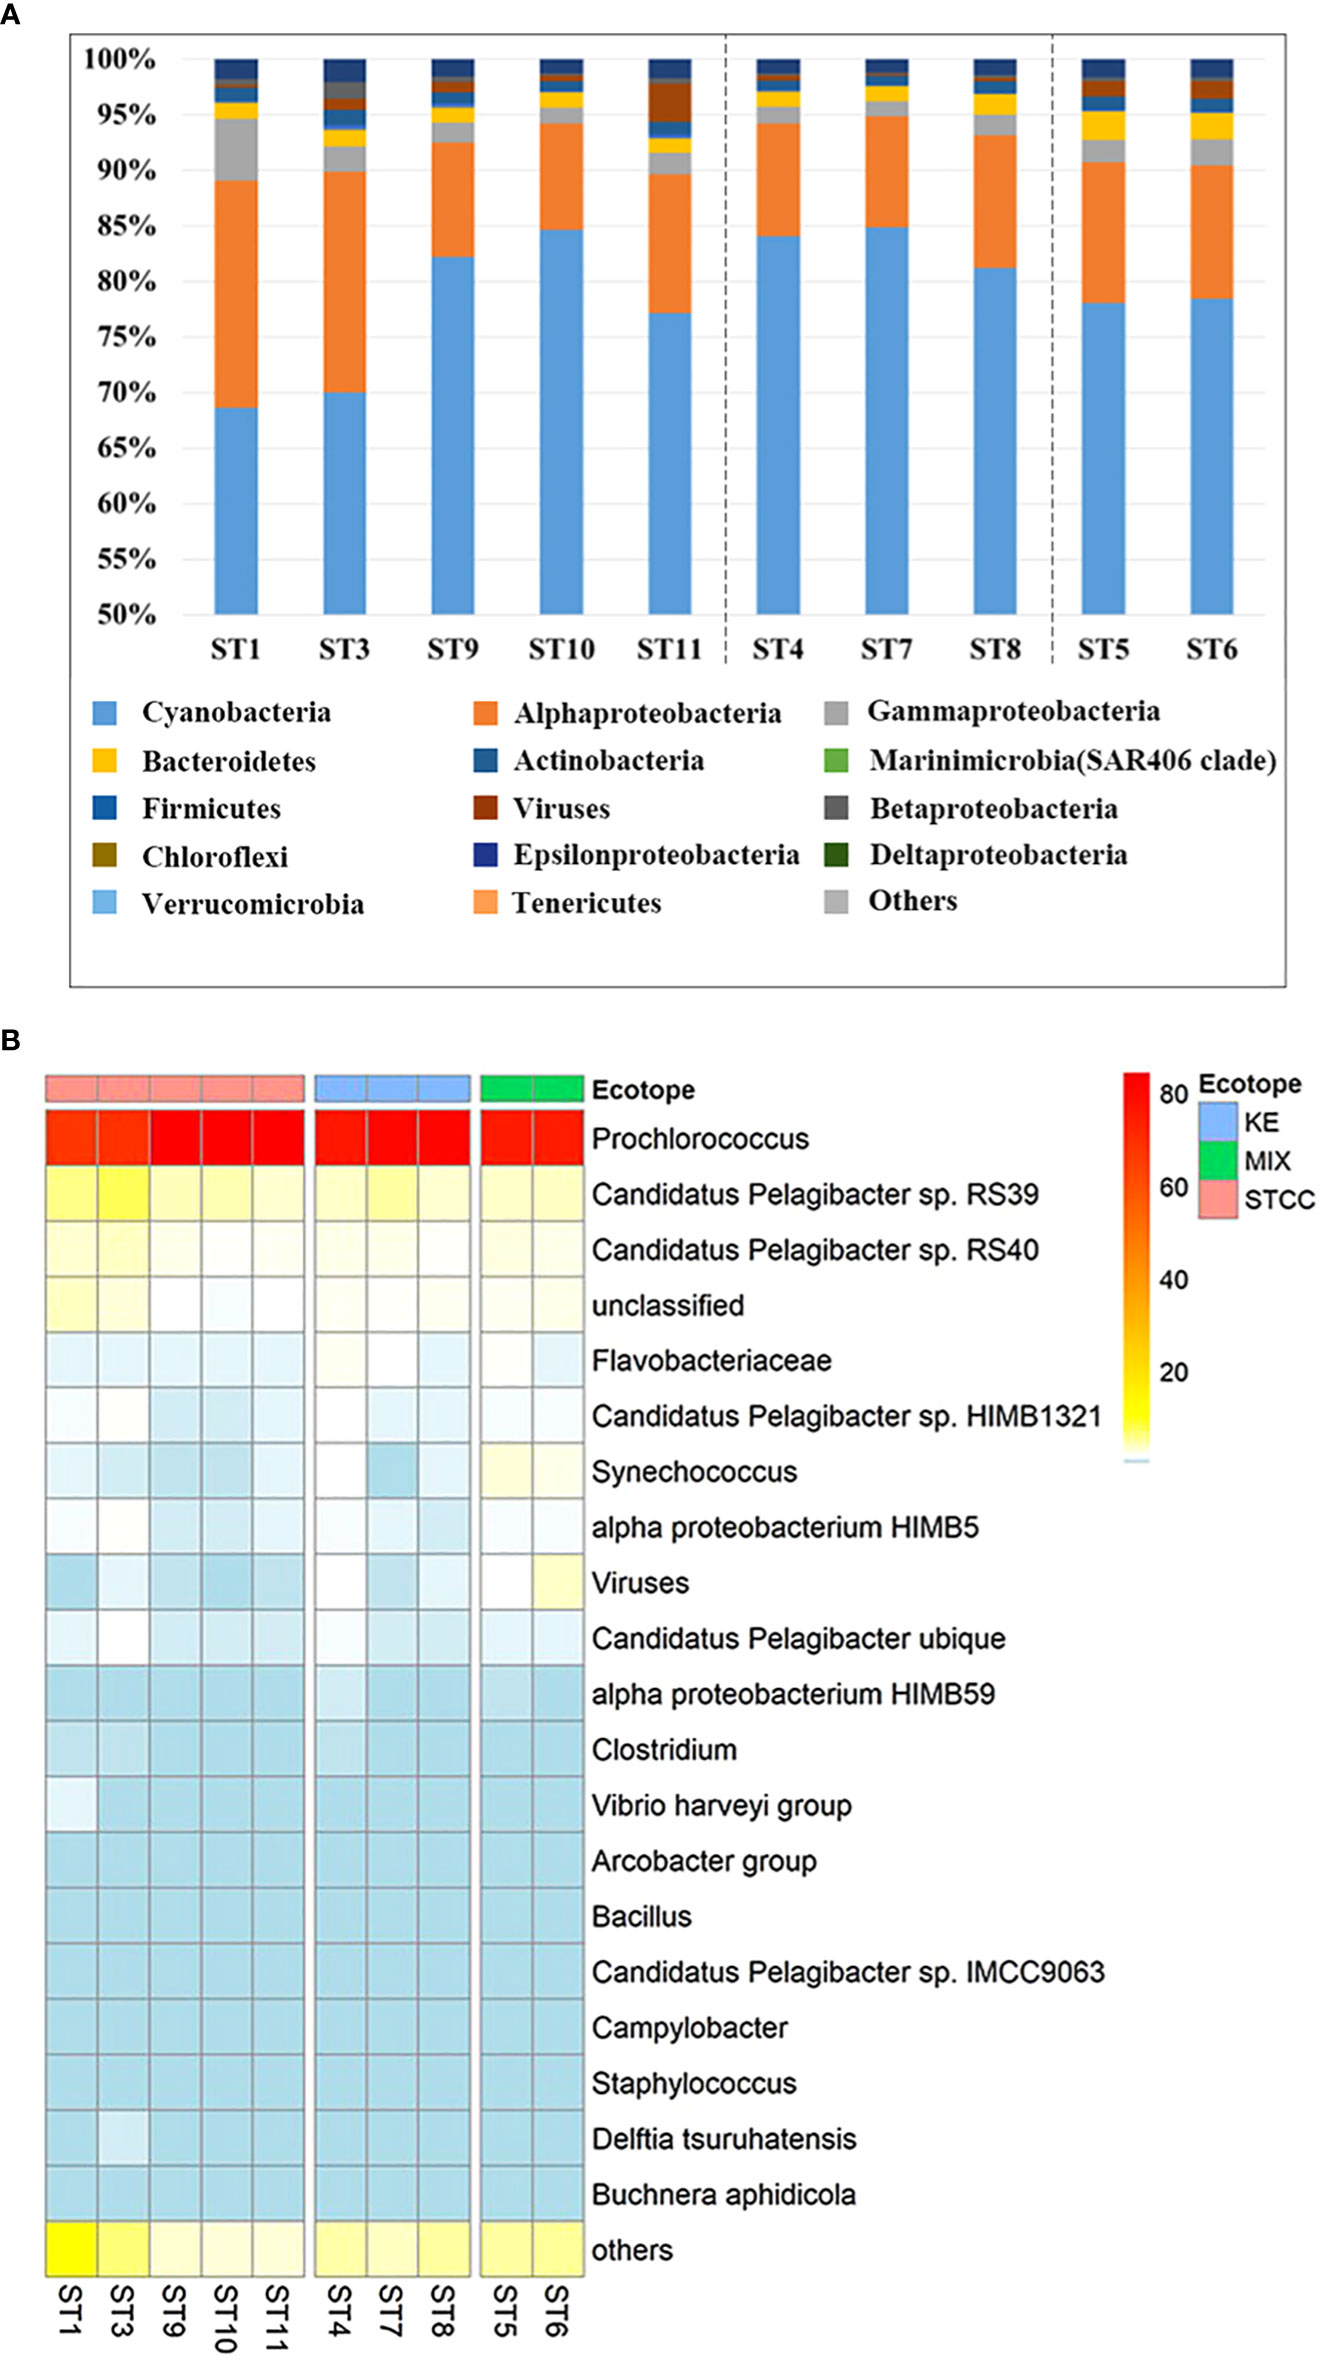
Figure 4 Relative abundance analysis of metagenomic sequences of ten sampling points in the NWPO surface layer during the summer cruise in 2018. (A) The histogram of the relative abundance of metagenomic sequences at the phylum level (proteobacteria for class level) and only the relative abundances of the top 15 phyla (class) were listed. (B) The heat map of relative abundance at the species level during the summer cruise in 2018 (only the relative abundances of the top 20 species are listed).
Gene functional analysis and diversity of bacterioplankton
In this study, a total of 1,566,315 non-repeat genes were identified through gene prediction. Among these, 12,376 genes were classified as core functional genes and accounted for 7.9% of the functional genes. Additionally, 36,912 functional genes were found to exist only in a single sample, accounting for 23.6% of all functional genes, while the remaining 1,073,431 functional genes made up 68.5% (Figure S1). The non-repeat genes shared between the two samples are counted in Table S5.
The functional genomic classification was performed using KEGG (Figure 5A), and the results indicated that the dominant planktonic microorganisms in the NWPO were metabolism-related genes, followed by genetic information processing and environmental information processing. Specifically, carbohydrate metabolism was the most abundant, accounting for 20% of all metabolic pathways (73,993 non-repeat genes). Amino acid transport and metabolism was the second most abundant, accounting for 18% (68,689 non-repeat genes), which was different from previous studies (Sunagawa et al., 2015). Metabolism of cofactors and vitamins accounted for 14% (51,267 non-repeated genes). Translation, replication and repair, folding, sorting, and degradation were the major sub-pathways of genetic information processing, others are shown in Figure 5A.

Figure 5 KEGG annotation of summer metagenomic data (A) and relative abundance analysis of subpathways among related samples (B). (A) The number of unigenes of the level 1 (KEGG metabolic pathway first level) and level 2 (KEGG metabolic pathway second level) in KEGG annotation results. (B) Heat map of the abundance of functional genes in different samples (red indicates the higher relative abundance, while green indicates the lower relative abundance).
To further understand the carbohydrate metabolic process of the samples, we performed CAZymes functional gene annotation. We listed the number of non-repeat genes for carbohydrase annotated by the three methods in Figure S2. The results showed that most non-repeat genes were annotated using HMMER. We selected the non-repeat genes that were annotated under both different methods for subsequent statistical analysis, and the results of the first level were listed in Table S6. Upon further analysis, 452 non-repeat genes were found to belong to auxiliary oxidoreductases, 160 non-repeat genes belonged to carbohydrate-binding modules, 810 non-repeat genes belonged to carbohydrate esterase, 3,323 non-repeat genes belonged to glycoside hydrolases, 5,358 non-repeat genes belonged to glycosyltransferases, and 39 non-repeats belonged to polysaccharide lyase. These results suggest that glycoside hydrolase and glycosyltransferase may be more actively transcribed in the samples. In addition, the number of ST5 and ST6 carbohydrates was found to be lower than in other samples, which was consistent with the KEGG annotation results (lower abundance of functional genes for ST5 and ST6 carbohydrate metabolism).
To identify the functional genes that have a significant effect on the differences between groups, a heat map of relative abundance between samples was done for the sub-pathways in this study (Figure 5B). Results showed that the functional gene abundance in the southern subtropical countercurrent zone (ST1 and ST3) and in the Kuroshio-Oyashio mixing zone (ST5 and ST6) was distinct from the other samples. The higher temperature in the southern subtropical countercurrent region was associated with an increased abundance of functional genes, except for the Sensory system and Cellular community-eukaryotes related to cellular processes. Conversely, the lower temperature and salinity in the Kuroshio-Oyashio mixing zone resulted in a lower abundance of functional metabolic pathway genes, except for Immune disease and Excretory system, which were higher than that in other areas. Samples from the mixed East China Sea and Kuroshio region (ST10 and ST11) had a similar functional gene distribution pattern to ST5 and ST6, but with slightly higher relative abundance. Samples from the Kuroshio Extension Return Zone (ST4, ST7, and ST8) and the Subtropical Countercurrent Zone (ST9) had a similar functional gene distribution pattern, with higher abundance compared to the Kuroshio-Oyashio mixing zone, but lower than ST1 and ST3.
We analyzed the functional genes involved in nitrogen, sulfur, and phosphorus metabolism in the metagenomes of our sampling sites. As shown in Figure S3A, key genes in the pathways of assimilatory nitrate reduction to ammonia (ANRA), dissimilatory nitrate reduction to ammonia (DNRA), denitrification, and nitrate assimilation were detected in metagenomes of the sampling sites. In general, the nirA and narG genes encoding the enzymes for nitrate/nitrite removal (ANRA and denitrification) showed high abundance in ST3 and ST11. The narB gene encoding the enzymes for ANRA showed high abundance in ST4 and ST7. However, the other key genes of nitrogen metabolism were most abundant in ST1, which was different from other regional samples.For sulfur metab olism, genes related to assimilatory sulfate reduction, dissimilatory sulfate reduction, and sulfur oxidation were detected in all sampling sites (Figure S3B). For sulfur oxidation, some genes involved in thiosulfate oxidation (soxC and soxD), and sulfite oxidation (soeC) had high abundances in ST5. The aprB gene (a key gene in dissimilatory sulfate reduction), soeA for sulfur oxidation, and the CysJ (a key gene in Assimilatory sulfate reduction) had the highest abundances in ST3. In ST1, the cysI/cysH genes encoding for Assimilatory sulfate reduction, and aprA for Dissimilatory sulfate reduction showed the highest abundances. We also identified key genes in phosphonate and phosphinate metabolism (Figure S3C). PhnP and phnA had the highest abundances in ST3 and were present at low abundance in other sampling sites. Pat and phnL showed the highest abundances in ST7. It is noteworthy that ST1 was also most abundant in phosphonate and phosphinate metabolism, with the same analysis results for the nitrogen anlfur metabolism.
Interestingly, Figure S3 exhibited a consistent trend with Figure 5B. As seen in Figure 5B, the Carbohydrate metabolism of ST1, ST3, ST4, ST7, and ST8, with a very high abundance of genes related to amino acid metabolism, was most likely due to the high summer temperature and lower nutrients content in these sea areas, which required more diverse metabolic pathways of carbon and nitrogen sources to more fully utilize the limited nutrient resources(Huo, 2012; Wang et al., 2021); And it was also found that the relative abundance of genes for transcription, translation, folding, sorting and degradation, and replication and repair functions related to protein metabolism were also higher in these samples than in others, indicating that microorganisms living in the subtropical countercurrent zone and the Kuroshio extension countercurrent area had more active gene transcription and faster cell proliferation or metabolism levels. And according to the results presented in Figure S3, ST1, and ST3 had a very high abundance of genes related to nitrogen, sulfur, and phosphorus metabolism, which was distinct from the other samples collected from the Subtropical Countercurrent Zone. Further, as evident from Figure 1, the sampling points of ST1 and ST3 were geographically separate from the others in the same zone. This suggests that pure geographic factors may play significant roles in shaping bacterial communities. Latitude, longitude, temperature, and salinity may be associated with specific microbial groups. These findings are consistent with previous studies (Wang et al., 2018b; Kong et al., 2020).
Prediction and annotation of metagenome-assembled genomes (MAGs)
We predicted and annotated possible new species based on the surface planktonic microbial metagenomes in the NWPO during summer. We employed MetaBAT2, MaxBin2, and Concoct for the initial binning of metagenomic data, and subsequently evaluated the quality of resulting bins using CheckM. As shown in Table S7, a total of 29 bins were obtained with high completeness and low contamination. These bins were further optimized by integrating the initial bins obtained from MetaBAT2, MaxBin2, and Concoct, resulting in 37 purified bins. The optimized bins were then assessed using CheckM, and the evaluation results are presented in Table S8. The results of FastANI and Sourmash analysis indicated that only two of the assembled genomes, MAG.21 and MAG.26, had an average nucleic acid similarity above 95% with known genomes, suggesting they belong to the same species (Table S9). PhyloPhlAn2 was used to search the published metagenome-based species-level assembled genome database to classify the species of the assembled genomes. It was found that eight of the assembled genomes were similar to published bins (Avg_dist < 0.05) while 29 were newly assembled. Among these 37 assembled genomes, 20 could be annotated to the kingdom level, 3 to the phylum level, 7 to the class level, 5 to the family level, and 2 to the species level, which was Delftia acidovorans for beta-proteobacteria, and Vibrio campbellii for gamma-proteobacteria. The results of the above analysis and assembled genome annotation were listed in Table S9, S10. The majority of the genomes belonged to alpha-proteobacteria, gamma-proteobacteria, and Flavobacteria within the Proteobacteria phylum, suggesting the abundance of Proteobacteria in the western Pacific Ocean and potentially in the global oceans may be underestimated.
We also found that the 37 MAGs could be clustered into four major groups based on their abundance in different samples. As shown in Figure 6, Cluster I was dominated by gamma-proteobacteria and had a higher abundance in all samples, particularly in subtropical countercurrent waters (ST1). Cluster II had a lower abundance in the lower-temperature Kuroshio-Oyashio mixing zone (ST5 and ST6) and the East China Sea-Kuroshio mixed zone (ST10 and ST11). Cluster III was comprised of various Proteobacteria and Archaea, with the highest abundance found in the Northwest Pacific subtropical countercurrent zone (ST3 and ST9). Cluster IV was mainly found in the lower-temperature Kuroshio-Oyashio mixing zone and the East China Sea-Kuroshio mixed zone. And we found that Delftia acidovorans (MAG.21) and Vibrio campbellii (MAG.26) had high abundance in all water masses and were mainly distributed in the high-temperature subtropical countercurrent zone (ST3 and ST1). Erythrobacter showed a similar distribution pattern as Vibrio campbellii, while Pelagibacteraceae (MAG.3) was mainly distributed in the subtropical countercurrent zone and the Kuroshio extension recirculation zone, similar to the spring distribution pattern. Flavobacterium was found in both the recirculation zone (MAG.10) and the mixed zone (MAG.12).
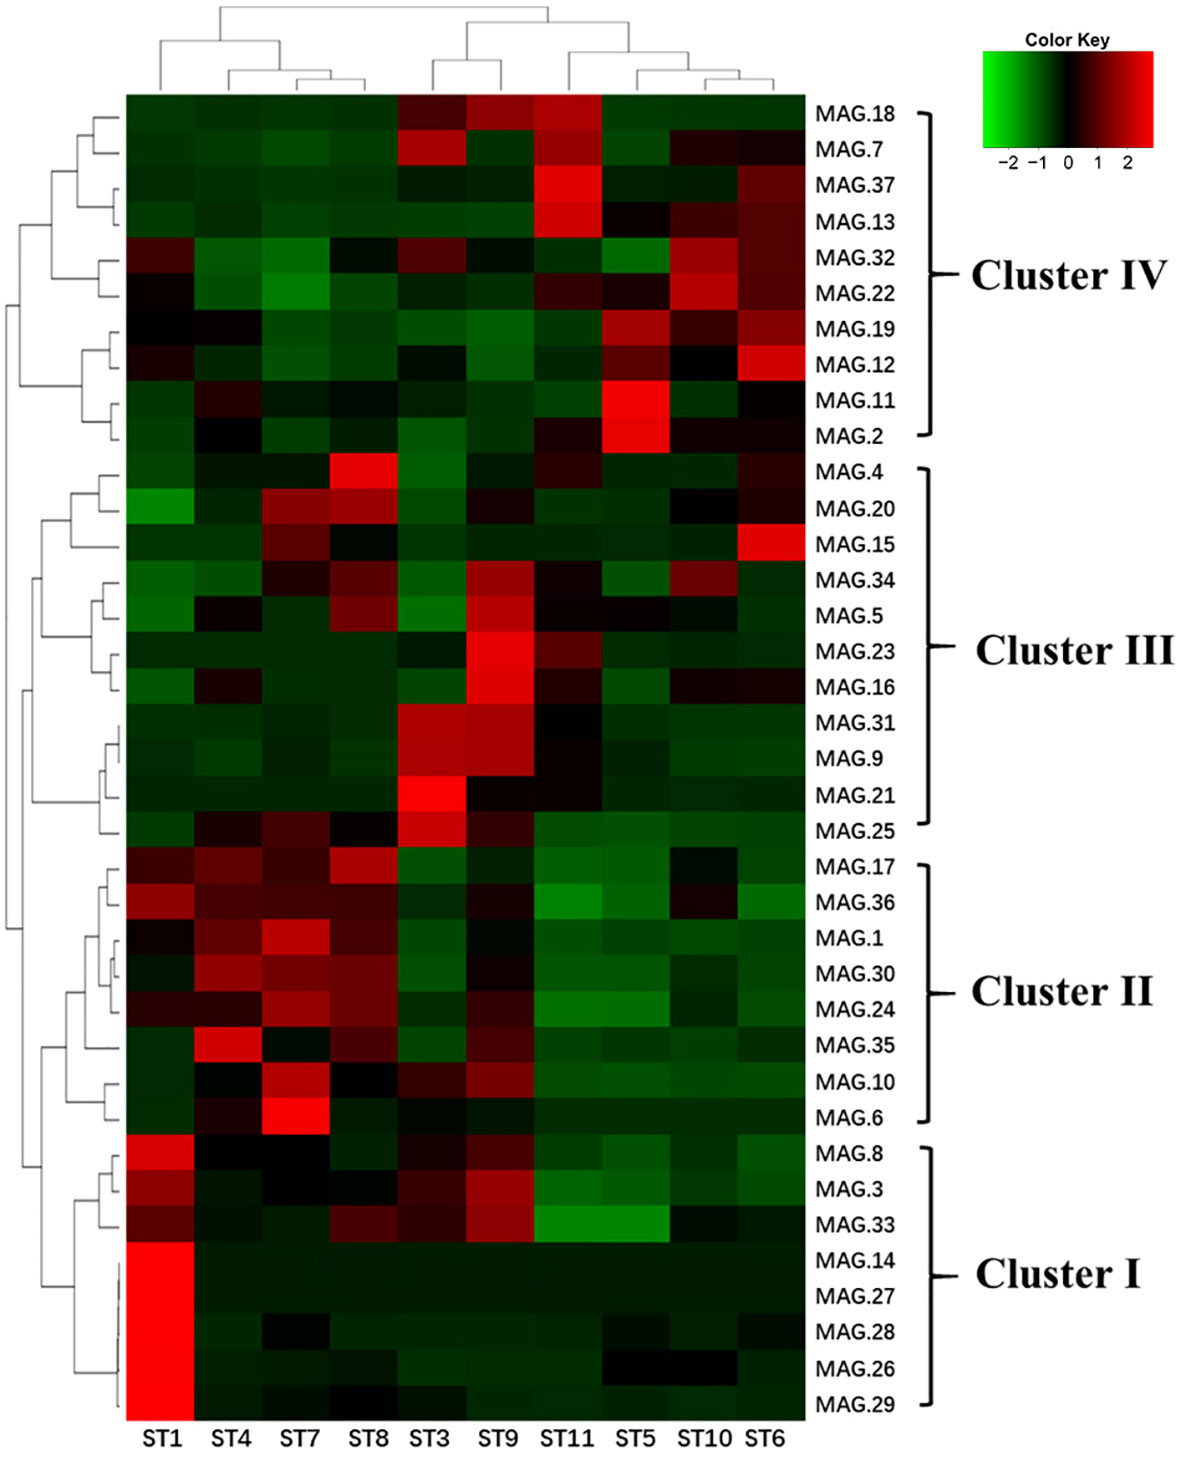
Figure 6 Heat map of the abundance analysis of MAGs of ten sampling points in the NWPO surface layer during the summer cruise (red indicates the higher relative abundance, while green indicates the lower relative abundance).
The assembled contigs were analysed using antiSMASH, resulting in the identification of 1195 biosynthetic gene clusters (BGCs) on 1172 contigs (Table S11). A total of 1154 BGCs (96.6%) were identified as being on a contig edge and were therefore categorized potentially incomplete, while 41 (3.4%) were full length. The average length of BGCs was 4.06 kb, with a maximum length of 46.9 kb. The most abundant classes of BGCs were terpenes (60.0%), followed by RRE-containing (5.4%), arylpolyene (5.3%) and RiPP-like (4.3%). In particular, BGCs were dominated by few subclasses. For all the 5594 genes in BGCs, 561 genes contained a squalene/phytoene synthase Pfam domain (PF00494). This indicates that the product of these BGCs is a tri- or tetraterpene. 340 genes also contained a lycopene cyclase domain (PF05834), 191 genes contained a Flavin containing amine oxidoreductase (PF01593), while 132 genes contained a Beta-carotene dioxygenase (PF15461).
Discussion
Planktonic bacterial diversity in the summer surface of the NWPO
Microorganisms play a critical role in the cycling of materials and energy in oceans. Therefore, understanding the seasonal distribution and diversity patterns of these microorganisms is crucial. The Northwest Pacific Gyre, known as one of the oligotrophic oceans on Earth, exhibits large temperature and nutrient concentration differences due to the interaction of the Kuroshio and Oyashio (Li et al., 2018b). In this environmental context, the structure of microbial communities in the NWPO varies among distinct water masses, providing an excellent model for studying the adaptation mechanisms of microorganisms to environmental changes.
In this study, more than 40 phyla of bacteria, with over 6000 microorganisms, were analyzed and annotated using metagenomic sequencing techniques. Consistent with previous studies (Fuhrman, 2009; Suh et al., 2014; Li et al., 2018a; Kong et al., 2020), The most abundant phylum was Cyanobacteria, with an average relative abundance of 78.9%, followed by Proteobacteria (16.2%), Bacteroidetes (1.7%), and Firmicutes (1.1%) (Figure 4A). Cyanobacteria had a relatively high abundance at each sampling site, followed by alpha-proteobacteria and gamma-proteobacteria, whose relative abundance was higher at sampling sites ST1 and ST3. The dominant species within Cyanobacteria was Prochlorococcus, accounting for 77.6% of the total (Figure 4B). Prochlorococcus, pico-class phytoplankton, because of its streamlined genome and high adaptability to low nutrient environments (Giovannoni et al., 2014; Milici et al., 2016), was widespread in oligotrophic seas around the world and was an important producer in oligotrophic sea areas, for example, in the central (Rusch et al., 2007; Zhou et al., 2018) and southern (de Jesus Affe et al., 2018) Atlantic Ocean, the eastern(Thompson et al., 2018) and equatorial Pacific (Kent et al., 2016), the northern (Díez et al., 2016) and equatorial eastern Indian Ocean(Ding et al., 2021). Synechococcus of Cyanobacteria was also widely distributed at all stations, but in lower abundance overall. The highest abundance was found in Kuroshio-Oyashio mixing zone. It was consistent with the finding that Synechococcus is more competitive in more trophic sea areas (Partensky et al., 1999; Li et al., 2018b).
The most common alpha-proteobacteria was SAR11 (Pelagibacter), the second dominant species in the study area. SAR11 was widely distributed in all sampling sites, but had the highest relative abundance in ST1 and ST3(Figure 4B). Like Prochlorococcus, SAR11 had a streamlined genome and was well adapted to low-nutrient environments. It had a very high biomass in the ocean and represented 25% or more of the total bacterial cells in seawater worldwide (Giebel et al., 2009; Brown et al., 2012; Giovannoni and Annual, 2017). Compared to Prochlorococcus, SAR11 had a wider geographical distribution, ranging from the hot equator to the poles(Becker et al., 2019; Dinasquet et al., 2022), with the highest biomass in oligotrophic marine environments (Giovannoni and Annual, 2017). In our study area, SAR11 had considerable diversity, with seven species in the top 20 in terms of relative abundance.
Seasonal distribution patterns of surface bacterioplankton in the NWPO
To further investigate the distribution patterns of surface microorganisms in the NWPO, the cited data (Li et al., 2018b) were analyzed, and a total of 22 phyla of bacteria were obtained. The phylum with the top 15 average abundance (Proteobacteria as the class) from the two cruise samples was taken for comparison and analysis of seasonal differences in community composition between water masses (Figure 7A). The results indicated distinct patterns of surface bacterioplankton distribution in the NWPO during spring and summer. In spring, the abundance of Cyanobacteria gradually decreased with increasing latitude, from the subtropical countercurrent zone to the Kuroshio-Oyashio mixing zone. Alpha-proteobacteria, gamma-proteobacteria, and Actinomycetes were more abundant in the Kuroshio extension countercurrent area. Meanwhile, the abundance of the Bacteroidetes and Marinimicrobia (SAR406 Clade) was higher in the Kuroshio-Oyashio mixing zone (Figure 7A). In addition, the Venn diagram of species distribution showed that there were 94 common genus species between the different water masses during the spring survey, accounting for only 31.4% of all genus species. The subtropical countercurrent zone alone contained 73 species of genera, with marked differences in community structure between different water masses (Figure S4A). The summer cruise results showed that the abundance of Cyanobacteria was lower at the two southernmost stations (ST1, ST3) and in mixed sea areas. The abundance of alpha-proteobacteria and gamma-proteobacteria was slightly higher in ST1, ST3, and Kuroshio-Oyashio mixing zone, and the abundance of Bacteroidetes was also slightly higher in Kuroshio-Oyashio mixing zone than in other areas (Figure 7A). The species common to the different water masses were 2153, accounting for 95.7% of all species, while less than 0.5% were endemic to each water mass (Figure S4B). This further demonstrated that there is a large variation in planktonic bacterial communities between water masses during spring. However, the community composition between the different water masses on the surface was almost identical during summer, and it was likely that microbial migration between water masses had occurred.
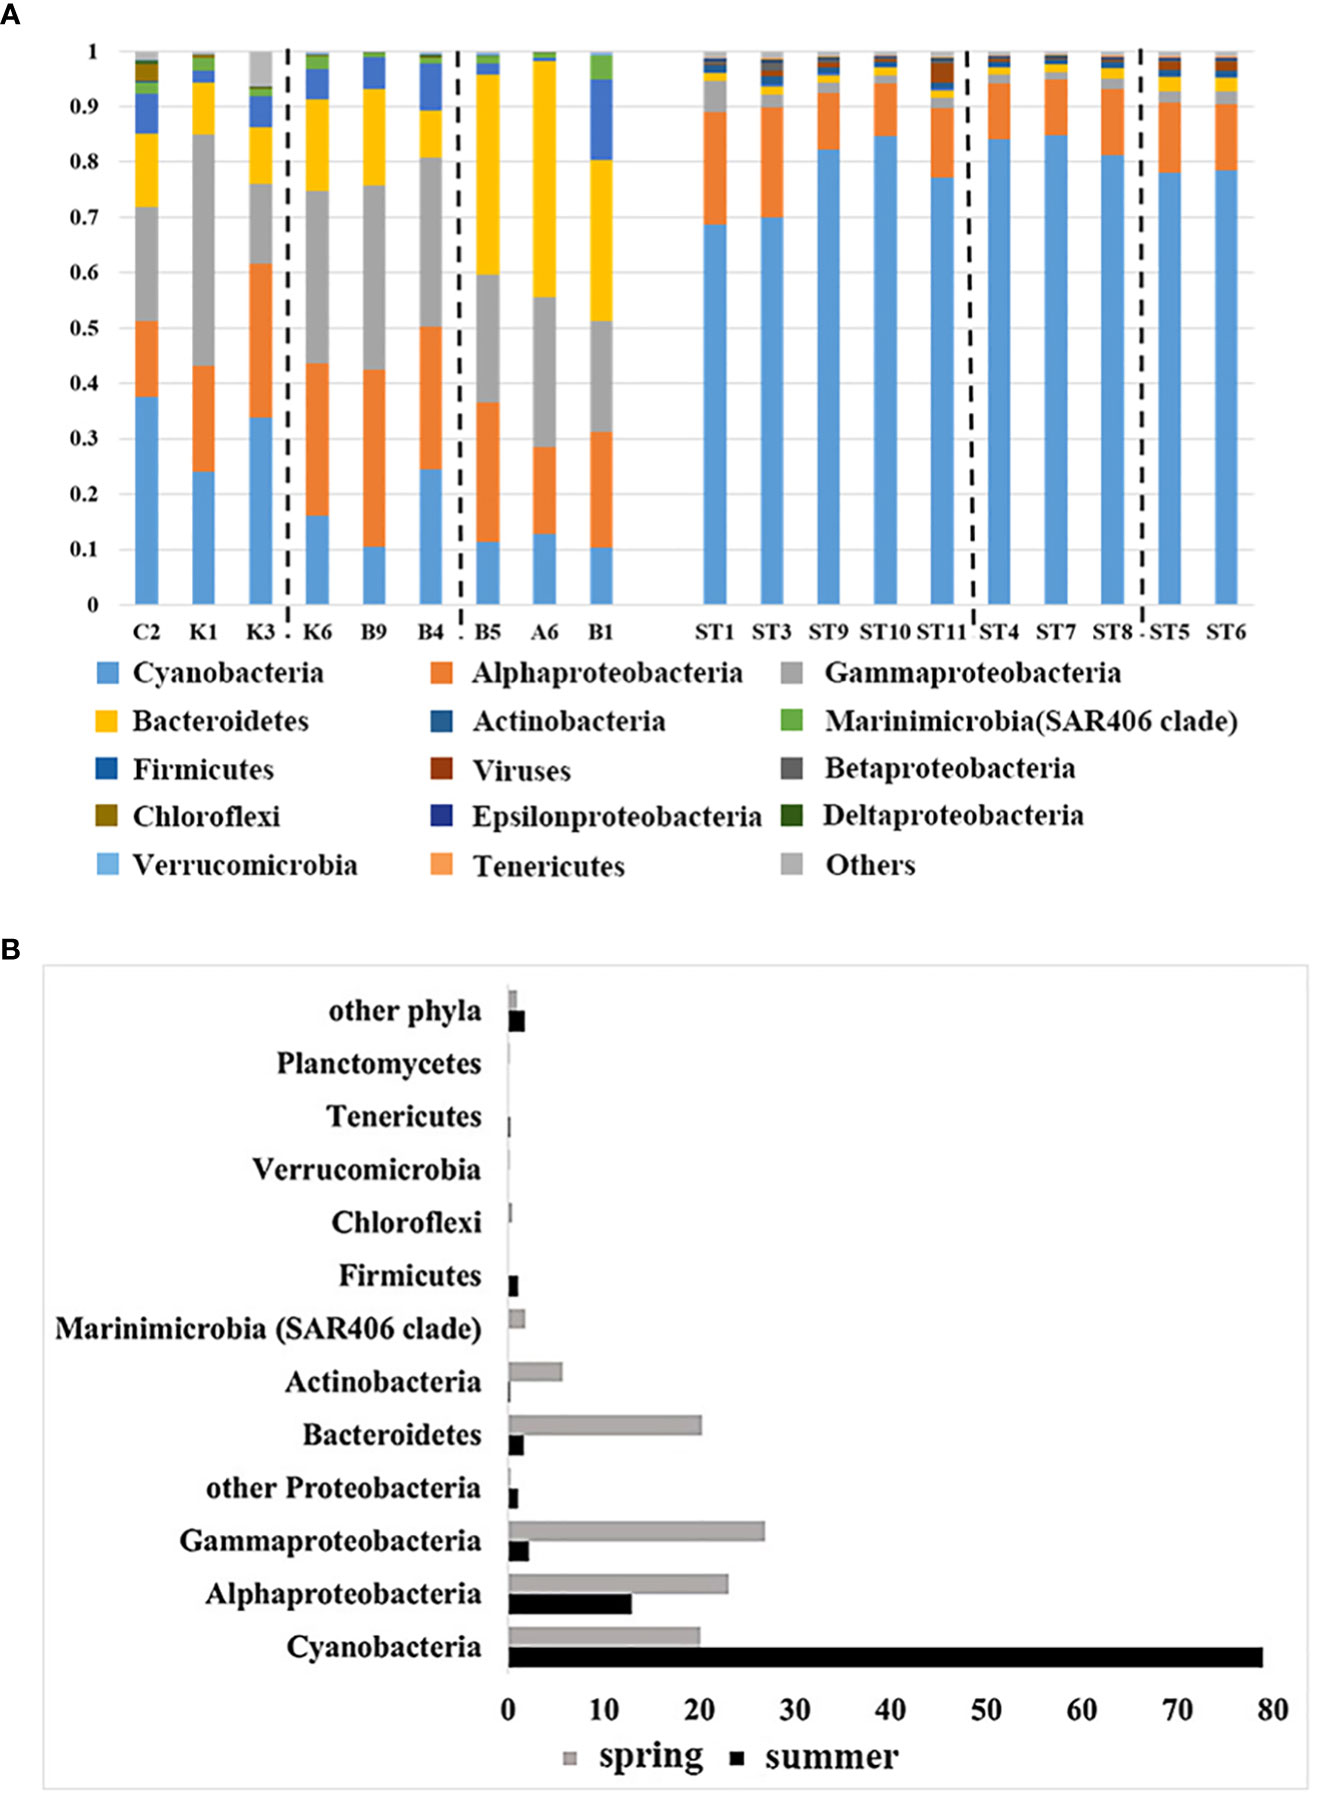
Figure 7 Comparison of community composition (A) during the spring cruise in 2015 (left) and the summer cruise in 2018 (right) in the NWPO (only the relative abundance of the top 15 phyla is listed) and comparison of the relative abundance of the top 12 phyla(class) (B) during the two cruises.
As shown in Figure 7, the relative abundance of the bacterial communities was found to be dominated by Cyanobacteria, Proteobacteria, Bacteroidetes, and Actinomycetes, accounting for over 95% of the relative abundance (sequence number relative ratio). And they had different distribution patterns in different seasons. Cyanobacteria were the dominant species in this ecosystem. Interestingly, during the summer cruise, the average relative abundance of Cyanobacteria increased from about 20% in the spring cruise to about 80%, becoming the first dominant species. The second was Proteobacteria, which accounted for 35-61% of the community composition during the spring survey. In contrast, the abundance of both alpha-proteobacteria and gamma-proteobacteria decreased during the summer cruise compared to the spring cruise (10% for the former and 20% for the latter), with the average abundance of the former being 13% and the latter 2.2% during the summer cruise, while the relative abundance of other Proteobacteria increased during the summer cruise (Figure 7B). Bacteroidetes, Actinomycetes, SAR406 Clade (Marinimicrobia) and Chloroflexi were the main constituents of the spring planktonic bacterial community structure. While the abundance of Firmicutes increased significantly during the summer months (Figure 7B). And we detected viruses in all samples in summer with abundances ranging from 0.1% to 3.4%.
We further analyzed the horizontal distribution of genus and species. The heat map of the planktonic bacterial community revealed that the two main genera under Cyanobacteria, Prochloron, and Synechococcus, were comparatively less abundant in the Kuroshio-Oyashio mixing zone compared to the other two areas during the spring survey, with Prochlorococcus not being detected at station B1 (Figure S5). During the spring survey, SAR86 of gamma-proteobacteria and the Rhodobacteraceae of alpha-proteobacteria were abundantly present at all stations, with the former being predominantly present in the nutrient-poor subtropical countercurrent zone and the latter being primarily found in the Kuroshio-Oyashio mixing zone and the Kuroshio Extension countercurrent zone. Although SAR11 was detected at all stations, its relative abundance was low (<5%), especially in the Kuroshio-Oyashio mixing zone and C2 (<1%). The three groups NS4, NS5, and NS9 of Flavobacteriales belonging to the Bacteroidetes were predominantly distributed in the Kuroshio-Oyashio mixing zone (Figure S5). These taxa were found to be adhesive and mainly lived attached to large particulate matter primarily attached to large particulate matter, with their distribution in the Atlantic Ocean being primarily in coastal areas with high nutrient concentrations (Milici et al., 2016). In contrast to the Atlantic Ocean, Pseudoalteromonas, the genus of gamma-proteobacteria, had a high relative abundance in the nutrient-poor subtropical countercurrent zone (K1) (Milici et al., 2016). During the summer survey, slight variations in species abundance were observed between the different water masses, although the community composition remained unchanged. Prochlorococcus was abundant in summer, with its relative abundance far surpassing that of all other species combined, with the highest abundance of 84.4% being found at station ST10 in the subtropical countercurrent zone. The average abundance of Synechococcus was relatively low at around 1%. And the SAR11 (Brown et al., 2012; West et al., 2016; Giovannoni and Annual, 2017; Maturana-Martínez et al., 2022) of alpha-proteobacteria, which was as widely distributed as Prochlorococcus in the surface ocean in previous surveys, had only a maximum abundance of 17.5% in the NWPO. Several species of SAR11, Candidatus Pelagibacter sp. RS39, Candidatus Pelagibacter sp. RS40, Candidatus Pelagibacter sp. HIMB1321, Candidatus Pelagibacter ubique, and Flavobacteriaceae, under the Bacteroidetes, were primarily distributed in the Kuroshio Extension countercurrent zone and the Kuroshio-Oyashio mixing zone (Figure 7B).
Different distribution patterns of SAR11 and Prochlorococcus
Prochlorococcus (Biller et al., 2015) and SAR11 (Giebel et al., 2009; Brown et al., 2012; Giovannoni and Annual, 2017) are two significant players in the marine microbial communities, particularly in the surface layers of the global oceans. Both SAR11 and Prochlorococcus were in fairly high abundance in the surface layers of the global oceans (except in the Southern Ocean). They accounted for 30% to 50% of the total community composition of the surface layer of the ocean, with a high SAR11 abundance of 15-41% (Sunagawa et al., 2015; Becker et al., 2019). However, the abundance of SAR11 was generally low in this research. In particular, the abundance was 0.25% to 4.5% in the May 2015 study of 16S rRNA. In contrast, the abundance of Prochlorococcus was generally high, especially in the August 2018 metagenomic study, where it accounted for more than 80% of the community (Figure S6).
There may be four reasons for the above distribution pattern: (1) Environmental conditions: The NWPO is located in the subtropical circulation and is in a perennial oligotrophic state due to strong stratification. There is a Pacific warm pool in the south. Influenced by the subtropical countercurrent, there is a strong western boundary current, the Kuroshio, to the west, and the influence of the Kuroshio Extension and Oyashio to the north(Fujiki et al., 2016; Kitamura et al., 2016; Cheng et al., 2017; Oka et al., 2018). The warm pool-Kuroshio-Kuroshio Extension has a strong influence on the community composition of the NWPO. The predominant pico-phytoplankton in the western Pacific warm pool and Kuroshio is Prochlorococcus, which can reach a cell abundance of 4~20×104 ml-1 (Choi et al., 2016). It is shown that in addition to the ability of Prochlorococcus itself to adapt to oligotrophic environments, Kuroshio plays a relatively important role in the input of the Northwest Pacific basin. (2) Seasonal change: In the study of Tara Oceans, the microbial samples were in the spring, autumn, and winter seasons corresponding to the northern and southern hemispheres (Sunagawa et al., 2015). Our metagenomic samples were collected from August to September 2018. At this time, it was late summer and early autumn in the NWPO. Previous studies had shown that the abundance of Cyanobacteria increased significantly in summer, especially Prochlorococcus, while the abundance of Proteobacteria decreased (Suh et al., 2014; Fujiki et al., 2016). (3) The interaction between Prochlorococcus and SRA11: There are many different strains of Prochlorococcus and SRA11, and there are some differences in ecological functions between different strains, which also makes the formation of complex interrelationships between Prochlorococcus and SRA11. For example, the potential symbiotic relationship (Carini et al., 2014). The glycolate produced during photorespiration in Prochlorococcus can fulfill the glycine requirements of some SAR11 strains (Carini et al., 2013). (4) Amensalism: In the co-cultivation experiment, when Prochlorococcus proliferates into a stable period, the abundance of SAR11 decreases. The relationship between SAR11 and Prochlorococcus changed from a symbiotic relationship at the beginning of the co-culture to amensalism(Becker et al., 2019). The significantly higher abundance of Prochlorococcus than SAR11 in the NWPO is also likely to be related to a change in the relationship between the two species. Therefore, further research is needed on the structure of microbial communities and species interactions in the NWPO.
Conclusion
In this study, the bacterioplankton community in the surface waters of the NWPO was investigated using metagenomic methods to shed light on the microbial taxonomy and functional diversity in this dynamic region. The distribution patterns of planktonic bacteria in different seasons were also analyzed in comparison with data from the literature. In total, more than 40 phyla and 2246 Prokaryotes, with Cyanobacteria, alpha-proteobacteria, gamma-proteobacteria, and Bacteroidetes being the dominant taxa. The distribution of bacterioplankton varied seasonally, with a clear latitudinal (regional) distribution pattern observed in spring, while environmental conditions such as temperature led to changes in the distribution pattern in summer. During summer, Cyanobacteria became the most dominant species, and the bacterioplankton communities became less diverse between water masses. At the same time, community differences between regions narrowed as environmental heterogeneity became smaller. The spatial separation of planktonic bacteria changed significantly. In addition, unlike the oligotrophic seas of the Eastern Pacific and Atlantic, the NWPO had a unique ocean current environment, with a low abundance of Proteobacteria, such as SAR11 and SAR86. The metabolic processes of microorganisms in the surface layer of the NWPO were dominated by carbohydrate metabolism, followed by amino acid transport and metabolism. And there was a low relative abundance of functional genes for carbohydrate metabolism in the microbial community of the Kuroshio-Oyashio mixing zone. This large-scale microbial metagenomic study also led to the assembly of 37 metagenomic assembled genomes (MAGs) belonging to the Proteobacteria, Bacteroidetes, and Euryarchaeota, providing further insights into the ecological functions of microorganisms in the region.
Data availability statement
The datasets presented in this study can be found in online repositories. The names of the repository/repositories and accession number(s) can be found below: https://www.ncbi.nlm.nih.gov/, PRJNA934102.
Author contributions
YW and HL performed the experiments, analyzed the data, and wrote the manuscript. RH and WZ designed the experiments and analyzed the data. All authors commented on the manuscript. All authors contributed to the article and approved the submitted version.
Funding
This work was supported by the National Key Research and Development Program of China (2018YFA0605800), the National Natural Science Foundation of China [grant numbers 32170065, 31970113].
Acknowledgments
The two sampling surveys were supported by the Laboratory of Marine Isotopic Technology and Environmental Risk Assessment, Third Institute of Oceanography, Ministry of Natural Resource, via the Survey Project of Environmental Radioactivity Detection in the Western Pacific (R/V Xiangyanghong 3 during May–June 2018, and R/V Tan Kah Kee during August–September 2018).
Conflict of interest
The authors declare that the research was conducted in the absence of any commercial or financial relationships that could be construed as a potential conflict of interest.
Publisher’s note
All claims expressed in this article are solely those of the authors and do not necessarily represent those of their affiliated organizations, or those of the publisher, the editors and the reviewers. Any product that may be evaluated in this article, or claim that may be made by its manufacturer, is not guaranteed or endorsed by the publisher.
Supplementary material
The Supplementary Material for this article can be found online at: https://www.frontiersin.org/articles/10.3389/fmars.2023.1177401/full#supplementary-material
References
Alneberg J., Bjarnason B. S., de Bruijn I., Schirmer M., Quick J., Ijaz U. Z., et al. (2014). Binning metagenomic contigs by coverage and composition. Nat. Methods 11 (11), 1144–1146. doi: 10.1038/nmeth.3103
Becker J. W., Hogle S. L., Rosendo K., Chisholm S. W. (2019). Co-Culture and biogeography of prochlorococcus and SAR11. Isme J. 13 (6), 1506–1519. doi: 10.1038/s41396-019-0365-4
Benson B. B., Krause D. (1984). The concentration and isotopic fractionation of oxygen dissolved in fresh-water and seawater in equilibrium with the atmosphere. Limnol. Oceanogr. 29 (3), 620–632. doi: 10.4319/lo.1984.29.3.0620
Biller S. J., Berube P. M., Lindell D., Chisholm S. W. (2015). Prochlorococcus: the structure and function of collective diversity. Nat. Rev. Microbiol. 13 (1), 13–27. doi: 10.1038/nrmicro3378
Blin K., Shaw S., Kloosterman A. M., Charlop-Powers Z., van Wezel G. P., Medema M. H., et al. (2021). antiSMASH 6.0: improving cluster detection and comparison capabilities. Nucleic Acids Res. 49 (W1), W29–w35. doi: 10.1093/nar/gkab335
Bolger A. M., Lohse M., Usadel B. (2014). Trimmomatic: a flexible trimmer for illumina sequence data. Bioinformatics 30 (15), 2114–2120. doi: 10.1093/bioinformatics/btu170
Bolyen E., Rideout J. R., Dillon M. R., Bokulich N. A., Abnet C. C., Al-Ghalith G. A., et al. (2019). Reproducible, interactive, scalable and extensible microbiome data science using QIIME 2. Nat. Biotechnol. 37 (8), 852–857. doi: 10.1038/s41587-019-0209-9
Brown M. V., Lauro F. M., DeMaere M. Z., Muir L., Wilkins D., Thomas T., et al. (2012). Global biogeography of SAR11 marine bacteria. Mol. Syst. Biol. 8, 595. doi: 10.1038/msb.2012.28
Brum J. R., Ignacio-Espinoza J. C., Roux S., Doulcier G., Acinas S. G., Alberti A., et al. (2015). Ocean plankton. patterns and ecological drivers of ocean viral communities. Science 348 (6237), 1261498. doi: 10.1126/science.1261498
Cantarel B. L., Coutinho P. M., Rancurel C., Bernard T., Lombard V., Henrissat B. (2009). The carbohydrate-active EnZymes database (CAZy): an expert resource for glycogenomics. Nucleic Acids Res. 37 (Database issue), D233–D238. doi: 10.1093/nar/gkn663
Carini P., Campbell E. O., Morre J., Sanudo-Wilhelmy S. A., Thrash J. C., Bennett S. E., et al. (2014). Discovery of a SAR11 growth requirement for thiamin’s pyrimidine precursor and its distribution in the Sargasso Sea. Isme J. 8 (8), 1727–1738. doi: 10.1038/ismej.2014.61
Carini P., Steindler L., Beszteri S., Giovannoni S. J. (2013). Nutrient requirements for growth of the extreme oligotroph ‘Candidatus pelagibacter ubique’ HTCC1062 on a defined medium. Isme J. 7 (3), 592–602. doi: 10.1038/ismej.2012.122
Carradec Q., Pelletier E., Da Silva C., Alberti A., Seeleuthner Y., Blanc-Mathieu R., et al. (2018). A global ocean atlas of eukaryotic genes. Nat. Commun. 9 (1), 373. doi: 10.1038/s41467-017-02342-1
Cheng Y.-H., Ho C.-R., Zheng Q., Qiu B., Hu J., Kuo N.-J. (2017). Statistical features of eddies approaching the kuroshio east of Taiwan island and Luzon island. J. Oceanogr. 73 (4), 427–438. doi: 10.1007/s10872-017-0411-7
Choi D. H., An S. M., Chun S., Yang E. C., Selph K. E., Lee C. M., et al. (2016). Dynamic changes in the composition of photosynthetic picoeukaryotes in the northwestern pacific ocean revealed by high-throughput tag sequencing of plastid 16S rRNA genes. FEMS Microbiol. Ecol. 92 (2), 11. doi: 10.1093/femsec/fiv170
de Jesus Affe H. M., Rigonato J., de Castro Nunes J. M., Menezes M. (2018). Metagenomic analysis of cyanobacteria in an oligotrophic tropical estuary, south Atlantic. Front. Microbiol. 9. doi: 10.3389/fmicb.2018.01393
de Vargas C., Audic S., Henry N., Decelle J., Mahé F., Logares R., et al. (2015). Ocean plankton. eukaryotic plankton diversity in the sunlit ocean. Science 348 (6237), 1261605. doi: 10.1126/science.1261605
Díez B., Nylander J. A., Ininbergs K., Dupont C. L., Allen A. E., Yooseph S., et al. (2016). Metagenomic analysis of the Indian ocean picocyanobacterial community: structure, potential function and evolution. PloS One 11 (5), e0155757. doi: 10.1371/journal.pone.0155757
Dinasquet J., Landa M., Obernosterer I. (2022). SAR11 clade microdiversity and activity during the early spring blooms off kerguelen island, southern ocean. Environ. Microbiol. Rep. 14 (6), 907–916. doi: 10.1111/1758-2229.13117
Ding C. L., Wu C., Guo C. C., Gui J., Wei Y. Q., Sun J. (2021). The composition and primary metabolic potential of microbial communities inhabiting the surface water in the equatorial Eastern Indian ocean. Biology-Basel 10 (3), 15. doi: 10.3390/biology10030248
Doney S. C., Ruckelshaus M., Duffy J. E., Barry J. P., Chan F., English C. A., et al. (2012). Climate change impacts on marine ecosystems. Ann. Rev. Mar. Sci. 4, 11–37. doi: 10.1146/annurev-marine-041911-111611
Dröge J., Gregor I., McHardy A. C. (2015). Taxator-tk: precise taxonomic assignment of metagenomes by fast approximation of evolutionary neighborhoods. Bioinformatics 31 (6), 817–824. doi: 10.1093/bioinformatics/btu745
Fuhrman J. A. (2009). Microbial community structure and its functional implications. Nature 459 (7244), 193–199. doi: 10.1038/nature08058
Fujiki T., Matsumoto K., Mino Y., Sasaoka K., Wakita M., Kawakami H., et al. (2014). Seasonal cycle of phytoplankton community structure and photophysiological state in the western subarctic gyre of the north pacific. Limnol. Oceanogr. 59 (3), 887–900. doi: 10.4319/lo.2014.59.3.0887
Fujiki T., Sasaoka K., Matsumoto K., Wakita M., Mino Y. (2016). Seasonal variability of phytoplankton community structure in the subtropical western north pacific. J. Oceanogr. 72 (3), 343–358. doi: 10.1007/s10872-015-0346-9
Giebel H. A., Brinkhoff T., Zwisler W., Selje N., Simon M. (2009). Distribution of roseobacter RCA and SAR11 lineages and distinct bacterial communities from the subtropics to the southern ocean. Environ. Microbiol. 11 (8), 2164–2178. doi: 10.1111/j.1462-2920.2009.01942.x
Giovannoni S. J., Annual R. (2017). SAR11 bacteria: the most abundant plankton in the oceans. Annu. Rev. Mar. Sci. 9, 231–255. doi: 10.1146/annurev-marine-010814-015934
Giovannoni S. J., Thrash J. C., Temperton B. (2014). Implications of streamlining theory for microbial ecology. Isme J. 8 (8), 1553–1565. doi: 10.1038/ismej.2014.60
Gurevich A., Saveliev V., Vyahhi N., Tesler G. (2013). QUAST: quality assessment tool for genome assemblies. Bioinformatics 29 (8), 1072–1075. doi: 10.1093/bioinformatics/btt086
Huo Y. (2012). Polyphasic taxonomic and genomic studies of offshore bacteria and metagenomic analysis of a deep-sea sediment. doctor (Zhejiang, China: Zhejiang University).
Jain C., Rodriguez R. L., Phillippy A. M., Konstantinidis K. T., Aluru S. (2018). High throughput ANI analysis of 90K prokaryotic genomes reveals clear species boundaries. Nat. Commun. 9 (1), 5114. doi: 10.1038/s41467-018-07641-9
Kanehisa M., Furumichi M., Tanabe M., Sato Y., Morishima K. (2017). KEGG: new perspectives on genomes, pathways, diseases and drugs. Nucleic Acids Res. 45 (D1), D353–d361. doi: 10.1093/nar/gkw1092
Kang D. D., Li F., Kirton E., Thomas A., Egan R., An H., et al. (2019). MetaBAT 2: an adaptive binning algorithm for robust and efficient genome reconstruction from metagenome assemblies. PeerJ 7, e7359. doi: 10.7717/peerj.7359
Kent A. G., Dupont C. L., Yooseph S., Martiny A. C. (2016). Global biogeography of prochlorococcus genome diversity in the surface ocean. Isme J. 10 (8), 1856–1865. doi: 10.1038/ismej.2015.265
Kitamura T., Nakano T., Sugimoto S. (2016). Decadal variations in mixed layer salinity in the kuroshio extension recirculation gyre region: influence of precipitation during the warm season. J. Oceanogr 72 (2), 167–175. doi: 10.1007/s10872-015-0317-1
Kong J., Liu X., Wang L., Huang H., Ou D., Guo J., et al. (2020). Patterns of relative and quantitative abundances of marine bacteria in surface waters of the subtropical north pacific ocean estimated with high-throughput quantification sequencing. Front. Microbiol. 11. doi: 10.3389/fmicb.2020.599614
Lewis E., Wallace D. (1998). Program developed for CO2 system calculations. ORNL/CDIAC-105, carbon dioxide information analysis center (Oak Ridge, Tennessee: Oak Ridge National Laboratory, US Department of Energy).
Li Y. Y., Chen X. H., Xie Z. X., Li D. X., Wu P. F., Kong L. F., et al. (2018b). Bacterial diversity and nitrogen utilization strategies in the upper layer of the northwestern pacific ocean. Front. Microbiol. 9. doi: 10.3389/fmicb.2018.00797
Li C.-L., Han L., Zhai W.-D., Qi D., Wang X.-C., Lin H.-M., et al. (2022). Storage and redistribution of anthropogenic CO2 in the western north pacific: the role of subtropical mode water transportation. Fundam. Res. doi: 10.1016/j.fmre.2022.05.001
Li Y., Jing H., Xia X., Cheung S., Suzuki K., Liu H. (2018a). Metagenomic insights into the microbial community and nutrient cycling in the Western subarctic pacific ocean. Front. Microbiol. 9. doi: 10.3389/fmicb.2018.00623
Li D., Liu C.-M., Luo R., Sadakane K., Lam T.-W. (2015). MEGAHIT: an ultra-fast single-node solution for large and complex metagenomics assembly via succinct de bruijn graph. Bioinformatics 31 (10), 1674–1676. doi: 10.1093/bioinformatics/btv033
Matsumoto K., Sasai Y., Sasaoka K., Siswanto E., Honda M. C. (2021). The formation of subtropical phytoplankton blooms is dictated by water column stability during winter and spring in the oligotrophic northwestern north pacific. J. Geophys Research-Oceans 126 (4), 18. doi: 10.1029/2020jc016864
Maturana-Martínez C., Iriarte J. L., Ha S. Y., Lee B., Ahn I. Y., Vernet M., et al. (2022). Biogeography of southern ocean active prokaryotic communities over a Large spatial scale. Front. Microbiol. 13. doi: 10.3389/fmicb.2022.862812
Milici M., Deng Z.-L., Tomasch J., Decelle J., Wos-Oxley M. L., Wang H., et al. (2016). Co-Occurrence analysis of microbial taxa in the Atlantic ocean reveals high connectivity in the free-living bacterioplankton. Front. Microbiol. 7. doi: 10.3389/fmicb.2016.00649
Moore C. M., Mills M. M., Arrigo K. R., Berman-Frank I., Bopp L., Boyd P. W., et al. (2013). Processes and patterns of oceanic nutrient limitation. Nat. Geosci. 6 (9), 701–710. doi: 10.1038/ngeo1765
Oka E., Ishii M., Nakano T., Suga T., Kouketsu S., Miyamoto M., et al. (2018). Fifty years of the 137A degrees e repeat hydrographic section in the western north pacific ocean. J. Oceanogr 74 (2), 115–145. doi: 10.1007/s10872-017-0461-x
Parks D. H., Imelfort M., Skennerton C. T., Hugenholtz P., Tyson G. W. (2015). CheckM: assessing the quality of microbial genomes recovered from isolates, single cells, and metagenomes. Genome Res. 25 (7), 1043–1055. doi: 10.1101/gr.186072.114
Partensky F., Blanchot J., Vaulot D. (1999). Differential distribution and ecology of prochlorococcus and synechococcus in oceanic waters: a review. Bull. l’Institut Oceanographique (Monaco) 0 (19), 457–475.
Pesant S., Not F., Picheral M., Kandels-Lewis S., Le Bescot N., Gorsky G., et al. (2015). Open science resources for the discovery and analysis of Tara oceans data. Sci. Data 2, 150023. doi: 10.1038/sdata.2015.23
Polovina J. J., Howell E. A., Abecassis M. (2008). Ocean’s least productive waters are expanding. Geophys Res. Lett. 35 (3), 5. doi: 10.1029/2007gl031745
Quast C., Pruesse E., Yilmaz P., Gerken J., Schweer T., Yarza P., et al. (2012). The SILVA ribosomal RNA gene database project: improved data processing and web-based tools. Nucleic Acids Res. 41 (D1), D590–D596. doi: 10.1093/nar/gks1219
Rusch D. B., Halpern A. L., Sutton G., Heidelberg K. B., Williamson S., Yooseph S., et al. (2007). The sorcerer II global ocean sampling expedition: Northwest Atlantic through Eastern tropical pacific. PloS Biol. 5 (3), 398–431. doi: 10.1371/journal.pbio.0050077
Rusch D. B., Martiny A. C., Dupont C. L., Halpern A. L., Venter J. C. (2010). Characterization of prochlorococcus clades from iron-depleted oceanic regions. Proc. Natl. Acad. Sci. U.S.A. 107 (37), 16184–16189. doi: 10.1073/pnas.1009513107
Schlitzer ,.R. (2023) Ocean data view. Available at: http://odv.awi.de/.
Segata N., Börnigen D., Morgan X. C., Huttenhower C. (2013). PhyloPhlAn is a new method for improved phylogenetic and taxonomic placement of microbes. Nat. Commun. 4, 2304. doi: 10.1038/ncomms3304
Suh S. S., Park M., Hwang J., Lee S., Chung Y., Lee T. K. (2014). Distinct patterns of marine bacterial communities in the south and north pacific oceans. J. Microbiol. 52 (10), 834–841. doi: 10.1007/s12275-014-4287-6
Sunagawa S., Coelho L. P., Chaffron S., Kultima J. R., Labadie K., Salazar G., et al. (2015). Structure and function of the global ocean microbiome. Science 348 (6237), 9. doi: 10.1126/science.1261359
Thompson A. W., van den Engh G., Ahlgren N. A., Kouba K., Ward S., Wilson S. T., et al. (2018). Dynamics of prochlorococcus diversity and photoacclimation during short-term shifts in water column stratification at station ALOHA. Front. Mar. Sci. 5. doi: 10.3389/fmars.2018.00488
Wang Y., Bi R., Zhang J., Gao J., Takeda S., Kondo Y., et al. (2022). Phytoplankton distributions in the kuroshio-oyashio region of the Northwest pacific ocean: implications for marine ecology and carbon cycle. Front. Mar. Sci. 9. doi: 10.3389/fmars.2022.865142
Wang Y. Y., Liao S. L., Gai Y. B., Liu G. L., Jin T., Liu H., et al. (2021). Metagenomic analysis reveals microbial community structure and metabolic potential for nitrogen acquisition in the oligotrophic surface water of the Indian ocean. Front. Microbiol. 12, 13. doi: 10.3389/fmicb.2021.518865
Wang S., Lin Y., Gifford S., Eveleth R., Cassar N. (2018b). Linking patterns of net community production and marine microbial community structure in the western north Atlantic. Isme J. 12 (11), 2582–2595. doi: 10.1038/s41396-018-0163-4
Wang F., Xie Y., Wu W., Sun P., Wang L., Huang B. (2018a). Picoeukaryotic diversity and activity in the northwestern pacific ocean based on rDNA and rRNA high-throughput sequencing. Front. Microbiol. 9. doi: 10.3389/fmicb.2018.03259
West N. J., Lepere C., Manes C.-L., Catala P., Scanlan D. J., Lebaron P. (2016). Distinct spatial patterns of SAR11, SAR86, and actinobacteria diversity along a transect in the ultra-oligotrophic south pacific ocean. Front. Microbiol. 7. doi: 10.3389/fmicb.2016.00234
Wilhelm L. J., Tripp H. J., Givan S. A., Smith D. P., Giovannoni S. J. (2007). Natural variation in SAR11 marine bacterioplankton genomes inferred from metagenomic data. Biol. Direct 2, 27. doi: 10.1186/1745-6150-2-27
Wood D. E., Salzberg S. L. (2014). Kraken: ultrafast metagenomic sequence classification using exact alignments. Genome Biol. 15 (3), R46. doi: 10.1186/gb-2014-15-3-r46
Wu Y. W., Simmons B. A., Singer S. W. (2016). MaxBin 2.0: an automated binning algorithm to recover genomes from multiple metagenomic datasets. Bioinformatics 32 (4), 605–607. doi: 10.1093/bioinformatics/btv638
Yooseph S., Sutton G., Rusch D. B., Halpern A. L., Williamson S. J., Remington K., et al. (2007). The sorcerer II global ocean sampling expedition: expanding the universe of protein families. PloS Biol. 5 (3), e16. doi: 10.1371/journal.pbio.0050016
Yutin N., Suzuki M. T., Teeling H., Weber M., Venter J. C., Rusch D. B., et al. (2007). Assessing diversity and biogeography of aerobic anoxygenic phototrophic bacteria in surface waters of the Atlantic and pacific oceans using the global ocean sampling expedition metagenomes. Environ. Microbiol. 9 (6), 1464–1475. doi: 10.1111/j.1462-2920.2007.01265.x
Zhai W. D., Zheng N., Huo C., Xu Y., Zhao H. D., Li Y. W., et al. (2014). Subsurface pH and carbonate saturation state of aragonite on the Chinese side of the north yellow Sea: seasonal variations and controls. Biogeosciences 11 (4), 1103–1123. doi: 10.5194/bg-11-1103-2014
Zhang X., Xu W., Liu Y., Cai M., Luo Z., Li M. (2018). Metagenomics reveals microbial diversity and metabolic potentials of seawater and surface sediment from a hadal biosphere at the yap trench. Front. Microbiol. 9. doi: 10.3389/fmicb.2018.02402
Zhou J., Song X., Zhang C.-Y., Chen G.-F., Lao Y.-M., Jin H., et al. (2018). Distribution patterns of microbial community structure along a 7000-mile latitudinal transect from the Mediterranean Sea across the Atlantic ocean to the Brazilian coastal Sea. Microbial Ecol. 76 (3), 592–609. doi: 10.1007/s00248-018-1150-z
Keywords: biodiversity, microbial community, metagenomics, northwest pacific ocean, seasonal variation
Citation: Wang Y, Lin H, Huang R and Zhai W (2023) Exploring the plankton bacteria diversity and distribution patterns in the surface water of northwest pacific ocean by metagenomic methods. Front. Mar. Sci. 10:1177401. doi: 10.3389/fmars.2023.1177401
Received: 01 March 2023; Accepted: 10 April 2023;
Published: 24 April 2023.
Edited by:
Guangchao Zhuang, Ocean University of China, ChinaReviewed by:
Shi Huang, The University of Hong Kong, Hong Kong SAR, ChinaQiang Zheng, Xiamen University, China
Copyright © 2023 Wang, Lin, Huang and Zhai. This is an open-access article distributed under the terms of the Creative Commons Attribution License (CC BY). The use, distribution or reproduction in other forums is permitted, provided the original author(s) and the copyright owner(s) are credited and that the original publication in this journal is cited, in accordance with accepted academic practice. No use, distribution or reproduction is permitted which does not comply with these terms.
*Correspondence: Ranran Huang, aHVhbmdyckBzZHUuZWR1LmNu
†These authors have contributed equally to this work