 Kristina N. Heidrich
 Jessica J. Meeuwig
 Dirk Zeller
- 1Sea Around Us – Indian Ocean, School of Biological Sciences, University of Western Australia, Crawley, WA, Australia
- 2Marine Futures Laboratory, School of Biological Sciences, University of Western Australia, Crawley, WA, Australia
Comprehensive catch data are fundamental to support the sustainable management of large pelagic fisheries. However, catch data reported by the Indian Ocean Tuna Commission (IOTC) on behalf of its member countries currently under-represent the extent of these fisheries in the Indian Ocean. We reconstructed fisheries catches of large pelagic species for the Indian Ocean from 1950 to 2020, aiming to improve the comprehensiveness of existing reported data and to provide more ecologically relevant datasets for research and management uses. We reconstructed catches for 42 countries operating five major gear groups (longline, purse seine, gillnet, pole-and-line, and other gears) in the large pelagic fisheries. Reconstructed catches were 30% higher than the data reported by the IOTC. We demonstrated that distant-water fishing fleets historically dominated large-scale industrial fishing but were gradually replaced by fleets flagged to Indian Ocean rim countries. Our results also indicated an average discard rate of ~14% over the 1950-2020 period, primarily attributable to extensive discarding practices associated with longline and gillnet vessels. Reporting over time has improved only for tunas, whereas shark catches still remain under-reported, accounting for 51% of total unreported landings and discards in 2020. We confirmed substantial taxonomic aggregation in the data reported by the IOTC on behalf of its member countries, masking important patterns and trends and further complicating the sustainable management of exploited species in the Indian Ocean. We recommend substantially increased observer coverage and far better and stronger support by all member countries to improve the fisheries statistics in the IOTC.
1 Introduction
Large pelagic species, such as tunas, billfishes, and sharks, are of substantial commercial value, both for large- and small-scale fisheries around the world, and may have ecological implications due to the broad distribution and accessibility in surface and near-surface waters of these species (Schaefer et al., 2014; Bell et al., 2021). These species support a substantial industry and produce highly valued catches for many countries worldwide. Global catches from these fisheries exceeded 6.5 million tonnes in 2018, and tuna alone were valued at an estimated US$42 billion (FAO, 2020; McKinney et al., 2020). The market demand for large pelagic species continues to increase, as do trends in fishing mortality rates, with fisheries thought to be catching at least 10-15% of the global large pelagic adult biomass each year (Allen, 2010). Consequently, the global adult biomass of tunas and their relatives has at least halved over the past half century, leaving most populations at least fully exploited and limiting further expansion of catches in these fisheries (Juan-Jordá et al., 2011).
Fisheries for large pelagic species have existed in the Indian Ocean for centuries, with artisanal fisheries primarily operating in coastal areas (Stequert and Marsac, 1986). Industrial fishing for large pelagic species began in the early 1950s, when European, Japanese, and Taiwanese longline fleets arrived in the Indian Ocean (Miyake et al., 2004). This arrival was driven by a shift in global fishing effort away from historically fully- or over-exploited regions in the Atlantic and Pacific Ocean fishing grounds for large pelagic species. The Indian Ocean region has experienced a particularly steep increase in catches for large pelagic species over the past ten years, and by 2018 accounted for 32% of the total global reported catch of all tuna Regional Fisheries Management Organizations (RFMOs) (Heidrich et al., 2022). Today, the Indian Ocean is home to the world’s second-largest fisheries for large pelagic species, providing 16% of the global tuna industry’s revenue (i.e., US$ 6.5 billion) in 2017 (Lecomte et al., 2017). Despite the perceived scale and economic importance of these fisheries, large tuna and billfishes account for only 7-8% of total ocean basin catches and 17% of all pelagic catches in the late 2010s in the entire Indian Ocean (Zeller et al., 2023a). Currently, local and foreign vessels operate in the Indian Ocean’s High Seas and within the Exclusive Economic Zones (EEZs) of the 36 countries and territories of the Indian Ocean rim as part of the fisheries for large pelagic species. The foreign fleets from countries outside the Indian Ocean region account for approximately 47% of the reported regional catch in 2020 (IOTC, 2021a; Li et al., 2021, https://www.iotc.org/data/datasets/latest/NC-ALL).
The large- and small-scale fisheries for large pelagics in the Indian Ocean supply local and international export markets with various products, ranging from fresh fish landed and consumed locally to canned tuna and high-grade sashimi for international trade (Lecomte et al., 2017). The industrial fisheries sector share of catches is almost exclusively export-oriented and is thought to be dominated by foreign fleets or foreign beneficial ownership fleets (Ford et al., 2022). These highly industrialized distant-water fishing fleets (DWF), predominantly from developed countries outside the Indian Ocean region, directly compete with local fishing fleets, which provide an essential source of food and livelihood security for millions of people in coastal communities throughout the Indian Ocean (Doyle, 2018; Techera, 2018; Taylor et al., 2019; Karim et al., 2020).
Among the countries involved in the fisheries for large pelagics in the Indian Ocean are some of the wealthiest countries in the world and some with the lowest per capita income (Llewellyn et al., 2016), which is a reflection of the extreme socio-economic diversity in the fishery. Globally, the large pelagic fisheries employ several million people directly, through fishing, and indirectly through employment in canneries, processing plants, and trade (Alder and Watson, 2007; Teh and Sumaila, 2013). Rapid human population growth and overall declining marine resources in the Indian Ocean have increased competition for pelagic fish among fishers, especially for the commercially important scombrid species: albacore (Thunnus alalunga), skipjack (Katsuwonus pelamis), yellowfin (Thunnus albacares), and bigeye tuna (Thunnus obesus). This competition, and the resulting growth in fishing effort, poses a significant challenge to sustainable fisheries management and economic viability in Indian Ocean rim countries (Kimani et al., 2009; WWF, 2020).
The management and conservation of tunas and other large pelagic species in the Indian Ocean fall under the jurisdiction of the Indian Ocean Tuna Commission (IOTC), the designated tuna RFMO for the Indian Ocean. The IOTC is responsible for managing 16 tuna and other large pelagic species but also requires its member countries to collect data on the bycatch of non-targeted species that are affected by large pelagic fishing activities (IOTC, 2011a). Economic, institutional, and political factors such as international competition in trade, the transboundary nature of tuna stocks, gear diversity, scientific uncertainties, and geopolitical factors make it challenging to regulate and manage highly migratory species like tuna (Sinan and Bailey, 2020). Additionally, IOTC member countries protect their own national economic and political interests during negotiations, which can further challenge, limit or even derail the effectiveness and scope of management actions taken by the IOTC (FAO, 2016). The lack of capacity and resources in many IOTC member countries, such as strong Control, Monitoring, and Surveillance (CMS) mechanisms and effective flag state control over fishing vessels operating on the High Seas or in foreign EEZs, complicates the implementation and enforcement of effective measures for the sustainable management of large pelagic species in the Indian Ocean. (Cullis-Suzuki and Pauly, 2010; Gianni et al., 2011; Weaver et al., 2011; Pitcher and Cheung, 2013; Wright et al., 2015). Overall, there continues to be a general deficiency in stock assessments resulting from significant gaps in comprehensive fisheries data and scientific understanding across the region (Heidrich et al., 2022).
Comprehensive and accurate catch data and fundamental biological data are paramount for understanding the stock status and trajectories of large pelagic species (McClenachan et al., 2012; Pauly and Zeller, 2016a), given their ecological, social, and economic importance in the Indian Ocean. However, the scale and extent of fishing impacts on these species are surprisingly uncertain, not least due to data collection challenges in the majority of Indian Ocean countries, driven by capacity and resource limitations to monitor the extensive fisheries for large pelagic species in many Indian Ocean rim countries (Kleisner et al., 2013; IOTC, 2019a; Martin and Shahid, 2021). In addition, DWF countries also pose a challenge to data accountability and completeness, driven by a lack of control and compliance by the flag state and an unwillingness to cooperate (Bateman, 2012; Pillai and Satheeshkumar, 2012). Consequently, the IOTC processes are hampered by a dearth of accurate data submissions by fishing countries and fleets, indicating profound quality issues in nationally and internationally assembled data (MRAG, 2019). Nationally collected data focus extensively or even exclusively on landings from major commercial fisheries and substantially underrepresent, misreport or completely lack comprehensive estimates on discards and illegal or unreported catches for bycatch species such as sharks, whose removal has significant implications for broader ocean ecosystem health (Trebilco et al., 2013; Lascelles et al., 2014). For example, in 2019, only 72% of the reported catches were deemed fully or partially complete, yet associated with poor quality, making their use for reliable stock assessments questionable (IOTC, 2019a). This lack of comprehensive reported catch data contributes to underestimating unreported landings and discards in these fisheries (IOTC, 2021b). It also results in a lack of publicly available, reliable data on the health of many exploited stocks in the Indian Ocean, with such a lack of public transparency and accountability posing a challenge to the management of these fisheries in the Indian Ocean (Heidrich et al., 2022). Despite the challenges of sustainably managing fisheries for large pelagic species in the Indian Ocean and the documented overexploitation of some of the most economically and ecologically important target species in the region (e.g., yellowfin tuna), there remains significant debate about the implementation of catch quota reduction among member countries of the IOTC (Collette et al., 2021; Walker, 2021).
Long-term catch histories are an essential component of stock assessments, particularly for species for which only data-limited stock assessment methods are available (Froese et al., 2017, Froese et al., 2018, Froese et al., 2020, Froese et al., 2021). Here, catch reconstructions can play a crucial role in filling such gaps, despite the potential for higher uncertainty levels (Pauly and Zeller, 2016a; Zeller et al., 2016; Pauly and Zeller, 2017). The IOTC has made efforts to improve national data collection systems in many of its member countries and to incorporate catch reconstructions as a viable method of complementing some previously incomplete data sets (OFC, 2007; OFC, 2010; OFC, 2013; Moazzam and Ayub, 2017; Moazzam et al., 2017). However, there are many cases where critical historical catches have gone unreported, as many countries were not collecting fishery statistics for the pre-1970 periods (IOTC, 2021b), thus, catch statistics in tuna RFMOs, including for the IOTC, suffer extensively from the ‘presentist bias’ (Zeller and Pauly, 2018). The current study reconstructs and examines catch data for large large pelagics in the Indian Ocean from 1950 to 2020. We generate comprehensive time-series estimates of catches missing from the reported landings baselines (i.e., estimates of unreported catches and discards).
2 Methods
The reconstruction of catches for the large pelagic species fisheries in the Indian Ocean for 1950-2020 followed the general catch reconstruction approach outlined in Zeller et al. (2016). This well-established catch reconstruction approach was first implemented for coral reef and demersal fisheries in U.S. flag-associated Pacific Islands (Zeller et al., 2006; Zeller et al., 2007) and has since been applied to the fisheries in EEZs of every maritime country in the world (Pauly and Zeller, 2016a; Pauly and Zeller, 2016b). Furthermore, a synthesis review of reconstructed catch, as well as fishing effort data for the entire Indian Ocean basin, has recently been completed (Zeller et al., 2023a). However, this is the first study to comprehensively apply this approach to the fisheries for large pelagic species under the management purview of a tuna RFMO.
2.1 Reported catch baseline data
The IOTC is an intergovernmental organization that, on behalf of its member countries, is responsible for collecting, analyzing, and disseminating scientific information, including catch and effort statistics relevant to the conservation and management of pelagic fish stocks in its Convention Area (Figure 1). We identified and sourced the IOTC’s publicly available reported catch records and used these as the reported baseline data to reconstruct the likely total catches of large pelagic species for the 1950-2020 period. We complemented these official records with comprehensive time-series estimates of unreported fisheries components, i.e., unreported landings and discards, as derived here using secondary data and information from the peer-reviewed and grey literature. Such secondary data and knowledge can help address existing data gaps when combined with conservative assumptions (Pauly and Zeller, 2016a; Zeller et al., 2016; Leitão et al., 2018).
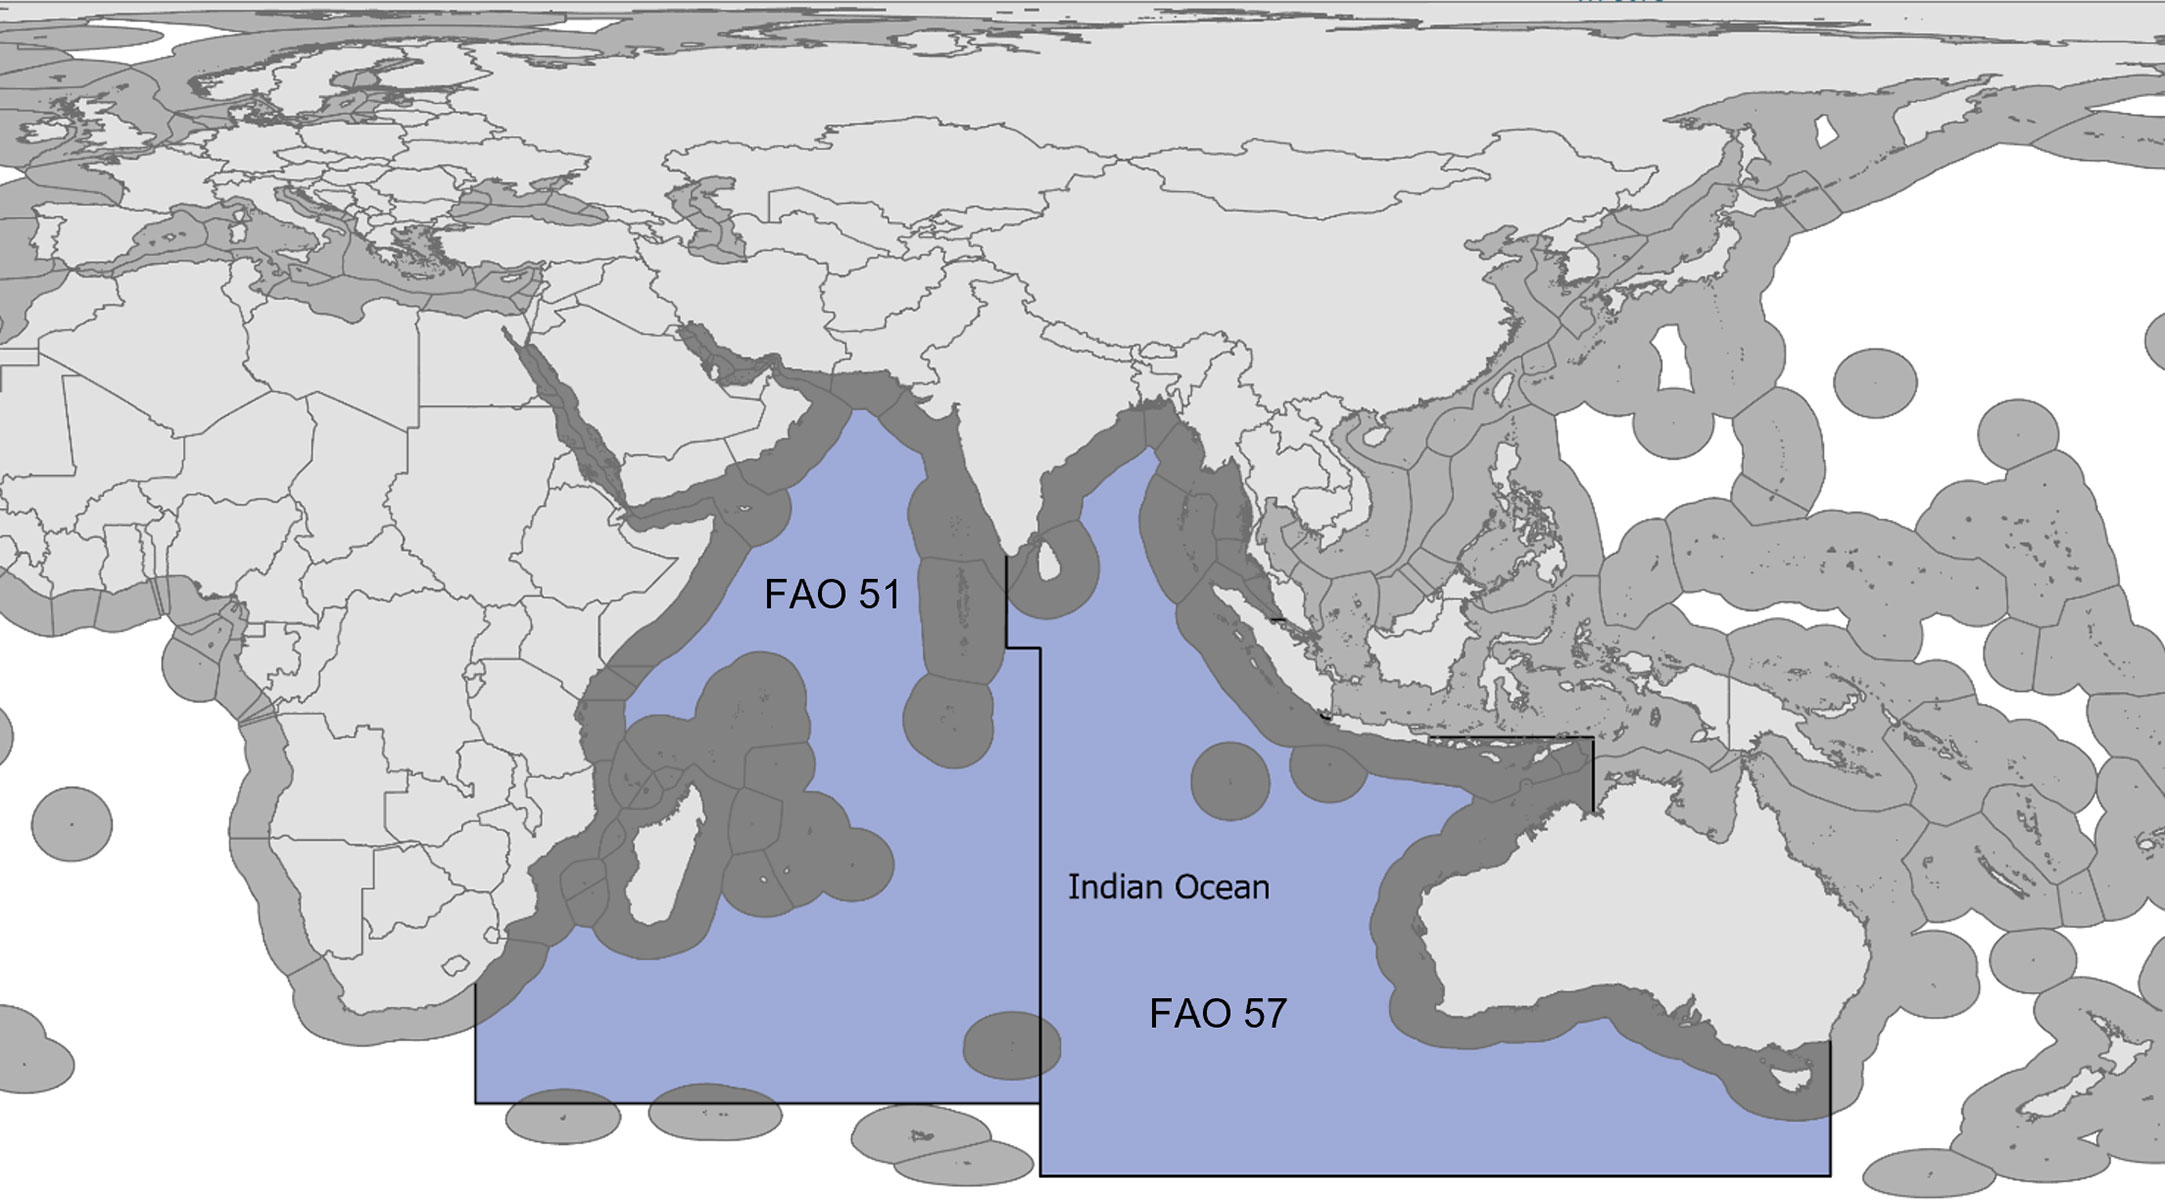
Figure 1 Map of the Indian Ocean region, including the Exclusive Economic Zones (EEZs) of the Indian Ocean rim countries (dark grey). The Indian Ocean Tuna Commission (IOTC) Convention Area, as applicable to the present study, is highlighted in blue and is comprised of FAO statistical areas 51 (Western Indian Ocean) and 57 (Eastern Indian Ocean).
2.1.1 Modifications to IOTC reported baseline data
Fisheries for large pelagic species in the IOTC Convention Area range from small-scale, artisanal operations in coastal waters of Indian Ocean rim countries (Okemwa et al., 2023) to large-scale, industrial operations in the EEZs and international waters (High Seas) of the Indian Ocean (Sala et al., 2018; Carmine et al., 2020). The IOTC classifies vessels as industrial or artisanal by their overall length and area of operation. Industrial vessels include vessels with an overall length > 24 m regardless of their area of operation (EEZs or High Seas) or vessels with an overall length< 24 m fishing in areas outside their own EEZ. The IOTC defines artisanal fishing vessels as vessels ranging from non-mechanized pirogues that fish for subsistence to longline, gillnet, and purse seine vessels with inboard motors that undertake commercial operations exclusively in national waters (MRAG, 2019). Thus, currently, only around one-third of the reported IOTC catches for large pelagic species are classified as industrial (Figure S1, IOTC, 2014; MRAG, 2019). We considered the IOTC definition of artisanal as too simplistic and therefore adjusted this definition to better match the stricter definition used in the global Sea Around Us database system (Zeller et al., 2016). Thus, we divided the catches reported by the IOTC into industrial and artisanal sectors based on vessel size, type of gear used, and area of operation. The Sea Around Us defines the small-scale, artisanal fishing sector as vessels < 15 meters in length that operate solely in domestic waters and using fishing gear that is not actively moved through the water column using engine power (Martin, 2012; Zeller et al., 2016). This is the definition we used here for reported catch data reclassification. On the other hand, the large-scale industrial sector comprises vessels > 15 m operating active and passive gears in High Seas and EEZ waters. Furthermore, all vessels using gear that is actively dragged or towed through the water column using engine power were labeled as ‘industrial’ regardless of their vessel size (Martin, 2012). Sources used to reclassify parts of the IOTC-reported artisanal catches as industrial catches are given in Table S1. For the present study, we excluded from further consideration all catches of large pelagic species taken by the newly re-defined artisanal sector, which amounted to 23.7 million t (~24%) of total reported IOTC catches (Figure S1). This exclusion minimizes potential double-counting of truly small-scale sector catches of large pelagic species, given that pelagic catches by small-scale fisheries were addressed separately through country-specific catch reconstructions of domestic EEZ fisheries (Pauly and Zeller, 2016b). Thus, in the present study, we only address large-scale, industrial fisheries catches of large pelagic species, using the adjusted sectoral baseline outlined above.
The large pelagic fisheries in the Indian Ocean can be divided into five main groups by general fishing gear types: longline, purse seine, gillnet, pole-and-line, and ‘other miscellaneous gears’, and these fisheries are conducted by 42 DWF and Indian Ocean rim countries. Some catches by the deep-freezing and fresh longline vessels and purse seine vessels flying various non-European flags are reported as ‘fishing country nei’ (fishing country not elsewhere included). We used information provided by the IOTC to disaggregate these catches, assuming an equal split of catches between countries in the respective ‘nei’ groups (Table S2).
2.2 Estimating unreported catches
We used available information from the literature and observer studies to complement the reported IOTC baseline data with catch estimates of unreported fisheries components, those being unreported landed and discarded catch for every gear group for every country operating vessels in the Indian Ocean fisheries for large pelagics in a given year (Figure S2). We acquired and analyzed information from over 50 unique sources, including grey and peer-reviewed literature from independent and government entities, to generate data anchor points (sensu Zeller et al., 2016). These sources were used to conservatively estimate likely unreported catches over time (Tables S2–S7). We estimated unreported landed and unreported discarded catch separately, following the flowchart logic presented in Figure S2 (see Figure S3 for details). For gear-country combinations where no independent information was available, an average underreporting and discarding rate from a similarly operating gear and country was applied (see Tables S2–7 for details).
2.2.1 Unreported landings
Unreported landings were estimated back to either 1950, the start year of the reconstruction period, or the known start of a gear-country-specific fleet from the earliest available anchor point by assuming past catches changed differently for teleosts and elasmobranchs. This approach assumed that changes in historical fishery catches for large pelagic species are directly related to the target species group of the specific fishery. We derived ‘anchor point catch rates’ by converting estimates unreported catch from the literature into catch rates of unreported catch per tonne of reported catch. For example, if a source documents 20 tonnes of unreported catch of species x by gear y by country z in a fishery that reports 100 tonnes of species x by gear y by country z, the derived ‘anchor point catch rate’ is 20/100 tonnes = 20%. We carried the earliest anchor point for unreported catch rate (i.e., percentage of catch going unreported) back to the start year of the time series or gear-country combination (Figure S2). We then multiplied this rate with the corresponding underlying reported data to get total estimates of unreported landings for teleosts (UL1i,j,k, Figure S3A). Catches for elasmobranchs were estimated back from the earliest anchor point to the start year of the individual fishery, assuming that catch rates for elasmobranchs were 50% higher at the beginning of the given fishery compared to the earliest anchor point year (Figure S2). This was based on our assumption that elasmobranch landings are declining due to rapidly declining shark populations (Davidson et al., 2016). The catch rates were then interpolated for years between the earliest anchor point and the beginning of the given fishery. Unreported elasmobranch catches were then derived by multiplying these adjusted catch rates with the corresponding underlying reported data to get total estimates of unreported landings for elasmobranchs (UL1i,j,k, Figure S3A). We used simple linear interpolations to fill gaps between years with anchor points for a given gear-country combination for both teleosts and elasmobranchs (UL2i,j,k, Figure S3A). Thereby, we assumed the continuation of fishing between years of reported data rather than assuming that no reported data implied the cessation of the fishery (Zeller et al., 2016). We estimated unreported catches forward from the most recent anchor point on record by carrying the most recent unreported catch rate anchor point forward to 2020 unchanged. Thereafter, we multiplied the derived catch rate by the underlying reported data to the time series end year of 2020 (UL3i,j,k, Figure S3A), except for gear-country combinations where information on earlier cessation of the fishing activity was available (Figure S3A).
2.2.2 Unreported discards
We estimated discards separately for all gear-country combinations based on independent data and information sources for gear- and country-specific discarding practices (Tables S3–S8). We defined discards as the portion of the catch that is not retained on board during fishing operations and is returned to the sea, often dead or dying. Discards are explicitly excluded from the IOTC reported baseline data, but some discard data are collated in a separate database for the IOTC Working Party on Ecosystems and Bycatch (WPEB, https://www.iotc.org/WPEB/16/Data/12-ROS, IOTC, 2015). This exclusion of discarded catches in official data reporting is, unfortunately also consistent with international reporting of fisheries catches by the Food and Agriculture Organization (FAO) of the United Nations (Garibaldi, 2012; Zeller et al., 2018). Therefore, all discards estimated here were deemed unreported with respect to the officially reported baseline data as reported by the IOTC and hence by the FAO. We followed the same approach in estimating unreported discards (UD) for each gear-country combination for every given year (Figure S3B) as outlined above for estimating unreported landings (UL). We estimated discards using independently sourced discard rates and applied these to the total landed catch, being the sum of the reported plus unreported landings by country and gear group. We used discard-to-landings ratios from known years to estimate missing discards for years where no discard data were available. Further, we used discard rates from similarly operating fleets or countries where country- and gear-specific discard rates were unavailable (Tables S3–S8).
2.2.3 Combination of unreported landings and unreported discards
We calculated the total unreported catch (UCi,j,k) of large pelagic species in the Indian Ocean (FAO areas 51 and 57; Figure 1) as the sum of unreported landings (ULi,j,k) and unreported discard (UDi,j,k), [Eq.1]:
for gear i and country j in year k.
We further calculated the total reconstructed catch (CRi) for each gear-country combination [Eq.2]:
where UCi,j,k and RCi,j,k are the unreported catch and reported catch by gear i and country j in year k, respectively (Figure S3C).
2.3 Taxonomic composition of reconstructed catches
The taxonomic composition of the estimated unreported landings and discards was primarily derived from the reported industrial large pelagic fisheries catch composition, i.e., from the IOTC reported baseline data. This composition was held constant for years when reported landings were available. We used the taxonomic composition of catches from the nearest available anchor point year for each gear-country combination to account for the taxonomic composition for years in which we filled data gaps. We linearly interpolated the proportion of total catches for each taxonomic group between anchor points to account for gaps in the taxonomic composition of catches between anchor points. We further divided the catches into two categories according to their taxonomic resolution, where the taxonomically finely-resolved catches included those reported at the species level, and the taxonomically more coarsely-resolved catches included those reported at the genus, family, order, and higher levels, hereafter referred to as species-level groups and higher-pooled groups, respectively. We applied the IOTC taxonomic composition of shark catches to the reconstructed catches to disaggregate the higher-pooled taxa group ‘sharks various nei’, one of the largest higher-pooled groups in the IOTC reported database (Table S9, Martin et al., 2017). We recognize that not all non-retained catches (i.e., discards) would taxonomically resemble retained landings and emphasize that future research is needed to address the detailed taxonomic composition of discarded catches.
2.4 Estimation of data uncertainty
We estimated uncertainty associated with the total reconstructed data (including reported and unreported catch components) following a data reliability scoring approach adopted from the Intergovernmental Panel on Climate Change (IPCC) (Mastrandrea et al., 2010) as outlined in Zeller et al. (2016) and as detailed in Pauly and Zeller (2017), Table S10. We assigned data reliability scores and the associated percentage uncertainty bounds based on a careful evaluation of the trust in the underlying secondary data and information sources used, separately for each fishing gear–country combination for both industrial landed and discarded catches for each of 4 time periods (1950 – 1969, 1970 – 1989, 1990 – 2009, and 2010 - 2020). The data reliability scores range from 1 to 4 (Table S10), with 1 representing the lowest reliability (highest uncertainty, ± 50%) and 4 representing the highest reliability (lowest uncertainty, ± 10%). We derived total data reliability scores and the associated percentage uncertainty bounds for each of the four periods based on the catch-weighted score averages for each category (gear–country combination).
2.5 Segmented regression – breakpoint detection
Visual examination of the total reconstructed catch time series suggested distinct periods with different trends. We therefore carried out a segmented regression analysis on the total reconstructed catch time series using the segmented package in R (Muggeo, 2008) to identify potential breakpoints in the time series trend. We included 71 years of catch data (1950-2020) in the calculations to determine if the time series could be described by one or several trend line patterns.
3 Results
3.1 Total reconstructed catches
The total reconstructed catches, i.e., the sum of reported landings plus unreported landings and unreported discards, for large pelagic species caught by industrial fisheries in the Indian Ocean between 1950 and 2020 were > 29% higher than the adjusted industrial catches reported by the IOTC on behalf of its member countries (Figure 2A, Table S11). Total industrial catches of large pelagic species increased gradually from around 44,000 t·year-1 in the early 1950s to 442,000 t·year-1 by 1982, after which catches increased strongly during the 1980s and 1990s to a peak of ~1.7 million t in 2005 (Figure 2A, Table S11). After 2005, catches declined to around 1.2 million t by 2010 before rebounding to average annual catches of approximately 1.4 million t·year-1 by 2020 (Figure 2A). The time series data suggested three distinct periods of time series trends in catches, as supported by a segmented regression (Figure S4). These periods were 1950 – 1982, 1983 – 1999, and 2000 – 2020 (Figures 2A, S3).
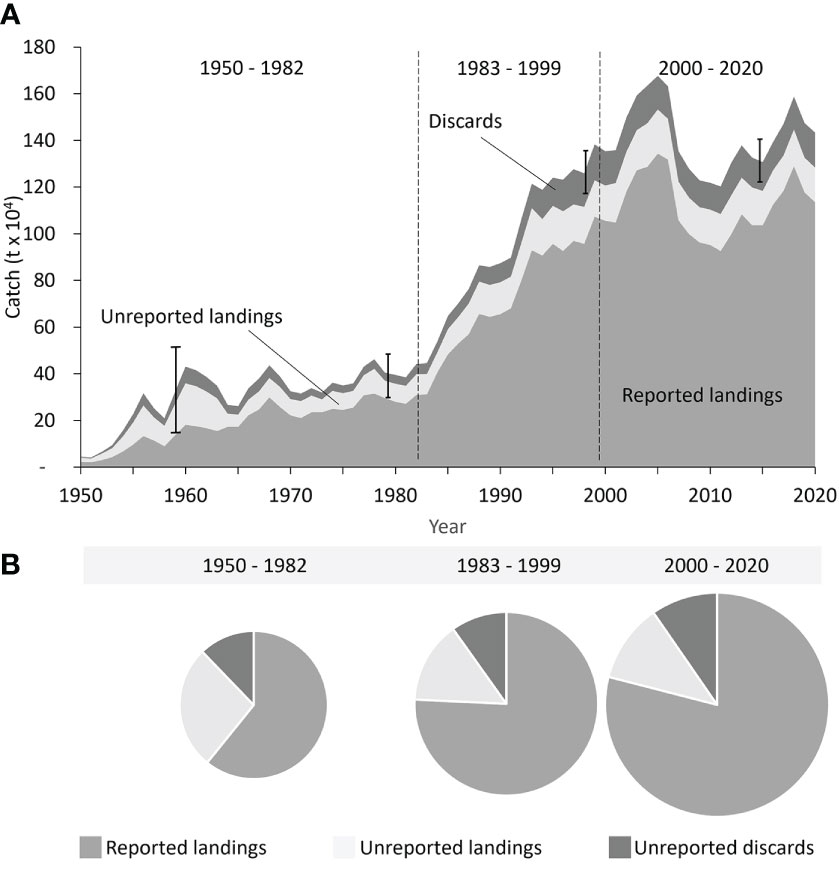
Figure 2 Total reconstructed large pelagic fisheries catches for the Indian Ocean by reporting status from (A) 1950 to 2020 with data reliability (uncertainty) bounds indicated as catch-weighted averages for 1950 - 1969, 1970 – 1989, 1990 – 2009, and 2010 – 2020 time spans; and (B) by analytically identified period (1950 – 1982, 1983 – 1999, and 2000-2020), where the pie chart size indicates the average amount of reconstructed catches per period.
The relative level of catch reporting was lowest during the earliest period (1950-1982), with only around 61% of total catches reported (Figure 2B). Reporting levels seemed to improve during the second period (1983-1999) to approximately 76% of total catches and further improved in the most recent period, with currently around 79% of total catches assessed as reported (Figure 2B). Unreported catches were dominated by unreported landed catches rather than discards in the earlier decades, accounting for 27% and 12% of total catches, respectively (Figure 2B, Table S11). The relative contribution of unreported landings to total unreported catches decreased during the second and third periods, and by the most recent period (2000-2020) unreported landings accounted for around 11% of total catches (Figure 2B, Table S11). Discards increased from about 37,500 t·year-1 in the early 1950s to a peak of around 154,000 t·year-1 in 1999 before declining slightly to approximately 149,700 t·year-1 by the end of the third period (Figure 2A). Thus, discards accounted for around 12% of total reconstructed catches in the early period, which decreased to about 10% in recent years (Figure 2B).
3.2 Data uncertainty
The uncertainty around the total reconstructed catch estimates derived via our data reliability scoring was highest in the earlier decades (the 1950s and 1960s), driven by the general scarcity of data and information for all gear groups during that time, leading to lower data reliability scores and thus more extensive uncertainty ranges of ±19.5% of the total reconstructed catch for the earlier decades (Table S12). The subsequent decades from 1970 – 2020 had better data and information sources, resulting in lower uncertainty bounds of ±10% of the total reconstructed catch (Table S12).
3.3 Reallocation of reported baseline catch data to the industrial sector
Nearly 56% of reported IOTC baseline catch data was labeled as ‘artisanal’ by the IOTC, including catches taken in high seas waters (Figure S1). On average, we reclassified around 188,000 t·year-1 of the reported ‘artisanal’ catches as being industrial sector catches, as the definition for the artisanal sector used globally by the Sea Around Us is spatially restrictive, i.e., artisanal and other small-scale fishing can only occur within inshore waters within a country’s EEZ (Chuenpagdee et al., 2006; Zeller et al., 2016). This reclassification reduced the artisanal sector component from 58% prior to sectoral reallocation to around 46% of reported catches in the Indian Ocean fisheries for large pelagic species in 2020 (Figure S1). The reclassified artisanal catches were not included in our analyses since they have already been addressed with country-specific, EEZ-scale catch reconstructions that emphasize small-scale fisheries, including for tuna and other pelagic species (Pauly and Zeller, 2016a; Zeller et al., 2016; Zeller et al., 2023b).
3.4 Details of total reconstructed catches
3.4.1 Fishing gears
Historically, total industrial catches of large pelagic species in the Indian Ocean were taken primarily by longline gears, which dominated during the first two decades (Figure 3A). More recently, however, gillnet and purse seine gears account for the majority of total industrial catches, accounting for 36% (~ 514,000 t·year-1) and 35% (~ 500,000 t·year-1) of total catches, respectively, in the late 2010s, while longlines account for only around 19% or ~ 280,000 t·year-1 (Figure 3A, Table S13). Pole-and-line gear made only minor contributions across the entire Indian Ocean, accounting for around ~119,000 t·year-1 or 8% of total catches in recent years (Figure 3A). Both unreported landings and unreported discards were dominated by longline and gillnet gears, with longline unreported landings and discards decreasing over time (Figures 3B, S5, Table S14). Gillnet gears showed a steady increase of unreported landings and discards from ~27% during 1950-1982 to ~43% in 2000-2000 (Figures 3B, S5, Table S14). In contrast, purse seine, pole-and-line, and ‘other’ gear types accounted for much smaller shares of unreported catches (Figures 3B, S5, Table S13). Purse seine gears, however, showed a slight increase in the relative contribution of discards to total reconstructed catches from the initial period of purse seine development (1983-1999, 11%) to the most recent period (13%, Figure 3B).
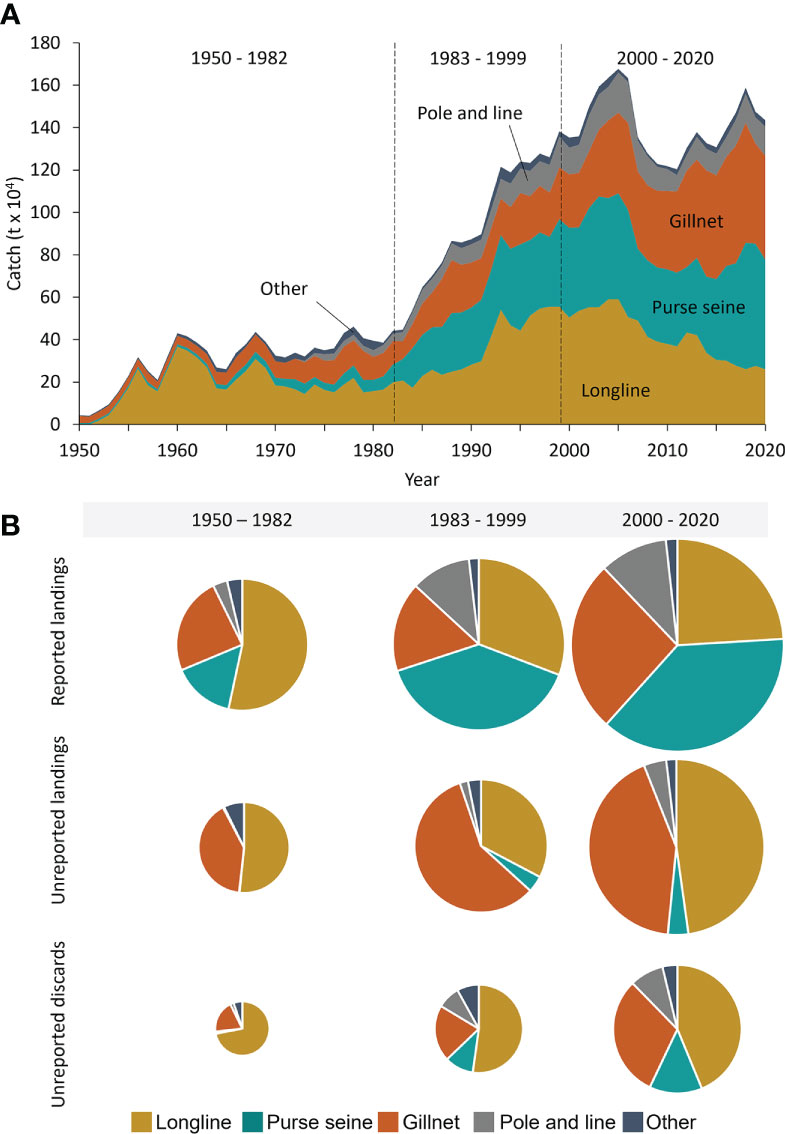
Figure 3 Total reconstructed large pelagic fisheries catches for the Indian Ocean by major gear group (A) from 1950 to 2020; and (B) by analytically identified period (1950 – 1982, 1983 – 1999, and 2000-2020) and reporting status, where the pie chart size indicates the average amount of reported landings, unreported landings, and unreported discards per period.
3.4.2 Taxonomic categories
Large tunas dominated the Indian Ocean’s large pelagic fisheries catches, accounting for 73% of total catches between 1950 and 2020 (Figure 4A). Catches of tuna taxa increased from around 110,000 t·year-1 during the 1950s to about 307,000 t·year-1 in the early 1980s before growing strongly and steadily to a peak catch of over 1.3 million t in 2005 (Figure 4A, Table S15). In recent years, i.e., 2018-2020, catches of tuna taxa averaged just under 1.2 million t·year-1 (Figure 4A). The second most commonly caught taxonomic group was pelagic sharks, which accounted for 13% of total catches over the entire period (Figure 4A). Catches of sharks increased more or less steadily throughout the earlier decades, peaking in the early 2000s at around 210,000 t·year-1, and have seemingly declined in recent years to approximately 86,000 t·year-1 by 2020 (Figure 4A). Billfishes (i.e., marlins, etc.) account for around 5% to total catches over time, having peaked at about 93,000 t·year-1 in 2004 before declining to about 61,000 t·year-1 by 2020 (Figure 4A). Taxonomic categories that have seen steady increases in their catch contribution in recent years are the seerfishes (i.e., mackerels, etc.) and the ‘other’ taxonomic grouping (Figure 4A). Catches of seerfishes have more than doubled from an average of 43,000 t·year-1 in the 1980s and 1990s to around 89,000 t·year-1 by 2020, while ‘other’ taxa amounted to ~78,000 t in 2020 (Figure 4A).
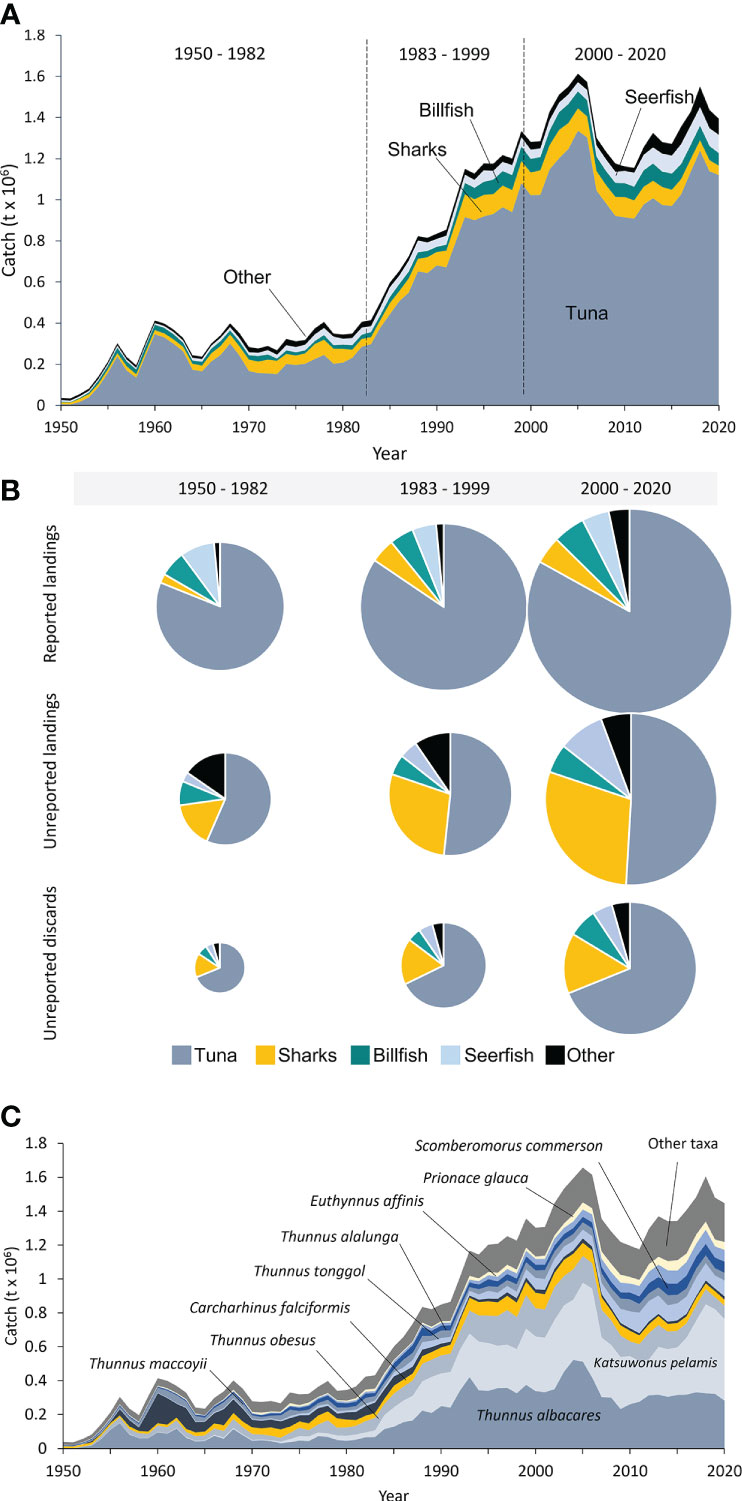
Figure 4 Total reconstructed large pelagic fisheries catches for the Indian Ocean by (A) major species groups from 1950 to 2020; (B) analytically identified period (1950 – 1982, 1983 – 1999, and 2000-2020) and reporting status, where the pie chart size indicates the average amount of reported landings, unreported landings, and unreported discards per period; and (C) Taxonomic composition of reconstructed total catches for the large pelagic fisheries catches for the Indian Ocean for 1950-2020. The category ‘other taxa; consists of 169 additional taxa with minor contributions to the overall catch.
Tunas and sharks dominate the unreported catches, as unreported landings and unreported discards (Figure 4B). In the most recent period (1999-2020), tunas account for 51% (~82,000 t·year-1) of unreported landings and 69% (~94,000 t·year-1) of unreported discards (Figure 4B). Sharks have experienced a gradual increase in their relative share of unreported catches, especially among landings, having increased from 16% (~39,800 t·year-1) of unreported landings in the earliest period to ~29% (47,000 t·year-1) in the most recent period (Figure 4B). Discards appear to be heavily dominated by tuna taxa, accounting for 63-69% of total discards over time (Figure 4B, Table S16). Sharks accounted for a smaller proportion (15-18%) of total discards, which amounted to ~16,700 t·year-1 in the earliest period (1950-1982) and ~20,000 t·year-1 in the most recent period (Figure 4B, Table S15). Overall, however, the volume of unreported catches, i.e., landings and discards, of sharks steadily increased over time from ~19,700 t·year-1 during the earliest period (1950-1982) to ~67,000 t·year-1 in the most recent period (1999-2020), reaching ~22% of the total reconstructed shark catches in recent years (Figure S6, Table S16).
3.4.2.1 Taxonomic composition of total catches
Catch data reported by the IOTC on behalf of its member countries ranged from fine-scale taxonomic resolution at the species level, e.g., yellowfin tuna, to very coarse and uninformative pooled group taxonomic resolution, e.g., ‘tunas nei’ (‘tunas not elsewhere included’; Table S17). The taxonomic composition of the total reconstructed catches across all six fishing gear groups comprised 194 taxonomic categories, of which 136 were at the informative species level, accounting for ~93% (~1.3 million t·year-1) of the total reconstructed catch (Table S18). The remaining 7% (~81,000 t) of the catch that is not at the species level includes highly vulnerable taxa, such as sharks and rays, and non-targeted, associated, and dependent taxa (Table S18). Ten dominant taxa accounted for ~85% of the reconstructed catches and included Thunnus albacares (24%), Katsuwonus pelamis (20%), Thunnus obesus (11%), Carcharhinus falciformis (8%), Thunnus maccooyii (5%, mainly in the 1950s and 1960s), Thunnus tonggol (5%), Thunnus alalunga (4%), Scomberomorus commerson (4%), Euthynnus affinis (3%), and Prionace glauca (3%) (Figure 4C, Table 19). ‘Other’ taxa, including other tunas, billfishes, sharks, and seerfishes, make up the remaining 14% of the total reconstructed catches (Figure 4C). The most abundant taxa caught between 1950 and the mid-1980s were Thunnus albacares and Thunnus maccoyii, followed by Carcharhinus falciformis and ‘other taxa’ (Figure 4C). The catches of Scomberomorus commerson increased over time, reaching a record high of 75,000 t in 2016 before slightly decreasing to ~65,000 t in 2020 (Figure 4C). Katsuwonus pelamis, Thunnus albacares, other taxa, and Thunnus tonggol made up the majority of catches in 2020 (~75) (Figure 4C).
Tunas represented the most important species group across all gear and country groups (Table S20). The second most important species group for longline and purse seine fisheries were sharks (e.g., Carcharhinus falciformis, Prionace glauca) which represented nearly 13% and 7% of the total reconstructed catch, respectively, whereas the second most important species group targeted by the gillnet fisheries includes small tunas and mackerels (e.g., Thunnus tonggol, Scomberomorus commerson, Euthynnus affinis), representing 21% of the total reconstructed catch (Tables S20, S21). Pole-and-line and other gears focused their efforts primarily on catching principal target tunas followed by ‘other’ taxa, accounting for 5% and 44% of the total reconstructed catches (Tables S20, S21). Sharks (i.e., Carcharhinuns falciformis, Prionace glauca) were among the main species groups targeted by distant-water and Indian Ocean rim countries, with these two shark species alone accounting for nearly 7% and 19% of the total reconstructed catches, respectively (Tables S20, S22). Indian Ocean rim countries further targeted seerfishes and thunnini (e.g., Scomberomorus commerson, Euthynnus affinis, Thunnus tonggol), which accounted for nearly 9% of the total reconstructed catches (Tables S20, S22).
3.5 Reconstructed catches by fishing country
The industrial fisheries for large pelagic species in the Indian Ocean have been dominated by vessels flying the flags of Indian Ocean rim countries in recent decades, accounting for around 73% (~1 million t) of total catches in 2020 (Figure 5A, Table S23). Seventeen Indian Ocean rim countries are actively engaged in the industrial fisheries for large pelagic species in the Indian Ocean (Table S25). The top ten Indian Ocean rim countries account for 70% of total reconstructed industrial catches of large pelagics in the Indian Ocean, and ~98% of the entire Indian Ocean rim country catches in 2020 (Figure 5A, Tables S24, S25). Indian Ocean rim country industrial catches of large pelagic species increased from 44,000 t·year-1 during the 1950s to slightly over 1 million t·year-1 by 2020 (Figure 5A, Table S23). Historically, however, catches by fleets flying the flag of 24 distant-water fishing countries dominated the fisheries for large pelagic species in this ocean basin (Figure 5A, Table S23), accounting for over 50% (~120,500 t·year-1) of total catches in the 1950s (Figure 5A). Total foreign catches increased from around 56,000 t·year-1 in the early 1950s to a peak of 716,000 t in 2005 (42% of total catches) before decreasing to 392,000 t·year-1 by 2020, at which point the distant-water fishing fleet catches accounted for only around 27% of total catches (Figure 5A).
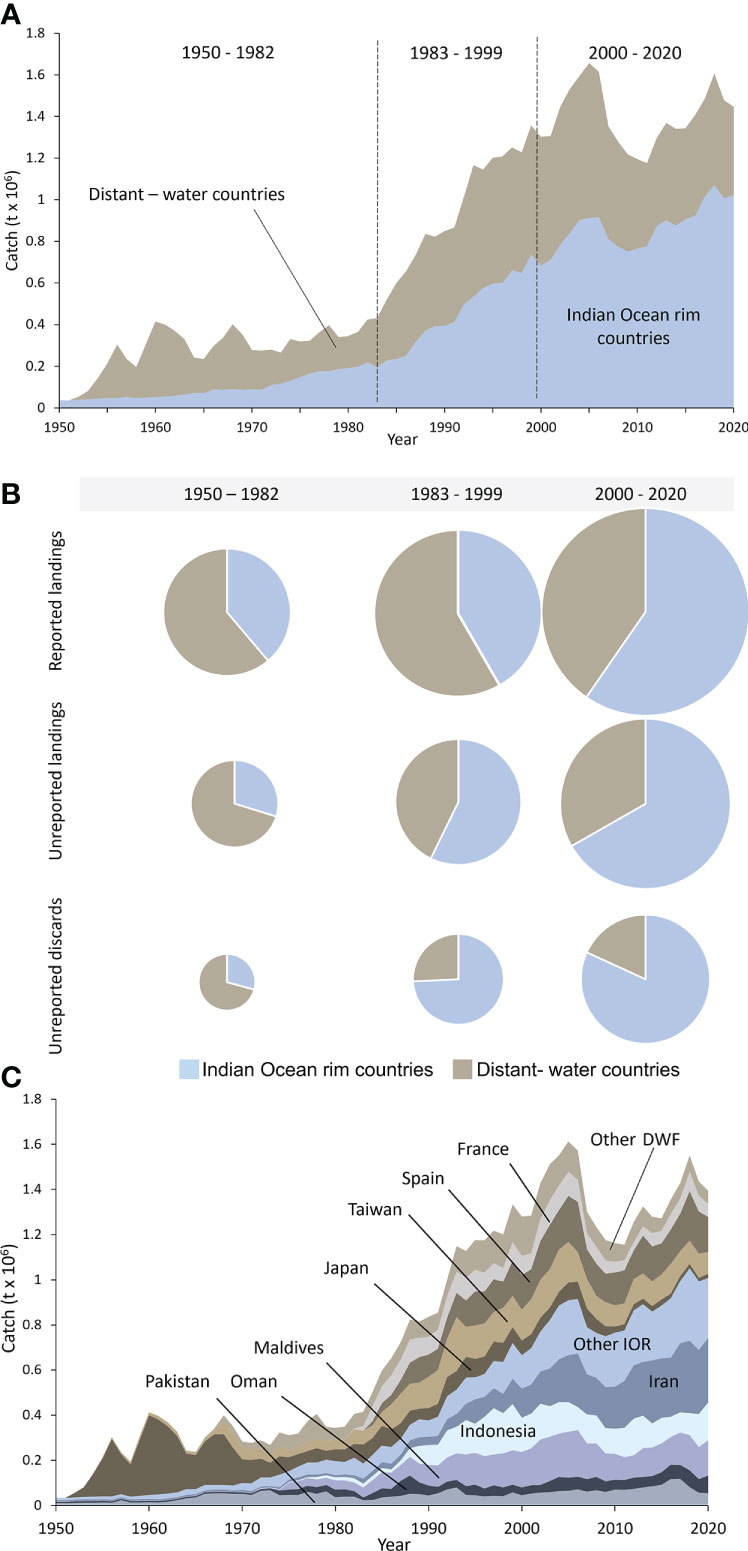
Figure 5 Total reconstructed industrial large pelagic fisheries catches for the Indian Ocean by (A) major country group from 1950 to 2020; (B) by analytically identified period (1950 – 1982, 1983 – 1999, and 2000-2020) and reporting status, where the pie chart size indicates the average amount of reported landings, unreported landings, and unreported discards per period; and (C) Composition of reconstructed total catches for the large pelagic fisheries catches for the Indian Ocean for 1950-2020 by country. The categories ‘other IOR’ and ‘other DWF’ consist of 14 and 21 additional countries with minor contributions to the overall catch.
Unreported landings, as well as unreported discards, were dominated by distant-water fishing countries in the earliest period, accounting for 68% (~57,400 t·year-1) and 69% (~26,300 t·year-1) of unreported industrial landings and discards, respectively (Figure 5B). In the most recent period (2000-2020), they declined to 31% (~50,200 t·year-1) and 17% (~ 23,600 t·year-1, Figure 5B, Table S20). On the other hand, Indian Ocean rim countries accounted for much smaller shares of unreported industrial landings and discards in the early period from the 1950s to the early 1980s (Figure 5B). However, in most recent years, they far exceeded distant-water fishing countries with 69% of unreported industrial landings (110,700 t·year-1) and 83% of discards (112,400 t·year-1), respectively (Figure 5B, Table S24).
During the earlier decades until the 1980s, approximately 90% (133,000 t·year-1) of the total reconstructed catches by distant-water countries was taken by Japan, followed by Taiwan, which contributed about 4% (~25,000 t·year-1) (Figure 5C, Table S25). Japan’s involvement in Indian Ocean tuna fisheries has declined substantially since the 1980s. More recently, Spain, Taiwan, and France dominate the distant-water fishing catches, accounting for 40% (~155,000 t·year-1), 26% (~103,000 t·year-1), and 15% (~59,000 t·year-1) of the total reconstructed distant-water catches in 2020, respectively (Figure 5C, Table S25).
Historically, the Indian Ocean rim countries Pakistan and Indonesia dominated the total reconstructed Indian Ocean rim country catches, accounting for approximately 35% (~35,000 t·year-1) and 13% (~28,000 t·year-1) of Indian Ocean rim country catches in this industrial fishery during the 1950s-1980s, respectively (Figure 5C, Table S25). Other Indian Ocean rim country, such as the Maldives, Iran, and Oman, have considerably increased their industrial tuna fishing activities from the 1980s onwards (Table S25). As a result, Indonesia and the Maldives are among the most important countries involved in the fisheries for large pelagics, accounting for approximately 17% (~169,000 t·year-1) and 15% (~156,000 t·year-1) of the Indian Ocean rim country industrial catches in 2020, respectively (Figure 5C, Tables S24, S25). However, the most important Indian Ocean rim country in the industrial tuna fisheries since the early 2000s is Iran, whose catches steadily increased since the 1950s, now representing around 28% (~287,000 t·year-1) of the total reconstructed Indian Ocean rim country industrial catch of large pelagics in 2020 (Figure 5C).
4 Discussion
Underreporting of fisheries catches by at least 30-50% is widespread in global fisheries (Pauly and Zeller, 2016a), and the industrial fisheries for large pelagic species in the Indian Ocean are no exception. We showed that these fisheries have underreported catches by nearly 30% since 1950 and at least 25% in recent years. As documented in this study, incomplete catch time series, non-reporting or underreporting of vulnerable bycatch species such as sharks, and the lack of discard records in the officially reported data are the primary cause of underreporting in these industrial Indian Ocean fisheries. This data shortfall suggests that despite the efforts of the IOTC to update, correct, and improve the catch data submitted by member countries, these data are still inconsistent and incomplete within and between countries and over time. The high proportion of unreported catches identified for the Indian Ocean’s large pelagic fisheries is concerning, given that the Indian Ocean tuna fishery is the second largest tuna fishery in the world, with ever-increasing catch volumes and highly industrialized vessels that heavily exploit both tunas and vulnerable bycatch species (Lecomte et al., 2017). The forty-fold increase in industrial Indian Ocean large pelagic catches, from approximately 35,000 t·year-1 in 1950 to just under 1.4 million t·year-1 by 2020, demonstrates the economic relevance of tuna fisheries in this ocean basin, a fishery that focuses mainly on supplying the global high-value seafood markets rather than local food security. It also illustrates the need for the IOTC to provide reliable and comprehensive catch data for the sustainable management of all species caught in these fisheries.
Discarding in fisheries is a wasteful practice, yet there has been considerable uncertainty over the magnitude of discards for the fisheries for large pelagics in the Indian Ocean and how they have changed over time (Baum and Worm, 2009). Our results suggest that discards in these Indian Ocean fisheries constitute a substantial component of unreported catches, accounting for half of the total unreported catches in 2020. Furthermore, discarding was primarily attributable to the extensive and wasteful disposal practices associated with longline and gillnet vessels. This number is particularly alarming, as longline and gillnet gears are lethal to a broad array of animals, such as critically endangered sharks whose bycatch mortality is exceptionally high during longlining (Campana et al., 2009; Gilman, 2011; Godin et al., 2012). Further, a study in 2020 found that most of the world’s cetacean bycatch comes from entanglement in gillnets (Anderson et al., 2011; Anderson et al., 2020). Our results indicate an average discard rate of ~11% over the 1950 -2020 period, which coincides with estimates from Kelleher (2005); Gilman et al. (2017; 2020), and Pérez-Roda et al. (2019), who estimated between 5% and 14% of discards for global fisheries. We found that discard rates were consistently highest for longline and gillnet gears, at ~14% and ~11%, respectively, whereas purse seine discard rates were much lower at ~4%. Discards estimated for the pelagic fisheries in this ocean basin align well with discards previously estimated for the largest pelagic fisheries in the world in the Pacific Ocean, which were also estimated at ~11% per year on average during 1950-2010 (Schiller, 2014). Our study provides a more in-depth update on the previous preliminary estimation of discards in the Indian Ocean’s large pelagic fisheries by Coulter et al. (2020), which assumed a median of ~7% discards.
The robustness of the underlying data for the present discard estimation remains relatively low due to extremely low and insufficient levels of observer coverage (~5%) and the low public availability of discard data (IOTC, 2011a). We emphasize that discard estimates provided by member countries to the IOTC should be included in the official IOTC reported baseline data as comprehensively raised and reconstructed discard estimates with comprehensive country, gear, and taxonomic compositions. Furthermore, the IOTC needs to substantially increase the observer coverage, either by human observers or via electronic monitoring systems on vessels active in the fisheries for large pelagic species, to ensure accurate catch and discard estimates (Gilman et al., 2019; van Helmond et al., 2020). However, this is only possible with increased compliance from member countries or through strengthening enforcement capacities within the IOTC.
Since 2011, IOTC measures stipulate that all member countries shall collect verified catch and other scientific data related to the fisheries for large pelagic species, including landings and discards of vulnerable bycatch species through the Regional Observer Scheme (ROS) (IOTC, 2011b). However, most member countries continue to ignore these reporting requirements, and as a result, both retained, and discarded catches are still only partially reported to the Commission (IOTC, 2011b; Heidrich et al., 2022). The exclusion of discards from national and international data reporting systems is unfortunately common globally and is highly problematic given the increased focus on ecosystem-based fisheries management (Pauly and Zeller, 2016a; Zeller et al., 2018). Catches reported to the IOTC, and most other tuna RFMOs, are still accepted as ‘true’ in the absence of definitive proof to the contrary. The IOTC, however, acknowledges that these data are estimated with some level of uncertainty (IOTC, 2021a).
The unreported landings and discards estimated here represent nearly 25% of the entire reconstructed catch in 2020 and have the potential to remain at this level unless more stringent measures are implemented to reduce non-reporting. Currently, these unreported catches may reflect the absence of sufficient and independent monitoring of vessels (Ewell et al., 2020). Furthermore, illegal fishing for tuna and sharks is known to occur throughout the Indian Ocean, with large-scale driftnets operating in the High Seas (Aranda et al., 2012; IOTC, 2012) and E.U. purse seiners likely accessing the EEZ waters of coastal countries illegally (Rattle, 2020). Our research found that longline and gillnet vessels contributed the majority (85%) of unreported catches of industrial tuna fisheries in the Indian Ocean. To what extent these catches are associated with illegal activities, such as using prohibited gear or fishing in EEZ waters without explicit access agreements, is currently not sufficiently known. We emphasize the need to address the underreporting of landings and discards seriously and to improve the IOTC catch statistics to strengthen the assessment and management of large pelagic species in the Indian Ocean.
Our reconstruction suggested that reporting quality has improved for tunas, whereas shark catches still often remain un- or under-reported, particularly in recent decades. Sharks account for 21% of total unreported landings and discards in 2020. There is a strong incentive to underreport shark catches when restrictive quotas are in place (Copes, 1986). The imposition of several fishing limits and restrictions on the trade of vulnerable sharks and rays, i.e., thresher sharks (Alopidae), oceanic whitetip sharks (Carcharhinus longimanus), and mobulid rays (Mobula spp.), including a ban on the retention, finning, and trading of specific species was a necessary first step towards the conservation of pelagic shark species (IOTC, 2010; IOTC, 2012; IOTC, 2013; IOTC, 2019b; IOTC, 2019c). Sharks are particularly vulnerable to fishing pressures due to their life history characteristics such as late maturity, low reproductive rates, and slow population growth (Hoenig, 1990). The failure of countries to collect and report detailed fisheries data on sharks hampers accurate population assessments that can inform management advice (Chen et al., 2003; Clarke et al., 2006; Cavanagh et al., 2009; Abella, 2011; Zhou et al., 2011). The majority of shark catch data reported by the IOTC on behalf of its member countries, particularly in earlier years, consists of highly aggregated taxonomic groups, i.e., ‘sharks various nei’. The uninformative coarse taxonomic resolution may be an artifact of the challenges associated with identifying sharks to the species level in field conditions. Reporting catches at fine taxonomic resolution requires a certain level of expertise and experience, but the misidentification of shark species is common, not least due to the lack of trained observers (IOTC, 2021b). The proportion of catches reported by species has increased in recent years, yet, some fleets continue only to report catches for species identified explicitly by the Commission and do not report catches of other species, causing difficulties in estimating total catches of all sharks and in disaggregating catches into species groups at a later date (IOTC, 2021b). This substantial taxonomic aggregation in the data reported by the IOTC on behalf of its member countries may mask essential patterns and trends in the Indian Ocean fisheries for large pelagics and further complicate the sustainable management of those species in the Indian Ocean. The industrial fisheries for large pelagic species in the Indian Ocean have already led to clearly identified impacts on shortfin mako (Isurus oxyrhynchus) and silky sharks (Carcharhinus falciformis) (Murua et al., 2009).
Our study demonstrated that distant-water fishing countries from East Asia and Europe historically dominated large-scale industrial fishing for large pelagic species in the Indian Ocean. These large fleets, flagged to distant-water countries outside the Indian Ocean region, were gradually replaced by fleets increasingly flagged to Indian Ocean rim countries, which currently account for the majority of industrial pelagic catches taken in the Indian Ocean (Lecomte et al., 2017). This shift in fishing country flags coincided with the intensification of reflagging and flag-hopping, as well as the growing use of flags of convenience and vessel chartering by coastal Indian Ocean countries starting in the 1990s (Majkowski, 2007). The use of flags of convenience and charters, where the majority beneficial ownership of vessels continues to lie outside the Indian Ocean rim country flag/host state, is unfortunately common practice in large-scale commercial fisheries today (Ford et al., 2022). However, this ability to register vessels in a country where the vessel or business owner is not a citizen or permanent resident and where its society does not receive the overwhelming majority of socio-economic benefits creates immense regulatory and tax challenges and contributes to the corruption in the fisheries sector tied to Illegal, Unreported, and Unregulated (IUU) fishing (C4ADS and Trygg Mat, 2020). The most prominent example of this growing link between reflagged vessels and high-risk fishing practices is the exploitation of West African flags, mainly by Asian, especially Chinese vessels and fishing captains (Belhabib et al., 2015), to evade effective control and fish unsustainably and irresponsibly in both sovereign African and international waters (SRFC, 2013M; Belhabib, 2017; Belhabib et al., 2020). There are also examples of known IUU fishing activities in the Indian Ocean, such as unauthorized tuna longlining and transshipment in the Bay of Bengal, a hotspot for IUU fishing (Faiyaz and Al Arif, 2022) and likely non-compliance with national and international regulations by Spanish-owned vessels fishing in Indian and Somali waters without authorization (Rattle, 2020; Rattle and Duncan-Jones, 2022; Richardson, 2022). The IOTC and other regional regulatory bodies in the Indian Ocean urgently need to address IUU fishing and the problem of reflagging foreign vessels in the region.
Many of the Indian Ocean rim countries engaged in fisheries for large pelagics continue to have poor monitoring systems, thus introducing high uncertainty in the region’s total catches by species, areas, and gears (Aranda et al., 2012). These vessels, classified by the IOTC as artisanal vessels engaged in small-scale fishing operations in the coastal waters of Indian Ocean rim countries, have increasingly gained navigational autonomy and onboard catch preservation capacities to undertake longer voyages beyond coastal and national waters, now competing with large-scale distant-water fleets in the High Seas (Aranda et al., 2012). This also supports our decision in this study to reclassify ~25% of catches reported by the IOTC as ‘artisanal’ to the industrial fishing sector. We commend the efforts of the IOTC on their in-country ‘fact-finding’ missions to enhance the understanding of data collection processes but emphasize the need to further improve awareness of the range of artisanal and industrial data collection systems in place to better understand the accuracy of current catch statistics (OFC, 2007; OFC, 2010; OFC, 2013).
Our study is the first to comprehensively account for all sources of total fisheries catches for large pelagic species in the Indian Ocean, including major unreported landings and discards.
However, numerous challenges were uncovered with regard to both the quantity and quality of available data and information and the accuracy of these sources. Furthermore, our results likely do not adequately reflect changes in the taxonomic composition of discards that may have occurred in earlier decades, as most of the taxonomic information on discards used for the reconstruction was based on data from recent decades. We recognize that our reconstructed estimates of unreported catch components are likely subject to higher uncertainty than the officially reported catch data (Zeller and Pauly, 2018; Zeller et al., 2023b). Yet, we believe that the reconstructed unreported catch components are the best current estimates and may likely even be conservative.
Comprehensive and more accurate time series of catches can better inform effective management advice for large pelagic species. Inaccurate and incomplete catch statistics, including the lack of taxonomic resolution, are a ubiquitous challenge and are recognized as a major obstacle to fisheries research and management (Ferretti et al., 2008; Bradai et al., 2012). Total allowable catches (TACs), which are partially informed by historical catch time series, can have substantial influence on rebuilding overfished stocks (Pons et al., 2017). Accordingly, well-informed TACs should be considered a primary tool for preventing the overexploitation of large pelagic species in the Indian Ocean, yet scientists and managers in the IOTC still debate the level of quotas set (Seto et al., 2020). We have provided a more comprehensive and transparent accounting of the industrial fisheries catches for large pelagic species in the Indian Ocean between 1950 and 2020 and highlighted the need for substantially improved accounting of catches in national and international statistics. Specifically, catch underreporting and high uncertainties in catches reported to the IOTC remain a challenge for Indian Ocean rim countries, despite improvements in the IOTC data reporting systems in recent years (IOTC, 2021b). Reconstructed catches in the Indian Ocean were 30% higher than the data reported by the IOTC on behalf of its member countries, potentially questioning the reliability of any TACs derived from incomplete data. Furthermore, additional monitoring and enforcement efforts are needed to improve fisheries in both the coastal and High Seas waters to counteract the unknown contribution to the exploitation of large pelagics in the Indian Ocean. We recommend that the IOTC and other regional regulatory bodies in the Indian Ocean urgently address IUU fishing and the problem of reflagging foreign vessels in the region. We also recommend they adopt harmonized and real-time traceability tools, such as permanent, compulsory AIS, and electronic catch documentation schemes for all industrial fleets, and gears. Furthermore, we urge a substantial increase in independent observer program coverage in all industrial fleet segments, by taking full advantage of all electronic and video monitoring technology.
Data availability statement
The original contributions presented in the study are included in the article/Supplementary Material. Further inquiries can be directed to the corresponding author.
Author contributions
KH completed the data synthesis and analysis and drafted, reviewed and edited the manuscript. DZ advised on methods, reviewed and edited the manuscript. All authors reviewed and edited the manuscript. All authors contributed to the article and approved the submitted version.
Funding
This research was supported by an Australian Government Research Training Program (RTP) Scholarship. KH was also supported by the Forrest Research Foundation. General Sea Around Us research is supported by the Oak Foundation, the Paul M. Angell Family Foundation, the Marisla Foundation, the David and Lucile Packard Foundation and the Bloomberg Philantropies via Rare. However, no specific or dedicated funds were provided to support this specific research.
Conflict of interest
The authors declare that the research was conducted in the absence of any commercial or financial relationships that could be construed as a potential conflict of interest.
Publisher’s note
All claims expressed in this article are solely those of the authors and do not necessarily represent those of their affiliated organizations, or those of the publisher, the editors and the reviewers. Any product that may be evaluated in this article, or claim that may be made by its manufacturer, is not guaranteed or endorsed by the publisher.
Author disclaimer
The views and opinions of authors herein do not necessarily state or reflect those of the funding organizations as they had no involvement in the design or production of the study.
Supplementary material
The Supplementary Material for this article can be found online at: https://www.frontiersin.org/articles/10.3389/fmars.2023.1177872/full#supplementary-material
References
Abella A. (2011). General review on the available methods for stock assessment of Elasmobranchs, especially in data shortage situations. In Sub-Committee on Stock Assessment (SCSA) Report of the Workshop on Stock Assessment of Selected Species of Elasmobranchs in the GFCM Area DG-MARE (Brussels, Belgium: GFCM-FAO) 12–16.
Alder J., Watson R. (2007). “Fisheries globalization: fair trade of piracy?,” in Globalization: effects on fisheries resources. Eds. Taylor W. W., Schechter M. G., Wolfson (New York: Cambridge University Press), 47–74.
Allen R. (2010). International management of tuna fisheries: arrangements, challenges and a way forward. FAO Fisheries and Aquaculture Technical Paper. No. 536 (Rome, FAO) 45.
Anderson R. C., Herrera M., Ilangakoon A. D., Koya K. M., Moazzam M., Mustika P. L., et al. (2020). Cetacean bycatch in Indian ocean tuna gillnet fisheries. Endanger. Species Res. 41, 39–53. doi: 10.3354/esr01008
Anderson O. R. J., Small C. J., Croxall J. P., Dunn E. K., Sullivan B. J., Yates O., et al. (2011). Global seabird bycatch in longline fisheries. Endanger. Species Res. 14, 91–106. doi: 10.3354/esr00347
Aranda M., Murua H., De Bruyn P. (2012). Managing fishing capacity in tuna regional fisheries management organisations (RFMOs): development and state of the art. Mar. Policy 36, 985–992. doi: 10.1016/j.marpol.2012.01.006
Belhabib D., Rashid Sumaila U., Lam V. W. Y., Zeller D., Le Billon P., Kane E. A., et al. (2015). Euros vs (Yuan: Comparing European and Chinese Fishing Access in West Africa). doi: 10.1371/journal.pone.0118351
Belhabib D., Cheung W. W. L., Kroodsma D., Lam V. W. Y., Underwood P. J., Virdin J. (2020). Catching industrial fishing incursions into inshore waters of Africa from space. Fish Fish. 21, 379–392. doi: 10.1111/faf.12436
Bateman S. (2012). Maritime security and port state control in the Indian ocean region. J. Indian Ocean Reg. 8, 188–201. doi: 10.1080/19480881.2012.730752
Baum J. K., Worm B. (2009). Cascading top-down effects of changing oceanic predator abundances. J. Anim. Ecol. 78, 699–714. doi: 10.1111/j.1365-2656.2009.01531.x
Bell J. D., Senina I., Adams T., Aumont O., Calmettes B., Clark S., et al. (2021). Pathways to sustaining tuna-dependent pacific island economies during climate change. Nat. Sustain. 4, 900–910. doi: 10.1038/s41893-021-00745-z
Bradai M. N., Saidi B., Enajjar S. (2012). Elasmobranchs of the Mediterranean and black Sea: status, ecology and biology. bibliographic analysis. Studies and Reviews-General Fisheries Commission for the Mediterranean, 91.
C4ADS, Trygg Mat (2020) Spotlight on: the exploitation of company structures by illegal fishing operators. Available at: https://1ae03060-3f06-4a5c-9ac6-b5c1b4a62664.usrfiles.com/ugd/1ae030_4e59a8cf86364c1a83eb385cb57619f7.pdf.
Campana S. E., Joyce W., Manning M. J. (2009). Bycatch and discard mortality in commercially caught blue sharks prionace glauca assessed using archival satellite pop-up tags. Mar. Ecol. Prog. Ser. 387, 241–253. doi: 10.3354/meps08109
Carmine G., Mayorga J., Miller N. A., Park J., Halpin P. N., Ortuño Crespo G., et al. (2020). Who is the high seas fishing industry? One Earth 3, 730–738. doi: 10.1016/j.oneear.2020.11.017
Cavanagh R. D., Fowler S. L., Camhi M. D. (2009). Pelagic sharks and the FAO international plan of action for the conservation and management of sharks. Sharks Open Ocean Biol. Fish. Conserv., 478–492. doi: 10.1002/9781444302516.ch38
Chen Y., Chen L., Stergiou K. I. (2003). Impacts of data quantity on fisheries stock assessment. Aquat. Sci. 65, 92–98. doi: 10.1007/s000270300008
Chuenpagdee R., Liguori L., Palomares M. L. D., Pauly D. (2006). Bottom-up, global estimates of small-scale marine fisheries catches. Fish. Cent. Res. Rep. 14, 105. doi: 10.14288/1.0074761
Clarke S. C., McAllister M. K., Milner-Gulland E. J., Kirkwood G. P., Michielsens C. G. J., Agnew D. J., et al. (2006). Global estimates of shark catches using trade records from commercial markets. Ecol. Lett. 9, 1115–1126. doi: 10.1111/j.1461-0248.2006.00968.x
Collette B. B., Boustan A., Fox W., Graves J., Juan-Jorda M. J., Restrepo V. (2021). Thunnus albacares. The IUCN red list of threatened species 2021, e.T21857A46624561. doi: 10.2305/IUCN.UK.2021-2.RLTS.T21857A46624561.en. (Accessed on 13 May 2023)
Copes P. (1986). A critical review of the individual quota as a device in fisheries management. Land Econ. 62, 278–291. doi: 10.4135/9781412969024.n17
Coulter A., Cashion T., Cisneros-Montemayor A. M., Popov S., Tsui G., Le Manach F., et al. (2020). Using harmonized historical catch data to infer the expansion of global tuna fisheries. Fish. Res. 221, 105379. doi: 10.1016/j.fishres.2019.105379
Cullis-Suzuki S., Pauly D. (2010). Failing the high seas: a global evaluation of regional fisheries management organizations. Mar. Policy 34, 1036–1042. doi: 10.1016/j.marpol.2010.03.002
Davidson L. N. K., Krawchuk M. A., Dulvy N. K. (2016). Why have global shark and ray landings declined: improved management or overfishing? Fish Fish. 17, 438–458. doi: 10.1111/faf.12119
Doyle T. (2018). Blue economy and the Indian ocean rim. J. Indian Ocean Reg. 14, 1–6. doi: 10.1080/19480881.2018.1421450
Ewell C., Hocevar J., Mitchell E., Snowden S., Jacquet J. (2020). An evaluation of regional fisheries management organization at-sea compliance monitoring and observer programs. Mar. Policy 115, 103842. doi: 10.1016/j.marpol.2020.103842
Faiyaz T., Al Arif A. (2022). Towards a blue revolution in the bay of Bengal: tackling illegal, unreported and unregulated fishing through effective regional cooperation. J. World Invest. Trade 23, 9–38. doi: 10.1163/22119000-12340239
FAO (2020). The state of world fisheries and aquaculture 2020. sustainability in action. Sustainability in action (Rome). doi: 10.4060/ca9229en
Ferretti F., Myers R. A., Serena F., Lotze H. K. (2008). Loss of large predatory sharks from the Mediterranean Sea. Conserv. Biol. 22, 952–964. doi: 10.1111/j.1523-1739.2008.00938.x
Ford J. H., Wold C., Currie D., Wilcox C. (2022). Incentivising change to beneficial ownership and open registers—Holding flag states responsible for their fleets and costs of illegal fishing. Fish and Fisheries 23 (5), 1240–1248. doi: 10.1111/faf.12677
Froese R., Nazli D., Gianpaolo C., Kleisner K. M., Henning W. (2017). Estimating fisheries reference points from catch and resilience. Fish Fisheries 183), 506–526.
Froese R., Winker H., Coro G., Demirel N., Tsikliras A. C., Dimarchopoulou D., et al. (2018). Status and rebuilding of European fisheries. Mar. Policy 93, 159–170.
Froese R., Winker H., Coro G., Demirel N., Tsikliras A. C., Dimarchopoulou D., et al. (2020). Estimating stock status from relative abundance and resilience. ICES J. Mar. Sci. 77 (2), 527–538.
Garibaldi L. (2012). The FAO global capture production database: a six-decade effort to catch the trend. Mar. Policy 36, 760–768. doi: 10.1016/j.marpol.2011.10.024
Gianni M., Currie D. E. J., Fuller S., Speer L., Ardron J., Weeber B., et al. (2011). Unfinished business: a review of the implementation of the provisions of UNGA resolutions 61/105 and 64/72 related to the management of bottom fisheries in areas beyond national jurisdiction. Deep Sea Conserv. Coalit. 54.
Gilman E. L. (2011). Bycatch governance and best practice mitigation technology in global tuna fisheries. Mar. Policy 35, 590–609. doi: 10.1016/j.marpol.2011.01.021
Gilman E., Legorburu G., Fedoruk A., Heberer C., Zimring M., Barkai A. (2019). Increasing the functionalities and accuracy of fisheries electronic monitoring systems. Aquat. Conserv. Mar. Freshw. Ecosyst. 29, 901–926. doi: 10.1002/aqc.3086
Gilman E., Perez Roda A., Huntington T., Kennelly S. J., Suuronen P., Chaloupka M., et al. (2020). Benchmarking global fisheries discards. Sci. Rep. 10 (1), 14017. doi: 10.1038/s41598-020-71021-x
Gilman E., Suuronen P., Chaloupka M. (2017). Discards in global tuna fisheries. Mar. Ecol. Prog. Ser. 582, 231–252. doi: 10.3354/meps12340
Godin A. C., Carlson J. K., Burgener V. (2012). The effect of circle hooks on shark catchability and at-vessel mortality rates in longlines fisheries. Bull. Mar. Sci. 88, 469–483. doi: 10.5343/bms.2011.1054
Heidrich K. N., Juan-Jordá M. J., Murua H., Thompson C. D. H., Meeuwig J. J., Zeller D. (2022). Assessing progress in data reporting by tuna regional fisheries management organizations. Fish Fish. 23 (6), 1–18. doi: 10.1111/faf.12687
Hoenig J. M. (1990). Life-history patterns in the elasmobranchs: implications for fisheries management. elasmobranchs as living resour. Adv. Biol. Ecol. Syst. Status Fish., NOAA Technical Rep. 1–16.
IOTC (2010). Recommendation 10/13 on the implementation of a ban on discards of skipjack tuna, yellow fin tuna, bigeye tuna, and non targeted species caught by purse seiners (Mahé, Seychelles: Indian Ocean Tuna Commission). Available at: https://www.iotc.org/cmm/recommendation-1013-implementation-ban-discards-skipjack-tuna-yellow-fin-tuna-bigeye-tuna-and.
IOTC (2011a). Res.11/04. resolution on a regional observer scheme (Mahé, Seychelles: Indian Ocean Tuna Commission). Available at: https://www.iotc.org/cmm/resolution-1104-regional-observer-scheme#:~:text=TheobjectiveoftheIOTC,theIOTCareaofcompetence.
IOTC (2011b). Resolution 11/04: on a regional observer scheme (Mahé, Seychelles: Indian Ocean Tuna Commission).
IOTC (2012). Res. 12/09. on the conservation of thresher sharks (family alopiidae) caught in association with fisheries in the IOTC area of competence (Mahé, Seychelles: Indian Ocean Tuna Commission).
IOTC (2013). Res.13/06. on a scientific and management framework on the conservatino of shark species caught in association with IOTC managed fisheries (Mahé, Seychelles: Indian Ocean Tuna Commission).
IOTC (2014). Guidelines for the reporting of fisheries statistics (Mahé, Seychelles: IOTC Secretariat).
IOTC (2015). Res. 15/02. mandatory statistical reporting requirements for IOTC contracting parties and cooperating non-contracting parties (CPCs) (Mahé, Seychelles: Indian Ocean Tuna Commission). Available at: https://www.iotc.org/cmm/resolution-1502-mandatory-statistical-reporting-requirements-iotc-contracting-parties-and.
IOTC (2019b). Res. 19/05. on a ban on discards of bigeye tuna, skipjack tuna, yellowfin tuna, and non- targeted species caught by purse seine vessels in the iotc area of competence (Mahé, Seychelles: Indian Ocean Tuna Commission).
IOTC (2019c). Resolution 19/03: on the conservation of mobulid rays in association with fisheries in the IOTC area of competence (Mahé, Seychelles: Indian Ocean Tuna Commission).
IOTC (2021a). Report of the 17th session of the IOTC working party on data collection and statistics (Mahé, Seychelles: IOTC Secretariat).
IOTC (2021b). Review of the statistical data available for bycatch species (Mahé, Seychelles: Indian Ocean Tuna Commission).
Juan-Jordá M. J., Mosqueira I., Cooper A. B., Freire J., Dulvy N. K. (2011). Global population trajectories of tunas and their relatives. Proc. Natl. Acad. Sci. U. S. A. 108, 20650–20655. doi: 10.1073/pnas.1107743108
Karim M. S., Techera E., Arif A. (2020). Ecosystem-based fisheries management and the precautionary approach in the Indian ocean regional fisheries management organisations. Mar. pollut. Bull. 159, 111438. doi: 10.1016/j.marpolbul.2020.111438
Kimani E. N., Okemwa G. M., Kazungu J. M. (2009). Fisheries in the southwest Indian ocean: trends and governance challenges. In Ellen L., Amit P. The Indian Ocean-Resource and Governance Challenges (Washington, DC: The Henry L. Stimson Center), 3–17. doi: 10.4324/9780203414132
Kleisner K., Zeller D., Froese R., Pauly D. (2013). Using global catch data for inferences on the world’s marine fisheries. Fish Fish. 14, 293–311. doi: 10.1111/j.1467-2979.2012.00469.x
Lascelles B., Notarbartolo G., Sciara D., Agardy T., Cuttelod A., Eckert S., et al. (2014). Migratory marine species: their status, threats and conservation management needs. Aquat. Conserv. Mar. Freshw. Ecosyst. 24, 111–127. doi: 10.1002/aqc.2512
Lecomte M., Rochette J., Laurans Y., Lapeyre R. (2017). ). Indian ocean tuna fisheries: between development opportunities and sustainability issues (Paris, France: Développment Durable Relations Int.), 1–96. Available at: https://www.iddri.org.
Leitão F., Baptista V., Erzini K. (2018). Reconstructing discards profiles of unreported catche. Sci. Mar. 82, 39–49. doi: 10.3989/scimar.04723.08A
Li M. L., Ota Y., Underwood P. J., Reygondeau G., Seto K., Lam V. W. Y., et al. (2021). Tracking industrial fishing activities in African waters from space. Fish Fish. 22, 851–864. doi: 10.1111/faf.12555
Llewellyn L. E., English S., Barnwell S. (2016). A roadmap to a sustainable Indian ocean blue economy. J. Indian Ocean Reg. 12, 52–66. doi: 10.1080/19480881.2016.1138713
Majkowski J. (2007). Tuna and tuna-like species: global status of fishery resources. Marine Resources Service (FIRM), Fishery Resources Division (FID), Fisheries Department (FI), Food and Agricultural Organization of the United States (FAO).
Martin S., Fiorellato F., Rice J. (2017). Approaches to the reconstruction of catches of Indian ocean blue shark (Prionace glauca) (Mahé, Seychelles: IOTC Secretariat).
Martin S., Shahid U. (2021). “Bycatch management in IOTC fisheries: IOTC-2021-WPEB17 (AS)-24”, Indian Ocean Tuna Commission Working Party on Ecosystems and Bycatch.
Mastrandrea M. D., Field C. B., Stocker T. F., Edenhofer O., Ebi K. L., Frame D. J., et al. (2010) Guidance note for lead authors of the IPCC fifth assessment report on consistent treatment of uncertainties. Available at: http://www.ipcc.ch.
McClenachan L., Ferretti F., Baum J. K. (2012). From archives to conservation: why historical data are needed to set baselines for marine animals and ecosystems. Conserv. Lett. 5, 349–359. doi: 10.1111/j.1755-263X.2012.00253.x
McKinney R., Gibbon J., Wozniak E., Galland G. (2020). A global tuna valuation (Pew Charitable Trusts, Washington, D.C., 2020) Report, 36.
Miyake M. P., Miyabe N., Nakano H. (2004). Historical trends of tuna catches in the world: FAO technical paper 467. Fao 467, 74.
Moazzam M., Ayub S. (2017). Catch reconstruction of neritic tuna landings of Pakistan based on data collected by WWF pakistan’s crew based obsever programme. Seventh Session of IOTC Working Party on Neritic Tuna (WPNT07), 10–13.
Moazzam M., Khan M. F., Khan M. W. (2017). Status of gillnet fisheries and data reconstruction of tropical tuna in Pakistan. Iotc 10.
MRAG (2019) Monitoring of artisanal fishing in the Indian ocean. Available at: www.mrag.co.uk.
Muggeo V. (2008). segmented: an r package to fit regression models with broken-line relationships. R news 8 (1), 20–25.
Murua H., Arrizabalaga H., Huang J., Romanov E., Bach P., de Bruyn P. (2009). Ecological risk assessment (ERA) for species caught in fisheries managed by the Indian ocean tuna commission (IOTC): a first attempt. IOTC-2009-WPEB-20 (Mahé, Seychelles).
OFC (2007). Indian Ocean Tuna Commission. Comprehensive report IOTC-OFCF project (April 2002~ March 2007) (Mahé, Seychelles: Indian Ocean Tuna Commission) Indian Ocean Tuna Commission. Comprehensive report IOTC-OFCF project (April 2002~ March 2007.
OFC (2010). Indian Ocean Tuna Commission. Comprehensive report IOTC-OFCF project phase II (June 2007-March 2010).
OFC (2013). Indian Ocean Tuna Commission. Comprehensive report IOTC-OFCF project phase II (June 2010-March 2013).
Okemwa G. M., Abubakar A. A., Mzingirwa F., Kimani E. N., Kamau J. N., Njiru J. M., et al. (2023). Characterizing gear-based exploitation patterns of artisanal tuna fisheries in the western Indian Ocean: a snapshot from Kenya. Reg. Stud. Mar. Sci. 61, 102877. doi: 10.1016/j.rsma.2023.102877
Pauly D., Zeller D. (2016a). Catch reconstructions reveal that global marine fisheries catches are higher than reported and declining. Nat. Commun. 7 (1), 10244. doi: 10.1038/ncomms10244
Pauly D., Zeller D. (2016b). Global atlas of marine fisheries: a critical appraisal of catches and ecosystem impacts (Washington, DC: Island Press), 497.
Pauly D., Zeller D. (2017). The best catch data that can possibly be? rejoinder to ye et al. “FAO’s statistic data and sustainability of fisheries and aquaculture” Mar. Policy 81, 406–410. doi: 10.1016/j.marpol.2017.03.013
Pérez-Roda A., Gilman E., Huntington T., Kennelly S. J., Suuronen P., Chaloupka M., et al. (2019) A third assessment of global marine fisheries discards. Available at: www.fao.org/.
Pillai N. G., Satheeshkumar P. (2012). Biology, fishery, conservation and management of Indian ocean tuna fisheries. Ocean Sci. J. 47, 411–433. doi: 10.1007/s12601-012-0038-y
Pitcher T. J., Cheung W. W. L. (2013). Fisheries: hope or despair? Mar. pollut. Bull. 74, 506–516. doi: 10.1016/j.marpolbul.2013.05.045
Pons M., Branch T. A., Melnychuk M. C., Jensen O. P., Brodziak J., Fromentin J. M., et al. (2017). Effects of biological, economic and management factors on tuna and billfish stock status. Fish Fish. 18, 1–21. doi: 10.1111/faf.12163
Rattle J. (2020). Automatic identification system (AIS) usage by Spanish and French-flagged vessels. Blue Marine Foundation.
Rattle J., Duncan-Jones G. (2022). Fishing outside the lines: widespread noncompliance in Indian Ocean tuna fisheries (London, UK: Blue Marine Foundation).
Richardson A. (2022) IOTC catch-effort assessment and AIS usage by flag-states in the Western Indian ocean 2016-2020. Available at: https://www.bluemarinefoundation.com/2022/05/20/evidence-of-unauthorised-fishing-by-eu-vessels-in-indian-ocean-coastal-states-waters/.
Sala E., Mayorga J., Costello C., Kroodsma D., Palomares M. L. D., Pauly D., et al. (2018). The economics of fishing the high seas. Sci. Adv. 4, eaat2504. doi: 10.1126/sciadv.aat2504
Schaefer K. M., Fuller D. W., Aldana G. (2014). Movements, behavior, and habitat utilization of yellowfin tuna (Thunnus albacares) in waters surrounding the revillagigedo islands archipelago biosphere reserve, Mexico. Fish. Oceanogr. 23, 65–82. doi: 10.1111/fog.12047
Schiller L. L. (2014). Tuna be, or not tuna be: using catch data to observe the ecologicl impacts of commercial tuna fisheries in the pacific ocean at varying spatial scales (Doctoral dissertation, University of British Columbia).
Seto K., Galland G. R., McDonald A., Abolhassani A., Azmi K., Sinan H., et al. (2020). Resource allocation in transboundary tuna fisheries: a global analysis. Ambio 50, 242–259. doi: 10.1007/s13280-020-01371-3
Sinan H., Bailey M. (2020). Understanding barriers in Indian ocean tuna commission allocation negotiations on fishing opportunities. Sustain. 12(16), 6665. doi: 10.3390/su12166665
SRFC P. S. (2013). Written statement of the Sub-regional fisheries commission, version 2, with annexes I to V. doi: 10.1163/9789004329607_044
Stequert B., Marsac F. (1986). Tropical tuna surface fisheries in the Indian ocean. Food & Agriculture Org. 282.
Taylor S. F. W., Roberts M. J., Milligan B., Ncwadi R. (2019). Measurement and implications of marine food security in the Western Indian ocean: an impending crisis? Food Secur. 11, 1395–1415. doi: 10.1007/s12571-019-00971-6
Techera E. J. (2018). Supporting blue economy agenda: fisheries, food security and climate change in the Indian ocean. J. Indian Ocean Reg. 14, 7–27. doi: 10.1080/19480881.2017.1420579
Teh L. C. L., Sumaila U. R. (2013). Contribution of marine fisheries to worldwide employment. Fish Fish. 14, 77–88. doi: 10.1111/j.1467-2979.2011.00450.x
Trebilco R., Baum J. K., Salomon A. K., Dulvy N. K. (2013). Ecosystem ecology: size-based constraints on the pyramids of life. Trends Ecol. Evol. 28, 423–431. doi: 10.1016/j.tree.2013.03.008
van Helmond A. T. M., Mortensen L. O., Plet-Hansen K. S., Ulrich C., Needle C. L., Oesterwind D., et al. (2020). Electronic monitoring in fisheries: lessons from global experiences and future opportunities. Fish Fish. 21, 162–189. doi: 10.1111/faf.12425
Walker R. (2021) Six countries intent to object IOTC catch limits could threaten the sustainability of yellowfin tuna stock. Available at: https://www.globaltunaalliance.com/general/six-countries-intent-to-object-iotc-catch-limits-could-threaten-the-sustainability-of-yellowfin-tuna-stock/.
Weaver P., Benn a, Arana P., Ardron J. (2011). The impact of deep-sea fisheries and implementation of the UNGA resolutions 61/105 and 64/72. report of an international scientific workshop (Southampton: National Oceanographic Centre), 45. Available at: http://epic.awi.de/24870/1/Wea2011a.pdf.
Wright G., Ardron J., Gjerde K., Currie D., Rochette J. (2015). Advancing marine biodiversity protection through regional fisheries management: a review of bottom fisheries closures in areas beyond national jurisdiction. Mar. Policy 61, 134–148. doi: 10.1016/j.marpol.2015.06.030
WWF (2020). Unregulated fishing on the high seas of the Indian ocean: the impacts on, risks to, and challenges for sustainable fishing and ocean health WWF. https://www.wwf.eu/?1014116/Unregulated-fishing-on-the-high-seas-of-the-Indian-Ocea.
Zeller D., Ansell M., Andreaoli V., Heidrich K. N. (2023a). Trends in Indian ocean marine fisheries since 1950: synthesis of reconstructed catch and effort data. Mar. Freshw. Res. doi: 10.1071/MF22148
Zeller D., Booth S., Craig P., Pauly D. (2006). Reconstruction of coral reef fisheries catches in American samoa 1950–2002. Coral Reefs 25, 144–152. doi: 10.1007/s00338-005-0067-4
Zeller D., Booth S., Davis G., Pauly D. (2007) Re-estimation of small-scale fishery for U.S. flag-associated island areas in the western pacific: the last 50 years. Available at: http://www.wpcouncil.
Zeller D., Cashion T., Palomares M., Pauly D. (2018). Global marine fisheries discards: a synthesis of reconstructed data. Fish Fish. 19, 30–39. doi: 10.1111/faf.12233
Zeller D., Palomares M. L. D., Pauly D. (2023b). Global fisheries science documents human impacts on oceans: the Sea around us serves civil society in the twenty-first century. Ann. Rev. Mar. Sci. 15, 147–165. doi: 10.1146/annurev-marine-030322-113814
Zeller D., Palomares M. L. D., Tavakolie A., Ang M., Belhabib D., Cheung W. W. L., et al. (2016). Still catching attention: Sea around us reconstructed global catch data, their spatial expression and public accessibility. Mar. Policy 70, 145–152. doi: 10.1016/j.marpol.2016.04.046
Zeller D., Pauly D. (2018). The ‘presentist bias’ in time-series data: implications for fisheries science and policy. Mar. Policy 90, 14–19. doi: 10.1016/j.marpol.2018.01.015
Keywords: bycatch, discards, sharks, tunas, unreported catches
Citation: Heidrich KN, Meeuwig JJ and Zeller D (2023) Reconstructing past fisheries catches for large pelagic species in the Indian Ocean. Front. Mar. Sci. 10:1177872. doi: 10.3389/fmars.2023.1177872
Received: 02 March 2023; Accepted: 10 May 2023;
Published: 23 May 2023.
Edited by:
Fabian Zimmermann, Norwegian Institute of Marine Research (IMR), NorwayReviewed by:
Dimitrios K. Moutopoulos, University of Patras, GreeceFrancisco Leitão, University of Algarve, Portugal
Copyright © 2023 Heidrich, Meeuwig and Zeller. This is an open-access article distributed under the terms of the Creative Commons Attribution License (CC BY). The use, distribution or reproduction in other forums is permitted, provided the original author(s) and the copyright owner(s) are credited and that the original publication in this journal is cited, in accordance with accepted academic practice. No use, distribution or reproduction is permitted which does not comply with these terms.
*Correspondence: Kristina N. Heidrich, a3Jpc3RpbmEuaGVpZHJpY2hAcmVzZWFyY2gudXdhLmVkdS5hdQ==