 Kuifeng Luan1,2
 Hui Li
 Zhenhua Wang
- 1College of Marine Sciences, Shanghai Ocean University, Shanghai, China
- 2Estuarine and Oceanographic Mapping Engineering Research Center of Shanghai, Shanghai, China
- 3Shanghai Marine Monitoring and Forecasting Center, Shanghai, China
- 4College of Information Technology, Shanghai Ocean University, Shanghai, China
Introduction: The study on the distribution characteristics of suspended sediment concentration (SSC) in estuaries is an important subject in the study of estuaries and coasts, which has important theoretical significance and practical value.
Methods: In order to fully understand the characteristics of SSC in the Yangtze River Estuary and its adjacent waters, this paper uses fixed vertical observation data and navigation type large area observation data as data sources to analyze the distribution characteristics of SSC in the Yangtze River Estuary and its adjacent waters under different tidal current states and its vertical profile characteristics. It discusses the impact of tidal current velocity on SSC and the changes of SSC in the Yangtze River Estuary and its adjacent waters from 2018 to 2020. And the applicability of the Rouse and Soulsby formulas in the Yangtze River Estuary and its adjacent waters was verified.
Results: It was found that the Rouse and Soulsby models have high applicability in the study area, and the prediction accuracy based on the Li’s Soulsby model is higher. This study provides effective support for carrying out marine forecasting, analysis and evaluation, and provides theoretical basis for carrying out analysis of the current situation of estuarine mudflat resources and prediction of the evolution trend. It plays an important role in scientific and comprehensive research and management of mudflat resources in Shanghai.
Discussion: However, this study only explored the characteristic patterns of SSC in the Yangtze River Estuary and its adjacent waters based on field observations, but SSC is a more complex water environment parameter that is influenced by a variety of factors. The effects of salinity, temperature and wind speed should be considered in subsequent studies.
Introduction
Estuaries play an important role in coastal systems as a transition zone for sediment transport from land to sea, rich in natural resources, densely populated, and as areas of transportation hubs and commercial and industrial centers (Tejedor et al., 2015; Nienhuis et al., 2016). Suspended Sediment Concentration (SSC) refers to the mass of suspended sediment per unit volume of water, and is one of the most important indicators for evaluating the environment of estuaries (especially high turbidity estuaries) and their adjacent waters. It has an important impact on the ecological environment of estuaries and their adjacent waters. For example, the SSC can directly affect the transmissivity of the water column, and thus the photosynthesis and primary productivity of phytoplankton, which in turn affects fisheries and ecosystem security. Because of their small particle size and large specific surface area, suspended sediments are often effective carriers of nutrients and pollutants (Du Laing et al., 2009; Xie and Wang, 2020), so changes in suspended sand concentration can affect the transport and enrichment of nutrients and pollutants such as heavy metals (Hestir et al., 2013; Hestir et al., 2016). The magnitude of SSC in estuaries is also related to the flushing and siltation of submerged deltas, tidal wetlands and harbor channels (Miserocchi et al., 2007; Shi et al., 2016). Therefore, it is of great theoretical and practical importance to study the variation of SSC in estuaries and their adjacent waters.
In recent years, there have been many research results on the distribution of suspended sand on estuarine shores. Ren et al (Ren and Wu, 2014). conducted fixed-point hydrographic observations of large and small tides in the Pearl River estuary, analyzed the characteristics of water flow and sediment distribution, and discussed the influence of density leap on sediment trapping. Jia et al. (2014) discussed the resuspension characteristics of sediment at the Mill Gate under wave-current interaction through in situ tripod observations. Gong et al. (2014) analyzed the effects of runoff and tidal mixing on sediment transport in the Mill Gate through in situ observations. Li et al. (2016) analyzed the sediment transport characteristics of the deepwater channel in the Yangtze estuary through fixed point observations and pointed out that sediment trapping was responsible for the large amount of siltation in the middle section of the deepwater channel. Becherer et al (Becherer et al., 2016). used CTD, ADCP and in situ sampling to obtain high-resolution in situ suspended sand, current velocity, water temperature and salinity data in the Wadden Sea area and analyzed sediment transport in a fully mixed tidal channel. Bian et al (Bian et al., 2013). analyzed the seasonal variation of suspended sediment distribution and explored its influencing factors by collecting suspended sediment concentrations on the surface of the Yellow Sea and East China Sea in four seasons in 2011. Dong et al. (2011) explored the sediment transport and its mechanism in the Yellow Sea and East China Sea based on the large surface suspended sediment data collected for many years. These studies have carried out good analyses and discussions on water and sand transport and sediment siltation in the Yangtze River Estuary, but fewer studies have been carried out on the characteristics of the vertical distribution of SSC during spring, middle and neap tides and at flood and ebb tides.
As the largest estuary in China, the Yangtze estuary is characterized by ‘high turbidity’ and ‘fine particles’, and is a branching estuary with extremely sensitive land-sea interactions, which brings together material inputs from the 1.8 million km2 catchment area and is influenced by the dynamical system of the East China Sea. It is also influenced by the dynamical system of the East China Sea, and has evolved over a long period of time as a result of a combination of factors to form the current pattern of “three levels of branching and four mouths into the sea”. The Yangtze River’s abundant water volume and huge sediment discharge have a significant impact on the hydrological environment, sediment deposition and ecological environment of the Yangtze River Estuary and its adjacent sea areas (Wang, 2014), while the Yangtze River Estuary and its adjacent sea areas are rich in freshwater, sediment, mudflat wetlands and biological resources, and have good navigation channels and shorelines, which have long provided important natural resources for the sustainable socio-economic development of Shanghai.
In this paper, we take the Yangtze River Estuary, the northern part of Hangzhou Bay and the Yangshan Port as the study areas, and use the fixed-point observation data and large-scale observation data obtained from the Shanghai Marine Monitoring and Forecasting Center as the data sources to analyze the distribution characteristics of the SSC in the Yangtze River Estuary and its adjacent waters under different tidal conditions. The analysis focuses on the vertical distribution characteristics, including the correlation among the SSCs and the vertical distribution pattern. The influence of tidal velocity on the SSC is discussed, and the applicability of Rouse’s formula and Soulsby’s formula to the Yangtze River Estuary and its adjacent waters is verified.
Materials and methods
Study area
The Yangtze River Estuary is one of the three major estuaries in China. From below Xu LiuJing, it diverges to the north and south sides of ChongMing Island, which are the South Branch and the North Branch respectively. The hydrodynamic conditions are complex and variable, the geomorphology is evolving rapidly, and the deposition process is complex. Hangzhou Bay is located in the Yangtze River Delta region, adjacent to the Yangtze River Estuary, and has a trumpet shape and flat bottom topography, with an average water depth of 8-10 m. It is one of the estuaries with the highest concentration of suspended sand in the world, and the measured concentration of suspended sand at the top of the bay was as high as 10.6 kg/m3 (Xie et al., 2009). The sea area of YangShan Port is located in the sea area of the rugged island group, which is a trumpet-shaped water area composed of two island chains, one in the north and one in the south, mainly composed of the Large and Small YangShan, with the Small YangShan, Huo Gai Tang, large rock reef, small rock reef, Pearl Hill and large turtle islands in the north island chain, and the Large YangShan, large Shan Tang and Shuang Lian Shan islands in the South Island chain. The sea is influenced by the sediment from the Yangtze River Estuary, which has a high sand content all year round, and the strong currents in the island group make the sediment movement more active (Dong, 2011).
Data sources
In this study, data collection is divided into fixed vertical lines data collection and large surface observation data collection. Five fixed vertical lines were deployed in the Yangtze River Estuary, including C1 to C4 near the mouth gates of the North Branch, the North Port, the North Channel and the South Channel of the Yangtze River Estuary, and C5 near the mouth of Nanhui in Shanghai. Three fixed vertical lines, H1 to H3, were deployed in the northern part of Hangzhou Bay. One vertical line was deployed in the harbor area of YangShan Port, and two vertical lines were deployed on the east and west sides of the island, Y1 to Y3 respectively. The large surface observation in the Yangtze River Estuary covers the Shanghai waters outside the Yangtze River Estuary, with 6 large surface observation sections, totaling 36 sampling points, numbered CD1~CD36, in the northern part of Hangzhou Bay, 4 large surface observation sections are deployed to monitor the changes of suspended sand concentration in the north coast waters, totaling 16 sampling points, numbered HD1~HD16, as shown in Figure 1.
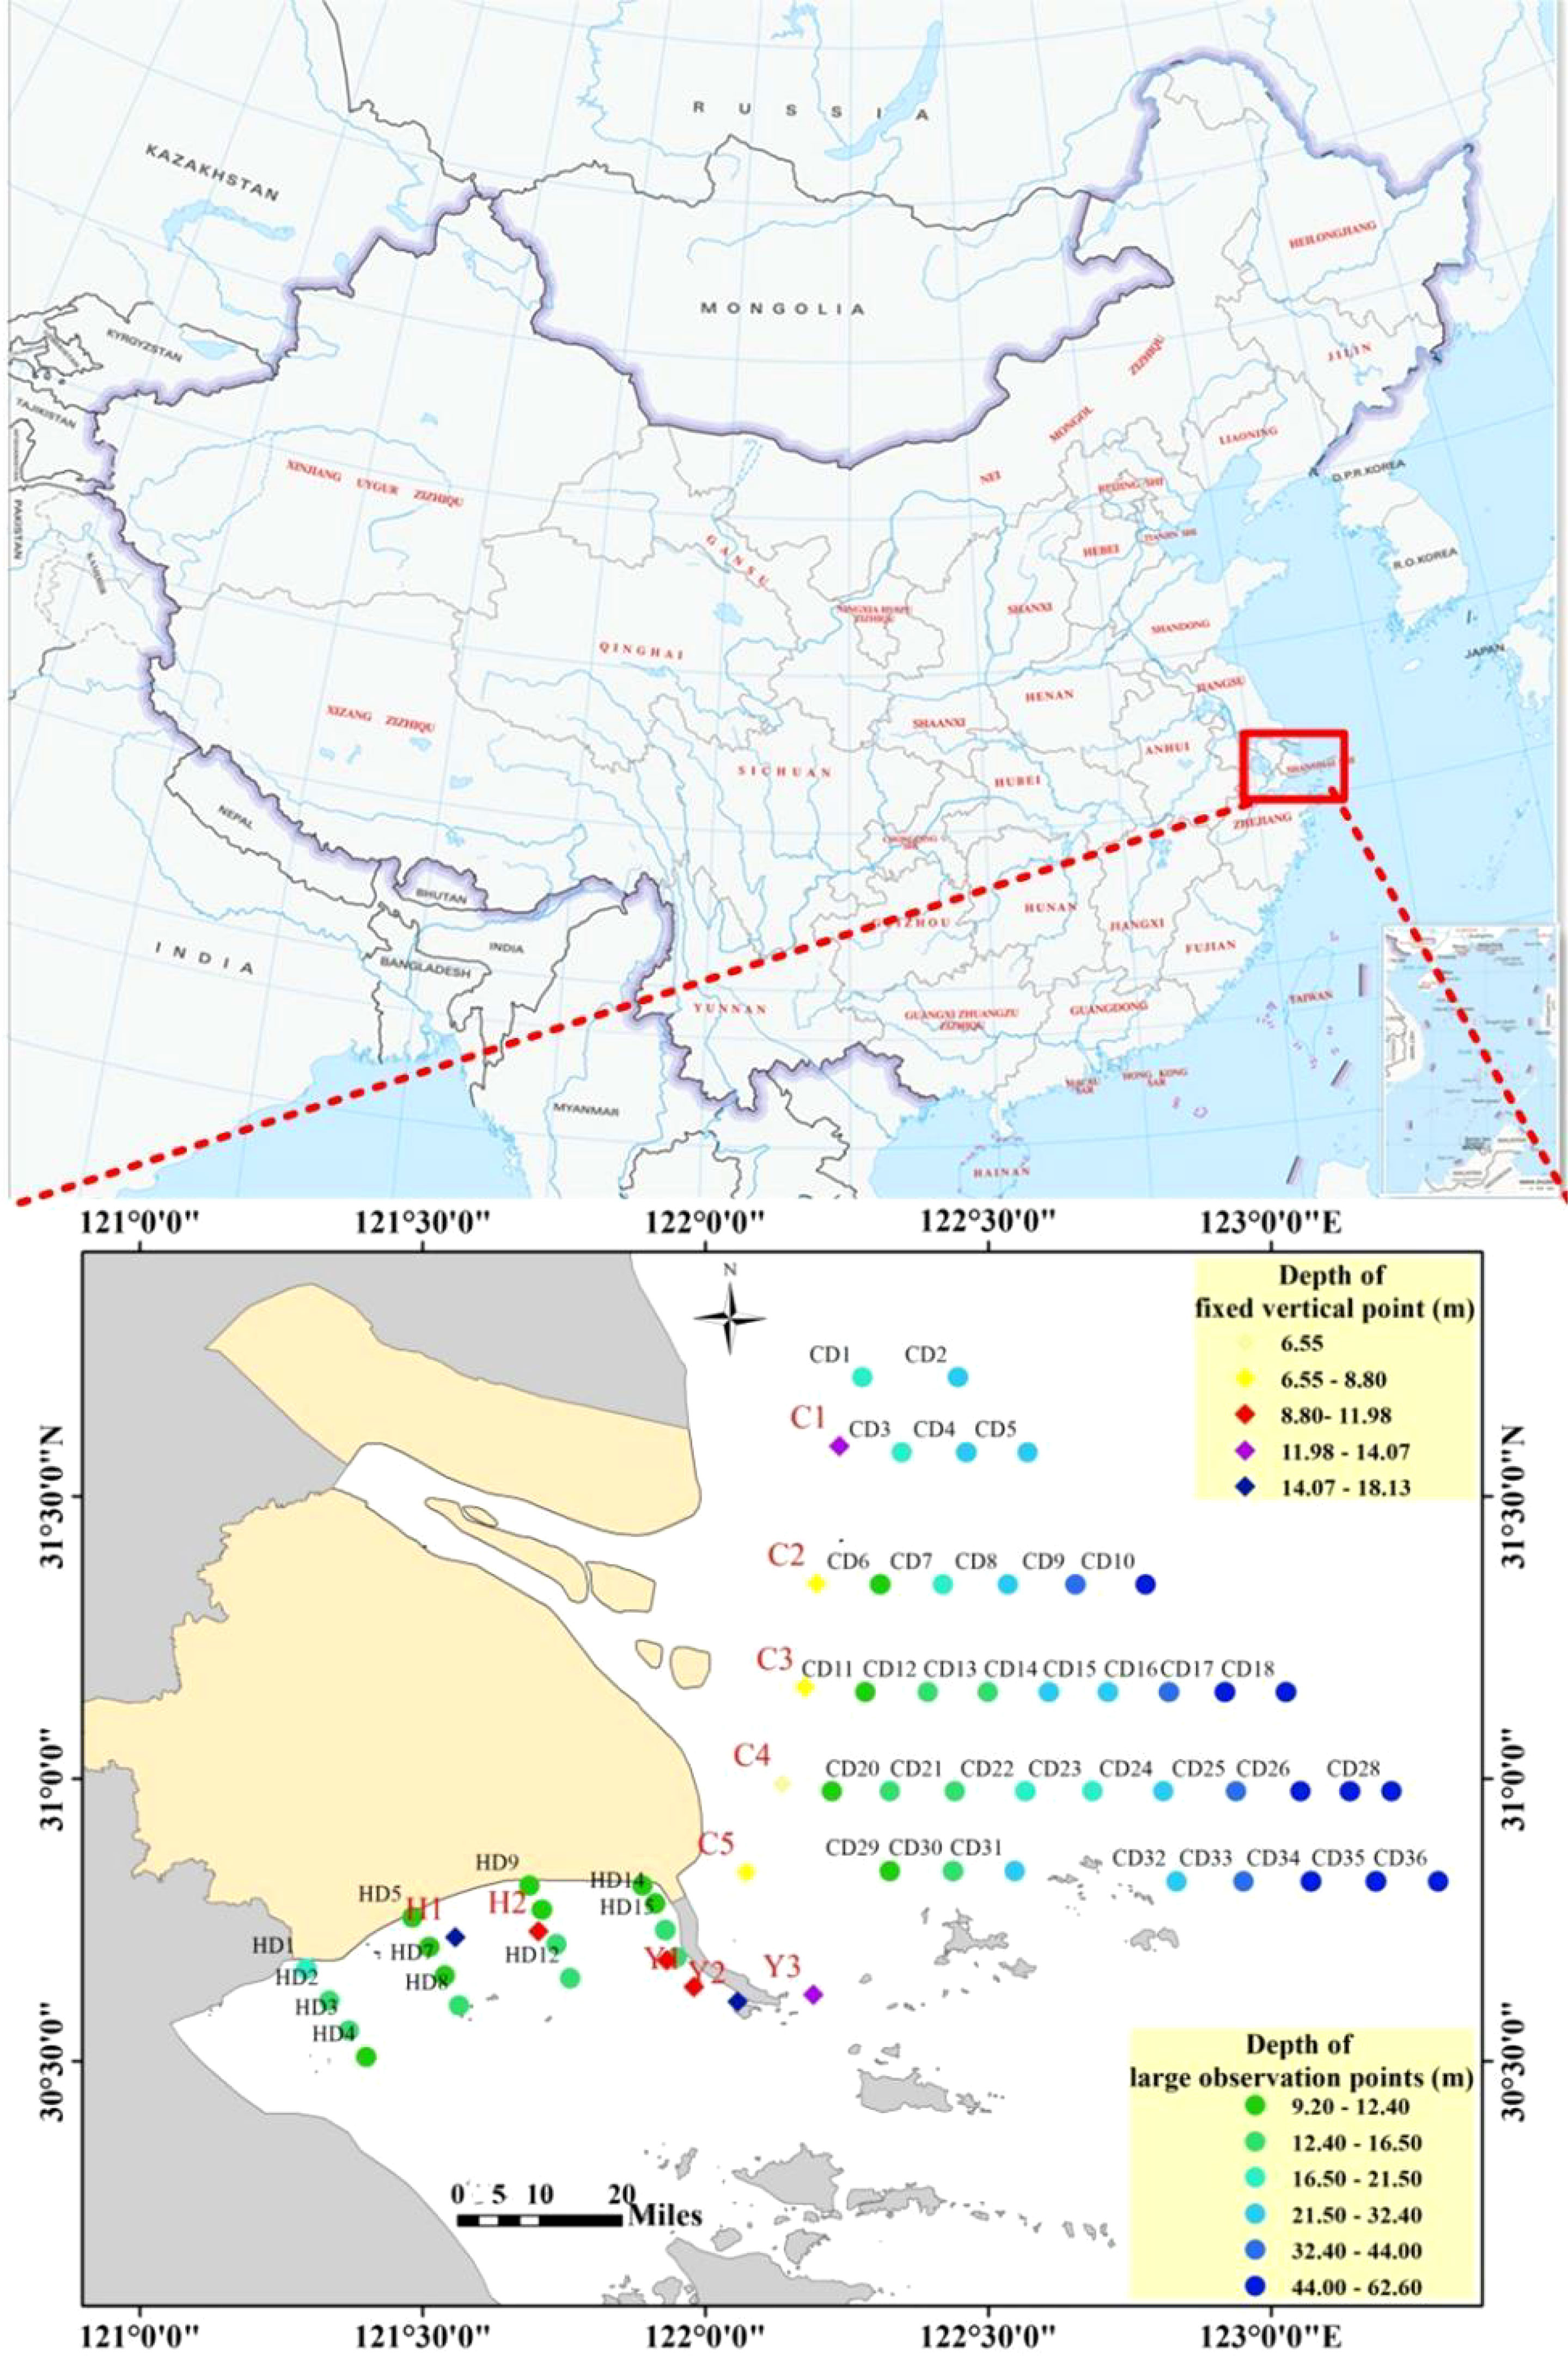
Figure 1 Study area and location of sampling sites.
Continuous monitoring was carried out at 11 fixed vertical lines in the Yangtze River Estuary, the north coast of Hangzhou Bay and Yangshan Port, respectively, to collect information on the stratified flow velocity and suspended sand concentration at spring, middle and neap tides. Sampling dates for spring tides are 15-16 June 2018; 29 May-30 May 2019; and 7-8 June 2020. Sampling dates for middle tides are 11-12 June 2018; 1-2 June 2019; and 3-4 June 2020. Sampling dates for neap tides are 7-8 June 2018; 4-5 June 2019; 30-31 May 2020. The velocity and direction data were obtained based on the ADCP, and were observed every 15 minutes for 3 minutes during the observation process; the SSC data were obtained based on the OBS, and were observed once every hour during the whole observation period. Water depths of up to 10 meters are sampled by the 3-point method, and water depths of 10 meters or more are sampled by the 6-point method. At the same time, 1000ml horizontal samplers were used to collect water samples to rate the OBS sampling results. The sampling frequency was as follows: the water samples were collected at the four periods of flood peak, flood slack, ebb peak and ebb slack in the first half of each fixed vertical line (4 times in total), and the water depth was within 10m according to the 3-point method, and above 10m according to the 6-point method. The water samples were taken at a relative water depth of 0.8H every hour during the rest of the period. The water samples were taken back to the laboratory to obtain suspended sand concentrations based on the weighing method. The acquisition of data from large surface observations is simpler than that of fixed plumb line data, using ADCP to obtain stratified flow velocity and direction, and only one observation at each point; using OBS to SSC data, and only one observation at each point during the whole observation period, while collecting water samples to rate the OBS sampling results. The sampling frequency is slightly different from that of fixed plumb line, specifically: CD1-CD4, CD6- CD8, CD11-CD13, CD19-CD21, CD29-CD31 and other 16 points, the water depth within 10 m was sampled by the 3-point method and above 10 m by the 6-point method; for the remaining 20 points, only water samples at 0.8H were collected. The water samples collected were also analyzed in the laboratory by the weighing method.
Since the OBS collects turbidity value, it is necessary to collect calibration water samples to analyze SSC in order to deduce the SSC of the measurement point, and then calculate SSC of the measurement point through the OBS turbidity value according to the OBS rate calibration formula (OBS turbidity value ~ SSC relationship curve). The field rate calibration is carried out according to the requirements of the “OBS-3A Calibration and Calibration Technical Guide”. Table 1 shows the R2 of OBS turbidity values and SSC fitting curves at some points, indicating a high correlation between the two, with R2 greater than 0.8.
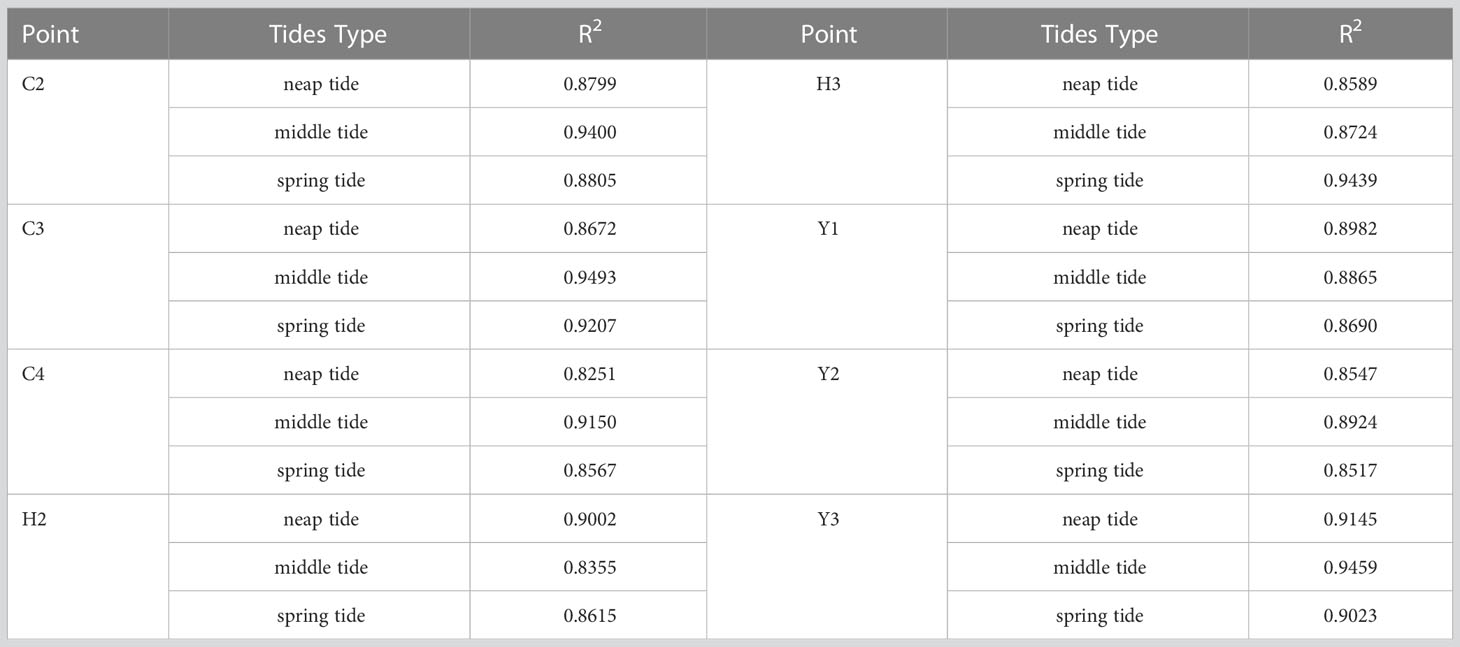
Table 1 R2 of OBS turbidity values and SSC fitting curves at some points.
The vertical average SSC is calculated by the following equation:
Six-point method:
Three-point method:
When it is located near the diverted flow, the flow velocity is low and the flow direction is turbulent. It may be unreasonable to calculate the average sand content of the vertical line by weighting the flow velocity, so it is calculated by weighting the sand content of the measurement point, i.e.
In the above equation: is mean sand content of the vertical line (kg/m3); is weighting coefficient (1, 2, 2, 2, 2, 2, 1 for the six-point method and 1, 1, 1 for the three-point method); is sand content of the measurement point (kg/m3); is average flow velocity at the measurement point (m/s) and is average flow velocity of vertical line (m/s).
Results
Analysis of the distribution characteristics of the SSC under different tidal states
The SSCs in the three regions of the Yangtze River Estuary, Hangzhou Bay and Yangshan Port from 2018 to 2020 were counted, and the characteristics of SSCs under different tidal types of neap, middle and spring tides were analyzed using three indicators: surface SSC (C(0H)), near-bottom SSC (C(1H)) and vertical average SSC (CSP), as shown in Tables 2–4, where C(0H), C(1H) and CSP are the average values of multiple single SSC vertical profiles, and N is the number of single vertical profiles. It can be seen that for the same region, the size ranking of C(0H), C(1H) and CSP for different tide types is all: neap tide< middle tide< spring tide. And from the three large regions, the highest SSC is in Hangzhou Bay, followed by Yangshan Port, and the lowest in Yangtze River Estuary, and with CSP in 2019, for example, Hangzhou Bay is 1.28 times higher than Yangshan Port and 2.10 times higher than Yangtze River Estuary. To investigate the effect of different tidal states such as high and low tides on the SSC, the magnitude characteristics of the SSC at high and low tides in the three regions were also analyzed using three indicators, C(0H), C(1H) and CSP as shown in Tables 2, 3, 5. The results show that the regularity of differences between the SSC at flood and ebb tides is not obvious in the three regions. Taking 2018 data as an example, in the Yangtze River Estuary area, the SSC during flood tide is slightly higher than that during ebb tide. In the waters of Yangshan Port, the SSC at flood tide is slightly lower than that at ebb tide. Similarly, analyzing the data from 2019 and 2020, it was found that there is no significant regularity in the differences in SSC between flood tides and ebb tides. That is to say, when analyzing the impact of flood tides and ebb tides on SSC, we also need to comprehensively analyze hydrodynamic parameters such as flow velocity.
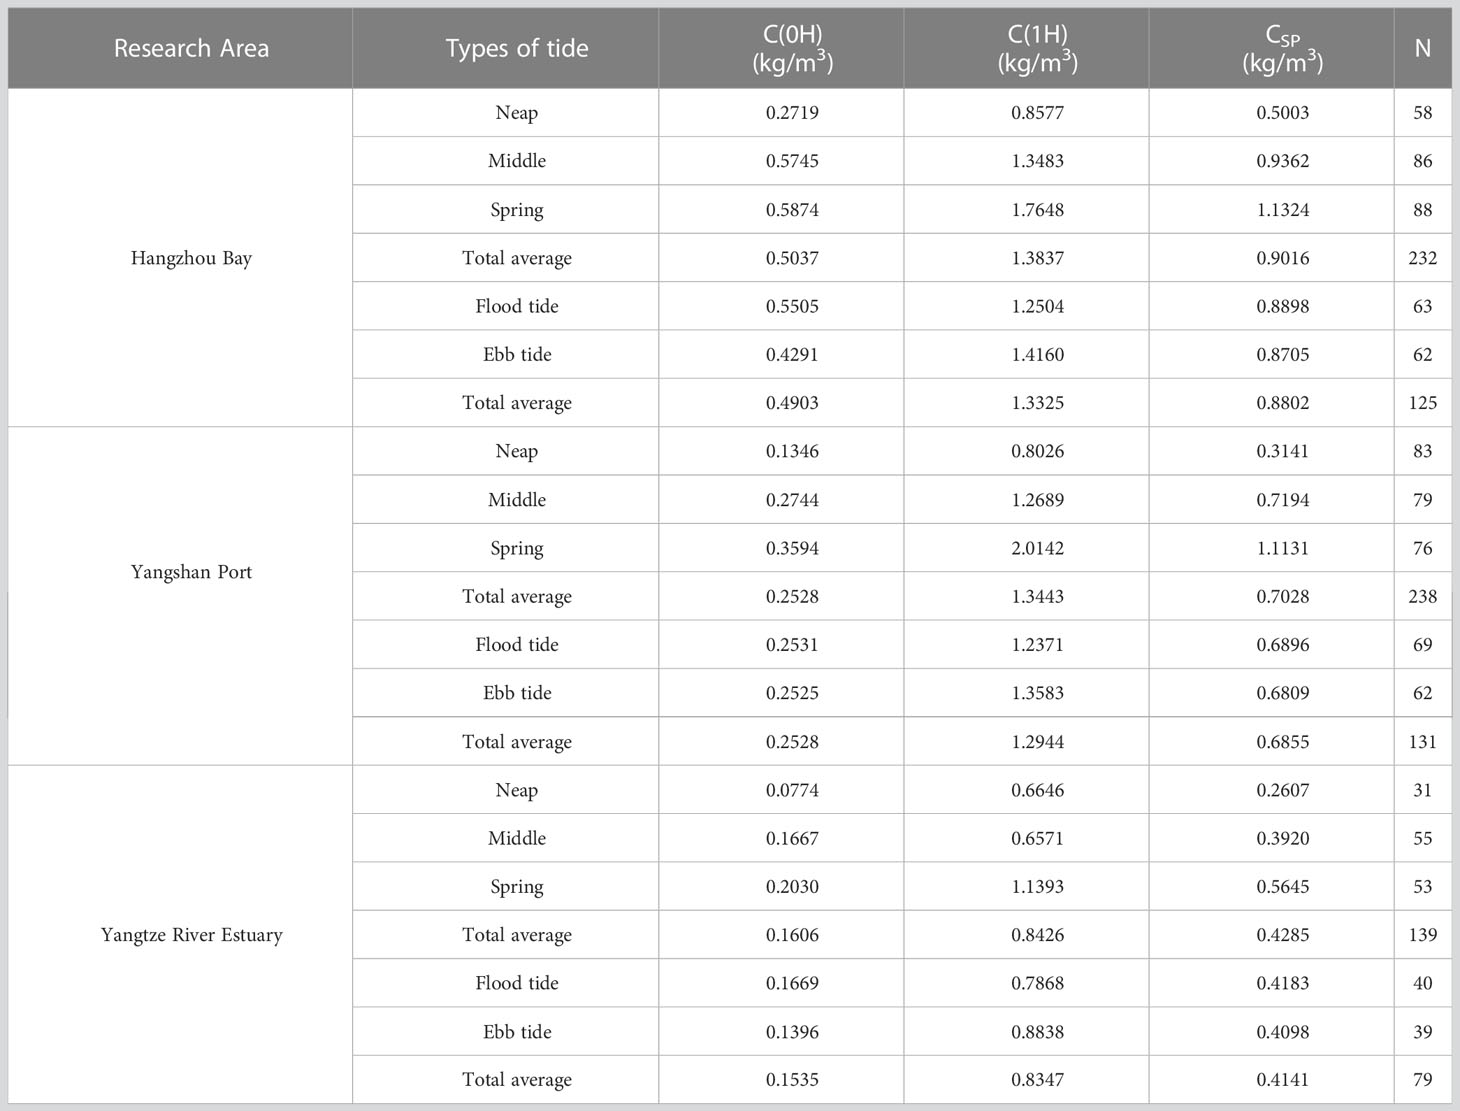
Table 2 Characteristics of SSC during different tide types in 2019.
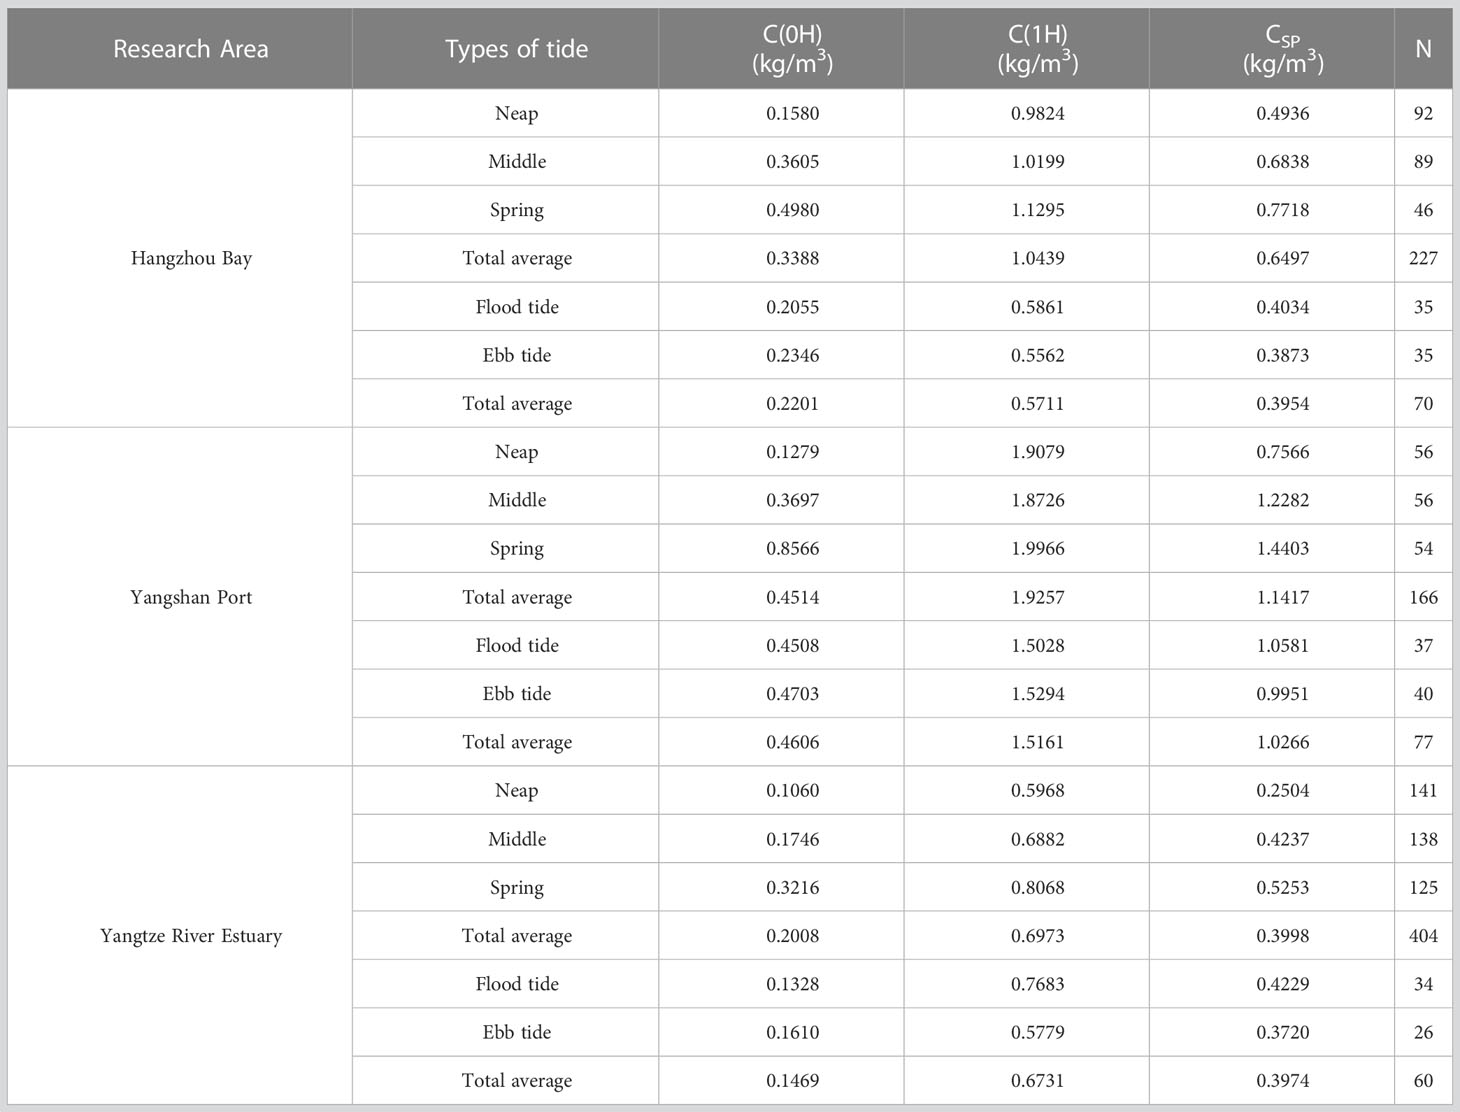
Table 3 Characteristics of SSC during different tide types in 2020.
Table 4 Matrix of correlation coefficients for SSC by layer.

Table 5 Characteristics of SSC during different tide types in 2018.
Correlation analysis of SSC in each vertical layer
Taking the 2019 data as an example, the correlation coefficients between the SSC in each layer of the three regions and the vertical average SSC were calculated separately to form the correlation coefficient matrix shown in Table 4. It can be seen that the SSC in two adjacent layers show a high correlation. Taking the Yangtze estuary as an example, the correlation coefficient between C(0H) and C(0.2H) is 0.8598, the correlation coefficient between C(0.2H) and C(The correlation coefficients between C(0H) and C(0.2H) were 0.8598, C(0.2H) and C(0.4H) were 0.8861, C(0.4H) and C(0.6H) were 0.8799, and C(0.6H) and C(0.8H) were 0.8819. There is also a high correlation between the SSC in each layer and the vertical average SSC. In Hangzhou Bay, for example, the correlation coefficients between the SSC in each layer and the vertical average SSC are above 0.7. The correlation coefficient between the SSC and the SSC in each layer from the surface to near-bottom decreases gradually, but the correlation with the vertical average SSC is larger, which is consistent with the findings of existing studies (Wang, 2008). Whether sampled by the six-point method or the three-point method, the correlation between the SSC of each layer in the vertical direction shows a similar regularity, i.e. the SSC of two adjacent layers has a high correlation, and there is a high correlation between the SSC of each layer and the vertical average SSC, but the correlation coefficient between the surface layer and the SSC of each layer from the surface layer to the near-bottom layer gradually decreases.
Analysis of the spatial and temporal variation of SSC during 2018-2020
We analyzed the spatial and temporal distribution of SSC in the Yangtze River Estuary and its adjacent waters based on fixed vertical observation data and large-scale observation data from 2018 to 2020, as shown in Figure 2. In terms of spatial dimension, as shown in Figures 2A–C, the distribution of SSCs in the Yangtze River Estuary and the north of Hangzhou Bay is slightly different. For the Yangtze River Estuary, SSC shows a decreasing trend as the offshore distance increases. However, in the north of Hangzhou Bay, the SSC of each sampling point has little difference. The reason for the analysis may be that outside the Yangtze River estuary, the water depth also shows an increasing trend with the increase of offshore distance, and the water area is vast and less affected by land. In the north of Hangzhou Bay, the overall offshore distance is small, and it is still distributed in the interior of Hangzhou Bay.
Figure 2 Planar distribution characteristics of SSC in the Yangtze River Estuary and northern Hangzhou Bay waters and Spatial distribution of SSC in 2018-2020. (A) Planar distribution in 2018, (B) Planar distribution in 2019, (C) Planar distribution in 2020, (D) Spatial distribution of SSC in 2018-2020.
In terms of time dimension, Figure 2D shows the spatial distribution of SSCs at 11 fixed vertical line positions from 2018 to 2020. In the northern part of Hangzhou Bay, the H1 vertical line near the Jinshanzui hydrographic gauging station has lower suspended sand concentrations than the H2 and H3 vertical lines to the north of the station, and the H1 suspended sand concentrations do not change much between 2018 and 2020, while the vertical lines H2 and H3 have higher concentrations in 2019 compared to 2018 and 2020; the suspended sand concentrations at the three locations in Yangshan Port do not differ much. The vertical lines Y1 and Y2 have lower concentrations in 2019 compared to 2018 and 2020, and the vertical line Y3 has lower concentrations in 2020 compared to 2018 and 2020. The data for Y3 in 2020 are vacant due to equipment and other reasons.
Discussion
Instantaneous and mean vertical profile characteristics of SSC
The vertical profiles of SSC at the 11 sampling sites in the three regions are diverse. Based on morphological characteristics and existing studies, the instantaneous SSC profiles in the study area can be classified into six basic types (Figure 3), namely L-shaped profile, Stepwise profile, Vertical profile, Slanting concave-up profile, Slanting concave-down profile and Quasi-slanting line profile (Dong et al., 2011). Taking the three vertical lines C5, H3 and Y1 as examples, Figures 1–3 in the Appendix show the vertical distribution curves of the three vertical lines during the four tidal states of flood peak, flood slack, ebb peak and ebb slack during neap, middle and spring tides. Among all the profiles, only about 40% of the basic types can be identified, and nearly 60% of the profiles cannot be classified into the basic types, making it difficult to describe the trend. It is probably a transitional pattern from one basic type to another.
Figure 3 The six basic types of transient profile patterns. (A) L-shaped profile; (B) Stepwise profile; (C) Vertical profile; (D) Slanting concave-up profile; (E) Slanting concave-down profile; (F) Quasi-slanting line profile.
The average SSC profile was obtained by averaging multiple single instantaneous SSC profiles and fitting a curve regression. The R2 for most of the sites was above 0.99, and the fit functions were mostly linear and logarithmic in form. When the mean profiles of all single profiles at all points in the three regions were analyzed, the fit functions were in logarithmic form for the Yangtze River Estuary and linear form for Hangzhou Bay and Yangshan Port (Figure 4), and the R2 was greater than 0.99 for all three regions.
Figure 4 Average SSC profiles and their standard deviations and regression trend fits. (A) Yangtze estuary; (B) the northern Hangzhou Bay. (C) Yangshan Port. In (A), from left to right, the mean profiles of fixed vertical lines C1-C5 and the total mean profile. In (B), from left to right, the mean profiles of fixed vertical lines H1-H3 and the total mean profile. In (C), from left to right, the mean profiles of fixed vertical lines Y1-Y3 and the total mean profile.
The effect of tidal flow velocity on the SSC
In order to investigate the relationship between flow velocity and SSC, a comparison of SSC and flow velocity is plotted as shown in Figure 5, which shows that the distribution of SSC in each trough of the Yangtze estuary and the northern part of Hangzhou Bay is highly consistent with the distribution of flow velocity. During the neap, middle and spring tides, the SSC and velocity show a similar planar distribution. The SSC increases linearly from C1 at the mouth of the Northern Branch to C3 in the Northern Trough, with a lower concentration in the Southern Trough at C4, and then increases again at C5 near the mouth of the Nanhui, with the corresponding flow velocities showing similar distribution characteristics. In the northern part of Hangzhou Bay near Jinshanzui hydrographic station, the H1 vertical line has a lower SSC, while the H2 and H3 vertical lines to the north of the H1 vertical line have a higher SSC. Similarly, the flow velocities are lower on the H1 vertical line and higher on the H2 and H3 vertical lines. Although the locations of the verticals are different, the magnitude of SSC and flow velocity during the small, medium and large tides basically follow the pattern of spring tide > middle tide > neap tide.
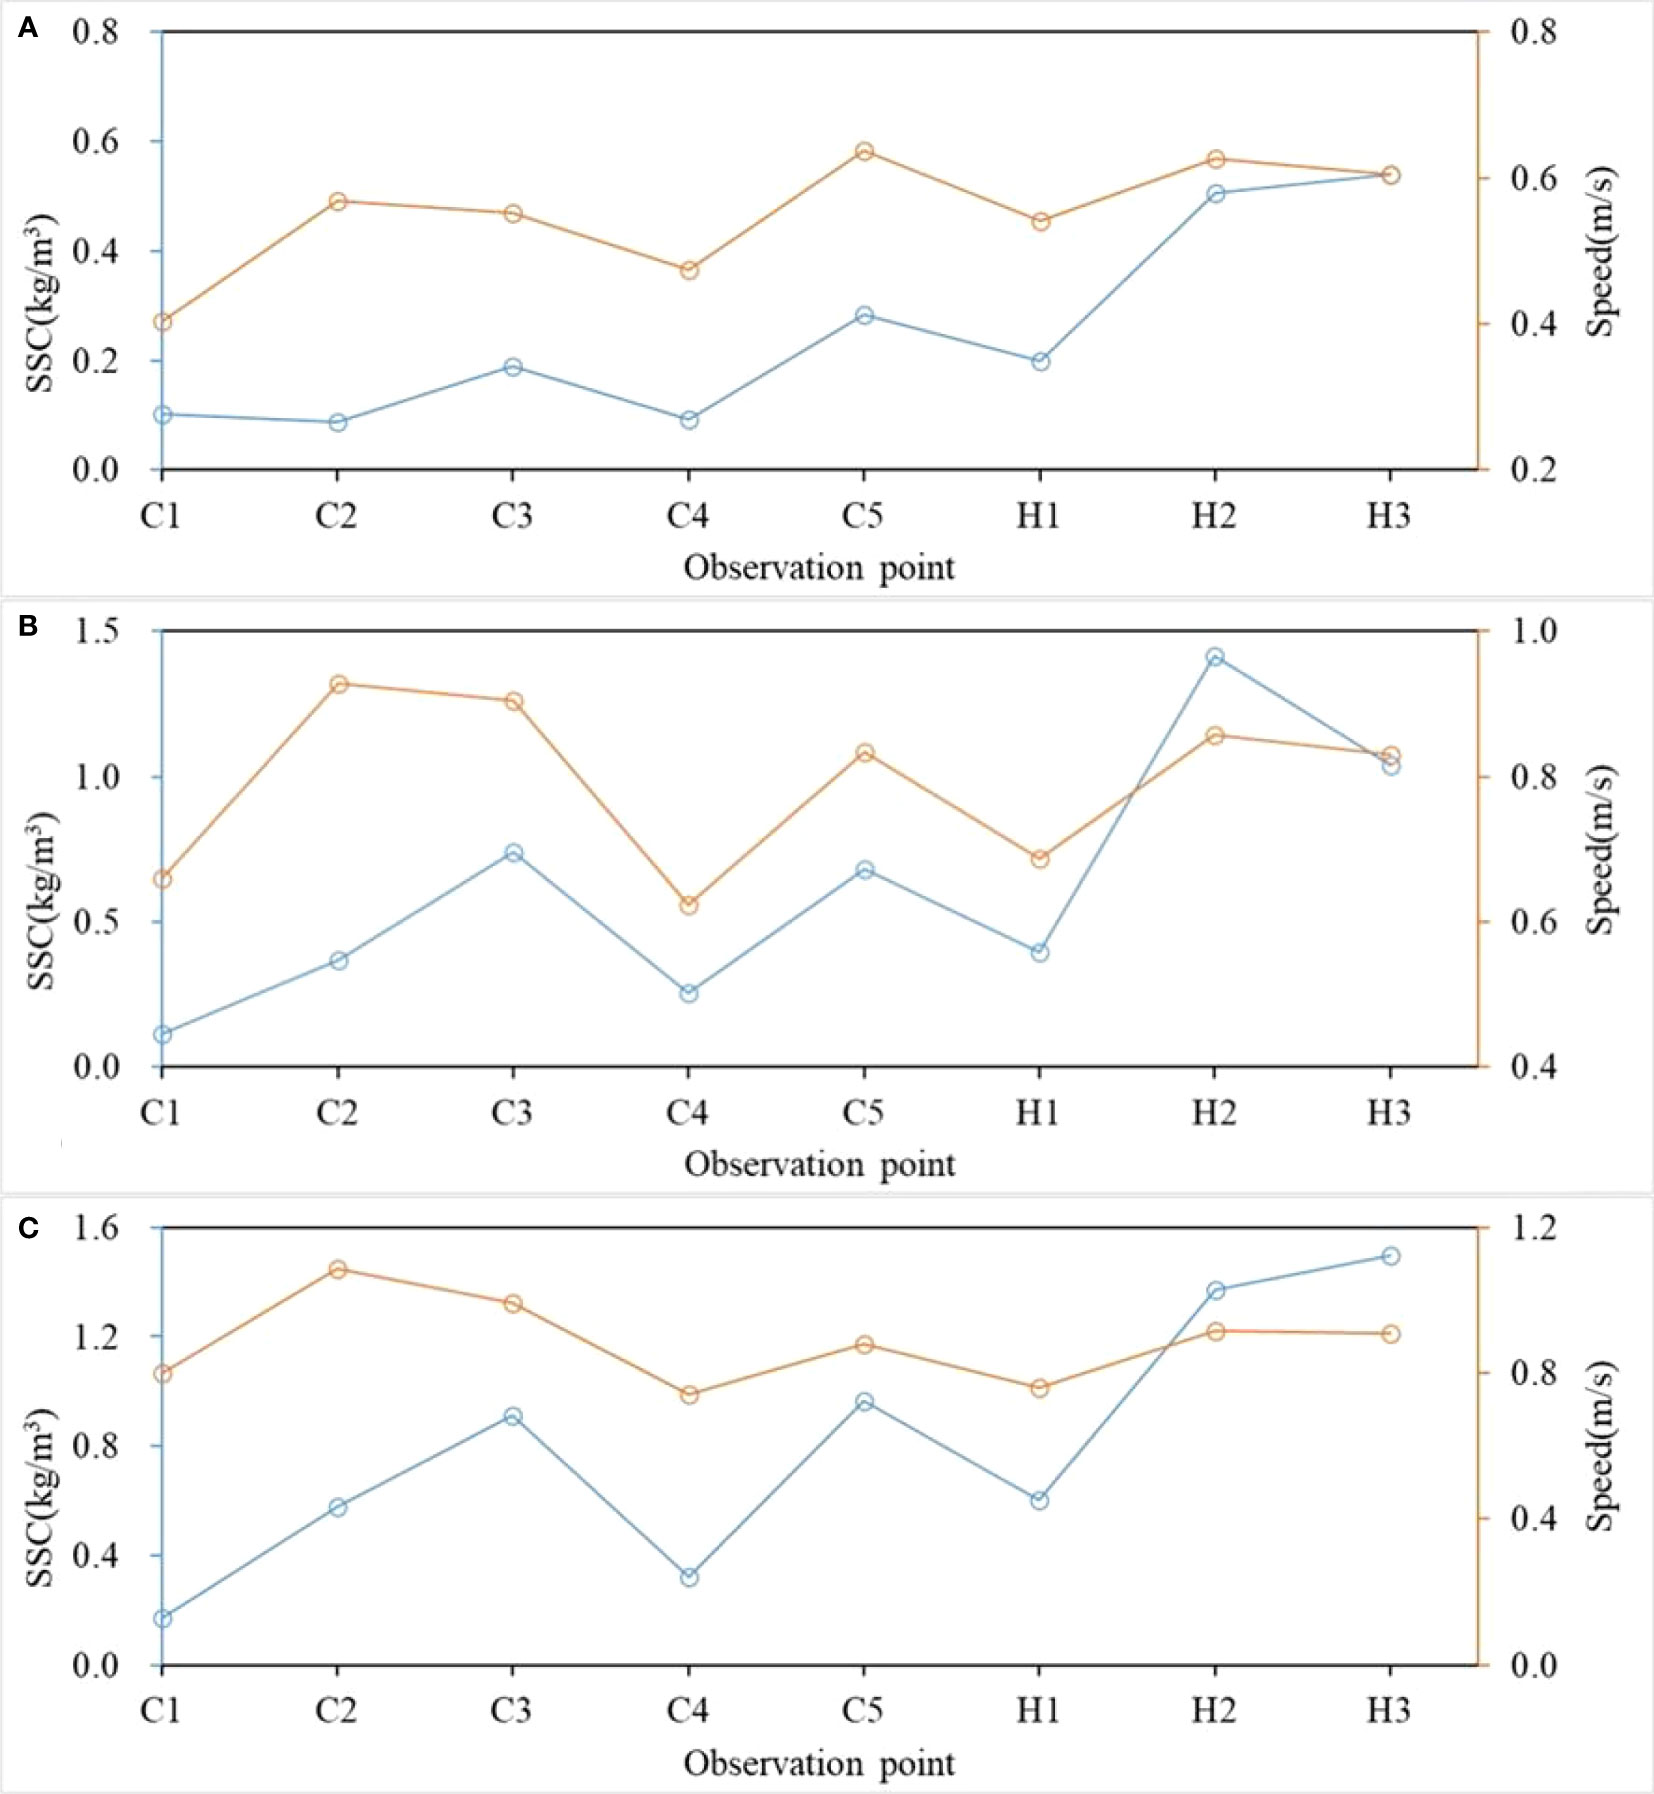
Figure 5 Plot of average vertical flow velocity versus mean vertical SSC at each fixed point. (A) neap tide; (B) middle tide; (C) spring tide.
There is usually a close relationship between the variation of SSC and current velocity during a tidal cycle in estuaries and estuarine bays. Figure 6 shows the variation curves of SSC and current velocity during a complete tidal cycle in three periods: C5 neap tide, H2 neap tide and H2 spring tide, where the red line indicates the variation of current velocity and the yellow line indicates the variation of SSC. It can be found that the changes in flow velocity and SSC are basically synchronous and show a positive correlation during a complete tidal cycle, i.e. when the flow velocity increases, the SSC increases and when the flow velocity decreases, the SSC also decreases.
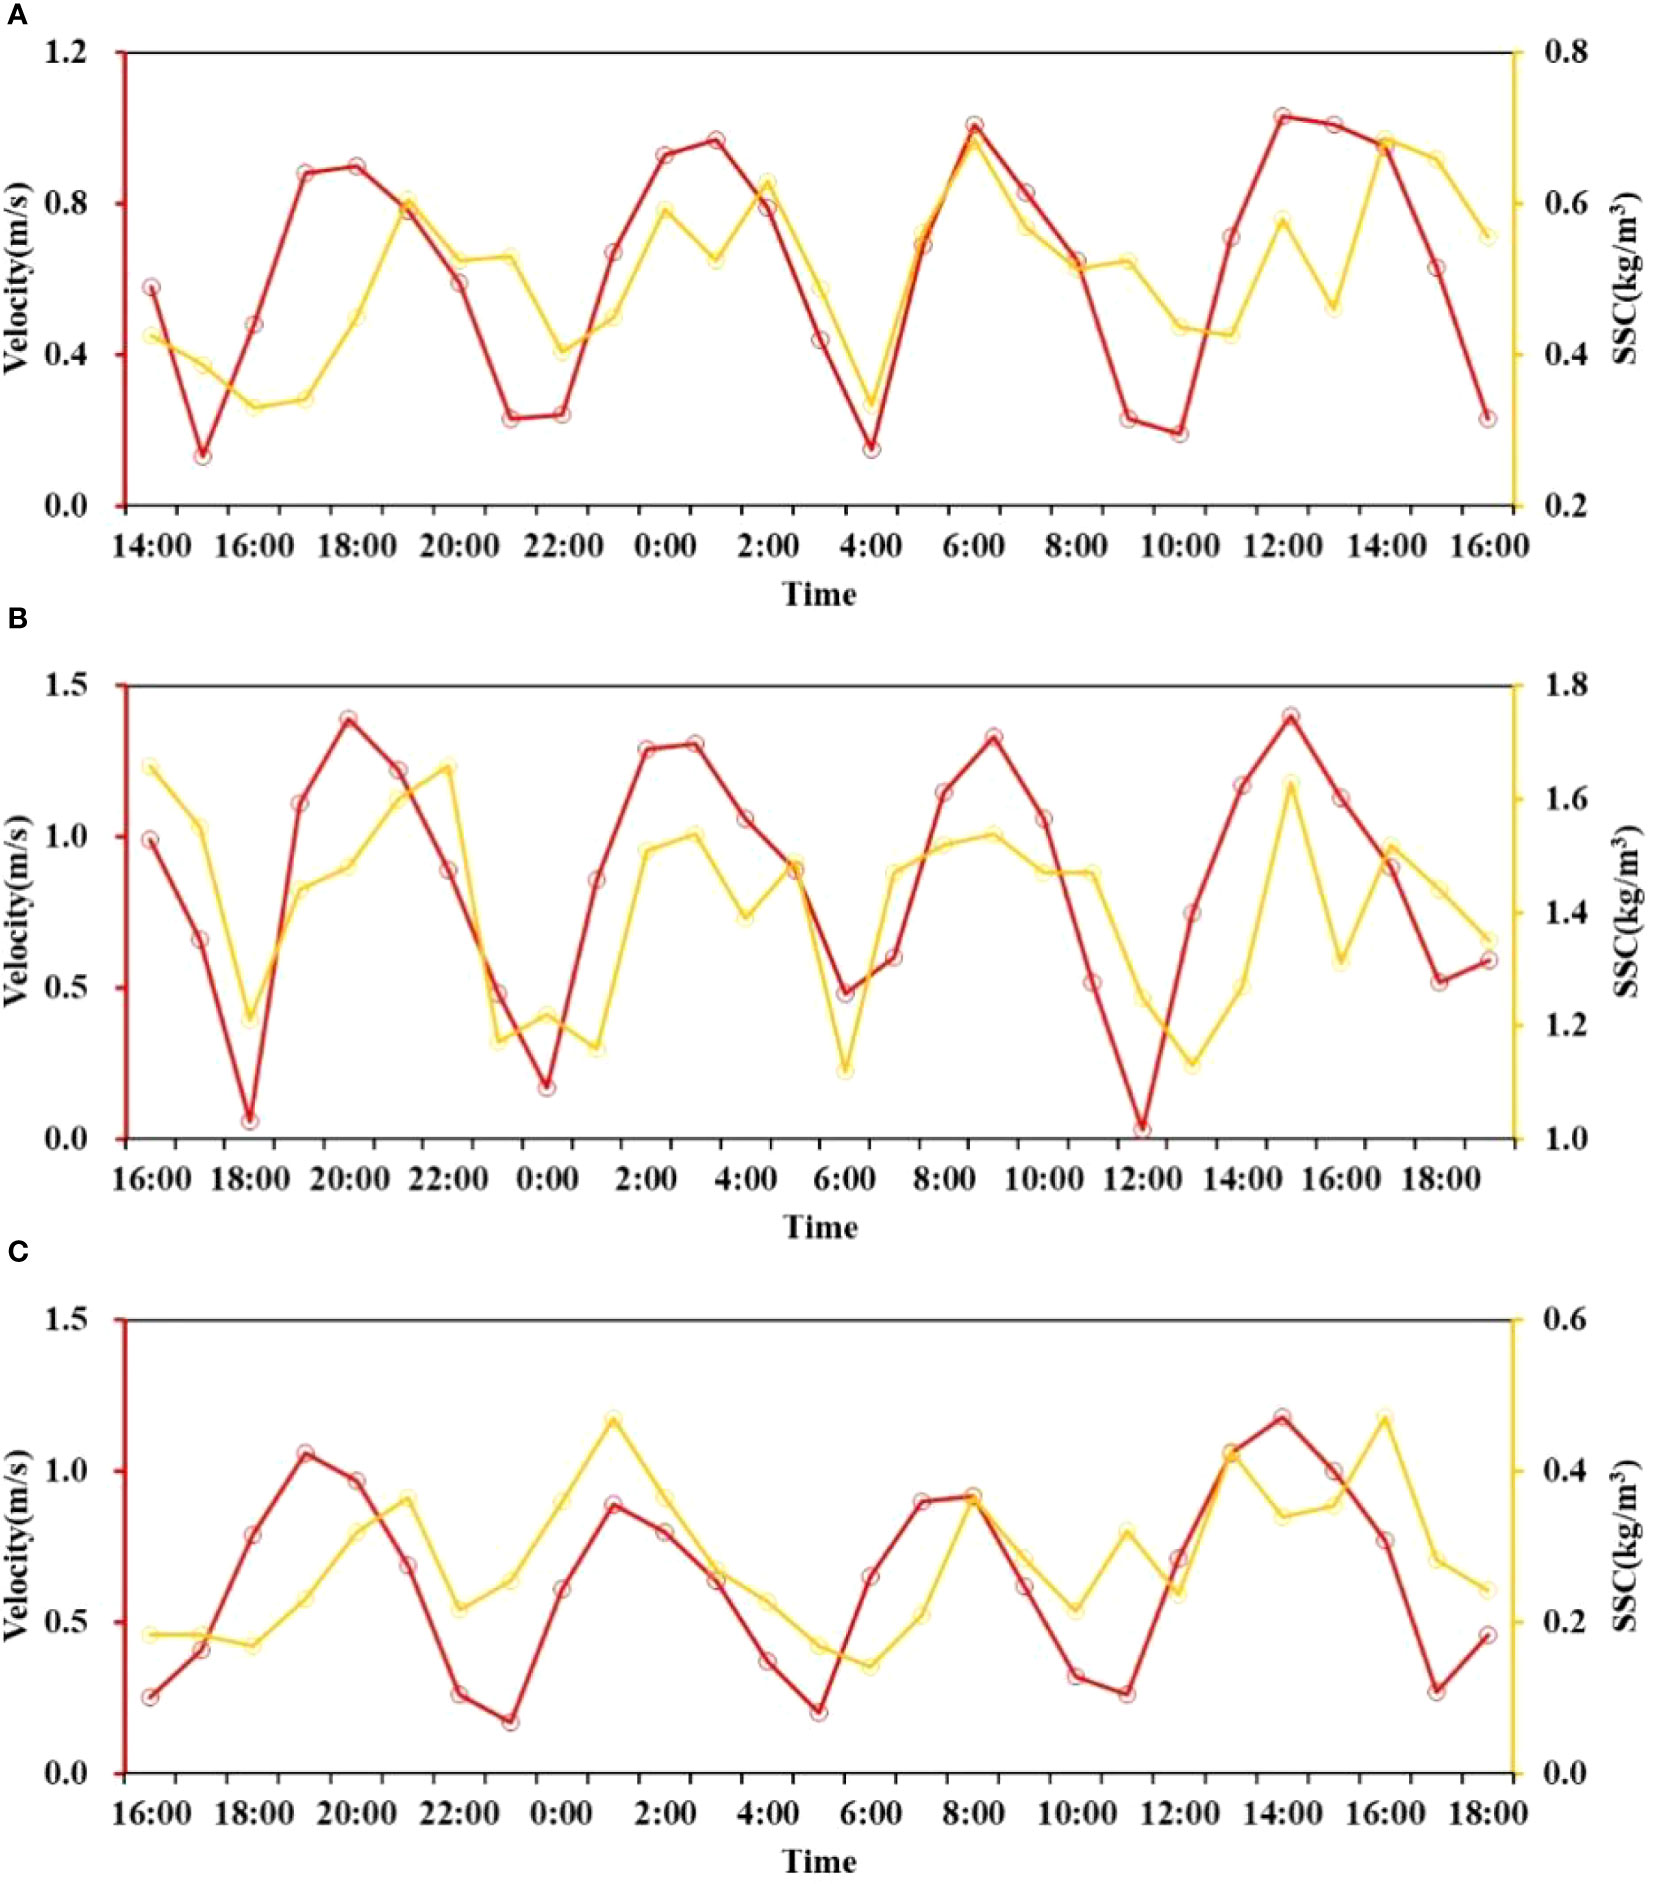
Figure 6 Variation curve of SSC versus flow velocity during the complete tidal cycle. (A) H2 neap tide; (B) H2 middle tide; (C) C5 neap tide.
In order to further investigate the relationship between SSC and current velocity, the SSC and current velocity at each layer in the vertical direction during a complete tidal cycle are shown in Figure 7, using the C5 tide as an example. The type of tide in the Yangtze estuary is an informal semi-diurnal tide, and this characteristic can be clearly seen in the curves of flow velocity, with two low tides and two high tides occurring in a full tidal cycle, and varying at high tide and low tide. Correspondingly, SSCs also show two peaks and two troughs within a completed tidal cycle, and they occur at roughly the same time as the peak and trough of the flow, but the peaks and troughs are less pronounced as the SSC is influenced by other hydrodynamic factors at the same time. In the vertical direction, the SSC increases from the surface layer to the bottom layer, while the flow velocity decreases in the opposite direction from the surface layer to the bottom layer. The reason for this is that when the bottom flow velocity increases, the sediment at the bottom is re-suspended due to scouring, which increases the SSC in the surface and middle layers.
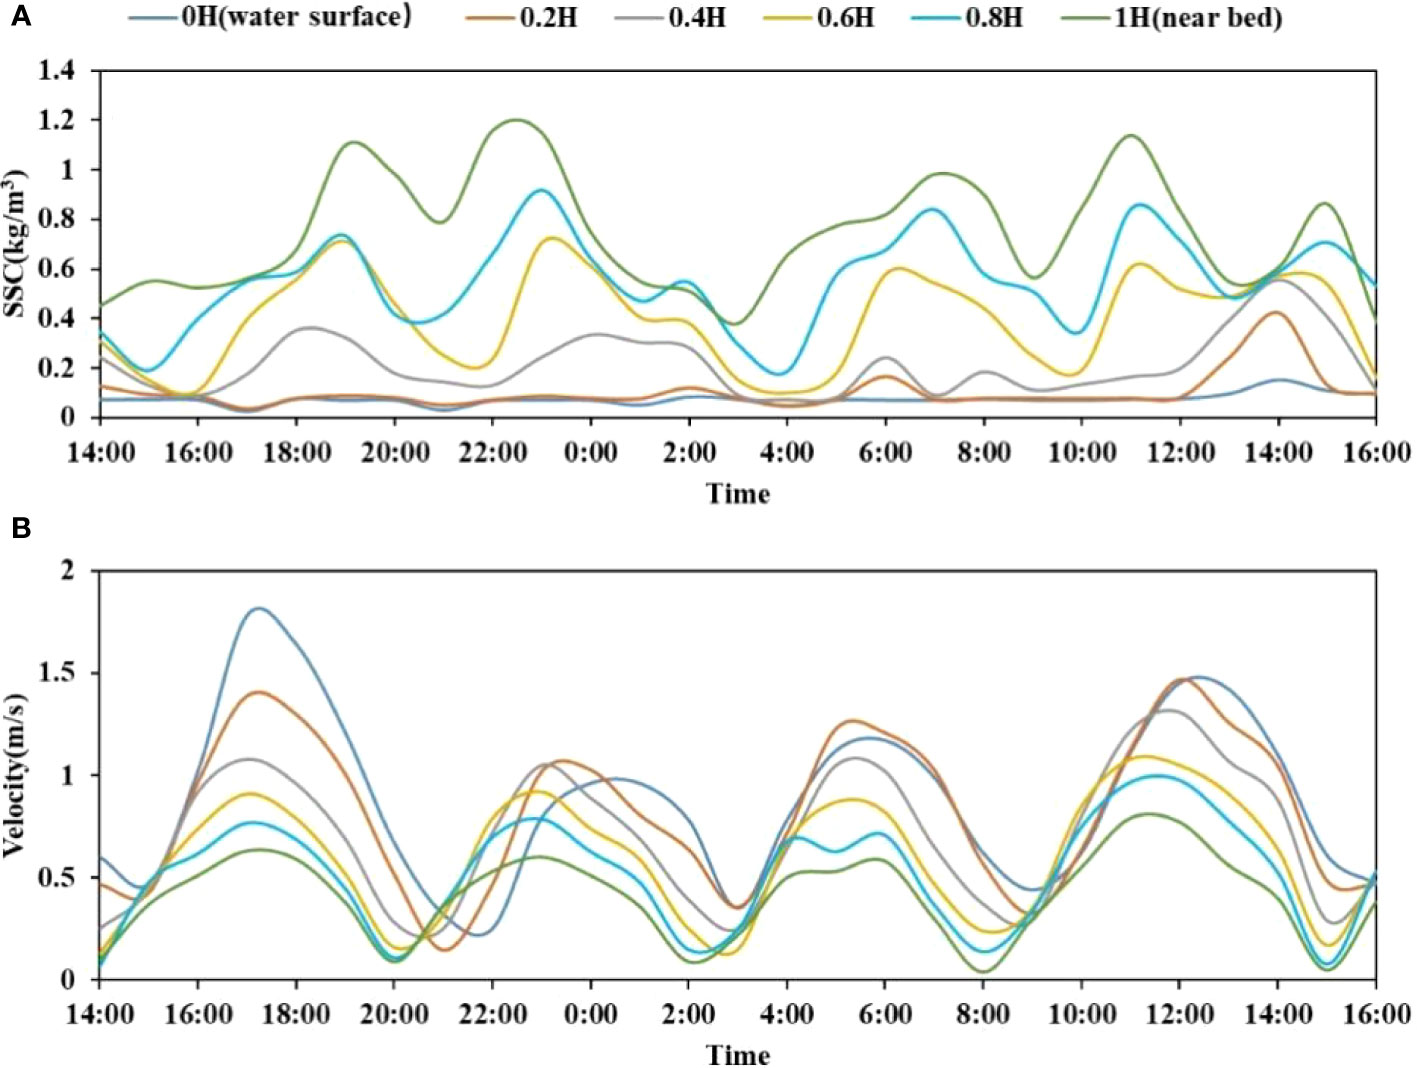
Figure 7 The variation curves of SSC versus flow velocity for each layer in the vertical direction during the C5 neap tide. (A) SSC variation curves; (B) flow velocity variation curves.
Empirical predictions of the vertical distribution of SSC in the Yangtze estuary and adjacent waters
Analysis of the applicability of the Rouse formula in the Yangtze estuary and its adjacent waters
The quantitative analysis and expression of the vertical distribution of SSC is an important scientific problem facing the sediment dynamics of estuarine shores, which has received much attention from scholars both at home and abroad. In the case of two-dimensional constant homogeneous flow, the vertical distribution of SSC can be expressed quantitatively by the Rouse formula when the downward settling flux of suspended sand is equal to the upward spreading flux (Guo, 2018).
Where is the SSC at from the bottom bed,. is the reference SSC, is the reference distance, is the water depth, is defined as the suspension indicator,. is the Karman constant and is the frictional flow velocity of the bottom bed. Assuming that the suspended sand settling velocity is constant along the vertical direction and taking the natural logarithm on both sides of the equal sign of the Rouse equation, this gives
where . When the SSC profile conforms to the Rouse formula, will have a good linear correlation with , and the higher the degree of conformity, the larger the correlation coefficient.
Linear regression analysis was performed using the measured suspended sand profiles during neap, middle and spring tides in the Yangtze River Estuary, northern Hangzhou Bay and Yangshan Port waters, and the correlation coefficients were calculated (Figure 8). It can be seen that the correlation coefficients for most of the profiles are greater than 0.8, while those for a few periods do not reach 0.8, indicating that the Rouse formula has good applicability to the SSC during the observed periods for both small and large tides.
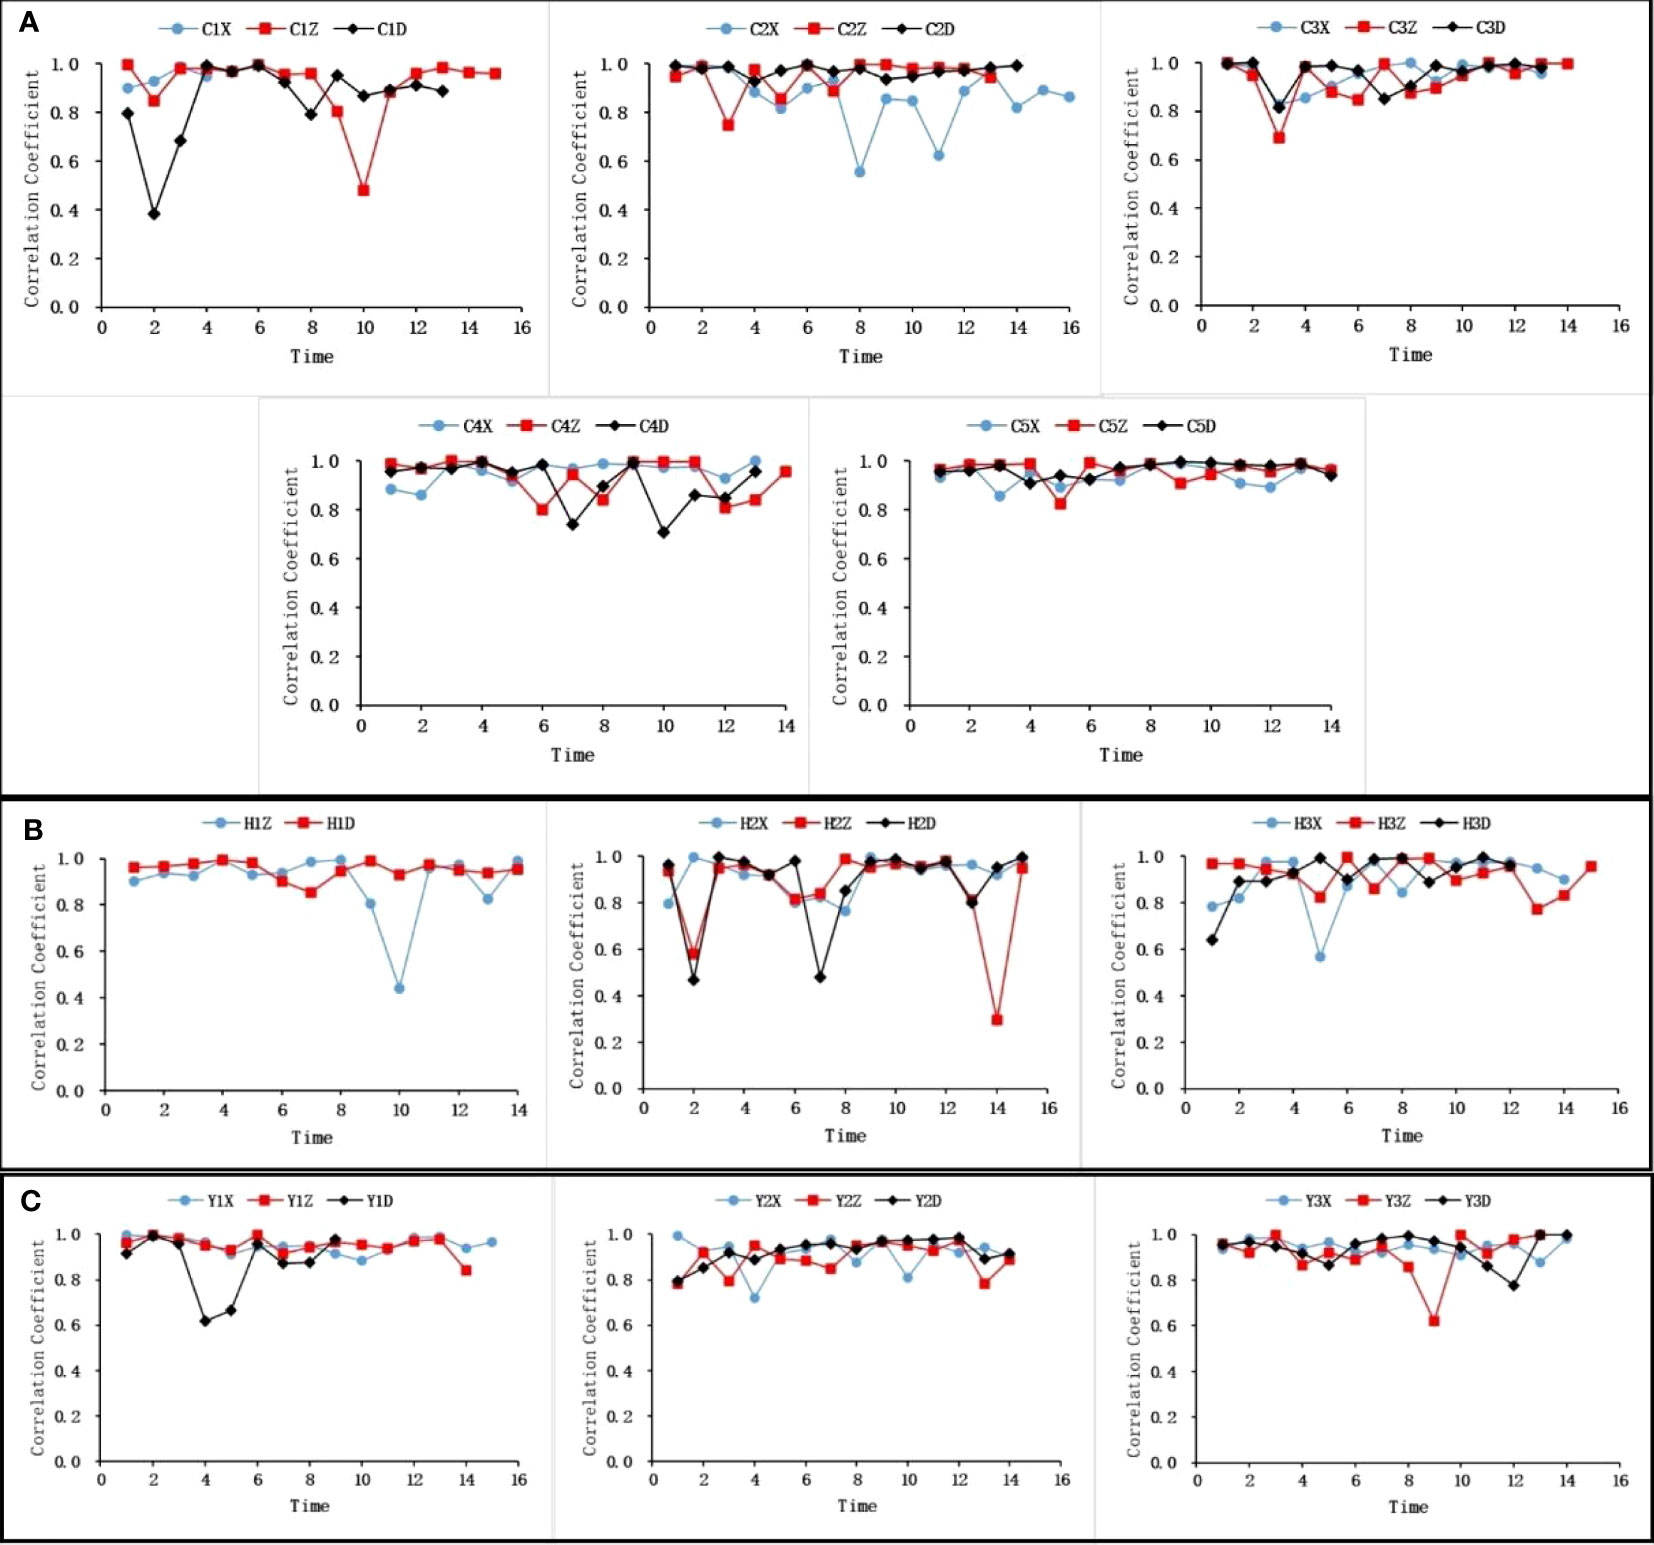
Figure 8 Correlation coefficients between I n C and for different tidal types in the Yangtze estuary (A), the northern Hangzhou Bay (B) and the Yangshan Port (C). In (A), from left to right, C1-C5; In (B), from left to right, H1-H3; In (C), from left to right, Y1-Y3.
In the fitting process of the SSC vertical distribution, the suspension indicator is an important parameter (denoted by Z), which not only characterizes the uniformity of the SSC vertical distribution (the smaller the Z, the more uniform the SSC vertical distribution), but also reflects the magnitude of the effective sink velocity of the suspended sand (the smaller the Z, the smaller the effective sink velocity) (Wang, 2008). As the suspension indicator cannot be measured directly, it can be obtained by fitting the Rouse formula. In order to investigate the difference between different tidal types of suspension indicators, the suspension indicators fitted to the 11 fixed plumb lines for neap, middle and spring tide periods were averaged, and similarly the suspension indicators fitted to the 11 fixed plumb lines for high and low tide states were averaged respectively, and the results are shown in Figure 9. Due to the complex topography and sand environment of the Yangtze River Estuary and adjacent sea areas, the influence of neap and spring tides as well as high and low tides on the suspension index varies from one observation point to another, which reflects the need to analyze the suspended sediment characteristics of each area separately and to consider the influence of high and low tides on them.
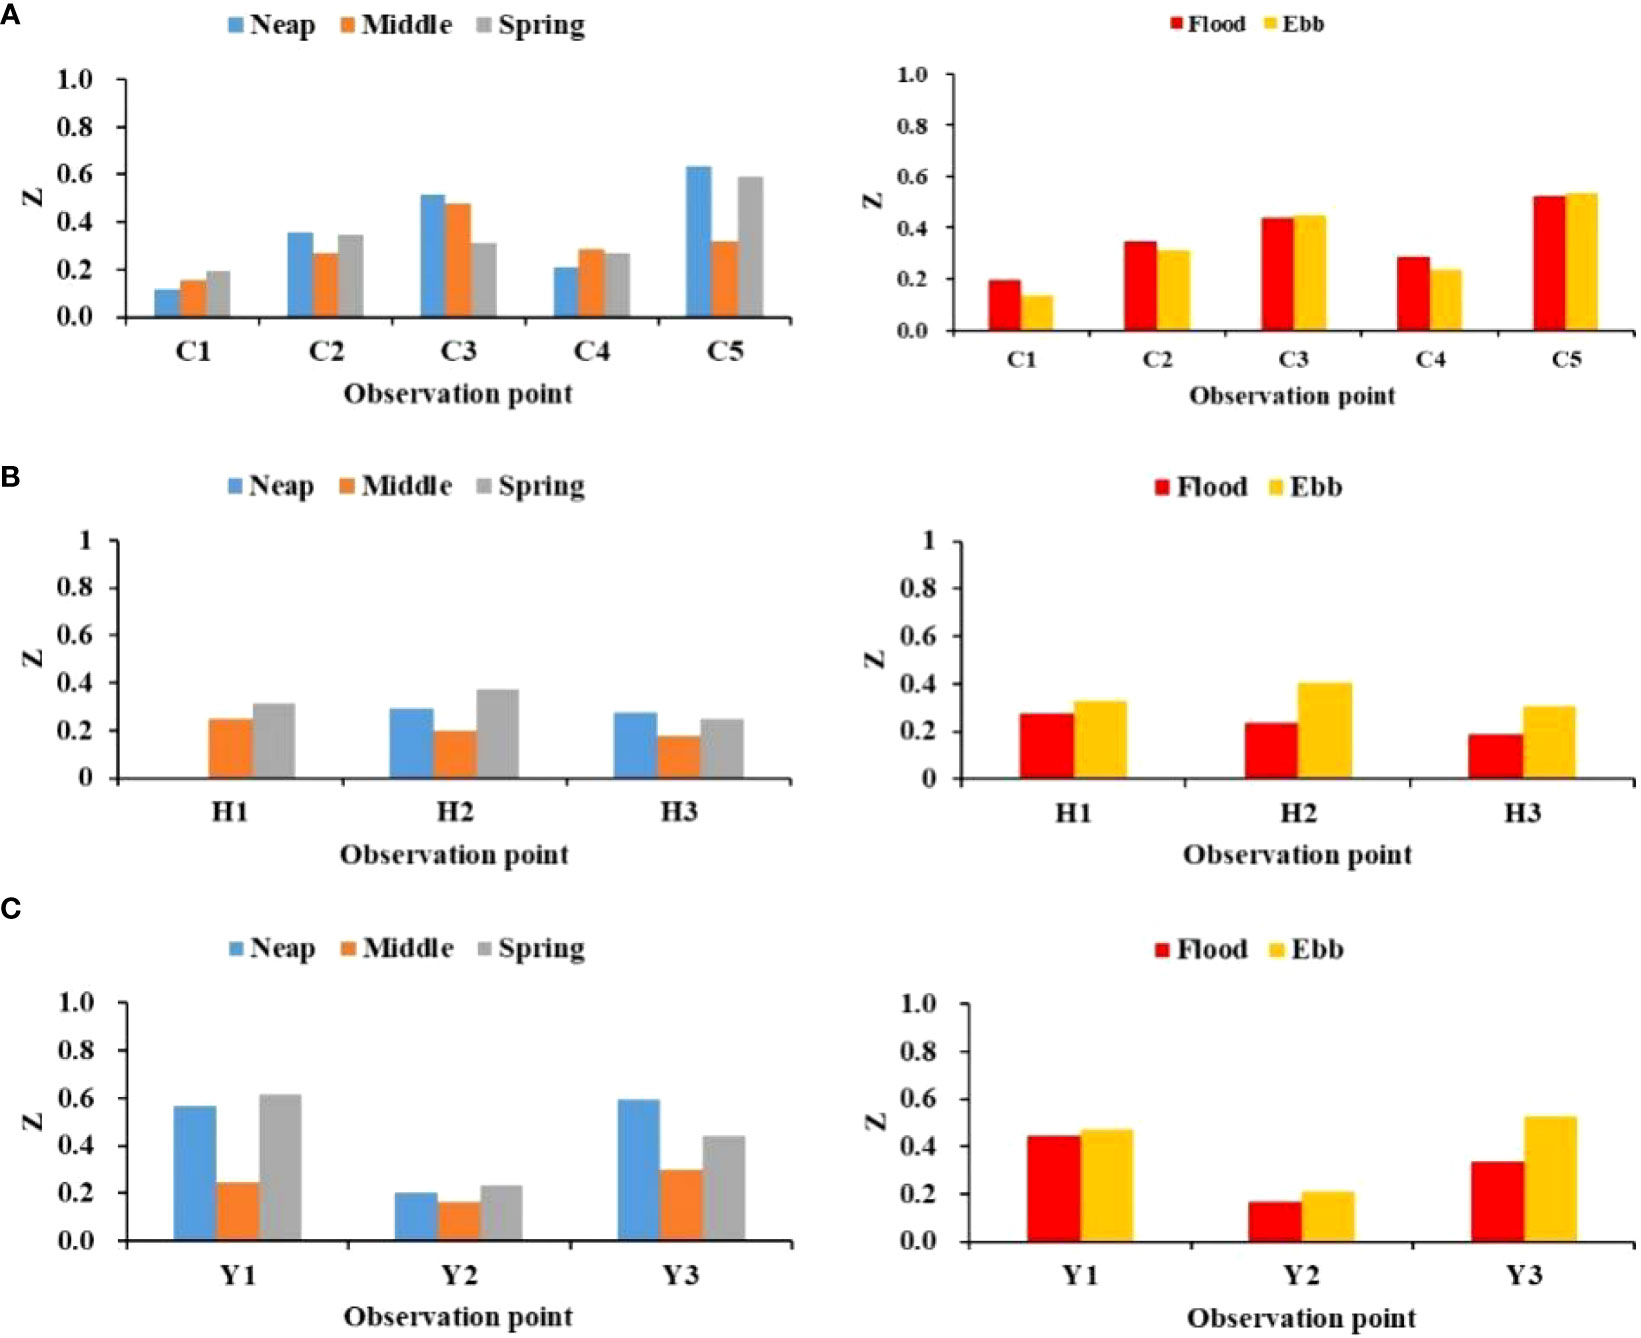
Figure 9 Differences in suspension indicators for different tidal types and tidal states. (A) In the Yangtze estuary; (B) In northern Hangzhou Bay; (C) In Yangshan Port.
Predictive analysis of SSC in each vertical layer based on Soulsby’s formula
Soulsby (2000) has proposed an empirical formula for the vertical distribution of SSC, which is expressed as follows.
is the SSC at height from the bottom bed, is the ratio of the near-bottom SSC to the surface SSC , and is the water depth.
In this paper, we use the measured vertical SSC data to predict the SSC in each vertical layer based on Soulsby’s formula, which is used to predict the concentration data of the remaining layers with the surface and near-bottom layer concentration data. We evaluate the prediction of the model by calculating the root mean square error (RMSE) and mean absolute error (MAE) between the predicted and measured values of 0.2H, 0.4H, 0.6H and 0.8H accuracy (Figure 10) It can be seen that the prediction accuracy for 0.2H and 0.8H is higher than that for 0.4H and 0.6H for both flood and ebb tides.
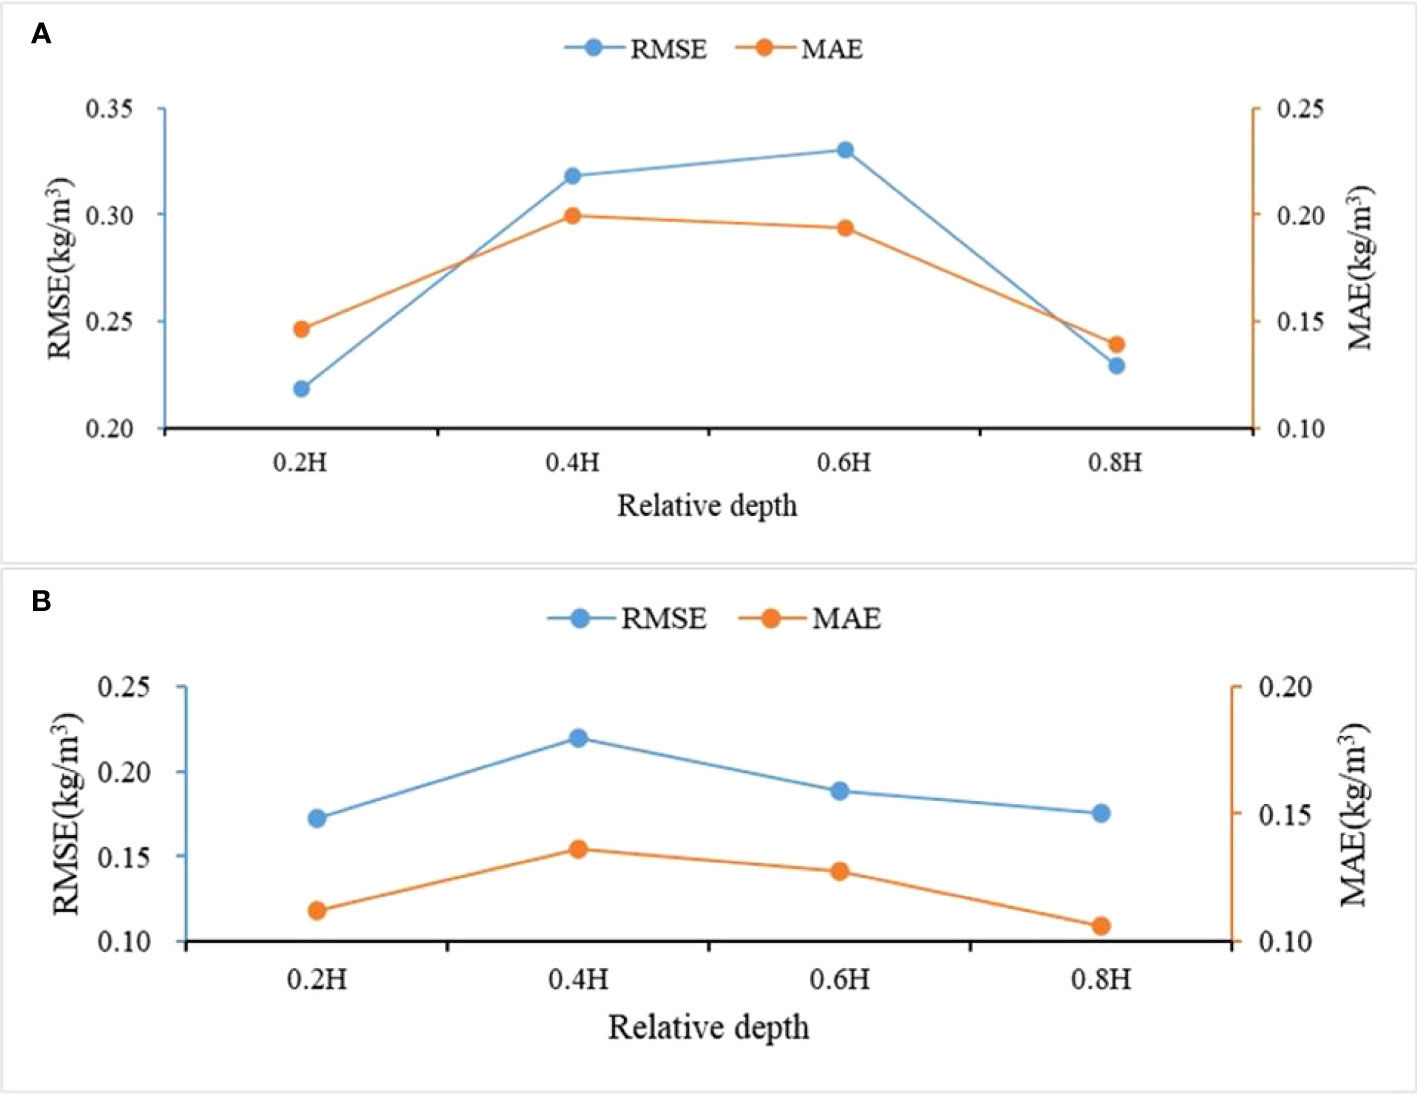
Figure 10 Prediction accuracy based on Soulsby’s model vertically for each layer. (A) Flood tide (B) Ebb tide.
In order to improve the prediction accuracy, different scholars have improved the Soulsby formula, with reference to Li (Li et al., 2019) the improved form is as follows.
Refer to Jiwei Zhao (2019) for an improved form of Soulsby’s formula as follows.
We made vertical predictions of the measured SSC based on Li’s Soulsby and Zhao’s Soulsby models, respectively, and compared the prediction accuracy of the three models by calculation (Figure 11) It was found that all three models could predict the SSC of the Yangtze estuary and its adjacent waters in the vertical direction better during both flood and ebb tides. The prediction accuracy of Li’s Soulsby model was slightly higher than the other two models. Analyzing the reason, it may be that the improved Soulsby model considers the error between the predicted profile and the measured profile, and reduces the error by taking logarithms. This means that we can effectively predict the SSC of the remaining layers in the vertical direction when the surface SSC, near-bottom SSC and water depth are known, which can greatly reduce the workload in the actual data collection species and has some practical value.
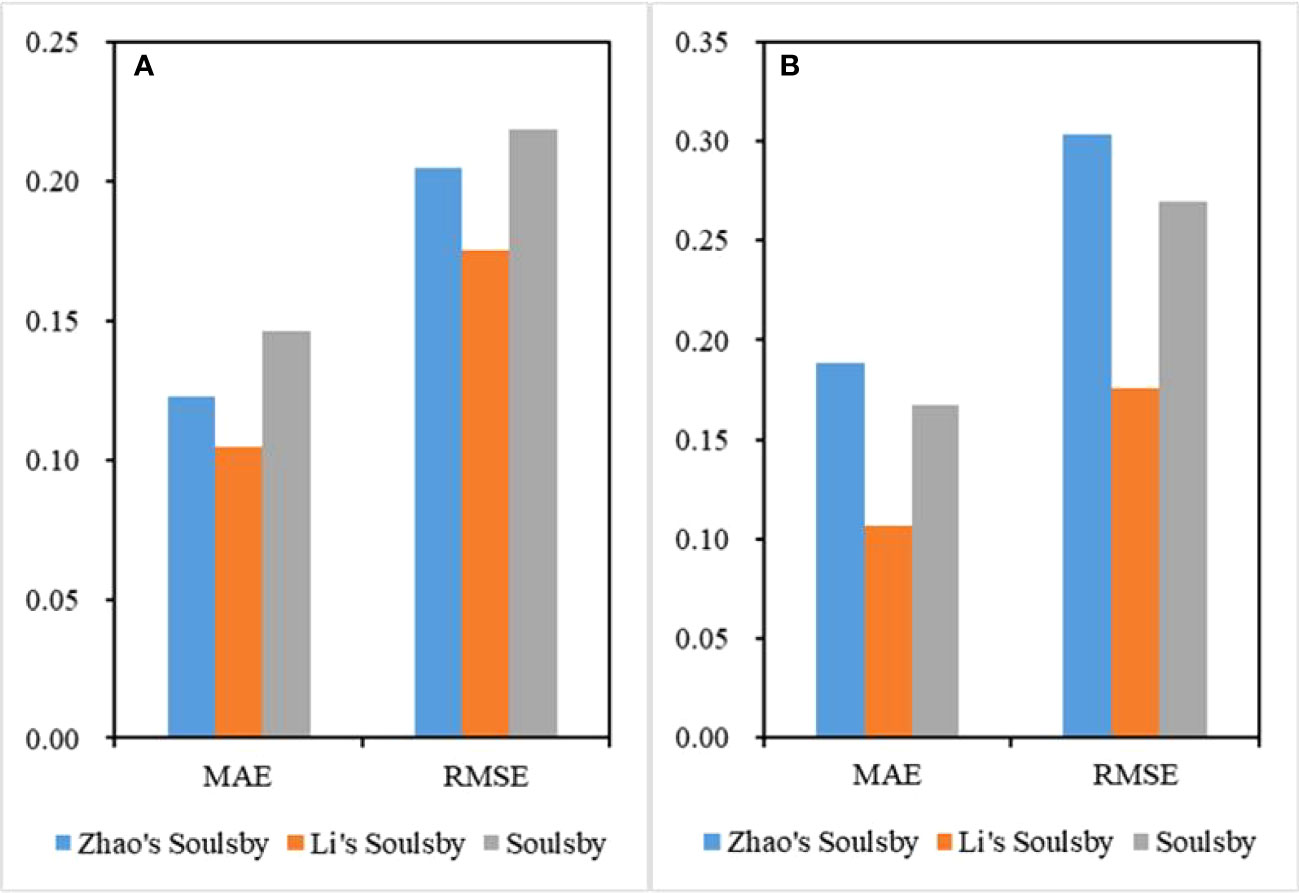
Figure 11 Comparison of vertical SSC prediction accuracy of three models. (A) Flood tide (B) Ebb tide.
The study of the variation of the vertical distribution of suspended sand in the estuary can provide a scientific basis for the evolution of scouring and siltation in the shallows of the Yangtze estuary, as well as a reference for the assessment and prediction of reserve land resources in Shanghai and the medium- and long-term planning of mudflats. Meanwhile, this paper discusses the applicability of typical hydrodynamic models Rouse’s formula and Soulsby’s formula and their improved forms to the Yangtze estuary and its nearby waters. It is found that the vertical distribution patterns of most of the suspended sand profiles in the region are close to the Rouse formula, and the vertical SSC prediction based on the Soulsby model has a high accuracy. However, the limitations of each hydrodynamic model should be further considered in the future, and each hydrodynamic model should be continuously improved so that it can accurately predict the vertical distribution of SSC.
This study helps to understand the variation patterns and quantitative information of SSC in the Yangtze River Estuary and its adjacent waters, which provides effective support for marine forecasting, analysis and evaluation. It also provides a theoretical basis for the analysis of the current situation of estuarine mudflat resources and the prediction of the evolution trend, and plays an important role in the integrated scientific research and management of mudflat resources in Shanghai. However, this study only explored the characteristic patterns of SSC in the Yangtze River Estuary and its adjacent waters based on field observations, but SSC is a more complex water environment parameter that is influenced by a variety of factors. The effects of salinity, temperature and wind speed should be considered in subsequent studies.
Data availability statement
The original contributions presented in the study are included in the article/Supplementary Material, further inquiries can be directed to the corresponding author/s.
Author contributions
KL and HL contributed to conception and design of the study. YP and HX organized the database. JW, WZ, HW, XY and ZW performed the statistical analysis. KL wrote the first draft of the manuscript. KL and HL wrote sections of the manuscript. All authors contributed to manuscript revision, read, and approved the submitted version.
Funding
This research was funded by the Key Laboratory of Marine Environmental Survey Technology and Application, Ministry of Natural Resources (grant No. MESTA-2021-B007), the Capacity Development for Local College Project (grant No. 19050502100) and Shanghai Ocean Bureau Research Project (Shanghai 2019-05).
Acknowledgments
Thanks to the Shanghai Marine Monitoring and Forecasting Center for the observation data of the Yangtze River Estuary.
Conflict of interest
The authors declare that the research was conducted in the absence of any commercial or financial relationships that could be construed as a potential conflict of interest.
Publisher’s note
All claims expressed in this article are solely those of the authors and do not necessarily represent those of their affiliated organizations, or those of the publisher, the editors and the reviewers. Any product that may be evaluated in this article, or claim that may be made by its manufacturer, is not guaranteed or endorsed by the publisher.
Supplementary material
The Supplementary Material for this article can be found online at: https://www.frontiersin.org/articles/10.3389/fmars.2023.1178862/full#supplementary-material
References
Becherer J., Flser G., Umlauf L., Burchard H (2016). Estuarine circulation versus tidal pumping: Sediment transport in a well-mixed tidal inlet. Ecol. Environ. Conserv. doi: 10.1002/2016JC011640
Bian B., Jiang J., Quan Q., Wang T., Greatbatch R. J., Li W. (2013). Distributions of suspended sediment concentration in the Yellow Sea and the East China Sea based on field surveys during the four seasons of 2011. J. Mar. Syst. 121–122. doi: 10.1016/j.jmarsys.2013.03.013
Dong J. (2011). Prediction of hydrodynamic changes and seabed evolution in Yangshan Port Redevelopment Project (Dalian, China: Dalian University of Technology).
Dong L. X., Guan W. B., Chen X. H., Li X. H., Liu X. H., Zheng X. M. (2011). Sediment transport in the yellow sea and east China sea. Estuar. Coast. Shelf Sci. 93 (3), 248–258. doi: 10.1016/j.ecss.2011.04.003
Du Laing G., Rinklebe J., Vandecasteele B., Meers E., Tack F. M. G. (2009). Trace metal behaviour in estuarine and riverine floodplain soils and sediments: a review. Sci. Tot. Environ. 407 (13), 3972–3985. doi: 10.1016/j.scitotenv.2008.07.025
Gong W., Jia L., Shen J., Liu J. T. (2014). Sediment transport in response to changes in river discharge and tidal mixing in a funnel-shaped micro-tidal estuary. Continental Shelf Res. 76, 89–107. doi: 10.1016/j.csr.2014.01.006
Guo C. (2018). Study on flocculation and sedimentation process and control mechanism of cohesive sediment (Shanghai, China: East China Normal University).
Hestir E. L., Schoellhamer D. H., Greenberg J., Morgan-King T., Ustin S. L. (2016). The effect of submerged aquatic vegetation expansion on a declining turbidity trend in the sacramento-san joaquin river delta. Estuaries Coasts 39 (4), 1100–1112. doi: 10.1007/s12237-015-0055-z
Hestir E. L., Schoellhamer D. H., Morgan-King T., Ustin S. L. (2013). A step decrease in sediment concentration in a highly modified tidal river delta following the 1983 El Nino floods. Mar. Geol. 345, 304–313. doi: 10.1016/j.margeo.2013.05.008
Jia L., Ren J., Nie D., Chen B., Lv X., CFCO Sciencetechnology, et al. (2014). Wave-current bottom shear stresses and sediment re-suspension in the mouth bar of the Modaomen Estuary during the dry season. Acta Oceanol. Sin. 33 (7), 107–115. doi: 10.1007/s13131-014-0510-x
Li Z., Jia J., Wu Y., Zong Y., Zhang Y., Wang Y., et al. (2019). Vertical distributions of suspended sediment concentrations in the turbidity maximum zone of the periodically and partially stratified changjiang estuary. Estuaries Coast. doi: 10.1007/s12237-019-00605-2
Li X., Zhu J., Yuan R., Qiu C., Wu H. (2016). Sediment trapping in the Changjiang Estuary: Observations in the North Passage over a spring-neap tidal cycle. Estuar. Coast. Shelf Sci. 177, 8–19. doi: 10.1016/j.ecss.2016.05.004
Miserocchi S., Langone L., Tesi T. (2007). Content and isotopic composition of organic carbon within a flood layer in the Po River prodelta (Adriatic Sea). Continental Shelf Res. 27 (3-4), 338–358. doi: 10.1016/j.csr.2005.05.005
Nienhuis J. H., Ashton A. D., Giosan L. (2016). Littoral steering of deltaic channels. Earth planetary Sci. Lett. 453, 204–214. doi: 10.1016/j.epsl.2016.08.018
Ren J., Wu J. (2014). Sediment trapping by haloclines of a river plume in the Pearl River Estuary. Continental Shelf Res. 82, 1–8. doi: 10.1016/j.csr.2014.03.016
Shi B., Wang Y. P., Du X., Cooper J. R., Li P., Li M., et al. (2016). Field and theoretical investigation of sediment mass fluxes on an accretional coastal mudflat. J. Hydro-environ. Res. 11. doi: 10.1016/j.jher.2016.01.002
Tejedor A., Longjas A., Zaliapin I. Z., Efi Foufoula-Georgiou (2015). Delta channel networks: 1. A graph-theoretic approach for studying connectivity and steady state transport on deltaic surfaces. Ecol. Environ. Conserv. 51 (6). doi: 10.1002/2014WR016577
Wang F. (2008). Study on the inherent optical properties and concentration remote sensing inversion model of suspended matter in estuarine water bodies (Zhejiang, China: Zhejiang University; College of Environment and Resources, Zhejiang University, Agricultural Resource Utilization).
Wang L. (2014). Research and application of remote sensing inversion of key dynamic parameters of surface waters in the Yangtze River Estuary and adjacent seas (Shanghai, China: East China Normal University).
Xie M., Wang W. X. (2020). Contrasting temporal dynamics of dissolved and colloidal trace metals in the Pearl River Estuary. Environ. pollut. 265 (Pt B), 114955. doi: 10.1016/j.envpol.2020.114955
Xie X., Wang Z., Gao G., Vriend H. J. D. (2009). Modeling the tidal channel morphodynamics in a macro-tidal embayment, Hangzhou Bay, China[J]. Continental shelf Res. 29 (15), 1757–1767. doi: 10.1016/j.csr.2009.03.009
Keywords: suspended sediment concentration, vertical distribution, Yangtze estuary and adjacent waters, Rouse’s formula, Soulsby’s formula
Citation: Luan K, Li H, Pan Y, Wang Z, Xu H, Zhu W, Wang J, Wan H and You X (2023) Characterization of suspended sand concentrations in the Yangtze River Estuary and adjacent waters. Front. Mar. Sci. 10:1178862. doi: 10.3389/fmars.2023.1178862
Received: 03 March 2023; Accepted: 31 July 2023;
Published: 18 August 2023.
Edited by:
Weiwei Sun, Ningbo University, ChinaReviewed by:
Jinhai Zheng, Hohai University, ChinaXueshi Sun, Fudan University, China
Xiong Xu, Tongji University, China
Kai Tan, East China Normal University, China
Copyright © 2023 Luan, Li, Pan, Wang, Xu, Zhu, Wang, Wan and You. This is an open-access article distributed under the terms of the Creative Commons Attribution License (CC BY). The use, distribution or reproduction in other forums is permitted, provided the original author(s) and the copyright owner(s) are credited and that the original publication in this journal is cited, in accordance with accepted academic practice. No use, distribution or reproduction is permitted which does not comply with these terms.
*Correspondence: Hui Li, QWRhbHluMDEyNUAxNjMuY29t