 Yun Hee Kim
 Hye Jin Seo
 Hyun Jun Yang
 Min-Young Lee
 Tae-Hoon Kim
 Dohyeop Yoo
 Byoung-Ju Choi
 Se Hyeon Jang
- Department of Oceanography, Chonnam National University, Gwangju, Republic of Korea
The northeastern East China Sea is an ecologically important marine ecosystem influenced by warm water derived from the Kuroshio Current. However, relatively little is known about the spatial variation of protist communities and their regulating factors from this region’s ecosystem during the spring season. Here, we investigated protistan community structures using a complementary approach combining 18S rRNA gene amplicon sequencing and light microscopy cell counts at nine stations from the northeastern East China Sea to the west of Jeju Island. The vertical profiles of physicochemical properties revealed that the Jeju Warm Current water mass, flowing from the southeast towards the northwest, created a thermohaline front dividing the region in two. These two regions had similar planktonic biomass, but the protistan communities differed significantly: dinoflagellates accounted for higher proportions of the protistan communities in the warm and saline waters, particularly at stations E35, E44, and E45, while the relative abundances of diatoms and picochlorophytes were higher in the low-density water of the western stations (E32 and E42). Furthermore, higher species richness and Shannon Diversity Index values in the warm and saline waters suggests that the Jeju Warm Current, a branch of the Kuroshio, increases protistan taxonomic diversity in the northeastern East China Sea during the late spring. Seed populations of harmful algal bloom-causing species were discovered in the warm and saline water originating from the Kuroshio, which is particularly important as it indicates that these waters could introduce harmful species that may spread to the Yellow Sea and Korea Strait. Taken together, the study suggests that potential changes to the current systems in the region could dramatically alter the structure of its protistan community.
1 Introduction
The northeastern East China Sea is a marginal sea within the Pacific Ocean located to the east of China and west of Japan and bordered by Korea to the north. The region has been known to be characterized by its complex system of water masses that are influenced by several factors, including the inflow of water from the Pacific Ocean, the discharge of freshwater from surrounding rivers, and seasonal fluctuations in temperature and salinity (Lie et al., 2000; Lie et al., 2015; Kang and Moon, 2022). One of the main water masses in the northeastern East China Sea is a branch of the Kuroshio Current, the Jeju Warm Current, which transports warm, nutrient-poor water, creating a distinct biogeographic region that provides habitat to a diverse array of marine life (Choi et al., 2008). Moreover, the water flow through this region is of great importance as it can extend to the coastal regions of the Korea Strait and Yellow Sea, leading to potentially significant problems such as the introduction of invasive species and pollution issues (Kwon et al., 2019; Lee and Park, 2022).
Although many aspects of the water mass system of the northeastern East China Sea are understood, planktonic community structures and their relationship to water characteristics have not been well studied (e.g., Shim and Park, 1984; Park et al., 2017; Sun et al., 2022). For example, remote sensing data has provided a relatively good understanding of how chlorophyll-a (Chl-a) concentrations, which are an indicator of phytoplankton biomass, fluctuate in response to water mass dynamics in the region (Kim et al., 2009; Yamaguchi et al., 2013). However, little is known about how the dynamics of these protistan community structures are affected despite their functional significance as potential determinants of food availability for higher trophic levels in marine ecosystems (Fukami et al., 1999; Zamora-Terol et al., 2020). In particular, late spring is a seasonally crucial phase for protists in the northeastern East China Sea because it is a period when the volume of water transported by the branch of the Kuroshio is still large and thus could flow towards the nearby coastal regions, potentially initiating the summer coastal blooms (Lie et al., 2000; Pang et al., 2003; Ahn et al., 2006). Thus, understanding the structures of protistan communities during this period is especially important.
Identifying protistan species can be an arduous task due to cell fragility, morphological variations, and relatively poorly known taxonomic information (Anderson and Menden-Deuer, 2017; Sherr and Sherr, 2018). However, with the development of various observational technologies, specific analyses of community structure have been actively conducted in recent years (Olson and Sosik, 2007; Lombard et al., 2019; Jang et al., 2022). One way to investigate taxonomic composition, relative species abundance, and spatiotemporal distribution in planktonic communities is DNA metabarcoding, which can be achieved by sequencing a short DNA region at a reasonable cost (Cuvelier et al., 2010; De Vargas et al., 2015; Abad et al., 2016; Jang, 2022). Moreover, the high sensitivity of this technique allows for the detection of rare taxa and identification of cryptic species that are typically overlooked by conventional microscopy observations because they are either too small or fragile (De Vargas et al., 2015; Abad et al., 2016). In this study, DNA metabarcoding complemented by microscopic examination was used to analyze the protistan communities present in the waters of the northeastern East China Sea. There were two primary objectives of this study. First, to investigate how oceanographic variables were impacted by the water mass features in the northeastern East China Sea during late spring. Second, to comprehend how these variables influenced the compositions and spatiotemporal distribution of planktonic protistan assemblages in the region.
2 Materials and methods
2.1 Study area and sample collection
The research cruise (R/V Saedongbaek, Chonnam National University) was conducted throughout the northeastern East China Sea from 33 to 34°N and 125 to 127°E from May 16th to May 18th, 2022 (Figure 1). The survey period fell within the typical warming season when the northeastern East China Sea is affected by the cool, less saline Mixed Shelf Water (MSW) in the northwest and the warm, saline Jeju Warm Current Water (JWCW) in the southeast (Guo et al., 2003; Park et al., 2017; Che and Zhang, 2018; Kang and Moon, 2022; Figure 1B). The surveyed stations were grouped into two distinct regions based on the observed data and defined by water mass characteristics (i.e., temperature-salinity profiles): a western region dominated by MSW and an eastern region affected by JWCW (See the Results section 3.2 for details).
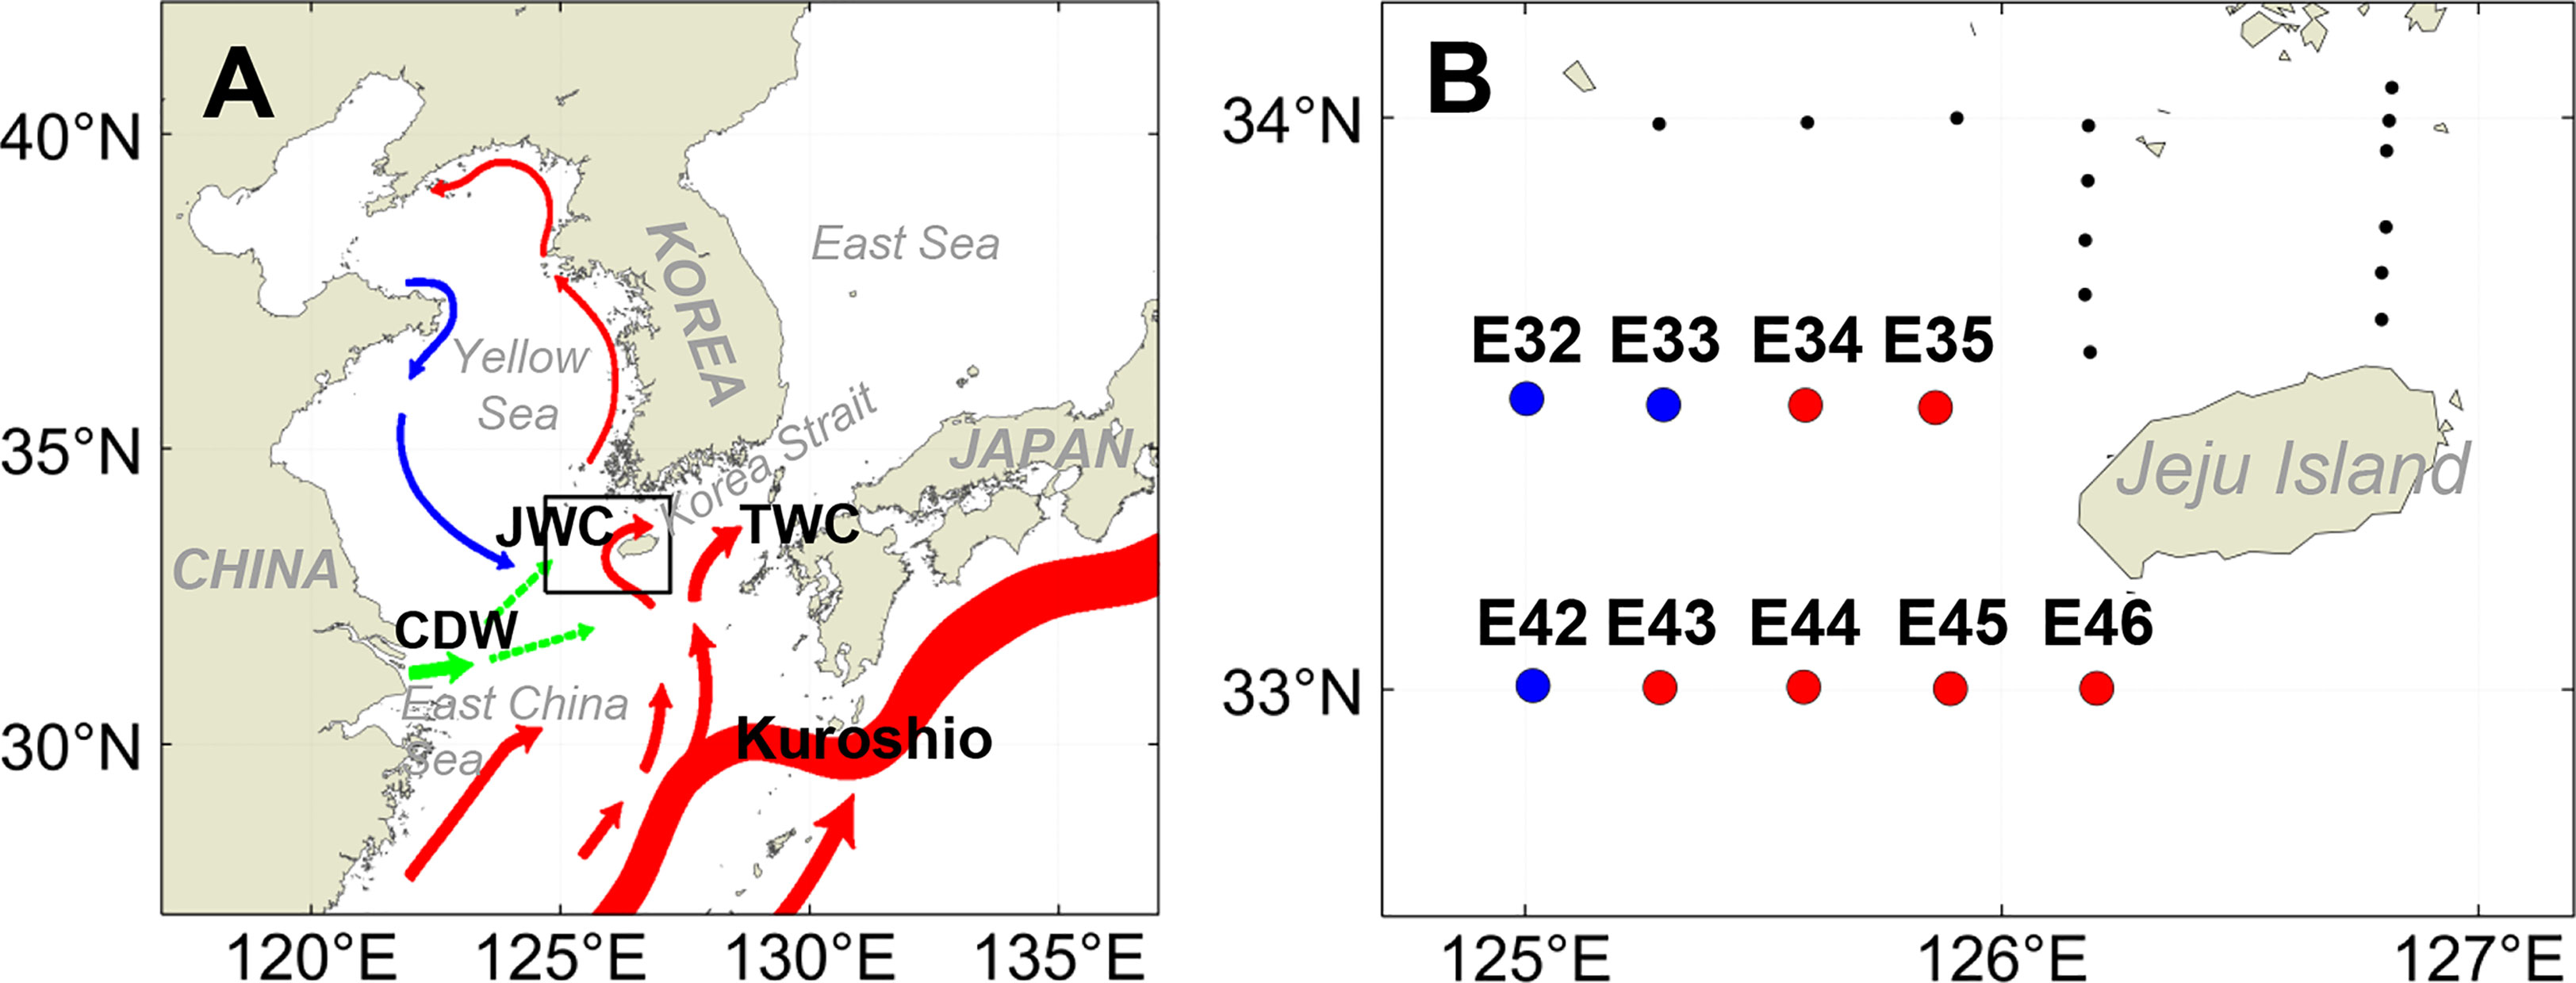
Figure 1 (A) Map of the study region (black rectangular box) along with the major surface oceanographic currents (colored vectors) based on Park et al. (2017) (JWC, Jeju Warm Current; TWC, Tsushima Warm Current; CDW, Changjiang Diluted Water). (B) Locations of sampling stations in the northeastern East China Sea. Blue circles indicate the stations in the Mixed Shelf Water (MSW) region, and red circles indicate the stations in the Jeju Warm Current Water (JWCW) region.
Conductivity-temperature-depth (CTD) profiles were obtained at 23 stations, and for biological and chemical measurements, seawater samples were collected at 4 depths—the surface (2 m), Deep Chlorophyll Maximum (DCM) layer, middle, and bottom water depths—at 9 stations using Niskin bottles mounted on the CTD rosette. The water depths were determined based on the CTD profiles obtained in situ. Raw water samples were pre-filtered through a 200 µm nylon sieve to eliminate the potential interference of larger plankton before being divided into samples for nutrient and particulate carbon and molecular analyses. Subsequently, we used a portable microscope (TBL-1500S, TOPEX, Korea) to visually assess the possibility of protist particles larger than 200 µm becoming trapped in the filters, but no chain-forming cells or cell aggregation was observed, likely due to the low cell abundances in the offshore waters. A 2 L sample for 18S rRNA gene sequencing and a 0.6 L sample for cell counts, preserved in Lugol’s iodine solution (final concentration of 2%), was collected from each sampling. Initially, we obtained triplicate samples for cell counting, but low cell abundances were observed in the offshore samples. To compensate for the insufficient quantity of biomass, the triplicate samples were pooled into one before the cell identification analysis was conducted. DNA and biochemical samples were frozen at -20°C, and the Lugol’s solution-fixed protist samples were stored in the dark at 4°C until further analysis.
2.2 Analyses of seawater properties
Macronutrient levels for nitrate + nitrite (NO3 + NO2), ammonium (NH4), phosphate (PO4), and silicic acid (Si[OH]4) were measured using a nutrient auto-analyzer (New QuAAtro39, SEAL Analytical, UK). A total of 15 mL of seawater for each sample was filtered through 0.7 µm GF/F filters (25 mm, Whatman Inc., Florham Park, NJ, USA) using acid-washed syringes into polypropylene Falcon™ tubes. Reference standards for each nutrient were run for quality control purposes.
Samples for particulate organic carbon (POC) were collected in 1 L HDPE bottles (Nalgene, Rochester, New York) and frozen until analysis. The samples were passed through 0.7 µm GF/F filters and the resulting filter papers were dried at 50°C for 12 h to remove any moisture. After that, acid fumigation was conducted with HCl for 12 h in a desiccator to remove inorganic carbon, and POC was measured using a Thermo Scientific Flash 2000 element analyzer.
Chlorophyll fluorescence measurements were made using a CTD equipped with a fluorescence sensor (WET Labs ECO-AFL/FL). The conversion of measured chlorophyll fluorescence to Chl-a concentration was based on linear regression using hundreds of discrete samples collected from the same study area (unpublished data).
The depths of the thermocline layers were determined by examining temperature and salinity profiles. All CTD casts were calibrated using SeaBird’s SeaSoft software.
2.3 Satellite data
Sea surface temperature (°C; SST) data, derived from satellites, were acquired at a 0.01° grid resolution from the Multi-scale Ultra-high Resolution (MUR) SST. Additionally, Chl-a (µg L-1), and POC (µg L-1) data were obtained at of 0.025° and 0.04° grid resolutions, respectively, from the MODerate-resolution Imaging Spectroradiometer (MODIS) on board the National Aeronautics and Space Agency’s Aqua satellite. Daily average sea surface temperature and 8-day averaged Chl-a and POC measurements were collected to reflect changing hydrologic conditions of the northeastern East China Sea during the survey and before the survey period. These data were retrieved from the NOAA CoastWatch Browser and are presented using MATLAB software.
2.4 DNA extraction, amplicon sequencing, and sequence analysis
The metabarcoding analyses were performed on DCM-layer samples. Two liters of the pre-filtered seawater was filtered under gentle vacuum pressure (< 100 mmHg) through 0.45 µm membrane filters (47 mm, Whatman). For DNA extraction, filters were extracted using the DNeasyPowerSoil Kit (Qiagen, Hilden, Germany), following the manufacturer’s instructions with an initial bead-beating step. Extracted DNA was quantified on a Qubit fluorometer using Quant-IT PicoGreen (Invitrogen) and stored at -20°C prior to polymerase chain reaction (PCR).
The sequencing libraries were prepared according to the Illumina Metagenomic Sequencing Library protocols for amplifying the target gene (San Diego, CA, USA). The input gDNA (2ng) was PCR-amplified with 500 nM each of the universal forward (TAReuk454FWD1; 5’- CCAGCASCYGCGGTAATTCC-3’) and reverse (V4 18S Next.Rev; 5’- ACTTTCGTTCTTGATYRATGA-3’) primers targeting the V4 region of the 18S rRNA gene (Stoeck et al., 2010; Piredda et al., 2017). Samples were amplified using Herculase II fusion DNA polymerase (Agilent Technologies, Santa Clara, CA) in a 5× reaction buffer, 1 mM dNTP mix. The thermocycler conditions for the 1st PCR were 3 min at 95°C, followed by 25 cycles of denaturation at 98°C for 30 s, annealing at 65°C for 60 s, and extension at 72°C for 90 s. The products were cleaned using AMPure beads (Agencourt Bioscience, Beverly, MA). After purification, 2 µL of each first PCR product was amplified again for the final library construction using NexteraXT Indexed Primers. The thermocycler conditions for the 2nd PCR were 3 min at 95°C; 10 cycles of 30 s at 95°C, 30 s at 55°C, and 30 s at 72°C; and a final 5 min step at 72°C. Products were purified with the AMPure beads.
The final purified product was then quantified using qPCR following the qPCR Quantification Protocol Guide (KAPA Library Quantification kits for Illumina Sequencing platforms) and qualified using a TapeStation D1000 ScreenTape system (Agilent Technologies, Waldbronn, Germany). Paired-end (2×300 bp) sequencing was performed at Macrogen (Seoul, South Korea) in a single lane of the Illumina MiSeq platform (Illumina, San Diego, USA).
The raw read sequences were deposited in the NCBI Short Read Archive (PRJNA945263). The sequencing output was demultiplexed using tools from QIIME 1.9.1 and Cutadapt 3.2 and then analyzed using the QIIME 1.9 software pipeline (Martin, 2011; Bolyen et al., 2019). The produced reads were trimmed, assembled, and quality controlled. Demultiplexed paired-end reads were denoised, paired ends were joined, and chimeras were removed with DADA2 software (Callahan et al., 2016). Joined sequences were clustered into amplicon sequence variants (ASVs). In order to eliminate potential biases due to sampling depth, the sequencing pool was randomly subsampled ten times using the “multiple_rarefactions_even_depth.py” script in QIIME. The resulting ASV tables were merged prior to conducting further analyses. Taxonomic assignment of these ASVs was carried out against the PR2 4.14.0 database with the default parameters (Guillou et al., 2012). All ASVs assigned to metazoans were removed from the analyses.
2.5 Cell identification and abundance
Light microscopy was used for the identification and enumeration of protistan species in the investigated samples. For microscopic cell counts, 600 mL subsamples preserved in Lugol’s solution were concentrated 5–10 folds using the 2-d settlement method. After being thoroughly mixed, all or a minimum of 300 total observed cells in three to five 1-mL Sedgwick-Rafter counting chambers were counted at 100× and/or 200× magnification.
2.6 Statistical analyses
To test the statistical significance of differences in oceanographic variables and gene read-based protistan taxa between the stations in the MSW and JWCW regions, t-tests were conducted using the statistical software package SPSS ver. 27.0 (IBM Corp., Armonk, NY, USA). A non-metric multidimensional scaling (NMDS) analysis was conducted to visualize pairwise dissimilarities between communities across the sampling stations. To represent the impact of oceanographic variables on spatial patterns in protistan communities, environmental factors were fitted onto the NMDS ordination using the “envfit” function. In order to determine whether the differences observed between the MSW and JWCW regions were statistically significant, a one-way analysis of similarities (ANOSIM) test was utilized. The “vegan” package in R v4.1.2 was utilized for both the NMDS and ANOSIM analyses.
3 Results
3.1 Temporal distribution of physical and biochemical properties
In the satellite-derived data, collected over a period beginning about four weeks prior to our cruise, SSTs displayed warm water masses moving northwest near Jeju Island (Figures 2A–C) and a clear regional contrast between the MSW and the JWCW regions (Figure 2C) during the data collection period. Both surface concentrations of chlorophyll-a (Chl-a) and particulate organic carbon (POC), as observed by satellite remote sensing, were generally increasing toward the northwest in a pattern consistent with but opposite that of the SST data in the study area (Figures 2D–I). Additionally, in mid-April, about four weeks prior to our cruise, the Chl-a data indicated that a spring bloom (defined by a threshold concentration of more than 5 µg L-1) occurred in the northeastern East China Sea region (Figure 2D). When comparing the seasonal changes in SSTs and Chl-a and POC concentrations, clear regional contrasts in SSTs between the MSW and the JWCW regions were observed throughout the year, except for in mid-winter and mid-summer (Supplementary Figure 1). Clear regional contrasts in Chl-a and POC concentrations were also observed between the two regions but were more seasonally dependent, with the most pronounced differences occurring in the periods immediately preceding and following winter. The inferred planktonic biomass within these regions was highest during the spring season (March-April) and exhibited a seasonal pattern, increasing again during autumn (after September).
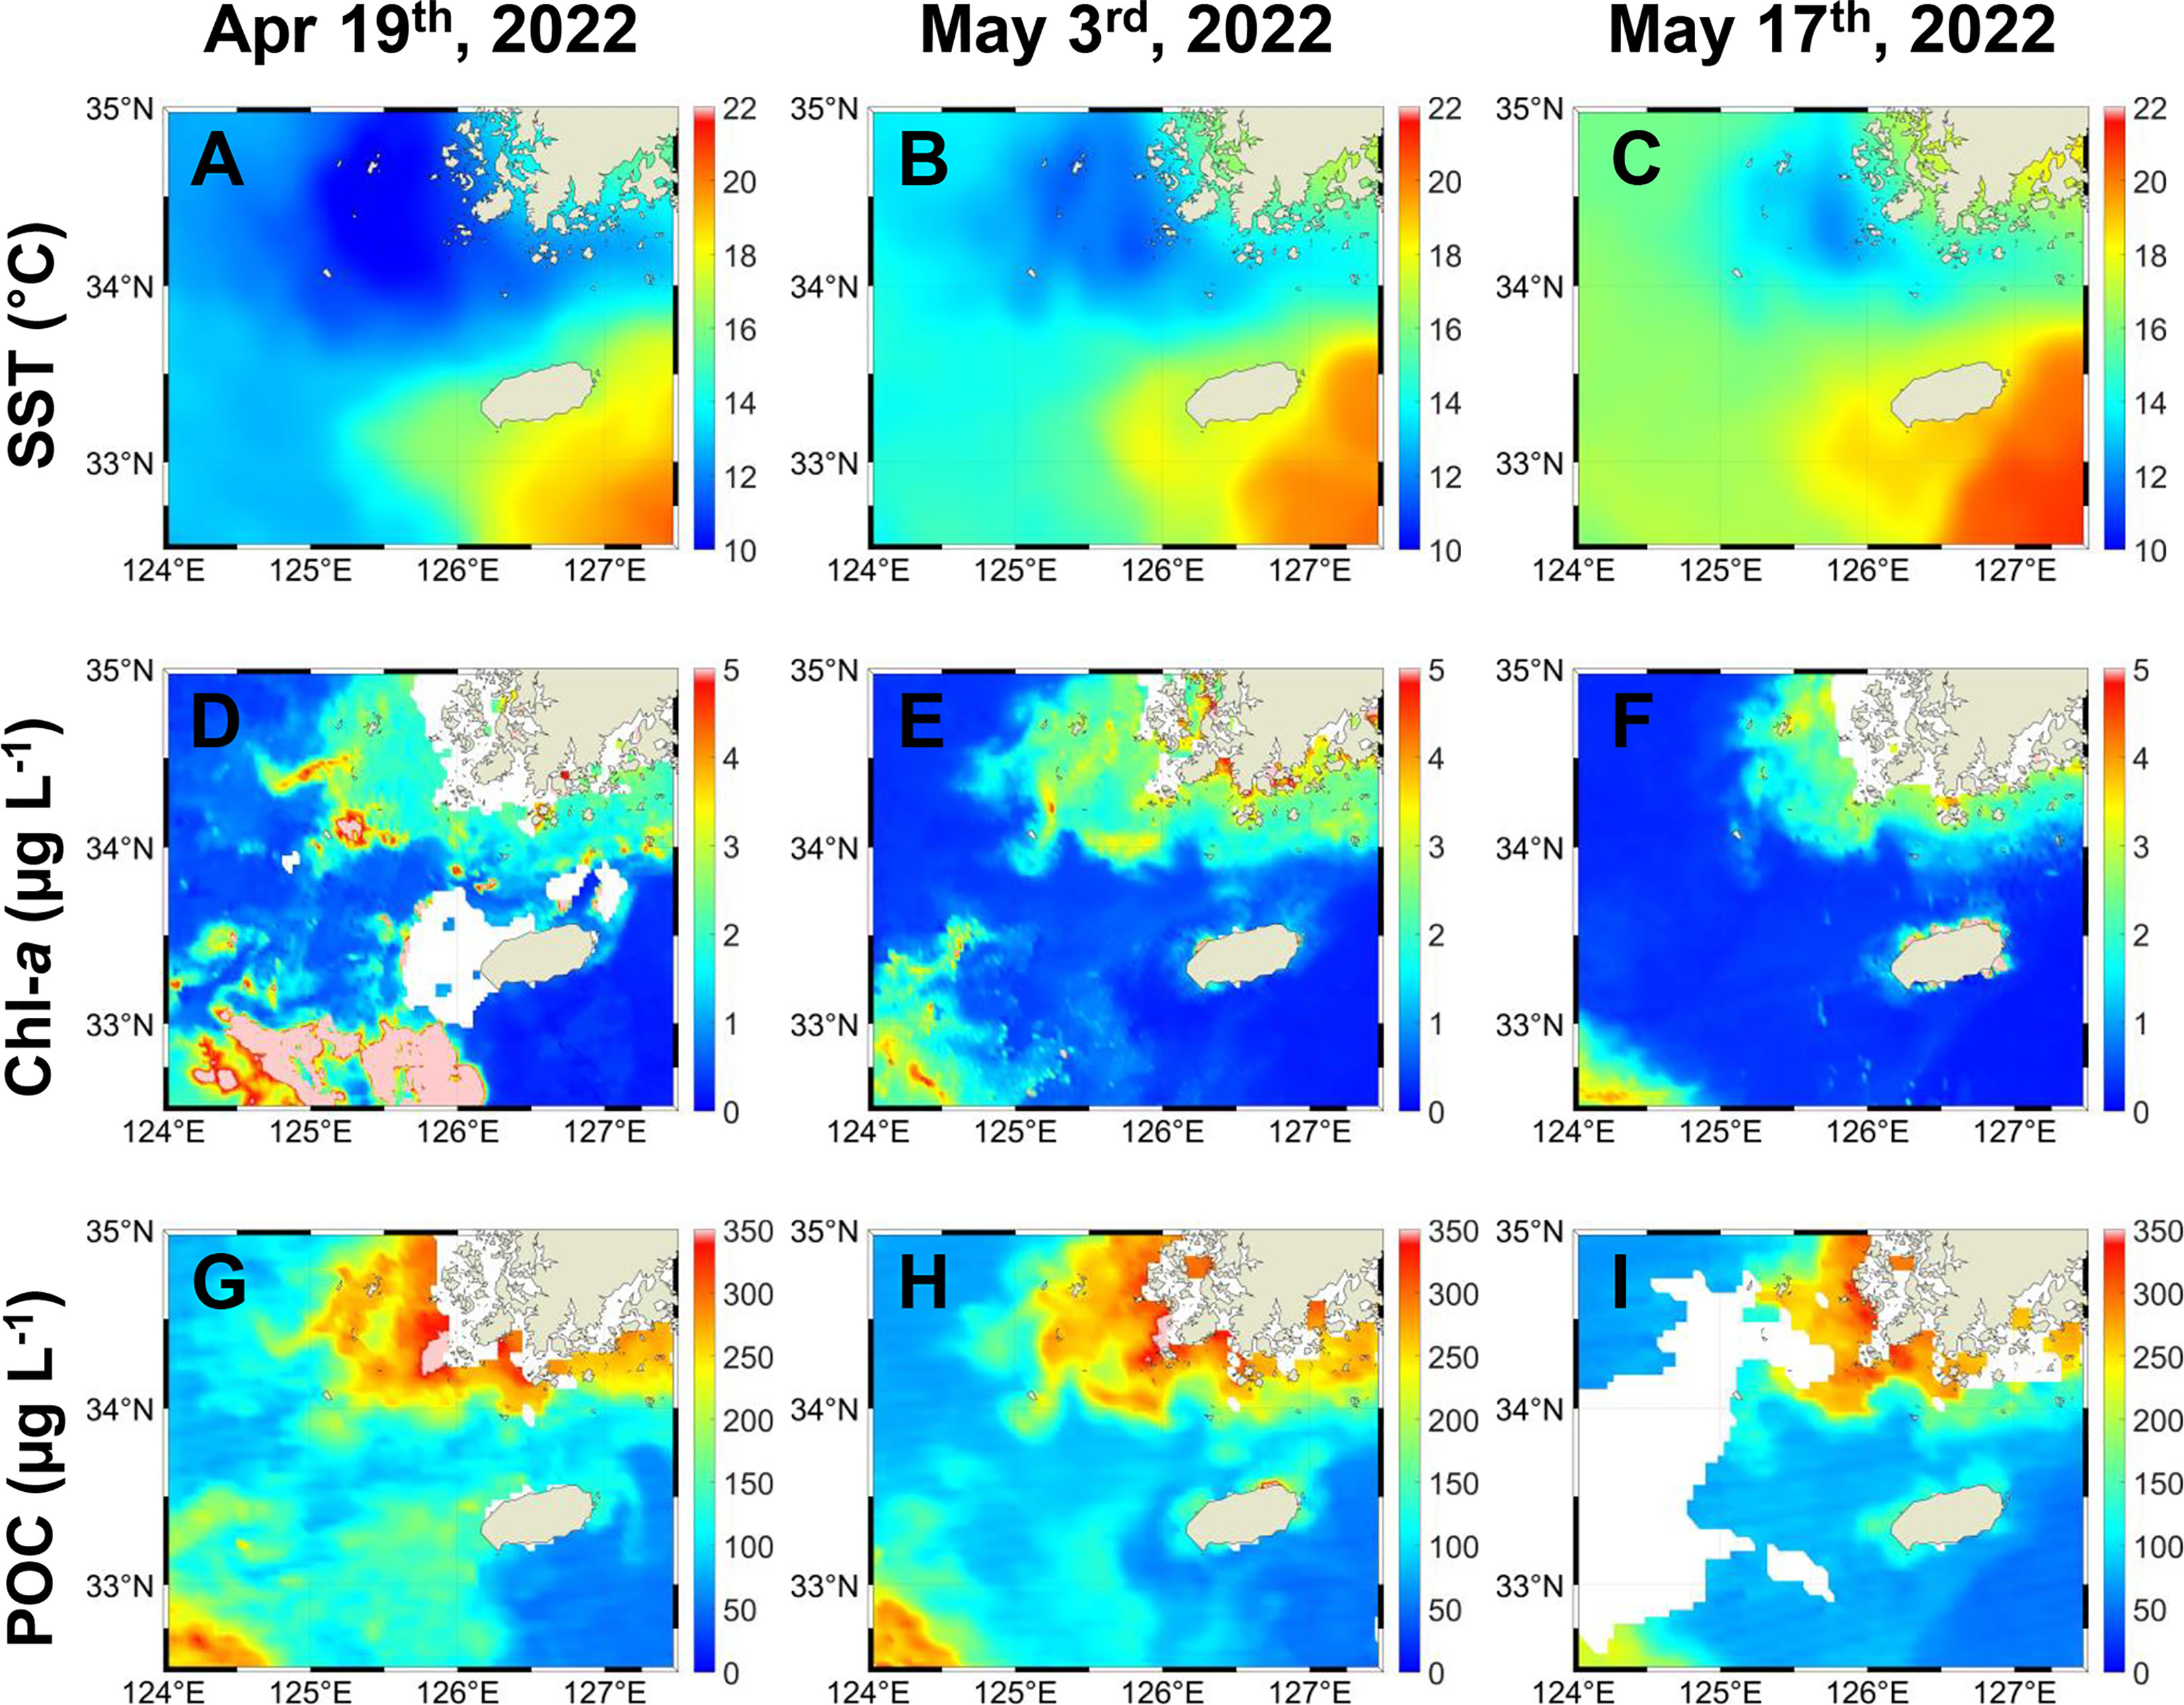
Figure 2 Temporal distribution of (A–C) sea surface temperatures (SSTs, °C), (D–F) chlorophyll-a (Chl-a, µg L-1), and (G–I) particulate organic carbon (POC, µg L-1) concentrations derived from remote sensing before and during the survey period. The data for (A, D, G) were obtained on April 19th; for (B, E, H) on May 3rd; and for (C, F, I) on May 17th (i.e., the survey period).
3.2 Spatial and vertical distribution of oceanographic properties
The spatial and vertical distribution of physical water characteristics during the field observation period is illustrated by the temperature and salinity information (Figure 3). The T-S diagram displays a thermohaline front between the southeast (i.e., E35, E45, and E46) and the northwest (i.e., E32, E33, and E42) stations consistent with a direct influence of warm and saline water masses (Figure 3A). Specifically, a strong temperature inversion occurred in the frontal boundary near stations E34 and E43. Furthermore, the spatial temperature and salinity distributions at the 5 m depth showed the effect of a warm water mass originating from the JWCW (Figures 3B, C).
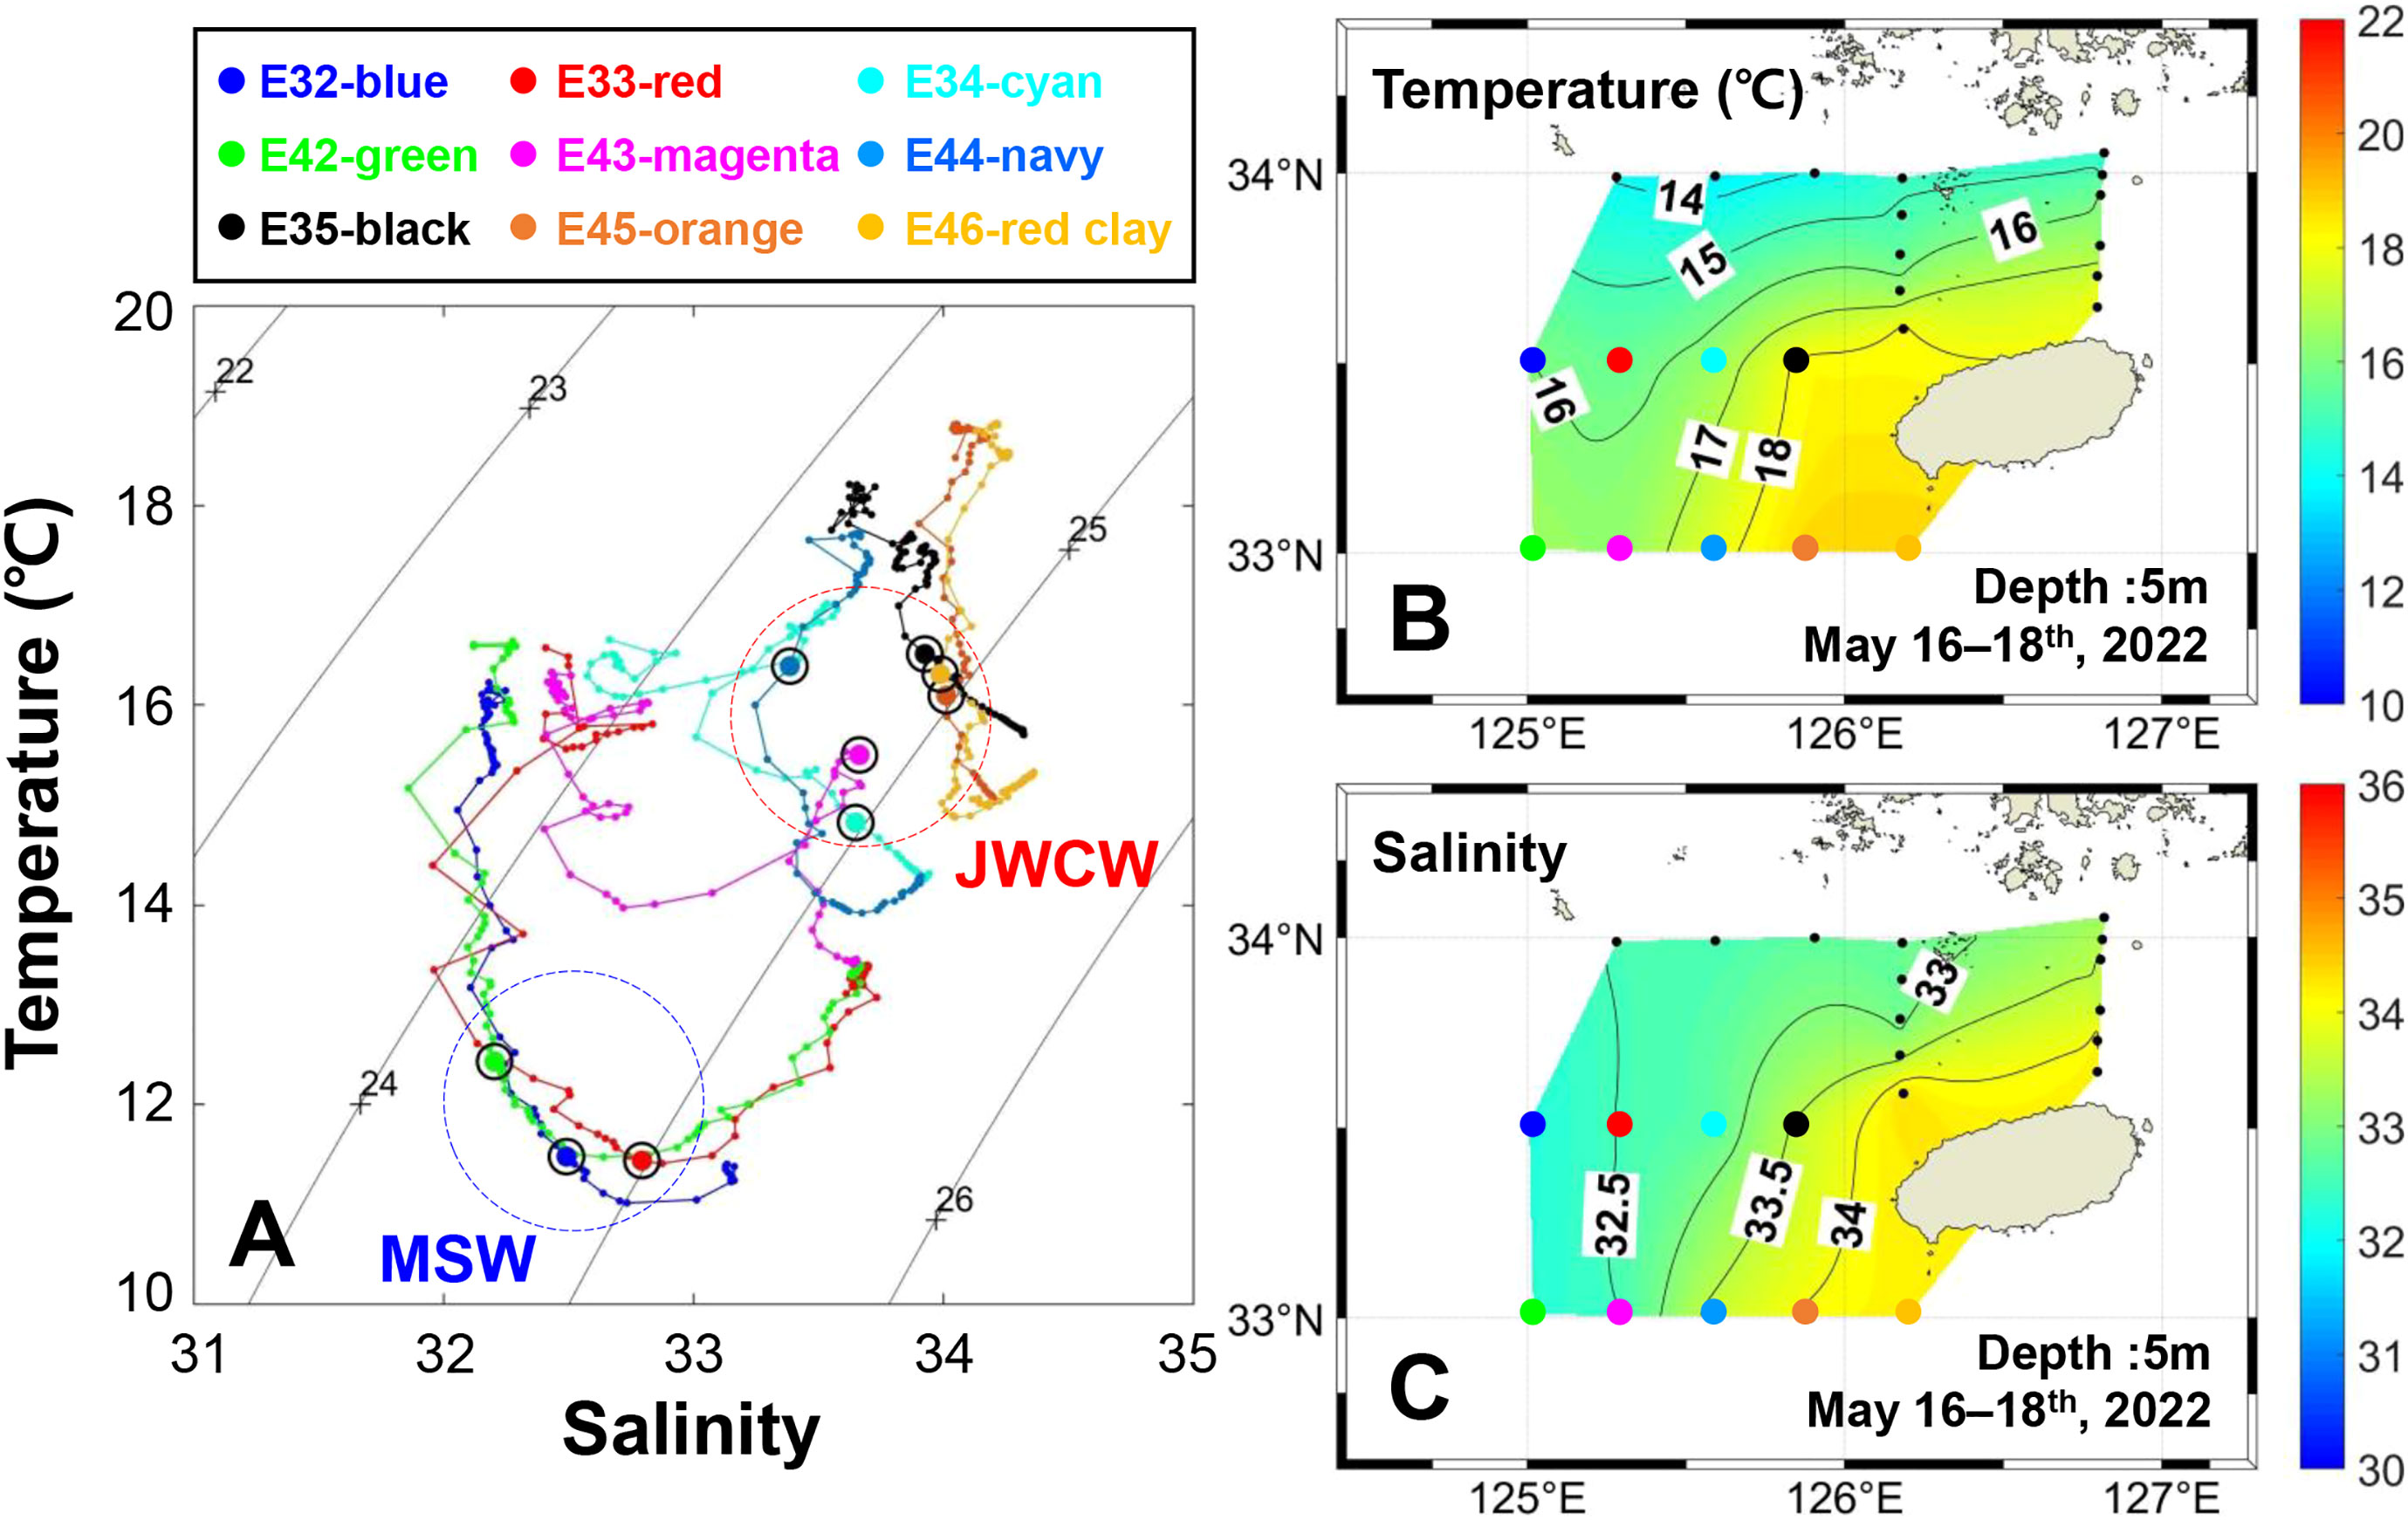
Figure 3 Spatial and vertical distribution of physical water characteristics in the northeastern East China Sea, surveyed from May 16–18th, 2022. (A) A temperature-salinity diagram. Each circle dot above the colored line represents the deep chlorophyll maximum layer at which DNA sampling was conducted. The background contour lines represent the water density (kg/m3). Survey stations were classified into water mass groups based on the similarity of their water characteristics: Mixed Shelf Water (MSW) and Jeju Warm Current Water (JWCW) regions. Spatial distributions of (B) temperature and (C) salinity based on values measured at 23 stations.
Using the spatial classifications defined according to the water mass characteristics, the mean water temperatures of the surface and DCM layers in the JWCW region were significantly higher than those in the MSW region (t-tests, both p < 0.05; Figure 4). The temperatures of the surface and DCM layers in the JWCW region were 17.2°C and 15.9°C, respectively, while those in the MSW region were 16.3°C and 11.8°C, respectively. Similarly, the mean salinities of the surface and DCM layers in the JWCW region were significantly higher than those in the MSW region (t-tests, both p < 0.05).
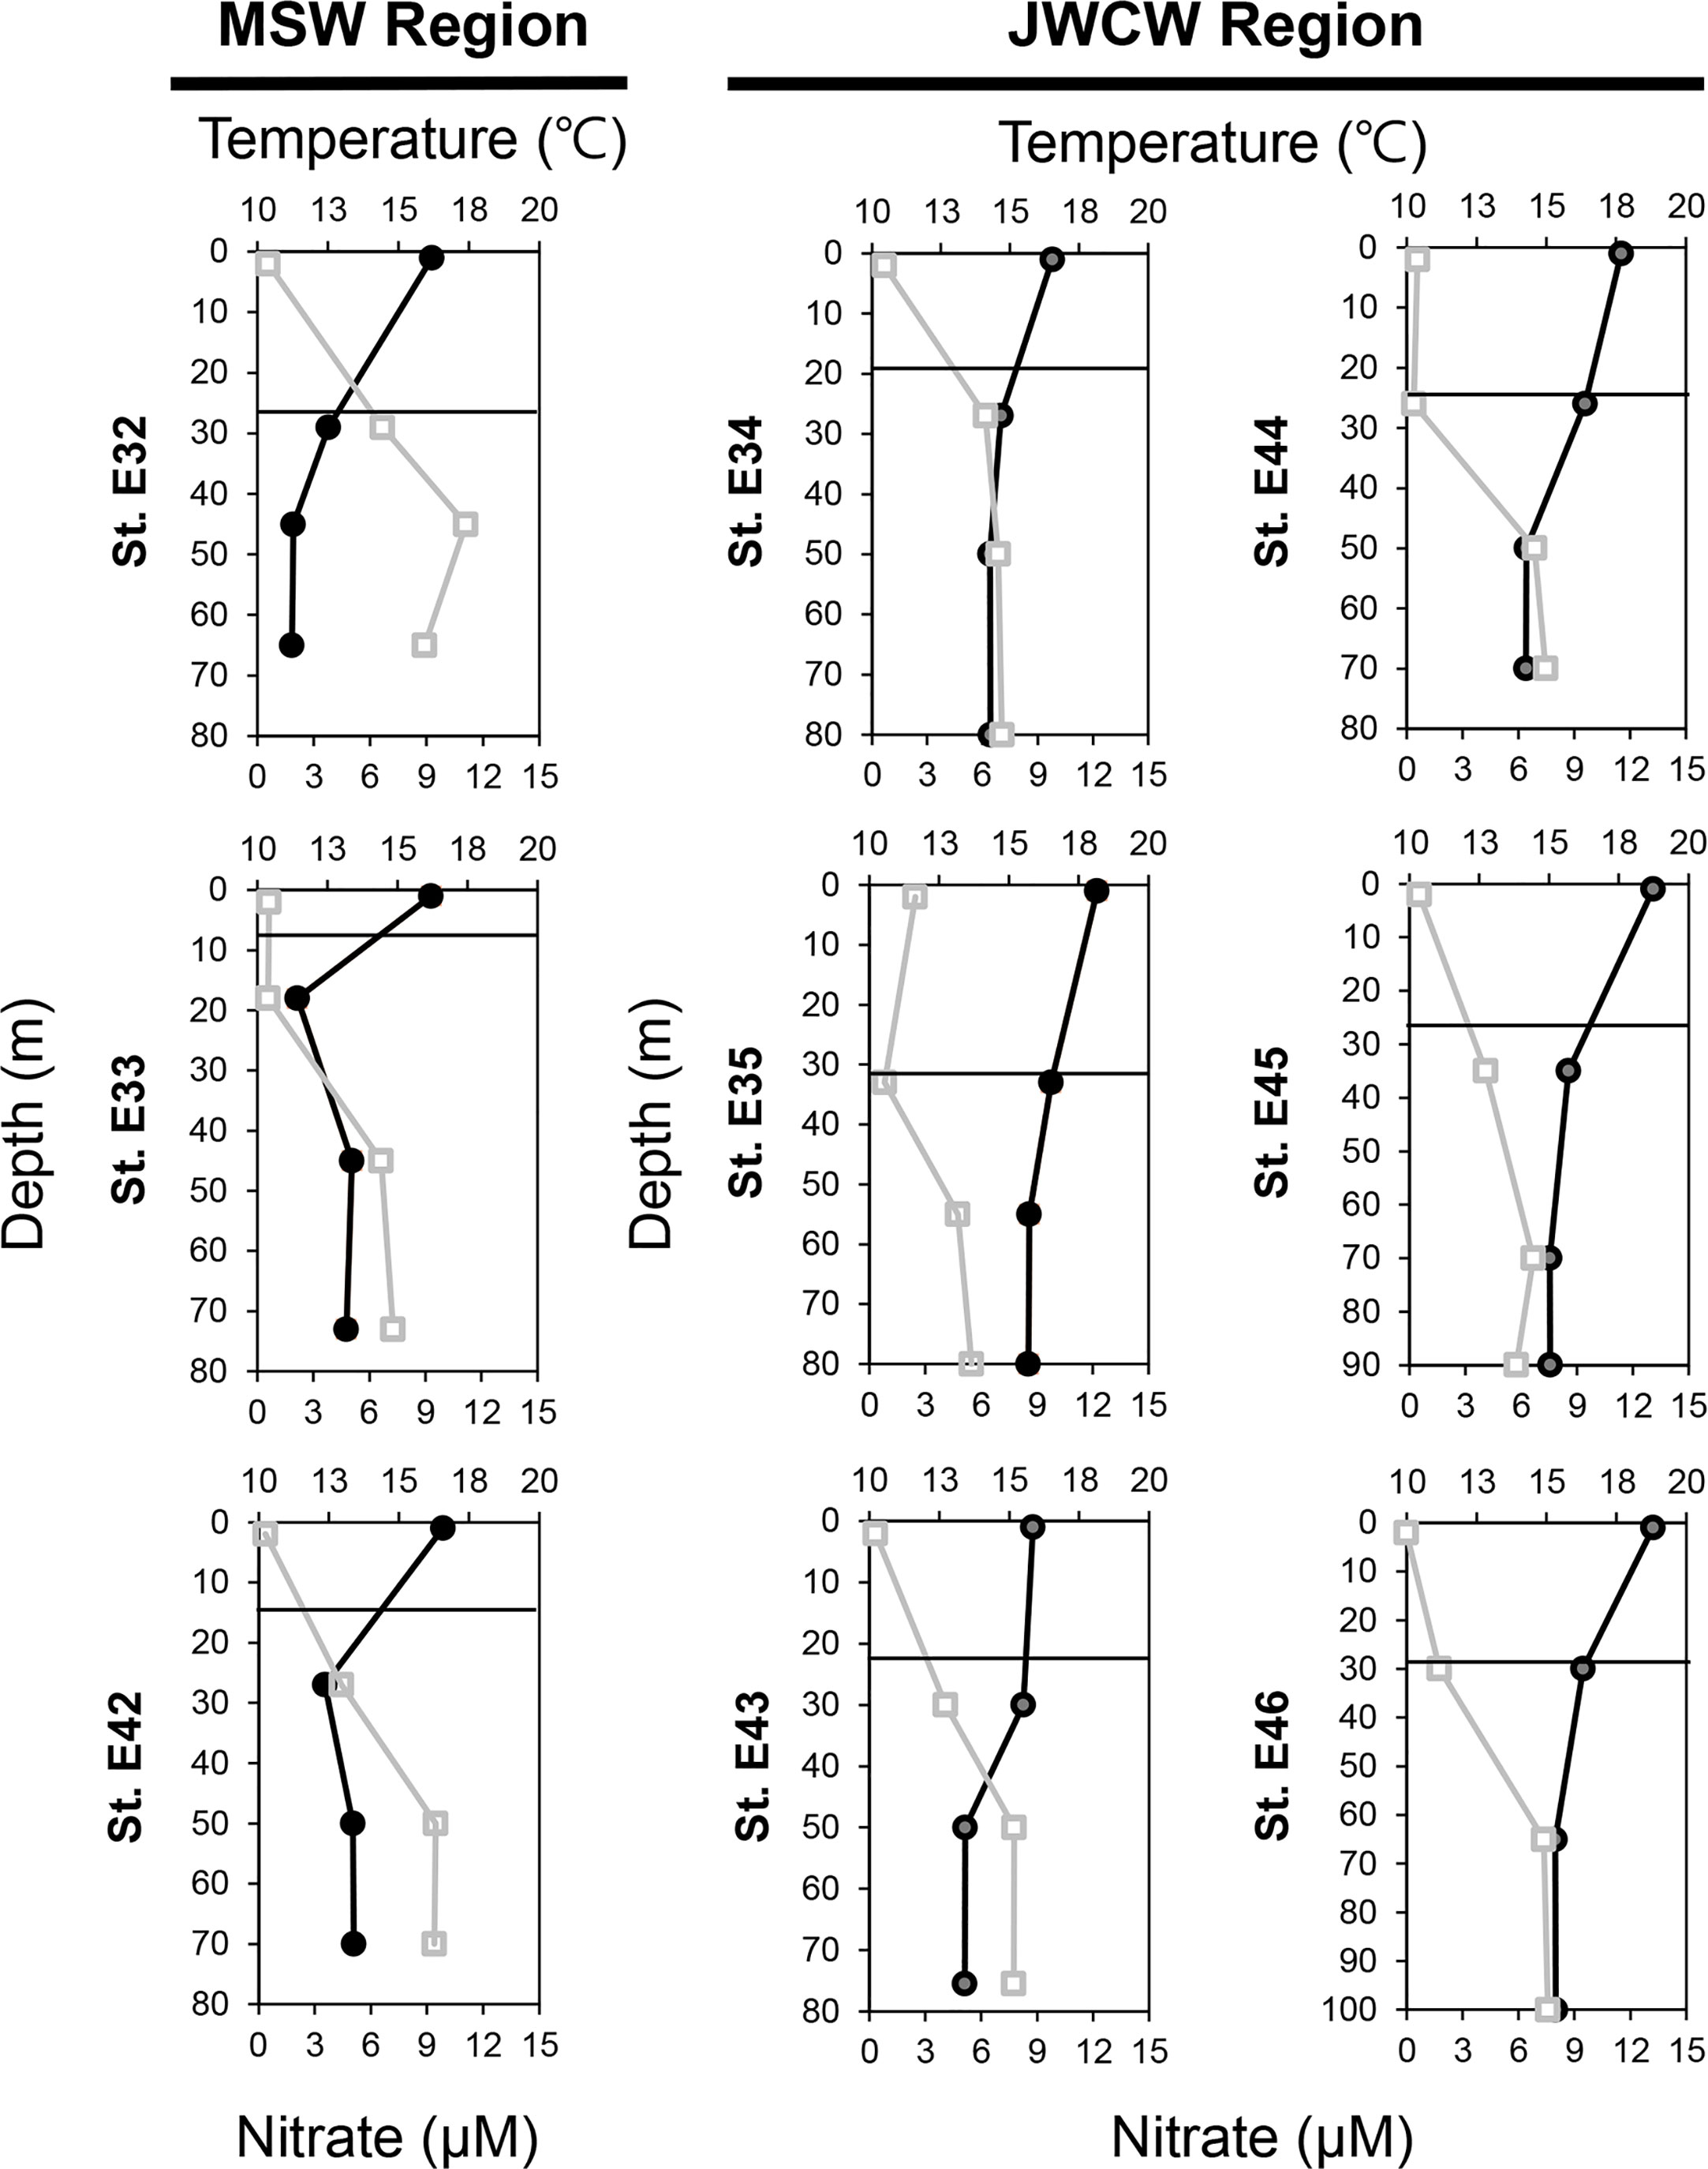
Figure 4 Vertical distribution of temperature (upper axis, closed circles, °C) and nitrate + nitrite concentrations (lower axis, open squares, µM) at the nine investigated stations. The y-axis indicates the depth (m), and the solid lines represent the thermocline layers.
Mean concentrations of individual nutrients, including NO3 + NO2, NH4, PO4, and Si[OH]4, were not remarkably different between the MSW and JWCW regions (Table 1). However, the average Si:P and Si:N ratios in the surface and DCM layers of the MSW region were generally greater than those in the JWCW region. In particular, the comparison of Si:P ratios in both the surface and DCM layers was close to statistical significance (t-test, both p < 0.06), indicating a relatively greater nutrient imbalance in the MSW region. Notably, the N:P ratios in the surface and DCM layers were not different between the two regions.
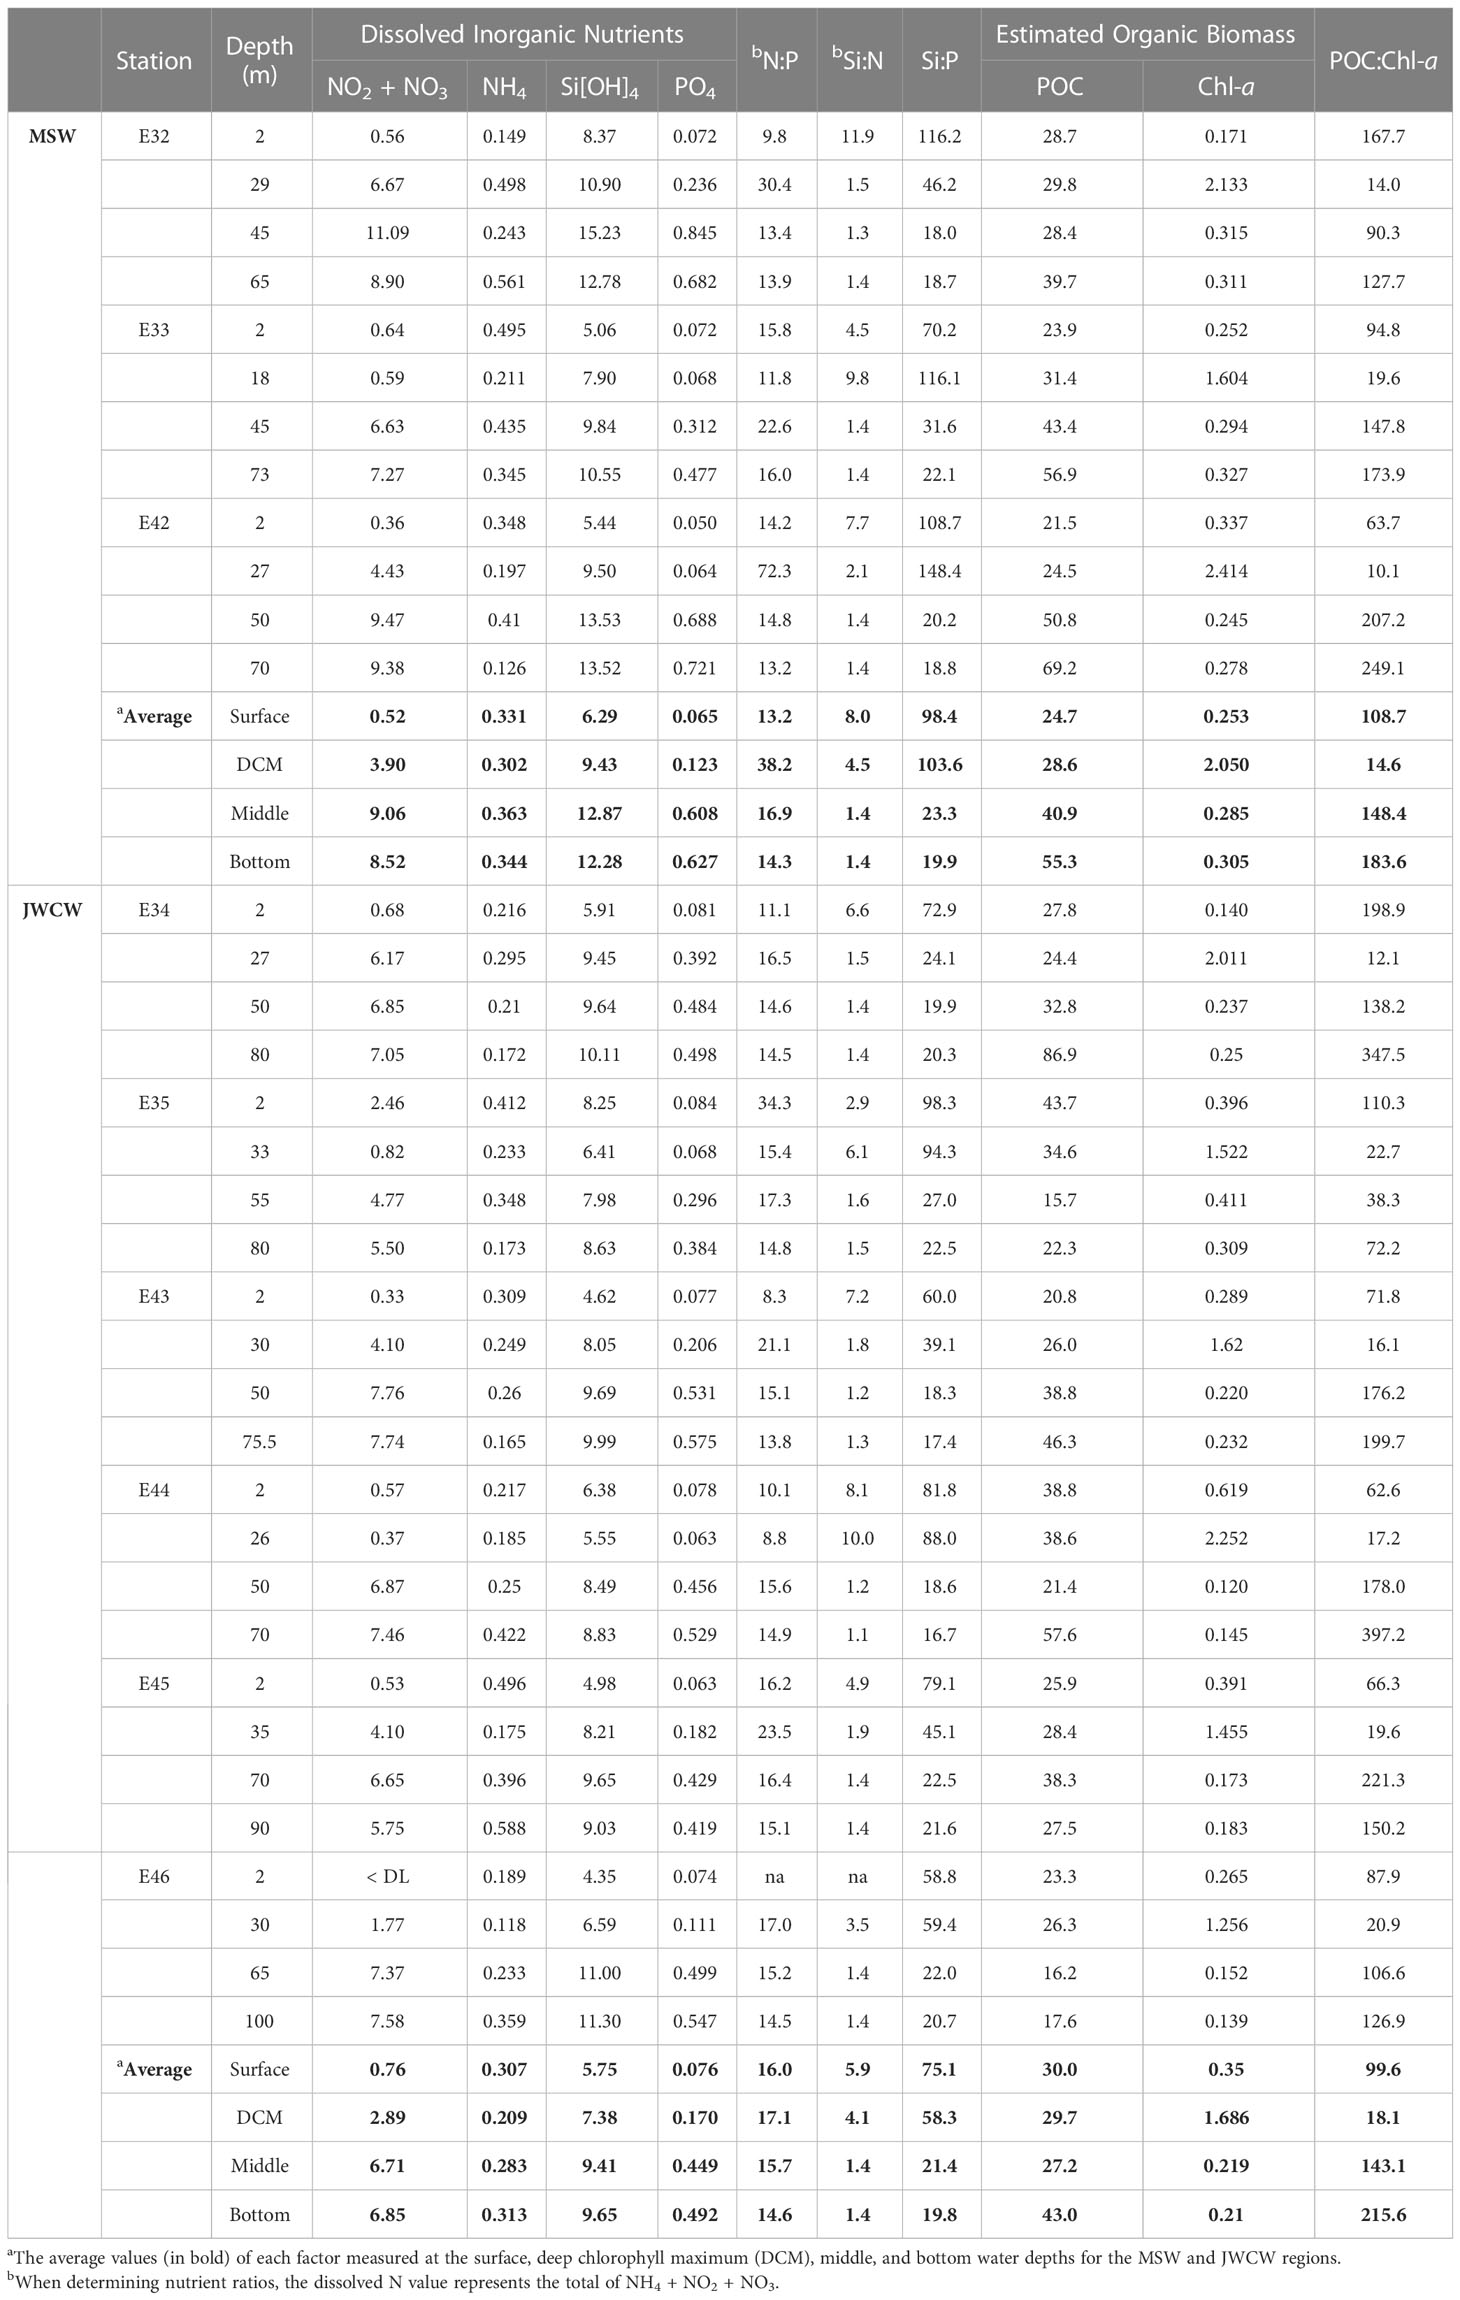
Table 1 Concentrations of dissolved inorganic nutrients (µM)—nitrate + nitrite (NO2 + NO3), ammonium (NH4), silicate (Si[OH]4), and phosphate (PO4)—and organic biomass estimates using particulate organic carbon (POC, µg L-1) and chlorophyll fluorescence (Chl-a, µg L-1) in the vertical layers at stations affected by the cool and less saline Mixed Shelf Water (MSW) in the northwest and the warm and saline Jeju Warm Current Water (JWCW) in the southeast regions during the period of May 16–18th, 2022 (DL, detection limit; na, not available).
In the vertical analysis of water characteristics, the mean depth of the DCM layer in the MSW (24.7 ± 5.9 m) was slightly shallower than that in the JWCW region (30.2 ± 3.4 m; t-test, p < 0.06), but the mean depths of the thermocline layers were similar in the MSW (18.4 ± 5.9 m) and JWCW (26.7 ± 3.4 m) regions (t-test, p > 0.1; Figure 4 and Table 1). The average water temperature difference between the surface layer and the DCM layer was 4.2°C and 1.8°C in the MSW and JWCW regions, respectively, indicating a relatively stronger degree of stratification in the former (t-test, p < 0.05). The average nitrate + nitrite concentrations in the surface and DCM layers in the MSW region were 0.52 µM and 3.9 µM, respectively, while the difference in the average nitrate + nitrite concentrations between the surface (0.76 µM) and the DCM (2.89 µM) layers in the JWCW region was slightly smaller.
3.3 Spatial and vertical distribution of biological properties
The concentrations of Chl-a in the surface layer at stations within the MSW regions ranged from 0.171 to 0.337 µg L-1 and were not significantly different from those of the JWCW region, which ranged from 0.14 to 0.619 µg L-1 (Table 1). Similarly, Chl-a concentrations at the depth of the DCM layers did not differ between the MSW (1.604–2.414 µg L-1) and the JWCW (1.256–2.252 µg L-1) regions. Furthermore, the concentrations of POC in the surface and DCM layers of the MSW region ranged from 21.5 to 28.7 and 24.5 to 29.8 µg L-1, respectively, and those in the JWCW region ranged from 20.8 to 43.7 and 24.4 to 38.6 µg L-1, respectively, showing no significant difference. While there was no difference between the two regions in POC:Chl-a ratios, which serve as an indicator of the relative amount of phytoplankton in the total particulate organic matter, the average values observed in the DCM layer were noticeably lower than those observed at other depths.
3.4 Protistan community structures
To understand the taxonomic structures of the protistan communities, DNA metabarcoding and cell count data collected at the depth of DCM layers were analyzed (Figure 5 and Table 2). We obtained an average of 81,351 reads (SD = 5,236) per station from the 18S rRNA gene sequencing. When the samples were normalized, the number of reads and ASVs per station were 45,898 and 1,486, respectively. Overall, 1,486 ASVs were annotated, comprising 47 classes, 78 orders, 167 families, and 244 species (Supplementary Table 1). Taxonomic assignment inferred from the V4 region of the 18S rRNA amplicon sequencing revealed the relative dominance of Syndiniales across both regions (Figure 5A). Dinoflagellata was the second most abundant group in the JWCW region (33 ± 7% of protistan reads), almost comparable to Syndiniales, while their relative abundance in the MSW region was comparatively small (19 ± 7%). Chlorophyta, consisting mostly of picoeukaryotic taxa, accounted for higher proportions of reads in the MSW region (20 ± 13%) than in the JWCW region (2 ± 1%). In addition, although the relative abundance of Cryptophyta was not remarkable, they were ubiquitous in the study region, showing a slightly higher tendency in the MSW region, and Ochrophyta, which is mostly composed of diatoms, showed a noticeable abundance at station E32 in the MSW region.
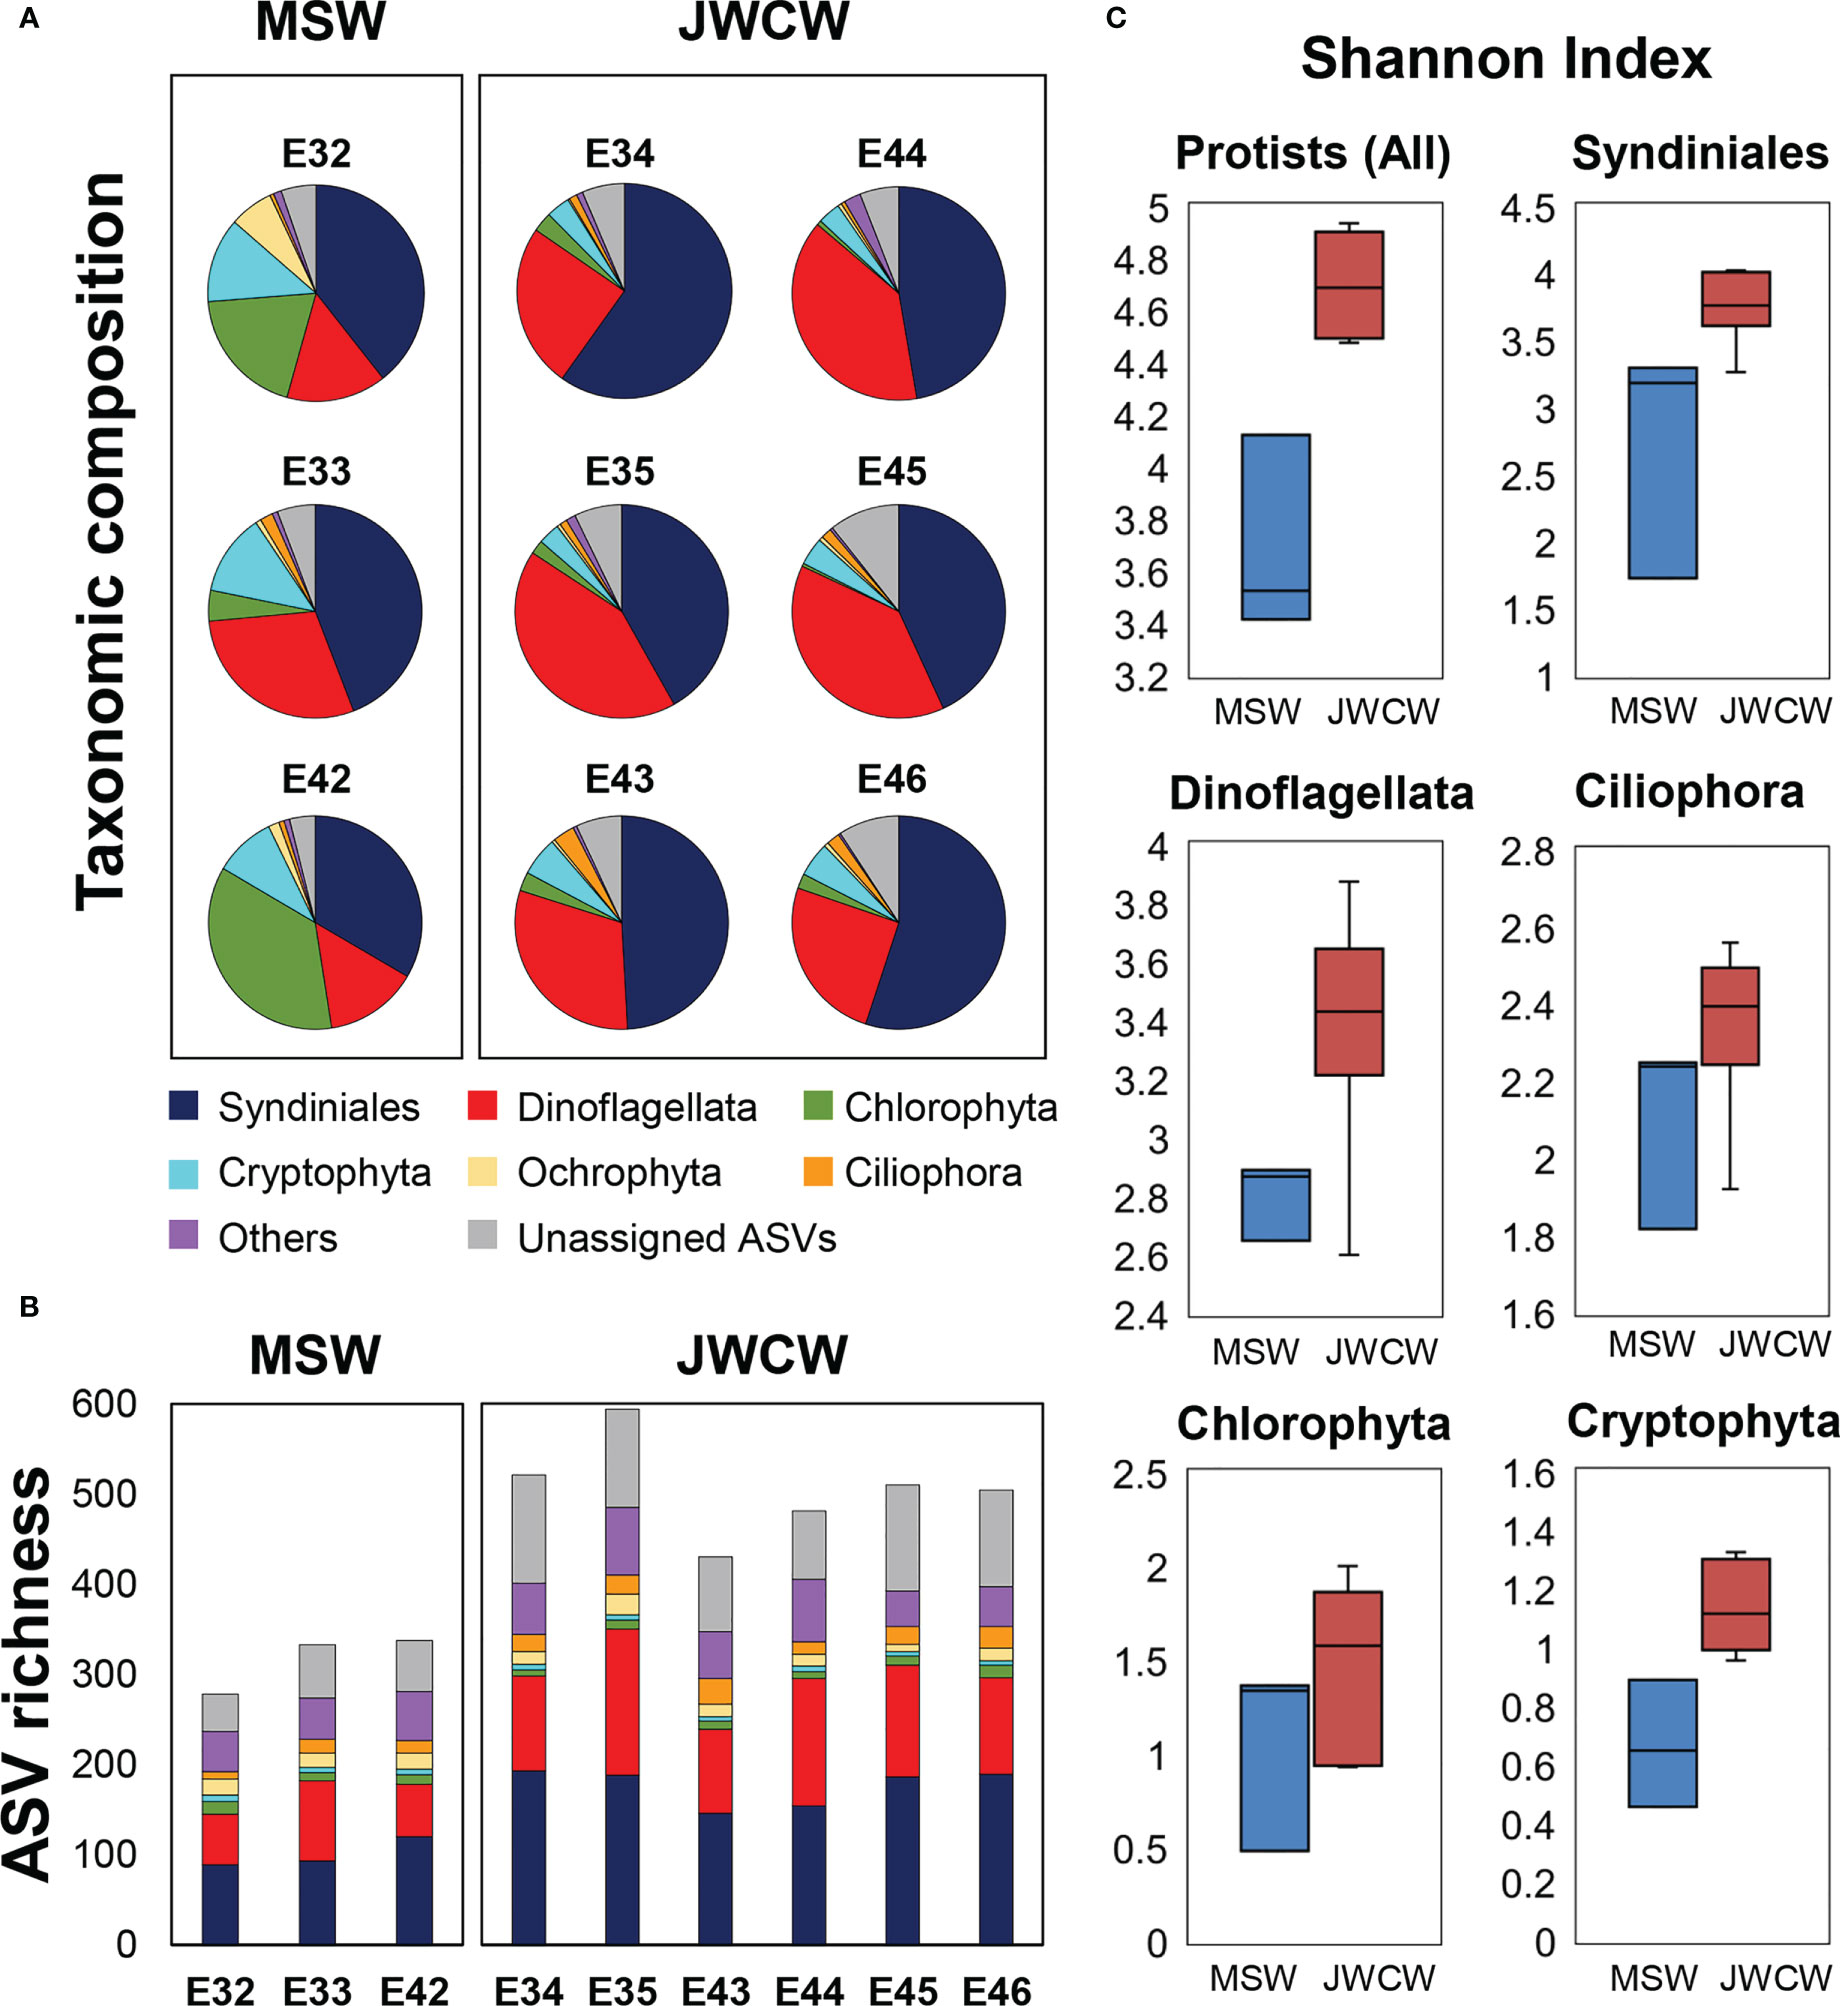
Figure 5 Protistan communities, grouped into higher ranked taxonomic groups, at the stations within the Mixed Shelf Water (MSW) and Jeju Warm Current Water (JWCW) regions, based on 18S ribosomal RNA gene amplicon sequencing data. (A) Relative abundances of taxa based on read counts. (B) Species richness based on the number of amplicon sequence variants (ASVs). (C) Box and whisker plots of alpha diversity, as expressed by the Shannon index.
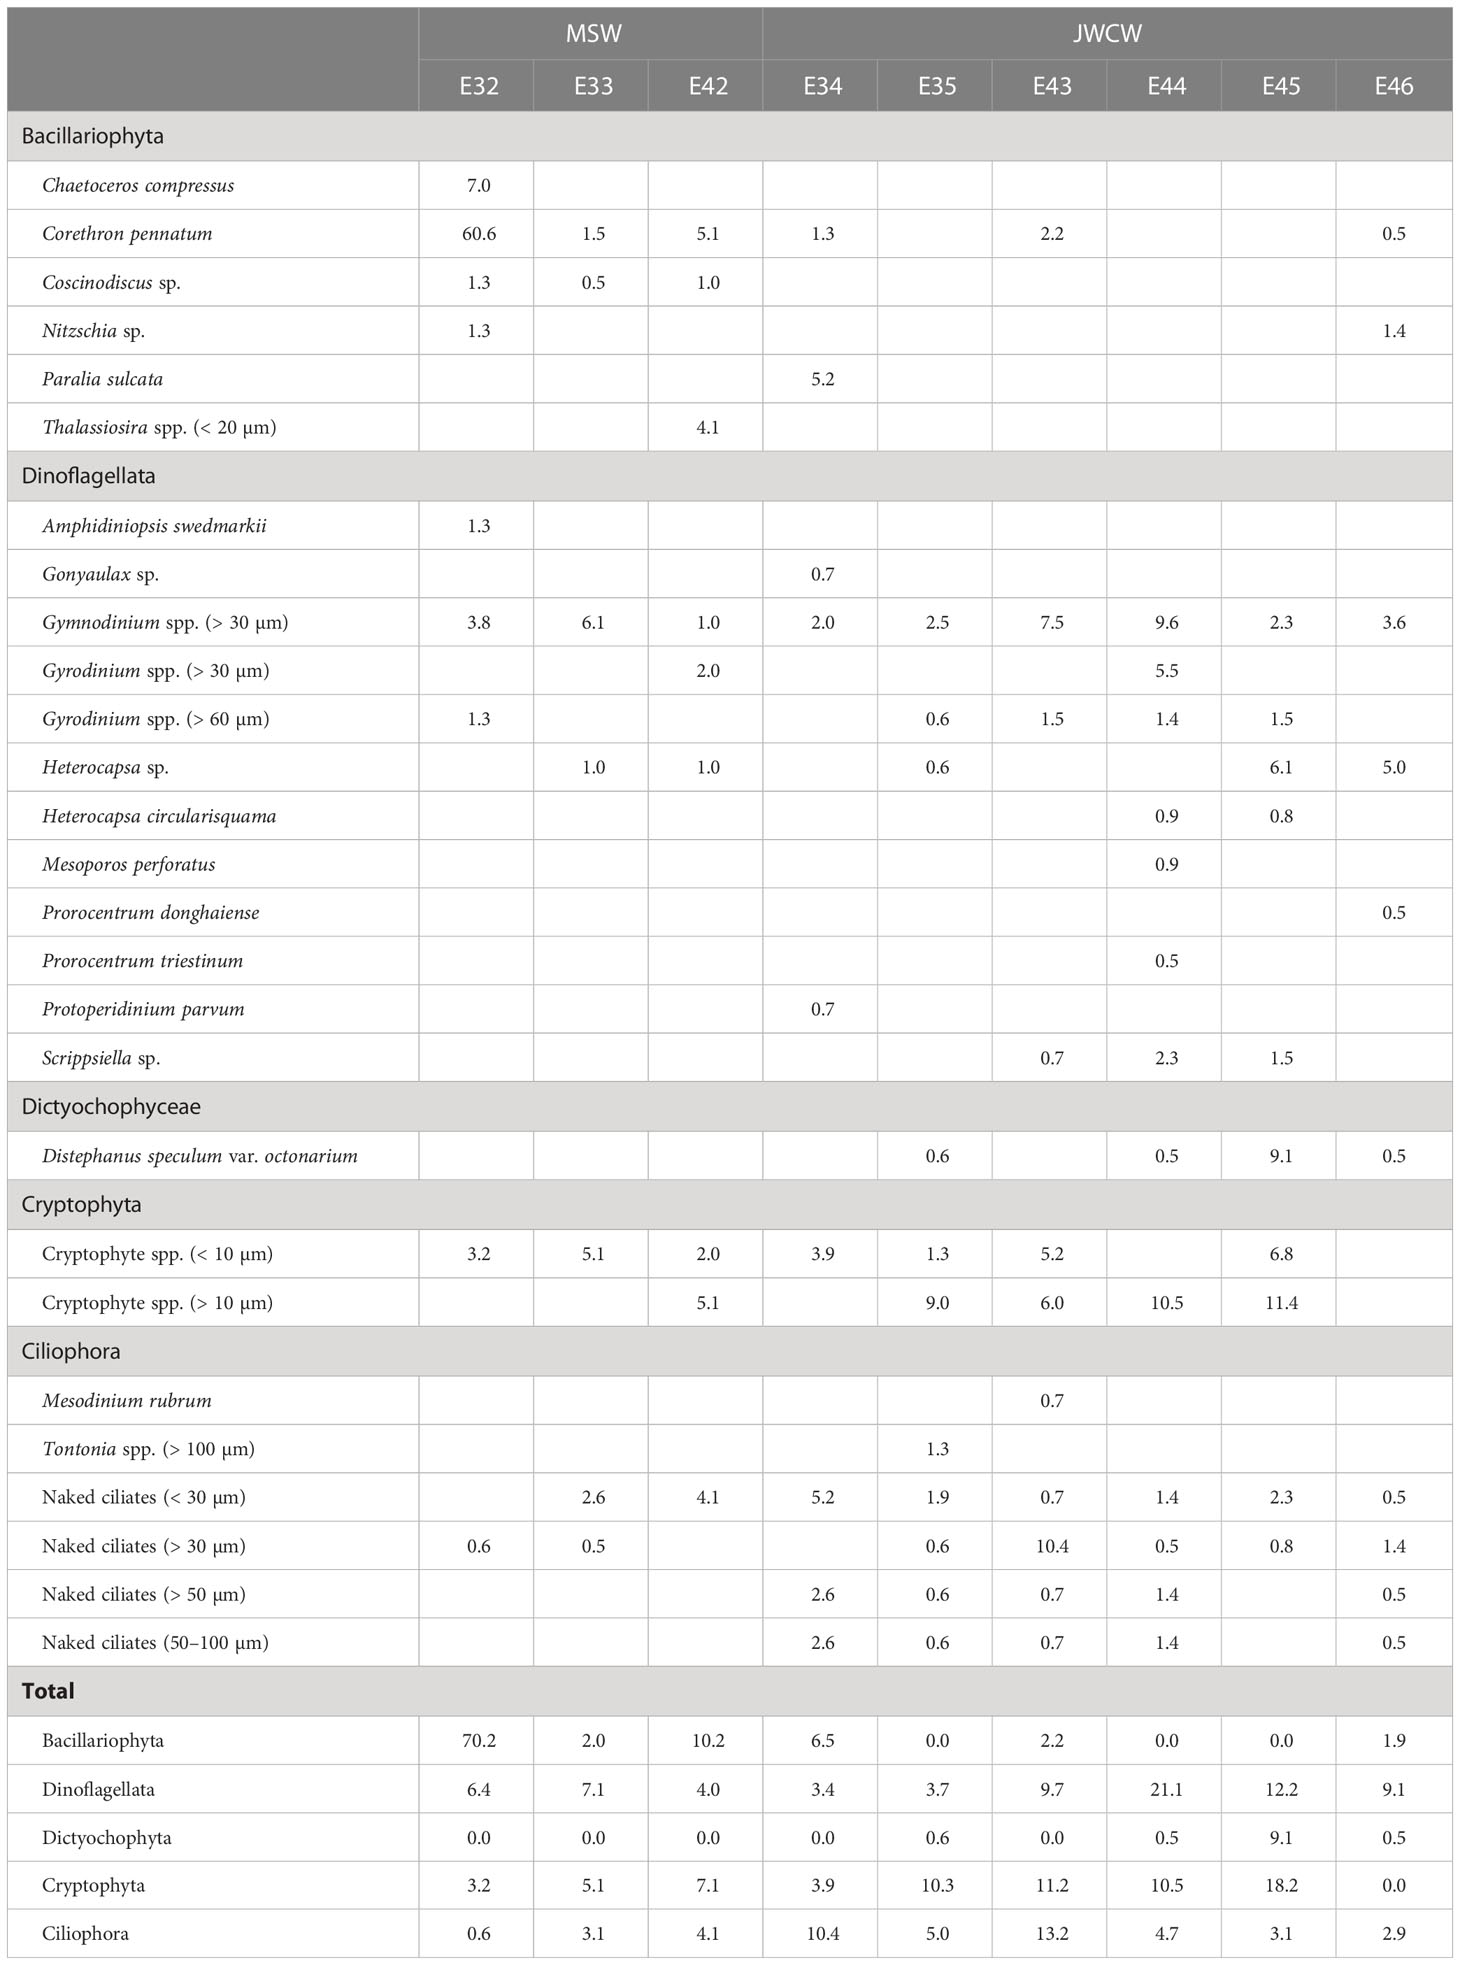
Table 2 Cell abundances (cells mL-1) of protistan taxa measured at stations located in the Mixed Shelf Water (MSW) and Jeju Warm Current Water (JWCW) regions during the period of May 16–18th, 2022.
The species richness at the whole protistan level, inferred by the number of ASVs, was significantly higher in the JWCW region than in the MSW region (t-test, p < 0.01, Figure 5B). Although the ASV richness for each taxonomic group accounted for similar proportions of the total richness as their relative abundances did in the taxonomic composition data, the ASV richness of taxa categorized as “Others” exhibited a higher proportion than would be expected based on their relative abundance. The Shannon index, based on the ASVs, revealed significantly higher diversity in the JWCW region (t-test, p < 0.01, Figure 5C). Also, after grouping the ASVs into the major taxonomic groups, all of the community diversity measures within these groups were higher in the JWCW region, with their mean values in the JWCW region in the descending order of Syndiniales, Dinoflagellata, Ciliophora, Chlorophyta, and Cryptophyta. In addition to the alpha diversity findings, the results of the beta diversity analysis, which were based on an NMDS conducted to compare the protistan ASV communities between the MSW and JWCW regions (Figure 6), showed stations clearly spatially clustered according to region. Furthermore, the NMDS revealed that ammonium and Chl-a concentrations and the Si:P ratio correlated more with the MSW region, whereas water density (i.e., temperature and salinity) and the POC:Chl-a ratio correlated more with the JWCW region. The ANOSIM analysis confirmed a significant dissimilarity in protistan communities between the two regions (R = 0.79; p < 0.05).
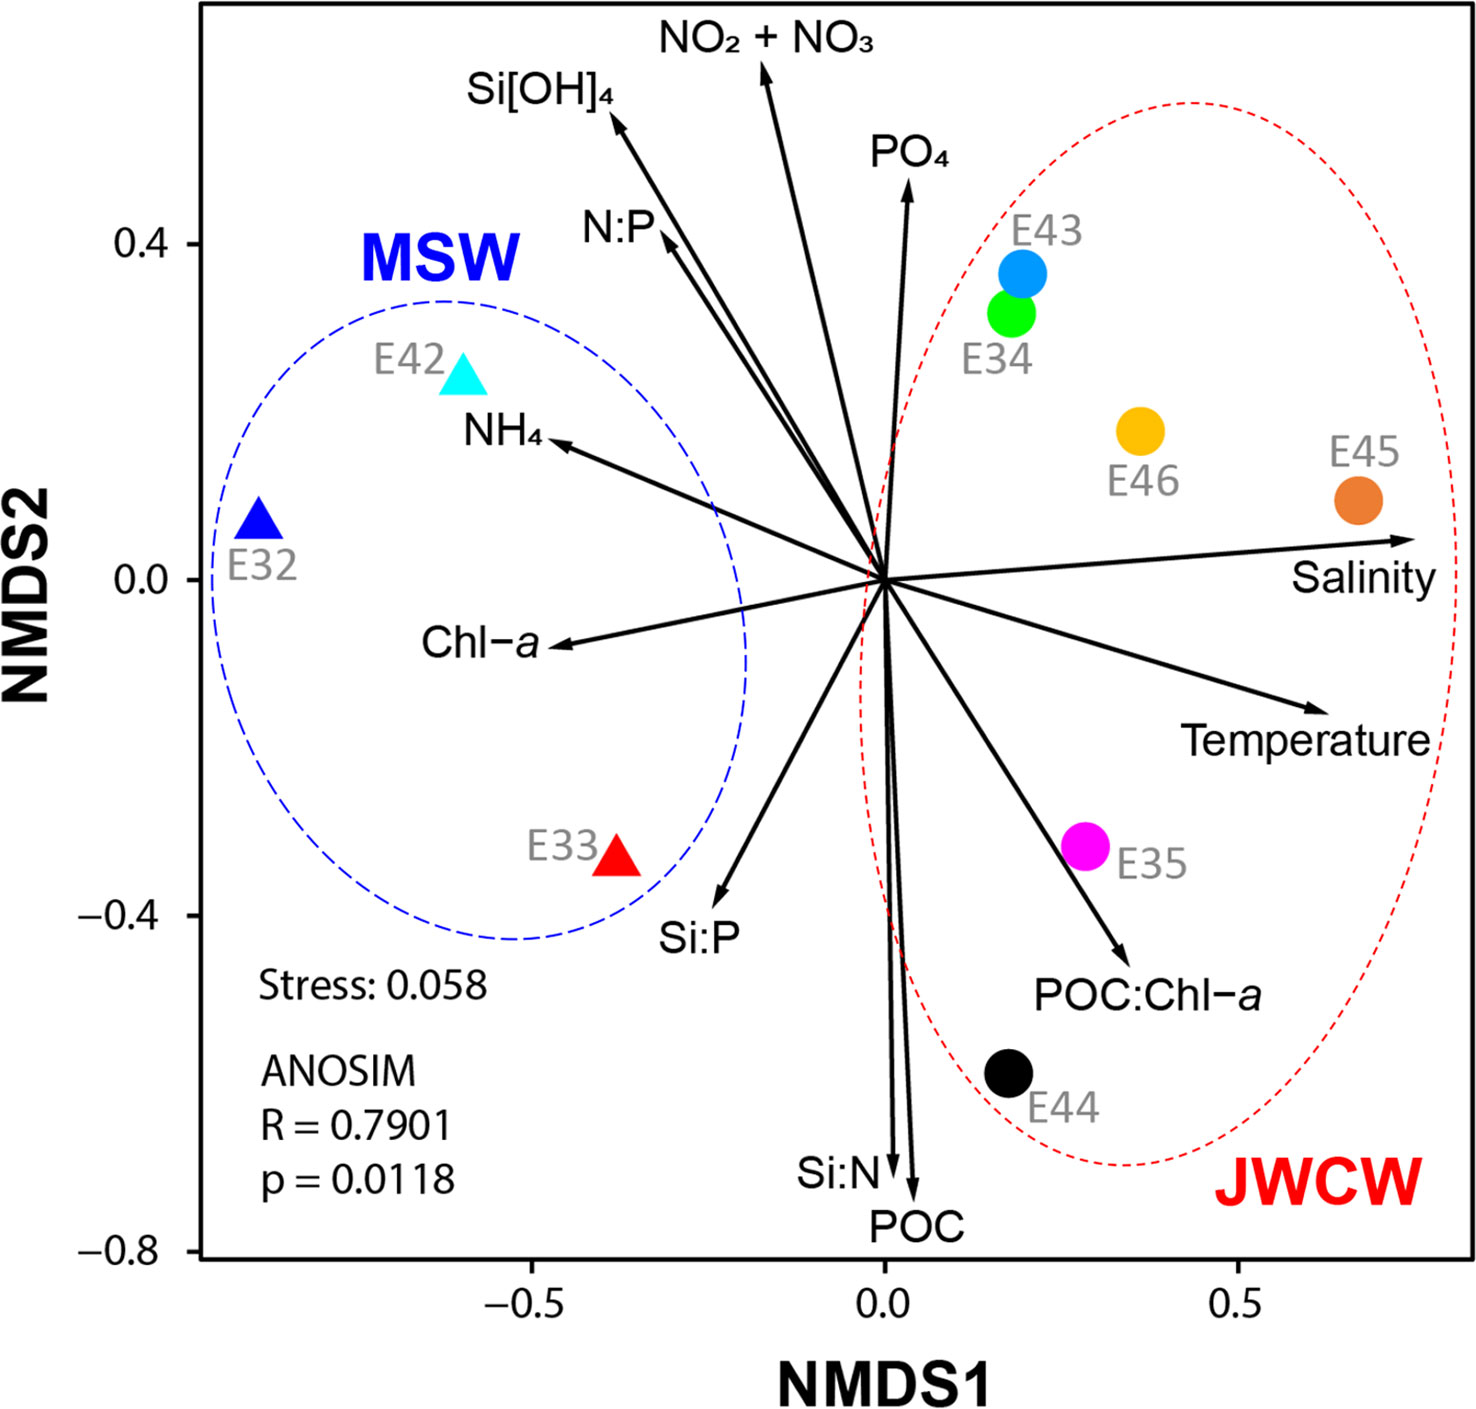
Figure 6 Non-metric multidimensional scaling (NMDS) of the protistan communities in the northeastern East China Sea. Samples were classified based on the stations at which they were collected: Mixed Shelf Water (MSW, triangles) and Jeju Warm Current Water (JWCW, circles) region stations. Vectors depict the relative directions and magnitudes of various oceanographic variables’ contributions to the dissimilarities among samples. The NMDS (stress = 0.058) was conducted using protist composition data obtained from DNA metabarcoding (V4 region of 18S rRNA gene) sequencing reads.
Further quantification of the protistan taxa was conducted through the analysis of cell counts based on light microscopy (Table 2). In general, a high average cell abundance of Bacillariophyta (diatoms) was observed in the MSW region (27.5 ± 37.2 cells mL-1) while their average abundance was low in the JWCW region (1.8 ± 2.5 cells mL-1). The diatom species Corethron pennatum was present at an especially high cell density of 60.6 cells mL-1 at station E32 in the MSW region. In addition, Coscinodiscus sp. was only observed at the three stations in the MSW region. The average cell density of dinoflagellates in the MSW region was 5.8 ± 1.6 cells mL-1, and was relatively high, at 9.9 ± 6.5 cells mL-1, in the JWCW region. In particular, dinoflagellate species in the genus Gymnodinium were present with the highest cell densities throughout the surveyed stations, but species in the second most abundant genus, Gyrodinium, were present mainly at stations in the JWCW region. In addition, several dinoflagellate species were found at stations E44 and E45 in the JWCW region. The silicoflagellate Distephanus speculum var. octonarium was present at many stations in the JWCW region, and unidentified cryptophyte species were commonly present across most of the surveyed stations in both regions. Finally, many unidentified naked ciliate species were commonly distributed in the JWCW region, while only small-sized naked ciliates (< 50 µm) were found in the MSW region (Table 2).
3.5 Differential distribution of dinoflagellate ASVs between the two regions
To better understand the distribution of dinoflagellates, which account for a high proportion across the investigated stations, we further compared their communities between the stations in the MSW and JWCW regions. Out of the 354 ASVs identified across all the stations, 101 (29%) were present in both regions, whereas 37 (10%) and 216 (61%) ASVs were exclusively found in the MSW and JWCW regions, respectively (Supplementary Figure 3). Many ASVs were annotated as an unclear taxonomic group within the dinoflagellates (i.e., Dinophyceae_XXX_sp.). As noted, over half were exclusively found in a specific region (Supplementary Table 2). For example, Alexandrium spp., Amphidoma languida, Azadinium spp., Brachidinium capitatum, Ensiculifera imariensis, Erythropsidinium agile, Gonyaulax polygramma, Margalefidinium fulvescens, Warnowia sp., and Zooxanthella nutricula were species only identified at stations of the JWCW region. Of the seed populations of the dinoflagellates found in this study, several represented harmful species (Figure 7). Their relative abundances among stations and the read numbers present at each station indicated that these harmful species are mostly specific to the JWCW region.
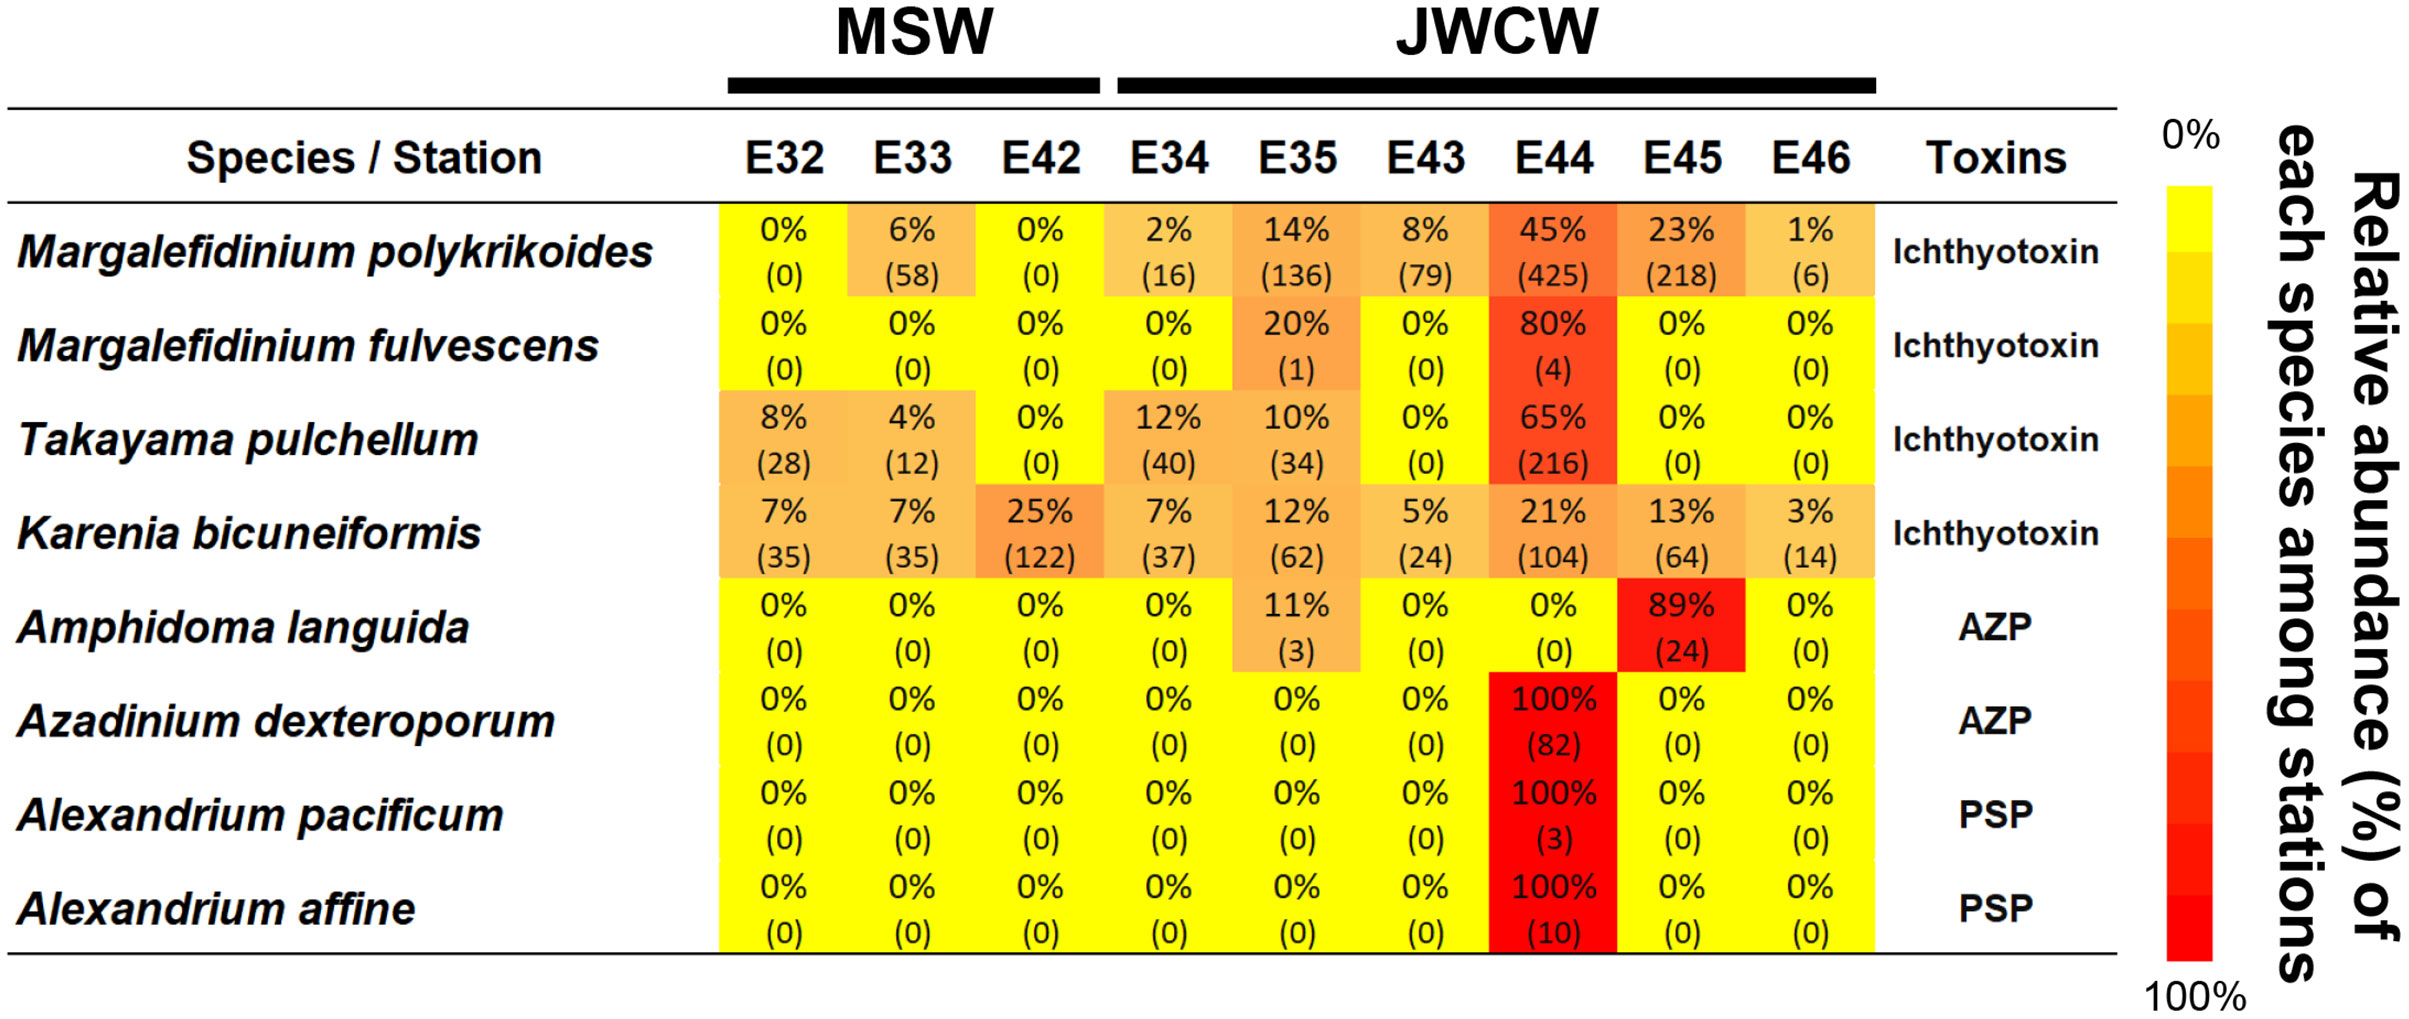
Figure 7 Harmful dinoflagellate species detected at the surveyed stations in the northeastern East China Sea in the late spring of 2022 (AZP, Azaspiracid shellfish poisoning; PSP, Paralytic shellfish poisoning). The heatmap is derived from the relative abundance data (%) of the metabarcoding analysis, with the numbers in parentheses indicating the actual numbers of sequencing reads recorded at each station.
4 Discussion
4.1 Oceanographic variability of the northeastern East China Sea in late spring
The northeastern East China Sea, especially to the west of Jeju Island, is affected by the JWCW throughout the year and shows a distinct seasonal change in water masses (Lie et al., 2000; Lie et al., 2015; Park et al., 2017; Kang and Moon, 2022). To reveal how the structures of the protistan communities of the northeastern East China Sea relate to water characteristics in the late spring season, we first investigated the spatial and vertical characteristics of the water masses that dynamically affect oceanographic variables in the region. During our survey period in mid-May 2022, the low salinity (~32 psu) of water observed at the westernmost stations is considered to be the effect of the Changjiang Diluted Water and Yellow Sea surface water, while the saline water (> 33.5 psu) at the eastern stations clearly appears to be affected by the Kuroshio branch current water, the JWCW (Lie et al., 2000; Yoo et al., 2023). While we have extensively investigated the water column in the spring season, the satellite-derived data and previous references suggest that this region has a stronger thermohaline front in the winter season that continued into our observation period (Lie, 1985; Lie et al., 2000; Lie et al., 2015). Furthermore, the water temperature inversion (i.e., a higher temperature at a deeper depth) observed during our survey has also been reported in the spring and summer seasons, and the formation of the thermohaline front is generally explained as one of the main reasons for this occurrence (Kim, 2020; Kang and Moon, 2022; Kim et al., 2022; Yoo et al., 2023). In addition, the monthly distributions of SSTs and Chl-a and POC concentrations derived from the satellite data revealed intricate seasonal changes in hydrographic conditions and the corresponding dynamics of planktonic biomass in the northeastern East China Sea. These findings suggest that it is necessary to conduct further research into future environmental changes and seasonal oceanographic variations with a focus on the MSW and JWCW regions.
The range of nutrient concentrations measured in our study generally overlapped with those of other studies observed in May in the same region during other years (Wang et al., 2003; Kim et al., 2006; Kim et al., 2009). However, considering the Redfield-Brzezinski ratios (i.e., C:Si:N:P = 106:15:16:1 from Redfield, 1934; Redfield, 1958, and Brzezinski, 1985), the relatively low absolute concentrations of N and P in the surface and DCM layers do not correspond with the high Si concentrations seen during the surveyed period. It is noteworthy that no significant deviations from the Redfield ratio were observed in the N:P ratios across all surveyed depth layers, indicating a deficiency of both N and P relative to Si in the northeastern East China Sea during the study period. Despite the East China Sea being generally recognized as a P-limited region (Wong et al., 1998; Huang et al., 2019), the investigated region did not reveal any deficiency in P compared to N. Water masses originating from Chinese rivers are known to significantly increase the N:P ratio (Wang et al., 2003; Huang et al., 2019). Furthermore, other studies have shown that the N:P ratio stabilizes rapidly as one moves away from the Chinese coast towards the northeastern region, particularly in dry (i.e., non-summer) seasons (Wang et al., 2003; Kim et al., 2006). Additionally, the higher ratios of Si:N and Si:P in the MSW region suggest a greater nutrient imbalance than in the JWCW region, which may be attributed to the still relatively higher concentration of silicates in the MSW region, in contrast to the almost depleted N and P, before high amounts of N- and P-rich water originating from Chinese rivers is transported to the MSW region in the wet, summer season. This finding is consistent with other studies in the region (Wang et al., 2003; Kim et al., 2006), and may be a significant contributing factor in determining the differing structures of protistan communities in these regions during late spring.
4.2 Spatial and vertical distribution of biological properties
Our study revealed that the potential organic biomass (i.e., Chl-a and POC) did not exhibit noticeable differences between the MSW and JWCW regions. Other studies within the same study region in May have reported surface Chl-a concentrations of less than 1 µg L-1, and our observed values were consistently within that range, all showing no significant difference between regions (Oh et al., 1999; Kim et al., 2009). Furthermore, other studies conducted during May found no significant differences in POC concentrations between the MSW and JWCW regions (Kim et al., 2009; Son et al., 2010). However, POC concentrations in both regions exhibited a seasonal pattern of rapid decrease during the spring bloom to summer period (Kim et al., 2009; Son et al., 2010), which is consistent with our satellite-based analysis data. In the northeastern East China Sea, particularly to the west of Jeju Island, May typically shows low biological activity within the waters in a seasonal context, immediately following the occurrence of the spring bloom (Furuya et al., 2003; Choi et al., 2018). Therefore, our investigation did not reveal any significant differences in estimated protist biomass at the scale of our study region because biomass, in general, was not particularly high. Although neither Chl-a nor POC concentrations reflected any differences in water-mass characteristics from a biomass perspective, the following section (section 4.3) discusses whether the protist community structures differed. In addition, the POC to Chl-a ratios were remarkably low in the DCM layers compared to the surface and deeper layers, suggesting that the communities in the DCM layers are generally composed of a high proportion of autotrophic plankton, instead of heterotrophic protists.
4.3 Protistan community structures
The rarefaction curves computed for each metabarcoding sample reached saturation, and the slopes of the curves at their endpoints ranged from 0 to 0.001 (Supplementary Figure 2), suggesting that the sequencing depth was sufficient for estimating the protistan communities in the samples. Furthermore, the interpretations derived from DNA metabarcoding are corroborated by the morphological identification and quantitative cell counts of the dominant protistan genera using light microscopy. Although a statistical correlation between the cell abundances determined by light microscopy and gene amplicon read counts could not be established, possibly due to the low cell abundances common in the offshore Lugol’s-fixed samples, the results from both methods exhibited similar biomass trends. This was especially evident in cases where cell abundances were relatively high, as observed with Corethron sp. and the cryptophyte species.
Despite no significant difference in nutrient concentrations observed between the two investigated regions, and considering that the Kuroshio branch current water (JWCW) is generally oligotrophic, the relatively higher proportions of the dinoflagellates in the nutrient-poor JWCW region may be explained by their diverse nutrient uptake abilities (i.e., mixotrophic or heterotrophic in addition to autotrophic), which could be advantageous in environments with limited nutrient availability (Jang et al., 2016; Jang and Jeong, 2020; Jeong et al., 2021). The accuracy of estimating cell abundances via metabarcoding in protists can be compromised due to variations in the number of 18S rRNA gene copies per species resulting from differences in their genome sizes (Gong and Marchetti, 2019). Despite this limitation, our study discovered that utilizing the metabarcoding approach was a highly effective means of gaining insights into the relative dynamics of protists. For example, it facilitated the detection of patterns in the populations of Chlorophyta and parasite Syndiniales, which are challenging to discern using conventional morphological assessments due to their delicate cellular structure and small size. Additionally, both high read abundances and ASV richnesses of Syndiniales parasites have commonly been reported in offshore metabarcoding samples (Egge et al., 2021; Käse et al., 2021; Rizos et al., 2023). This highlights their unknown genetic diversity and raises questions regarding their specific ecological niches within marine ecosystems. Furthermore, although their rRNA gene copies were low in number (Zhu et al., 2005; Gong and Marchetti, 2019), it is noteworthy that there were significant read abundances of small cell-sized groups such as Chlorophyta and Cryptophyta across all surveyed stations. In particular, the high read abundances of picoeukaryotic Chlorophyta in the MSW region could be primarily attributed to their small size, which confers an advantage in nutrient acquisition (Raven, 1986). However, this abundance could also result from a confluence of various oceanographic factors specific to the MSW region. In both the cell count and DNA metabarcoding data, the abundances of diatom species were higher in the MSW region. In particular, those of the genus Corethron were observed to have a density as high as 60.6 cells mL-1. When considering the relatively sufficient concentration of silicates in the MSW region, which is even higher than the half-saturation constants for silicate uptake by many diatom species, the silicate-rich nutrient stoichiometry of the water could potentially benefit fast-growing diatoms (Guillard et al., 1973; Paasche, 1973; Paasche, 1975; Tilman and Kilham, 1976). Additionally, it is worth noting that species of the large diatom genus Corethron generally dwell in cold water and employ a strategy of dominating the oligotrophic assemblages by exploiting deep-water nutrients in stratified waters through vertical migration facilitated by controlling their buoyancy (Leventer et al., 2002; Zúñiga et al., 2021). This could partially explain their prevalence at the MSW region stations, where the waters are relatively cold and more vertically stratified.
The species richness at the stations affected by the inflowing Kuroshio branch current water (the JWCW) was remarkably higher, suggesting that this water mass can increase the protistan taxonomic diversity of the northeastern East China Sea during the spring season. In both the cell count and metabarcoding data, not only was the abundance of dinoflagellates higher in the JWCW region but so too was the number of dinoflagellate species occurring. Among these species, many were known to cause harmful algal blooms; further discussion of this continues in the next section (section 4.4). In addition, not only the species richness but also the community diversity, as inferred by the Shannon alpha diversity index, was greater in the JWCW region across all categorized major taxonomic groups. These results provide evidence that the different water masses present in each region produced distinct impacts on the spatial distributions of protists that were similar across the major protistan taxon. Profound differences in the protistan community structures affected by different water masses were also demonstrated by the NMDS analysis. In particular, the results indicate that the communities of the MSW region could be dominated by taxa that have a high affinity for regenerated production, using nutrient sources such as ammonium and urea, in nutrient-imbalanced environments (i.e., those with a high Si:P ratio). In fact, the observed prevalence of picoeukaryotic Chlorophyta in the MSW region may be attributed to the tendency of small eukaryotes to preferentially assimilate ammonium, which provides a competitive edge in the acquisition of nitrogen (Le Bouteiller, 1986; Meyer et al., 2022). Conversely, the positive correlations between temperature/salinity and the protistan communities in JWCW samples show that the composition of these communities was influenced by the warm and saline Kuroshio branch current. Furthermore, the positive correlation between POC:Chl-a ratios and the JWCW communities, along with their negative correlation with Chl-a concentrations, suggest the possibility of a greater proportion of heterotrophic organisms within these communities.
4.4 The potential introduction of harmful species through the Kuroshio Current branch
The noticeably higher species richnesses and relative abundances of Dinoflagellata group taxa in the JWCW region may suggest that dinoflagellate species could be commonly introduced into the region from the Kuroshio Current via the Jeju Warm Current branch. In fact, a significant number of dinoflagellate ASVs identified in the JWCW region were discovered exclusively in that region, supporting a possible new introduction to the region. Many species of dinoflagellates are toxic and cause serious damage by creating harmful algal blooms (HABs) in coastal ocean waters (Smayda, 1997; Brand et al., 2012; Tillmann, 2018; Rolton et al., 2022). Among the seed populations of the HAB species found in this study, Alexandrium and Margalefidinium (= Cochlodinium) species, which are representative causes of severe red tide damage, have been commonly reported causing HABs in the Korean coastal water and the Yellow Sea (Matsuoka et al., 2010; Park et al., 2013; Gao et al., 2015; Jeong et al., 2017). In particular, the initial populations of M. polykrikoides have often been attributed to current-driven movement (Matsuoka et al., 2010; Park et al., 2014), and our results further corroborate the notion that harmful species infiltrate the region through the Kuroshio branch currents. Additionally, the harmful species Amphidoma languida, Azadinium dexteroporum, Karenia bicuneiformis, and Takayama pulchellum have not been previously detected in the waters off the Korean coast and in the Yellow Sea. Even if the absolute read numbers of these HAB species are generally not high, it is important to note that they can act as initial seed populations. Furthermore, this study has added several species to the checklist of HAB species discovered in the northeastern East China Sea region (Supplementary Table 3), which can provide a basis for understanding HAB issues during future ecological changes of the nearby coastal region. Overall, the identification of these species in the present study suggests the likelihood of other HAB species flowing into the region through the branches of the Kuroshio Current. Consequently, closely monitoring protist communities in this region holds critical significance, not only in terms of ecosystem research but also social and economic impacts.
5 Conclusion
To the best of our knowledge, this study is the first to employ a complementary approach of DNA metabarcoding and cell count methods to uncover the protistan communities in the spring season in the northeastern East China Sea, which is influenced by complex systems of ocean currents. The water masses in the region during May 2022 were clearly divided into two categories, one characterized by cold and low salinity water, the MSW, and the other by relatively warm and saline water, the JWCW. There was no difference in terms of planktonic biomass between the two regions, but the species richness and composition of the protistan communities exhibited significant differentiation. Specifically, a higher relative abundance of dinoflagellates was found in the JWCW, whereas diatom and picochlorophyte abundances in the MSW were remarkably greater. Furthermore, the higher species richness in the JWCW region suggests that this branch of the Kuroshio current can increase the protistan taxonomic diversity of the northeastern East China Sea during the late spring. Most importantly, we found new seed populations of harmful dinoflagellate species in the Kuroshio branch water mass, which may be seed introduction sources of toxic species that could further spread to the Yellow Sea and/or Korea Strait. In general, the results suggest that potential changes to the complex current systems of the region may, in turn, dramatically alter the structures of protistan communities.
Data availability statement
The datasets presented in this study can be found in the NCBI online repository under the accession numbers: PRJNA945263, SAMN33802727-SAMN33802735.
Author contributions
YHK, T-HK, B-JC, and SHJ designed the research and wrote the manuscript. YHK, HJS, HJY, M-YL, DY, and SHJ conducted the experiment and analyzed the data. All authors contributed to the article and approved the submitted version.
Funding
This work was supported by the Korea Institute of Marine Science & Technology (KIMST) funded by the Ministry of Oceans and Fisheries (No. RS-2023-00256330, Development of risk managing technology tackling ocean and fisheries crisis around Korean Peninsula by Kuroshio Current) and supported by the National Research Foundation of Korea (NRF) grant funded by the Korea government (MSIT) (Nos. 2022R1C1C1004755 and 2022M3I6A1085991) awarded to SHJ.
Acknowledgments
We would like to thank the captain and crew of the R/V Saedongbaek (Chonnam National University) and Ye Chan Park for their technical support, as well as to Wordvice (https://wordvice.com) for English language editing.
Conflict of interest
The authors declare that the research was conducted in the absence of any commercial or financial relationships that could be construed as a potential conflict of interest.
Publisher’s note
All claims expressed in this article are solely those of the authors and do not necessarily represent those of their affiliated organizations, or those of the publisher, the editors and the reviewers. Any product that may be evaluated in this article, or claim that may be made by its manufacturer, is not guaranteed or endorsed by the publisher.
Supplementary material
The Supplementary Material for this article can be found online at: https://www.frontiersin.org/articles/10.3389/fmars.2023.1192529/full#supplementary-material
References
Abad D., Albaina A., Aguirre M., Laza-Martínez A., Uriarte I., Iriarte A., et al. (2016). Is metabarcoding suitable for estuarine plankton monitoring? a comparative study with microscopy. Mar. Biol. 163, 1–13. doi: 10.1007/s00227-016-2920-0
Ahn Y. H., Shanmugam P., Ryu J. H., Jeong J. C. (2006). Satellite detection of harmful algal bloom occurrences in Korean waters. Harmful Algae 5 (2), 213–231. doi: 10.1016/j.hal.2005.07.007
Anderson S. R., Menden-Deuer S. (2017). Growth, grazing, and starvation survival in three heterotrophic dinoflagellate species. J. Eukaryot. Microbiol. 64 (2), 213–225. doi: 10.1111/jeu.12353
Bolyen E., Rideout J. R., Dillon M. R., Bokulich N. A., Abnet C. C., Al-Ghalith G. A., et al. (2019). Reproducible, interactive, scalable and extensible microbiome data science using QIIME 2. Nat. Biotechnol. 37 (8), 852–857. doi: 10.1038/s41587-019-0209-9
Brand L. E., Campbell L., Bresnan E. (2012). Karenia: the biology and ecology of a toxic genus. Harmful algae 14, 156–178. doi: 10.1016/j.hal.2011.10.020
Brzezinski M. A. (1985). The Si: c: n ratio of marine diatoms: interspecific variability and the effect of some environmental variables. J. Phycol. 21 (3), 347–357. doi: 10.1111/j.0022-3646.1985.00347.x
Callahan B. J., McMurdie P. J., Rosen M. J., Han A. W., Johnson A. J. A., Holmes S. P. (2016). DADA2: high-resolution sample inference from illumina amplicon data. Nat. Methods 13 (7), 581–583. doi: 10.1038/nmeth.3869
Che H., Zhang J. (2018). Water mass analysis and end-member mixing contribution using coupled radiogenic Nd isotopes and Nd concentrations: interaction between marginal seas and the northwestern pacific. Geophys. Res. Lett. 45 (5), 2388–2395. doi: 10.1002/2017GL076978
Choi D. H., An S. M., Yang E. C., Lee H., Shim J., Jeong J., et al. (2018). Daily variation in the prokaryotic community during a spring bloom in shelf waters of the East China Sea. FEMS Microbiol. Ecol. 94 (9), fiy134. doi: 10.1093/femsec/fiy134
Choi Y. M., Yoo J. T., Choi J. H., Choi K. H., Kim J. K., Kim Y. S., et al. (2008). Ecosystem structure and trophic level to the oceanographic conditions around the waters of jeju island. J. Environ. Biol. 29, 419–425.
Cuvelier M. L., Allen A. E., Monier A., McCrow J. P., Messié M., Tringe S. G., et al. (2010). Targeted metagenomics and ecology of globally important uncultured eukaryotic phytoplankton. PNAS 107 (33), 14679–14684. doi: 10.1073/pnas.1001665107
De Vargas C., Audic S., Henry N., Decelle J., Mahé F., Logares R., et al. (2015). Eukaryotic plankton diversity in the sunlit ocean. Science 348 (6237), 1261605. doi: 10.1126/science.1261605
Egge E., Elferink S., Vaulot D., John U., Bratbak G., Larsen A., et al. (2021). An 18S V4 rRNA metabarcoding dataset of protist diversity in the Atlantic inflow to the Arctic ocean, through the year and down to 1000 m depth. Earth Syst. Sci. Data. 13 (10), 4913–4928. doi: 10.5194/essd-13-4913-2021
Fukami K., Watanabe A., Fujita S., Yamaoka K., Nishijima T. (1999). Predation on naked protozoan microzooplankton by fish larvae. Mar. Ecol. Prog. Ser. 185, 285–291. doi: 10.3354/meps185285
Furuya K., Hayashi M., Yabushita Y., Ishikawa A. (2003). Phytoplankton dynamics in the East China Sea in spring and summer as revealed by HPLC-derived pigment signatures. Deep Sea Res. 2 Top. Stud. Oceanogr. 50 (2), 367–387. doi: 10.1016/S0967-0645(02)00460-5
Gao Y., Yu R. C., Chen J. H., Zhang Q. C., Kong F. Z., Zhou M. J. (2015). Distribution of Alexandrium fundyense and A. pacificum (Dinophyceae) in the yellow Sea and bohai Sea. Mar. pollut. Bull. 96 (1-2), 210–219. doi: 10.1016/j.marpolbul.2015.05.025
Gong W., Marchetti A. (2019). Estimation of 18S gene copy number in marine eukaryotic plankton using a next-generation sequencing approach. Front. Mar. Sci. 6, 219. doi: 10.3389/fmars.2019.00219
Guillard R. R., Kilham P., Jackson T. A. (1973). Kinetics of silicon-limited growth in the marine diatom Thalassiosira pseudonana hasle and heimdal (= Cyclotella nana hustedt). J. Phycol. 9 (3), 233–237. doi: 10.1111/j.0022-3646.1973.00233.x
Guillou L., Bachar D., Audic S., Bass D., Berney C., Bittner L., et al. (2012). The protist ribosomal reference database (PR2): a catalog of unicellular eukaryote small sub-unit rRNA sequences with curated taxonomy. Nucleic Acids Res. 41 (D1), D597–D604. doi: 10.1093/nar/gks1160
Guo B., Hu X., Xiong X., Ge R. (2003). Study on interaction between the coastal water, shelf water and kuroshio water in the huanghai Sea and East China Sea. Acta Oceanol. Sin. 22 (3), 351–367.
Huang T. H., Chen C. T. A., Lee J., Wu C. R., Wang Y. L., Bai Y., et al. (2019). East China Sea Increasingly gains limiting nutrient p from south China Sea. Sci. Rep. 9 (1), 1–10. doi: 10.1038/s41598-019-42020-4
Jang S. H. (2022). Assessment of biodiversity, global distribution, and putative ecological niches of suessiacean dinoflagellates by DNA metabarcoding. Front. Ecol. Evol. 10, 1010854. doi: 10.3389/fevo.2022.1010854
Jang S. H., Jeong H. J. (2020). Spatio-temporal distributions of the newly described mixotrophic dinoflagellate Yihiella yeosuensis (Suessiaceae) in Korean coastal waters and its grazing impact on prey populations. Algae 35 (1), 45–59. doi: 10.4490/algae.2020.35.2.24
Jang S. H., Jeong H. J., Lim A. S., Kwon J. E., Kang N. S. (2016). Feeding by the newly described heterotrophic dinoflagellate Aduncodinium glandula: having the most diverse prey species in the family pfiesteriaceae. Algae 31 (1), 17–31. doi: 10.4490/algae.2016.31.2.2
Jang S. H., Lim P., Torano O., Neave E. F., Seim H., Marchetti A. (2022). Protistan communities within the Galapagos archipelago with an emphasis on micrograzers. Front. Mar. Sci. 9, 811979. doi: 10.3389/fmars.2022.811979
Jeong H. J., Kang H. C., Lim A. S., Jang S. H., Lee K., Lee S. Y., et al. (2021). Feeding diverse prey as an excellent strategy of mixotrophic dinoflagellates for global dominance. Sci. Adv. 7, eabe4214. doi: 10.1126/sciadv.abe4214
Jeong H. J., Lim A. S., Lee K., Lee M. J., Seong K. A., Kang N. S., et al. (2017). Ichthyotoxic Cochlodinium polykrikoides red tides offshore in the south Sea, Korea in 2014, I. Temporal variations in three-dimensional distributions of red-tide organisms and environmental factors. Algae 32, 101–130. doi: 10.4490/algae.2017.32.5.30
Kang S. Y., Moon J. H. (2022). Distribution of water masses and characteristics of temperature inversion in the western seas of jeju island in spring (In Korean with English summary). Ocean Pol. Res. 44 (3), 191–207. doi: 10.4217/OPR.2022018
Käse L., Metfies K., Neuhaus S., Boersma M., Wiltshire K. H., Kraberg A. C. (2021). Host-parasitoid associations in marine planktonic time series: can metabarcoding help reveal them? PloS One 16 (1), e0244817. doi: 10.1371/journal.pone.0244817
Kim S. H. (2020). Characteristics of water temperature inversion observed in a region west of jeju island in April 2015 (In Korean with English summary). Ocean Polar Res. 42 (2), 97–113. doi: 10.4217/OPR.2020.42.2.097
Kim D., Choi S. H., Kim K. H., Shim J., Yoo S., Kim C. H. (2009). Spatial and temporal variations in nutrient and chlorophyll-a concentrations in the northern East China Sea surrounding cheju island. Cont. Shelf Res. 29 (11-12), 1426–1436. doi: 10.1016/j.csr.2009.03.012
Kim J. K., Choi B. J., Kim J., Sun Y. J. (2022). Wind-driven retreat of cold water pool and abrupt sea temperature rise off the southwest coast of Korea in summer 2017. J. Mar. Syst. 231, 103739. doi: 10.1016/j.jmarsys.2022.103739
Kim D., Shim J., Yoo S. (2006). Seasonal variations in nutrients and chlorophyll-a concentrations in the northern East China Sea. Ocean Sci. J. 41, 125–137. doi: 10.1007/BF03022418
Kwon K., Choi B. J., Kim K. Y., Kim K. (2019). Tracing the trajectory of pelagic Sargassum using satellite monitoring and Lagrangian transport simulations in the East China Sea and yellow Sea. Algae 34 (4), 315–326. doi: 10.4490/algae.2019.34.12.11
Le Bouteiller A. (1986). Environmental control of nitrate and ammonium uptake by phytoplankton in the equatorial Atlantic ocean. Mar. Ecol. Prog. Ser. 30, 167–179. doi: 10.3354/meps030167
Lee B., Park M. G. (2022). Drifting marine plastics as new ecological habitats for harmful eukaryotic microbial communities in jeju strait, Korea. Front. Mar. Sci. 9, 985756. doi: 10.3389/fmars.2022.985756
Leventer A., Domack E., Barkoukis A., McAndrews B., Murray J. (2002). Laminations from the palmer deep: a diatom-based interpretation. Paleoceanography 17 (3), PAL–PA3. doi: 10.1029/2001PA000624
Lie H. J. (1985). Wintertime temperature-salinity characteristics in the southeastern hwanghae (Yellow Sea). J. Oceanogr. Soc Jpn. 41, 291–298. doi: 10.1007/BF02109236
Lie H. J., Cho C. H., Jung K. T. (2015). Occurrence of large temperature inversion in the thermohaline frontal zone at the yellow Sea entrance in winter and its relation to advection. J. Geophys. Res. Oceans 120 (1), 417–435. doi: 10.1002/2014JC010653
Lie H. J., Cho C. H., Lee J. H., Lee S., Tang Y. (2000). Seasonal variation of the cheju warm current in the northern East China Sea. J. Oceanogr. 56, 197–211. doi: 10.1023/A:1011139313988
Lombard F., Boss E., Waite A. M., Vogt M., Uitz J., Stemmann L., et al. (2019). Globally consistent quantitative observations of planktonic ecosystems. Front. Mar. Sci. 6, 196. doi: 10.3389/fmars.2019.00196
Martin M. (2011). Cutadapt removes adapter sequences from high-throughput sequencing reads. EMBnet J. 17 (1), 10–12. doi: 10.14806/ej.17.1.200
Matsuoka K., Mizuno A., Iwataki M., Takano Y., Yamatogi T., Yoon Y. H., et al. (2010). Seed populations of a harmful unarmored dinoflagellate Cochlodinium polykrikoides margalef in the East China Sea. Harmful Algae 9 (6), 548–556. doi: 10.1016/j.hal.2010.04.003
Meyer M. G., Gong W., Kafrissen S. M., Torano O., Varela D. E., Santoro A. E., et al. (2022). Phytoplankton size-class contributions to new and regenerated production during the EXPORTS northeast pacific ocean field deployment. Elem. Sci. Anth. 10 (1), 00068. doi: 10.1525/elementa.2021.00068
Oh H. J., Kang Y. S., Park J. H. (1999). Distributional characteristics of chlorophyll-a and oceanographic conditions in the northern part of East China Sea. J. Korean Fish. Soc 32 (1), 88–97.
Olson R. J., Sosik H. M. (2007). A submersible imaging-in-flow instrument to analyze nano-and microplankton: imaging FlowCytobot. Limnol. Oceanogr. Methods 5 (6), 195–203. doi: 10.4319/lom.2007.5.195
Paasche E. (1973). Silicon and the ecology of marine plankton diatoms. II. silicate-uptake kinetics in five diatom species. Mar. Biol. 19, 262–269. doi: 10.1007/BF02097147
Paasche E. (1975). Growth of the plankton diatom Thalassiosira nordenskioeldii cleve at low silicate concentrations. J. Exp. Mar. Biol. Ecol. 18 (2), 173–183. doi: 10.1016/0022-0981(75)90072-6
Pang I. C., Hong C. S., Chang K. I., Lee J. C., Kim J. T. (2003). Monthly variation of water mass distribution and current in the cheju strait. J. Korean Soc Oceanogr. 38 (3), 87–100.
Park T. G., Lim W. A., Park Y. T., Lee C. K., Jeong H. J. (2013). Economic impact, management and mitigation of red tides in Korea. Harmful algae 30, S131–S143. doi: 10.1016/j.hal.2013.10.012
Park K. A., Park J. E., Choi B. J., Lee S. H., Shin H. R., Lee S. R., et al. (2017). Schematic maps of ocean currents in the yellow Sea and the East China Sea for science textbooks based on scientific knowledge from oceanic measurements (In Korean with English summary). Sea 22 (4), 151–171.
Park B. S., Wang P., Kim J. H., Kim J. H., Gobler C. J., Han M. S. (2014). Resolving the intra-specific succession within Cochlodinium polykrikoides populations in southern Korean coastal waters via use of quantitative PCR assays. Harmful algae 37, 133–141. doi: 10.1016/j.hal.2014.04.019
Piredda R., Tomasino M. P., D'erchia A. M., Manzari C., Pesole G., Montresor M., et al. (2017). Diversity and temporal patterns of planktonic protist assemblages at a Mediterranean long term ecological research site. FEMS Microbiol. Ecol. 93 (1), fiw200. doi: 10.1093/femsec/fiw200
Raven J. A. (1986). Physiological consequences of extremely small size for autotrophic organisms in the sea. Can. Bull. Fish. Aquat. Sci. 214, 1–70.
Redfield A. C. (1934). On the proportions of organic derivatives in Sea water and their relation to the composition of plankton (Vol. 1). Liverpool: Univ. Press Liverpool pp, 177–192.
Redfield A. C. (1958). The biological control of chemical factors in the environment. Am. Sci. 46 (3), 230A–2221.
Rizos I., Debeljak P., Finet T., Klein D., Ayata S. D., Not F., et al. (2023). Beyond the limits of the unassigned protist microbiome: inferring large-scale spatio-temporal patterns of syndiniales marine parasites. ISME Commun. 3 (1), 16. doi: 10.1038/s43705-022-00203-7
Rolton A., Rhodes L., Hutson K. S., Biessy L., Bui T., MacKenzie L., et al. (2022). Effects of harmful algal blooms on fish and shellfish species: a case study of new Zealand in a changing environment. Toxins 14 (5), 341. doi: 10.3390/toxins14050341
Sherr E. B., Sherr B. F. (2018). “Preservation and storage of samples for enumeration of heterotrophic protists,” in Handbook of methods in aquatic microbial ecology, vol. ) . Eds. Kemp P. F., Cole J. J., Sherr B. F., Sherr E. B. (Boca Raton, FL: CRC Press), 207–212.
Shim J. H., Park Y. C. (1984). Community structure and spatial distribution of phytoplankton in the southwestern sea of Korea, in early summer. J. Oceanol. Soc Korea 19 (1), 68–81.
Smayda T. J. (1997). Harmful algal blooms: their ecophysiology and general relevance to phytoplankton blooms in the sea. Limnol. Oceanogr. 42(5 Part 2), 1137–1153. doi: 10.4319/lo.1997.42.5_part_2.1137
Son Y. B., Lee T. H., Choi D. L., Jang S. T., Kim C. H., Ahn Y. H., et al. (2010). Spatial and temporal variations of satellite-derived 10-year surface particulate organic carbon (POC) in the East China Sea. Kor. J. Remote Sens. 26 (4), 421–437.
Stoeck T., Bass D., Nebel M., Christen R., Jones M. D., Breiner H. W., et al. (2010). Multiple marker parallel tag environmental DNA sequencing reveals a highly complex eukaryotic community in marine anoxic water. Mol. Ecol. 19, 21–31. doi: 10.1111/j.1365-294X.2009.04480.x
Sun Y., Youn S. H., Kim Y., Kang J. J., Lee D., Kim K., et al. (2022). Interannual variation in phytoplankton community driven by environmental factors in the northern East China Sea. Front. Mar.Sci. 9, 57. doi: 10.3389/fmars.2022.769497
Tillmann U. (2018). “Amphidomataceae,” in Harmful algal blooms: a compendium desk reference. Eds. Shumway S. E., Burkholder J. M., Morton S. L. (Hoboken, NJ: Wiley Blackwell), 575–582.
Tilman D., Kilham S. S. (1976). Phosphate and silicate growth and uptake kinetics of the diatoms Asterionella formosa and Cyclotella meneghiniana in batch and semicontinuous culture. J. Phycol. 12 (4), 375–383. doi: 10.1111/j.1529-8817.1976.tb02860.x
Wang B. D., Wang X. L., Zhan R. (2003). Nutrient conditions in the yellow Sea and the East China Sea. Estuar. Coast. Shelf Sci. 58 (1), 127–136. doi: 10.1016/S0272-7714(03)00067-2
Wong G. T. F., Gong G. C., Liu K. K., Pai S. C. (1998). ‘Excess nitrate’ in the East China Sea. Estuar. Coast. Shelf Sci. 46 (3), 411–418. doi: 10.1006/ecss.1997.0287
Yamaguchi H., Ishizaka J., Siswanto E., Son Y. B., Yoo S., Kiyomoto Y. (2013). Seasonal and spring interannual variations in satellite-observed chlorophyll-a in the yellow and East China seas: new datasets with reduced interference from high concentration of resuspended sediment. Cont. Shelf Res. 59, 1–9. doi: 10.1016/j.csr.2013.03.009
Yoo D., Kim J. K., Choi B. J. (2023). Distribution and origin of the mid-depth cold water pools observed in the jeju strait in the summer of 2019 (In Korean with English summary). Sea 28 (1), 19–40. doi: 10.7850/jkso.2023.28.1.019
Zamora-Terol S., Novotny A., Winder M. (2020). Reconstructing marine plankton food web interactions using DNA metabarcoding. Mol. Ecol. 29 (17), 3380–3395. doi: 10.1111/mec.15555
Zhu F., Massana R., Not F., Marie D., Vaulot D. (2005). Mapping of picoeucaryotes in marine ecosystems with quantitative PCR of the 18S rRNA gene. FEMS Microbiol. Ecol. 52 (1), 79–92. doi: 10.1016/j.femsec.2004.10.006
Keywords: Jeju Warm Current, harmful algal bloom, Korea Strait, Kuroshio Current, metabarcoding, phytoplankton, protist community
Citation: Kim YH, Seo HJ, Yang HJ, Lee M-Y, Kim T-H, Yoo D, Choi B-J and Jang SH (2023) Protistan community structure and the influence of a branch of Kuroshio in the northeastern East China Sea during the late spring. Front. Mar. Sci. 10:1192529. doi: 10.3389/fmars.2023.1192529
Received: 23 March 2023; Accepted: 15 May 2023;
Published: 05 June 2023.
Edited by:
Meng Yan, City University of Hong Kong, Hong Kong SAR, ChinaReviewed by:
Rongjie Zhao, City University of Hong Kong, Hong Kong SAR, ChinaJack Chi-Ho Ip, Hong Kong Baptist University, Hong Kong SAR, China
Copyright © 2023 Kim, Seo, Yang, Lee, Kim, Yoo, Choi and Jang. This is an open-access article distributed under the terms of the Creative Commons Attribution License (CC BY). The use, distribution or reproduction in other forums is permitted, provided the original author(s) and the copyright owner(s) are credited and that the original publication in this journal is cited, in accordance with accepted academic practice. No use, distribution or reproduction is permitted which does not comply with these terms.
*Correspondence: Se Hyeon Jang, c2hqYW5nQGpudS5hYy5rcg==