 Margaret A. Redick1
 Milo E. Cummings2
 George F. Neuhaus1Lila M. Ardor Bellucci3Andrew R. Thurber2,3*
 Kerry L. McPhail1*
- 1Department of Pharmaceutical Sciences, College of Pharmacy, Oregon State University, Corvallis, OR, United States
- 2Department of Microbiology, College of Science, Oregon State University, Corvallis, OR, United States
- 3College of Earth, Ocean, and Atmospheric Sciences, Oregon State University, Corvallis, OR, United States
Deep-sea methane seeps host highly diverse microbial communities whose biological diversity is distinct from other marine habitats. Coupled with microbial community analysis, untargeted metabolomics of environmental samples using high resolution tandem mass spectrometry provides unprecedented access to the unique specialized metabolisms of these chemosynthetic microorganisms. In addition, the diverse microbial natural products are of broad interest due to their potential applications for human and environmental health and well-being. In this exploratory study, sediment cores were collected from two methane seeps (-1000 m water depth) with very different gross geomorphologies, as well as a non-seep control site. Cores were subjected to parallel metabolomic and microbial community analyses to assess the feasibility of representative metabolite detection and identify congruent patterns between metabolites and microbes. Metabolomes generated using high resolution liquid chromatography tandem mass spectrometry were annotated with predicted structure classifications of the majority of mass features using SIRIUS and CANOPUS. The microbiome was characterized by analysis of 16S rRNA genes and analyzed both at the whole community level, as well as the small subgroup of Actinobacteria, which are known to produce societally useful compounds. Overall, the younger Dagorlad seep possessed a greater abundance of metabolites while there was more variation in abundance, number, and distribution of metabolites between samples at the older Emyn Muil seep. Lipid and lipid-like molecules displayed the greatest variation between sites and accounted for a larger proportion of metabolites found at the older seep. Overall, significant differences in composition of the microbial community mirrored the patterns of metabolite diversity within the samples; both varied greatly as a function of distance from methane seep, indicating a deterministic role of seepage. Interdisciplinary research to understand microbial and metabolic diversity is essential for understanding the processes and role of ubiquitous methane seeps in global systems and here we increase understanding of these systems by visualizing some of the chemical diversity that seeps add to marine systems.
1 Introduction
Methane seeps are areas where methane leaks from vast subseafloor reservoirs, fueling dense communities of organisms. Methane seep communities, including endemic microorganisms and animals, either harness the chemical energy being released from the seafloor directly or through symbiosis, or make use of the habitat (both physical and chemical) created by seep biological processes. Alongside endemic species, methane seeps host organisms that are found throughout the margin, including species that are harvested commercially (Grupe et al., 2015; Seabrook et al., 2019). The seeps themselves are a mosaic of different habitats with varying biogeochemistry and fauna (Boetius and Suess, 2004; Bernardino et al., 2012) in which communities change over time. Over the geologic time scales that methane seepage can occur, the metabolic activity of microbial communities results in carbonate precipitation that can pave vast areas of the seafloor (Cordes et al., 2009; Bowden et al., 2013). The resulting hard substrate, termed authigenic carbonate, provides for attachment and growth of anemones, sponges, and corals at mature methane seep sites in the otherwise expansive soft sediment of the deep ocean. Methane seeps enhance biological diversity of the ocean margin by producing substrate, hosting divergent biological processes and biogeochemistry, and contributing significantly to primary production in the deep ocean. Here we add to this foundational knowledge by revealing chemical diversity, which has implications for future societal use.
Methane seeps comprise a diversity of habitats in close proximity, creating a unique opportunity for natural products (NPs) discovery. The high biological diversity of seeps is illustrated in a recent study focused on the habitat along the Oregon and Washington margins in which more than 72,000 different amplicon sequence variants (ASVs) were documented from six seep and non-seep collection sites, plus a control site (Cummings et al., 2023). At the three methane seep sites sampled, 11,631 different amplicon sequence variants (ASVs) were present only in the on-seep core samples. While on-seep cores had relatively low Chao1 diversity values, with a mean of 452 ± 204 for Emyn Muil and Dagorlad seeps, the 5m off-seep cores had local peaks in diversity with values of 861 ± 162. Even in earlier studies where ASVs with 97% similarity are combined into Operational Taxonomic Units (OTUs), more than 30,000 distinct OTUs have been measured at methane seep habitats (Seabrook et al., 2018).
Oxygen, sulfide (toxic to most animals), and redox gradients typify seep habitats, and the microbial communities reflect this diverse environment through an abundance of metabolic pathways, including aerobic methane oxidation, anaerobic oxidation of methane, sulfate reduction, sulfide oxidation, manganese and iron reduction, and nitrogen fixation (Levin, 2005; Reeburgh, 2007; Knittel and Boetius, 2009; Dekas et al., 2014). Sediment communities, including those at seeps, use or must exist in the presence of metabolites produced by co-occurring taxa as defense chemicals, transient chemical signals, and/or in a multitude of possible undefined ecological roles (Dekas et al., 2016; Patin et al., 2017).
Knowledge of the diverse metabolic strategies at methane seeps resulting in a diversity of pathways involved in cellular energy production and compound biosynthesis is far from comprehensive. Most studies investigating environmental microbiomes have focused on phylogenetic identity and abundance of microbial community members, without metabolomic analyses or testing for biological activity or potential ecological roles. Technological advances in high resolution mass spectrometry and associated data analysis tools have facilitated and been driven further by targeted and untargeted metabolomics coupled to microbial community analysis in microbiome studies (Bauermeister et al., 2022), with applications in human health (Aleti et al., 2022; Zhang et al., 2023) and agriculture (Rothman et al., 2019; Sun et al., 2022; Nie et al., 2023). With continued development of computational methods to annotate structurally complex specialized metabolites in complex mixtures (Morehouse et al., 2023), these integrated approaches are increasingly applicable to detection and structural annotation of microbial specialized metabolites in environmental microbiome samples (Shaffer et al., 2022), although structural annotations in untargeted mass spectrometry experiments are putative assignments of structural class or planar molecular structure that require follow-up for valid molecular structure characterization.
Limited material from environmental sampling poses a challenge for traditional NP isolations of new compounds for structure elucidation and biological activity testing. However, untargeted metabolomics analyses of environmental samples using high resolution liquid chromatography tandem mass spectrometry (LCMS2) may require only nanograms of chemical extract from milligrams of collected sample. This approach provides data for comparative analyses when working with limited materials. Importantly, the identities of metabolites detected via untargeted analyses remain largely unknown, with an estimated 10% average annotation rate possible using LCMS spectral databases and computational prediction tools (de Jonge et al., 2022).
Untargeted LCMS2 surveys coupled with computational tools permit generation of hypotheses from exploratory data to direct further investigation and prioritization of organisms or metabolites for targeted analyses. Open access tools such as GNPS, SIRIUS, and CANOPUS enable predictions of metabolite structure or structure class based on tandem mass spectrometry (MS2) fragmentation patterns. GNPS is a web-based mass spectrometry platform for sharing and comparative networking of MS2 data (Wang et al., 2016). The downloadable software framework SIRIUS (Dührkop et al., 2021) incorporates CSI : FingerID and CANOPUS for prediction of molecular formulas and structure classifications using MS1 isotope and MS2 fragmentation patterns (Djoumbou Feunang et al., 2016; Kim et al., 2021). Here we present the results of a coupled metabolome-microbiome approach using untargeted high-resolution LCMS2 analysis and bacterial 16S rRNA amplicon sequencing of environmental samples to assess metabolite detection and explore the chemical and biological relationships between two methane seep habitats that differ significantly in their gross morphology (Figure 1). The 16S rRNA sequence data used for our comparative analyses of the Emyn Muil and Dagorlad methane seeps comprise a subset of the larger ASV dataset reported by Cummings et al. (2023).
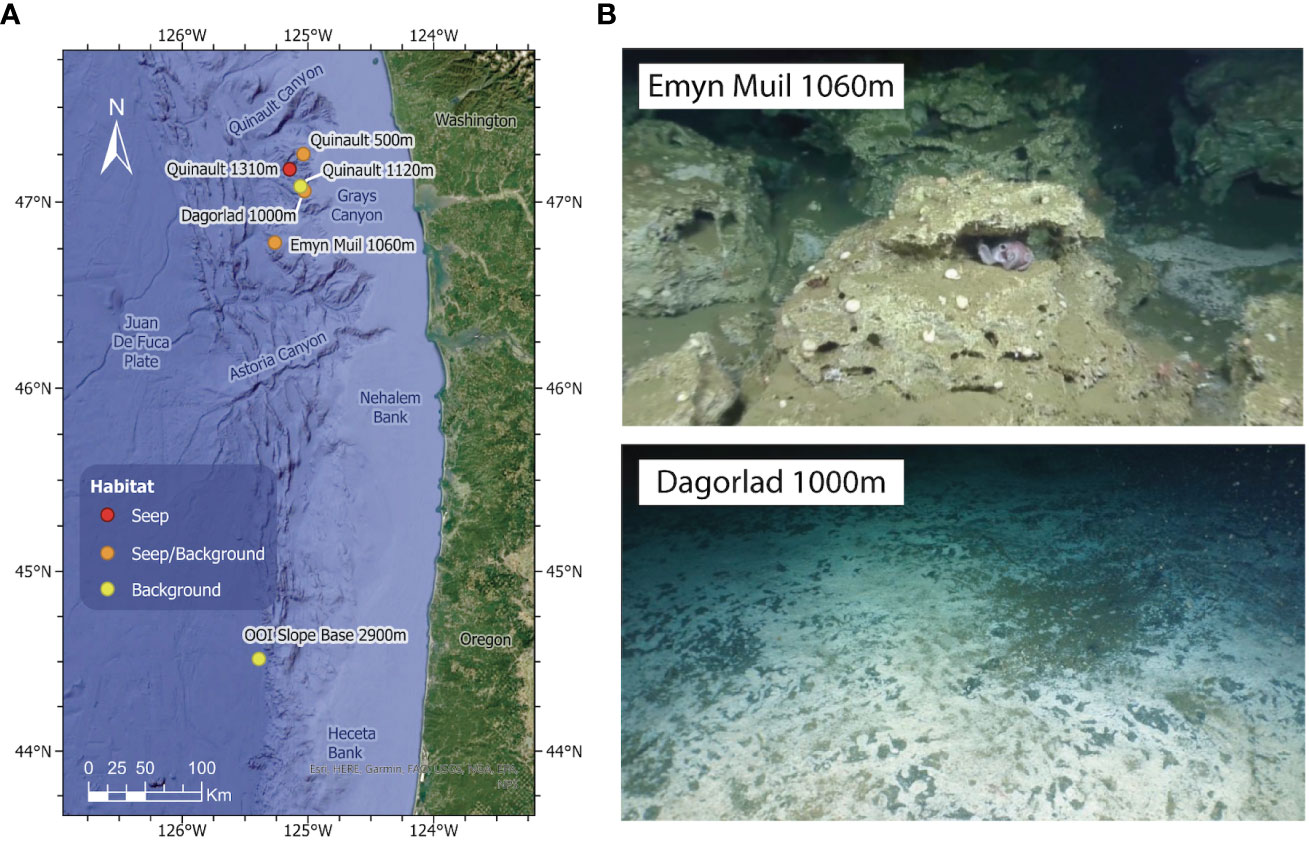
Figure 1 (A) Map indicating the locations of the three sampling sites (older seep Emyn Muil, younger seep Dagorlad, OOI Slope Base control). The two seeps are approximately 50 miles off the Washington coast on the Juan de Fuca Plate. (B) Images of the two methane seep sites sampled: upper is the older seep, Emyn Muil (1,060 m), characterized by carbonate deposits; lower is the younger seep, Dagorlad (1,000 m), characterized by soft sediments and extensive microbial mats. This figure is reproduced in part with permission from Cummings et al. (2023, https://doi.org/10.7717/peerj.15119/fig-1).
The Dagorlad seep site is an expansive microbial mat, likely indicative of a recent onset of seepage, and the Emyn Muil seep site is a large carbonate outcrop consistent with seepage that has been ongoing for hundreds to thousands of years. These two sites potentially represent the opposite ends of seep succession. By comparison with nearby off-seep habitats, as well as a deep-sea non-seep control site, we address the overarching question of whether different seep microbiomes can be distinguished by untargeted metabolomics of environmental samples. We also present a correlation analysis of the subset of putative peptides with actinobacterial 16S rRNA sequence since Actinobacteria are well-known to produce biologically active peptides (Zhao et al., 2018). Our results thus may provide preliminary insight on the potential for discovery of new biotechnological or biopharmaceutical compounds from deep-sea methane seeps. Our long term goal is to better understand the role of seeps in marine biological diversity and future pharmaceutical and biotechnological research.
2 Methods
2.1 Sample collection
Sediment cores were collected from two methane seeps along the Cascadia Margin using the ROV Hercules on E/V Nautilus cruise NA121, in partnership with the Ocean Exploration Trust. Here we focused on one core collected directly at the seep and one core collected 5 m away from areas of active seepage at each of two contrasting seep sites (Figure 1). These areas of active seepage had the highest microbial diversity present in the region (Cummings et al., 2023). An additional core from the Slope Base site of the Ocean Observatories Initiative (OOI) Regional Cabled Array was collected at a water depth of 2,900 m by ROV JASON during routine maintenance of the site (44.5152°N, -125.3898°W). The OOI site located 300 km south of the other sampling sites was included to compare a deeper non-seep site in the same geographical region. Sediment push cores were extruded shipboard and sectioned into 1 cm-thick sections ranging from 0 (surface) to 10 cm deep in the core, with the exterior discarded to prevent sediment smearing from impacting the measured microbial community and metabolome. Core sections were subdivided for metabolite and 16S rRNA analysis and frozen at -80°C until analysis. Samples for metabolite profiling were only handled with metal core slicing devices and were stored frozen in glass vials.
2.2 Microbial community analysis
Microbial analysis of sediment samples was performed as described in Seabrook et al. (2018). In brief, DNA was extracted from ~ 0.5 g frozen sediment using the QIAgen PowerSoil kit according to the kit protocol. The V4 region of the 16S rRNA gene was amplified and sequenced following the Earth Microbiome protocol, including the updated primers (Parada et al., 2016). Sequencing was carried out at the Oregon State University Center for Quantitative Life Sciences on the Illumina MiSeq platform, with 250-bp paired-end reads. Bioinformatics of the 16S rRNA analysis was carried out as part of a larger study using a Qiime2 pipeline as described in Cummings et al. (2023). The actinobacterial taxa from the resulting ASV table were selected for separate analyses.
2.3 Chemical extraction and LCMS2
Each sediment core subsection (48 in total) was lyophilized, resuspended in HPLC grade methanol (15 mL), sonicated (30 min) and left to extract overnight at room temperature. The solvent supernatants were then filtered using 0.2 µM PTFE syringe filters, dried in vacuo, and the resulting 48 extracts were weighed. High-resolution LCMS2 profiling of all samples was performed using an Agilent 1260 Infinity II LC system with detection by an Agilent 6545 TOF mass spectrometer. For this analysis, the sample extracts were reconstituted at 10 mg/mL in LCMS grade methanol of which 5 µL were injected. A reversed phase C18 porous core column (Kinetex C18, 50 x 2.1 mm, 2.6 μm particle size, 100 Å pore size, Phenomenex, Torrance, USA) was used for chromatographic separation. A binary gradient system with mobile phase consisting of H2O (solvent A) and acetonitrile (ACN, solvent B), and flow rate of 0.4 mL/min was used. After injection, the samples were eluted with a linear gradient from 0-5.5 min at 15% B, 5.5-15 min 15-80% B, 15-20 min 100% B. Initially the first 5.5 minutes were sent to waste but as no peaks were seen until after 8 minutes, 7.5 min of eluent was sent to waste to divert salt from the mass spectrometer for subsequent runs. Data dependent acquisition (DDA) of MS2 spectra was performed in positive mode.
2.4 Chemoinformatic analysis of metabolomic data
For LCMS2 data analysis, raw data (Agilent .d format) were converted to .mzML files using MSconvert (ProteoWizard); data pre-processing to extract MS1 and MS2 features was performed using MZmine3 (Pluskal et al., 2010). The parameters used in MZmine3 are listed in Supplementary Table S1. Mass spectrometric data are available via MassIVE (MassIVE ID MSV000090543) (MassIVE, n.d.). The MZmine3 peak list was exported as an .mgf file and uploaded to SIRIUS 5 GUI (Dührkop et al., 2019). SIRIUS (Dührkop et al., 2019), CSI : FingerID (Dührkop et al., 2015), and CANOPUS (Djoumbou Feunang et al., 2016; Dührkop et al., 2021; Kim et al., 2021) analyses were performed using the parameters in Supplementary Table S2. The MZmine3 generated feature list and quantification table were also analyzed using the GNPS platform (Wang et al., 2016). Peak areas of LCMS (MS1) features were summed by CANOPUS-assigned NPClassifier pathways to generate a pie chart for each core, representing the distribution of features across major structure classes (Figure 2). The fatty acid and terpenoid pathways were combined to form “Lipids and Lipid-like molecules”. Peak areas of LCMS (MS1) features were summed by CANOPUS-assigned NPClassifier pathways and stacked bar plots (Figure 3) showing the proportions of each pathway by core/depth were generated using the R package ggplot2 (Torondel et al., 2016; Wickham et al., 2019; R Core Team, 2022).

Figure 2 Pie charts of all MS features assigned to structural classes based on NPClassifier Pathways designated by CANOPUS. Terpenoids and fatty acids have been combined to form the class of “lipids and lipid-like” compounds. The plots display proportions based on MS1 peak areas summed by sample collection site. (A) Emyn Muil (EM) on-seep microbial mat. (B) Emyn Muil (EM) 5 m off-seep. (C) Dagorlad Seep (DS) microbial mat. (D) Dagorlad Seep (DS) 5 m off-seep (E) Non-seep control site, OOI slope base 2900 m.
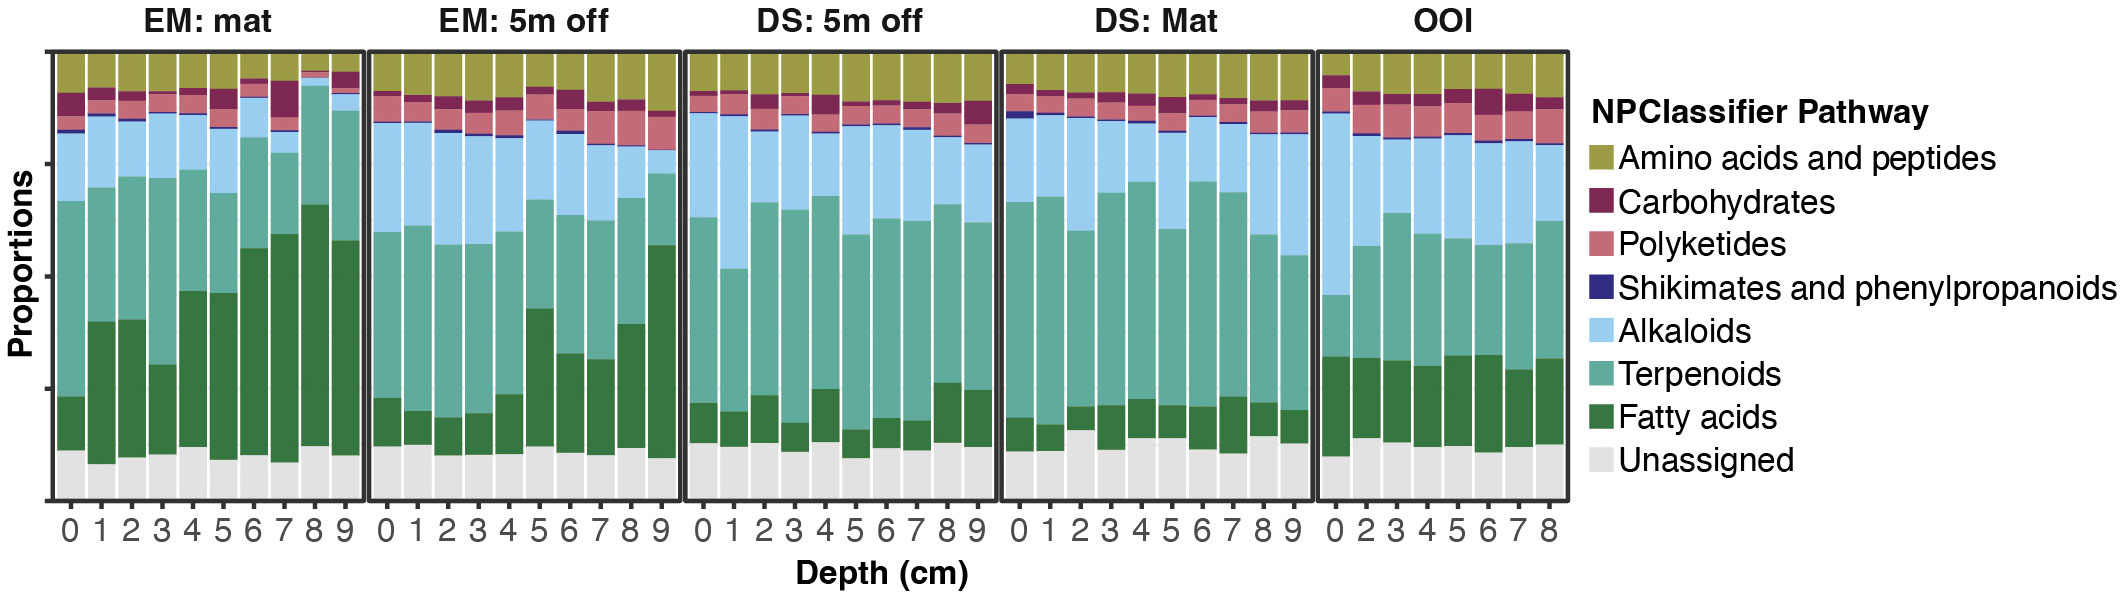
Figure 3 Stacked bar graphs displaying proportions of MS features assigned to structural classes based on NPClassifier Pathways designated by CANOPUS for core sections from each of the 5 different cores. EM: Mat is Emyn Muil on-seep mat core; EM: 5 m off is Emyn Muil 5 m off-seep core; DS: Mat is Dagorlad Seep on-seep mat core; DS: 5 m off is Dagorlad Seep 5 m off-seep core; OOI: non-seep is the OOI slope base core.
2.5 Statistical analyses of microbial and metabolomic data
Comparative analyses were performed on the microbial ASV, actinobacterial ASV, and LCMS ion feature peak area datasets using multivariate analysis in PRIMER v7 (Clarke and Gorley, 2015). Data were Log(X+1) transformed and Bray-Curtis similarity was used to construct a resemblance matrix. Significant patterns in the resulting data were identified via similarity profile (SIMPROF) analysis, which is also available in R package. SIMPROF identifies significant differences within datasets without a priori groupings and without an arbitrary cutoff of overall similarity. We used a significance level for SIMPROF groupings of 5%. We generated SIMPROF groupings for each MS2, total bacterial community, and actinobacteria only. We also visualized these data using non-metric multidimensional scaling (NMDS). Data were processed to visualize significant Spearman’s correlations between LCMS features and microbial ASVs in heatmaps using the R (R Core Team, 2022) script provided in the supplemental data repository and performed previously (Neuhaus et al., 2022). In brief, the MS ion feature list was filtered to generate a list containing only the subset of features annotated as potentially peptide by CANOPUS in either ontology. Correlation analysis with the family level microbial data was then performed separately for this peptidic metabolite subset in which features (microbial family or MS feature) observed in less than 10% of samples were removed prior to correlation. Microbial amplicon sequencing data were transformed to proportions by dividing the counts in each sample by the sample’s total sequencing depth. The dataset was mean centered and scaled before Spearman’s correlations were calculated (R package “Hmisc”) between each pair (microbe~metabolite) of features. P values were adjusted according to the Benjamini-Hochberg procedure to control the false discovery rate. Adjusted p values < 0.05 were considered significant.
3 Results
High resolution LCMS2 and 16S rRNA amplicon sequence data were curated for each of ten core sections from four sediment cores (40 samples in total). One core was collected on-seep and one core was collected 5 m off-seep from each of two seep sites with distinct geomorphologies (Figure 1) and variable geochemistry (Cummings et al., 2023). Paired data were similarly obtained for depth sections of a non-seep OOI core as a background control (8 samples in total). Throughout this manuscript we use the term “older” for the carbonate-dominated Emyn Muil seep and “younger” for the soft-sediment Dagorlad seep as it provides context for the results, however, we do not know the time of onset of seepage at the sites sampled. At both sites, soft sediment habitats were sampled, although the sediment cores collected from the Emyn Muil seep were next to an expansive carbonate outcrop indicative of persistent seepage in the region for hundreds to thousands of years.
3.1 Microbial community
A total of 1,423,130 sequences belonging to 17,217 microbial ASVs were detected from the four methane seep sediment cores selected. The ASVs comprised 686 families in total. Actinobacterial sequences were a minor component of the total ASVs present. Overall, 2,046 sequences were identified within the Actinobacteria, representing 142 distinct ASVs. The Actinobacteria ASVs represented 27 families in total, although two families accounted for 85% of all ASVs, with half (54%) of those belonging to WCHB1-81 and the others falling outside of currently identifiable families.
3.2 Untargeted metabolomics
Processing of LCMS2 raw data with MZMine3 resulted in a total of 1,304 mass features, which were assigned to 119 out of the 672 NPClassifier (Kim et al., 2021) structural classes across all seven NP biosynthetic pathways using CANOPUS (Dührkop et al., 2021). The metabolite profiles for cores from both methane seep sites (Figures 2A–D) exhibited a higher proportion of lipids and lipid-like molecules than the non-methane seep OOI site (Figure 2E). The chemistry of the microbial mat at the older seep with hard carbonate substrate clearly comprised the highest proportion of lipids and lipid-like molecules of all the sites (Figure 2A). The distribution of metabolites among NPClassifier pathways was most similar between the 5 m off-seep cores from each site (Figures 2B, D). While the relative proportion of features assigned to each structure class did not change markedly for non-lipid metabolites, the specific metabolites within each class varied significantly between sites.
Stacked bar plots of MS1 feature peak areas summed by their NPClassifier assignments display the proportions of each biosynthetic class by depth in each core (Figure 3). The plots for both cores from Emyn Muil displayed the highest overall proportion and greatest variation in fatty acids and terpenoids, with the proportion of fatty acids generally increasing with depth in core. The on-seep microbial mat had a remarkably high proportion of fatty acids, and a concomitantly lower proportion of alkaloids and amino acids/peptides, especially with increasing depth in the core. In contrast, the Dagorlad cores displayed the lowest abundance of fatty acids with proportionally more terpenoids, and a relatively uniform distribution of metabolite biosynthetic classes between the on-seep microbial mat and 5 m off-seep cores. These data are summarized in Figure 4, in which MS feature counts, summed peak areas and NPClassifier classes are summarized in parallel for each core by depth. The older Emyn Muil seep displayed greater variability in the abundance (peak areas, Figure 4A) and number (counts, Figure 4B) of LCMS features, with deeper core sections containing fewer and less abundance of features than shallower sections. In contrast, the number and abundance of LCMS features in both the control OOI slope base and the younger Dagorlad seep samples were less variable across depths. The number of distinct metabolite structural classes annotated for each sample using the NPClassifier ontology in CANOPUS was also determined and revealed consistent trends with depth (Figure 4C). Comparison of the shallower samples at the two seep sites revealed similar numbers and abundance of LCMS features (Figures 4A, B), with fewer structural classes assigned within the deeper samples from the older Emyn Muil seep (Figure 4C).
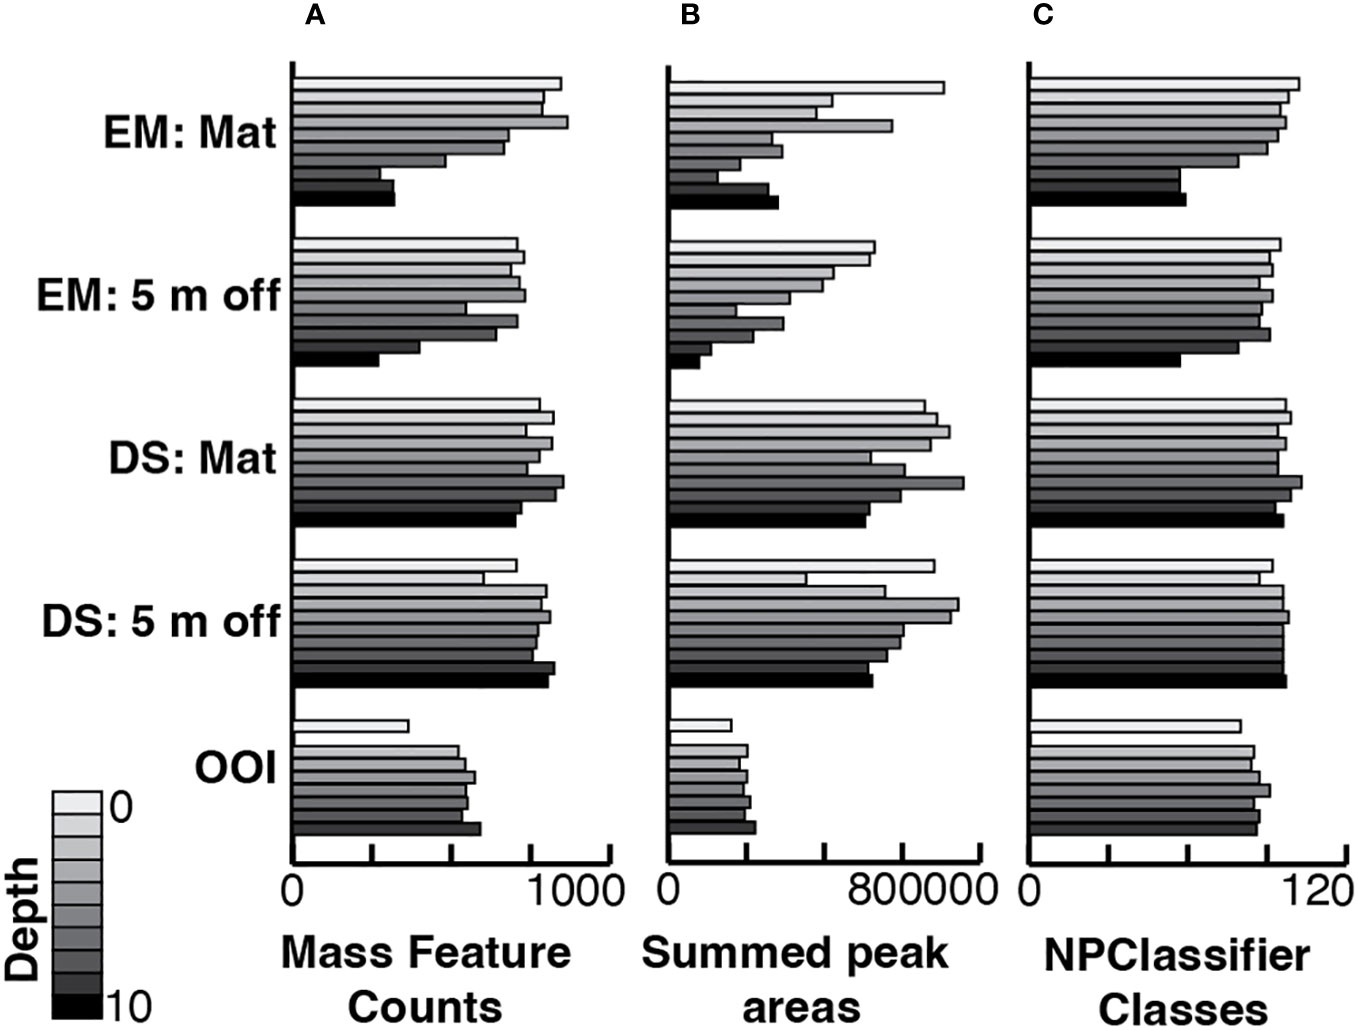
Figure 4 Bar graphs displaying per sample, stacked by core and sample depth in core, (A) the number of mass features, (B) the sum of all LCMS peak areas from the feature list generated in MzMine3, and (C) the number of distinct NPClassifier classes in each sample. EM: Mat is Emyn Muil on-seep mat core; EM: 5 m off is Emyn Muil 5 m off-seep core; DS: Mat is Dagorlad Seep on-seep mat core; DS: 5 m off is Dagorlad Seep 5 m off-seep core; OOI: non-seep is the OOI slope base core.
3.3 Integrated analysis of microbial and metabolite data
Separate NMDS plots of total microbial ASV and MS1 data for all core samples exhibited corresponding patterns of variation. The subset of actinobacterial ASV abundances was also analyzed separately from the rest of the microbial ASV data because of the known capacity of Actinobacteria for specialized metabolism, resulting in structurally diverse compounds with antibiotic and other biological activities (Zhao et al., 2018).
Greatest variability in both metabolites (Figure 5A) and microbes (Figure 5B) was evident around the older carbonate Emyn Muil seep compared to the relatively clustered samples of the younger soft sediment Dagorlad seep, and the distinct microbial community and chemistry of the non-seep OOI slope base. We note that each point represents both a core location and depth within that core, making statistical analysis using a priori groupings (i.e. PERMANOVA) inappropriate to apply. Hence our application of exploratory significance testing using similarity profile (SIMPROF) analysis. The SIMPROF method examines whether the similarities observed in the data are smaller and/or larger than those expected by chance (null hypothesis testing). The MS1 data showed more variability in both feature counts (on-seep mat: 602.9 ± 233.6; 5 m off-seep: 613.5 ± 160.2) and abundances (on-seep mat: 3.48E5 ± 1.78E5; 5 m off-seep: 3.05 ± 1.61E5) at the older Emyn Muil seep, with deeper sections yielding lower feature counts and abundances than shallower ones (Figure 4). The LCMS data for the two Dagorlad seep cores varied less, in both feature counts (on-seep mat: 777.3 ± 51.8; 5 m off-seep: 762.5 ± 65.6) and abundances (on-seep mat: 6.24E5 ± 9.02E4; 5 m off-seep 5.85E5 ± 1.15E5). This is further reflected in the greater spread in core section LCMS data for the two Emyn Muil cores compared to the Dagorlad cores (Figure 5A). Additionally, the LCMS data formed less distinct clusters (Figure 5A) compared to the corresponding microbial ASV data (Figure 5B) of the sediment cores, reflecting the shared chemistry of metabolisms between different microbial taxa. In both the ASV and LCMS data plots, the OOI slope base core samples clustered separately from the on-seep and 5 m off-seep samples (Figures 5A, B).
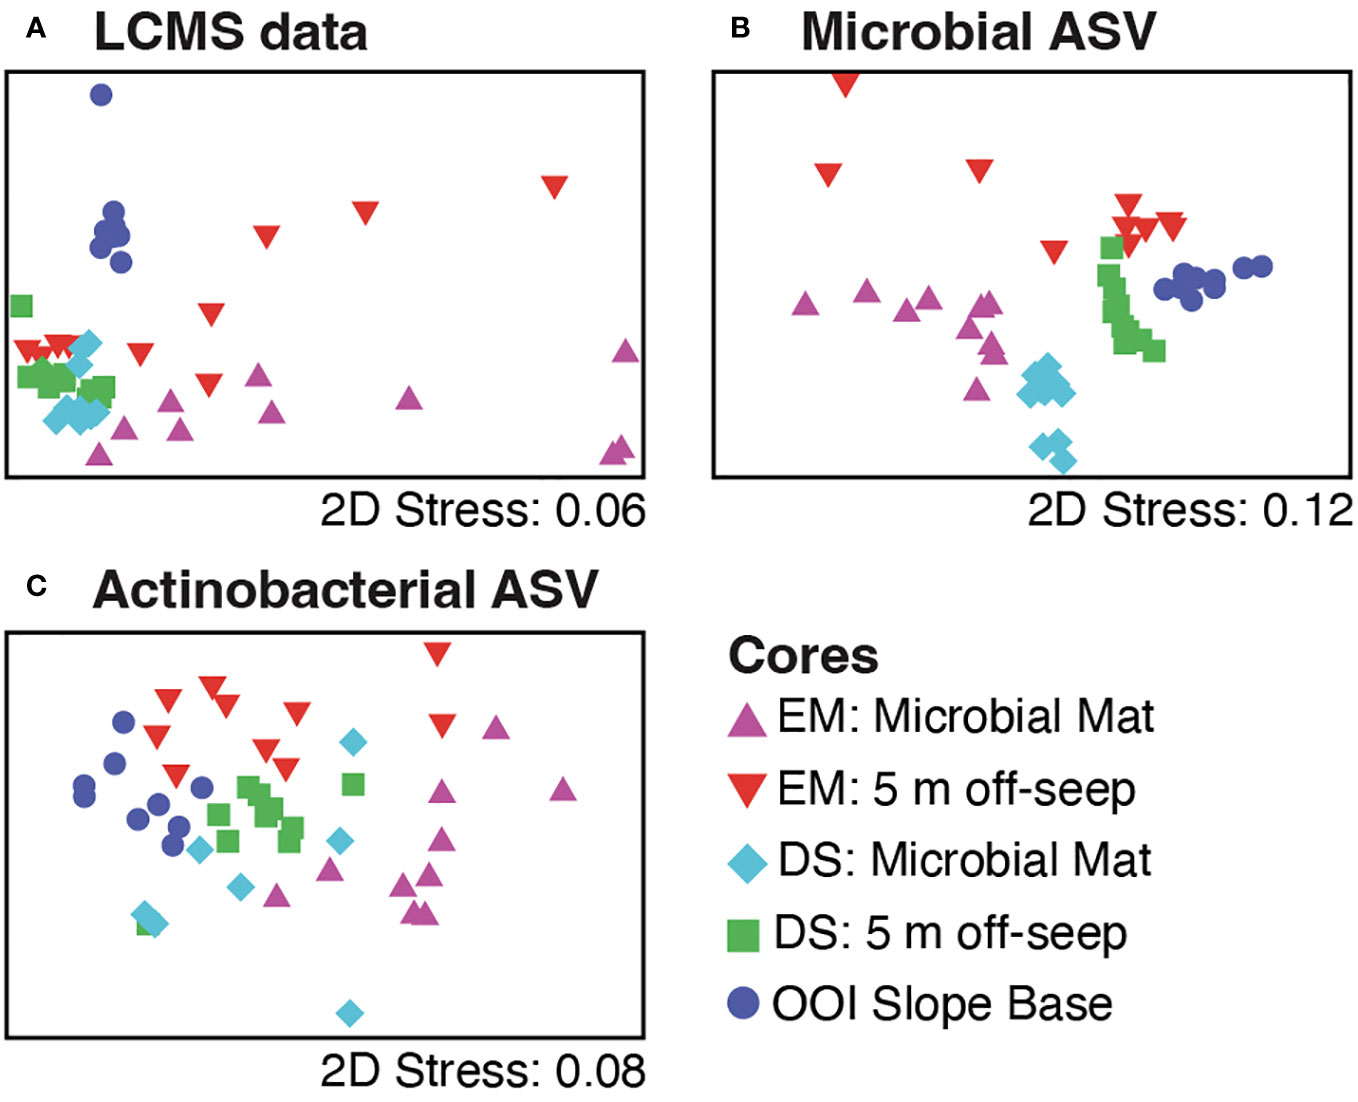
Figure 5 Non-metric multidimensional scaling (nMDS) plots of the data for 10 core sections from five different cores, including on-seep mat (Emyn Muil, EM, purple; Dagorlad Seep, DS, cyan), 5 m off-seep (EM, red; DS, green), and non-seep OOI control (dark blue) using (A) LCMS data, (B) all microbial (16S rRNA) ASV data, and (C) actinobacterial ASV data only.
The 5 m off-seep cores possessed greater ASV richness than their corresponding on-seep microbial mat cores. The Emyn Muil sediment core from 5 m off-seep had greater microbial ASV richness (6,948 ASVs) than the on-seep microbial mat core from the same site (4,427 ASVs). The Dagorlad seep cores had less ASV richness than the corresponding cores at the Emyn Muil seep but again, greater richness was seen in the 5 m off-seep core (5,802 ASVs) than the on-seep mat (1,338 ASVs). Sediment samples were generally clustered by core using microbial ASV data (Figure 5B). However, the samples from the younger Dagorlad seep cores clustered more tightly than those from the older Emyn Muil seep, where deeper depths were less clustered than shallower depths (Figure 5B). The NMDS plot of core samples based on the actinobacterial ASVs (Figure 5C) displayed the least separation between the cores, likely due to the low overall counts of Actinobacteria. Nevertheless, it is noteworthy that actinobacterial ASV richness appeared to be less diverse for the on-seep microbial mat cores (EM:28, DS:12) than for the 5 m off-seep cores (EM:78, DS:35).
Clustering by similarity using the SIMPROF routine is a method of exploratory data analysis that detects patterns using null hypothesis testing. In summary, a Bray-Curtis similarity matrix for the data is compared, using the pi statistic, to a mean permuted similarity profile generated from iterative random shuffling of the raw data. This SIMPROF method was performed on microbial ASV abundance data, the actinobacterial ASV subset, and LCMS peak area (abundance) data for the sediment samples. Sediment core schematics, representing the spatial distribution of SIMPROF groupings for the three datasets by depth of core section sample, are presented in Figure 6, together with a template core on which section depths are labeled (Figure 6A). In general, for Emyn Muil and Dagorlad seep sites, changes in metabolites with depth, indicated by bold line boundaries between different colored sections, are consistent with changes in microorganisms with depth (Figures 6C–F). In contrast, the metabolite and microbial datasets for the non-seep OOI control site do not correlate well in terms of variation with depth, and there are overall fewer changes/boundaries (Figure 6B). In numerous instances for the two seep sites, as indicated by circled letters, SIMPROF groupings match between the LCMS and total microbial ASV datasets. These correlations imply the presence of distinct microbial populations with correspondingly distinct chemistry in these core sections. There is less correlation in the change with depth of LCMS versus actinobacterial ASV data alone, which may again reflect the relatively low overall counts of actinobacterial ASVs. Somewhat correlated changes in depth between actinobacteria and LCMS datasets are apparent for the 5 m off-seep sites, for example, between 4-7 cm core section depth in the Emyn Muil samples and variously throughout the Dagorlad samples.
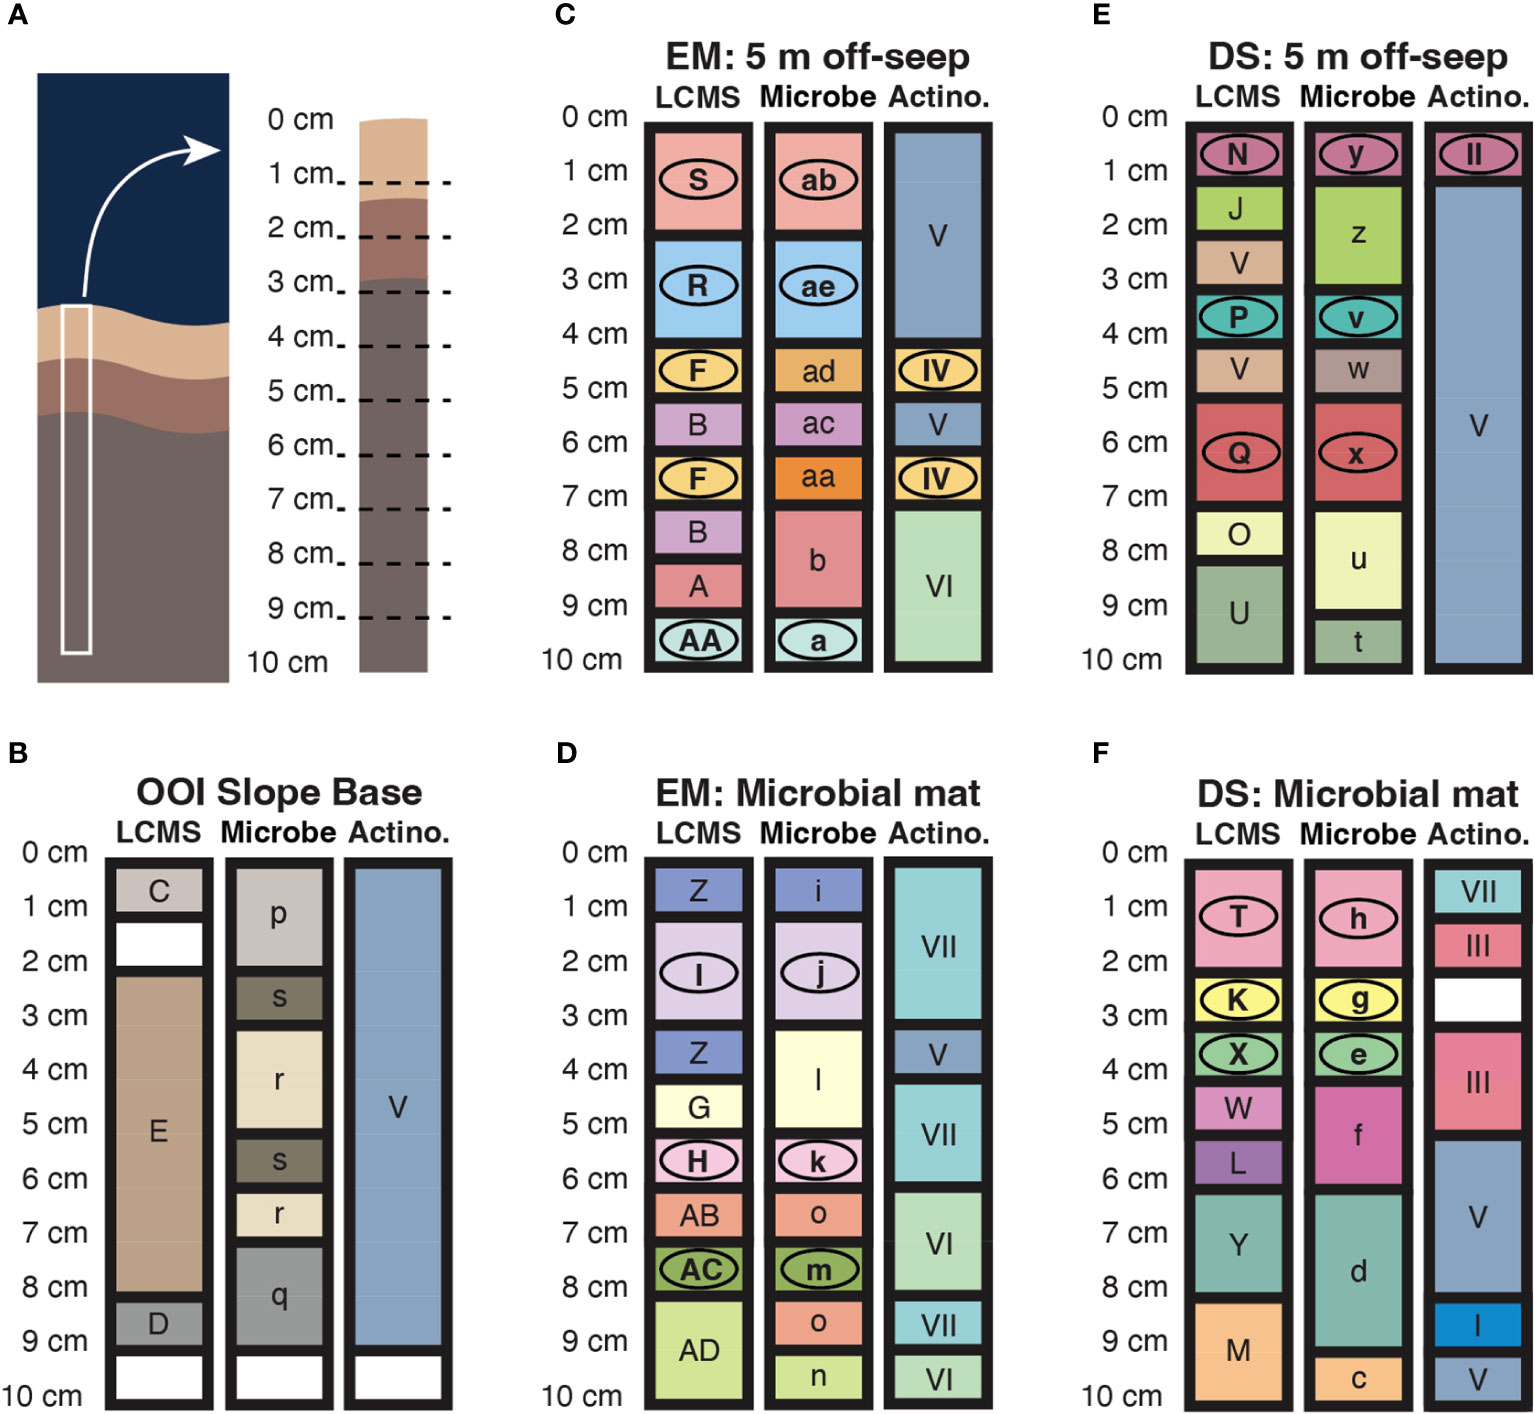
Figure 6 Core schematics representing the spatial distribution of similarity groupings according to SIMPROF analysis of LCMS features (LCMS), microbial 16S ASVs (Microbe), and actinobacterial 16S ASVs (Actino). Conserved color and label of core section within LCMS, Microbe or Actino datasets indicates that those sections belong to the same SIMPROF grouping. Circled letters indicate groupings that match across at least two datasets. (A) Diagrammatic representation of a sediment core in situ, in benthic substrate, alongside a representative core with depth graduations corresponding to sectioning of the core during sample processing. (B–F) Data for the non-seep OOI Slope Base, and off-seep and on-seep microbial mat for the younger Dagorlad (DS) and older Emyn Muil (EM) seeps, as labeled.
Significant positive and negative microbe~metabolite Spearman’s correlations occurred between microbial ASVs assigned at the family level and LCMS features annotated as putative peptides in either ontology (Supplementary Figure S1). The Log(X+1) normalized abundances of each of these features, separated by sample core depth for each site, is presented in Figure 7. Many individual LCMS features in this peptide dataset were simultaneously categorized in other NPClassifier pathways by CANOPUS, as anticipated for metabolites substituted with various functional groups, or with low probability peptide annotations. The 407 mass ion features annotated as “peptide” ranged from m/z 361.2448 to 1239.9522. While the overall proportion of peptides did not change much between cores (Figure 4), at the feature level there are differences in the pattern of these metabolites present in the different cores. Peptidic metabolites significantly correlated to microbes were predominant in the upper two-thirds of the older Emyn Muil on-seep microbial mat core with relatively few correlated metabolites distributed throughout all core sections (Figure 7). By comparison, the Emyn Muil 5 m off-seep core possessed a greater proportion of significantly correlated peptidic metabolites distributed from the surface to deeper in the core. The Dagorlad on-seep microbial mat and 5 m off-seep core profiles were comparable to each other and contained a majority of significantly correlated peptidic metabolites throughout the core, as was also found in the non-seep OOI core (Figure 7). The corresponding abundance of significantly correlated peptide metabolites plotted on the right-hand y axis indicates a decrease in peptide abundance with core section depth for the two Emyn Muil carbonate seep cores, but not for the soft sediment Dagorlad seep cores. This is in agreement with the trend across all metabolites (Figure 2). Notably, positive correlations were observed between actinobacterial families and putative cyclic peptides (Table 1). The complete dataset of correlations between features annotated as peptidic and microbial families can be found in the Supplemental Material (Supplementary Table S3, Supplementary Figure S1).
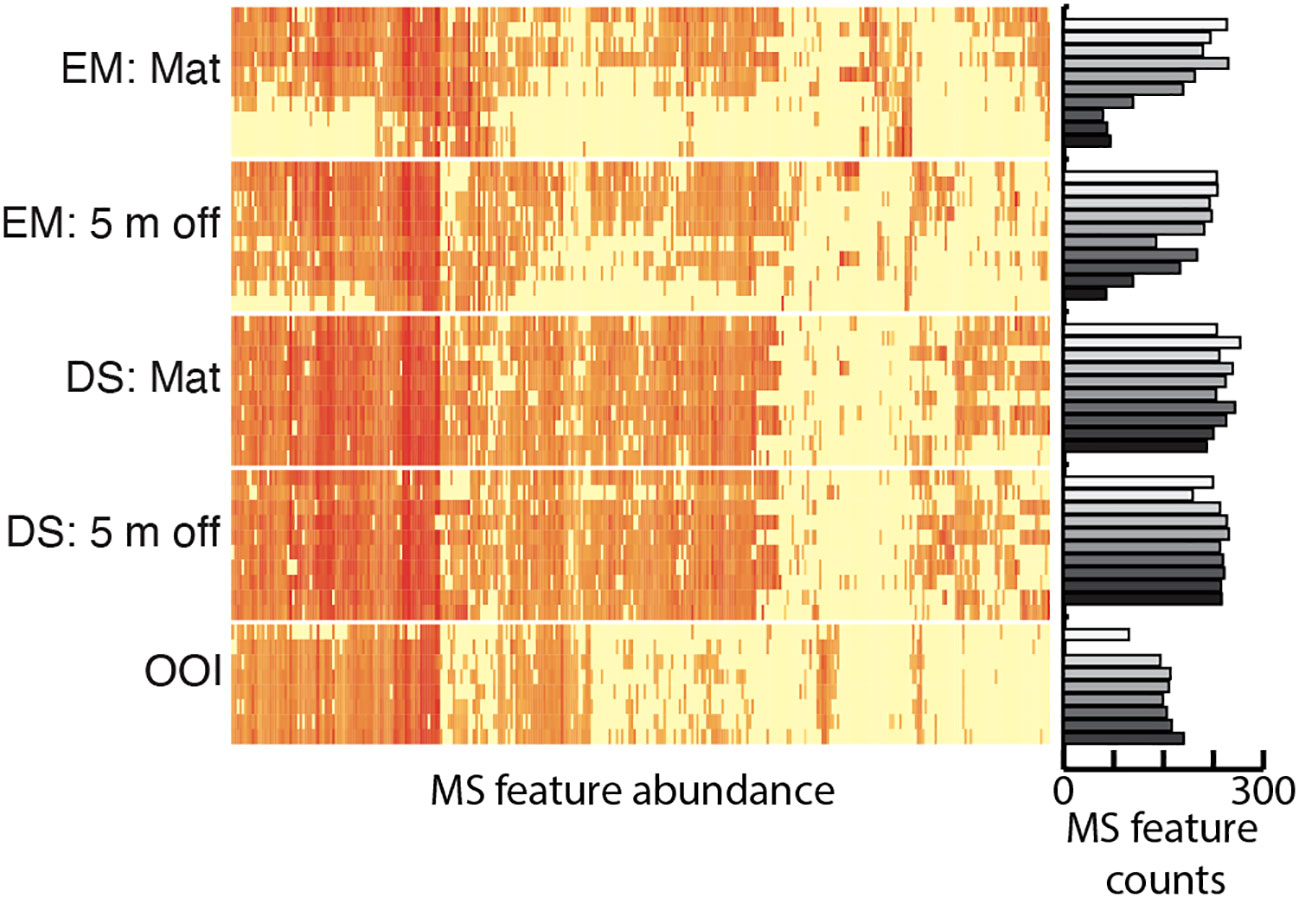
Figure 7 Heatmap of MS ion feature abundance representing distribution by core of putative peptidic metabolites with significant positive or negative correlations to families of microbial ASVs. Bar graph representing total numbers of features annotated as putative peptides by depth and core. For both heatmap and bar graphs, rows are stacked by depth within cores.
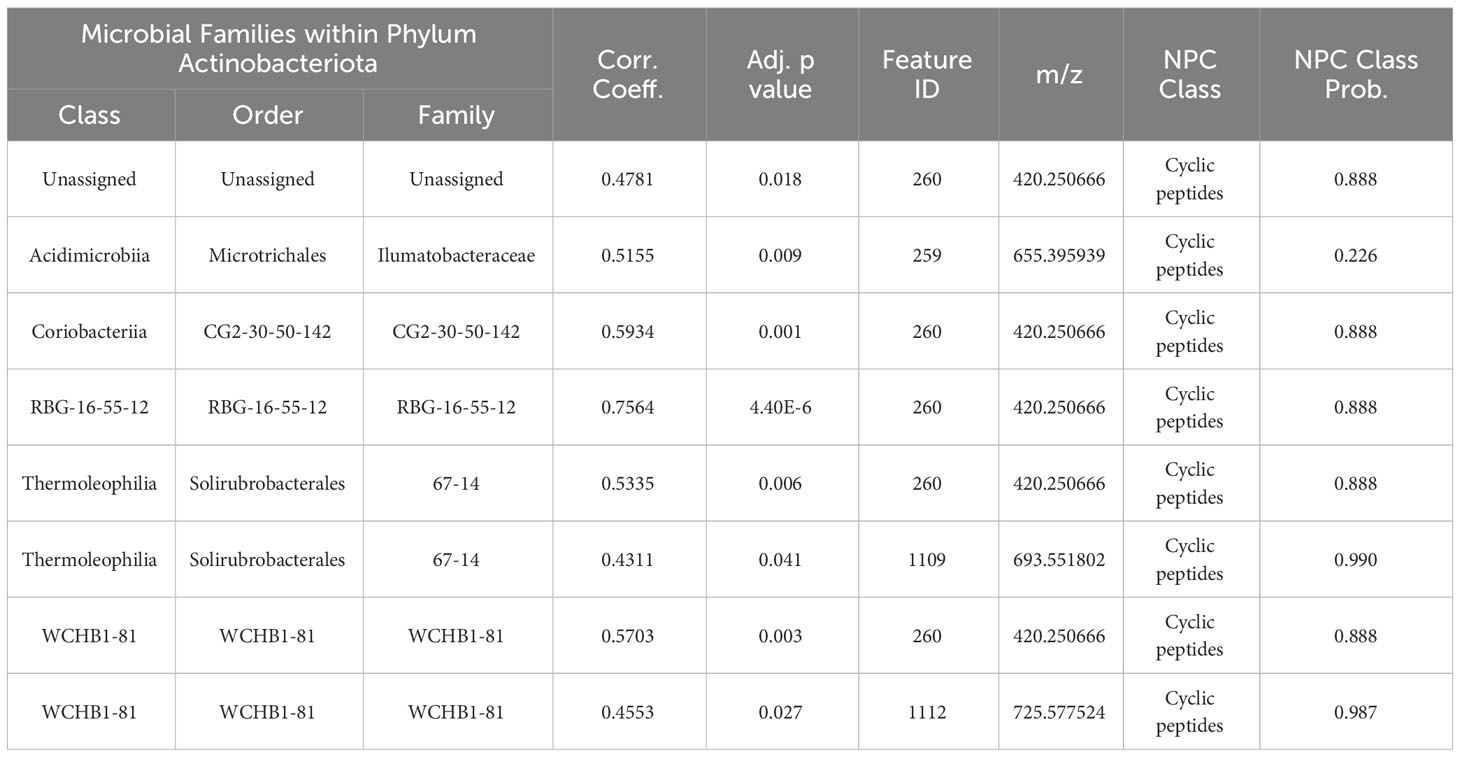
Table 1 Correlations between families within Actinobacteriota and mass features annotated as cyclic peptides by CANOPUS.
4 Discussion
Our coupled metabolomics and bacterial community survey revealed distinct chemistry at methane seep sites compared to non-seep sites at the level of microbial family and metabolite structure class. The microbial family level was chosen for our analyses to facilitate data handling and visualization, and for consistency with our previous report (Cummings et al., 2023). Furthermore, variations in specific molecular analogues within a series of biosynthetically related molecules (molecular family) may occur at the microbial genus, species or strain level, however, presence or absence of biosynthetic genes encoding a biologically important molecular family is most often noted at the microbial genus or higher taxonomic level (Donia et al., 2014). Chemical diversity changed across sites and core depth in relation to the changes in microbial diversity (Figures 5, 6). While the proportions of structure superclasses did not vary markedly across sites (Figures 2, 3), individual features and subclasses of compounds varied considerably between samples (e.g., for peptides, Figure 7).
We previously reported relative abundance of the 13 most abundant microbial families in the on-seep microbial mat and 5 m off-seep cores from Dagorlad and Emyn Muil seeps (Cummings et al., 2023). Notably, the microbial mat core from older Emyn Muil comprises a relatively large portion of anaerobic methanotrophic archaea (ANME), specifically ANME-1, not represented in the younger Dagorlad microbial mat. The Dagorlad microbial mat instead comprises a relatively high abundance of sulfur-reducing bacteria (SRB) in the families Desulfobulbaceae and Desulfobacteraceae, with ANME-2 present. The partitioning of ANME-1 and ANME-2 in this way has been reported to be driven by methane supply (Niu et al., 2023) and suggests that the older Emyn Muil seep may experience higher methane seepage than Dagorlad seep. However, in the absence of flux data, there are a variety of possible interpretations, such as is proposed in Cummings et al., 2023. Further, nitrogen-fixing ANME-2 and SRB have been deemed responsible for the majority of new nitrogen production previously (Dekas et al., 2014). Thus other limiting nutrients or processes, besides methane seepage, may impact the community compositions observed here.
The relatively high abundance of lipids and lipid-like molecules at both methane seep sites versus the non-seep OOI control site (Figures 2, 3) may be attributed to methane seep-specialized bacteria, which are known to produce large quantities of methanotroph-specific monounsaturated fatty acids (Guan et al, 2022; Cordova-Gonzalez et al., 2020) and terpenoid compounds including carotenoids, steroids, polyprenols, and hopanoids (Salvador-Castell et al., 2019; Grivard et al., 2022). The unknown reason for the highest proportion of lipids and lipid-like molecules at the older carbonate substrate seep (Figure 2A) is presumably associated with the specific microbial community (and geochemistry) at the older carbonate substrate seep. These observations present opportunities for future hypothesis-driven research, potentially using targeted lipid analysis. These chemosynthetic habitats add to the chemical diversity of the ocean, and our exploratory work here demonstrates that even comparable habitats (soft sediment microbial mats, fueled by methane) have divergent metabolites (Figure 4), demonstrating that different chemosynthetic habitats add to the overall chemical diversity present in marine systems.
As very few MS ion features had spectral library or in silico predicted annotations in GNPS, we relied on CANOPUS to provide structural information for LCMS features that could be used to compare sediment cores from different sites. CANOPUS annotations are predictions that require further analysis and additional data for confirmation and comprehensive structure elucidation. CANOPUS predictions are also less accurate for molecules with masses greater than 850 Da, and SIRIUS does not currently support formula prediction or structural class prediction from doubly charged ion features. The semantic ontologies (NPClassifier and ClassyFire) used for computational assignment of structural class or ‘pathway’ may offer several alternatives since many chemical compounds comprise multiple substructures which fall into separate structural categories. Hence, assignment of a reasonably complex compound to only one structural class or another is subjective and requires manual assignment. Thus, metabolites are considered only at the level of biosynthetic class in this study.
Marine sediment samples posed challenges for LCMS analysis that may have resulted in an underestimation of the NPs present. Salt comprised a large portion of the mass-limited extracts obtained and potentially contributed to ion suppression, reducing the sensitivity of the mass detector (Metwally et al., 2015). To prevent large quantities of salt from entering the mass spectrometer, the LC column eluent was directed to waste for the first several minutes, meaning that more polar metabolites were likely lost to waste. The proportions of metabolites belonging to the various pathways are also likely skewed by electrospray ionization (ESI) technique and (positive or negative) mode used, as well as parameters set in the mass detection method, which affect metabolite ionizability. For example, carbohydrates may be underrepresented because many glycans do not give strong signals in positive mode due to lack of basic sites for protonation (Grabarics et al., 2022). Additionally, there is a large amount of elemental sulfur in deep-sea sediments around methane seeps, and organic polysulfide compounds may require chemical ionization (CI) or Fast Atom Bombardment (FAB) for mass detection, as is the case for lissoclinotoxins (Davis et al., 2003) and lissoclibadins (Nakazawa et al., 2007). As a result, while we have used a powerful technique coupled with multiple computational pathways, we are likely underestimating the chemical diversity present in methane seep habitats.
The correlations between LCMS features and particular bacterial families determined here will direct future investigation. The heatmap of peptidic feature correlations to microbial families (Supplementary Figure S1) emphasizes the chemical and biological complexity of methane seep sediment communities, illustrating that any one LCMS feature may have multiple positive and negative correlations with diverse microbial families and vice versa. The heatmap is organized by similarity of patterns in correlations, so that MS ion features with similar patterns of correlation across microbial families are clustered together. Thus, in the upper portion of the heatmap, there are obvious groupings of microbial families (in rows) that display consistent positive and negative correlations with groupings of metabolites, which may form the basis of hypotheses for future investigation.
While it is not possible to confidently assign producing organisms or functional roles to (structurally unassigned) metabolites based on Spearman’s correlations (Carr et al., 2019), the co-occurrence of known biologically active classes of metabolites with bacterial families known to produce those metabolites demonstrates relevance and rationale for natural products biomedical and biotechnological research. Our data reveal that several bacterial families belonging to orders that have previously yielded structurally diverse bioactive NPs are positively correlated with LCMS features of the same structural classes as the known bioactive NPs. For example, positive correlations were seen between actinobacterial ASVs and several LCMS features annotated as cyclic peptides (Table 1). Actinobacteria are well-known to produce biologically active cyclic peptides (Zhao et al., 2018). Additionally, other bacterial families within Cellvibrionales (Han et al., 2013), Campylobacterales (Rischer et al., 2018) and Rhodobacterales (Ióca et al., 2021) also have significant positive correlations with putative peptidic features (correlation data in Supplementary Table S3), and members of these orders are known producers of bioactive nonribosomal peptides. Rhodobacteraceae are reported to produce peptide-derived alkaloids (Dickschat et al., 2005a; Dickschat et al., 2005b; Nicacio et al., 2017) and several LCMS features in our methane seep cores that were annotated as both alkaloid and peptide positively correlated with Rhodobacteraceae. The exploratory analysis undertaken here leverages significant bioinformatic and analytical advancement and provides a foundation for future work to realize the NP potential as well as the functional role of specialized metabolites in marine systems. In order to bridge the gap between specialized metabolite discovery by LCMS feature annotation and identification of biologically active metabolites relevant to human health, the adoption of computational methods is essential. Emerging tools such as NPAnalyst (Lee et al., 2022) or Pearson correlation pipelines (Nothias et al., 2018) permit mapping of biological activity observed for complex mixtures to individual components therein. The ability to discern structural and substructural motifs known to be associated with specific bioactivities further enables more targeted testing of limited sample quantities. In addition, tools such as GNPS may allow identification of other sources of the same or related metabolites of interest, facilitating access to larger quantities for more extensive biological testing and structure elucidation. The deep sea, beyond depths accessible by SCUBA, is only beginning to be included in the search for new NPs, with 75% of the new metabolites discovered found to be biologically active, and almost half having some anti-cancer potential (Skropeta and Wei, 2014). The challenges of accessing, isolating, and characterizing new organic molecules requires ongoing technological innovations and interdisciplinary collaborative research, which is well justified given the tremendous contributions to date of small organic compounds in chemical and biological research, and to global health (Cheng et al., 2014; Newman and Cragg, 2020; Carroll et al, 2022). Here we present a snapshot of the potential for NP discovery in methane fueled habitats, where we found different metabolite profiles at two sites at the same water depth in relatively close proximity. Seep biodiversity is known to vary latitudinally across the Cascadia Margin (Seabrook et al., 2018) and there is high microbial heterogeneity at <1 m spatial scale (Boetius and Suess, 2004; Cummings et al., 2023). In addition, seeps change over time, as do the biological communities that inhabit them (Cordes et al., 2005; Bowden et al., 2013; Thurber et al., 2020). If we presume our two seep sites are at the opposite ends of seep succession, temporal patterns also contribute to the diversity of metabolites present in these habitats. Continued and increased characterization of habitats at the interface of metabolome and microbiome science has astounding potential, especially considering the more than 3,500 seeps that are present but 99% unexplored on the Cascadia Margin (Merle et al., 2021), where this research was carried out. Characterizing the role of habitat heterogeneity on deep-sea ecosystem services, such as NP discovery, will allow informed management of deep-sea habitats with an eye towards future potential balancing immediate gains.
Data availability statement
The original contributions presented in the study are publicly available. These data can be found here: For the LCMS data, MassIVE ID MSV000090543, https://massive.ucsd.edu/ProteoSAFe/dataset.jsp?task=0de7900cc26b433fbf18049d0bdf622b; 16S sequence data, https://www.ncbi.nlm.nih.gov/bioproject/?term=PRJNA718843.
Author contributions
AT, KM contributed to conceptualization of the study and funding acquisition; all authors contributed to the investigation; MR and MC led formal analysis and data visualization with contributions by all authors; MR, KM and AT contributed to writing – original draft. All authors contributed to the article and approved the submitted version.
Funding
This research was funded by NOAA Ocean Exploration Grant NA19OAR0110301, and by the National Institutes of Health via NCCIH T32 AT010131 (support of MR), NIGMS 1R01GM132649 (KM), and National Science Foundation grants 2046800 and 1933165 (AT).
Acknowledgments
We thank Prof. Benjamin Philmus for assistance with LCMS data acquisition.
Conflict of interest
The authors declare that the research was conducted in the absence of any commercial or financial relationships that could be construed as a potential conflict of interest.
Publisher’s note
All claims expressed in this article are solely those of the authors and do not necessarily represent those of their affiliated organizations, or those of the publisher, the editors and the reviewers. Any product that may be evaluated in this article, or claim that may be made by its manufacturer, is not guaranteed or endorsed by the publisher.
Supplementary material
The Supplementary Material for this article can be found online at: https://www.frontiersin.org/articles/10.3389/fmars.2023.1197338/full#supplementary-material
Supplementary Figure S1 | Heatmap of significant positive (red) and negative (blue) correlations between putative peptidic LCMS features and families of microbial ASVs.
Supplementary Table S3 | Dataset of correlations between all features annotated as peptidic and microbial families.
References
Aleti G., Kohn J. N., Troyer E. A., Weldon K., Huang S., Tripathi A., et al. (2022). Salivary bacterial signatures in depression-obesity comorbidity are associated with neurotransmitters and neuroactive dipeptides. BMC Microbiol. 22, 75. doi: 10.1186/s12866-022-02483-4
Bauermeister A., Mannochio-Russo H., Costa-Lotufo L. V., Jarmusch A. K., Dorrestein P. C. (2022). Mass spectrometry-based metabolomics in microbiome investigations. Nat. Rev. Microbiol. 20, 143–160. doi: 10.1038/s41579-021-00621-9
Bernardino A. F., Levin L. A., Thurber A. R., Smith C. R. (2012). Comparative composition, diversity and trophic ecology of sediment macrofauna at vents, seeps and organic falls. PloS One 7, e33515. doi: 10.1371/journal.pone.0033515
Boetius A., Suess E. (2004). Hydrate Ridge: A natural laboratory for the study of microbial life fueled by methane from near-surface gas hydrates. Chem. Geol. 205, 291–310. doi: 10.1016/j.chemgeo.2003.12.034
Bowden D. A., Rowden A. A., Thurber A. R., Baco A. R., Levin L. A., Smith C. R. (2013). Cold seep epifaunal communities on the Hikurangi margin, New Zealand: composition, succession, and vulnerability to human activities. PloS One 8, e76869. doi: 10.1371/journal.pone.0076869
Carroll A. R., Copp B. R., Davis R. A., Keyzers R. A., Prinsep M. R. (2022). Marine natural products. Nat. Prod. Rep. 39, 1122–1171. doi: 10.1039/d1np00076d
Clarke, Gorley (2015). Getting started with PRIMER v7 (Plymouth: PRIMER-E: Plymouth). Available at: http://updates.primer-e.com/primer7/manuals/Getting_started_with_PRIMER_7.pdf.
Carr A., Diener C., Baliga N. S., Gibbons S. M. (2019). Use and abuse of correlation analyses in microbial ecology. ISME J. 13, 2647–2655. doi: 10.1038/s41396-019-0459-z
Cheng G., Hao H., Xie S., Wang X., Dai M., Huang L., et al. (2014). Antibiotic alternatives: the substitution of antibiotics in animal husbandry? Front. Microbiol. 5. doi: 10.3389/fmicb.2014.00217
Cordes E. E., Hourdez S., Predmore B. L., Redding M. L., Fisher C. R. (2005). Succession of hydrocarbon seep communities associated with the long-lived foundation species Lamellibrachia luymesi. Mar. Ecol. Prog. Ser. 305, 17–29. doi: 10.3354/meps305017
Cordova-Gonzalez A., Birgel D., Kappler A., Peckmann J. (2020). Carbon stable isotope patterns of cyclic terpenoids: A comparison of cultured alkaliphilic aerobic methanotrophic bacteria and methane-seep environments. Org. Geochem. 139, 103940. doi: 10.1016/j.orggeochem.2019.103940
Cordes E. E., Bergquist D. C., Fisher C. R. (2009). Macro-ecology of Gulf of Mexico cold seeps. Ann. Rev. Mar. Sci. 1, 143–168. doi: 10.1146/annurev.marine.010908.163912
Cummings S., Ardor Bellucci L. M., Seabrook S., Raineault N. A., McPhail K. L., Thurber A. R. (2023). Variations and gradients between methane seep and off-seep microbial communities in a submarine canyon system in the Northeast Pacific. PeerJ 11, e15119. doi: 10.7717/peerj.15119
Davis R. A., Sandoval I. T., Concepcion G. P., Moreira da Rocha R., Ireland C. M. (2003). Lissoclinotoxins E and F, novel cytotoxic alkaloids from a Philippine didemnid ascidian. Tetrahedron 59, 2855–2859. doi: 10.1016/S0040-4020(03)00335-1
de Jonge N. F., Mildau K., Meijer D., Louwen J. J.R., Bueschl C., Huber F., et al. (2022). Good practices and recommendations for using and benchmarking computational metabolomics metabolite annotation tools. Metabolomics 18 (12), 103. doi: 10.1007/s11306-022-01963-y
Dekas A. E., Chadwick G. L., Bowles M. W., Joye S. B., Orphan V. J. (2014). Spatial distribution of nitrogen fixation in methane seep sediment and the role of the ANME archaea. Environ. Microbiol. 16, 3012–3029. doi: 10.1111/1462-2920.12247
Dekas A. E., Connon S. A., Chadwick G. L., Trembath-Reichert E., Orphan V. J. (2016). Activity and interactions of methane seep microorganisms assessed by parallel transcription and FISH-NanoSIMS analyses. ISME J. 10, 678–692. doi: 10.1038/ismej.2015.145
Dickschat J. S., Reichenbach H., Wagner-Döbler I., Schulz S. (2005a). Novel pyrazines from the MyxobacteriumChondromyces crocatusand marine bacteria. Eur. J. Org. Chem. 2005, 4141–4153. doi: 10.1002/ejoc.200500280
Dickschat J. S., Wagner-Döbler I., Schulz S. (2005b). The chafer pheromone buibuilactone and ant pyrazines are also produced by marine bacteria. J. Chem. Ecol. 31, 925–947. doi: 10.1007/s10886-005-3553-9
Djoumbou Feunang Y., Eisner R., Knox C., Chepelev L., Hastings J., Owen G., et al. (2016). ClassyFire: automated chemical classification with a comprehensive, computable taxonomy. J. Cheminform. 8, 61. doi: 10.1186/s13321-016-0174-y
Donia M. S., Cimermancic P., Schulze C. J., Brown L. C.W., Martin J., Mitreva M., et al. (2014). A systematic analysis of biosynthetic gene clusters in the human microbiome reveals a common family of antibiotics. Cell 158 (6), 1402–1145. doi: 10.1016/j.cell.2014.08.032
Dührkop K., Fleischauer M., Ludwig M., Aksenov A. A., Melnik A. V., Meusel M., et al. (2019). SIRIUS 4: a rapid tool for turning tandem mass spectra into metabolite structure information. Nat. Methods 16, 299–302. doi: 10.1038/s41592-019-0344-8
Dührkop K., Nothias L.-F., Fleischauer M., Reher R., Ludwig M., Hoffmann M. A., et al. (2021). Systematic classification of unknown metabolites using high-resolution fragmentation mass spectra. Nat. Biotechnol. 39, 462–471. doi: 10.1038/s41587-020-0740-8
Dührkop K., Shen H., Meusel M., Rousu J., Böcker S. (2015). Searching molecular structure databases with tandem mass spectra using CSI:FingerID. Proc. Natl. Acad. Sci. U. S. A. 112, 12580–12585. doi: 10.1073/pnas.1509788112
Grabarics M., Lettow M., Kirschbaum C., Greis K., Manz C., Pagel K. (2022). Mass spectrometry-based techniques to elucidate the sugar code. Chem. Rev. 122, 7840–7908. doi: 10.1021/acs.chemrev.1c00380
Grivard A., Goubet I., Filho L. M. d. S., Thiéry V., Chevalier S., de Oliveira-Junior R. G., et al. (2022). Archaea carotenoids: natural pigments with unexplored innovative potential. Mar. Drugs 20, 524. doi: 10.3390/md20080524
Grupe B. M., Krach M. L., Pasulka A. L., Maloney J. M., Levin L. A., Frieder C. A. (2015). Methane seep ecosystem functions and services from a recently discovered southern California seep. Mar. Ecol. 36, 91–108. doi: 10.1111/maec.12243
Guan H., Feng D., Birgel D., Kiel S., Peckmann J., Li S., et al. (2022). Lipid biomarker patterns reflect nutritional strategies of seep-dwelling bivalves from the South China Sea. Front. Mar. Sci. 9. doi: 10.3389/fmars.2022.831286
Han A. W., Sandy M., Fishman B., Trindade-Silva A. E., Soares C. A. G., Distel D. L., et al. (2013). Turnerbactin, a novel triscatecholate siderophore from the shipworm endosymbiont Teredinibacter turnerae T7901. PloS One 8, e76151. doi: 10.1371/journal.pone.0076151
Ióca L. P., Dai Y., Kunakom S., Diaz-Espinosa J., Krunic A., Crnkovic C. M., et al. (2021). A family of nonribosomal peptides modulate collective behavior in pseudovibrio bacteria isolated from marine sponges*. Angew. Chem. Int. Ed. Engl. 60, 15891–15898. doi: 10.1021/acs.jnatprod.1c00399
Kim H. W., Wang M., Leber C. A., Nothias L.-F., Reher R., Kang K. B., et al. (2021). NPClassifier: A deep neural network-based structural classification tool for natural products. J. Nat. Prod. 84, 2795–2807. doi: 10.1021/acs.jnatprod.1c00399
Knittel K., Boetius A. (2009). Anaerobic oxidation of methane: progress with an unknown process. Annu. Rev. Microbiol. 63, 311–334. doi: 10.1146/annurev.micro.61.080706.093130
Lee S., van Santen J. A., Farzaneh N., Liu D. Y., Pye C. R., Baumeister T. U. H., et al. (2022). NP analyst: an open online platform for compound activity mapping. ACS Cent. Sci. 8, 223–234. doi: 10.1021/acscentsci.1c01108
Levin L. A. (2005). “Ecology of cold seep sediments: interactions of fauna with flow, chemistry and microbes,” in Oceanography and Marine Biology (Boca Raton, FL: CRC Press), 11–56. doi: 10.1201/9781420037449-3
MassIVE (n.d). Available at: https://massive.ucsd.edu/ProteoSAFe/static/massive.jsp (Accessed March 7, 2023).
Merle S. G., Embley R. W., Johnson H. P., Lau T.-K., Phrampus B. J., Raineault N. A., et al. (2021). Distribution of methane plumes on cascadia margin and implications for the landward limit of methane hydrate stability. Front. Earth Sci. Chin. 9. doi: 10.3389/feart.2021.531714
Metwally H., McAllister R. G., Konermann L. (2015). Exploring the mechanism of salt-induced signal suppression in protein electrospray mass spectrometry using experiments and molecular dynamics simulations. Anal. Chem. 87, 2434–2442. doi: 10.1021/ac5044016
Morehouse N. J., Clark T. N., McMann E. J., van Santen J. A., Haeckl F. P. J., Gray C. A., et al. (2023). Annotation of natural product compound families using molecular networking topology and structural similarity fingerprinting. Nat. Commun. 14, 308. doi: 10.1038/s41467-022-35734-z
Nakazawa T., Xu J., Nishikawa T., Oda T., Fujita A., Ukai K., et al. (2007). Lissoclibadins 4-7, polysulfur aromatic alkaloids from the Indonesian ascidian Lissoclinum cf. badium. J. Nat. Prod. 70, 439–442. doi: 10.1021/np060593c
Neuhaus G., Aron A., Isemonger E., Petras D., Waterworth S., Gentry E., et al. (2022). Metabolomics spatial survey of modern stromatolites from South Africa and characterization of ibhayipeptolides. Cambridge: Cambridge Open Engage. ChemRxiv. doi: 10.26434/chemrxiv-2022-1vr86
Newman D. J., Cragg G. M. (2020). Natural products as sources of new drugs over the nearly four decades from 01/1981 to 09/2019. J. Nat. Prod. 83, 770–803. doi: 10.1021/acs.jnatprod.9b01285
Nicacio K. J., Ióca L. P., Fróes A. M., Leomil L., Appolinario L. R., Thompson C. C., et al. (2017). Cultures of the marine bacterium pseudovibrio denitrificans ab134 produce bromotyrosine-derived alkaloids previously only isolated from marine sponges. J. Nat. Prod. 80, 235–240. doi: 10.1021/acs.jnatprod.6b00838
Nie Z., Xu X., Shao N., He J., Li P., Xu P., et al. (2023). Integrative analysis of microbiome and metabolome reveals the linkage between gut microbiota and carp growth. Environ. Res. 220, 115133. doi: 10.1016/j.envres.2022.115133
Niu M., Deng L., Su L., Ruff S.E., Yang N., Luo M., et al. (2023). Methane supply drives prokaryotic community assembly and networks at cold seeps of the South China Sea. Mol. Ecol. 32 (3), 660–795. doi: 10.1111/mec.16786
Nothias L.-F., Nothias-Esposito M., da Silva R., Wang M., Protsyuk I., Zhang Z., et al. (2018). Bioactivity-based molecular networking for the discovery of drug leads in natural product bioassay-guided fractionation. J. Nat. Prod. 81, 758–767. doi: 10.1021/acs.jnatprod.7b00737
Parada A. E., Needham D. M., Fuhrman J. A. (2016). Every base matters: assessing small subunit rRNA primers for marine microbiomes with mock communities, time series and global field samples. Environ. Microbiol. 18, 1403–1414. doi: 10.1111/1462-2920.13023
Patin N. V., Schorn M., Aguinaldo K., Lincecum T., Moore B. S., Jensen P. R. (2017). Effects of actinomycete secondary metabolites on sediment microbial communities. Appl. Environ. Microbiol. 83, e02676-16. doi: 10.1128/AEM.02676-16
Pluskal T., Castillo S., Villar-Briones A., Oresic M. (2010). MZmine 2: modular framework for processing, visualizing, and analyzing mass spectrometry-based molecular profile data. BMC Bioinf. 11, 395. doi: 10.1186/1471-2105-11-395
R Core Team (2022) R: A Language and Environment for Statistical Computing. Available at: https://www.R-project.org/.
Reeburgh W. S. (2007). Oceanic methane biogeochemistry. Chem. Rev. 107, 486–513. doi: 10.1021/cr050362v
Rischer M., Raguž L., Guo H., Keiff F., Diekert G., Goris T., et al. (2018). Biosynthesis, synthesis, and activities of barnesin A, a NRPS-PKS hybrid produced by an anaerobic epsilonproteobacterium. ACS Chem. Biol. 13, 1990–1995. doi: 10.1021/acschembio.8b00445
Rothman J. A., Leger L., Kirkwood J. S., McFrederick Q. S. (2019). Cadmium and selenate exposure affects the honey bee microbiome and metabolome, and bee-associated bacteria show potential for bioaccumulation. Appl. Environ. Microbiol. 85, e01411-19. doi: 10.1128/AEM.01411-19
Salvador-Castell M., Tourte M., Oger P. M. (2019). In search for the membrane regulators of archaea. Int. J. Mol. Sci. 20, 4434. doi: 10.3390/ijms20184434
Seabrook S., Cabrera De Leo F., Thurber A. (2019). Flipping for Food: The use of a methane seep by Tanner Crabs (Chionoecetes tanneri). Front. Mar. Sci. 6. doi: 10.3389/fmars.2019.00043
Seabrook S., De Leo C., Baumberger T., Raineault N., Thurber A. R. (2018). Heterogeneity of methane seep biomes in the Northeast Pacific. Deep Sea Res. Part 2 Top. Stud. Oceanogr. 150, 195–209. doi: 10.1016/j.dsr2.2017.10.016
Shaffer J. P., Nothias L.-F., Thompson L. R., Sanders J. G., Salido R. A., Couvillion S. P., et al. (2022). Standardized multi-omics of Earth’s microbiomes reveals microbial and metabolite diversity. Nat. Microbiol. 7, 2128–2150. doi: 10.1038/s41564-022-01266-x
Skropeta D., Wei L. (2014). Recent advances in deep-sea natural products. Nat. Prod. Rep. 31, 999–1025. doi: 10.1039/c3np70118b
Sun L., Wang Y., Ma D., Wang L., Zhang X., Ding Y., et al. (2022). Differential responses of the rhizosphere microbiome structure and soil metabolites in tea (Camellia sinensis) upon application of cow manure. BMC Microbiol. 22, 55. doi: 10.1186/s12866-022-02470-9
Thurber A. R., Seabrook S., Welsh R. M. (2020). Riddles in the cold: Antarctic endemism and microbial succession impact methane cycling in the Southern Ocean. Proc. Biol. Sci. 287, 20201134. doi: 10.1098/rspb.2020.1134
Torondel B., Ensink J. H.J., Gundogdu O., Ijaz U. Z., Parkhill J., Abdelahi F., et al. (2016). Assessment of the influence of intrinsic environmental and geographical factors on the bacterial ecology of pit latrines. Microbial Biotechnol. 9 (2), 209–223. doi: 10.1111/1751-7915.12334
Wang M., Carver J. J., Phelan V. V., Sanchez L. M., Garg N., Peng Y., et al. (2016). Sharing and community curation of mass spectrometry data with Global Natural Products Social Molecular Networking. Nat. Biotechnol. 34, 828–837. doi: 10.1038/nbt.3597
Wickham H., Averick M., Bryan J., Chang W., McGowan L. D., François R., et al. (2019). Welcome to the tidyverse. J. Open Source Softw. 4, 1686. doi: 10.21105/joss.01686.Wilson
Zhang S.-L., Cheng L.-S., Zhang Z.-Y., Sun H.-T., Li J.-J. (2023). Untangling determinants of gut microbiota and tumor immunologic status through a multi-omics approach in colorectal cancer. Pharmacol. Res. 188, 106633. doi: 10.1016/j.phrs.2022.106633
Keywords: methane seep, deep-sea, untargeted metabolomics, microbial community, tandem mass spectrometry, environmental analysis
Citation: Redick MA, Cummings ME, Neuhaus GF, Ardor Bellucci LM, Thurber AR and McPhail KL (2023) Integration of untargeted metabolomics and microbial community analyses to characterize distinct deep-sea methane seeps. Front. Mar. Sci. 10:1197338. doi: 10.3389/fmars.2023.1197338
Received: 30 March 2023; Accepted: 03 October 2023;
Published: 20 October 2023.
Edited by:
Mark Alexander Lever, The University of Texas at Austin, United StatesReviewed by:
Maria Pachiadaki, Woods Hole Oceanographic Institution, United StatesLauren M. Seyler, Stockton University, United States
Copyright © 2023 Redick, Cummings, Neuhaus, Ardor Bellucci, Thurber and McPhail. This is an open-access article distributed under the terms of the Creative Commons Attribution License (CC BY). The use, distribution or reproduction in other forums is permitted, provided the original author(s) and the copyright owner(s) are credited and that the original publication in this journal is cited, in accordance with accepted academic practice. No use, distribution or reproduction is permitted which does not comply with these terms.
*Correspondence: Kerry L. McPhail, a2VycnkubWNwaGFpbEBvcmVnb25zdGF0ZS5lZHU=; Andrew R. Thurber, YW5kcmV3LnRodXJiZXJAb3JlZ29uc3RhdGUuZWR1