 Charlotte L. Briddon1
 Maria Nicoară1
 Adriana Hegedüs1Adina Niculea2
 Richard Bellerby3,4,5Wenche Eikrem3,6
 Bibiana G. Crespo3
 Sam Dupont7,8
 Bogdan Drugă1*
- 1Taxonomy and Ecology, Institute of Biological Research (NIRDBS), Cluj-Napoca, Romania
- 2Taxonomy and Ecology, Faculty of Biology and Geology, Babeș-Bolyai University, Cluj-Napoca, Romania
- 3Department of Oceanography, Norweigan Institute for Water Research, Bergen, Norway
- 4SKLEC-NIVA Centre for Marine and Coastal Research, State Key Laboratory for Estuarine and Coastal Research, East China Normal University, Shanghai, China
- 5Faculty of Applied Sciences, UCSI University, Kuala Lumpur, Malaysia
- 6Natural History Museum, University of Oslo, Oslo, Norway
- 7Department of Biological & Environmental Sciences, University of Gothenberg, Fiskebäckskil, Sweden
- 8Radioecology Laboratory, International Atomic Energy Agency (IAEA), Monaco, Monaco
Understanding the long-term response of key marine phytoplankton species to ongoing global changes is pivotal in determining how oceanic community composition will respond over the coming decades. To better understand the impact of ocean acidification and warming, we acclimated two strains of Skeletonema marinoi isolated from natural communities to three pCO2 (400 μatm, 600 μatm and 1000 μatm) for 8 months and five temperature conditions (7°C, 10°C, 13°C, 16°C and 19°C) for 11 months. These strains were then tested in natural microbial communities, exposed to three pCO2 treatments (400 μatm, 600 μatm and 1000 μatm). DNA metabarcoding of the 16S and 18S gene for prokaryotes and eukaryotes respectively was used to show differences in abundance and diversity between the three CO2 treatments. We found there were no significant differences in acclimated S. marinoi concentrations between the three pCO2 treatments, most likely due to the high variability these strains experience in their natural environment. There were significant compositional differences between the pCO2 treatments for prokaryotes suggesting that indirect changes to phytoplankton-bacteria interactions could be a possible driver of bacterial community composition. Yet, there were no differences for eukaryotic community composition, with all treatments dominated by diatoms (but not the acclimated S. marinoi) resulting in similar biodiversity. Furthermore, strain-specific differences in community composition suggests interactions between prokaryotic and eukaryotic taxa could play a role in determining future community composition.
Introduction
Rapidly escalating global changes have led marine organisms to adapt to unprecedented rates of change (Collins et al., 2014), with global warming and ocean acidification being two of the most serious challenges facing phytoplankton. Northern oceans have warmed by on average 0.7°C (IPCC, 2022) and are projected to rise by an additional 3°C by the end of the century (Collins et al., 2014). In addition, the world’s oceans have absorbed 26% of anthropogenic CO2 emissions, leading to an average pH decline of 0.1 units since pre-industrial times (Friedlingstein et al., 2022), with implications for the chemical balance of surface waters (Caldeira and Wickett, 2003). If anthropogenic CO2 emissions continue at a similar rate, future atmospheric CO2 concentrations are projected to reach 1000 μatm, which will result in a further decline in the mean surface pH of 0.3-0.4 units by 2100 (Pörtner et al., 2019). Moreover, oceanic pH is also influenced by a variety of biochemical processes such as primary production, respiration, algal blooms and organic matter decay (AMAP, 2018), which leads to diurnal and seasonal fluctuations in pCO2 (Schulz and Riebesell, 2013; Liu et al., 2017; Vargas et al., 2022). As pCO2 of seawater increases, the decline in buffering capacity will lead to amplifications in pCO2 fluctuations (Angeles Gallego et al., 2018). However, the biological effects of oceanic warming and acidification vary between species and locations (Vargas et al., 2022), therefore, understanding how organisms respond is critical in determining the impact on the marine food web.
The effects of temperature and pCO2 have been extensively studied, highlighting a wide range of responses to primary productivity and community composition (Feng et al., 2009; Gao and Campbell, 2014; Hoppe et al., 2018; Kim and Kim, 2021). Ocean warming increases stratification, constraining nutrient supply and altering the thermal regime in the surface layer (Winder and Sommer, 2012), leading to a reduction in phytoplankton biomass and productivity (Lewandowska et al., 2014; Behrenfeld et al., 2016). Increased pCO2 concentrations have been shown to facilitate inorganic carbon acquisition in some phytoplankton, enhancing primary production (Rost et al., 2008), leading to changes in phytoplankton-bacteria interactions. As bacteria are highly dependent on algae exudates for growth (and also regenerate ammonium for phytoplankton growth), any changes to pCO2 concentrations will influence the interactions between these two groups (Van Den Meersche et al., 2004). Previous studies have shown that the response of bacteria to changing pCO2 concentrations is linked to phytoplankton, rather than being a direct effect of pCO2, therefore, any increases in phytoplankton (due to higher pCO2) could lead to an enhancement of bacteria biomass (De Kluijver et al., 2010).Changes to these interactions can also influence nutrient fluxes and have implications for the marine food web (Seymour et al., 2017). Ocean acidification can also cause varying responses of phytoplankton, resulting in shifts in the competitive fitness between different phytoplankton groups, substantially altering the community composition (Dutkiewicz et al., 2015). Other studies found only subtle changes in community composition (Kim et al., 2006), whilst Hoppe et al. (2018) found that Arctic phytoplankton community composition and primary production were unresponsive to ocean acidification. As seawater pCO2 concentrations increase, it has been shown that species which benefit from CO2 fertilisation may become more dominant at the expense of those species which are unresponsive or negatively affected by an increase in CO2 (Bach et al., 2017). Studies have shown increasing pCO2 concentrations give a neutral or slight benefit to diatoms and is strongly beneficial for N2 fixing cyanobacteria, with coccolithophores negatively affected (Rost et al., 2008; Sommer et al., 2015). Collins et al. (2014) found that diatoms possess RubisCOs with high CO2 affinities which could partially explain why they have shown small responses to high pCO2; however, species-specific responses must be considered. Nevertheless, the response of acclimated phytoplankton communities to future high pCO2 conditions have yet to be investigated.
Skeletonema marinoi is one of the most important and abundant primary producers in coastal temperate regions and, is critical for the marine food web (Sefbom et al., 2022). As ocean warming and acidification have the potential to influence microbial community composition, they can drive physiological and evolutionary changes within taxa such as Skeletonema (Maugendre et al., 2015). Acclimation of a dominant species such as S. marinoi to the projected future conditions (temperature and pCO2 concentrations), allows for an investigation into the impacts of environmental changes to the microbial community (Collins et al., 2014), whilst still considering the pCO2 variability species experience in their natural environments. As this species inhabits a wide geographical area and displays population genetic differentiation (Sefbom et al., 2018), acclimating S. marinoi strains from different geographical regions, allows us to understand the physiological and adaptive capabilities of a key phytoplankton taxa and how these vary within species (Li et al., 2021). Previous studies have resulted in conflicting reports on how increased temperature and pCO2 concentrations influences the growth rate of Skeletonema (Zheng et al., 2015; Gao et al., 2019; Chen et al., 2021). Inoculating S. marinoi strains acclimated to future environmental scenarios into mesocosm experiments permits the replication of more realistic conditions allowing us to test their competitive ability against natural microbial communities (Briddon et al., 2022).
The main aim of this study is to understand whether the long-term response of S. marinoi to global changes, specifically, ocean warming and acidification could be predicted by using strains that were previously acclimated to various conditions. To determine how different pCO2 concentrations will influence eukaryotes and prokaryotes, we compared three pCO2 treatments, 400 μatm, 600 μatm and 1000 μatm. We also assessed if acclimation to increased temperature or pCO2 gave two strains of S. marinoi, a competitive advantage against natural microbial communities exposed to different pCO2 treatments. Changes in biomass were measured using a PHYTO-PAM-II (Multiple Excitation Wavelength Phytoplankton and Photosynthesis Analyser) and DNA metabarcoding to show differences in abundance and diversity between the three CO2 treatments. Understanding the response to global stressors of dominant marine phytoplankton species can help to project more accurately their response to forecasted future conditions and the impact on the marine food web.
Materials and methods
Biological materials and growth conditions of the Skeletonema strains (S8 and S17)
The Skeletonema strains used in this study were isolated from two locations along the Norwegian Coast. Water samples were collected using the automated sampling system operated by NIVA (Norwegian Institute for water Research) on board the coastal steamer MS Trollfjord. Strain S8 originated from a water sample (temperature; 10.02°C and 33.86 psu) collected in the outer part of Tanafjorden, Northern Norway (70.8306° N, 28.4723° E; average summer surface water temperature of 11°C, Figure 1). Strain S17, originated from a water sample (temperature; 13.37°C and 25.54 psu; Table S1) collected in Sognesjøen (61.1554° N, 6.5806° E; average summer surface water temperature of 17°C; Figure 1) in the Sognesjøen region on the Norwegian West Coast. The strains were brought into unialgal culture using a combination of serial culturing technique and single cell isolation (Andersen and Kawachi, 2005). The strains were then deposited as non-axenic cultures in the Collection of Cyanobacteria and Algae (AICB) at the Institute of Biological Research in Cluj-Napoca, Romania (Dragoș, 1997). The phylogenetic identity of the strains was confirmed using the 18S rDNA gene amplified with specific primers (Hadziavdic et al., 2014). The PCR fragments were sequenced by a third-party company (Macrogen Europe, Amsterdam, The Netherlands), who confirmed species identification.
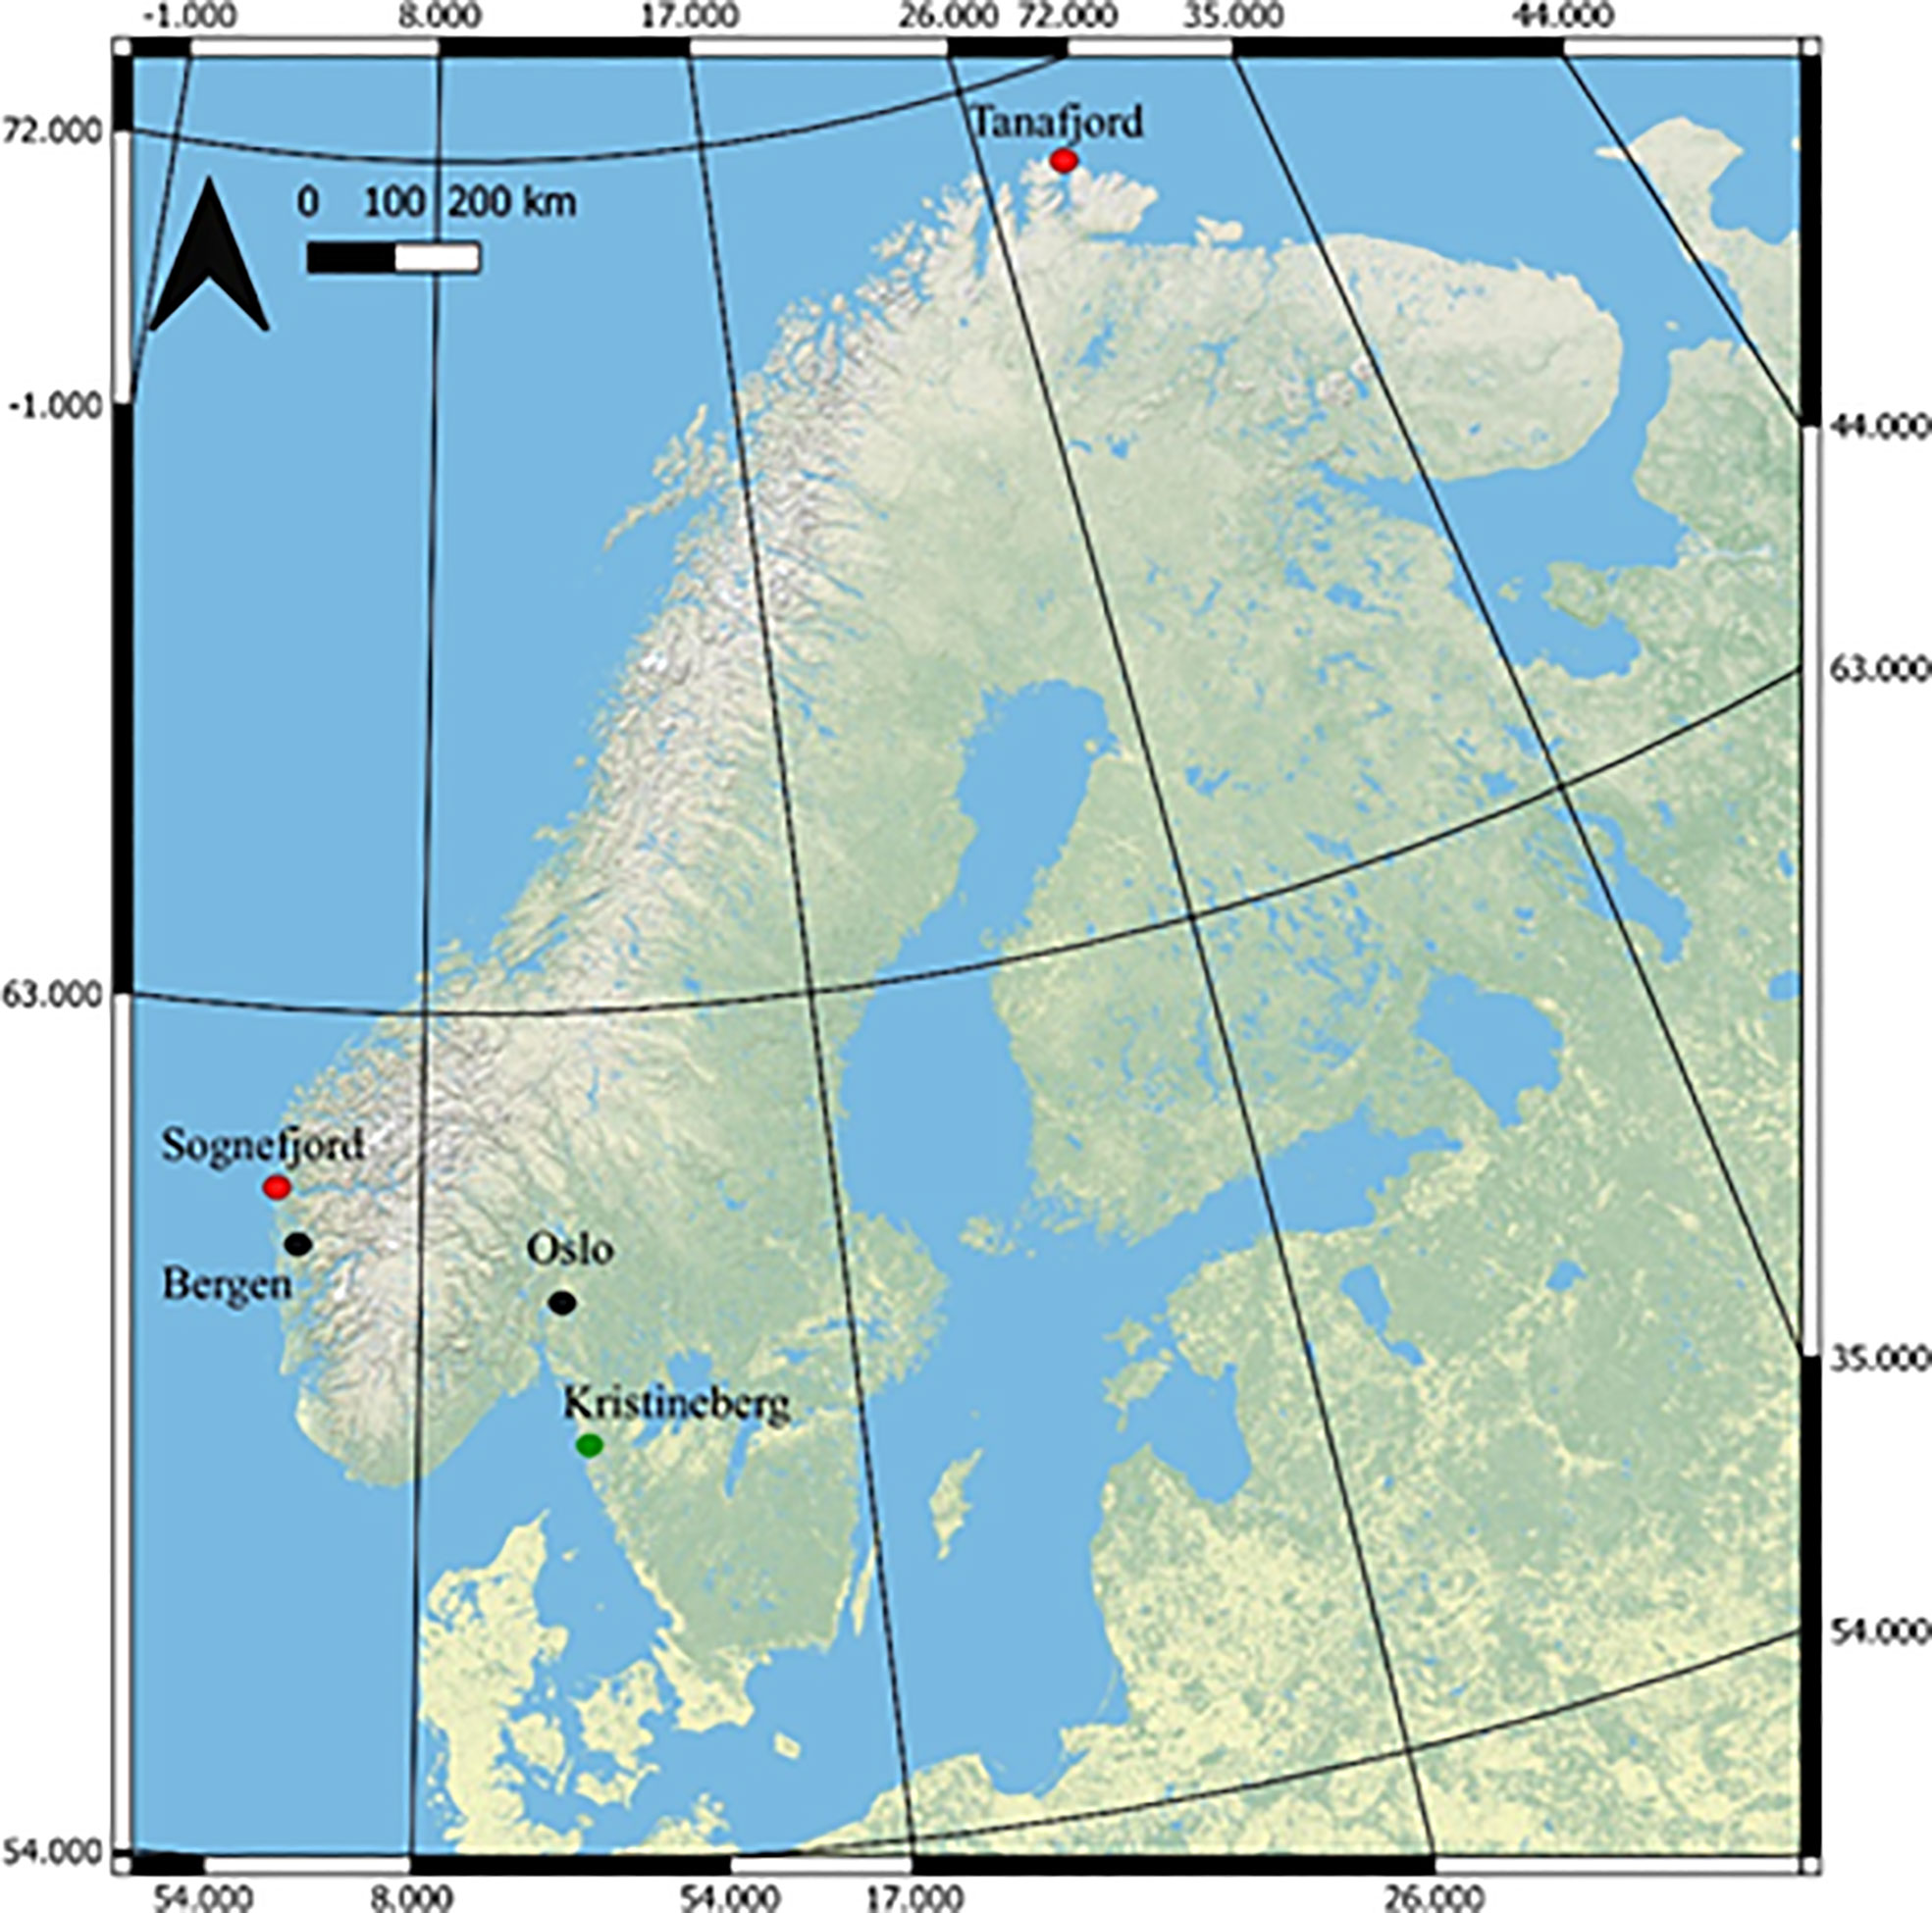
Figure 1 Map of Norway highlighting the two sample locations (Sognefjord and Tanafjord, red dots) and main urban areas (black dots). The green dot shows the location of the research institute in Sweden, Kristineberg, where the mesocosm experiment took place. The Geographical coordinate system GCS_WGS_198: Source Arc GIS Open Data, ESRI.
The S8 and S17 strains were exposed to five different temperature conditions (7°C, 10°C, 13°C, 16°C and 19°C) for 11 months (August 2021 to July 2022) and three pCO2 conditions (400, 600 and 1000 μatm) for 8 months (November 2021 to July 2022; Table 1; Figure 2). The strains were grown under a range of different average temperature conditions to reflect the projected temperatures for 2050 and 2100 under scenarios SSP5-8.5 and SSP2-4.5 from the latest IPCC climate model output (CMIP6; IPCC, 2018) for both sample collection sites (Tanafjorden and Sognesjøen, Norway). To acclimate the strains to different pCO2 concentrations, each sample was bubbled daily with tanks filled with artificial air containing either 400 ppm, 600 ppm or 1000 ppm CO2 (Messer, Bad Soden, Germany) for 90 minutes (15 minutes aeration every 4 hours). Frequent bubbling was also needed to prevent cells clumping. The strains were acclimated in semi-batch conditions (corresponding to approx. 100 generations) in artificial seawater (Kester et al., 1967) with macronutrients (Guillard and Ryther, 1962) and micronutrients/trace metals (Guillard, 1975) under controlled 16h:8h light:dark conditions provided by white LED lamps (100 μmol photon m−2 s−1). Samples were grown in triplicates in 100 ml glass tubes.
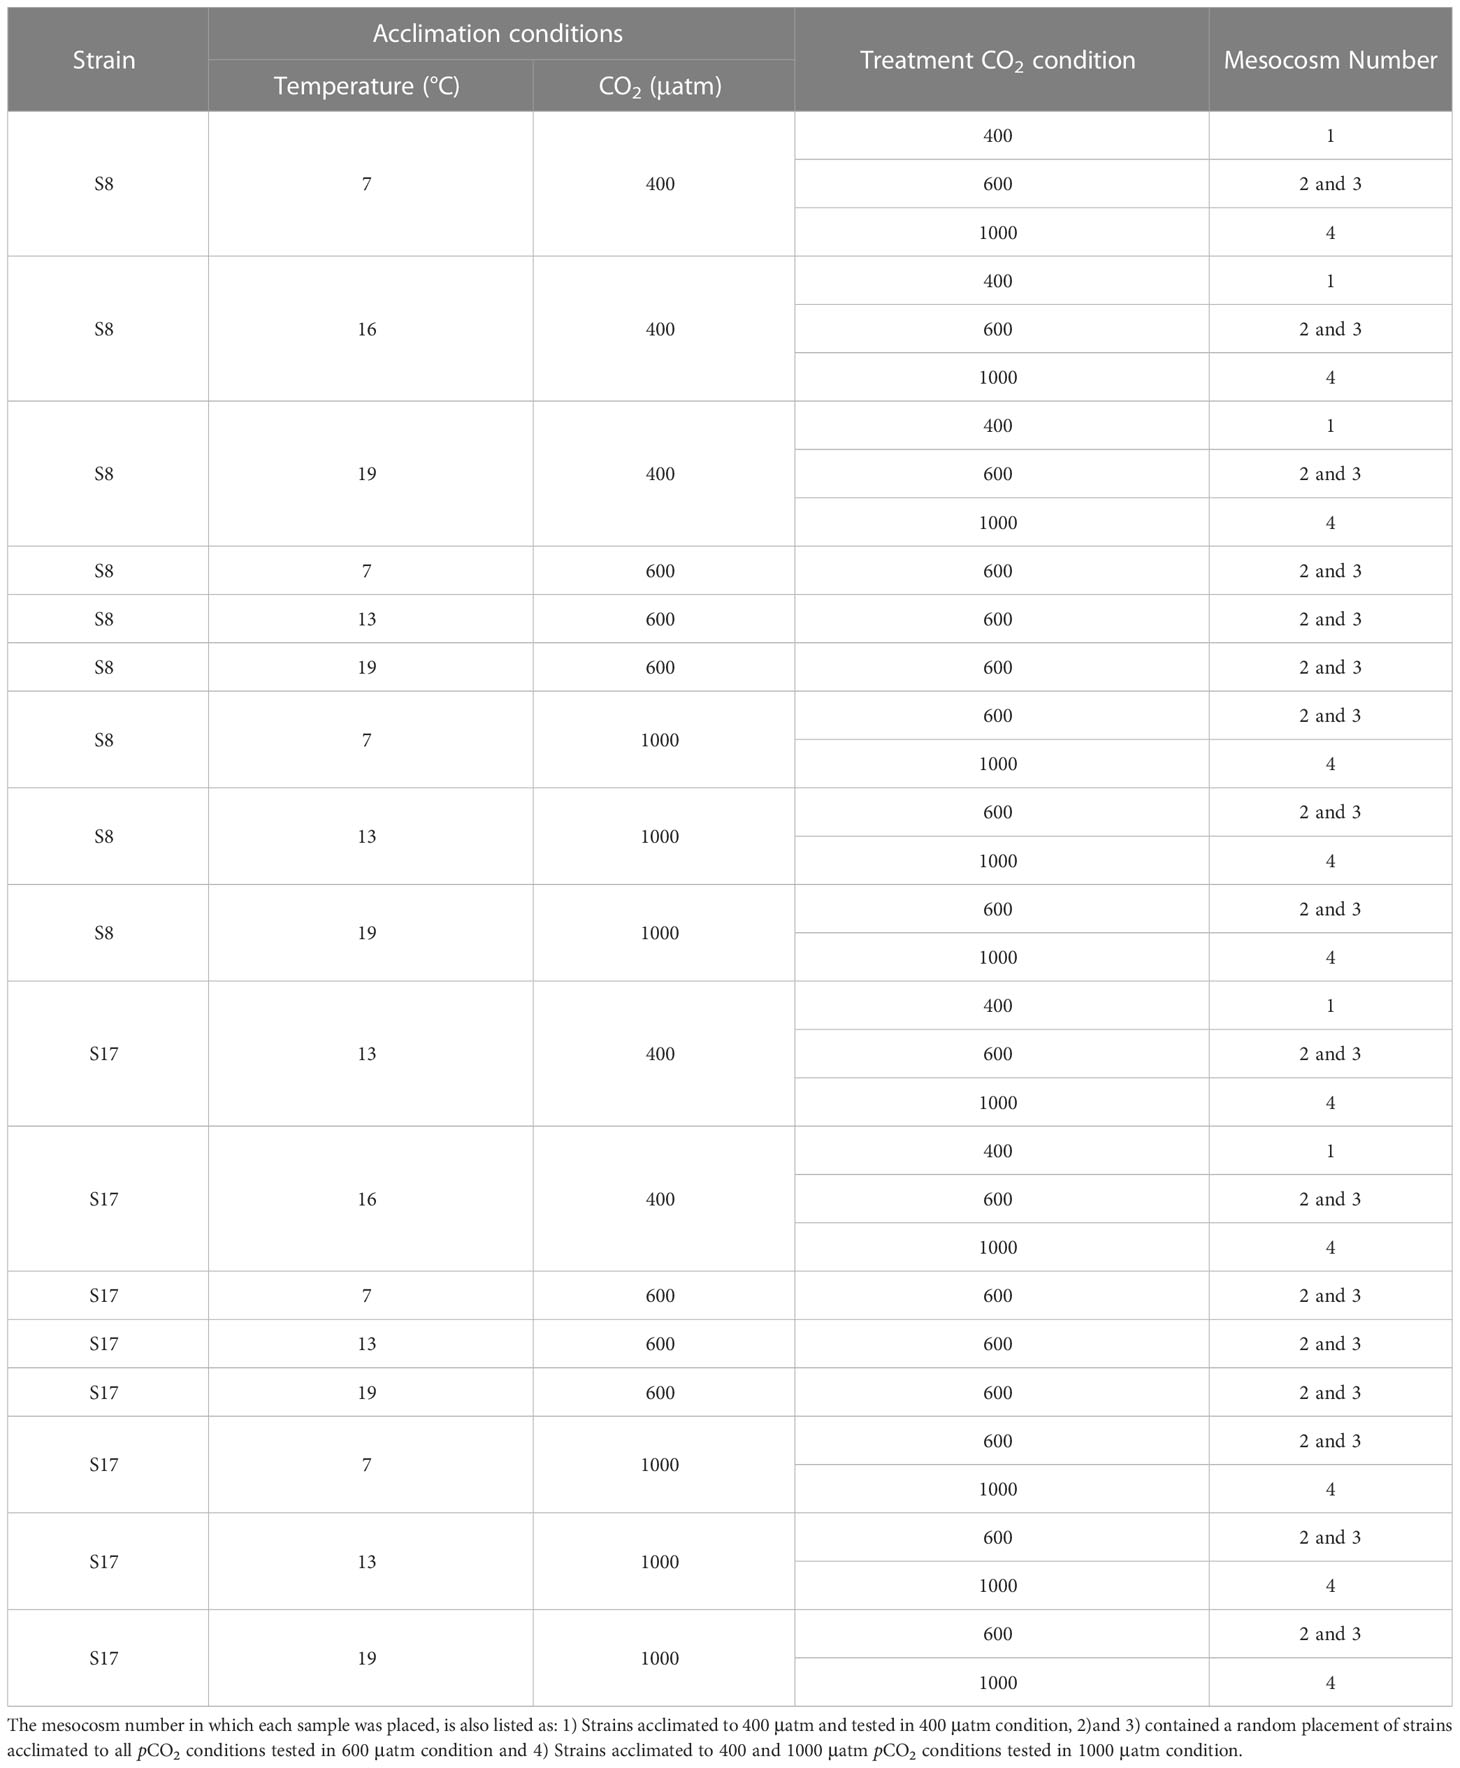
Table 1 List of the two S. marinoi strains (S8 and S17), the acclimated conditions used in the mesocosm experiment (temperature and pCO2) and the corresponding pCO2 treatment each sample was tested in.
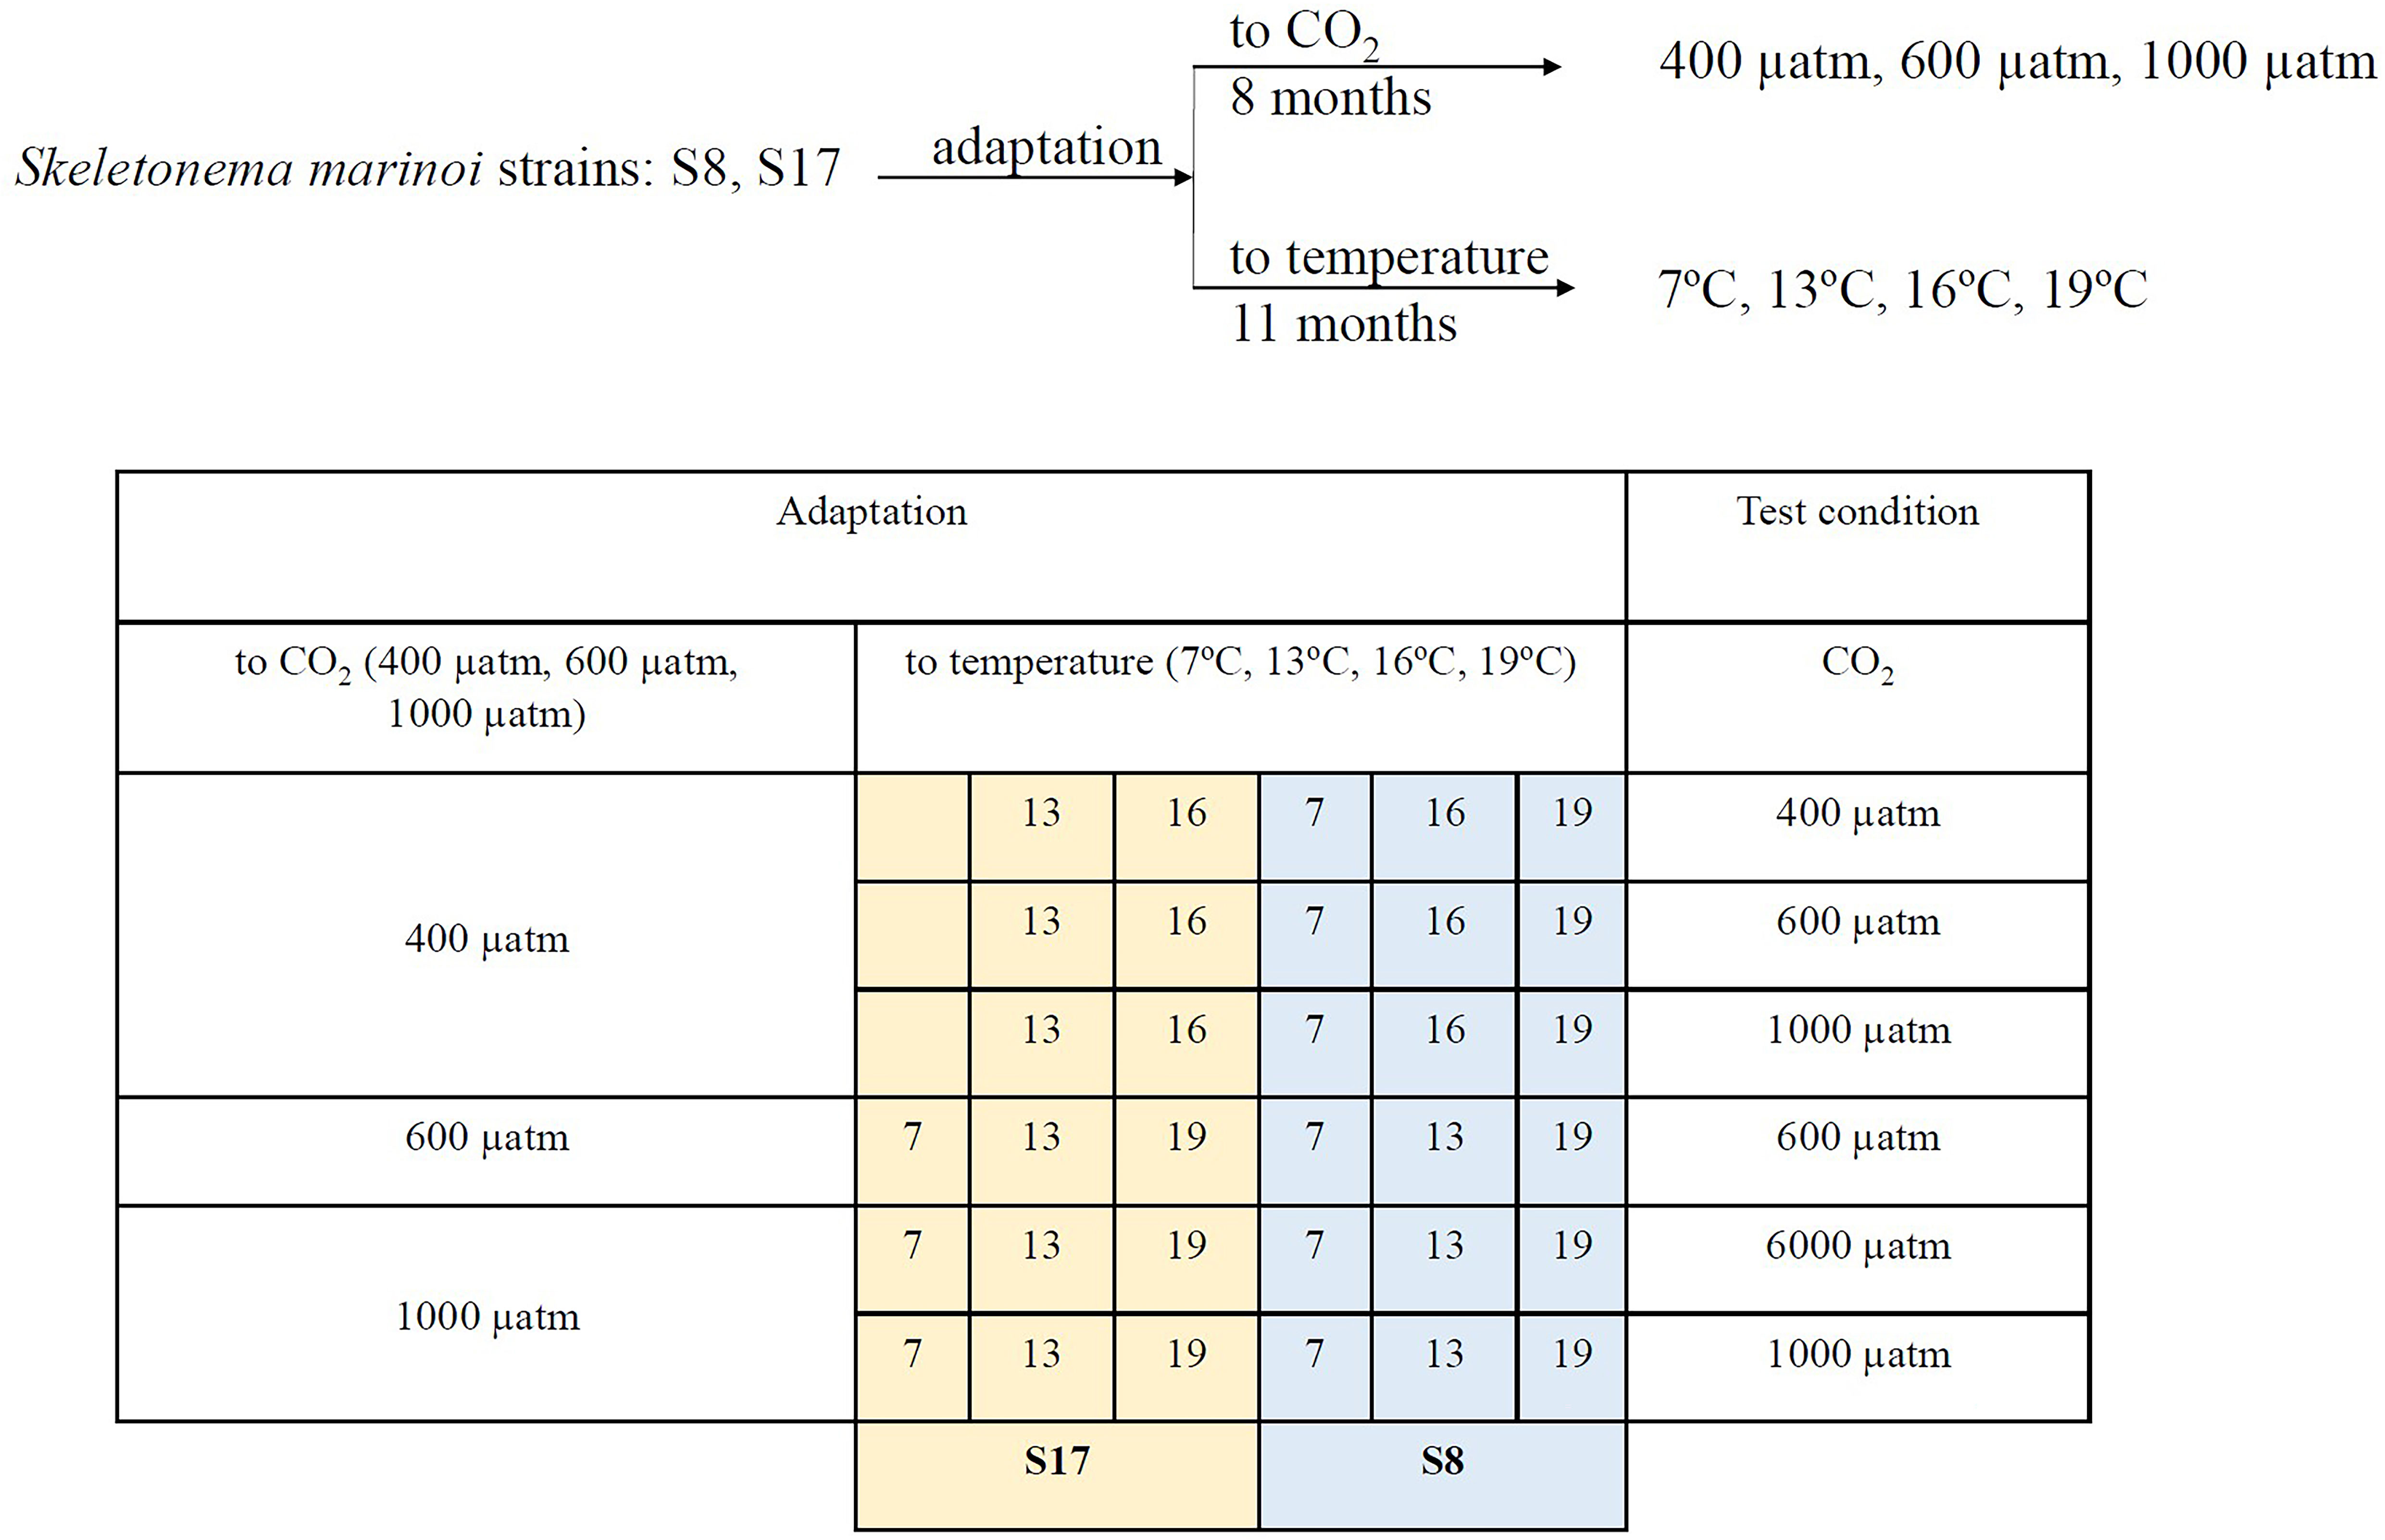
Figure 2 Schematic representation of the experimental setup.
Land-based mesocosm experiment
The impact of acclimated S. marinoi on natural microbial communities was tested at the Kristineberg Center for Marine Research and Innovation, University of Gothenburg, Sweden during a mesocosm experiment (25th-31st July 2022). The experiment lasted 6 days as previous research has shown that by this time the Skeletonema strains had reached the stationary growth phase. Three 1500 L water tanks were used, in which four 200 L plastic containers, the mesocosms, were deployed. For the mesocosms themselves, surface (55%; collected from 0.5 m depth) and bottom (45%; collected from 5 m dep) fjord water (58.2497° N, 11.4448° E) was mixed to ensure the presence of sufficient phytoplankton (found in surface waters) and nutrients (from the bottom waters). The fjord water was filtered (using a 250 µm mesh) to remove macro- and mesozooplankton before being added to the mesocosms. We added nutrients to each mesocosm prior to the beginning of the experiment as analysis of nutrients in a preliminary experiment showed undetectable levels. Therefore, 2 L of synthetic artificial seawater with the associated macronutrients, micronutrients and trace metals (for the full list of added nutrients, see Table S2) was added to and mixed with the fjord water in each of the four large mesocosms (Guillard and Ryther, 1962; Kester et al., 1967; Guillard, 1975).
Three different treatments were used: 400 μatm, 600 μatm and 1000 μatm (Figure 2). Due to practical limitations, not all the acclimated strains were used in the 3 different pCO2 treatments (See Table 1 for the list of strains, acclimation conditions and the tested pCO2 conditions). For logistical reasons we only tested the samples in different pCO2 treatments, as we were unable to control the temperature within the mesocosms. In order to distinguish between the different S. marinoi strains, acclimated conditions and pCO2 treatments, the following labelling layout was used; strain_temperature_CO2acclimisation_CO2treatment. High pCO2 levels were attained through bubbling pure CO2 gas into the mesocosms and the pH was controlled using IKS Industrial Aquastar system (Karlsbad, Germany). Previous studies have found the bubbling of pure CO2 gas to be a precise method for conducting ocean acidification experiments (Gattuso and Lavigne, 2009). Temperature was logged every 15 minutes using sensors linked to a HOBO MX2202 temperature/light data logger. The salinity of all mesocosms was 29 to ensure it is within the tolerable range for both strains (Table S1). The salinity of each mesocosm was measured twice a day using an Oxi 340i multiparameter (WTW, Weilheim, Germany). The four mesocosms were maintained for 6 days, to allow the planktonic resident communities to acclimate, prior to the addition of the dialysis bags containing the acclimated S. marinoi strains. Prior to the experiment, S. marinoi was also acclimated for 6 days with 50% synthetic seawater and 50% natural ocean water (55% surface and 45% bottom fjord water).
The use of small dialysis bags (10-20 k Dalton pore size; Nadir, Carl Roth, Karlsruhe, Germany), which are permeable for micro- and macro- nutrient (but not bacteria and phytoplankton), allowed for three replicates of each combination of strain and acclimation conditions (with an approximate volume of 520 mL each; Table 1) within the four mesocosm enclosures (Briddon et al., 2022; Drugă et al., 2022). Each dialysis bag was filled with the same water used in the mesocosms (55% surface and 45% bottom filtered -250 µm mesh- fjord water). All the dialysis bags were inoculated with S. marinoi (OD600 = 0.05; approximately 1.06x10³ cell L-1, the corresponding chlorophyll a concentrations used in other phytoplankton-related experiments and in previous laboratory based experiments (unpublished); Briddon et al., 2022; Drugă et al., 2022) except for the controls. The acclimated S8 and S17 were separately inoculated into all three pCO2 treatments (Table 1). Nine additional dialysis bags were also used as controls (three for each pCO2 treatment), which contained only mixed surface and bottom fjord water and no inoculated S. marinoi. In total, the experiment consisted of 108 dialysis bags distributed into four mesocosms (Table 1; Figure S1). After completion of the mesocosm experiment, the triplicates (99 dialysis bags plus an additional 9 dialysis bags used as a control for each pCO2 treatment) were then combined, resulting in a total of 36 samples, which underwent further analysis.
Chlorophyll a and pigment measurements
Chlorophyll a concentrations (µg L-1) were estimated in vivo every two days using a PHYTO-PAM-II Compact Version (Heinz Walz Gmbh, Germany), for a total of 6 days. An aliquot was taken from every dialysis bag, and this was used to determine the composition of the major algal groups. The PHYTO-PAM-II uses specific wavelengths to supply data on phytoplankton community composition using three defined functional groups of total chlorophyll a concentration. The three different major algal groups identified were: chlorophytes, cyanobacteria and a “brown” group (Chromophytes), which consists mainly of algae that have additional pigments that absorb in the yellow/orange wavelength range (e.g. diatoms, cryptophytes, dinoflagellates). Total chlorophyll a was determined using the sum of all three groups.
Nutrients
Samples for analysis of total nitrogen (TN), silica (Si), phosphate (PO43-), iron (Fe), total phosphorus (TP) concentrations and total alkalinity were collected at the beginning and at the end of the 6-day experiment for all treatments. The analyses were standardised using calibration curves of samples with known concentrations and the use of blanks between samples. These analyses were completed using the HI83399 Multiparameter Photometer with COD for Water and Wastewater (HANNA Instruments, Germany). The nutrients were analysed from unfiltered water samples collected from each of the four mesocosms using the methods detailed in https://hannainst.ro/mwdownloads/download/link/id/939.
DNA analysis
The microbial community of each dialysis bag was analysed after the 6-day mesocosm experiment using DNA metabarcoding. This technique was chosen as it can determine both eukaryotic and prokaryotic diversity and abundance down to the genus level. Firstly, the water from each of the three replicates was combined (totalling approx. 1.5L), and then centrifuged to allow for the removal of the excess water. Total DNA was isolated using a E.Z.N.A.® Soil DNA Kit (Omega Bio-tek, Norcross, GA, USA), following the manufacturer’s instructions. The DNA concentration and quality were assessed using a NanoDrop™ 2000 Spectrophotometer (Waltham, MA, USA). The small ribosomal DNA (rDNA) subunit (16S for prokaryotes and 18S for eukaryotes) was then amplified using PCR (Herlemann et al., 2011; Hadziavdic et al., 2014). These primers targeted a 300 bp DNA fragment within the 16S gene in prokaryotes (341F 5’-CCTAYGGGRBGCASCAG-3’ and 806R 5’-GGACTACNNGGGTATCTAAT-3’), and a 350 bp long fragment from the V4 region in the 18S gene in eukaryotes (528F 5’-GCGGTAATTCCAGCTCCAA-3’ and 706R 5’-AATCCRAGAATTTCACCTCT-3’).
DNA sequencing was performed by a third-party company (Novogen, United Kingdom). Following DNA sequencing, base calling and run demultiplexing were completed using the BaseSpace service (Illumina, San Diego, CA, USA) meters. The pair-end reads were joined in QIIME, and the quality filtration, dereplication and singleton removal was performed using Usearch v8. Both de novo and reference chimera checking were performed in Usearch v8, using the latest version of the Greengenes database (‘13_8’) as a reference (DeSantis et al., 2006). The taxonomy was assigned for the representative OTUs in QIIME using the SSU/LSU 138 SILVA database (Gurevich et al., 2013). The taxonomy was added to the OTU table with the biom-format package, and the mitochondrial and plastid sequences were filtered out of the final OTU table. Rarefaction was performed, followed by alpha- and beta-diversity estimation in QIIME (Lozupone and Knight, 2005; Caporaso et al., 2010). Multiple alpha diversity indexes were used to estimate the diversity of the communities at the end of the experiment.
Statistics (data analysis)
One-way, two-way and three-way ANOVAs (on chlorophyll a concentrations) were completed using the factors, time, temperature and level of pCO2 acclimation and pCO2 treatment for the two strains separately and both strains together. Prior to analysis, normality, the identification of outliers and assumption of sphericity were checked using a Shapiro Wilk’s test, identifiy_outliers() function and Mauchly’s test of sphericity respectively. For the ANOVAs, the controls were excluded as they contained no additional S. marinoi (and would distort the correlations). Post-hoc analysis included mean separation tests for the multiple comparisons (using Tukey-adjusted comparison) and least square means for the main effects. The analysis was completed using R (version 4.1.2). Furthermore, one-way ANOVAs and two sample t-test were also used to determine if the strain (S8 or S17) and/or the acclimation conditions resulted in any significant differences in OTU abundances of the main microbial groups.
Principal coordinate analysis (PCoA) was completed using the Weighted Unifrac of Bray-Curtis distances to determine any differences between the strains, temperature and pCO2 acclimated and treatment. This analysis was completed using the calibrate package in R (version 4.1.2; Graffelman and van Eeuwijk, 2005; R Core Team, 2021). Indicator species analysis (Indval) was used to assess the affinity of the different groups for the three pCO2 treatments and was conducted using the Indval function in the indicspecies package in R (Version 3.4.2). Indval uses a species’ relative abundance and occurrence to estimate the strength of their association to different groups. The test uses priori groups of interest and a simple randomisation test to evaluate the probability of a species’ affinity to a certain group. Analysis of Similarities (ANOSIM) was also used to assess differences in bacterial and eukaryotic assemblages between the three pCO2 treatments (Clarke, 1993; Clarke and Warwick, 1994). The three techniques complement each other as PCoA helps to determine what could be driving the differences between treatments, whilst Indval determines the affinity of each taxon to a specific pCO2 treatment, and ANOSIM quantifies the similarities between the treatments.
Results
Land-based mesocosm experiments - temperature and light intensity
The temperature was similar in all pCO2 treatments throughout the 6-day experiment (Figure S2A). The mean daytime and nighttime temperature averaged c.19-20°C and c.17°C respectively. Mesocosms 4 (1000 μatm pCO2 treatment; Table 1) and 3 (600 μatm pCO2 treatment) had a higher temperature compared to mesocosms 1 (400 μatm pCO2 treatment) and 2 (600 μatm pCO2 treatment) on the 26th July due to their location within the greenhouse and subsequent clouding over. Mesocosm 2 (one of the 600 μatm pCO2 treatment) had a lower light intensity compared to the other three (Figure S2B). The remaining mesocosms had light intensity measurements that were similar across all treatments and followed near-identical patterns over the whole experiment. However, as mesocosms 2 and 3 contained a random placement of the triplicates being tested in the 600 μatm pCO2 treatment, any influence of the reduced light intensity would have been removed once the triplicates were combined.
Nutrients
There were similar concentrations of TP, phosphate, iron, in all treatments at the start of the experiment (Table 2), whilst silica concentrations were lower in mesocosms 2 and 3. All the nutrients measured increased by the end of the experiment in all mesocosms except for iron which declined to undetectable levels. At the end of the experiment, there were again similar levels of silica, yet TP, phosphate and TN concentrations varied (Table 2). In mesocosms 1 and 4, there were substantially higher concentrations of TP and phosphate compared to the other mesocosms. Total alkalinity also showed a slight increase as pCO2 concentration increased, most likely due to evaporation and/or nutrient consumption (Millero et al., 1998). Evaporation and the use of unfiltered water (which would contain microbes) for the nutrient analyses could explain the increase in nutrients (except for iron) observed at the end of the experiment (Zingel et al., 2023).
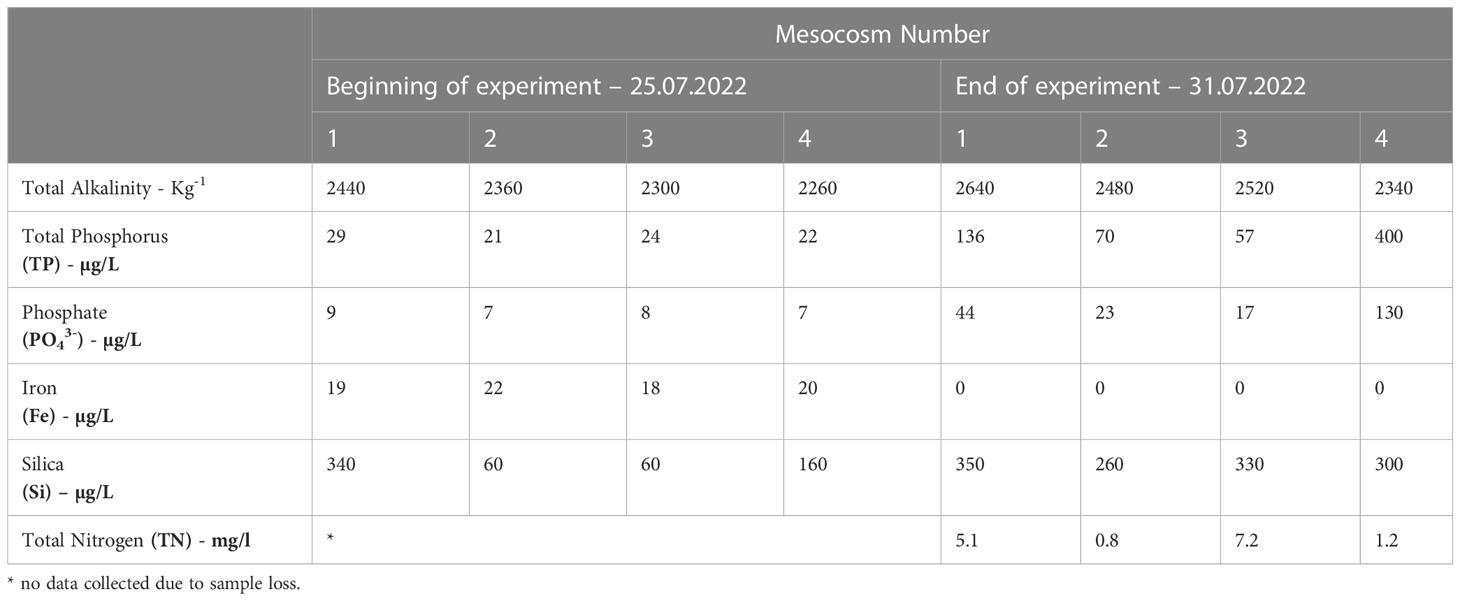
Table 2 Total alkalinity and nutrient concentrations (total phosphorus, phosphate, iron, silica, silica dioxide and total nitrogen) of the samples collected on Day 1 (25th July 2022) and Day 6 (31h July 2022) of the 6-day experiment.
Phytoplankton group dynamics
There were no significant differences (ANOVA) between chlorophyll a concentration and any of the factors (temperature and level of pCO2 acclimation, pCO2 treatment and time) for either strain or both strains together (Table S3). There were also no significant differences between the different factors and their interactions. Chlorophyll a concentrations were not significantly different for both strains by the end of the experiment (Figure 3). Chromophytes (consisting mainly of diatoms) chlorophyll a concentrations were the highest of all the algal groups (15.3-43.7 µg L-1) by Day 6, with no significant differences between S8 and S17 strains. Chlorophyte and cyanobacterial (consisting of only chloroplasts, endosymbiotic cyanobacteria, according to the DNA metabarcoding results) chlorophyll a concentrations were significantly higher in the samples inoculated with S8 compared to S17. Chlorophyll a concentrations fluctuated across the 6-day experiment for the three algal groups with no pattern between the temperature or pCO2 concentration of acclimation or the pCO2 treatment. Four samples consistently had the highest concentrations across all algal groups (S8_13°C_1000μatm _1000μatm, S8_19°C_1000μatm _1000μatm, S8_7°C _400μatm _400μatm and S17_19°C _1000μatm _1000μatm) but there was no relationship between temperature, pCO2 acclimation or pCO2 treatment.
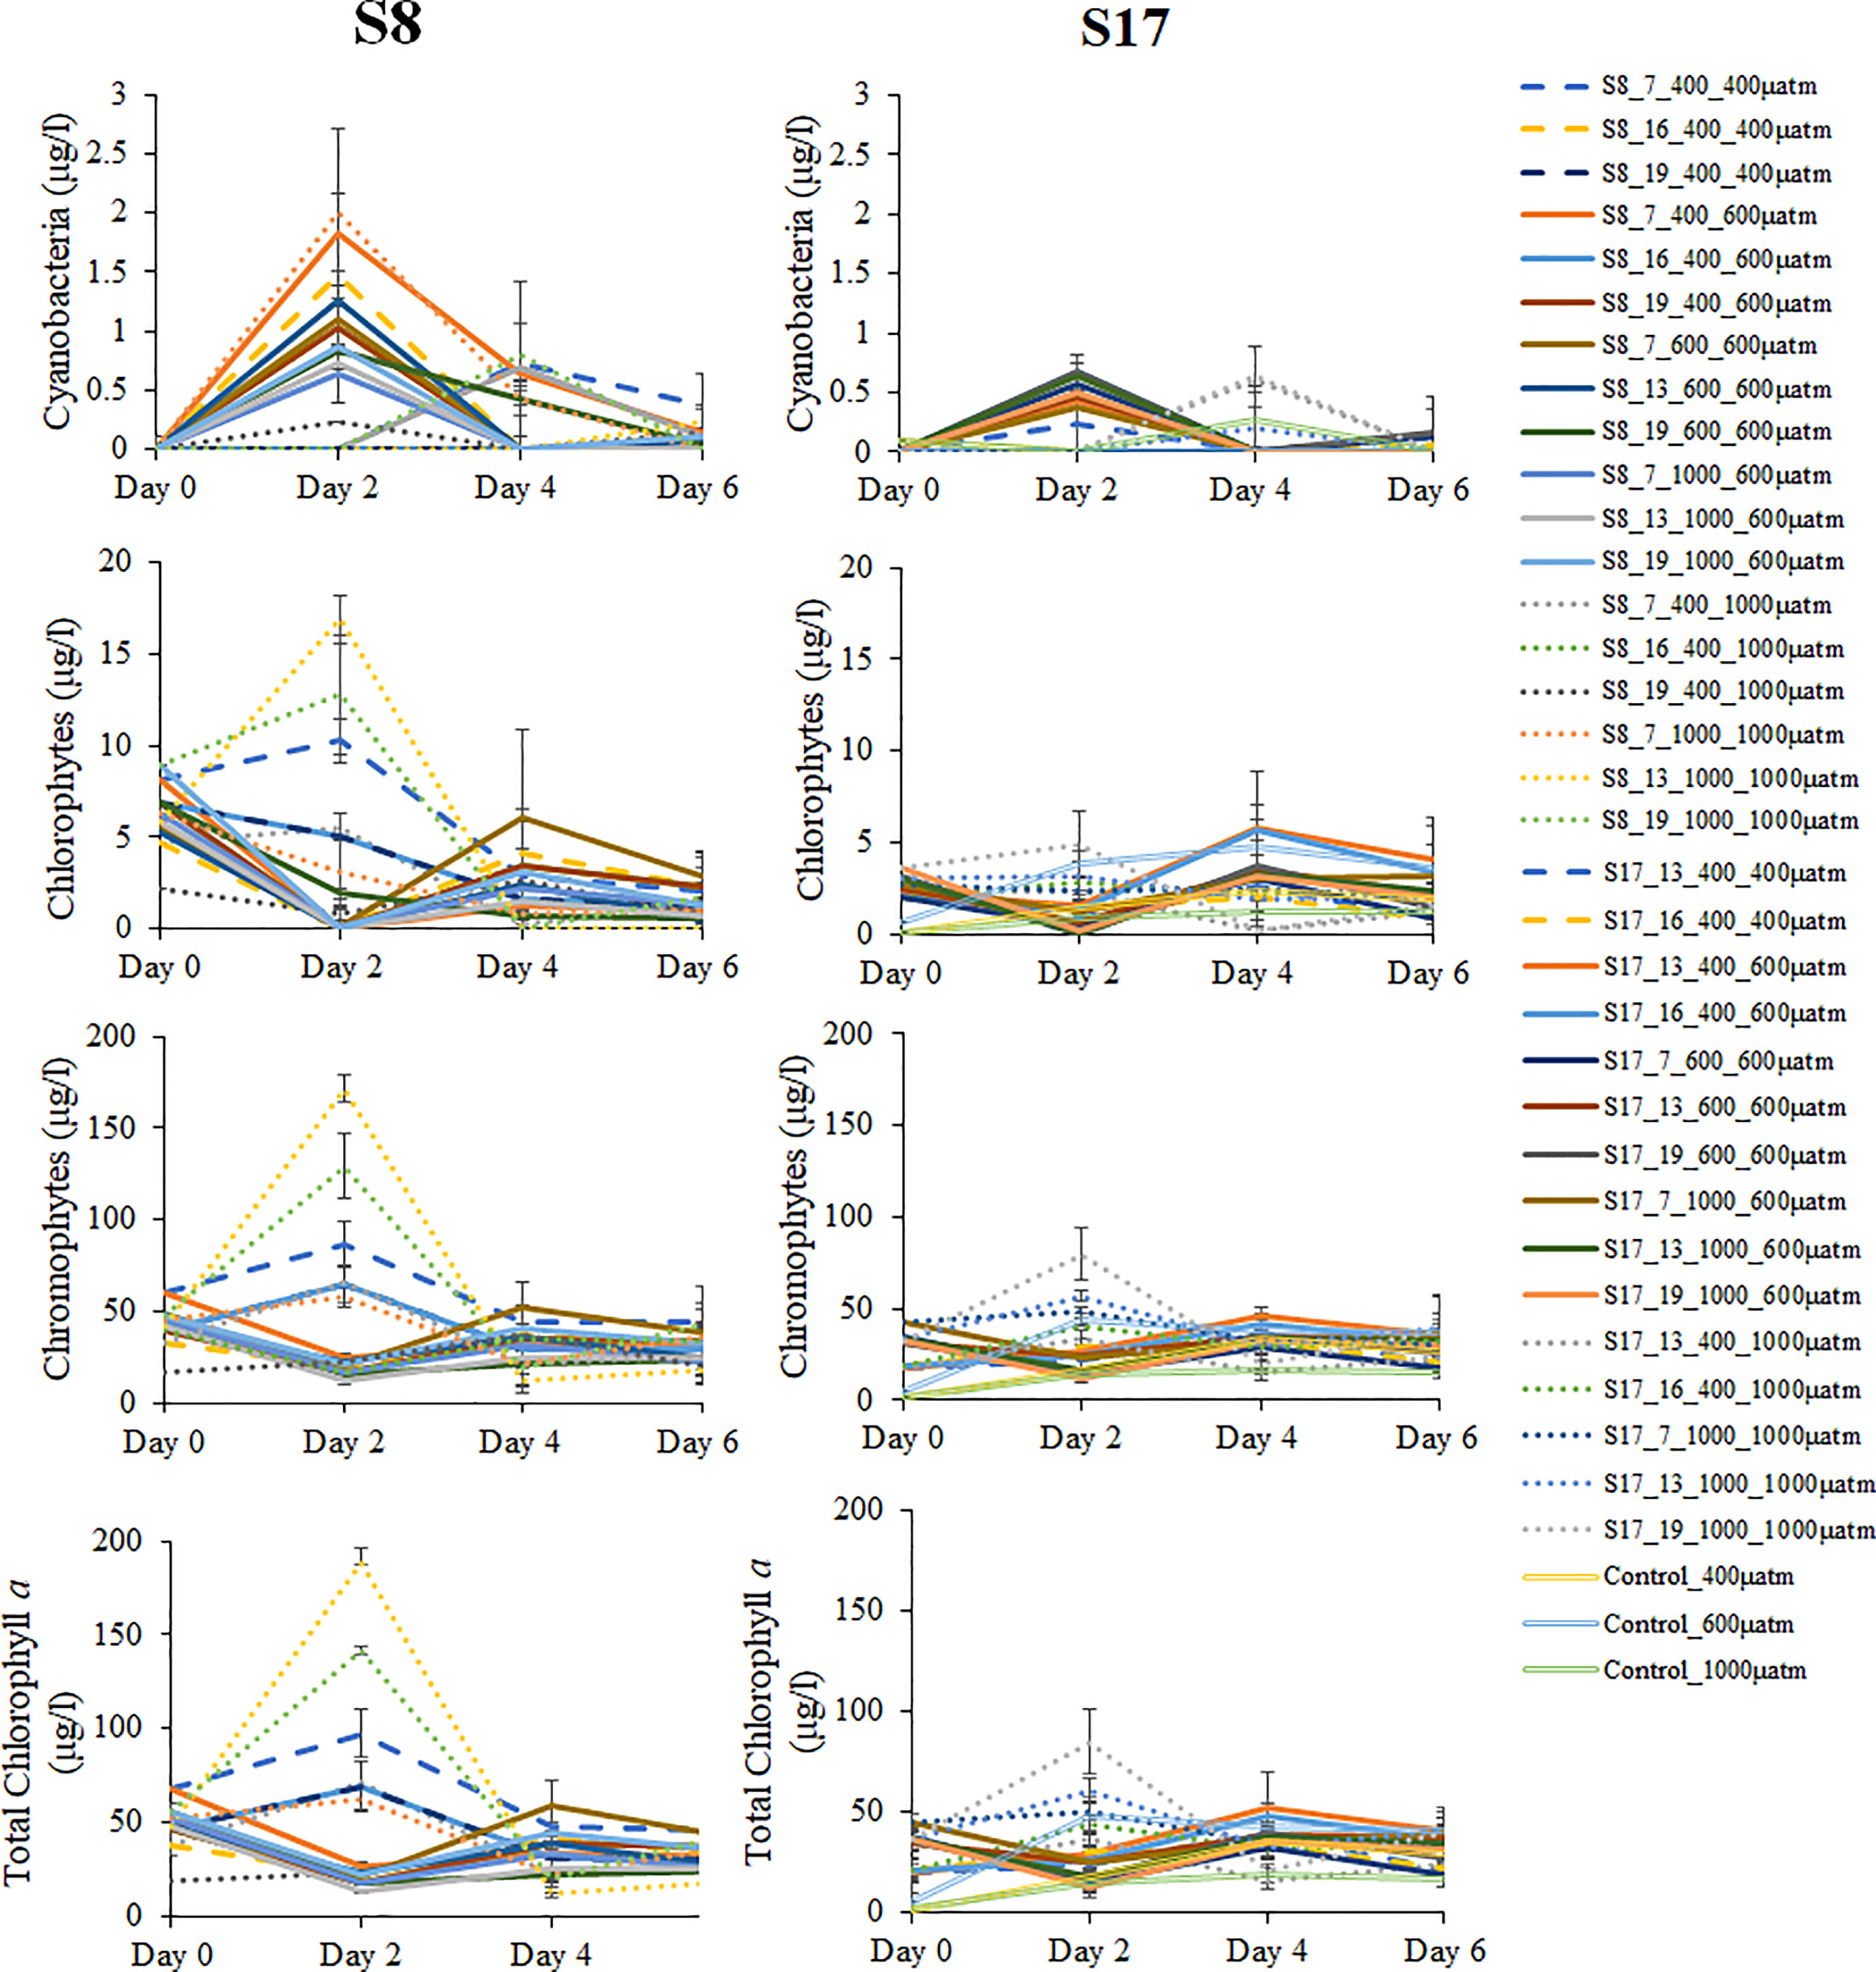
Figure 3 Mean total Chlorophytes, Chromophytes, Cyanobacteri and Chlorophyll a concentrations measured every two days of the experiment for all pCO2 treatments (400 μatm, 600 μatm and 1000 μatm) for both S. marinoi strains (S8 and S17) and all the acclimation conditions. Each concentration was calculated using specific wavelengths of total chlorophyll a concentration for the three defined functional groups (Chlorophytes, Chromophytes and Cyanobacteria). The dashed, straight and dotted lines correspond to the samples tested in the 400 μatm, 600 μatm and 1000 μatm respectively. The controls sample are denoted by the unfilled lines. The error bars were determining using standard error. The following labelling was used to distinguish between the different S. marinoi strains, temperature and CO2 acclimisation conditions and pCO2 treatment; strain_temperature_CO2acclimisation_CO2treatment.
16S and 18S metabarcoding data
A total of 3.83 million sequence reads were obtained following 16S rDNA amplicon sequencing and 3.87 million for 18S rDNA. 3.46 (16S) and 3.81 (18S) million combined reads passed the processing and filtering stages (sequencing quality and read length). After reassembly, alignment clean-up and mapping, the total abundance of OTUs from the 36 samples were 1306 prokaryotic and 1087 eukaryotic. The bacterial and eukaryotic composition at the class, order and family levels are shown in Figures S3–S8. The alpha diversity measurements (chao1, Simpson and Shannon diversity indexes) showed similar prokaryotic and eukaryotic diversity in all pCO2 treatments, yet less variability between the three triplicates in the 600 μatm treatment (Table S4).
All treatments had a similar bacterial community composition, yet the OTU abundances differed (Figure 4). All samples were dominated by cyanobacteria (all chloroplasts, endosymbiotic cyanobacteria), Proteobacteria and Bacteroidota. Cyanobacteria was the most abundant group (with a range of 49.1-78.4% for all samples) with significant differences between strain and the pCO2 treatment. The highest cyanobacteria concentrations were found in the samples inoculated with strain S17 (mean of 37.9%) and those samples tested in the 600 μatm pCO2 treatment (mean of 69.5%). The acclimation conditions (temperature and CO2) did not result in any significant differences in cyanobacterial concentrations. The second most abundant group was proteobacteria (15.4-37.9%) with significantly higher concentrations for the samples inoculated with strain S8 (p=0.026) and those acclimated (p=0.005; F=6.31) and tested in the 400 μatm pCO2 conditions (p=<0.001; F=20.42). The proteobacteria abundance mostly consisted of the orders Rhodobacterales, Caulobacterales, Rhizobiales and Thalassobaculales from the class Alphaproteobacteria (5.3-12.8%) and Alteromonadales, Oceanospirillales and Vibrionales from the class Gammaproteobacteria (9.1-28.1%). The third and final most abundant group was Bacteroidota consisting of the orders Flavobacteriales (1.1-10.9%), Cytophagales (0.1-1.8%) and Chitinophagales (0.2-1.9%). Within this group, the families Flavobacteriaceae and Alteromonadaceae had significantly higher OTU abundances in the 600 and 1000 μatm treatments. The abundances of Bacteroidota significantly increased along the pCO2 treatments (p=0.005, F=6.31). There were no significant differences between strains or the acclimation conditions.
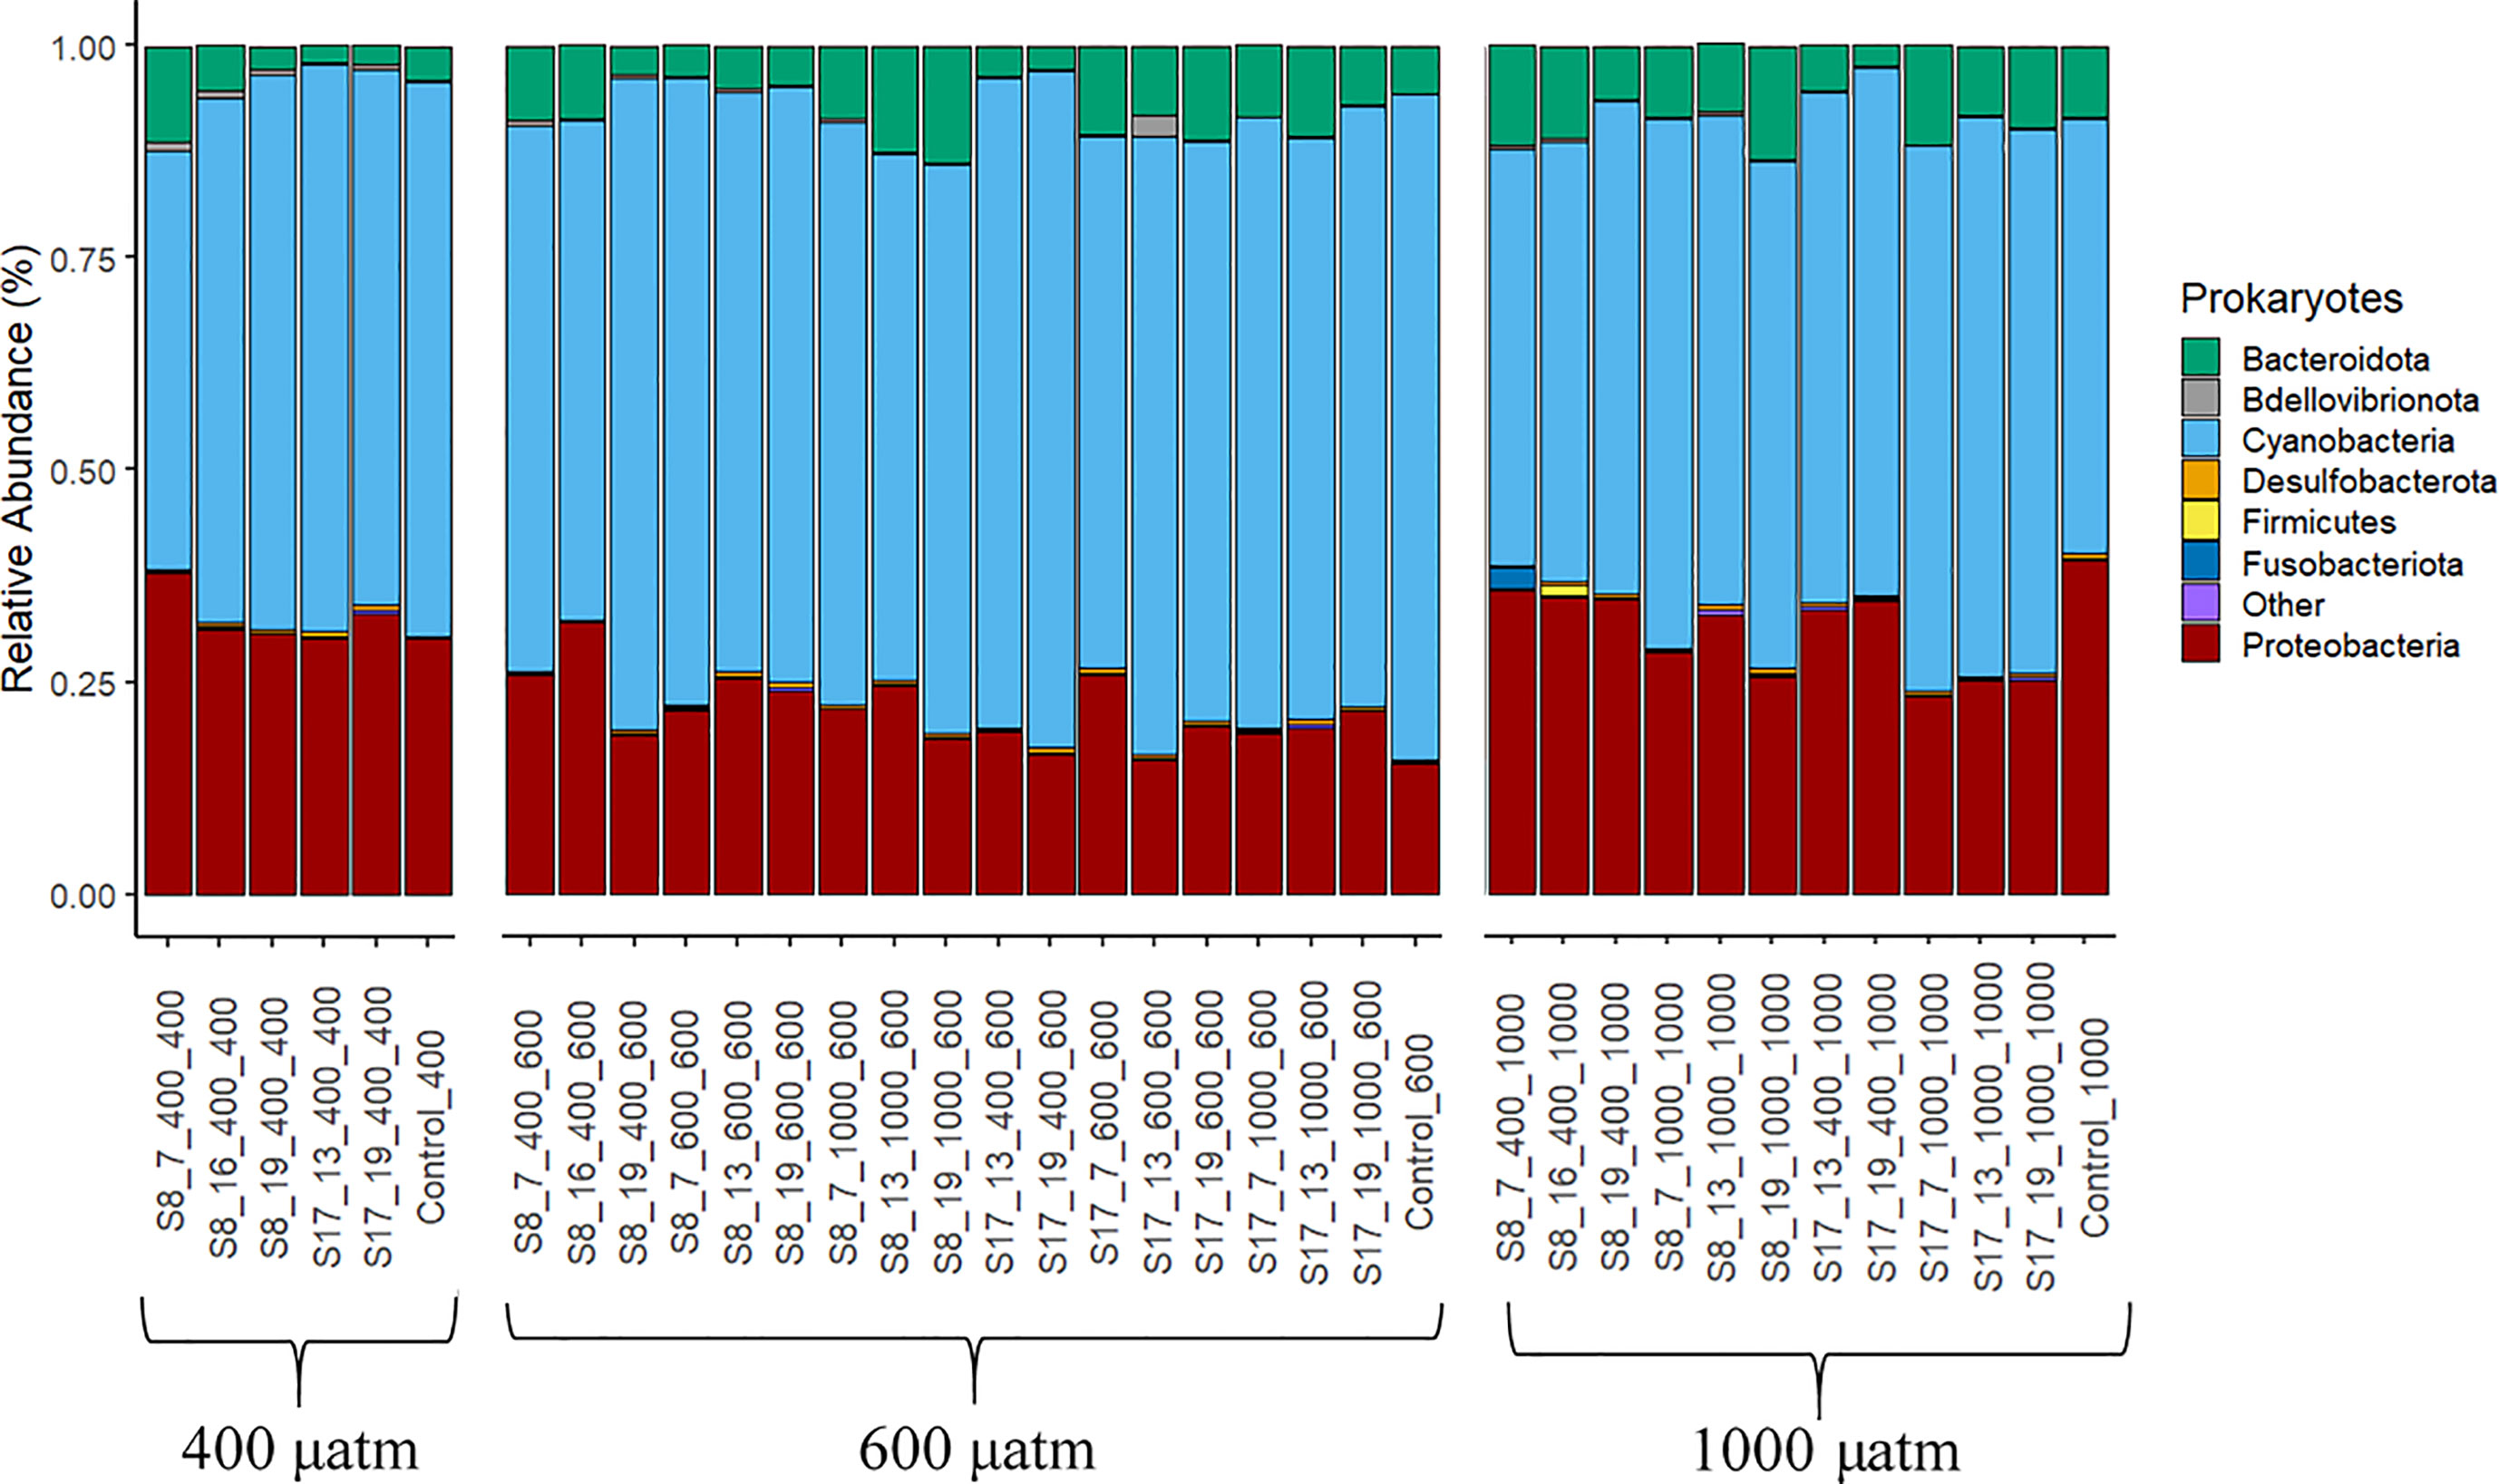
Figure 4 Prokaryote phyla according to the 16S gene DNA Metabarcoding analysis from the samples collected at the end of the 6 day experiment. The results are grouped by the three pCO2 treatments (400 μatm, 600 μatm, 1000 μatm). The category “other” (in purple) is all remaining orders with <0.1% relative abundance. The following labelling was used to distinguish between the different S. marinoi strains, temperature and pCO2 acclimisation conditions and pCO2 treatment; strain_temperature_CO2acclimisation_CO2treatment.
The eukaryotic populations in all samples were dominated by diatoms (78.6-96.1%; Figure 5). Most of the DNA reads were assigned to the pennate diatoms of the class Bacillariophyceae (77.5-94.5%) consisting of the orders Achnanthales, Bacillariales, Cymbellales, Dictyoneidales, Eunotiales, Lyrellales, Mastogloiales, Naviculales, Rhopalodiales, Surirellales and Thalassionematales. However, it is not possible to determine which families were dominating due to insufficient fragment lengths, needed for a more accurate identification. The samples inoculated with strain S8 had significantly higher diatom OTU abundances compared to those inoculated with S17 (p<0.001), with no discernable patterns between pCO2 treatment and the acclimation conditions. Skeletonema OTU abundance was low in all the samples including the controls (0.1-27%) with no distinguishable trends between strains, pCO2 treatment or the acclimation conditions, even though all samples (except the controls) were inoculated with acclimated Skeletonema strains. Most of the remaining eukaryotic OTU abundance consisted of Ciliphora (1.5-11.6%), Cercozoa (0.1-2.5%) and Dinoflagellates (0.3-2.3%). There were significant differences between the samples inoculated with S8 and S17 for Ciliphora (S17) and Cercozoa (S8) (p=<0.05), with no difference for Dinoflagellates (p=0.25). There were no significant differences between the pCO2 treatments. There were low OTU abundances (0.1-0.5% average relative abundance) of the groups Ascomycota, Bicosoecida, Holozoa, Incertae Sedis and Ochrophyta in all samples.
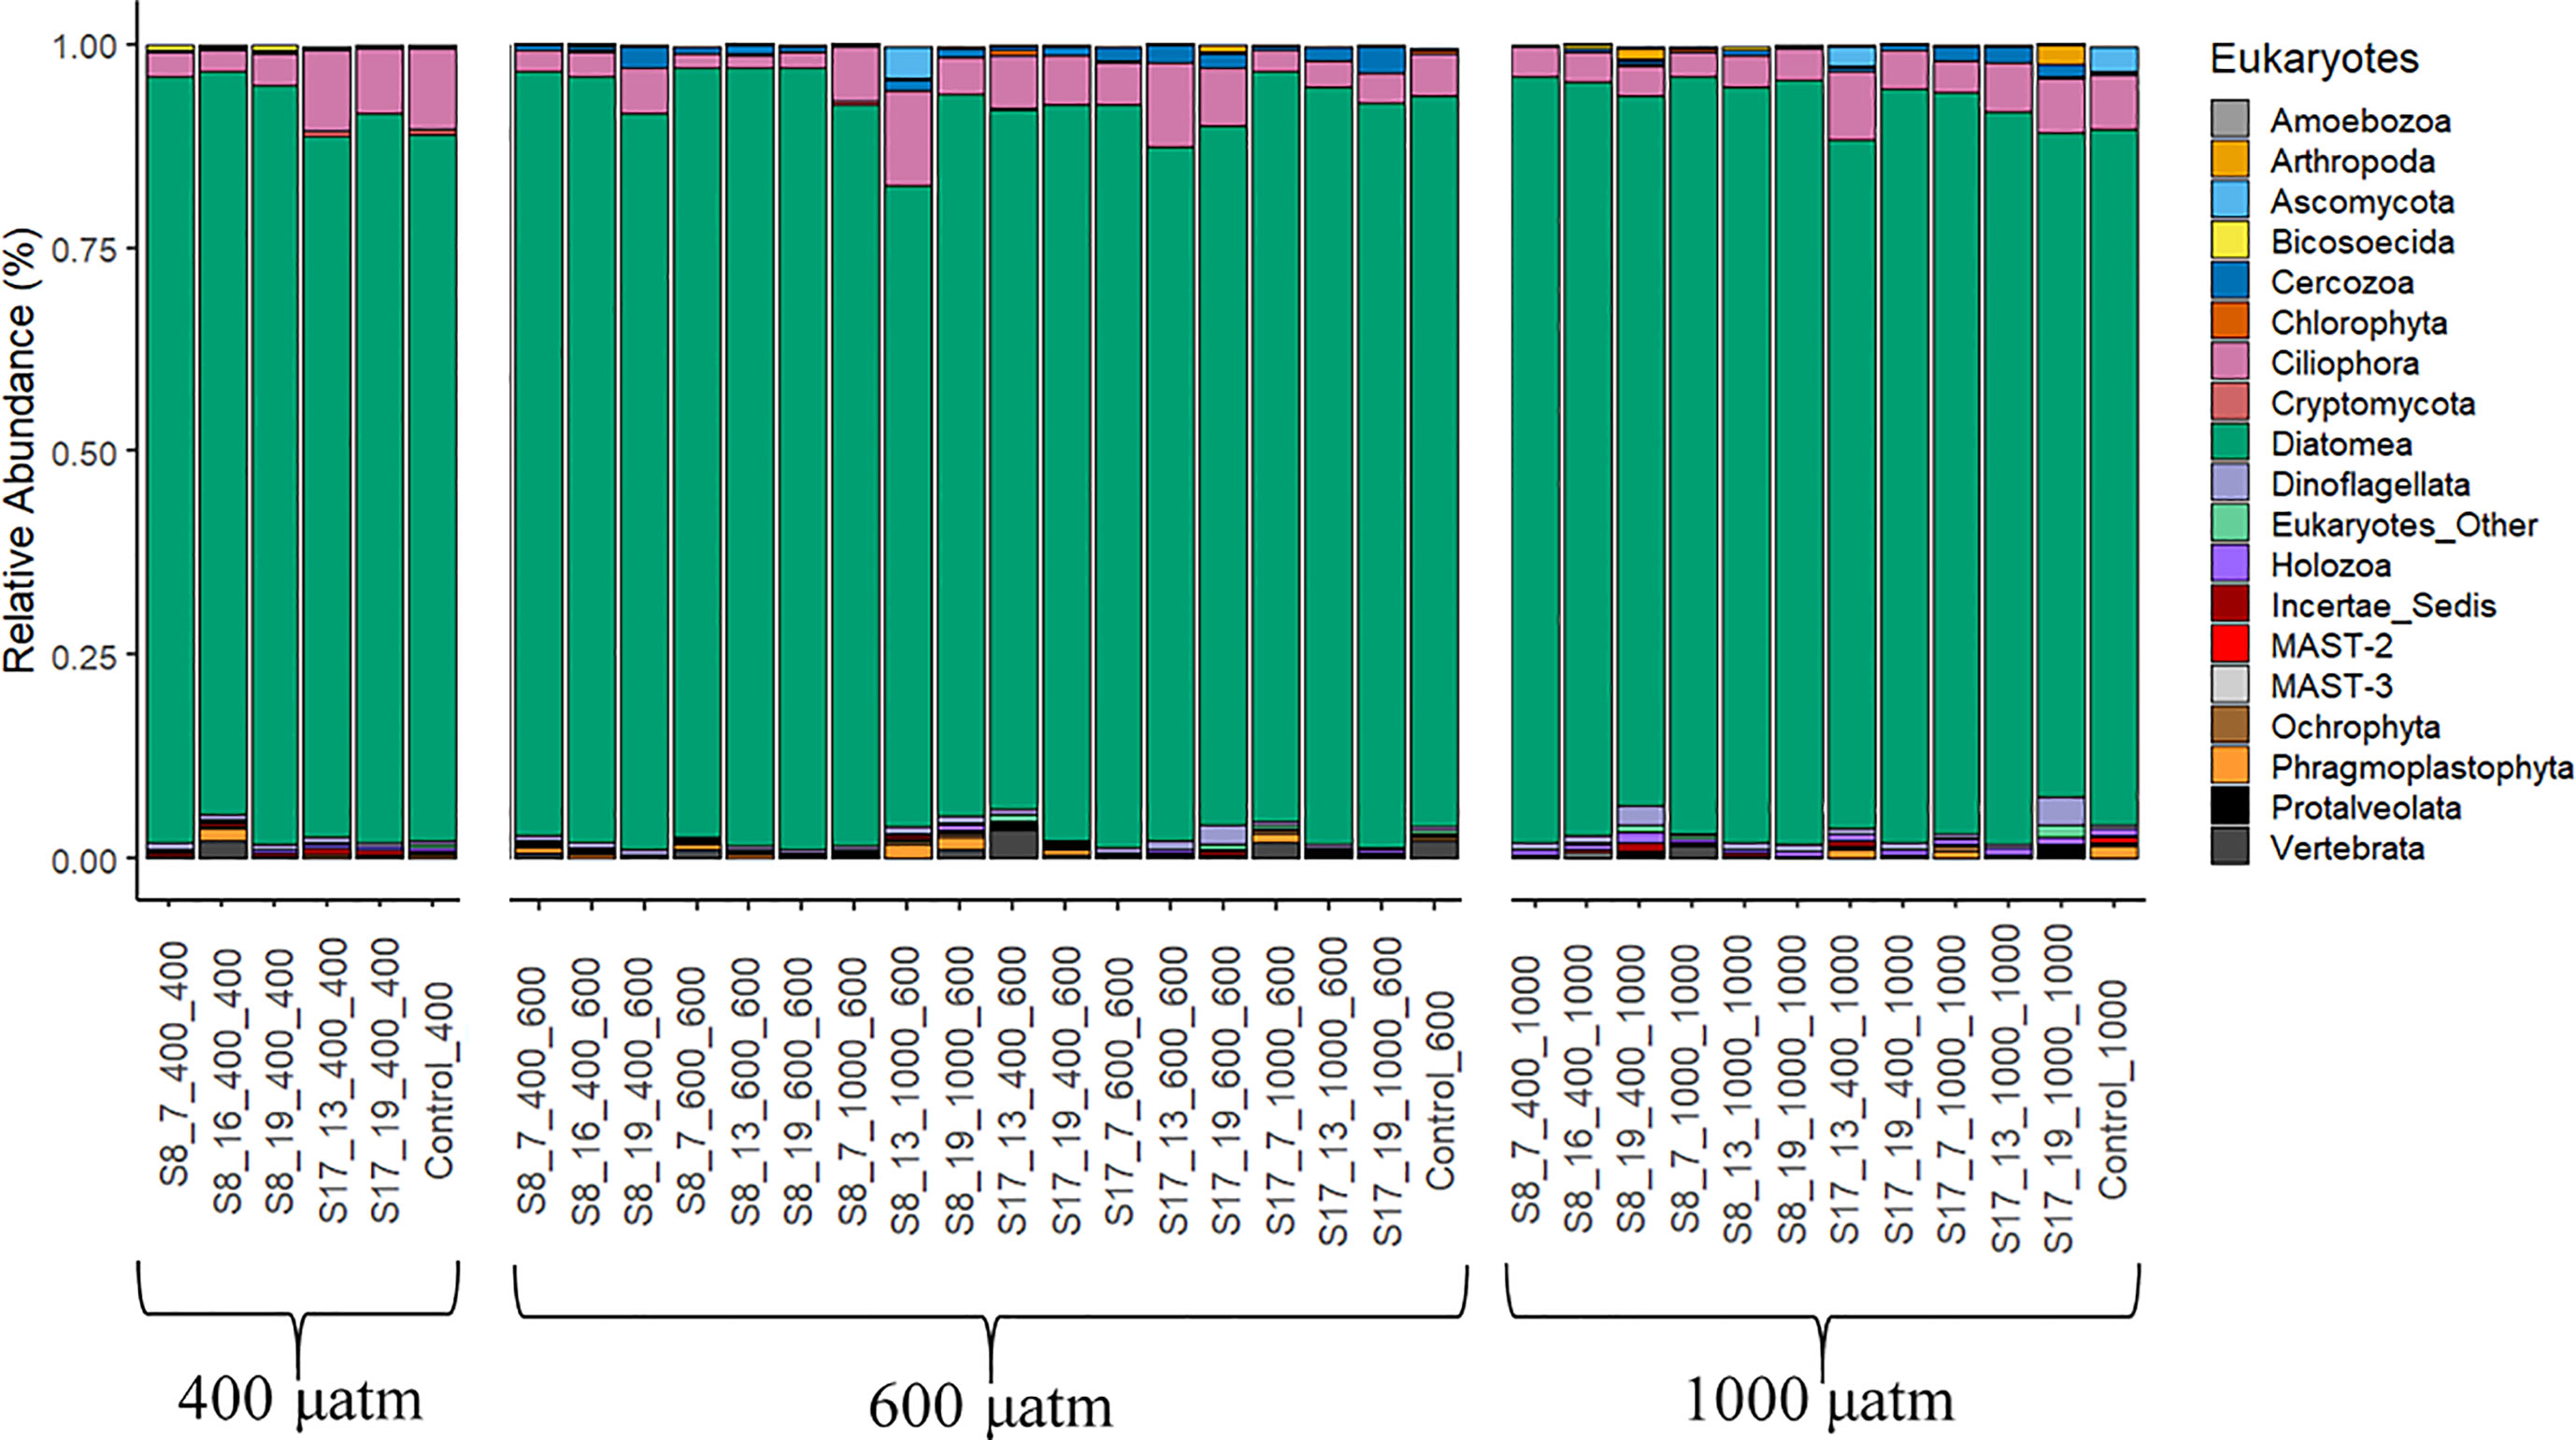
Figure 5 Eukaryote phyla according to the 18S gene DNA Metabarcoding analysis from the samples collected at the end of the 6 day experiment. The results are grouped by the three pCO2 treatments (400 μatm, 600 μatm, 1000 μatm). The following labelling was used to distinguish between the different S. marinoi strains, temperature and pCO2 acclimisation conditions and pCO2 treatment; strain_temperature_CO2acclimisation_CO2treatment.
The PCoA of the bacterial communities using the Weighted Unifrac of Bray-Curtis showed a clear grouping for the different pCO2 treatments (Figure 6). The first group (southern quadrant) consisted of most samples from the 400 μatm treatment, the second (eastern quadrant) from the 600 μatm treatment and the third group (western quadrant) from the 1000 μatm treatment. In agreement, with the 16S PCoA, ANOSIM analysis demonstrated significant differences between the 600 μatm treatment and the other two pCO2 treatments (r=0.51 and 0.43, p=0.001; Table S5). However, indicator species analysis did not highlight any taxa which had an affinity to the 600 μatm treatment. The only treatment with a significant indicator species, Bdellovibrio (IndVal value=0.707, p =0.006; Table S6), was the 400 μatm.
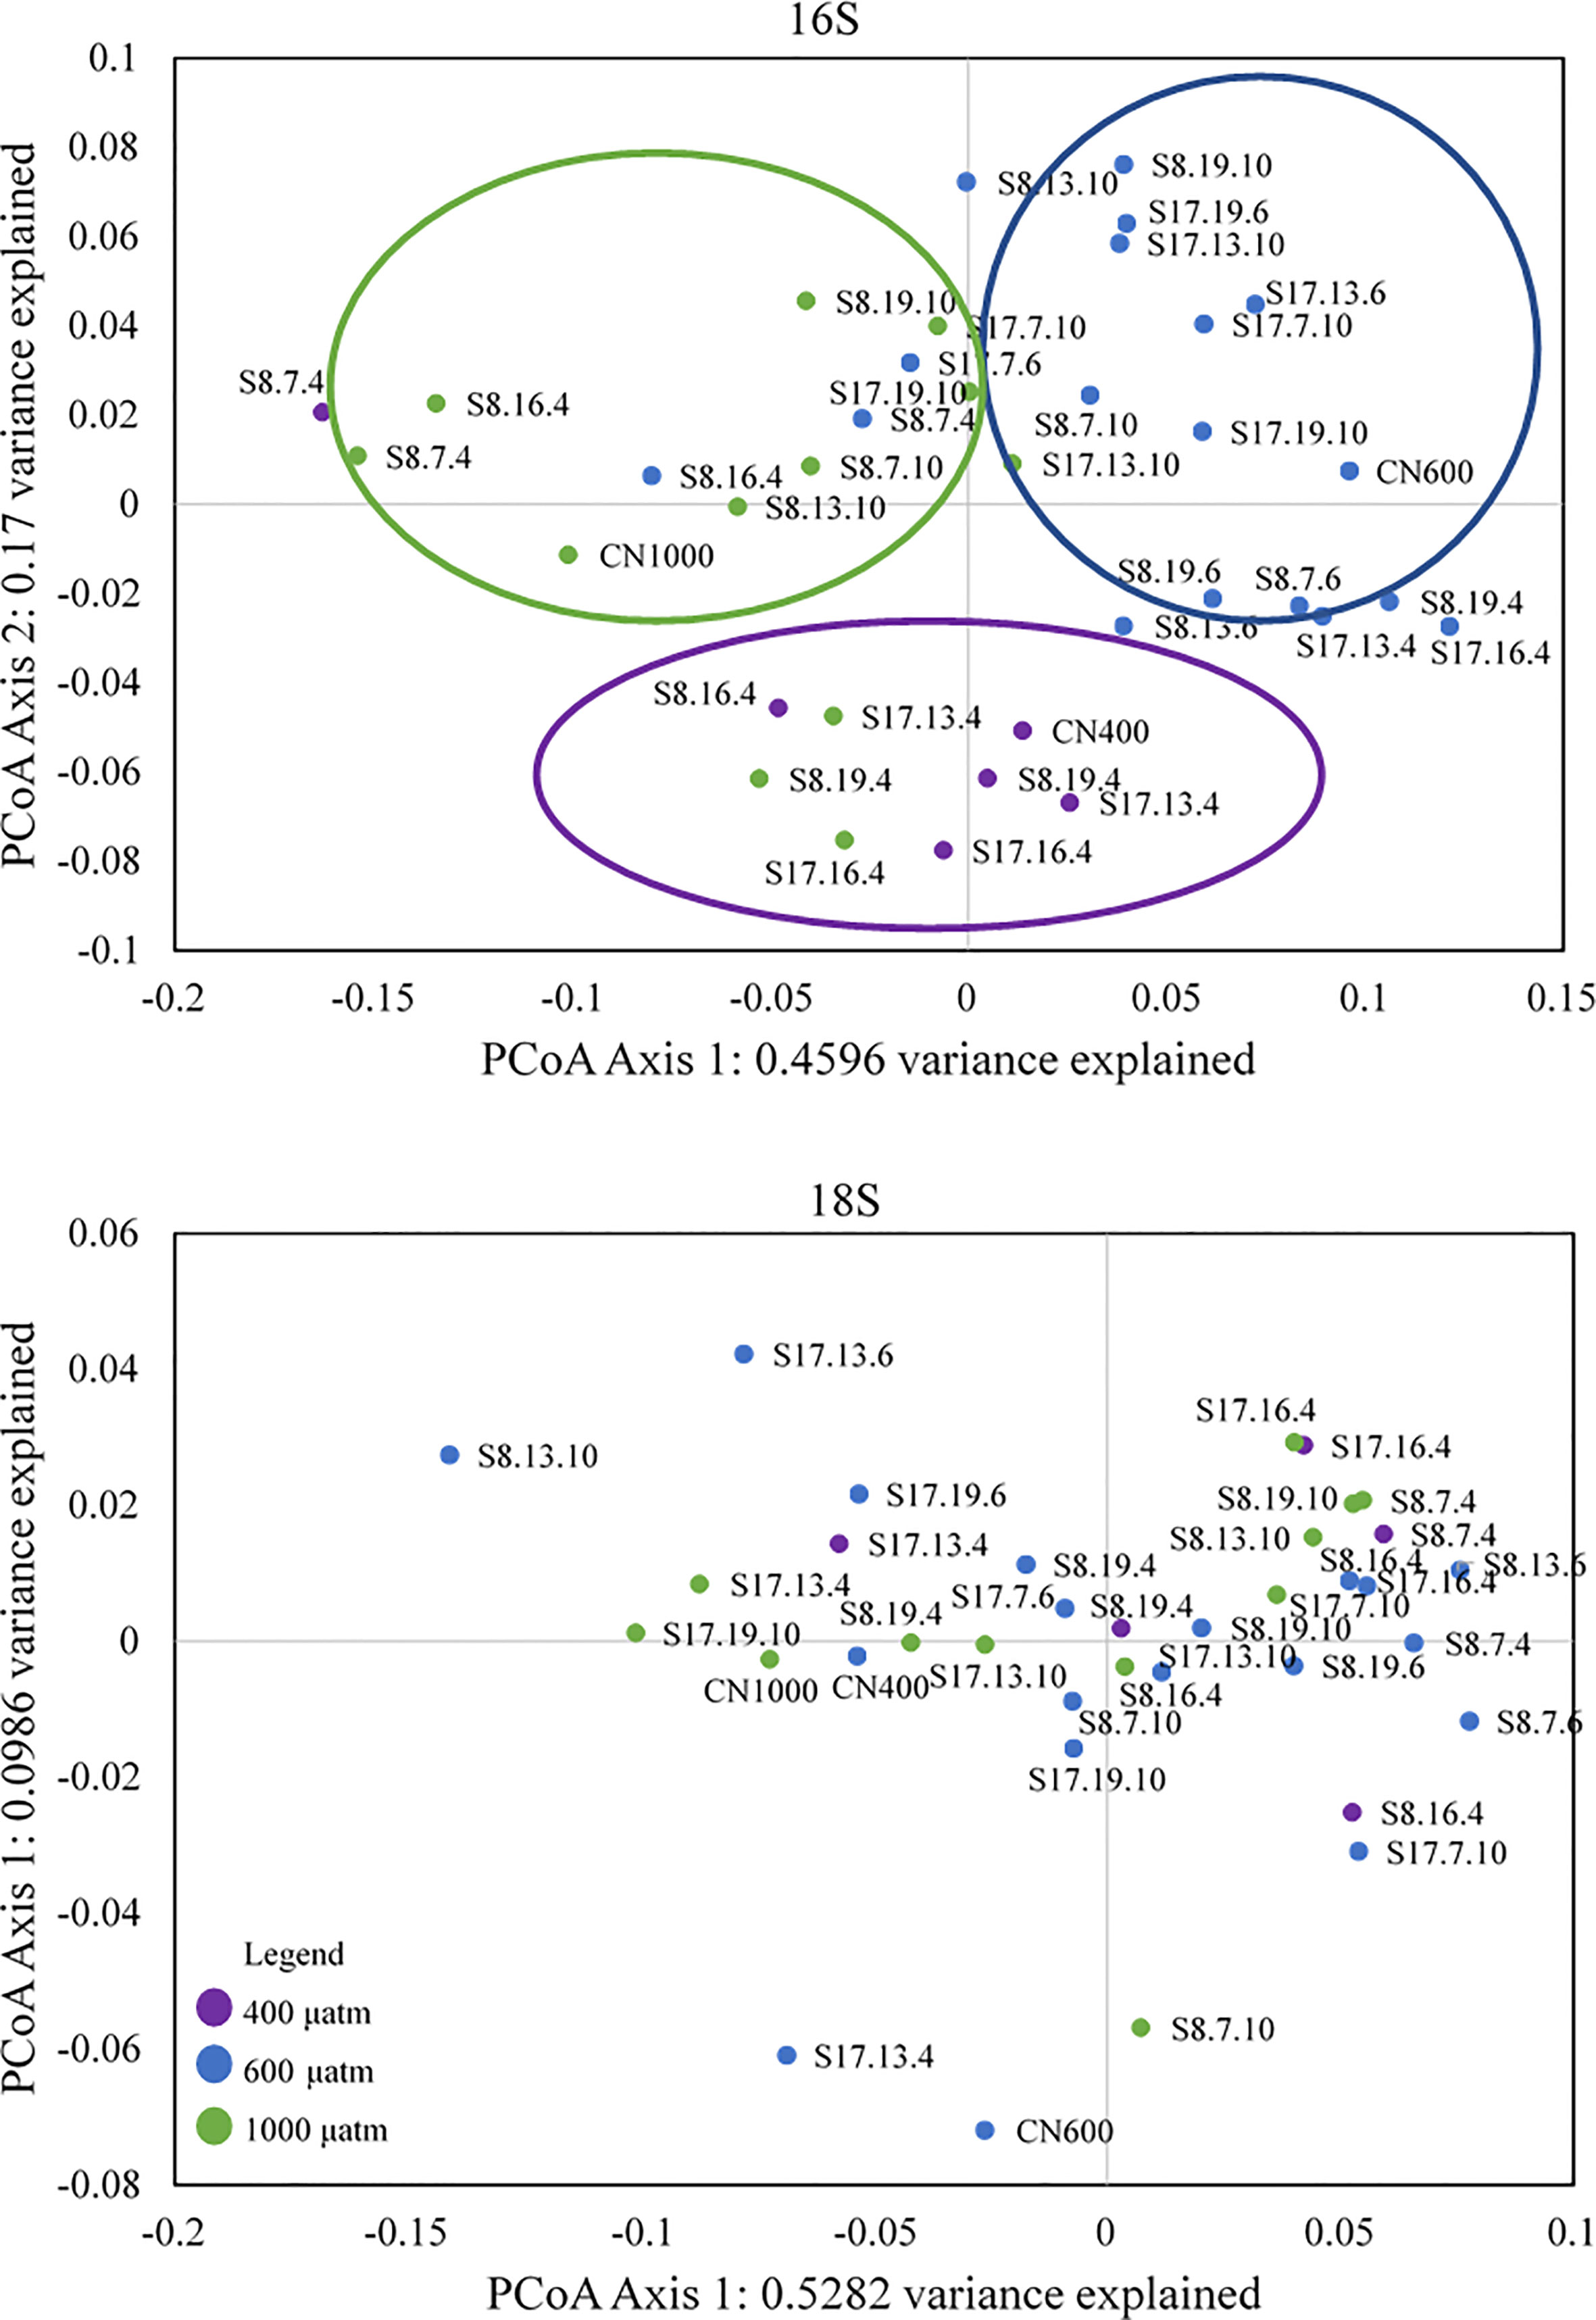
Figure 6 PCoA biplot of the 16S and 18S Bray-Curtis distance matrix for all samples. The three circles in the 16S PCoA plot correspond to the different groupings according to pCO2 treatment, with the colours matching those in the legend, with purple= 400 μatm, blue= 600 μatm and green =1000 μatm CO2 treatment. There were no associated groupings for 18S (eukaryotes).
Compared to the 16S PCoA, the PCoA of the eukaryotic communities consisted of no groupings as well as no clear patterns or trends (Figure 6). This is supported by the 18S ANOSIM results which showed no significant differences between the three pCO2 treatments (Table S5). Only the 400 μatm treatment had an indicator species (Cryptomycota; Indval value=0.537, p=0.033; Table S6). Some groups were more strongly associated with a combination of treatments, such as Chlorophyta (400 and 600 μatm treatments; Indval value=0.809, p=0.024) and Amoebozoa (600 and 1000 μatm treatments; Indval value=0.753, p=0.019).
Discussion
The incorporation of long-term acclimated S. marinoi into short-term mesocosms can help determine if previous acclimation to elevated temperature and pCO2 concentration could give them a competitive advantage in natural microbial communities. Although, in this case, the lack of significant differences after acclimation to different temperature and pCO2 concentrations suggests that S. marinoi did not gain any competitive advantage over other microbial groups. This is supported by Low-Décarie et al. (2013) who found that adaptation to high CO2 concentrations (380 ppm vs. 1000 ppm) did not result in evolutionary change or increased growth rates at elevated CO2 for two diatom genera (Nitzschia spp. and Navicula spp.). This could be due to the pCO2 variability phytoplankton communities experience in their natural environment, both diurnally and seasonally (Schulz and Riebesell, 2013; Yasunaka et al., 2016). Diurnal fluctuations in seawater can range from 0.1 pH units in the Bay of Calvi in the Mediterranean sea to 0.5 in the Kerguelen Archipelago in the Southern Ocean (Delille et al., 2009; Schulz and Riebesell, 2013). Whilst in eutrophic systems, pH can vary between 0.7 and 3.2 units (Thomsen et al., 2010). So, the lack of variations between the different acclimation conditions could be because they are within the pCO2 variability the two strains experience in their natural environments (Thor and Dupont, 2015; Vargas et al., 2022). Whereas, for temperature, Briddon et al., (in review) determined that previous acclimation to two different temperatures conditions, 22°C (mean lake summer temperature) and 26°C (the predicted temperature by 2100), could be a possible driver of genetic change due to enhanced mutation rate and lower secondary metabolites production in heat-adapted cyanobacteria. However, as diatoms are diploids, any mutation or changes in one allele could be masked by the functional allele, making any genetic changes harder to detect (Low-Décarie et al., 2013).
The pCO2 treatment could be a possible indirect driver of bacterial community composition through changes to phytoplankton-bacteria interactions (Krause et al., 2012; Héry et al., 2014). There were significant differences for the 600 μatm treatment (in comparison to the 400 and 1000 μatm treatments) for the bacterial but not for the eukaryotic communities. It is unlikely to be due to differences in nutrient concentrations due to similar abundances between the 600 μatm treatment (mesocosms 2 and 3) and the mesocosm used for the 400 μatm treatment (number 1; Table 2). Krause et al. (2012), using a highly replicated microcosm experiment over the four seasons, found that even moderated changes in pH resulted in microbial community shifts, indicating that slight reductions in pH could be crucial for determining their composition. Yet, this depended on the community assembly and environmental factors such as light. Furthermore, Davidson et al. (2016) found there were little differences in Antarctic microbial abundance (including bacteria) between 84 and 643 μatm pCO2. However, once concentrations exceeded 1281 μatm, the community structure changed favouring small protists (<5 μm) over larger taxa. This suggests that bacteria communities can acclimate to pCO2 changes to a certain level until their rate of acclimation plateaus and they are no longer able to keep up with the continuous decrease in pH (Maas et al., 2013; Aguayo et al., 2020). An increase in atmospheric CO2 whilst not leading to significant changes in algal community composition, can lead to an increase in algal abundance (Bach et al., 2017) and, therefore, an enhancement of organic matter (Huang et al., 2021) and changes to phytoplankton-bacteria interactions (De Kluijver et al., 2010; Hornick et al., 2017). The families Flavobacteriaceae and Alteromonadaceae are highly abundant in marine environments and can become dominant in response to an increase in organic matter (Waśkiewicz and Irzykowska, 2014; Bunse et al., 2016). However, as the 600 and 1000 μatm treatments did not have significantly higher chlorophyll a concentrations, it suggests that other factors must also be influencing bacterial communities. Crummett (2020) found that both families (families Flavobacteriaceae and Alteromonadaceae) can have sub-OTU habitat specialisation to different pH environments, which can also vary seasonally. The season and the naturally occurring bacterial communities (present in the fjord water used in the experiment) could explain the significantly higher OTU abundances of Flavobacteriaceae and Alteromonadaceae in the 600 and 1000 μatm treatments. It would be interesting to replicate this mesocosm experiment in different seasons to determine if bacterial habitation specialisation plays a role in their response to ocean acidification
Even though there were a lack of differences for the eukaryotic communities between the different pCO2 treatments, some groups preferred certain pCO2 conditions. Cryptomycota preferred the 400 μatm treatment, Chlorophyta had an affinity for the 400 and 600 μatm treatment whilst Amoebozoa had an affinity to the 600 and 1000 μatm treatments. The lack of any significant affinity for the 1000 μatm treatment, which had the highest TP and phosphate concentrations, suggests that the high P concentrations are unlikely to be causing the differences between treatments. Cryptomycota is a fungus which consisted of Incertae sedis, meaning taxonomic groups with unknown relationships (Comeau et al., 2016). Rojas-Jimenez et al. (2017) suggests composition of this clade is influenced by site specific effects such as water-column stratification, anoxia and nutrient inputs, suggesting either the present-day pCO2 concentration or an unknown factor led to higher OTU abundances of Cryptomycota in the 400 μatm treatment. Chlorophyta (consisting mostly of the genus Tetraselmis) is commonly found in marine environments. Figueroa et al. (2021) and Kang and Kim (2016) found that Chlorophyta growth increased with CO2 concentrations when nutrients were not limiting. The opposite pattern observed here, could be due to the low or undetectable (iron) nutrient concentrations in all mesocosms. Amoebozoa’s affinity to the higher pCO2 treatment could be due to its ability to survive in a wide range of environments and the limited understanding on the ecological preferences of this taxonomic group (Kudryavtsev et al., 2021). The OTU abundances of Ciliphora (consisting mostly of the subclass Haptoria) was similar across all treatments. The subclass Haptoria is widely distributed in coastal waters (Earland and Montagnes, 2002) and can dominate planktonic communities in a wide variety of nutrient conditions (Barouillet et al., 2022). As micropredators they are exposed to both top-down and bottom-up controls, the removal of zooplankton prior to the beginning of the experiment could have resulted in high abundances in all treatments due to reduced predation.
Overall, elevated pCO2 would increase the growth of photosynthetic organisms, it would also enhance the demand for nutrients (Low-Décarie et al., 2013). Therefore, the lack of iron in all treatments (Table 2) could have prevented elevated growth rates and explain the lack of differences for eukaryotes between the different treatments. This could be why the high pCO2 (1000 μatm) treatment was not significantly different from the other treatment, even though the opposite would be expected. Moreover, the high tolerance of eukaryotes could be due to the highly variable pCO2 conditions they experience in their natural environment. This variability suggests that local phytoplankton communities can acclimate to fluctuating pH conditions at least in the short term (Hinga, 2002; Rathbone et al., 2022). This could explain why all the major algal groups showed limited differences between treatments, supported by the DNA evidence, which showed similar bacterial and eukaryotic species richness among all CO2 treatments (according to the Shannon Diversity Index; Table S4).
Cyanobacteria were the dominant prokaryotes in all treatments; however, all cyanobacterial reads had been assigned as chloroplasts (endosymbiotic cyanobacteria) suggesting that the reads could be fragments of organelles from living and/or dead photoautotrophic eukaryotes. It is now widely accepted that chloroplasts originate from cyanobacteria (Falcón et al., 2010; Sato, 2021). Therefore, it could be suggested that the reads assigned to chloroplasts would most likely belong to the diatoms as they are the most abundant eukaryotic group (>85%). However, it cannot be discounted that the reads also suggest the presence of cyanobacteria. An annual phytoplankton community study from Laholm Bay (south of Gothenburg, Sweden) found July to have the highest monthly relative abundance of cyanobacteria (Eberlein et al., 2017). This combined with stratified water column observed during the summer season, are ideal conditions for cyanobacterial blooms (Paerl and Huisman, 2008). Furthermore, Valencia et al. (2022) found that diatoms and cyanobacteria (specifically Synechococcus) were overrepresented in sinking particles in oligotrophic oceanic regions relative to other eukaryotes. As the water enclosed in the mesocosms used a mixture of surface and bottom water, this could include sinking particles. However, as metagenomic sequencing was not completed it is not possible to determine the origin of the chloroplasts.
Interestingly, even though all samples (except the controls) were inoculated with acclimated Skeletonema, it was not the dominant diatom species in terms of OTUs. Multiple studies have shown that diatoms dominate the phytoplankton community at the time of year the experiment was run (July; Höglander et al., 2013; Eberlein et al., 2017). This is supported by the chlorophyll a concentrations of the major algal groups, which showed that the chromophyte algae group (consisting of cryptophytes, dinoflagellates and diatoms) had the highest concentration in all treatments. All samples also had a high relative OTU abundance of diatoms (unclassified Bacillariophyceae; 77.5-94.5%). However, it is unlikely to be the acclimated Skeletonema strains (S8 and S17), due to similar OTU abundances in the control samples which were not inoculated with these strains. As the diatom relative OTU abundance was similar in all treatments, the high OTU abundances are most likely due to the diatoms dominating the phytoplankton community at the time.
Strain-specific differences (between S8 and S17) suggests phenotypic and genotypic variants of the same species can result in different responses in natural microbial communities (Langer et al., 2009). This could explain the significantly higher relative abundances of diatoms and proteobacteria in mesocosms containing the seawater inoculated with the strain S8 and the high relative abundances of Ciliphora, Cercozoa and endosymbiotic cyanobacteria in mesocosms containing the seawater inoculated with the strain S17. Interspecies interactions can play a significant role in determining community composition and preclude or facilitate the coexistence of specific community members (Leventhal et al., 2018). Goyal et al. (2022) found that strains belonging to the same species were the key element of long-term community dynamics due to pre-existing genetics. It is plausible that strain interactions between the acclimated S. marinoi and the other major eukaryotic and bacterial groups could explain some of the significant differences between the microbial communities (Vuong et al., 2017). However, without metagenomic analyses it is not possible to determine if genetic variation or differentiated genotypes played a role.
Conclusion
In summary, this study showed that increases in pCO2 could result in significant changes in OTU diversity of prokaryotic communities but have a limited impact on eukaryotes. Even though all dialysis bags (except the controls) were inoculated with acclimated S. marinoi, there were insignificant differences between the pCO2 treatments showing the species plasticity to variations within its natural environment. This suggests that previous acclimation to increased temperature and pCO2 did not give them a competitive advantage in natural microbial communities. Furthermore, strain specific differences indicated that interspecies interactions between different eukaryotic and bacterial groups could have played a role in determining community composition. In the future, the use of metagenomic sequencing of the resulting biomass from mesocosm experiments could improve our understanding of strain-specific interactions.
Data availability statement
The datasets presented in this study can be found in online repositories. The names of the repository/repositories and accession number(s) can be found below: European Nucleotide Archive, PRJEB61711.
Author contributions
RB, WE, and BC collected and described the Skeletonema strains. CB, BD, MN, and AH performed the long-term acclimation experiment. BD, RB, and SD designed the experimental setup. CB, MN, AN, and BD completed the mesocosm experiment. MN and AN completed the DNA extraction and purification process. CB analysed the DNA metabarcoding results and wrote the first version of the manuscript. All authors contributed to the article and approved the submitted version.
Funding
This work was supported by Norway Grants Call 2019 (RO-NO 2019) – Collaborative Research Projects, no. 28/2020, the Romanian Ministry of Research, Innovation and Digitization (PN-III-P2-2.1-PED-2021, contract 653/2022 and the Core Project BIORESGREEN, subproject BioClimpact no. 7/30.12.2022, code 23020401.
Acknowledgments
We would like to thank Maria-Cecilia Chiriac for depositing the raw 16S and 18S DNA sequences in the European Nucleotide Archive.
Conflict of interest
The authors declare that the research was conducted in the absence of any commercial or financial relationships that could be construed as a potential conflict of interest.
Publisher’s note
All claims expressed in this article are solely those of the authors and do not necessarily represent those of their affiliated organizations, or those of the publisher, the editors and the reviewers. Any product that may be evaluated in this article, or claim that may be made by its manufacturer, is not guaranteed or endorsed by the publisher.
Supplementary material
The Supplementary Material for this article can be found online at: https://www.frontiersin.org/articles/10.3389/fmars.2023.1197570/full#supplementary-material
References
Aguayo P., Campos V. L., Henríquez C., Olivares F., De Ia Iglesia R., Ulloa O., et al. (2020). The influence of pCO2-driven ocean acidification on open ocean bacterial communities during a short-term microcosm experiment in the Eastern Tropical South Pacific (ETSP) off Northern Chile. Microorganisms 8 (12), 1–14. doi: 10.3390/microorganisms8121924
AMAP (2018). “Arctic Monitoring and assessment programme: biological responses to ocean acidification,” in Arctic Monitoring and Assessment Programme (AMAP), (Oslo, Norway). Available at: http://www.amap.no/documents/doc/amap-assessment-2013-arctic-ocean-acidification/881.
Andersen R. A., Kawachi M. (2005). Microalgae isolation techniques. Algal Culturing Techniques (Elsevier), 83.
Angeles Gallego M., Timmermann A., Friedrich T., Zeebe R. E. (2018). Drivers of future seasonal cycle changes in oceanic pCO2. Biogeosciences 15 (17), 5315–5327. doi: 10.5194/bg-15-5315-2018
Bach L. T., Alvarez-Fernandez S., Hornick T., Stuhr A., Riebesell U. (2017). Simulated ocean acidification reveals winners and losers in coastal phytoplankton. PLoS One 12 (11), 1–22. doi: 10.1371/journal.pone.0188198
Barouillet C., Vasselon V., Keck F., Millet L., Etienne D., Galop D., et al. (2022). Paleoreconstructions of ciliate communities reveal long-term ecological changes in temperate lakes. Sci. Rep. 12 (1), 1–12. doi: 10.1038/s41598-022-12041-7
Behrenfeld M. J., O’Malley R. T., Boss E. S., Westberry T. K., Graff J. R., Halsey K. H., et al. (2016). Revaluating ocean warming impacts on global phytoplankton. Nat. Climate Change 6 (3), 323–330. doi: 10.1038/nclimate2838
Briddon C. L., Szekeres E., Hegedüs A., Nicoară M., Chiriac C., Stockenreiter M., et al. (2022). The combined impact of low temperatures and shifting phosphorus availability on the competitive ability of cyanobacteria. Sci. Rep. 12, 1–13. doi: 10.1038/s41598-022-20580-2
Bunse C., Lundin D., Karlsson C. M. G., Akram N., Vila-Costa M., Palovaara J., et al. (2016). Response of marine bacterioplankton pH homeostasis gene expression to elevated CO2. Nat. Climate Change 6 (5), 483–487. doi: 10.1038/nclimate2914
Caldeira K., Wickett M. E. (2003). Anthropogenic carbon and ocean pH. Nature 425 (6956), 365. doi: 10.1038/425365a
Caporaso J. G., Kuczynski J., Stombaugh J., Bittinger K., Bushman F. D., Costello E. K., et al. (2010). QIIME allows analysis of high-throughput community sequencing data. Nat. Methods 7 (5), 335–336. doi: 10.1038/nmeth.f.303
Chen M., Xu C., Wang X., Wu Y., Li L. (2021). Nonribosomal peptide synthetases and nonribosomal cyanopeptides synthesis in microcystis: a comparative genomics study. Algal Res. 59, 102432. doi: 10.1016/j.algal.2021.102432
Clarke K.R. (1993). Non-parametric multivariate analyses of changes in community structure. Aust. J. Ecol. 18 (1), 117–143. doi: 10.1111/j.1442-9993.1993.tb00438.x
Clarke K. R., Warwick R. M. (1994). Similarity-based testing for community pattern: the two-way layout with no replication. Mar. Biol. 118 (1), 167–176. doi: 10.1007/BF00699231
Collins S., Rost B., Rynearson T. A. (2014). Evolutionary potential of marine phytoplankton under ocean acidification. Evol. Appl. 7 (1), 140–155. doi: 10.1111/eva.12120
Comeau A. M., Vincent W. F., Bernier L., Lovejoy C. (2016). Novel chytrid lineages dominate fungal sequences in diverse marine and freshwater habitats. Sci. Rep. 6, 1–6. doi: 10.1038/srep30120
Crummett L. T. (2020). Acidification decreases microbial community diversity in the salish Sea, a region with naturally high pCO2. PLoS One 15 (10), e0241183. doi: 10.1371/journal.pone.0241183
Davidson A. T., McKinlay J., Westwood K., Thomson P. G., Van Den Enden R., De Salas M., et al. (2016). Enhanced CO2 concentrations change the structure of Antarctic marine microbial communities. Mar. Ecol. Prog. Ser. 552, 93–113. doi: 10.3354/meps11742
De Kluijver A., Soetaert K., Schulz K. G., Riebesell U., Bellerby R. G. J., Middelburg J. J. (2010). Phytoplankton-bacteria coupling under elevated CO2 levels: a stable isotope labelling study. Biogeosciences 7 (11), 3783–3797. doi: 10.5194/bg-7-3783-2010
Delille B., Borges A. V., Delille D. (2009). Influence of giant kelp beds (Macrocystis pyrifera) on diel cycles of pCO2 and DIC in the Sub-Antarctic coastal area. Estuarine Coast. Shelf Sci. 81 (1), 114–122. doi: 10.1016/j.ecss.2008.10.004
DeSantis T. Z., Hugenholtz P., Larsen N., Rojas M., Brodie E. L., Keller K., et al. (2006). Greengenes, a chimera-checked 16S rRNA gene database and workbench compatible with ARB. Appl. Environ. Microbiol. 72 (7), 5069–5072. doi: 10.1128/AEM.03006-05
Dragoș N. (1997). An introduction to the algae and the culture collection of algae at the institute of biological research, cluj-napoca (Cluj-Napoca, Romania: Cluj University Press).
Drugă B., Ramm E., Szekeres E., Chiriac C., Hegedüs A., Stockenreiter M. (2022). Long‐term acclimation might enhance the growth and competitive ability of Microcystis aeruginosa in warm environments. Freshw. Biol. 67 (4), 89–602. doi: 10.1111/fwb.13865
Dutkiewicz S., Morris J. J., Follows M. J., Scott J., Levitan O., Dyhrman S. T., et al. (2015). Impact of ocean acidification on the structure of future phytoplankton communities. Nat. Climate Change 5 (11), 1002–1006. doi: 10.1038/nclimate2722
Earland K. A., Montagnes D. J. S. (2002). Description of a new marine species of askenasia blochmann 1895 (Ciliophora, haptoria), with notes on its ecology. J. Eukaryotic Microbiol. 49 (5), 423–427. doi: 10.1111/j.1550-7408.2002.tb00222.x
Eberlein T., Wohlrab S., Rost B., John U., Bach L. T., Riebesell U., et al. (2017). Effects of ocean acidification on primary production in a coastal North Sea phytoplankton community. PLoS One 12 (3), 1–15. doi: 10.1371/journal.pone.0172594
Falcón L. I., Magallón S., Castillo A. (2010). Dating the cyanobacterial ancestor of the chloroplast. ISME J. 4 (6), 777–783. doi: 10.1038/ismej.2010.2
Feng Y., Hare C. E., Leblanc K., Rose J. M., Zhang Y., DiTullio G. R., et al. (2009). Effects of increased pCO2 and temperature on the North Atlantic spring bloom. i. the phytoplankton community and biogeochemical response. Mar. Ecol. Prog. Ser. 388 (May), 13–25. doi: 10.3354/meps08133
Figueroa F. L., Bonomi-Barufi J., Celis-Plá P. S. M., Nitschke U., Arenas F., Connan S., et al. (2021). Short-term effects of increased CO2, nitrate and temperature on photosynthetic activity in ulva rigida (Chlorophyta) estimated by different pulse amplitude modulated fluorometers and oxygen evolution. J. Exp. Bot. 72 (2), 491–509. doi: 10.1093/jxb/eraa473
Friedlingstein P., O'sullivan M., Jones M. W., Andrew R. M., Gregor L., Hauck J., et al. (2022). Global carbon budget 2022. Earth System Science Data Discussions 2022, 1–159.
Gao K., Campbell D. A. (2014). Photophysiological responses of marine diatoms to elevated CO2 and decreased pH: a review. Funct. Plant Biol. 41 (5), 449–459. doi: 10.1071/FP13247
Gao G., Fu Q., Beardall J., Wu M., Xu J. (2019). Combination of ocean acidification and warming enhances the competitive advantage of Skeletonema costatum over a green tide alga, ulva linza. Harmful Algae 85, 101698. doi: 10.1016/j.hal.2019.101698
Gattuso J. P., Lavigne H. (2009). Technical note: approaches and software tools to investigate the impact of ocean acidification. Biogeosciences 6 (10), 2121–2133. doi: 10.5194/bg-6-2121-2009
Goyal A., Bittleston L. S., Leventhal G. E., Lu L., Cordero O. X. (2022). Interactions between strains govern the eco-evolutionary dynamics of microbial communities. ELife 11, 1–23. doi: 10.7554/ELIFE.74987
Graffelman J., van Eeuwijk F. (2005). Calibration of multivariate scatter plots for exploratory analysis of relations within and between sets of variables in genomic research. Biometrical J. 47 (6), 863–879. doi: 10.1002/bimj.200510177
Guillard R. R. L. (1975). “Culture of phytoplankton for feeding marine invertebrates,” in Culture of marine invertebrate animals: proceedings–1st conference on culture of marine invertebrate animals greenport (Boston, MA: Springer US), 29–60.
Guillard R. R. L., Ryther J. H. (1962). Studies of marine planktonic diatoms: i. cyclotella nana hustedt, and detonula confervacea (Cleve) gran. Can. J. Microbiol. 8 (2), 229–239. doi: 10.1139/m62-029
Gurevich A., Saveliev V., Vyahhi N., Tesler G. (2013). QUAST: quality assessment tool for genome assemblies. Bioinformatics 29 (8), 1072–1075. doi: 10.1093/bioinformatics/btt086
Hadziavdic K., Lekang K., Lanzen A., Jonassen I., Thompson E. M., Troedsson C. (2014). Characterization of the 18S rRNA gene for designing universal eukaryote specific primers. PLoS One 9 (2), e87624. doi: 10.1371/journal.pone.0087624
Herlemann D. P., Labrenz M., Jürgens K., Bertilsson S., Waniek and Andersson J. J. A. F. (2011). Transitions in bacterial communities along the 2000 km salinity gradient of the Baltic Sea. ISME J 5 (10), 1571–1579.
Héry M., Volant A., Garing C., Luquot L., Elbaz Poulichet F., Gouze P. (2014). Diversity and geochemical structuring of bacterial communities along a salinity gradient in a carbonate aquifer subject to seawater intrusion. FEMS Microbiol. Ecol. 90 (3), 922–934. doi: 10.1111/1574-6941.12445
Hinga K. R. (2002). Effects of pH on coastal marine phytoplankton. Mar. Ecol. Prog. Ser. 238, 281–300. doi: 10.3354/meps238281
Höglander H., Karlson B., Johansen M., Walve J., Andersson A. (2013). “Overview of coastal phytoplankton indicators and their potential use in Swedish waters,” in WATERS report no. 2013, vol. 5. Available at: https://waters.gu.se/digitalAssets/1457/1457765_3.3_1_coastal_phytoplankton_indicators.pdf.
Hoppe C. J. M., Wolf K. K. E., Schuback N., Tortell P. D., Rost B. (2018). Compensation of ocean acidification effects in Arctic phytoplankton assemblages. Nat. Climate Change 8 (6), 529–533. doi: 10.1038/s41558-018-0142-9
Hornick T., Bach L. T., Crawfurd K. J., Spilling K., Achterberg E. P., Woodhouse J. N., et al. (2017). Ocean acidification impacts bacteria–phytoplankton coupling at low-nutrient conditions. Biogeosciences 14 (1), 1–15. doi: 10.5194/bg-14-1-2017
Huang R., Sun J., Yang Y., Jiang X., Wang Z., Song X., et al. (2021). Elevated pCO2 impedes succession of phytoplankton community from diatoms to dinoflagellates along with increased abundance of viruses and bacteria. Front. Mar. Sci. 8 (August). doi: 10.3389/fmars.2021.642208
IPCC (2018). “IPCC report global warming of 1.5°C,” in Ipcc - Sr15, 2. 17–20. Available at: www.environmentalgraphiti.org.
IPCC (2022). “Climate change 2022: impacts, adaptation, and vulnerability,” in Contribution of working group II to the sixth assessment report of the intergovernmental panel on climate change. Eds. Pörtner H.-O., Roberts D. C., Tignor M., Poloczanska E. S., Mintenbeck K., Alegría A., Craig M., Langsdorf S., Löschke S., Möller V., Okem A., Rama B. (Cambridge, UK and New York, NY, USA: Cambridge University Press).
Kang E. J., Kim K. Y. (2016). Effects of future climate conditions on photosynthesis and biochemical component of ulva pertusa (Chlorophyta). Algae 31 (1), 49–59. doi: 10.4490/algae.2016.31.3.9
Kester D. R., Duedall I. W., Connors D. N., Pytkowicz R. M. (1967). Preparation of artificial seawater 1. Limnol. Oceanogr. 12 (1), 176–179. doi: 10.4319/lo.1967.12.1.0176
Kim S. U., Kim K. Y. (2021). Impact of climate change on the primary production and related biogeochemical cycles in the coastal and sea ice zone of the Southern Ocean. Sci. Total Environ. 751, 141678. doi: 10.1016/j.scitotenv.2020.141678
Kim J.-M., Lee K., Shin K., Kang J.-H., Lee H.-W., Kim M., et al. (2006). The effect of seawater CO2 concentration on growth of a natural phytoplankton assemblage in a controlled mesocosm experiment. Limnol. Oceanogr. 51 (4), 1629–1636. doi: 10.4319/lo.2006.51.4.1629
Krause E., Wichels A., Giménez L., Lunau M., Schilhabel M. B., Gerdts G. (2012). Small changes in pH have direct effects on marine bacterial community composition: a microcosm approach. PloS One 7 (10), e47035. doi: 10.1371/journal.pone.0047035
Kudryavtsev A., Volkova E., Voytinsky F. (2021). A checklist of amoebozoa species from marine and brackish-water biotopes with notes on taxonomy, species concept and distribution patterns. Protistology 15 (4), 220–273. doi: 10.21685/1680-0826-2021-15-4-3
Langer G., Nehrke G., Probert I., Ly J., Ziveri P. (2009). Strain-specific responses of emiliania huxleyi to changing seawater carbonate chemistry. Biogeosciences 6 (11), 2637–2646. doi: 10.5194/bg-6-2637-2009
Leventhal G. E., Boix C., Kuechler U., Enke T. N., Sliwerska E., Holliger C., et al. (2018). Strain-level diversity drives alternative community types in milimetre-scale granular biofilms. Nat. Microbiol. 3 (2), 1295–1303. doi: 10.1038/s41564-018-0242-3
Lewandowska A. M., Boyce D. G., Hofmann M., Matthiessen B., Sommer U., Worm B. (2014). Effects of sea surface warming on marine plankton. Ecol. Lett. 17 (5), 614–623. doi: 10.1111/ele.12265
Li H., Xu T., Ma J., Li F., Xu J. (2021). Physiological responses of Skeletonema costatum to the interactions of seawater acidification and the combination of photoperiod and temperature. Biogeosciences 18 (4), 1439–1449. doi: 10.5194/bg-18-1439-2021
Liu X., Li Y., Wu Y., Huang B., Dai M., Fu F., et al. (2017). Effects of elevated CO2 on phytoplankton during a mesocosm experiment in the Southern eutrophicated coastal water of China. Sci. Rep. 7 (1), 1–14. doi: 10.1038/s41598-017-07195-8
Low-Décarie E., Jewell M. D., Fussmann G. F., Bell G. (2013). Long-term culture at elevated atmospheric CO2 fails to evoke specific adaptation in seven freshwater phytoplankton species. Proc. R. Soc. B: Biol. Sci. 280 (1754), 20122598. doi: 10.1098/rspb.2012.2598
Lozupone C., Knight R. (2005). UniFrac: a new phylogenetic method for comparing microbial communities. Appl. Environ. Microbiol. 71 (12), 8228–8235. doi: 10.1128/AEM.71.12.8228-8235.2005
Maas E. W., Law C. S., Hall J. A., Pickmere S., Currie K. I., Chang F. H., et al. (2013). Effect of ocean acidification on bacterial abundance, activity and diversity in the Ross Sea, Antarctica. Aquat. Microbial Ecol. 70 (1), 1–15. doi: 10.3354/ame01633
Maugendre L., Gattuso J.-P., Louis J., De Kluijver A., Marro S., Soetaert K., et al. (2015). Effect of ocean warming and acidification on a plankton community in the NW Mediterranean Sea. ICES J. Mar. Sci. 72 (6), 1744–1755. doi: 10.1093/icesjms/fsu161
Millero F. J., Lee K., Roche M. (1998). Distribution of alkalinity in the surface waters of the major oceans. Mar. Chem. 60 (1–2), 111–130. doi: 10.1016/S0304-4203(97)00084-4
Paerl H. W., Huisman J. (2008). Blooms like it hot. Science 320 (5872), 57–58. doi: 10.1126/science.1155398
Pörtner D. C., Roberts V., Masson-Delmotte P., Zhai M., Tignor E., Poloczanska K., et al. (2019) in IPCC, 2019. Special Report on the Ocean and Cryosphere in a Changing Climate. (Cambridge, UK and New York, NY, USA: Cambridge University Press).
Rathbone M., Brown K. T., Dove S. (2022). Tolerance to a highly variable environment does not infer resilience to future ocean warming and acidification in a branching coral. Limnol. Oceanogr. 67 (1), 272–284. doi: 10.1002/lno.11991
Rojas-Jimenez K., Wurzbacher C., Bourne E. C., Chiuchiolo A., Priscu J. C., Grossart H. P. (2017). Early diverging lineages within cryptomycota and chytridiomycota dominate the fungal communities in ice-covered lakes of the McMurdo dry valleys, Antarctica. Sci. Rep. 7 (1), 1–11. doi: 10.1038/s41598-017-15598-w
Rost B., Zondervan I., Wolf-Gladrow D. (2008). Sensitivity of phytoplankton to future changes in ocean carbonate chemistry: current knowledge, contradictions and research directions. Mar. Ecol. Prog. Ser. 373, 227–237. doi: 10.3354/meps07776
Sato N. (2021). Are cyanobacteria an ancestor of chloroplasts or just one of the gene donors for plants and algae? Genes 12 (6), 823. doi: 10.3390/genes12060823
Schulz K. G., Riebesell U. (2013). Diurnal changes in seawater carbonate chemistry speciation at increasing atmospheric carbon dioxide. Mar. Biol. 160 (8), 1889–1899. doi: 10.1007/s00227-012-1965-y
Sefbom J., Kremp A., Hansen P. J., Johannesson K., Godhe A., Rengefors K. (2022). Local adaptation through countergradient selection in Northern populations of Skeletonema marinoi. Evol. Appl. , 1–10. doi: 10.1111/eva.13436
Sefbom J., Kremp A., Rengefors K., Jonsson P. R., Sjöqvist C., Godhe A. (2018). A planktonic diatom displays genetic structure over small spatial scales. Environ. Microbiol. 20 (8), 2783–2795. doi: 10.1111/1462-2920.14117
Seymour J. R., Amin S. A., Raina J.-B., Stocker R. (2017). Zooming in on the phycosphere: the ecological interface for phytoplankton–bacteria relationships. Nat. Microbiol. 2 (7), 1–12. doi: 10.1038/nmicrobiol.2017.65
Sommer U., Paul C., Moustaka-Gouni M. (2015). Warming and ocean acidification effects on phytoplankton - from species shifts to size shifts within species in a mesocosm experiment. PloS One 10 (5), 1–17. doi: 10.1371/journal.pone.0125239
Thomsen J., Gutowska M. A., Saphörster J., Heinemann A., Trübenbach K., Fietzke J., et al. (2010). Calcifying invertebrates succeed in a naturally CO 2-rich coastal habitat but are threatened by high levels of future acidification. Biogeosciences 7 (11), 3879–3891. doi: 10.5194/bg-7-3879-2010
Thor P., Dupont S. (2015). Transgenerational effects alleviate severe fecundity loss during ocean acidification in a ubiquitous planktonic copepod. Global Change Biol. 21 (6), 2261–2271. doi: 10.1111/gcb.12815
Valencia B., Stukel M. R., Allen A. E., McCrow J. P., Rabines A., Landry M. R. (2022). Microbial communities associated with sinking particles across an environmental gradient from coastal upwelling to the oligotrophic ocean. Deep-Sea Res. Part I: Oceanographic Res. Papers 179 (October 2021), 103668. doi: 10.1016/j.dsr.2021.103668
Van Den Meersche K., Middelburg J. J., Soetaert K., Van Rijswijk P., Boschker H. T. S., Heip C. H. R. (2004). Carbon-nitrogen coupling and algal-bacterial interactions during an experimental bloom: modeling a 13C tracer experiment. Limnol. Oceanogr. 49 (3), 862–878. doi: 10.4319/lo.2004.49.3.0862
Vargas C. A., Cuevas L. A., Broitman B. R., San Martin V. A., Lagos N. A., Gaitán-Espitia J. D., et al. (2022). Upper environmental pCO2 drives sensitivity to ocean acidification in marine invertebrates. Nat. Climate Change 12 (2), 200–207. doi: 10.1038/s41558-021-01269-2
Vuong H. B., Thrall P. H., Barrett L. G. (2017). Host species and environmental variation can influence rhizobial community composition. J. Ecol. 105 (2), 540–548. doi: 10.1111/1365-2745.12687
Waśkiewicz A., Irzykowska L. (2014). Flavobacterium spp.–characteristics, occurrence, and toxicity. Encyclopedia of Food Microbiology, 938–942. doi: 10.1016/B978-0-12-384730-0.00126-9
Winder M., Sommer U. (2012). Phytoplankton response to a changing climate. Hydrobiologia 698 (1), 5–16. doi: 10.1007/s10750-012-1149-2
Yasunaka S., Murata A., Watanabe E., Chierici M., Fransson A., van Heuven S., et al. (2016). Mapping of the air–sea CO2 flux in the Arctic ocean and its adjacent seas: basin-wide distribution and seasonal to interannual variability. Polar Sci. 10 (3), 323–334. doi: 10.1016/j.polar.2016.03.006
Zheng Y., Giordano M., Gao K. (2015). Photochemical responses of the diatom Skeletonema costatum grown under elevated CO2 concentrations to short-term changes in pH. Aquat. Biol. 23 (2), 109–118. doi: 10.3354/ab00619
Keywords: acclimation, prokaryotes, eukaryotes, community composition, strain-specific, biodiversity
Citation: Briddon CL, Nicoară M, Hegedüs A, Niculea A, Bellerby R, Eikrem W, Crespo BG, Dupont S and Drugă B (2023) Acclimation to various temperature and pCO2 levels does not impact the competitive ability of two strains of Skeletonema marinoi in natural communities. Front. Mar. Sci. 10:1197570. doi: 10.3389/fmars.2023.1197570
Received: 31 March 2023; Accepted: 29 June 2023;
Published: 17 July 2023.
Edited by:
Jonathan Y.S. Leung, University of Adelaide, AustraliaReviewed by:
Stacy Louise Deppeler, National Institute of Water and Atmospheric Research (NIWA), New ZealandPeng Jin, University of Guangzhou, China
Copyright © 2023 Briddon, Nicoară, Hegedüs, Niculea, Bellerby, Eikrem, Crespo, Dupont and Drugă. This is an open-access article distributed under the terms of the Creative Commons Attribution License (CC BY). The use, distribution or reproduction in other forums is permitted, provided the original author(s) and the copyright owner(s) are credited and that the original publication in this journal is cited, in accordance with accepted academic practice. No use, distribution or reproduction is permitted which does not comply with these terms.
*Correspondence: Bogdan Drugă, Ym9nZGFuLmRydWdhQGljYmNsdWoucm8=