 Ian J. Brown
 Vassilis Kitidis
 Andrew P. Rees
- Plymouth Marine Laboratory, Plymouth, United Kingdom
An automated system was developed using commercially available Cavity Ring-Down Spectroscopy (CRDS) technology (Picarro LTD., G2508) which was interfaced to a custom-made system which automated the equilibration and analysis of seawater dissolved nitrous oxide (N2O) and methane (CH4). The combined system was deployed during two research cruises in the Atlantic Ocean, which combined covered 16,500 kms, one on a west to east transect between the United States and Europe at approximately 24°N, the second was a north to south transect which covered approximately 70° of latitude between the Tropic of Cancer and the Southern Ocean. Semi-continuous measurements using the CRDS (Approx. 73,000) were compared to discretely collected samples (n=156) which were analysed using gas chromatography (GC) with flame ionisation detection for CH4 and electron capture detection for N2O. Excellent agreement between the two approaches, though with an increase in analytical precision offered by CRDS compared to GC gives great confidence in the applicability of the CRDS system, whilst the significant (2 to 3 orders of magnitude) increase in measurement frequency offer an opportunity to greatly increase the number of dissolved N2O and CH4 data that are currently available. Whilst identifying a number of small-scale features, deployment during this study showed that whilst the surface of large areas of the Atlantic Ocean were in-balance with the overlying atmosphere with respect to N2O, the most of this region was offering a source of atmospheric CH4.
1 Introduction
Greenhouse gases (GHG’s) absorb infrared radiation which increases atmospheric temperature and contributes to global warming. Although anthropogenic emissions of carbon dioxide (CO2) contribute most to GHG induced warming, other long lived gases such as methane (CH4) and nitrous oxide (N2O) affect climate for decades to millennia, influencing climate change and stratospheric chemistry (Montzka et al., 2011). Atmospheric concentrations of these long lived GHG’s have been increasing rapidly over the last century, mainly in association with human activities, leading to an overall warming of the earth’s climate system (IPCC, 2021). The oceans play a major role in controlling atmospheric greenhouse gases, though consumption and production processes are not homogenously distributed so that on a regional scale the ocean may act as source or sink. N2O concentration in most of the surface of the ocean is in close equilibrium with the atmosphere (Nevison et al., 1995) and global emissions from the open ocean and coastal waters contribute 35–39% of the total natural sources of N2O (Tian et al., 2020) though there is a fine balance between the ocean acting as net producer or consumer of N2O and an increase in the number and frequency of measurements provides our motivation to better constrain the uncertainty in absolute exchange rates. The world’s oceans are also a natural source of CH4 though this source makes only a minor contribution to the global atmospheric budget. The open ocean and coastal waters account for 7 to 12% of total natural sources and approximately 4% of global emissions (Saunois et al., 2020) with estuarine and coastal waters accounting for approximately 75% of the total marine source (Weber et al., 2019).
Large coordinated efforts are in place to determine the role of the ocean in removing atmospheric CO2 and which include the Surface Ocean CO2 Atlas (SOCAT) and the Integrated Carbon Observing System (ICOS). Despite their importance the same isn’t in place for CH4 and N2O, and vast areas of the ocean remain under investigated with regard to their role in emissions (Bange et al., 2019; Yang et al., 2020). Temporal and spatial studies are sparse due to constraints posed by existing discrete and semi-continuous methods, combined with the difficulties operating in remote parts of the oceans. This has led to the oceanic emission estimates of both gases being poorly quantified which highlights the need for better spatial distributions of long lived GHG measurements. The most common technique for N2O and CH4 determination involve the injection of the gas phase into a gas chromatograph fitted with an electron capture detector and flame ionisation detector for N2O and CH4 respectively following either purge and trap of dissolved gases or equilibration of seawater with a gas of known N2O/CH4 content (Wilson et al., 2018). These methods are labour intensive and thereby limit the temporal resolution of data. There is therefore a need for development and implementation of cost-effective methods for underway measurements which offer the potential to extend the spatial coverage and temporal resolution of ship-based observations (Arévalo-Martínez et al., 2013; Wilson et al., 2020). Over the last decade or so, a number of technologies (including cavity ring-down spectroscopy and off-axis integrated cavity-output spectroscopy), have evolved to determine these gases at high frequency and high precision. Use of these systems is dominated by atmospheric measurements e.g. (Crosson, 2008; Yang et al., 2019; Ganesan et al., 2020) though several approaches have been taken to extract and introduce gases dissolved in fresh and seawater to the gas analyser, though in the main for N2O or CH4 individually or in concert with CO2 (Arévalo-Martínez et al., 2013; Nicholson et al., 2018; Zhan et al., 2021). To date there are limited reports of simultaneous measurements of both N2O and CH4 (Troncoso et al., 2018).
Here we present a system which interfaces Picarro G2508 analyser (Picarro Inc., USA) to a custom-made equilibration unit which allows N2O and CH4 gases to be measured continuously from ship-based underway water with concurrent atmospheric measurements. This new method was compared with discrete samples measured using established gas chromatography methods.
2 Materials and methods
2.1 Equilibrator principle
As in discrete analysis using GC and headspace equilibrium approaches, the principle of continuous analysis involves equilibrating air (gas phase) with seawater (aqueous phase) and determining the concentration of the target species in the gas phase. This method eliminates the potential of phase partitioning and potential detector sensitivity considerations (Upstill-Goddard et al., 1996). However continuous analysis requires re-circulation of the air phase through the detector and its return to the water phase in a closed circulation loop in order to maintain equilibrator pressure and full equilibration. A shower head type equilibrator was used to obtain an equilibrated gas phase similar to the one described by (Kitidis et al., 2012). Due to the different solubilities and diffusivities of CH4 and N2O (Wiesenberg and Guinasso, 1979; Weiss and Price, 1980) and to ensure complete equilibration of each gas, separate equilibrators were used, set to different water flow rates. CH4 solubility is lower and is therefore likely to require a longer residence time for full equilibration, this was achieved by utilising a lower flow rate. A water flow of 1.6 L min-1 and 1.2 L min-1 was maintained for the N2O and CH4 equilibrators respectively. Initially two equilibrators were utilised however it was determined that N2O was fully equilibrated from the lower flow of the CH4 equilibrator. Figure 1 shows a schematic setup of the equilibrator and were the same as previously used with the PML-Dartcom LivepCO2 system which compared favourably with other equilibrators (Ribas-Ribas et al., 2014).
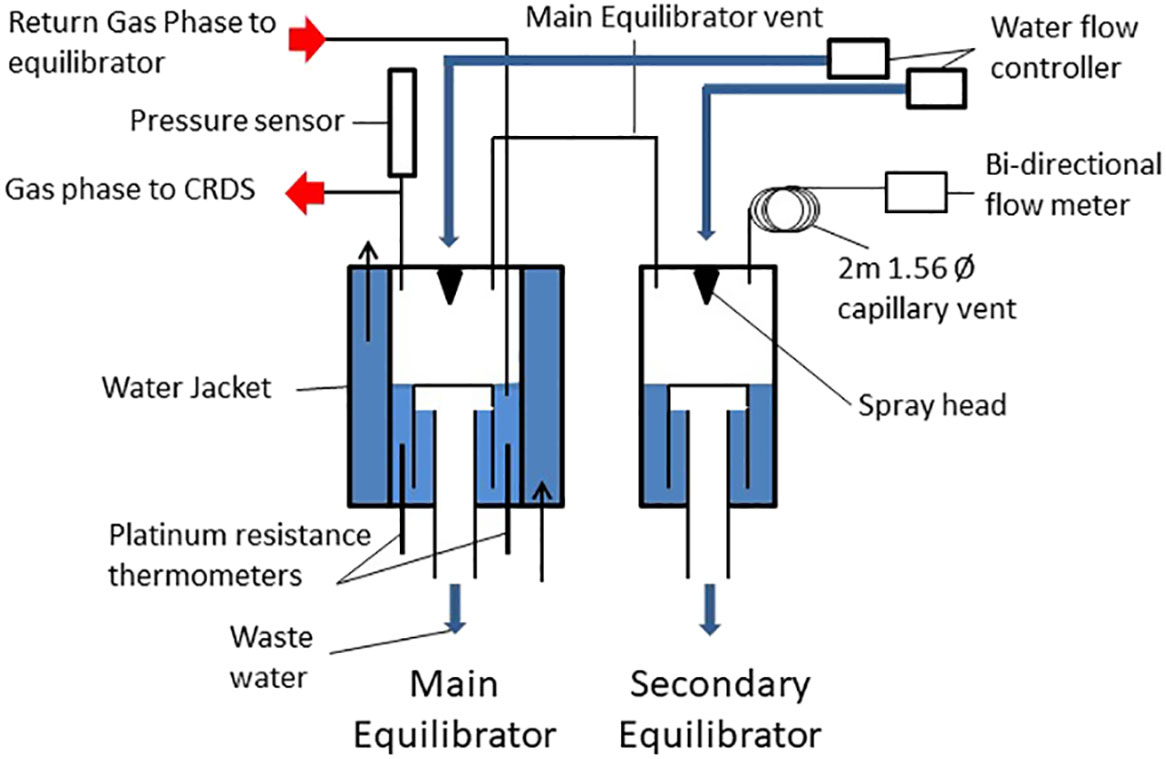
Figure 1 Design of seawater-air equilibrator during this study.
2.2 Equilibration conditions
The equilibrators were supplied with a continuous supply of seawater from an intake at the ship’s hull, approximately 5 m below the surface. The equilibrators consist of an outer acrylic tube (diameter 135 mm) with an inner acrylic chamber (Diameter 98mm). The outer chamber was filled with a continuous flow of surface water to act as a thermal insulator in order to maintain the inner and a stable equilibration chamber temperature. The water in the inner chamber passed through a Sprinkler head (BETE® N series nozzle) to increase the surface area available for gas exchange and thus decreasing equilibration times. A trap vent with a vent to the atmosphere creates a lower water phase which is isolated from the headspace and maintains a constant water volume which is continuously renewed from the ships underway water supply system. Each equilibrator is connected via a 6.25 mm Teflon tube to a smaller secondary equilibrator through which underway seawater also flows through a Sprinkler head (BETE® W series nozzle). The secondary equilibrator allows for compensation of potential air volume changes caused by humidity removal, solubility changes due to warming or cooling of the water or disequilibrium of one of the main dissolved gases e.g. oxygen (Schneider et al., 2007) or pressure changes due to water flow variations. The secondary equilibrator is in turn vented via a 2m 1.56 mm stainless steel tube to minimise atmospheric exchange and to maintain atmospheric pressure. Any small pressure fluctuations inside the main equilibrator are thereby eliminated, buffered by the secondary equilibrator and 2 m vent. At the end of this vent line is a bi-directional flow meter (Honeywell AWM3303V bi-directional mass flow sensor) to measure any exchange of air through the vent to the atmosphere. The water flow is regulated with a proportional solenoid (Burket series 6240) with an electronic control (Burket Type 8611 eControl) which maintains the desired water flow under variable flow conditions from the underway seawater supply. A pressure sensor (Druck X7517-05A-3257) is located on the gas re-circulation loop close to the equilibrator to monitor the equilibrator pressure.
During the water phase sampling operation, the headspace gas to me measured is continuously drawn from the equilibrator and passed through a Peltier dryer, cooled to -20°C, which is fitted with a water watcher switch (Honeywell Phototransistor Level Switch, LLE102000) to automatically protect the electronics and detector from flooding in case of water ingress. The dried air is then directed through the detector and then passes through a valve tray where a series of solenoids (Peter Paul 52N8DGB) select the appropriate equilibrator to send the return air flow to the inner chamber below the surface of the residual water.
A 6.25 mm Decabon® line was set up from the meteorological platform at the bow of the ship to allow atmospheric air to be pumped directly into the lab for atmospheric measurements.
2.3 Sampling, calibration and data logging
Seawater was continuously supplied from the ships underway system from approximately 5m depth. The intake temperature was recorded and compared to that at the equilibration point to account for changes in temperature as the water passes through the ship. A gas phase sampling schedule was set up allowing each equilibrator and marine air to be sampled sequentially. Each equilibrator was sampled for 60 minutes before switching to the next equilibrator, also for 60 minutes. This cycle was completed 4 time before switching to marine air. This allows time for adequate flushing of the analyser and ensures a stable base line. Flushing times for N2O and CH4 at 1.6 and 1.2 L min-1 were determined as 15 and 30 minutes for CH4 for equilibrators 1 and 2 respectively. The analysis protocol involved determination of three mixed reference gas standards (Air Products Ltd.) with mixing ratios 317.4, 406.4, 496.7 ppbv N2O and 1.009, 2.058, 3.04 ppmv CH4 in synthetic air which had been calibrated against National Oceanic and Atmospheric Administration (NOAA) primary gas standards. These were run for approximately 45 minutes each at the start and end of the day. The system was synchronised to the ship’s navigation and underway logging system to acquire positional and ancillary data (date, time, seawater temperature, salinity) every 10 seconds. The data were logged with 6 readings averaged to give one measurement per minute. The software R was used to integrate and process the data, (see data processing equations in Supplementary Material). The first 30 minutes of each equilibrator cycle were removed to ensure full equilibration of water and gas phases.
2.4 Automation
The sampling schedule and processes were controlled electronically by custom-built software based on the PML Dartcom LivepCO2 system (Kitidis et al., 2017). Solenoids (Peter Paul 52N8DGB) controlled the gas flow through an automated manifold in order to select the particular gas source to be measured (equilibrator 1 or 2, atmospheric air or standards) and a recirculation loop allowed for the return to the equilibrators. Gases within the tray associated with the equilibrator were monitored with appropriate sensors for pressure (Druck X7517-05A-3257), temperature and humidity (Farnell HIH-4602-C), and flow rate (Honeywell AWM3303V) at both the input and output of the valve tray. Humidity and pressure were monitored in the gas stream before and after passing through the CRDS. The programme allows for the independent setting of the equilibrators and standards to enable adequate flushing time and frequency of analysis. The schematic setup of the analytical system is shown in Figure 2. The Picarro CRDS is sensitive to strong pressure differences that may arise following the total closure of all gas lines resulting in zero flow though the analyser, which have the potential to damage the in-built laser. A default position was therefore programmed in case moisture develops in the equilibrator lines in which all valves automatically align to enable atmospheric air flow through the CRDS unit. A water watcher switch (Honeywell Phototransistor Level Switch, LLE102000) triggers the default position in the event that water is detected in a gas drying unit (Figure 2).
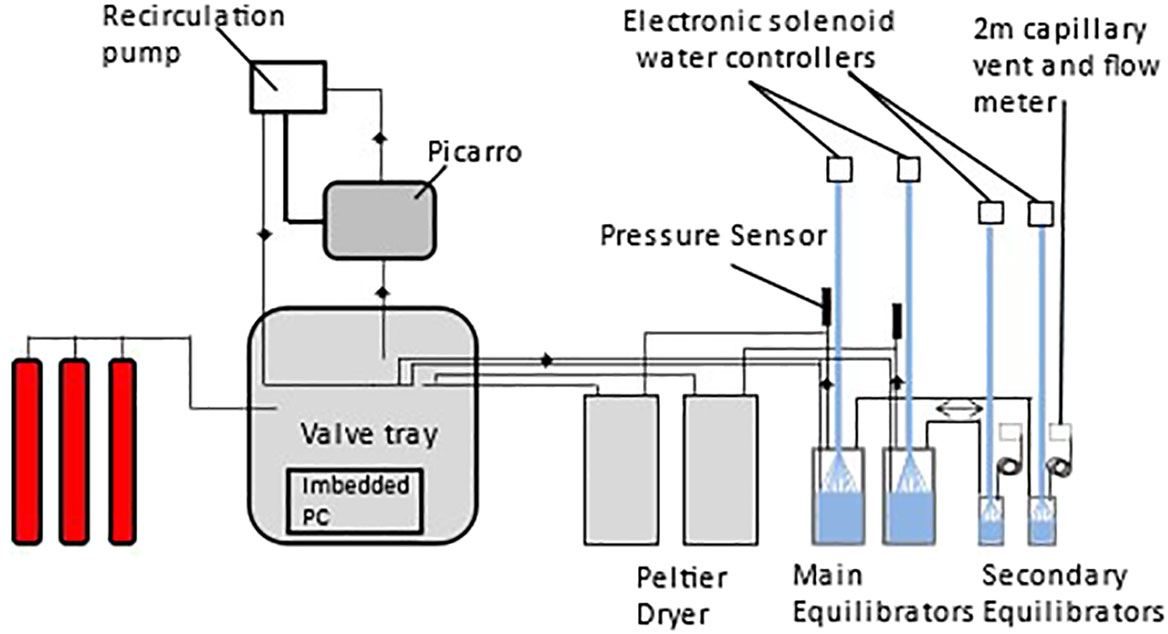
Figure 2 Schematic of integrated equilibrator and analysis system.
2.5 CRDS principle
The CRDS allows for the simultaneous measurement of molar fractions of N2O and CH4 with precision at sub-parts per billion (ppb) levels. The device is based upon the technology described in full by (Maity et al., 2020) and briefly summarised here. Gas concentrations are measured from a single frequency laser diode in a 25cm long cavity defined by 3 mirrors which increase the effective path length to over 20km. The laser is abruptly turned off once the photodetector signal reaches a threshold level, typically this is achieved in a few tens of microseconds. The light continues to pass between the mirrors which have a 99.99% reflectivity; the intensity steadily decays to zero the “ring down”. The time difference in this decay, to that of an empty cavity, is directly proportional to the near infra-red absorption of the gas-phase molecules at known wavelengths for the target gases.
During sampling air is pumped continuously by a recirculation pump A0702 (Picarro Research Inc., USA) which simultaneously achieves the sub-atmospheric pressure required for the cavity and provides a re-circulatory air supply to the equilibrator loop (Figure 2). The CRDS cell temperature and pressure are very precisely and continually recorded by the instrument and used as part of the gas molar fraction calculations. The gas flow is dried in a purpose-built Peltier dryer unit prior to analysis which reduces the moisture content to <15%. The CRDS measures the H2O molar fraction along with N2O and CH4, this allows the calculation of the dry mole fractions and allows for potential bias in partial pressure due to the water vapour content and negates the need to completely dry the sample air. To calculate the dry mole fractions of N2O and CH4 the Picaro software applies the following calculation:
Where x(gas) dry and x(gas) wet are the mole fractions of the corresponding gas after and before correction respectively and xH2O is the measured molar fraction of water vapour correction.
2.6 Gas chromatography reference method
Discrete seawater samples were collected at 5m using clean Tygon® tubing into 500 ml borosilicate bottles either from the ship’s continuous seawater supply or from Niskin bottles on a CTD rosette. Bottles were overfilled with three times the bottle volume to eliminate air bubbles and poisoned with 200 µl of a saturated mercuric chloride solution. They were then transferred to a water bath at 25 ± 0.1°C and temperature equilibrated for a minimum of one hour before analysis. Samples were analysed for CH4 and N2O by single-phase equilibration gas chromatography using a flame ionisation detector and Electron Capture detector and similar to that described by (Upstill-Goddard et al., 1996). Samples were typically analysed within 8 hours of collection and calibrated with the same 3 certified standards (Air Products Ltd.; mixing ratios 317.4, 406.4, 496.7 PPBv N2O and 1.009, 2.058, 3.04 PPMv CH4 in synthetic air; calibrated against NOAA primaries). The PPMv and PPBv mixing ratios correspond to the gas phase concentration. All other concentrations are converted to nmol L-1 to allow accurate comparison to discrete GC samples.
Air measurements were made at each oceanographic station and were collected into Tedlar® gas sample bags from a position at the ships bow. These were analysed and calibrated against the same reference gases and used for calculating atmospheric mixing ratios. Aqueous CH4 and N2O concentrations were calculated from the solubility tables of (Wiesenberg and Guinasso, 1979; Weiss and Price, 1980) respectively.
The CRDS and gas chromatography (GC) systems were both deployed during two oceanographic campaigns in the Atlantic during RRS Discovery cruise DY040 as part of the RAGNARoCC (Radiatively Active Gases from the North Atlantic Region and Climate Change) between Florida and the Canary Islands (6th December 2016 – 22nd January 2015) and during RRS Discovery cruise DY084 AMT27 as part of the Atlantic Meridional Transect programme (23 September – 5th November 2017) between the UK and Falkland Islands (Figure 3). 156 discrete surface measurements were made using GC on DY040 and 100 on DY084.
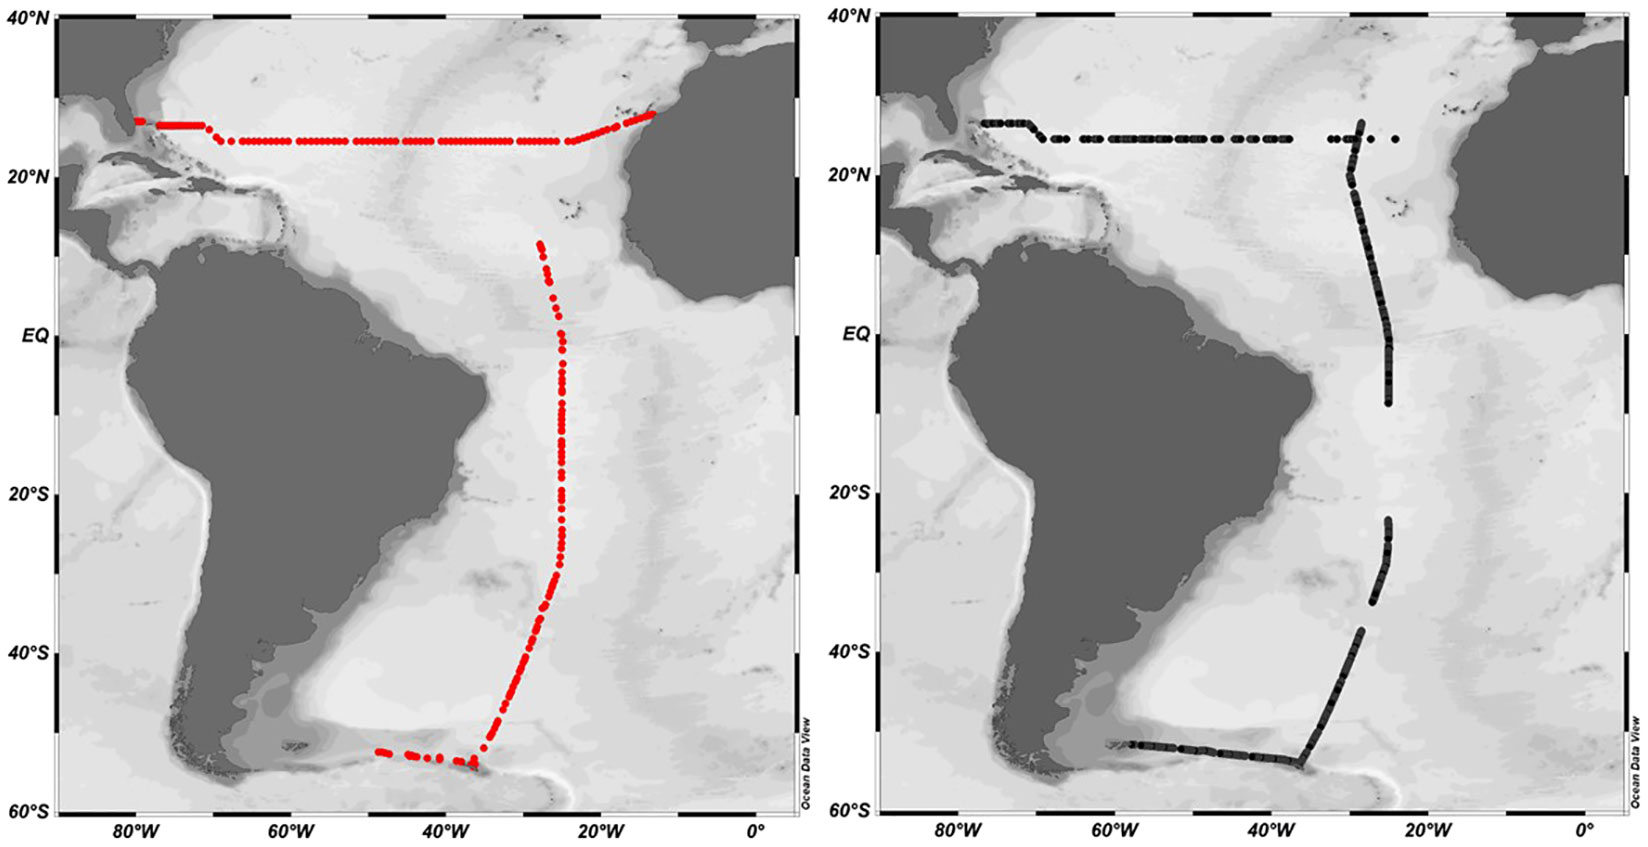
Figure 3 DY040 and DY084 cruise tracks. DY040 transacted West to East along 24.5°N, DY084 followed the AMT track from North to South. Black dots indicate CRDS measurements. Red dots indicate CTD stations and underway measurements analysed by gas chromatography.
3 Results and discussion
The performance of the CRDS N2O/CH4 analyser system in the field was evaluated by comparison with the established GC method (Upstill-Goddard et al., 1996; Rees et al., 2011; Brown et al., 2014) using discrete CTD and underway sea surface discrete samples for N2O and CH4 analysis (Figure 4). The cruise track of DY084 (Figure 3) traverses more than 100 degrees of latitude along the length of the Atlantic with analyses for the purpose of this study used between 11.5° North and 55.5° South and through several different biogeographic provinces from the temperate north Atlantic, the tropics, south Atlantic and on to the productive waters of the Antarctic circumpolar current and the waters around South Georgia. This provided a variety of water masses and a greater range of gas concentrations suitable for a comparison. DY040 traveling from west to east across the north Atlantic Gyre offers a large geographical area of relatively low concentrations and variability suitable for comparing the re-producibility of the CRDS.
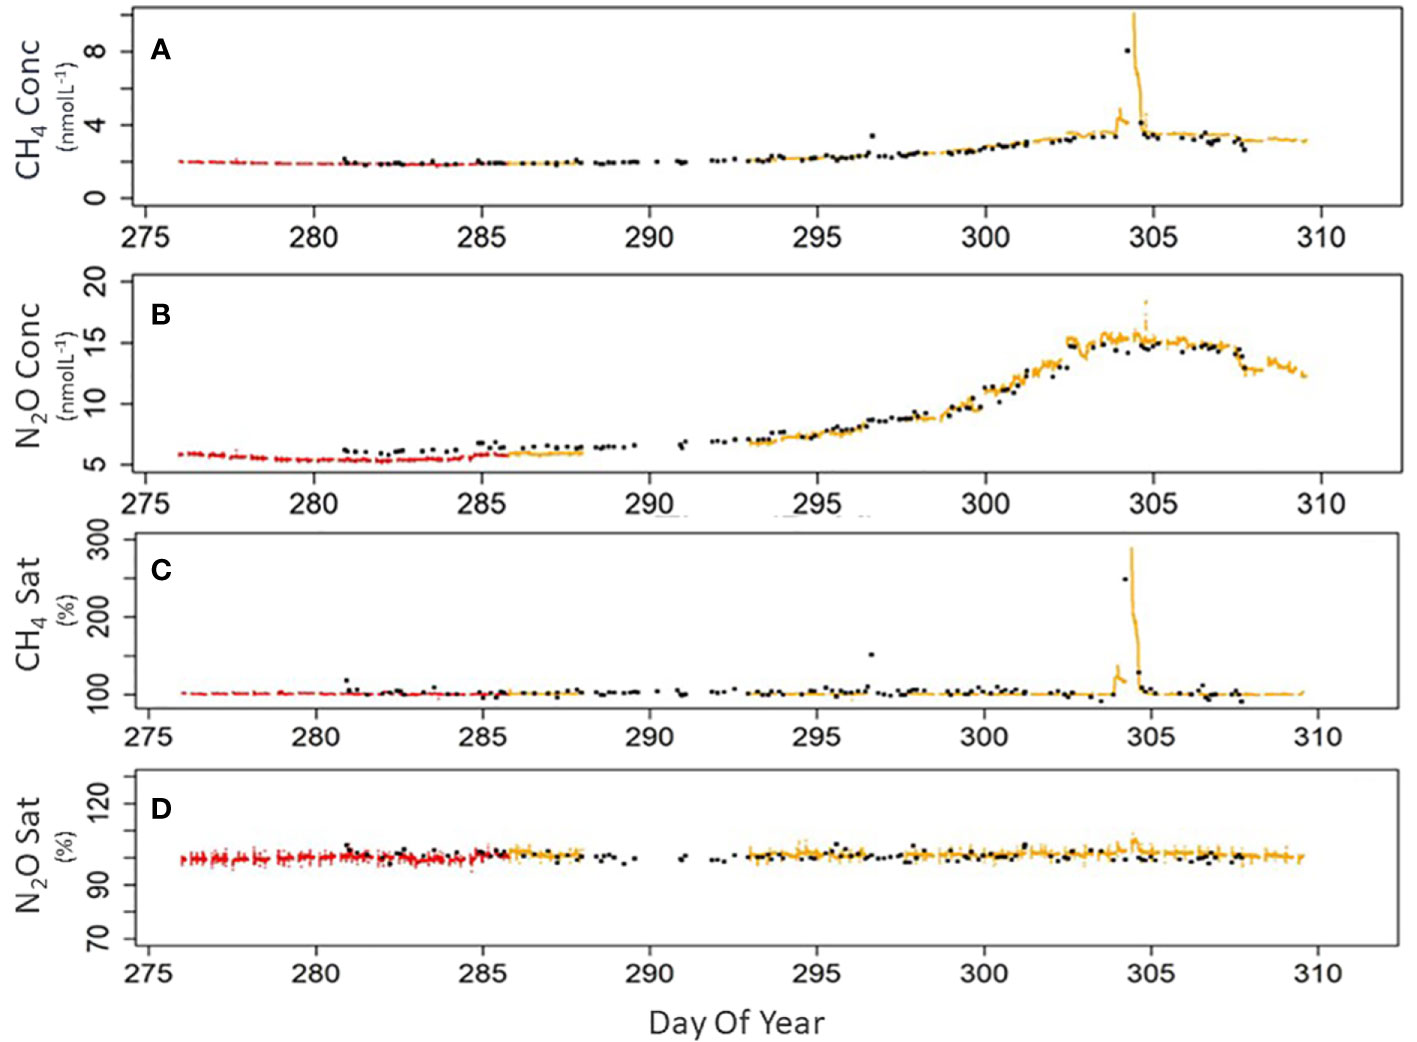
Figure 4 Comparison of GC and CRDS data collected during cruise DY084 (AMT27) in 2017. Panels (A) methane concentration (nmol L-1), (B) nitrous oxide concentration (nmol L-1), (C) methane saturation (%), (D) nitrous oxide saturation (%). All panels, CRDS using equilibrator 1 (red dots), CRDS using equilibrator 2 (yellow dots), GC from underway and CTD measurements (black dots).
Dissolved concentrations determined on discrete samples collected during DY040 showed a very limited range for both gases: 5.97 – 7.51 nmolL-1 (Mean ± 1 sd = 6.56 ± 0.37 nmol L-1) for N2O and 2.03 to 3.76 nmolL-1 for (2.20 ± 0.27 nmol L-1) for CH4 (n=156). N2O and CH4 saturations were 102.62% and 117.56% respectively which on balance reflects equilibrium with the atmosphere for N2O and the ocean offering a source of CH4. The highest CH4 concentration of 3.76 nmol L-1 was equivalent to a saturation value of 169% and was determined at the eastern side of the transect in proximity to the African coast. Dissolved concentrations determined on discrete samples during DY084 ranged from 5.31 to 15.28 and 1.74 to 8.21 nmol L-1 for N2O and CH4 respectively (n=100) (Figure 4) with the maximum values being recorded in Cumberland Bay, South Georgia during DY084 on day 304 and which were likely influenced by nearby elephant seal and king penguin colonies. Mean saturations indicate that for much of this area N2O was generally in equilibrium with the atmosphere (100.9% ± 1.2%) whilst there was a potential source of CH4 from the ocean to the atmosphere (110.5% ± 26.9%). The higher uncertainty in the CH4 saturations can be attributed to the larger range of saturations particularly when in close proximity to South Georgia.
A correlation and regression analysis of discrete and underway N2O and CH4 measurements collected within 30 minutes of a CRDS measurement during both cruises show a significant linear agreement between the two analytical approaches for both gases (Figure 5). Correlation coefficients for the two approaches using 153 pairs of observations determined over the two research expeditions were r2 = 0.9871, p<0.001 and r2 = 0.9839, p<0.001 for N2O and CH4 respectively. The derived regressions showed that N2O-CRDS = ((N2O-GC * 1.03549 ± 0.01) - 0.522472 ± 0.09) and CH4-CRDS = ((CH4-GC * 1.09041 ± 0.29) - 0.255484 ± 0.09). A T test on the same data shows values of -0.153 and 1.616 P ≤ 0.05 (DF153) for N2O and CH4 respectively, again showing no significant difference between the GC and CRDS data. The limit of detection of the CRD is far below our 300ppb/1ppm N2O/CH4 standard which were always lower than our measured samples. The response of the instrument is linear between the range of standards used.
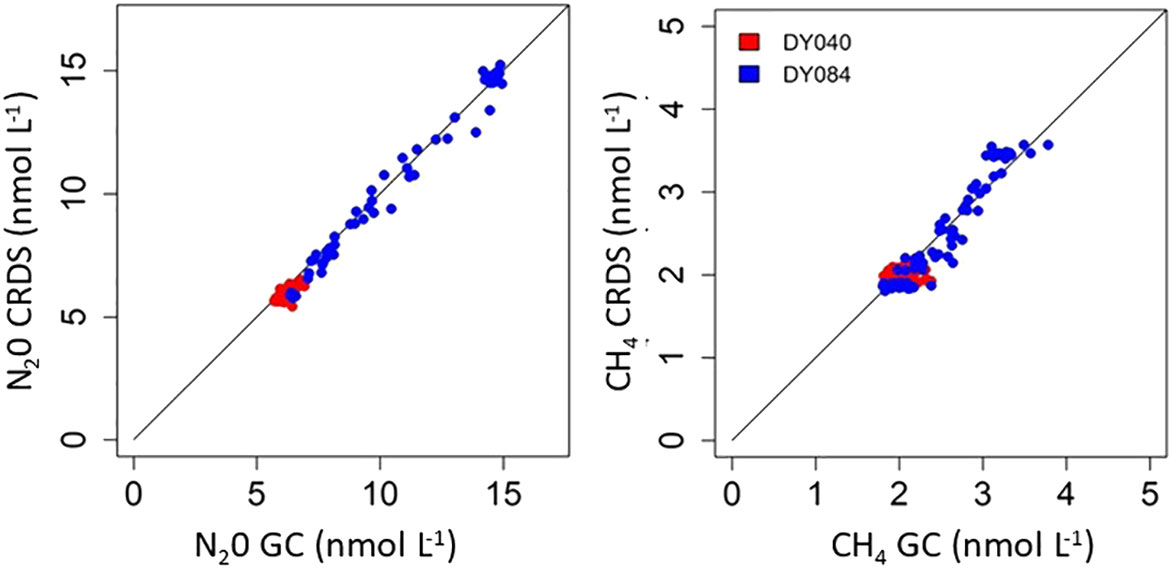
Figure 5 Discrete and underway N2O and CH4 samples collected on DY040 and DY084 within 30 minutes of a CRDS measurement.
During the majority of both expeditions the saturations of N2O and CH4 were generally close to atmospheric equilibrium with concentrations largely determined by seawater temperature. (Figure 4). This suggests strong physical processes that determine and regulate surface concentrations throughout much of the surface Atlantic Ocean. The CH4 data shows some small variability between the GC and CRDS which is greater in the South Atlantic region where the concentrations are higher and have larger variability. There were no systematic trends in this change suggesting that these can be attributed to heterogeneity in collected samples. The significant statistical agreement between both approaches for both gases, the stringent calibration of both approaches and our engagement in a previous community intercalibration exercise for GC analysis (Wilson et al., 2018) indicates that the methods are statistically proven to be in good agreement, giving great confidence in the use of either approach. It is evident though that the CRDS system provides not only great advantage in terms of frequency of measurement but also in analytical precision, (DY040 CH4 Ave concentration 1.99 nmol L-1 RSD 0.03% and N2O 5.87 nmol L-1 RSD 0.04% n=45202). The discrete samples analysed by GC involved additional handling and measuring procedures which contribute to larger uncertainties in the analysis and increased variability compared to that of the high frequency autonomous measurement using CRDS. During the period 20 to 23 October (days 293 to 296 Figure 4) 2017 (DY084) 27294 measurements were made using the CRDS system which gave averages values of 2.17 ± 0.07 nmol L-1 (3% variability) and 7.37 ± 0.38 nmol L-1 (5% variability) for CH4 and N2O respectively. In the same period 22 GC measurements gave concentrations of 2.54 ± 0.21 nmol L-1 (8% variability) and 7.63 ± 0.47 (6% variability) nmol L-1 for CH4 and N2O respectively.
4 Conclusion
The CRDS underway system was used to provide an accurate and precise data set of nearly 200,000 N2O and CH4 measurements and has the potential to offer greater spatial and temporal coverage of surface waters than previously achievable when deployed using the approach presented here. Due to near continuous measurement offered by the CRDS approach, features and gradients in dissolved gas distribution were highlighted which discrete sampling and GC analysis failed to resolve. CRDS measurements proved to be stable in tropical, temperate, and polar waters and have compared favourably to traditional techniques whilst offering better spatial and temporal resolution with a fraction of the manual effort required by GC methodology. The CRDS system as described here is applicable to coastal and open ocean studies offering the potential to improve our understanding of these climatically important gases. The current set-up has the potential to be used continuously not only onboard research vessels but also on voluntary observing ships, this is currently limited to some extent by the cost of instrumentation but further by the current requirement for manual intervention should there be an ingress/build-up of water downstream of the equilibrators.
Data availability statement
The raw data supporting the conclusions of this article will be made available by the authors, without undue reservation.
Author contributions
IB: Led the design of instrumentation and construction of instrumentation and project design. VK: Led R script development. AR: Led Research direction. Manuscript preparation led by IB with full input from VK and AR. All authors contributed to the article and approved the submitted version.
Funding
This work benefitted from funding and contributed to the outputs of UK NERC funded projects RAGNARRoCC - Radiatively active gases from the North Atlantic Region and Climate Change (NERC: NE/K002511/1) and the Atlantic Meridional Transect (AMT) through National Capability Long-term Single Centre Science Programme, Climate Linked Atlantic Sector Science (NE/R015953/1).
Acknowledgments
We would like to extend our thanks to the officers and crew on RRS Discovery during both research cruises. This study contributes to the international IMBeR project and is contribution number 392 of the AMT programme. We would also like to offer our thanks to Dartcom Ltd our partners in the development of system software and electronic manifold control.
Conflict of interest
The authors declare that the research was conducted in the absence of any commercial or financial relationships that could be construed as a potential conflict of interest.
Publisher’s note
All claims expressed in this article are solely those of the authors and do not necessarily represent those of their affiliated organizations, or those of the publisher, the editors and the reviewers. Any product that may be evaluated in this article, or claim that may be made by its manufacturer, is not guaranteed or endorsed by the publisher.
Supplementary material
The Supplementary Material for this article can be found online at: https://www.frontiersin.org/articles/10.3389/fmars.2023.1197727/full#supplementary-material
References
Arévalo-Martínez D. L., Beyer M., Krumbholz M., Piller I., Kock A., Steinhoff T., et al. (2013). A new method for continuous measurements of oceanic and atmospheric N2O, CO and CO2: performance of off-axis integrated cavity output spectroscopy (OA-ICOS) coupled to non-dispersive infrared detection (NDIR). Ocean Sci. 9, 1071–1087. doi: 10.5194/os-9-1071-2013
Bange H. W., Arevalo-Martinez D. L., de la Paz M., Farias L., Kaiser J., Kock A., et al. (2019). A harmonized nitrous oxide (N2O) ocean observation network for the 21st century. Front. Mar. Sci. 6. doi: 10.3389/fmars.2019.00157
Brown I. J., Torres R., Rees A. P. (2014). The origin of sub-surface source waters define the sea-air flux of methane in the Mauritanian Upwelling, NW Africa. Dynamics Atmospheres Oceans 67, 39–46. doi: 10.1016/j.dynatmoce.2014.06.001
Crosson E. R. (2008). A cavity ring-down analyzer for measuring atmospheric levels of methane, carbon dioxide, and water vapor. Appl. Phys. B 92, 403–408. doi: 10.1007/s00340-008-3135-y
Ganesan A. L., Manizza M., Morgan E. J., Harth C. M., Kozlova E., Lueker T., et al. (2020). Marine nitrous oxide emissions from three eastern boundary upwelling systems inferred from atmospheric observations. Geophys. Res. Lett. 47, e2020GL087822. doi: 10.1029/2020GL087822
IPCC (2021). Climate change 2021: the physical science basis. Contribution of working group I to the sixth assessment report of the intergovernmental panel on climate change (Cambridge, United Kingdom and New York, NY, USA: Cambridge University Press), In press.
Kitidis V., Brown I., Hardman-Mountford N., Lefèvre N. (2017). Surface ocean carbon dioxide during the Atlantic Meridional Transect, (1995–2013); evidence of ocean acidification. Prog. Oceanography 158, 65–75. doi: 10.1016/j.pocean.2016.08.005
Kitidis V., Hardman-Mountford N. J., Litt E., Brown I., Cummings D., Hartman S., et al. (2012). Seasonal dynamics of the carbonate system in the Western English Channel. Continental Shelf Res. 42, 30–40. doi: 10.1016/j.csr.2012.04.012
Maity A., Maithani S., Pradhan M. (2020). “Chapter 3 - Cavity ring-down spectroscopy: recent technological advances and applications,” in Molecular and laser spectroscopy. Eds. Gupta V. P., Ozaki Y. (Elsevier), 83–120.
Montzka S. A., Dlugokencky E. J., Butler J. H. (2011). Non-CO2 greenhouse gases and climate change. Nature 476, 43–50. doi: 10.1038/nature10322
Nevison C. D., Weiss R. F., Erickson D. J. (1995). Global oceanic emissions of nitrous-oxide. J. Geophysical Research-Oceans 100, 15809–15820. doi: 10.1029/95JC00684
Nicholson D. P., Michel A. P. M., Wankel S. D., Manganini K., Sugrue R. A., Sandwith Z. O., et al. (2018). Rapid mapping of dissolved methane and carbon dioxide in coastal ecosystems using the chemYak autonomous surface vehicle. Environ. Sci. Technol. 52, 13314–13324. doi: 10.1021/acs.est.8b04190
Rees A. P., Brown I. J., Clark D. R., Torres R. (2011). The Lagrangian progression of nitrous oxide within filaments formed in the Mauritanian upwelling. Geophys. Res. Lett. 38, L21606. doi: 10.1029/2011GL049322
Ribas-Ribas M., Rérolle V. M. C., Bakker D. C. E., Kitidis V., Lee G. A., Brown I., et al. (2014). Intercomparison of carbonate chemistry measurements on a cruise in northwestern European shelf seas. Biogeosciences 11, 4339–4355. doi: 10.5194/bg-11-4339-2014
Saunois M., Stavert A. R., Poulter B., Bousquet P., Canadell J. G., Jackson R. B., et al. (2020). The global methane budget 2000-2017. Earth System Sci. Data 12, 1561–1623. doi: 10.5194/essd-12-1561-2020
Schneider B., Sadkowiak B., Wachholz F. (2007). A new method for continuous measurements of O2 in surface water in combination with pCO2 measurements: Implications for gas phase equilibration. Mar. Chem. 103, 163–171. doi: 10.1016/j.marchem.2006.07.002
Tian H. Q., Xu R. T., Canadell J. G., Thompson R. L., Winiwarter W., Suntharalingam P., et al. (2020). A comprehensive quantification of global nitrous oxide sources and sinks. Nature 586, 248–24+. doi: 10.1038/s41586-020-2780-0
Troncoso M., Garcia G., Verdugo J., Farías L. (2018). Toward high-resolution vertical measurements of dissolved greenhouse gases (Nitrous oxide and methane) and nutrients in the Eastern South Pacific. Front. Mar. Sci. 5. doi: 10.3389/fmars.2018.00148
Upstill-Goddard R. C., Rees A. P., Owens N. J. P. (1996). Simultaneous high-precision measurements of methane and nitrous oxide in water and seawater by single phase equilibration gas chromatography. Deep-Sea Res. Part I-Oceanographic Res. Papers 43, 1669–1682. doi: 10.1016/s0967-0637(96)00074-x
Weber T., Wiseman N. A., Kock A. (2019). Global ocean methane emissions dominated by shallow coastal waters. Nat. Commun. 10, 4584. doi: 10.1038/s41467-019-12541-7
Weiss R. F., Price B. A. (1980). Nitrous-oxide solubility in water and seawater. Mar. Chem. 8, 347–359. doi: 10.1016/0304-4203(80)90024-9
Wiesenberg D. A., Guinasso N. L. (1979). Equilibrium solubilities of methane, carbon monoxide, and hydrogen in water and sea water. J. Chem. Eng. Data 24, 356–360. doi: 10.1021/je60083a006
Wilson S. T., Al-Haj A. N., Bourbonnais A., Frey C., Fulweiler R. W., Kessler J. D., et al. (2020). Ideas and perspectives: A strategic assessment of methane and nitrous oxide measurements in the marine environment. Biogeosciences 17, 5809–5828. doi: 10.5194/bg-17-5809-2020
Wilson S. T., Bange H. W., Arevalo-Martinez D. L., Barnes J., Borges A. V., Brown I., et al. (2018). An intercomparison of oceanic methane and nitrous oxide measurements. Biogeosciences 15, 5891–5907. doi: 10.5194/bg-15-5891-2018
Yang M., Bell T. G., Brown I. J., Fishwick J. R., Kitidis V., Nightingale P. D., et al. (2019). Insights from year-long measurements of air–water CH4 and CO2 exchange in a coastal environment. Biogeosciences 16, 961–978. doi: 10.5194/bg-16-961-2019
Yang S., Chang B. X., Warner M. J., Weber T. S., Bourbonnais A. M., Santoro A. E., et al. (2020). Global reconstruction reduces the uncertainty of oceanic nitrous oxide emissions and reveals a vigorous seasonal cycle. Proc. Natl. Acad. Sci. 117, 11954–11960. doi: 10.1073/pnas.1921914117
Keywords: nitrous oxide, methane, cavity ring-down spectroscopy, gas chromatography, Atlantic Meridional Transect (AMT), Atlantic Ocean
Citation: Brown IJ, Kitidis V and Rees AP (2023) Simultaneous high-precision, high-frequency measurements of methane and nitrous oxide in surface seawater by cavity ring-down spectroscopy. Front. Mar. Sci. 10:1197727. doi: 10.3389/fmars.2023.1197727
Received: 31 March 2023; Accepted: 09 August 2023;
Published: 23 August 2023.
Edited by:
Toste Tanhua, Helmholtz Association of German Research Centres (HZ), GermanyReviewed by:
Mike D. DeGrandpre, University of Montana, United StatesVivien Guyader, Institut français de recherche pour l’exploitation de la mer (IFREMER), France
Copyright © 2023 Brown, Kitidis and Rees. This is an open-access article distributed under the terms of the Creative Commons Attribution License (CC BY). The use, distribution or reproduction in other forums is permitted, provided the original author(s) and the copyright owner(s) are credited and that the original publication in this journal is cited, in accordance with accepted academic practice. No use, distribution or reproduction is permitted which does not comply with these terms.
*Correspondence: Ian J. Brown, aWJAcG1sLmFjLnVr