 Mi Hae Jeon
 Jinyoung Jung
 Mi Ok Park2*
 Kyoung-Ho Cho
 Youngju Lee
 Eun Jin Yang
 Sung-Ho Kang
- 1Division of Ocean Sciences, Korea Polar Research Institute, Incheon, Republic of Korea
- 2Department of Oceanography, Pukyong National University, Busan, Republic of Korea
Increase in river discharge and seasonal primary production and decline in sea ice coverage in the Arctic Ocean in summer can significantly affect the distribution and composition of dissolved organic matter (DOM). This study aimed to enhance the current available knowledge about the impacts of environmental changes on the characteristics of DOM in the rapidly changing Arctic Ocean. Seawater samples were collected from the western Arctic Ocean during the summer of 2019 and analyzed for fluorescent DOM (FDOM), dissolved organic carbon (DOC), and stable oxygen isotope (δ18O) content in conjunction with biophysical properties. We identified two humic-like (C1 and C2) and one protein-like (C3) components using fluorescence excitation-emission matrix coupled with parallel factor (EEM–PARAFAC) analysis. Remarkably high intensities of humic-like FDOM were found in the upper halocline layer (32 < salinity < 33.5 psu, at depths between 50–200 m) with high inorganic nutrient concentrations and low N* values, indicating that the humic-like FDOM was supplied from the shelf sediment. Furthermore, shoaling of the upper halocline layer brought high levels of humic-like FDOM to the euphotic zone, resulting in an increased probability of photodegradation of humic-like FDOM due to exposure to solar radiation in the surface layer. Tryptophan-like FDOM was positively correlated with river water fraction (friver) and riverine DOC but not with chlorophyll-a (Chl-a) and heterotrophic bacterial abundance, indicating river discharge as a potential additional source of tryptophan-like FDOM. The correlation coefficients between tryptophan-like FDOM and river water parameters (friver and riverine DOC) differed across the Chukchi Sea, Chukchi Borderland, and East Siberian Sea, implying that the influence of river discharge on tryptophan-like FDOM is region-dependent. An increase in river discharge in future might lead to a greater supply of tryptophan-like FDOM, impacting the dynamics of DOM cycling in the western Arctic Ocean.
1 Introduction
The Arctic Ocean is undergoing rapid climate-induced environmental changes, such as warming (Ballinger et al., 2021; Meier et al., 2021; Rantanen et al., 2022), increase in river discharge (Peterson et al., 2002; Holmes et al., 2021), and sea ice reduction (Cavalieri and Parkinson, 2012; Meier et al., 2021). Response of the Arctic ecosystem to the ongoing environmental changes could have a profound effect on the distribution and composition of dissolved organic matter (DOM). For example, an increase in river discharge due to the permafrost thaw can result in the input of allochthonous DOM into the Arctic Ocean (Opsahl et al., 1999; Amon, 2004; Raymond and Spencer, 2015). In general, allochthonous DOM represented as riverine dissolved organic carbon (DOC), is considered refractory due to its conservative behavior with respect to salinity (S) and low biodegradability (Dittmar and Kattner, 2003; Mann et al., 2012). However, an increasing number of recent studies have provided evidence that the biodegradability of allochthonous DOM can vary depending on factors, including seasonality, chemical composition, source, and regional hydrology (Cauwet and Sidorov, 1996; Dittmar and Kattner, 2003; Koühler et al., 2003; Amon, 2004; Amon and Meon, 2004; Holmes et al., 2008; Mann et al., 2012; Kaiser et al., 2017b; Kazmiruk et al., 2021). In addition, recent studies reported that a substantial proportion of DOC (34–67%) present in cryospheric conditions (e.g., permafrost and snow) could be highly biodegradable (Vonk et al., 2013; Abbott et al., 2014; Gao et al., 2019; Zhang et al., 2020), suggesting that the input of allochthonous DOM to the Arctic Ocean through river discharge, influenced by a warming climate and permafrost thaw, can significantly impact the Arctic carbon cycle (Frey and McClelland, 2009; Kaiser et al., 2017a; Kaiser et al., 2017b; Müller et al., 2018). In addition to the allochthonous DOM input via river discharge, the decline in sea ice cover can potentially influence the primary production (Ardyna and Arrigo, 2020; Lewis et al., 2020), thereby contributing to an increase in autochthonous DOM.
Phytoplankton-derived DOM referred to as autochthonous DOM, consists of carbohydrates, amino acids, lipids, and other cellular materials that are highly bioavailable (Lancelot, 1984; Zhao et al., 2019; Nguyen et al., 2022). This bioavailable autochthonous DOM can be readily consumed by heterotrophic organisms (Poulton et al., 2016; Shen et al., 2016b), implying that an increase in autochthonous DOM resulting from enhanced primary production can significantly impact the dynamics of marine food webs in the Arctic Ocean. Moreover, previous studies reported that DOM in sea ice was predominantly of autochthonous origin (Scully and Miller, 2000; Stedmon et al., 2007; Müller et al., 2013; Jørgensen et al., 2015; Brogi et al., 2018; Zabłocka et al., 2020), likely resulting from biological activities (Granskog et al., 2005; Underwood et al., 2010; Aslam et al., 2012; Logvinova et al., 2016). The results from previous studies suggest that the melting of sea ice can potentially supply autochthonous DOM to the Arctic Ocean. Taken together, the enhanced primary production and melting of sea ice have the potential to supply a substantial amount of autochthonous DOM to the Arctic Ocean, which can have significant implications for marine food webs and DOM cycling in the region. Therefore, keeping track of the sources of DOM in the Arctic Ocean and investigating the impact of climate change on the potential fate of DOM would be critical.
Fluorescent dissolved organic matter (FDOM), measured by a fluorescence excitation–emission matrix coupled with parallel factor (EEM–PARAFAC) analysis, has been extensively used to trace the dynamics of DOM in various aquatic environments, providing comprehensive information for distinguishing between the allochthonous and autochthonous sources of DOM (Coble, 1996; Castillo et al., 1999; Murphy et al., 2008; Yamashita et al., 2013a). Based on the peak location of excitation and emission spectra, FDOM is generally categorized into two major groups, namely the humic-like and protein-like FDOM (Coble, 2007). The humic-like FDOM has broader emission and excitation spectra than the protein-like FDOM owing to it being a chemically complex mixture of organic matter. The humic-like FDOM is known to originate from various sources; river discharge has been considered an important source of humic-like FDOM in the Arctic Ocean (Stedmon and Markager, 2005a; Guéguen et al., 2012; Gonçalves-Araujo et al., 2016; Jung et al., 2021b). In addition, the humic-like FDOM is known to originate from microbial activity (Yamashita and Tanoue, 2008; Ishii and Boyer, 2012), and from the dissolution or fragmentation of sinking particles (Yamashita and Tanoue, 2008; Jeon et al., 2021). More recently, Hioki et al. (2014) and Chen et al. (2018) reported that the terrestrial humic-like FDOM originated from shelf sediment and then laterally transported through the upper halocline layer (32 < S < 33.5 psu) to the western Arctic Ocean. Furthermore, the upper halocline layer can become shallower when the anticyclonic atmospheric circulation is weakened over the Beaufort Sea (Jung et al., 2021a), suggesting that the distribution of humic-like FDOM could be altered by a change in the ocean circulation system in the Arctic Ocean.
Unlike the humic-like FDOM, the protein-like FDOM (e.g., tryptophan-like and tyrosine-like FDOM) is considered to be derived from planktonic organisms and/or microbial activity (Determann et al., 1994; Determann et al., 1998; Yamashita and Tanoue, 2003; Cammack et al., 2004; Coble, 2007; Romera-Castillo et al., 2011; Chen et al., 2017). The protein-like FDOM was recognized as the labile fraction of DOM (Yamashita and Tanoue, 2003; Yamashita et al., 2008; Yao et al., 2011). For example, previous studies reported correlations between protein-like FDOM and chlorophyll-a (Chl-a) (Heller et al., 2013; Yamashita et al., 2017; Makarewicz et al., 2018). Furthermore, it was observed that protein-like FDOM is produced during exponential algal growth (Stedmon and Markager, 2005b; Romera-Castillo et al., 2010). These previous results provided evidence for the association of protein-like FDOM with biological activities. However, a few recent studies conducted in the western Arctic Ocean, including the Beaufort, Laptev, and East Siberian seas, revealed that the protein-like FDOM is associated with river runoff (Dainard et al., 2019; Drozdova et al., 2022); however, the mechanism is not well understood. Similarly, Yamashita et al. (2017), who studied the geographical distributions of FDOM compositions in the surface waters of the Pacific Ocean, suggested that the high levels of protein-like FDOM in the Chukchi Sea are possibly due to terrigenous contributions.
In order to gain a better understanding of the impact of environmental changes in the Arctic marine system (e.g., increase in river discharge and primary production and change of water mass structure) on the DOM cycle, it is crucial to obtain detailed knowledge regarding the current distribution and sources of DOM. Although significant efforts have been made to investigate the distribution and sources of DOM in the western Arctic Ocean using FDOM (Guéguen et al., 2007; Guéguen et al., 2012; Guéguen et al., 2015; Logvinova et al., 2015; Chen et al., 2016; Chen et al., 2017; Mendoza et al., 2017; Chen et al., 2018; Dainard et al., 2019; Yamashita et al., 2019; Jung et al., 2021b; Drozdova et al., 2022), the available data are still insufficient to provide a comprehensive understanding of FDOM distribution in the region. For example, previous studies have primarily examined specific FDOM components such as humic-like or protein-like FDOM (Yamashita et al., 2019; Jung et al., 2021b) or have focused solely on surface waters within the upper 50 m (Guéguen et al., 2015; Logvinova et al., 2016; Yamashita et al., 2019; Drozdova et al., 2022). Consequently, these limited approaches have restricted our comprehensive understanding of FDOM. Therefore, it is imperative to investigate the sources and characteristics of DOM in order to understand its response to the recent environmental changes occurring in the western Arctic Ocean.
In this study, we aimed to investigate FDOM in conjunction with biophysical properties of water column (e.g., potential temperature (θ), S, inorganic nutrients, Chl-a, and heterotrophic bacterial abundance) in the Chukchi Sea, Chukchi Borderland, and East Siberian Sea in August 2019. The main objectives of this study are to (1) identify the composition and sources of FDOM and (2) evaluate the influence of changing hydrographic conditions in the western Arctic on the FDOM cycle. Although the data are from a single snapshot during a cruise, the results of this study offer valuable insights into the source and potential fate of FDOM in the context of ongoing marine environmental changes in the western Arctic Ocean.
2 Materials and methods
2.1 Seawater collection
A hydrographic survey was conducted at a total of 29 stations in the western Arctic Ocean during the ARA10B cruise (August 5−24, 2019) aboard the Korean icebreaker IBR/V Araon (Figure 1). The study area was divided into three regions based on its geographical location, namely the Chukchi Sea (CS; stations 1–13), Chukchi Borderland (CBL; stations 14–26 and 34), and East Siberian Sea (ESS; stations 27–33). In order to explore the water column characteristics in different regions, we partitioned the sampling stations into two transects, namely transect 1 across the CS and CBL and transect 2 across the ESS and CBL.
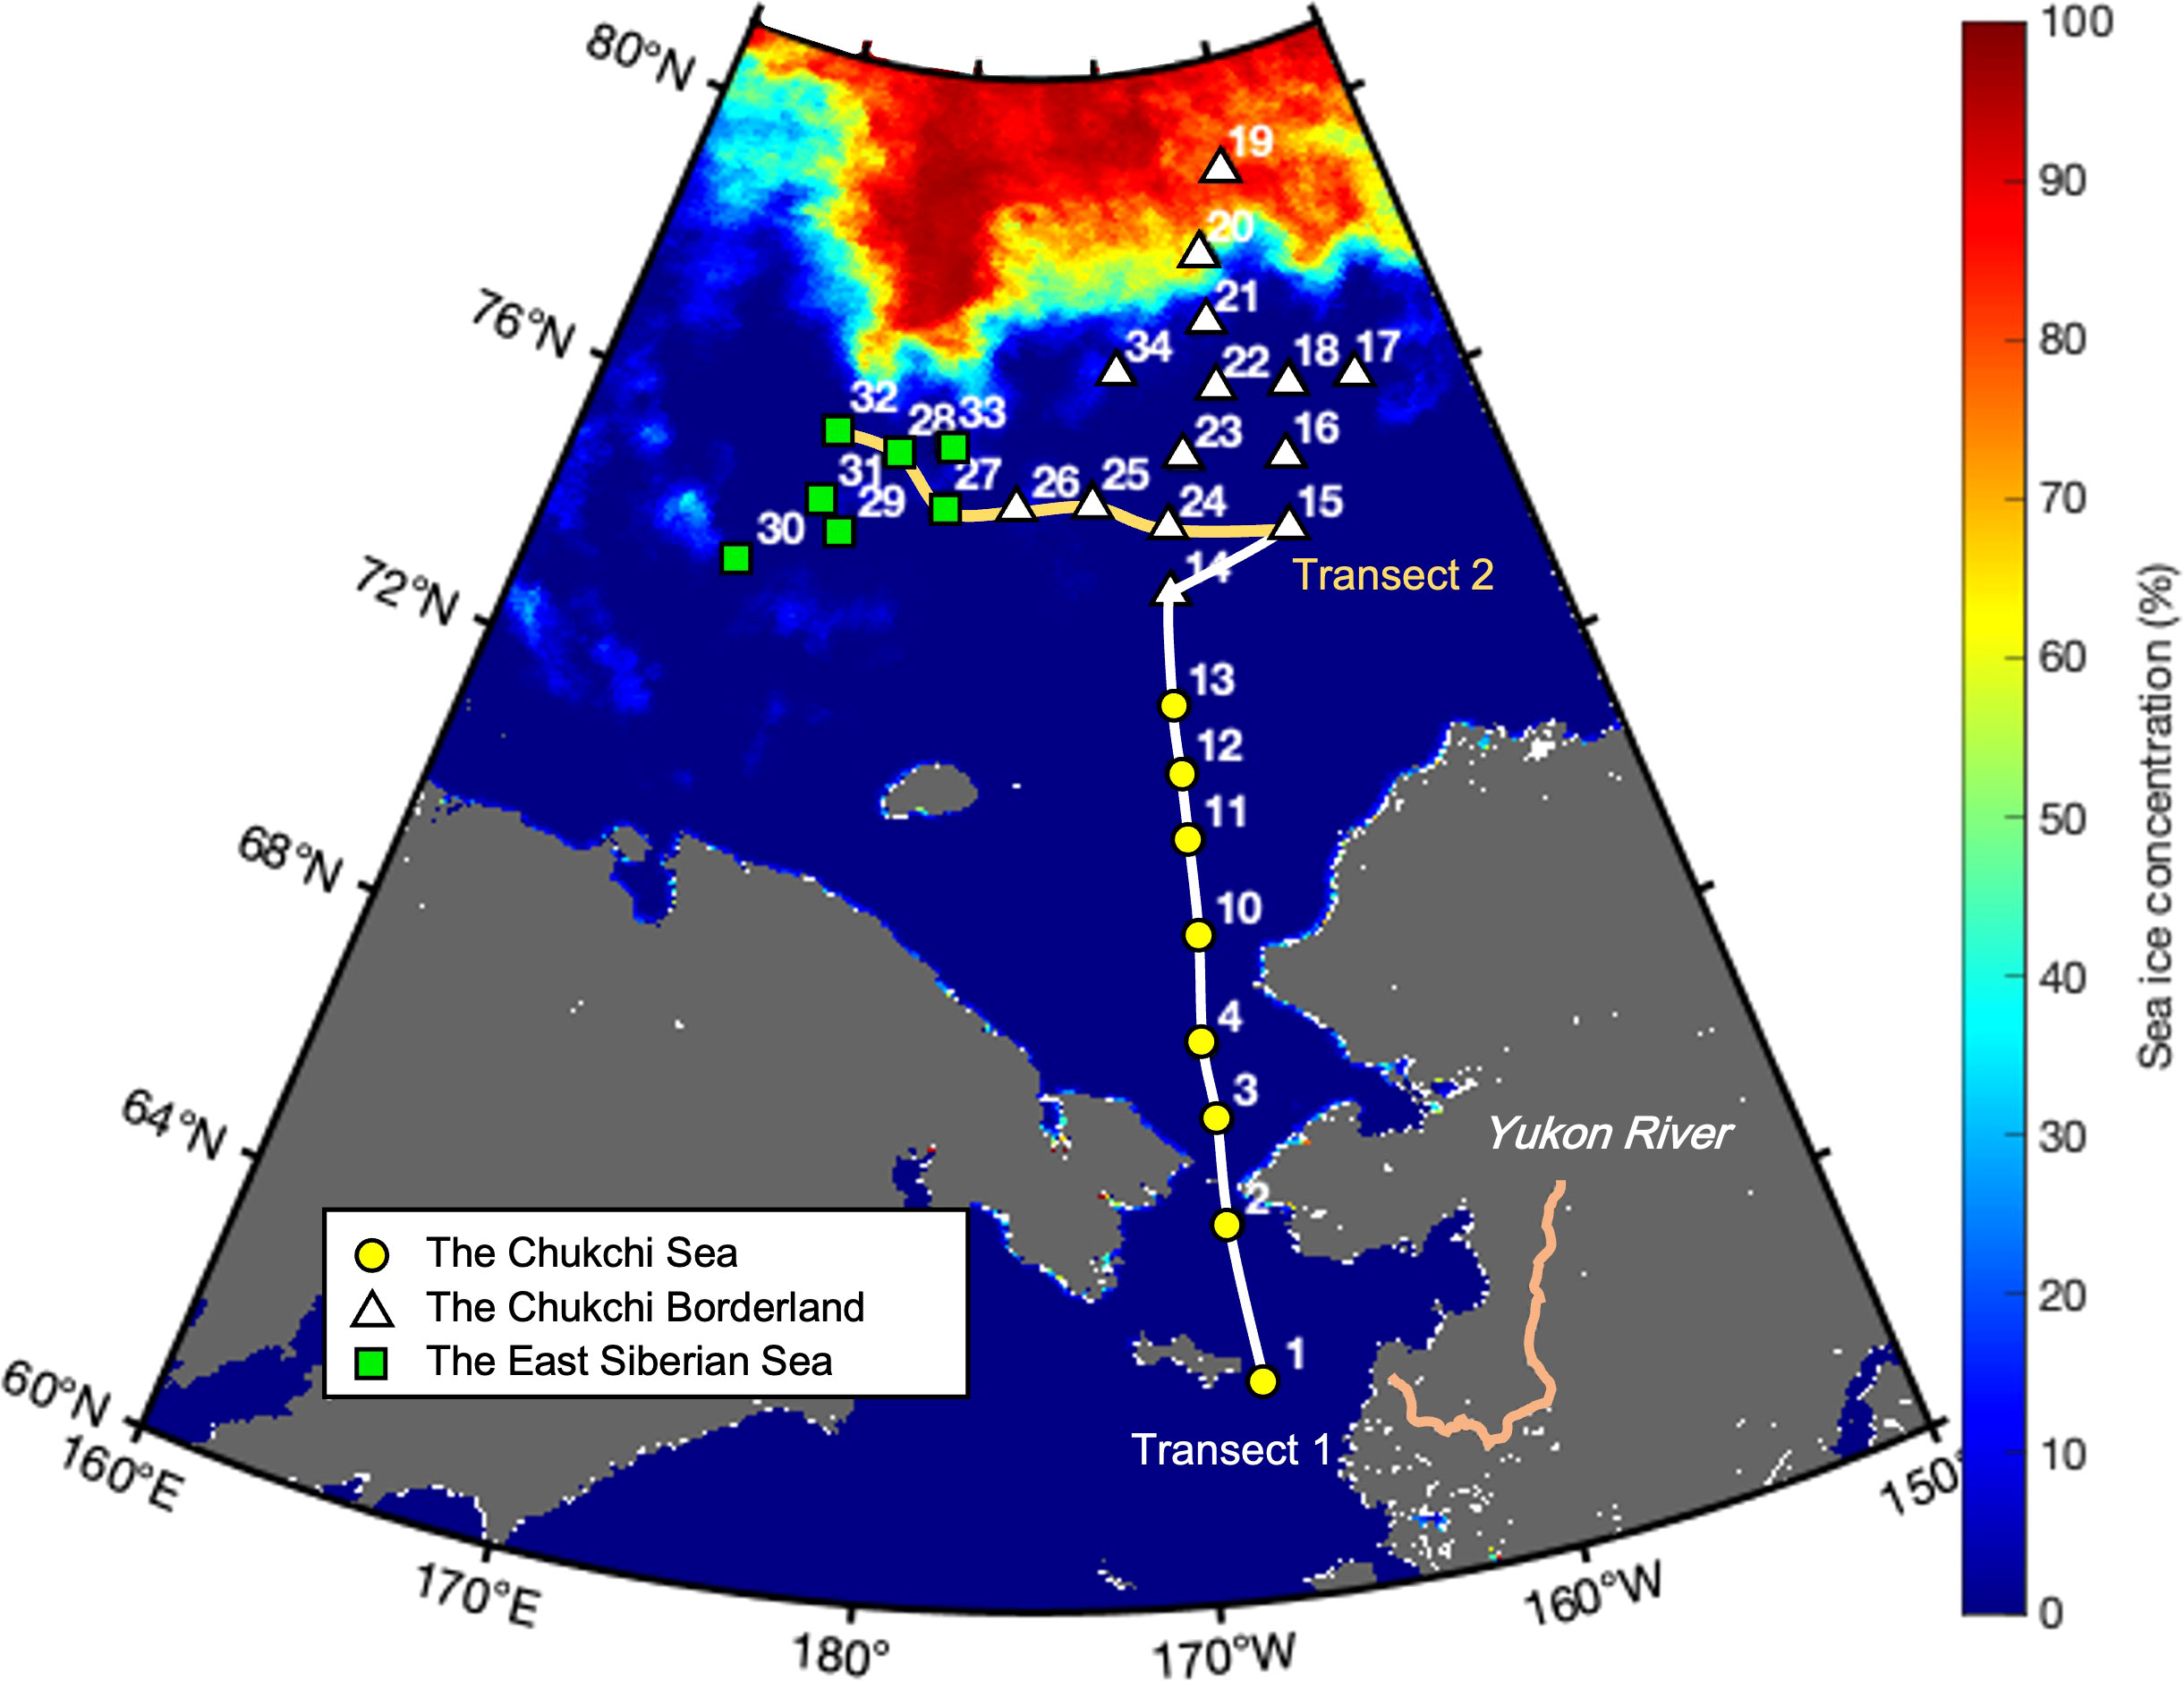
Figure 1 Map showing locations of the hydrographic survey stations and mean sea ice concentration for the sampling period in the western Arctic Ocean. The locations and numbers of sampling stations are superimposed onto the mean sea ice concentrations derived from Advanced Microwave Scanning Radiometer (AMSR) 2 sea ice concentration data for the period of August 5−24, 2019. Geographical locations are abbreviated as follows: Chukchi Sea (CS, yellow circles), Chukchi Borderland (CBL, white triangles), and East Siberian Sea (ESS, green squares).
Seawater sampling was conducted using 10 L Niskin bottles on the surface and at discrete depths chosen based on conductivity-temperature-depth (CTD; SBE 911 plus, SeaBird Electronics Inc., Bellevue, WA, USA) profiles. Seawater samples for DOM optical properties, DOC, and oxygen isotope ratios (δ18O) were gravity filtered from the Niskin bottles using an inline pre-combusted (at 550°C for 6 h) Whatman GF/F filter held in an acid-cleaned (0.1 M HCl) polycarbonate 47-mm filter holder (PP-47, ADVANTEC), as described in detail by Jung et al. (2021b). In each case, the filter holder was attached directly to the Niskin bottle spigot. For DOM optical properties and DOC measurements, the filtrates were divided into pre-combusted (at 550°C for 6 h) 20 mL glass ampoules using a sterilized serological pipette. For δ 18O measurement, the filtrate was distributed into an acid-cleaned 20 ml glass vial. The ampoules for DOM optical properties and DOC were sealed with a torch, quick-frozen, and stored under dark conditions at –24 °C for approximately two months until the analysis in our land laboratory. The vials for δ18O were sealed with parafilm and stored at 4 °C for approximately two months until the analysis in our land laboratory. For inorganic nutrient measurement, seawater was drawn into 50 mL conical tubes and immediately stored in a refrigerator at 4 °C until chemical analysis was conducted onboard within three days. Seawater samples (300–500 mL) for Chl-a analysis were filtered through Whatman GF/F filters. The filters were then immersed in 90% acetone for 24 hr to extract the Chl-a. The Chl-a concentration was immediately measured onboard after the extraction process. Seawater samples for heterotrophic bacterial abundance measurement were transferred into 2 mL cryovials, fixed with a final concentration of 1% (v/v) paraformaldehyde for 15 min, and stored at −80°C. The samples were analyzed onboard within a few weeks after collection.
When considering the filtration of FDOM samples, the choice of filter pore size is an important factor that can influence the properties of FDOM. While some studies have recommended using 0.2 μm pore size filters to prevent the passage of microorganisms and colloids that are not considered true DOM (Castillo and Coble, 2000; Moran et al., 2000; Yamashita et al., 2008; Romera-Castillo et al., 2010; Yao et al., 2011; Jørgensen et al., 2014; Gonçalves-Araujo et al., 2015; Logvinova et al., 2015; Logvinova et al., 2016; Mendoza et al., 2017), there is also a widespread use of GF/F filters with a pore size of 0.7 μm in previous studies (Stedmon et al., 2003; Yamashita and Tanoue, 2003; Stedmon and Markager, 2005a; Stedmon and Markager, 2005b; Stedmon et al., 2011; Dainard and Guéguen, 2013; Yamashita et al., 2013a; Gao and Guéguen, 2017; Yamashita et al., 2017; Chen et al., 2018; Brogi et al., 2019; Dainard et al., 2019; Kim et al., 2020; Drozdova et al., 2022) due to their high flow rate, high loading capacity, and the ease of the cleaning procedure (Spencer and Coble, 2014). Additionally, Nayar and Chou (2003) found that pre-combusted GF/F filters had an average pore size of 0.3 μm. Hence, taking into account the availability and performance characteristics of the pre-combusted GF/F filters, the use of these filters for FDOM filtration is expected to yield comparable results to 0.2 μm filters.
2.2 Optical properties of dissolved organic matter
Absorbance spectra of filtered seawater samples were measured using a spectrophotometer (UV-2600, Shimadzu Inc., Japan) at 1 nm intervals between 200 and 800 nm. All sample spectra were corrected using Milli-Q water measured daily. The measured absorbance was converted to absorption coefficient, according to the following equation:
where a is the absorption coefficient (m–1) at wavelength λ, A is the absorbance at wavelength λ, and L is the path length (m) (Green and Blough, 1994).
The spectral slope coefficient between 275 and 295 nm (S275–295, nm–1) was calculated using an exponential function, as described by Green and Blough (1994):
where a(λ) and a(λ0) are absorption coefficients at wavelength λ and λ0 (λ > λ0).
S275–295 has been widely applied in studies of aquatic environments (Fichot and Benner, 2012; Granskog, 2012; Granskog et al., 2012; Dainard and Guéguen, 2013; Helms et al., 2013; Yamashita et al., 2013b; Lee et al., 2016; Shen et al., 2016a; Johnston et al., 2018; Hirawake et al., 2021), because it can provide insight into the source, DOM molecular weight, and photochemical alterations (Helms et al., 2008; Helms et al., 2013).
Fluorescence EEMs were obtained using a fluorescence spectrophotometer (F-7100, Hitachi Inc., Japan) at excitation/emission (Ex/Em) wavelengths of 250−500/280−550 nm. The Ex and Em scans were set at 5 nm and 1 nm steps, respectively. Milli-Q water was used as a blank and its EEM spectrum was subtracted from the EEM spectra of the sample being analyzed. The fluorescence intensities were normalized to the area under the Milli-Q water Raman peak and reported in Raman units (R.U.) (Stedmon et al., 2003). Since absorbance values were always lower than 0.3 at 254 nm for all samples in this study, both reabsorption and inner filter effects were minimized (Burdige et al., 2004). The EEMs were characterized by PARAFAC modeling in MATLAB (Mathworks, USA) using the DOMFluor toolbox (Stedmon and Bro, 2008). The number of components was determined by a split-half validation and the percentage of explained variance (98.5%).
2.3 Dissolved organic carbon measurement
DOC concentration was measured by high-temperature combustion using a TOC analyzer (TOC-L, Shimadzu Inc., Japan). The concentration of DOC in Milli-Q water was measured daily and used as a blank. DOC concentration in consensus reference materials (CRM, 42−45 µM C for DOC, deep Florida Strait water obtained from the University of Miami, USA) were measured at every sixth analysis to check the reliability of measurements. The instrument ran 3–4 injections per sample, and analytical errors were within 5% for DOC (Chen et al., 2018; Jung et al., 2021b).
2.4 Stable oxygen isotope ratio measurement
Samples for δ18O measurement were analyzed by equilibration with carbon oxide. The δ18O was measured using a stable isotope ratio mass spectrometer (Isoprime, Micromass, Manchester, UK) in Korea Basic Science Institute. Data are reported with respect to Vienna-Standard Mean Ocean Water (V-SMOW) standard with the δ18O notation, where δ18O = [(18O/16Osample/18O/16OV-SMOW)–1] × 1000. Precision of the analysis, based on duplicate measurements of an internal standard, was determined to be < 0.1‰ (Jung et al., 2021b).
2.5 Freshwater component calculation
δ18O and S were used to estimate the fractions of seawater (fseawater), sea ice meltwater (fsea ice melt), and river water (friver), by assuming that the observed δ18O and S in the seawater samples have resulted from a mixture of river water, sea ice meltwater, and seawater. The respective fractions (i.e., fseawater, fsea ice melt, and friver) were calculated using the following mass balance equations:
where f and S are the fraction and salinity, respectively. δ18Oobs and Sobs refer to the observed values from each seawater sample. We chose the three end-member values for the calculation of friver, fsea ice melt, and fseawater (Table 1), as suggested in previous studies (Mathis et al., 2007; Cooper et al., 2008; Yamamoto-Kawai et al., 2008).
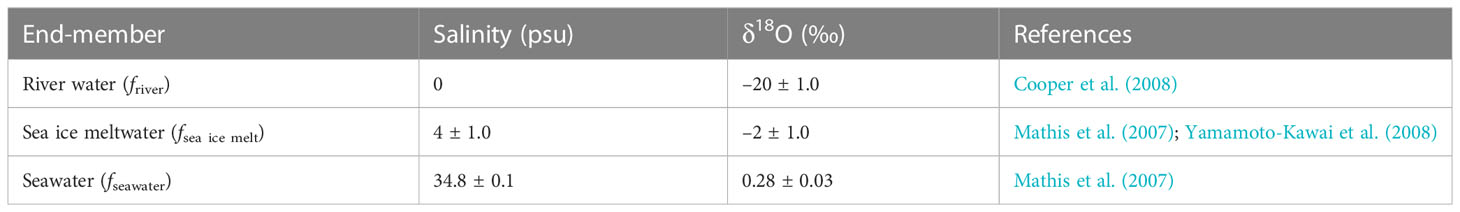
Table 1 Values of end-members used in mass balance calculations.
2.6 Inorganic nutrient measurement
Inorganic nutrients, including nitrite + nitrate (NO2– + NO3–), and phosphate (PO43–), were measured onboard using a four-channel auto-analyzer (QuAAtro, Seal Analytical, Germany) following the Joint Global Ocean Flux Study (JGOFS) protocols (Gordon et al., 1993). The reference material for nutrients in seawater (Lot No. “BV”, KANSO Technos Co., Ltd., Osaka, Japan) was used in conjunction with standards for each batch of runs to ensure precise and consistent measurements. The accuracies of the measured concentrations (reported as relative standard deviation) of NO2– + NO3– and PO43– were ± 1.0% at 35.33 μmol kg–1 and ± 0.89% at 2.514 μmol kg–1, respectively. The detection limits (calculated as three times the standard error of the intercept/slope of the calibration line) were 0.27 μmol kg–1 for NO2– + NO3– and 0.21 μmol kg–1 for PO43–.
2.7 Chlorophyll-a measurement
Chl-a concentrations were estimated using a fluorometer (Trilogy, Turner Designs, San Jose, CA, USA) previously calibrated with pure Chl-a (Sigma, St. Louis, MO, USA) (Parsons et al., 1984).
2.8 Heterotrophic bacterial abundance measurement
Immediately prior to analysis, the samples were thawed, stained with SYBR Green I (Molecular Probes) for 15 min (Noble and Fuhrman, 1998), and then analyzed using an Accuri C6 flow cytometer (Becton Dickinson, Franklin Lakes, NJ, USA) equipped with an air-cooled argon ion laser (488 nm, 15 mW). Bacteria were identified using the characteristics of their side light scatter and green fluorescence signals.
2.9 Estimation of riverine dissolved organic carbon
Riverine DOC concentration (μM C) was determined using the following equation, as described by Mathis et al. (2007):
where DOCriver is the initial DOC concentration in river runoff. In this study, a concentration of 350 μM C was used for DOCriver in the CS (i.e., stations 1–13) (Mathis et al., 2007). For the CBL and ESS, DOCriver was set to be 175 μM C, corresponding to zero-salinity (100% river water) DOC value, obtained from the relationship between DOC and sea ice meltwater-corrected S in these regions (Figure S1). Details underlying the choice of DOCriver in our study regions can be found in the publications by Jung et al. (2021b) and Jung et al. (2022).
2.10 N* Calculation
The parameter N* was calculated using the following equation reported by Gruber and Sarmiento (1997):
The underlying premise of N* is that when marine organic matter is remineralized, the N/P atomic regeneration ratio is normally close to 16/1 (i.e., the Redfield ratio of N to P). The constant value 2.9 was used to make the global average of N* for the ocean zero, and the value 0.87 was used to account for PO43– released by the regeneration of organic matter during denitrification. The Atlantic waters entering the Arctic Ocean have positive N* values owing to net nitrogen fixation in the North Atlantic, whereas that entering Pacific waters have negative values due to the significant denitrification that occurs within the shelf sediments in the Chukchi Sea (Devol et al., 1997; Codispoti et al., 2005; Codispoti et al., 2009; Nishino et al., 2013).
3 Results
3.1 Hydrographic characteristics
The θ–S diagram shows the presence of four major water masses in the western Arctic Ocean (Figure S2), consistent with previous studies (Codispoti et al., 2005; Nishino et al., 2013; Alkire et al., 2019): surface mixed layer (< 50 m depth), Pacific summer water (S = 31–32 psu, θ maximum, 50–100 m depth), Pacific winter water (S ≈ 33 psu, θ minimum, 100–150 m depth), and Atlantic water (S > 34 psu, maximum θ, below 150 m depth). In the CBL and ESS, the Atlantic-origin cold halocline water (S ≈ 34.2~34.5 psu, θ ≈ –1 °C) was also observed (Jung et al., 2021a).
Figure 2 shows the hydrographic conditions (S, θ, inorganic nutrients, N*, and Chl-a) along a latitudinal transect from the CS to CBL (i.e., transect 1). The warmest waters (3.2 < θ < 10.9 °C) were observed in the upper 50 m of the southern CS (stations 1–4 and 10), which became shallow as they flowed into the northern CS and CBL. Compared to those in the CS (range: 29.9 < S < 33.0 psu, mean: 32.0 ± 0.7 psu), S values in the upper 50 m of the CBL (range: 27.2 < S < 31.8 psu, mean: 29.7 ± 1.8 psu) were lower, presumably due to river discharge and/or melting of sea ice. The upper halocline layer with salinities of 32–33.5 psu at depths between 50 and 200 m had high inorganic nutrient concentrations (mean: 1.4 ± 0.3 μmol kg–1 for PO43– and 9.4 ± 4.5 μmol kg–1 for NO2– + NO3–) and low N* (range: –10.4 to –7.6 μmol kg–1, mean: –8.9 ± 0.9 μmol kg–1), suggesting the characteristics of Pacific-origin water (Itoh et al., 2015; Danielson et al., 2017). The warm (θ > 0°C) and saline (S > 34 psu) Atlantic water lay beneath the upper halocline layer. The Chl-a concentrations ranged from 0.07 to 17.9 mg m–3 (mean: 3.1 ± 4.0 mg m–3), with the highest values in the CS.
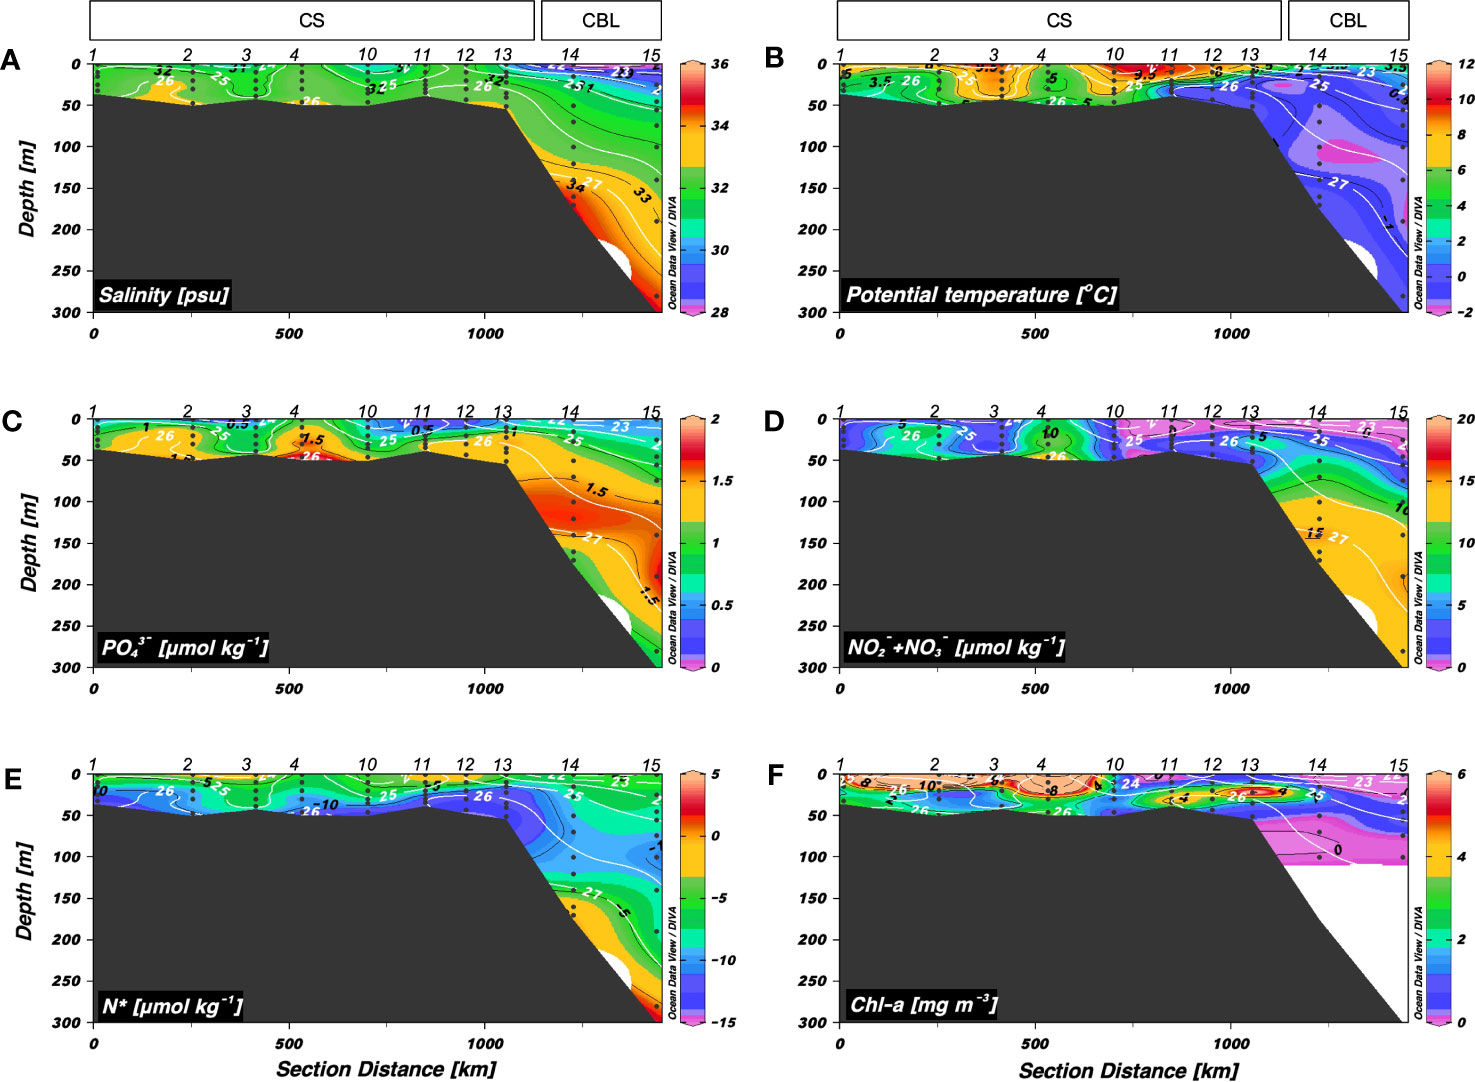
Figure 2 Vertical distributions obtained along transect 1 across the Chukchi Sea (CS) and Chukchi Borderland (CBL) during the summer of 2019. Vertical distributions of (A) salinity (S) (psu), (B) potential temperature (θ) (°C), (C) phosphate (PO43–) (μmol kg−1), (D) nitrite + nitrate (NO2– + NO3–) (μmol kg−1), (E) N* (μmol kg−1), and (F) chlorophyll-a (Chl-a) (mg m−3). The station numbers are shown at the top of each figure. Black lines and numbers show the contours and values of each variable. Density contours (white lines and numbers) are superimposed on the panels of Figures 2A–F. The Chl-a concentration was measured within 100 m depth.
The vertical distributions of S and θ along a longitudinal transect from the ESS to CBL (i.e., transect 2) showed a vertical stratification (Figure 3). The surface mixed layer (< 25 m) was characterized by relatively warm (range: −1.5 < θ < 5.2 °C, mean: 1.0 ± 2.2 °C) and fresh waters (range: 27.4 < S < 31.4 psu, mean: 29.4 ± 1.2 psu). Below the surface mixed layer, the Pacific summer water (S = 31–32 psu, θ maximum) was observed. The upper halocline layer (32 < S < 33.5 psu, at depths between 50 and 200 m) had higher concentrations of inorganic nutrients (mean: 1.6 ± 0.4 μmol kg–1 for PO43– and 12.4 ± 4.5 μmol kg–1 for NO2– + NO3–) and lower N* values (range: –12.9 to –4.5 μmol kg–1, mean: –9.5 ± 1.8 μmol kg–1) (Figures 3C−E). Interestingly, the upper halocline waters with salinities of 32–33.5 psu shoaled up to approximately 30 m at station 26. The Chl-a maximum was found at depth of 22 m in station 26 (Figure 3F). The densest water (S > 34 psu and θ ≈ –1 °C) observed at depths below 80 m in the west part of the ESS was associated with Atlantic-origin waters (Codispoti et al., 2009; Kondo et al., 2016), and its layer deepened toward the east.
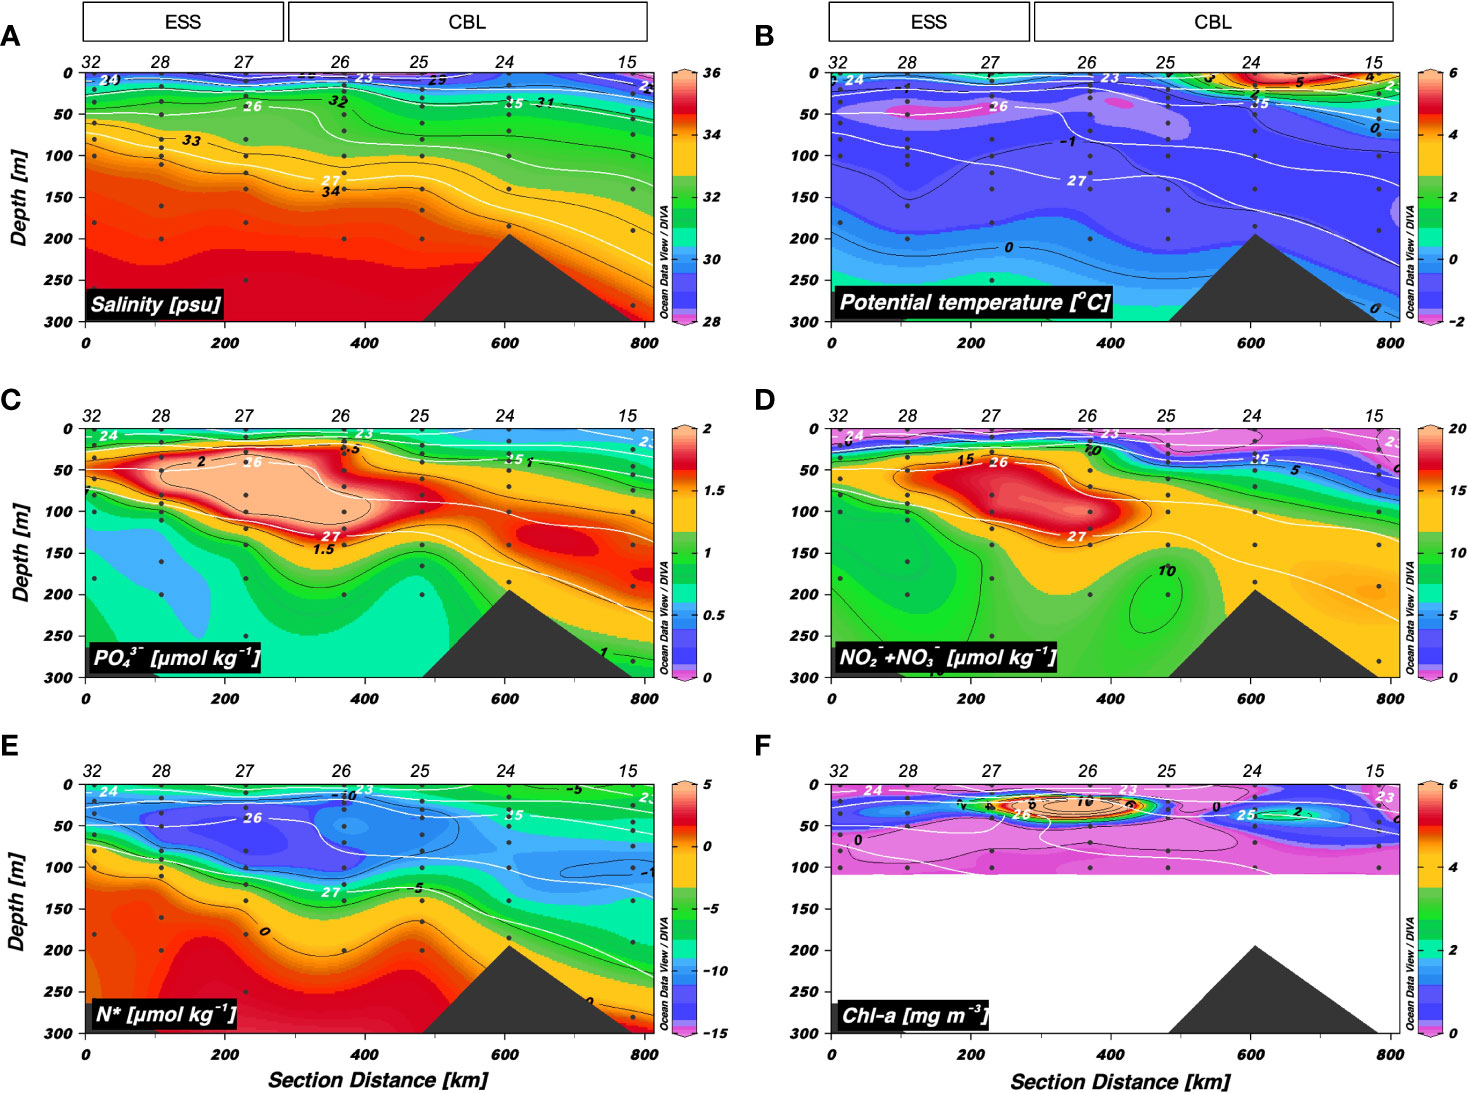
Figure 3 Vertical distributions obtained along transect 2 across the East Siberian Sea (ESS) and Chukchi Borderland (CBL) during the summer of 2019. Vertical distributions of (A) salinity (S) (psu), (B) potential temperature (θ) (°C), (C) phosphate (PO43–) (μmol kg−1), (D) nitrite + nitrate (NO2– + NO3–) (μmol kg−1), (E) N* (μmol kg−1), and (F) chlorophyll-a (Chl-a) (mg m−3). The station numbers are shown at the top of each figure. Black lines and numbers show the contours and values of each variable. Density contours (white lines and numbers) are superimposed on the panels of Figures 3A–F. The Chl-a concentration was measured within 100 m depth.
3.2 River water fraction and riverine DOC
The distributions of friver along transects 1 and 2 are shown in Figures 4A, B. The friver along transect 1 ranged from 0 to 0.18, with means of 0.06 ± 0.02 in the CS and 0.10 ± 0.05 in the CBL (Figure 4A). The friver along transect 2 exhibited similar distribution as along transect 1, varying from 0 to 0.18 (Figure 4B). Overall, the friver values in the upper 50 m of the CBL (mean: 0.13 ± 0.03) were higher than those in the ESS (mean: 0.09 ± 0.02). The highest friver values were observed in the eastern parts of transect 2 (i.e., stations 15, 24–25), where the regions are in accord with the position of the edge of Beaufort Gyre associated with freshwater accumulation (Jung et al., 2021b).
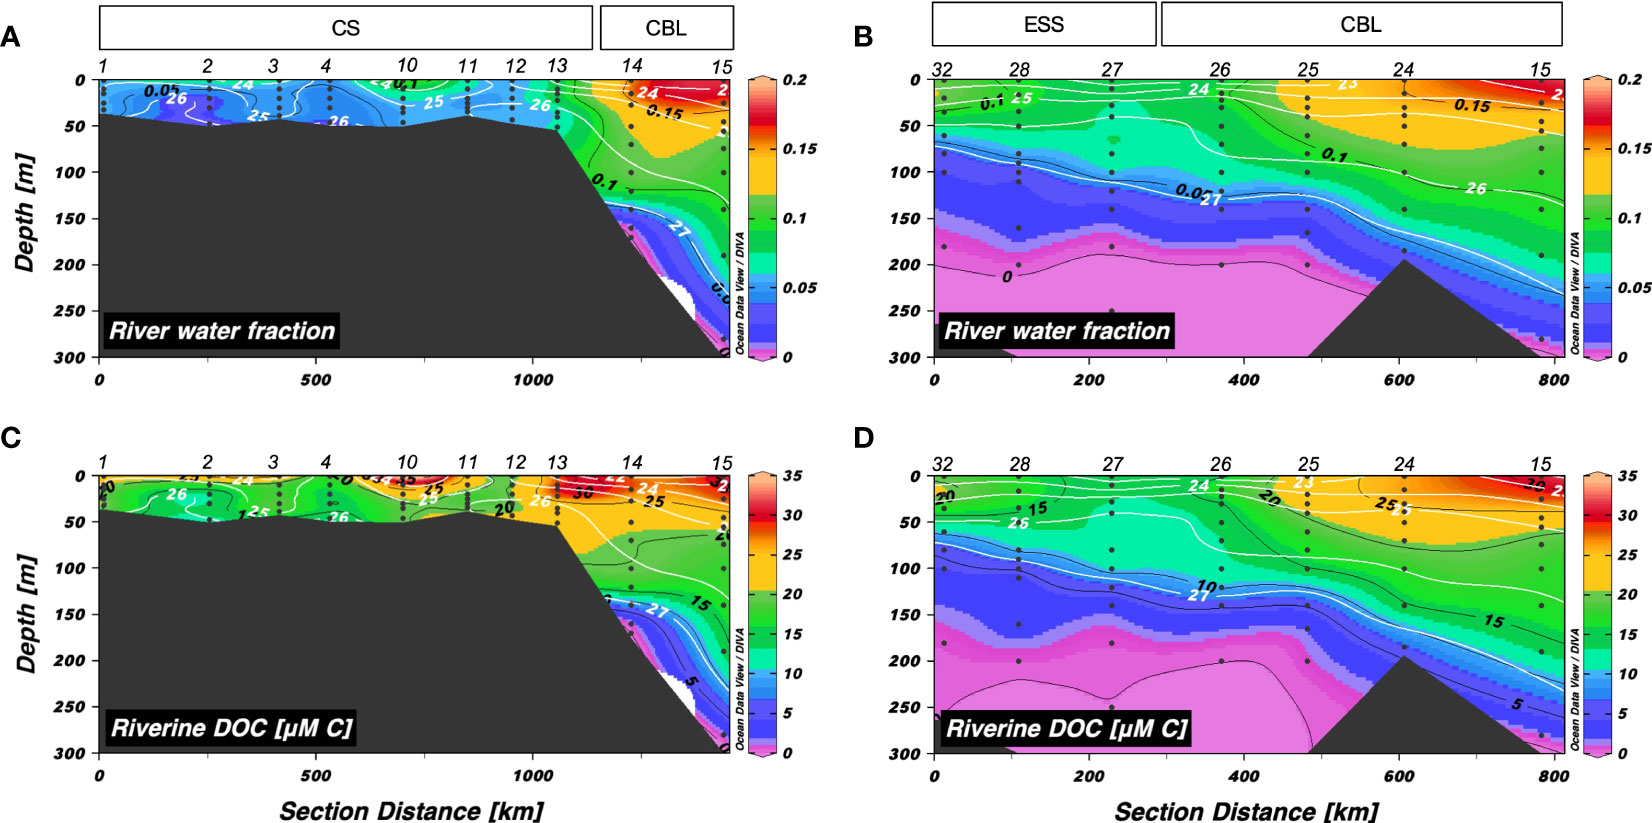
Figure 4 Vertical distributions of (A, B) river water fraction and (C, D) riverine dissolved organic carbon (μM C) along transects 1 and 2, respectively. The sampling locations indicated in the upper panels are abbreviated as follows: Chukchi Sea (CS), Chukchi Borderland (CBL), and East Siberian Sea (ESS). The station numbers are shown at the top of each figure. Black lines and numbers show the contours and values of each variable. Density contours (white lines and numbers) are superimposed on the panels of Figures 4A–D.
The vertical distributions of riverine DOC in transects 1 and 2 were similar to those of friver (Figures 4C, D). The riverine DOC concentrations along transect 1 ranged from 1.04 to 55.4 µM C (mean: 22.8 ± 11.0 µM C), with the highest values in the surface layer and decreasing with depth (Figure 4C). The mean concentration of riverine DOC in the upper 50 m of the CBL (27.1 ± 2.6 µM C) was higher compared to that in the CS (20.9 ± 6.0 µM C). The riverine DOC along transect 2 exhibited similar distribution as that along transect 1, varying from 0 to 31.2 µM C (mean: 13.2 ± 8.2 µM C) (Figure 4D).
3.3 Heterotrophic bacterial abundance
Heterotrophic bacterial abundance along transects 1 and 2 ranged from 0.24 to 2.5 × 10⁶ cells mL–1 and 0.11 to 1.8 × 10⁶ cells mL–1, respectively (Figure 5). Along transect 1, the mean abundance of heterotrophic bacteria in the upper 50 m of the CBL (mean: 0.37 ± 0.10 × 10⁶ cells mL–1) was lower than that in the CS (mean: 1.3 ± 0.54 × 10⁶ cells mL–1). Heterotrophic bacterial abundance in the surface layer of the CBL along transect 2 (mean: 0.36 ± 0.18 × 10⁶ cells mL–1) was lower than that in the ESS (mean: 0.65 ± 0.42 × 10⁶ cells mL–1).
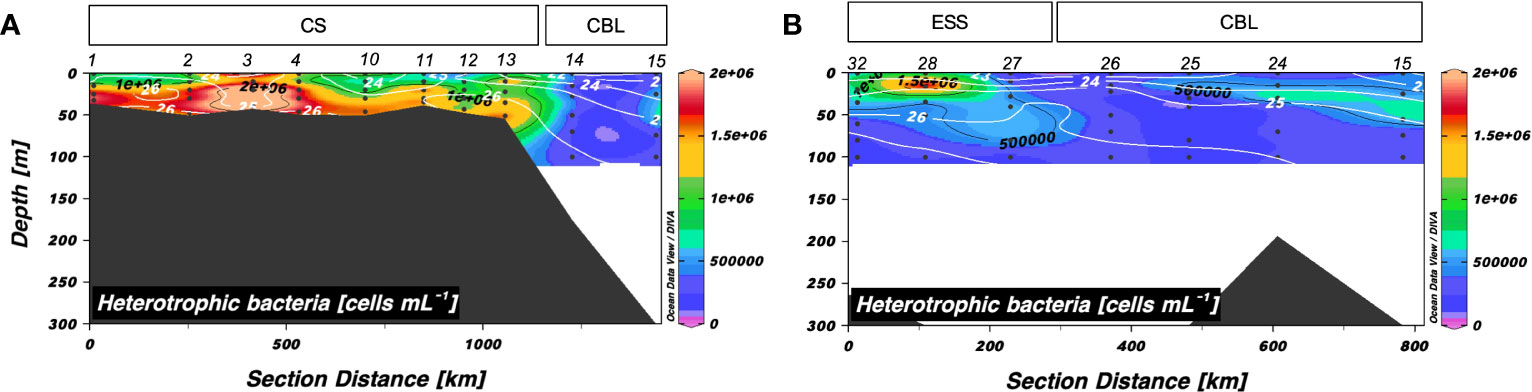
Figure 5 Vertical distributions of heterotrophic bacterial abundance along (A) transect 1 and (B) transect 2. Sampling locations indicated in the upper panels are abbreviated as follows: Chukchi Sea (CS), Chukchi Borderland (CBL), and East Siberian Sea (ESS). The station numbers are shown at the top of each figure. Black lines and numbers show the contours and values of each variable. Density contours (white lines and numbers) are superimposed on the panels of Figures 5A, B. The heterotrophic bacterial abundance was measured within 100 m depth.
3.4 Fluorescent dissolved organic matter components
Three different fluorescent components were identified by the PARAFAC analysis, based on the results from core consistency and split-half validation, and are henceforth referred to as components 1 to 3 (Figure 6). The three components were compared to those identified previously from the OpenFluor database with Tucker’s congruence coefficients exceeding 0.95 (Murphy et al., 2014) and by visual inspection (Table S1) (Stedmon et al., 2007; Stedmon et al., 2011; Dainard and Guéguen, 2013; Catalá et al., 2015; Gonçalves-Araujo et al., 2015; Gonçalves-Araujo et al., 2016; Gao and Guéguen, 2017; Brogi et al., 2019; Kim et al., 2020). Component 1 (C1) showed maximum Ex wavelengths below 250 nm and at 310 nm, and a maximum Em wavelength at 400 nm (Figures 6A, D), whereas component 2 (C2) showed Ex maxima at 260 nm and 370 nm, and an Em maximum at 473 nm (Figures 6B, E). The C1 and C2 were categorized as the humic-like FDOM, since they had broader Ex spectra and Em maxima above 380 nm. The results obtained from the OpenFluor database for C1 were somewhat contradictory; some indicated C1 to be similar to the terrestrial humic-like component (Stedmon et al., 2007; Gonçalves-Araujo et al., 2015) while others showed C1 to have the characteristics of marine humic-like component in the visible region (Catalá et al., 2015; Gao and Guéguen, 2017; Kim et al., 2020). Therefore, C1 was categorized as a mixture of the terrestrial and marine humic-like components, described earlier as peaks A and M by Coble (1996) through visual inspection (Ishii and Boyer, 2012). C2 has fluorescence properties similar to that of terrestrial humic-like component (Stedmon et al., 2011; Dainard and Guéguen, 2013; Gonçalves-Araujo et al., 2016; Kim et al., 2020). It was characterized as a mixture of the terrestrial humic-like components in the UV and visible regions, described earlier as peaks A and C (Coble, 1996). Component 3 (C3) displayed an Ex maximum at 280 nm and an Em maximum at 341 nm (Figures 6C, F). It had similar spectral characteristics as the tryptophan-like component (Stedmon et al., 2011; Brogi et al., 2019).
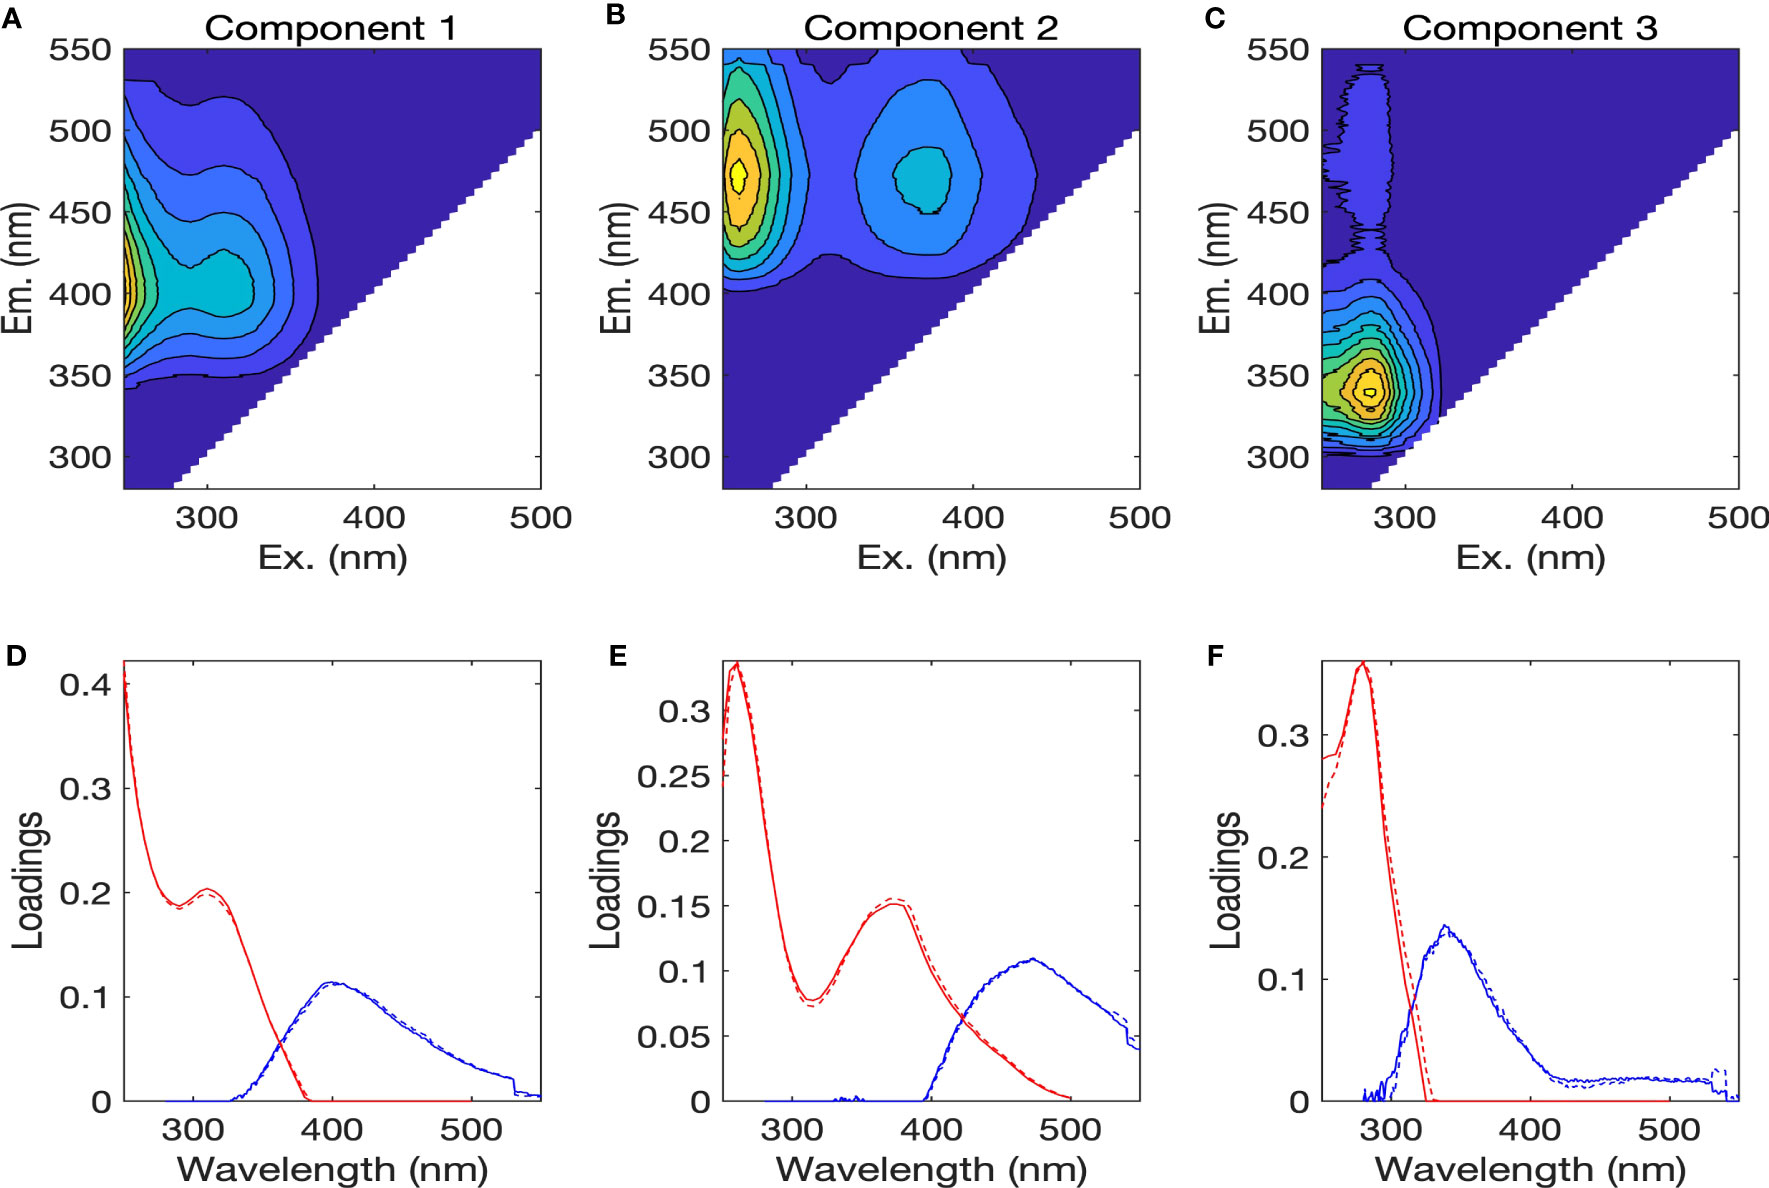
Figure 6 (A–C) Fluorescence excitation-emission matrix contour plots of three PARAFAC components, with (D–F) the excitation (red lines) and emission (blue lines) spectra of three components. The solid and dotted lines denote two random halves of the complete dataset.
3.5 Spatial distributions of FDOM
The surface distributions of the humic-like and tryptophan-like FDOM and S275–295 are shown in Figure 7. The fluorescence intensities of a mixture of terrestrial and marine humic-like C1 and terrestrial humic-like C2 varied from 0.018 to 0.063 R.U. and 0.009 to 0.028 R.U., respectively (Figures 7A, B). Notably, the CBL exhibited lower intensities of humic-like FDOM (mean: 0.027 ± 0.006 R.U. for C1 and 0.011 ± 0.003 R.U. for C2) compared to the CS (mean: 0.036 ± 0.018 R.U. for C1 and 0.015 ± 0.006 R.U. for C2) and ESS (mean: 0.036 ± 0.004 R.U. for C1 and 0.016 ± 0.001 R.U. for C2). The tryptophan-like C3 exhibited values ranging from 0.011 to 0.026 R.U., with the highest concentrations observed in the CS (Figure 7C). The S275–295 values varied between 0.006 and 0.041 nm–1, with the highest values observed in the eastern stations of the CBL (i.e., stations 15–18), ranging from 0.031 to 0.041 nm–1 (Figure 7D). The lowest S275–295 value (0.006 nm–1) was observed in conjunction with high fluorescent intensity values of the humic-like FDOM at station 26. Notably, this station coincided with the location where shoaling of the upper halocline layer was observed (Figures 3A–E). In addition, elevated S275–295 values and reduced fluorescence intensities of humic-like FDOM were observed in the surface water of the eastern stations in the CBL, in contrast to the CS and ESS.
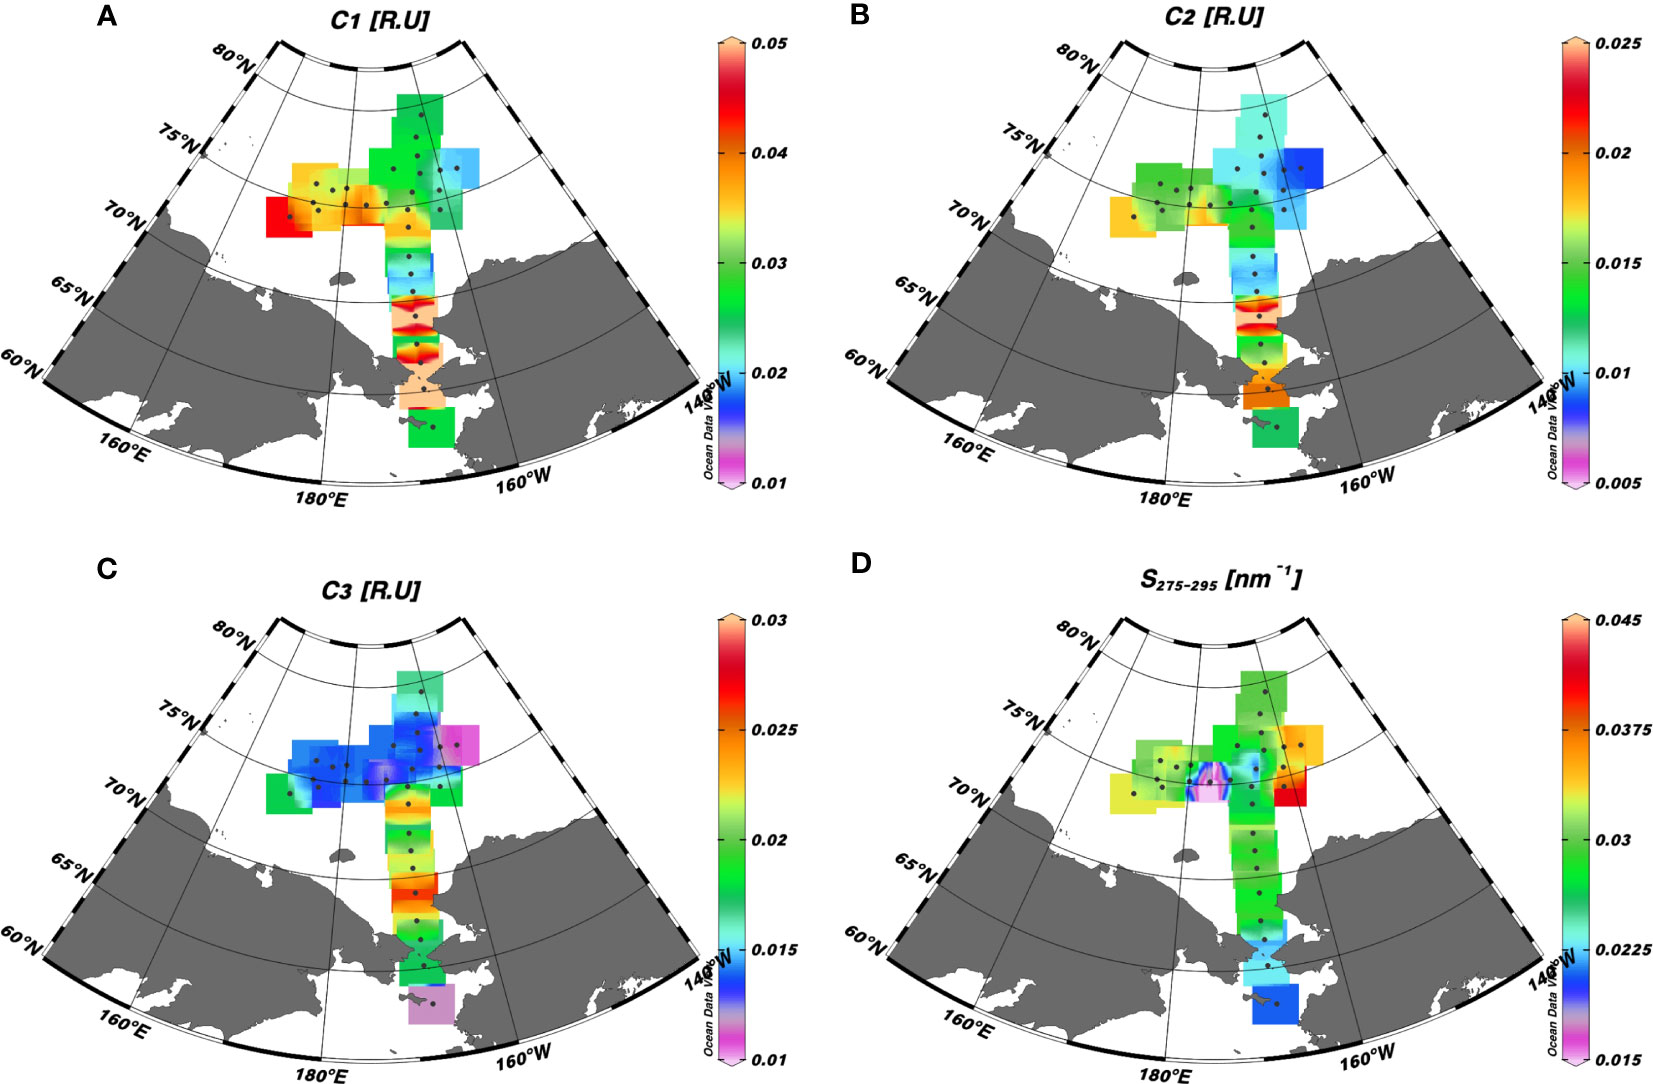
Figure 7 Surface distributions of (A) a mixture of the terrestrial and marine humic-like FDOM (C1) (R.U.), (B) a mixture of terrestrial humic-like FDOM in the UV and visible regions (C2) (R.U.), (C) tryptophan-like FDOM (C3), and (D) spectral slope of CDOM between 275 and 295 nm (S275–295) (nm–1) in the western Arctic Ocean.
The vertical distributions of C1 and C2 fluorescence intensities along transects 1 and 2 are shown in Figures 8A–D. The intensities of C1 and C2 along transect 1 ranged from 0.018 to 0.063 R.U. and 0.010 to 0.028 R.U., respectively (Figures 8A, C). Intensities of the humic-like FDOM were low in the surface layer and high in the upper halocline layer. Along transect 2, C1 and C2 values varied from 0.022 to 0.066 R.U. and 0.010 to 0.031 R.U., respectively, with the highest intensities in the upper halocline layer and the lowest intensities at the surface. Interestingly, higher intensities of humic-like FDOM (C1 and C2) than that in surrounding waters were found in the upper 30 m at station 26 along transect 2, where Chl-a was observed to be maximum (Figure 3F).
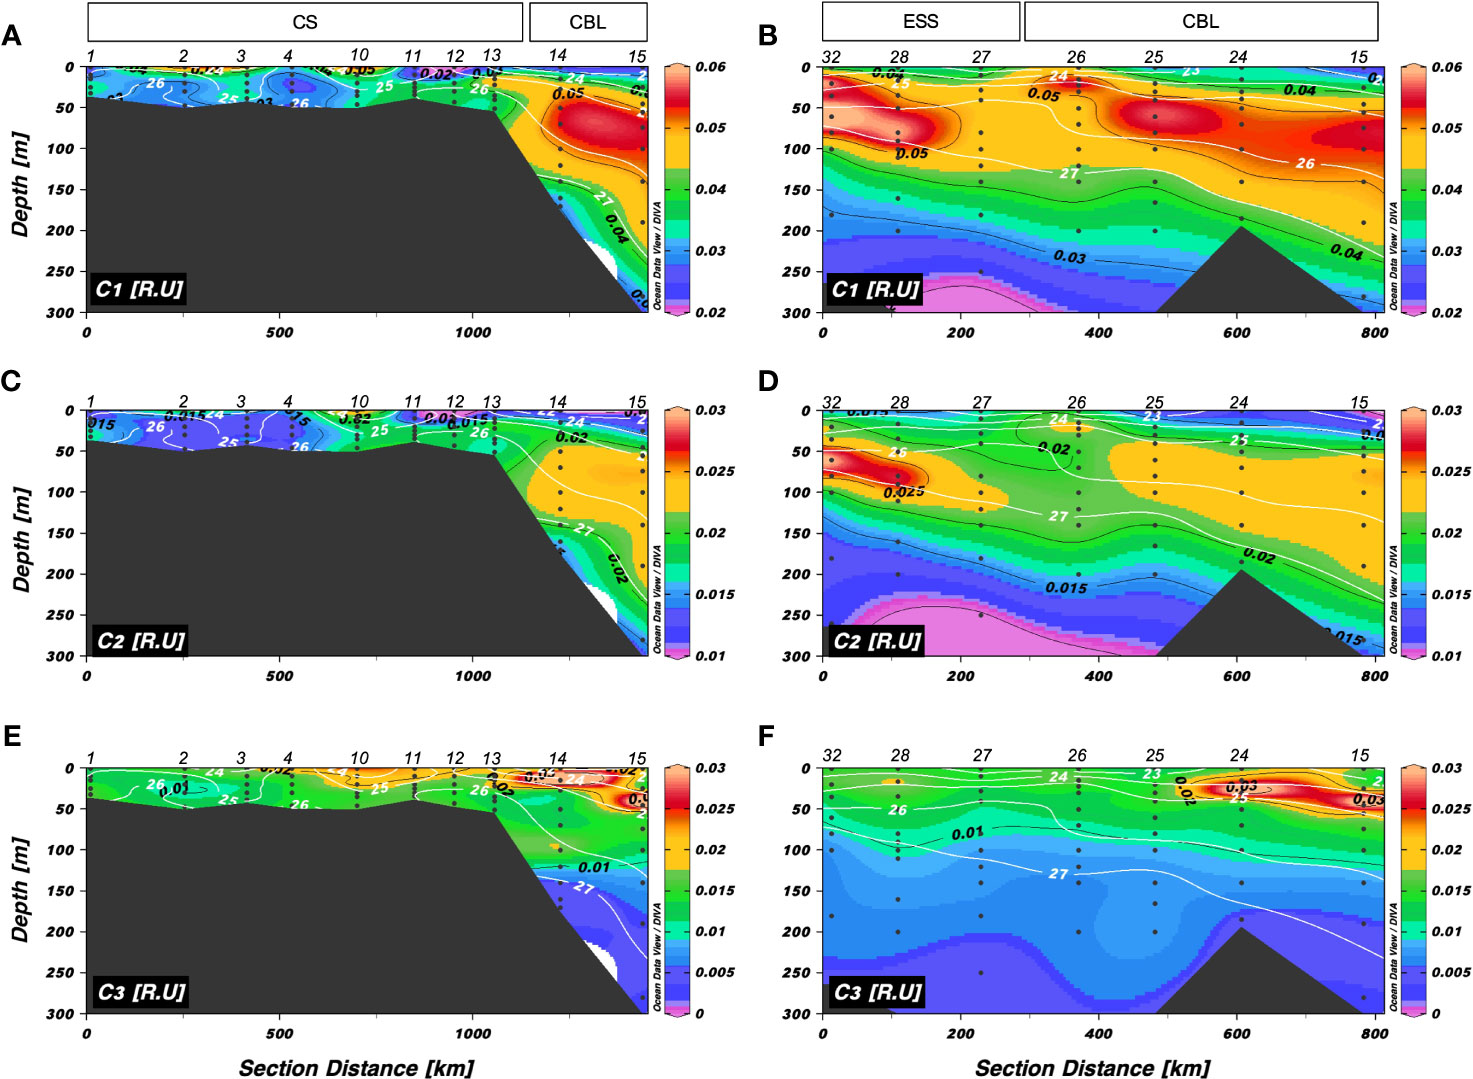
Figure 8 Vertical distributions of (A, B) a mixture of the terrestrial and marine humic-like FDOM (C1) (R.U.), (C, D) a mixture of terrestrial humic-like FDOM in the UV and visible regions (C2) (R.U.), and (E, F) tryptophan-like FDOM (C3) along transects 1 and 2, respectively. The sampling locations indicated in the upper panels are abbreviated as follows: Chukchi Sea (CS), Chukchi Borderland (CBL), and East Siberian Sea (ESS). The station numbers are shown at the top of each figure. Black lines and numbers show the contours and values of each variable. Density contours (white lines and numbers) are superimposed on the panels of Figures 7A–F.
The tryptophan-like C3 showed different patterns compared to the humic-like FDOM (C1 and C2) (Figures 8E, F). The intensities of tryptophan-like FDOM along transects 1 and 2 ranged from 0.003 to 0.047 R.U. and 0.003 to 0.041 R.U., respectively, showing a pattern of decreasing intensities with depth. Fluorescence intensities of the tryptophan-like FDOM in the upper 50 m (mean: 0.017 ± 0.007 R.U. in transects 1 and 2) were higher than that at depths below 50 m (mean: 0.010 ± 0.005 R.U. in transect 1 and 0.007 ± 0.001 R.U. in transect 2). Furthermore, distributions of the tryptophan-like FDOM showed an overall south-north gradient for transect 1 and an east-west gradient for transect 2. Compared to those in the CS and ESS, the intensities of tryptophan-like FDOM were higher at depths of approximately 50 m in the CBL, where the friver and riverine DOC levels were maximum (Figure 4). Contrary to previously published results, which suggested that tryptophan-like FDOM is produced from biological activities (Determann et al., 1998; Moran et al., 2000; Stedmon et al., 2003; Romera-Castillo et al., 2011; Chen et al., 2017; Chen et al., 2018), the vertical distributions of the tryptophan-like FDOM along transects 1 and 2 were different from those of Chl-a (Figures 2F, 3F) and heterotrophic bacterial abundance (Figure 5).
3.6 Relationships between C3 and environmental parameters
To explore the origin of tryptophan-like FDOM (C3), we examined the correlation of tryptophan-like FDOM with biological factors, such as Chl-a and heterotrophic bacterial abundance, as well as river water parameters, including friver and riverine DOC (Figure 9). There was no significant correlation between tryptophan-like FDOM and biological factors (Figures 9A, B), which implied that the tryptophan-like FDOM may have originated from processes other than biological activities. Additionally, no significant relationship was found between the tryptophan-like FDOM and fsea ice melt (Figure S3A), suggesting that the contribution of sea ice meltwater to the tryptophan-like FDOM is negligible. On the other hand, the tryptophan-like FDOM showed significant positive relationships with friver and riverine DOC (Figures 9C, D), indicating a strong association between tryptophan-like FDOM and riverine inputs. Moreover, a negative relationship was found between the tryptophan-like FDOM and fseawater (Figure S3B) in the study regions, further supporting the association between tryptophan-like FDOM and riverine contributions. Furthermore, the magnitude of correlation coefficients between the tryptophan-like FDOM and river water parameters (r = 0.55 for the CS, r = 0.51 for the CBL, and r = 0.85 for the ESS) was different across regions (Figures 9C, D). Plots between the tryptophan-like FDOM intensities and river water parameters in the ESS were scattered over a narrower range than those in the CS and CBL, indicating that the influence of river water on tryptophan-like FDOM is much stronger in the ESS than in the CS and CBL.
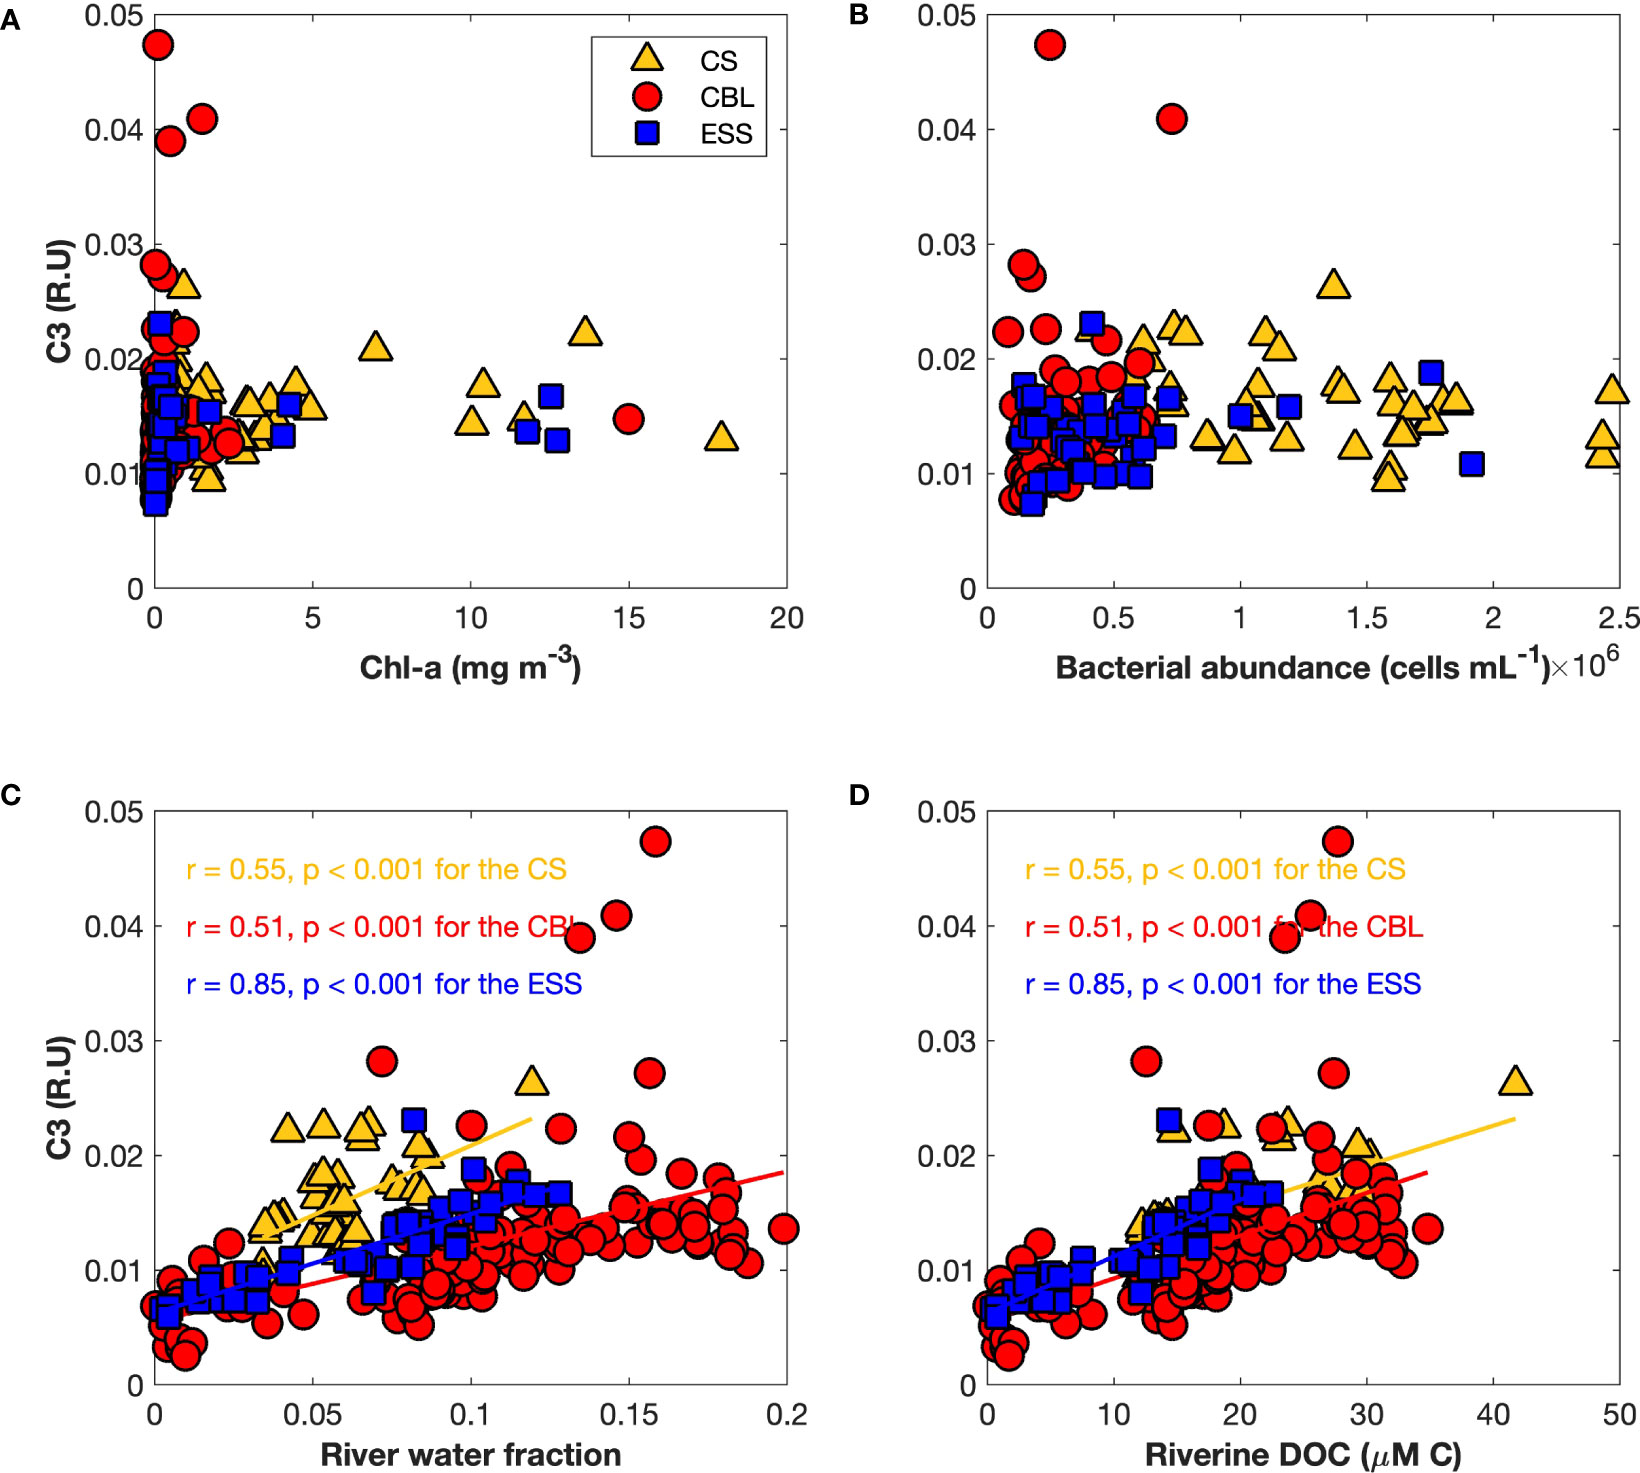
Figure 9 Relationships of the tryptophan-like FDOM (C3) (R.U.) with (A) chlorophyll-a (Chl-a) (mg m−3), (B) heterotrophic bacterial abundance (cells mL−1), (C) river water fraction, and (D) riverine dissolved organic carbon (μM C). The linear regression functions, correlation coefficients (r), and p-values (p) for the Chukchi Sea (CS, yellow triangles), Chukchi Borderland (CBL, red circles), and East Siberian Sea (ESS, blue squares) are shown.
4 Discussion
4.1 Source of humic-like FDOM
The upper 50 m of the water column in the Arctic Ocean is generally depleted of nutrients (PO43– < 1 μmol kg−1 and NO2– + NO3– < 3 μmol kg−1) during summer (Lee et al., 2012; Hioki et al., 2014; Coupel et al., 2015). However, higher concentrations of inorganic nutrients (up to 2 μmol kg−1 for PO43– and 15 μmol kg−1 for NO2– + NO3–) were observed in the upper 50 m of the ESS along transect 2 (Figures 3C, D), resulting in phytoplankton bloom (Figure 3F). The distributions of S and θ along transect 2 showed shoaling of the upper halocline layer, with doming of the isopycnals (Figures 3A, B). Moreover, the Atlantic-origin cold halocline water shoaled up to a depth of 80 m (Figure 3), which was shallower than the depths of 140–150 m where the Atlantic water is usually found (Jung et al., 2021a). This implied that shoaling of both the upper halocline layer and Pacific-origin water by the intrusion of Atlantic-origin cold halocline water triggered the supply of inorganic nutrients into the surface layer, thereby resulting in phytoplankton bloom. This was consistent with the result reported by Jung et al. (2021a), which suggested that the Atlantic-origin cold halocline water extended as far as the region of Chukchi Sea due to the strong cyclonic circulation, resulting in shoaling of the upper halocline layer.
Interestingly, the humic-like FDOM (C1 and C2) was remarkably high in the upper halocline layer with low N* values (Figures 2, 3, and 8). Since N* is known as the deviation of nitrate from the stoichiometric ratio of nitrate to phosphate (Gruber and Sarmiento, 1997), it is widely used to estimate the excess nitrate (e.g., nitrogen fixation) or nitrate deficit (e.g., denitrification) relative to phosphate. A positive N* value corresponds to high nitrogen input while a negative N* value is indicative of nitrogen deficiency from sediment denitrification and/or water column denitrification. Extremely low N* values (< –10 µmol kg-1) are rare, occurring in only approximately 3% of global measurements (Deutsch and Weber, 2012). The Bering and Chukchi seas are known as hotspots of sedimentary denitrification, resulting in an extremely low N* of approximately –10 µmol kg-1 (Devol et al., 1997; Tanaka et al., 2004; Yamamoto-Kawai et al., 2006; Chang and Devol, 2009; Brown et al., 2015). Therefore, the layer of high humic-like FDOM intensities with the lowest N* suggested that the humic-like FDOM was supplied from the shelf sediments. This finding was consistent with that of previous studies, which showed that the humic-like FDOM is released from shelf sediment during early diagenesis and then spread laterally along the upper halocline layer of the Arctic Ocean (Hioki et al., 2014; Chen et al., 2018).
In addition, the high intensities of humic-like FDOM in the surface layer (< 30 m) at station 26 (Figures 8B, D) coincided with the region where shoaling of the upper halocline layer was substantial. As reported in previous studies (Polyakov et al., 2017; Ardyna and Arrigo, 2020; Polyakov et al., 2020; Jung et al., 2021a), the impacts of climate change on the atmospheric circulation have significant implications on ocean circulation in the western Arctic Ocean. Observation and modeling results suggested the shift of ocean circulation to a more cyclonic state in the 1990s (Steele and Boyd, 1998; Johnson and Polyakov, 2001). In addition, Jung et al. (2021a) reported that the enhanced cyclonic winds in 2017 led to the intrusion of Atlantic-origin cold halocline water from the Eurasian seas into the Chukchi Sea along the shelf slope, resulting in shoaling of the Pacific-origin water into the euphotic zone. As a result of this intrusion of Atlantic-origin cold halocline water into the Chukchi Sea, high intensities of the humic-like FDOM were supplied to the euphotic zone with shoaling of the upper halocline layer, thereby causing an exposure of the humic-like FDOM to sunlight.
4.2 Source of tryptophan-like FDOM
Generally, tryptophan-like FDOM is known to be produced by biological activities, such as direct exudation from phytoplankton (Stedmon and Markager, 2005b; Romera-Castillo et al., 2010; Romera-Castillo et al., 2011), release during zooplankton grazing (Urban-Rich et al., 2004; Urban-Rich et al., 2006), production via heterotrophic bacterial processes (Moran et al., 2000; Rochelle-Newall and Fisher, 2002; Romera-Castillo et al., 2011; Chen et al., 2018), and photodegradation of humic-like DOM (Romera-Castillo et al., 2013). However, the tryptophan-like FDOM (C3) showed no significant relationships with Chl-a and heterotrophic bacterial abundance in this study (Figures 9A, B), suggesting that it could be associated with other sources and/or processes rather than with biological activities. Interestingly, higher fluorescence intensities of tryptophan-like FDOM were found in the CBL along transects 1 and 2 (Figures 8E, F), where the friver and riverine DOC were maximum (Figure 4) and Chl-a and heterotrophic bacterial abundance were low (Figures 2F, 3F, and 5). Furthermore, intensity of tryptophan-like FDOM was significantly positively correlated with friver and riverine DOC (Figures 9C, D), indicating that riverine input could be a source of tryptophan-like FDOM. This was consistent with the previous results observed in the Canada Basin (Dainard et al., 2019) and the East Siberian Sea (Drozdova et al., 2022). River runoff supplies large amounts of terrestrial DOM to the Arctic Ocean (Gordeev et al., 1996; Amon et al., 2012; Holmes et al., 2012; Anderson and Amon, 2015). For example, Opsahl et al. (1999) estimated that approximately 5–33% of DOM on the Arctic Ocean surface is of terrigenous origin. Terrestrial DOM pools consist of complex mixtures of compounds of varying ages (Raymond and Spencer, 2015). In addition, the PARAFAC-validation components cannot be attributed to only pure compounds, but also to a group of compounds that exhibit similar fluorescence properties as of pure compounds (Gao and Guéguen, 2017). This suggested that the FDOM components are a complex mixture of compounds that have overlapping absorption and emission spectra, with no single compound dominating. Stedmon and Markager (2005b) reported that tryptophan-like FDOM is linked to the degradation of terrestrial DOM. Previous studies (Maie et al., 2007; Hernes et al., 2009; Yamashita et al., 2017) had revealed that both propylphenol monomers and tannins, typical biomarkers of vascular plant, fluoresce in the region of the EEMs that is traditionally defined as the tryptophan-like region. In addition, Maie et al. (2007) had separated the tryptophan-like FDOM into two compounds using size exclusion chromatography, namely proteinaceous materials and phenolic moieties of humic substances. The finding showed that tryptophan-like FDOM consists of a mixture of compounds with different chemical structures, namely labile proteinaceous substances and phenolic moieties in the humic-like substances. Phenolic compounds are mainly derived from the breakdown of lignin, which is regarded as a biomarker for terrestrial organic matter (Saiz-Jimenez and Leeuw, 1986). Thus, higher intensities of tryptophan-like FDOM in the CBL suggested that tryptophan-like FDOM could be mainly derived from river discharge.
Further, the results of this study showed that the influences of friver and riverine DOC on tryptophan-like FDOM are region-dependent (Figures 9C, D). The high correlation coefficients between tryptophan-like FDOM and friver and riverine DOC in the ESS indicated that tryptophan-like FDOM in the ESS could be mainly regulated by a riverine source. In contrast, the low correlation coefficients in the CS and CBL suggested that there is an additional mechanism for regulating the relationship between tryptophan-like FDOM and friver and riverine DOC in the CS and CBL. A possible explanation for this difference could be in terms of biological activities. Along transect 2 across the ESS and CBL, heterotrophic bacterial abundance was higher in the ESS than in the CBL. Tryptophan-like FDOM is significantly correlated with the percent of biodegradable organic carbon (Fellman et al., 2009; Hood et al., 2009) that is rapidly consumed by bacteria in the surface waters (Rich et al., 1996; Ogawa et al., 2001; Mathew et al., 2021). Furthermore, Lønborg et al. (2015) reported that the tryptophan-like FDOM decayed by 30% after 72 h of incubation in the darkness. Therefore, the labile proteinaceous substance may be inferred to be consumed by the high abundance of heterotrophic bacteria in the ESS, while the phenolic moieties originating from river water remained, resulting in the high correlation coefficients in the relationships between tryptophan-like FDOM and river water parameters (i.e., friver and riverine DOC) in the ESS.
4.3 Potential fate of FDOM under ongoing Arctic marine environmental changes
The DOM cycling in the Arctic marine system can be impacted by various environmental changes, such as increase in river discharge (Peterson et al., 2002; Holmes et al., 2021), decline in sea ice coverage (Cavalieri and Parkinson, 2012; Meier et al., 2021), modifications of water mass structures resulting from changes in the ocean circulation system (Polyakov et al., 2017; Polyakov et al., 2020), and increase in net primary production (Ardyna and Arrigo, 2020). For example, the reduction in sea ice coverage has led to an increase in open water area and prolonged duration of sea ice-free conditions, allowing for increased penetration of solar radiation into the Arctic Ocean (Nicolaus et al., 2012). In addition to the reduced sea ice coverage, the increase in river discharge can lead to a freshening of the Arctic Ocean, resulting in a longer residence time caused by stratification, which provides favorable conditions for the photochemical processes of DOM (Osburn et al., 2014). Previous studies have revealed that humic-like FDOM is susceptible to photodegradation (Vecchio and Blough, 2002; Jørgensen et al., 2014; Logvinova et al., 2015). Photodegradation of high-molecular-weight DOM typically leads to a decrease in the average molecular weight of DOM, consequently resulting in an increase in S275–295 (Helms et al., 2008; Lu et al., 2016). Helms et al. (2008) reported an increase in S275–295 values during the course of irradiation, indicating a decrease in the molecular weight of DOM due to the photodegradation of high-molecular-weight DOM. Similarly, Lu et al. (2016) observed a gradual increase in S275–295 values from 0.014 nm–1 on day 0 to 0.027 nm–1 on day 62 as the irradiation progressed. Thus, S275–295 values have been widely used as a reliable proxy of DOM molecular weight and photochemical processes (Helms et al., 2008; Fichot and Benner, 2012; Granskog, 2012; Granskog et al., 2012; Dainard and Guéguen, 2013; Helms et al., 2013; Yamashita et al., 2013b; Lee et al., 2016; Shen et al., 2016a; Johnston et al., 2018; Hirawake et al., 2021). In this study, we found that the humic-like FDOM derived from the shelf sediments was supplied to the euphotic zone through shoaling of the upper halocline layer due to the intrusion of Atlantic-origin cold halocline water into the CBL, thus exposing the humic-like FDOM to sunlight (Figures 8B, D). This claim can be supported by the observation of the lowest S275–295 value, along with high fluorescent intensity values of the humic-like FDOM in the surface water at station 26 (Figures 1, 7), where shoaling of the upper halocline layer was observed (Figures 3A–E). The occurrence of the lowest S275–295 value, coupled with the high fluorescent intensity values of the humic-like FDOM in the surface water of the CBL, provides strong evidence for the transport of high-molecular-weight DOM to the surface water as a consequence of shoaling of the upper halocline layer. Moreover, we observed elevated S275–295 values and reduced fluorescence intensities of the humic-like FDOM in the surface water of the eastern stations in the CBL, in contrast to the CS and ESS (Figures 7A, B, D). Given the susceptibility of high-molecular-weight DOM to photodegradation (Vecchio and Blough, 2002; Jørgensen et al., 2014; Logvinova et al., 2015), these results strongly support the occurrence of DOM photodegradation, which is likely enhanced in the highly stratified surface waters with a prolonged residence time in the region influenced by the Beaufort Gyre. Similarly, Shen et al. (2016a) reported elevated S275–295 values in the surface waters of the Beaufort Gyre, suggesting significant DOM removal through photodegradation, which was facilitated by a longer residence time in the region. In addition, the conversion of humic-like FDOM to low-molecular-weight DOM through photodegradation increases its bioavailability (Tranvik and Bertilsson, 2001; Logvinova et al., 2015; Wilske et al., 2020). This process can also contribute to enhancing bacterioplankton productivity (Logvinova et al., 2015). Previous studies (Nakayama et al., 2011; Hioki et al., 2014) had revealed that inorganic nutrients and dissolved iron, as well as the humic-like FDOM, are supplied from shelf sediment and transported through the upper halocline layer in the Arctic Ocean. Considering that the supply of sufficient dissolved iron and inorganic nutrients to the euphotic zone can lead to an increase in primary production, the transport of these constituents to the euphotic zone by shoaling of the upper halocline layer, coupled with the transformation of the humic-like FDOM into low-molecular-weight DOM through photodegradation, could result in the consumption of humic-like FDOM by microbial and/or photochemical degradation along with fresh DOM produced by primary production (Shen and Benner, 2018). Furthermore, photodegradation of DOM can lead to the production of inorganic carbon forms, CO and CO2 (Mopper et al., 1991; Helms et al., 2008). Consequently, our results highlight that the transport of the humic-like FDOM to the euphotic zone due to a change in ocean circulation pattern has the potential to impact the marine carbon and biogeochemical cycles in the western Arctic Ocean.
As the Arctic Ocean continues to warm, the projected increase in river discharge (Peterson et al., 2002; Holmes et al., 2021) will introduce phenolic compounds directly leached from terrestrial plant materials (Benner et al., 1990; Hernes et al., 2001) into the Arctic Ocean. The mobilization of these plant-derived materials has increased by up to 6% from 1985 to 2004 (Feng et al., 2013) and is expected to increase further under the current warming trends (Amon et al., 2012). In addition, Bertosio et al. (2022) reported that the Beaufort Gyre, the major reservoir of Arctic freshwater, extended northward, and freshwater content increased in the central Arctic from 2012 onward due to changes in atmospheric circulation patterns. Thus, additional tryptophan-like FDOM (i.e., phenolic moieties) (Figure 9) could be introduced into the Arctic surface waters via river discharge and carried further north. Moreover, Müller et al. (2018), who reported the effects of terrestrial-derived DOM on marine microbial community composition, suggested that the addition of terrestrial-derived DOM to seawater samples induces changes in bacterial community composition, leading to an increase in bacterivorous grazing by small protists. This implies that the supply of tryptophan-like FDOM via river discharge may have an impact not only on bacteria but also on higher trophic levels of the microbial food webs indirectly.
Furthermore, a long-term study utilizing an ocean color algorithm parameterized for the Arctic Ocean revealed that primary production, particularly along the interior shelf break, increased by 57% between 1998 and 2018 as a result of melting sea ice and the consequent amplification of phytoplankton biomass (Lewis et al., 2020). The increase in Arctic primary production has the potential to further enhance the supply of tryptophan-like FDOM (i.e., labile proteinaceous substances). This was supported by DeFrancesco and Guéguen (2021), who reported a significant increase in protein-like FDOM in the upper polar mixed layer of the central Canada Basin between 2007 and 2017. Because labile tryptophan-like FDOM is strongly correlated with the percent of biodegradable organic carbon (Fellman et al., 2009; Hood et al., 2009) that is rapidly consumed by bacteria (Rich et al., 1996; Ogawa et al., 2001; Hansell, 2013; Mathew et al., 2021), the increased supply of labile tryptophan-like FDOM is expected to provide a significant amount of biodegradable organic carbon. This, in turn, can induce changes in the quantity and quality of DOM in the Arctic Ocean.
FDOM, a sub-fraction of chromophoric DOM (CDOM), absorbs visible radiation and consequently contributes to the heating of surface waters (Kirk, 1988; Hill, 2008). Hill (2008) reported that elevated CDOM concentrations can lead to the trapping of radiant heat in the mixed layer of the water column. Thus, the enhanced supply of humic-like FDOM originating from the shelf sediment through shoaling of the upper halocline layer, as well as tryptophan-like FDOM derived from marine primary production and river discharge (i.e., both labile proteinaceous substances and phenolic moieties) to the euphotic zone can also affect the heat budget in the Arctic Ocean. However, it is worth noting that these FDOM components are subject to processes such as photodegradation and bacterial consumption, which can alter their concentrations and influence their impact on the heat budget. Nevertheless, the potentially photobleaching-resistant fractions of humic-like FDOM, along with the less photolabile tryptophan-like FDOM, can enhance the absorption of solar energy and trap additional heat in the mixed layer, thus potentially affecting the heating budget of Arctic surface waters (Yang et al., 2020). Thus, our results suggest that the increased supply of humic-like and tryptophan-like FDOM to the euphotic zone could potentially impact the dynamics of marine food webs, DOM cycling, and the heating budget in the western Arctic Ocean.
5 Conclusion
We, herein, investigated the distributions, sources, and fates of FDOM in the western Arctic Ocean. Consistent with previous studies conducted in the western Arctic Ocean, the humic-like FDOM was found to be supplied from the shelf sediment and then spread laterally in the upper halocline layer. We found that the high values of inorganic nutrients and humic-like FDOM in the euphotic zone (approximately 30 m) were due to shoaling of the upper halocline layer. Exposure of the humic-like FDOM to solar radiation and consequent photodegradation of the same could result in CO2 release back to the atmosphere and increase in bioavailability of DOM through the transformation of humic-rich DOM into low-molecular-weight DOM (Tranvik and Bertilsson, 2001; Logvinova et al., 2015; Wilske et al., 2020). We further observed high intensities of tryptophan-like FDOM in the CBL, where friver and riverine DOC were maximum, and relatively low levels of Chl-a and heterotrophic bacterial abundance. Intensities of the tryptophan-like FDOM were positively correlated with friver and riverine DOC, suggesting that the former in the western Arctic Ocean could originate from river discharge. In addition, the correlation coefficients of tryptophan-like FDOM with friver and riverine DOC were found to be region-dependent. Maie et al. (2007) had discovered that tryptophan-like FDOM comprises not only of proteinaceous materials but also of phenolic moieties of humic substances; therefore, tryptophan-like FDOM in the western Arctic Ocean could be inferred to likely be a mixture of proteinaceous materials and phenolic moieties originating from river runoff. Consequently, the strong correlation between tryptophan-like FDOM and river water parameters in the ESS, where there is a high abundance of heterotrophic bacteria, could imply that the labile proteinaceous substance is consumed by bacteria, leading to the retention of phenolic moieties from the river water.
Given the ongoing climate change in the western Arctic Ocean, water mass structures are expected to be modified (Polyakov et al., 2017; Polyakov et al., 2020). Shoaling of the upper halocline layer, observed in our study region (Jung et al., 2021a; Jung et al., 2022), had the potential to supply humic-like FDOM to the euphotic zone. Thus, photodegradation of the humic-like FDOM, combined with the supply of inorganic nutrients to the surface layer, could enhance marine primary productivity in the western Arctic Ocean. In addition, increase in river discharge (Peterson et al., 2002; Holmes et al., 2021) and phytoplankton biomass (Lewis et al., 2020) due to climate change are likely to enhance the supply of tryptophan-like FDOM (including both phenolic moieties and labile proteinaceous substances). Our findings suggested that the supply of FDOM can continuously increase in response to climate change; increase in the supply of FDOM to the surface waters of the Arctic Ocean could impact the DOC pool, even though FDOM is a small fraction of the total DOC pool (Coble, 2007). Therefore, further research, including long-term in situ observations of FDOM, would be essential in order to gain a more profound understanding of how climate change in the western Arctic Ocean may impact the dynamics of DOM cycling.
Data availability statement
The raw data supporting the conclusions of this article will be made available by the authors, without undue reservation.
Author contributions
MJ conducted the experiments, processed the data, and wrote the original draft. JJ designed the research and contributed to the conceptualization and reviewing of the original draft. MP contributed to supervision and reviewing of the original draft. K-HC and YL contributed to the scientific discussion and paper correction. EY and S-HK organized the field campaign and contributed to the funding acquisition, scientific discussion, and paper correction. All authors contributed to the article and approved the submitted version.
Funding
This research was supported by Korea Institute of Marine Science & Technology Promotion (KIMST) funded by the Ministry of Oceans and Fisheries (20210605, Korea-Arctic Ocean Warming and Response of Ecosystem, KOPRI).
Acknowledgments
We are grateful to the captain and crew of the IBR/V Araon for their enthusiastic assistance during the ARA10B cruise. We thank the reviewers and the editor for their constructive comments on the manuscript.
Conflict of interest
The authors declare that the research was conducted in the absence of any commercial or financial relationships that could be construed as a potential conflict of interest.
Publisher’s note
All claims expressed in this article are solely those of the authors and do not necessarily represent those of their affiliated organizations, or those of the publisher, the editors and the reviewers. Any product that may be evaluated in this article, or claim that may be made by its manufacturer, is not guaranteed or endorsed by the publisher.
Supplementary material
The Supplementary Material for this article can be found online at: https://www.frontiersin.org/articles/10.3389/fmars.2023.1199893/full#supplementary-material
References
Abbott B. W., Larouche J. R., Jones J. B., Bowden W. B., Balser A. W. (2014). Elevated dissolved organic carbon biodegradability from thawing and collapsing permafrost. J. Geophys. Res. 119, 2049–2063. doi: 10.1002/2014JG002678
Alkire M. B., Rember R., Polyakov I. (2019). Discrepancy in the identification of the Atlantic/Pacific front in the central Arctic ocean: NO versus nutrient relationships. Geophys. Res. Lett. 46, 3843–3852. doi: 10.1029/2018gl081837
Amon R. M. W. (2004). “The role of dissolved organic matter for the organic carbon cycle in the Arctic ocean,” in The organic carbon cycle in the Arctic ocean. Eds. Stein R., MacDonald R. W. (Berlin, Heidelberg: Springer Berlin Heidelberg), 83–99. doi: 10.1007/978-3-642-18912-8_4
Amon R. M. W., Meon B. (2004). The biogeochemistry of dissolved organic matter and nutrients in two large Arctic estuaries and potential implications for our understanding of the Arctic ocean system. Mar. Chem. 92, 311–330. doi: 10.1016/j.marchem.2004.06.034
Amon R. M. W., Rinehart A. J., Duan S., Louchouarn P., Prokushkin A., Guggenberger G., et al. (2012). Dissolved organic matter sources in large Arctic rivers. Geochim. Cosmochim. Acta 94, 217–237. doi: 10.1016/j.gca.2012.07.015
Anderson L. G., Amon R. M. W. (2015). “DOM in the Arctic ocean,” in Biogeochemistry of marine dissolved organic matter, 2nd ed. Eds. Hansell D. A., Carlson C. A. (Boston: Academic Press), 609–633. doi: 10.1016/b978-0-12-405940-5.00014-5
Ardyna M., Arrigo K. R. (2020). Phytoplankton dynamics in a changing Arctic ocean. Nat. Clim. Change 10, 892–903. doi: 10.1038/s41558-020-0905-y
Aslam S. N., Underwood G. J. C., Kaartokallio H., Norman L., Autio R., Fischer M., et al. (2012). Dissolved extracellular polymeric substances (dEPS) dynamics and bacterial growth during sea ice formation in an ice tank study. Polar Biol. 35, 661–676. doi: 10.1007/s00300-011-1112-0
Ballinger T. J., Overland J. E., Wang M., Bhatt U. S., Brettschneider B., Hanna E., et al. (2021)Surface air temperature. In: Arctic Report card 2021. Available at: https://arctic.noaa.gov/Report-Card/Report-Card-2021 (Accessed May 30, 2022).
Benner R., Weliky K., Hedges J. I. (1990). Early diagenesis of mangrove leaves in a tropical estuary: molecular-level analyses of neutral sugars and lignin-derived phenols. Geochim. Cosmochim. Acta 54, 1991–2001. doi: 10.1016/0016-7037(90)90267-o
Bertosio C., Provost C., Athanase M., Sennéchael N., Garric G., Lellouche J., et al. (2022). Changes in freshwater distribution and pathways in the Arctic ocean since 2007 in the Mercator ocean global operational system. J. Geophys. Res.: Oceans 127, e2021JC017701. doi: 10.1029/2021jc017701
Brogi S. R., Ha S.-H., Kim K., Derrien M., Lee Y. K., Hur J. (2018). Optical and molecular characterization of dissolved organic matter (DOM) in the Arctic ice core and the underlying seawater (Cambridge bay, canada): implication for increased autochthonous DOM during ice melting. Sci. Total Environ. 627, 802–811. doi: 10.1016/j.scitotenv.2018.01.251
Brogi S. R., Jung J. Y., Ha S.-Y., Hur J. (2019). Seasonal differences in dissolved organic matter properties and sources in an Arctic fjord: implications for future conditions. Sci. Total Environ. 694, 133740. doi: 10.1016/j.scitotenv.2019.133740
Brown Z. W., Casciotti K. L., Pickart R. S., Swift J. H., Arrigo K. R. (2015). Aspects of the marine nitrogen cycle of the chukchi Sea shelf and Canada basin. Deep Sea Res. Part II Top. Stud. Oceanogr. 118, 73–87. doi: 10.1016/j.dsr2.2015.02.009
Burdige D. J., Kline S. W., Chen W. (2004). Fluorescent dissolved organic matter in marine sediment pore waters. Mar. Chem. 89, 289–311. doi: 10.1016/j.marchem.2004.02.015
Cammack W. K. L., Kalff J., Prairie Y. T., Smith E. M. (2004). Fluorescent dissolved organic matter in lakes: relationships with heterotrophic metabolism. Limnol. Oceanogr. 49, 2034–2045. doi: 10.4319/lo.2004.49.6.2034
Castillo C. E. D., Coble P. G. (2000). Seasonal variability of the colored dissolved organic matter during the 1994–95 NE and SW monsoons in the Arabian Sea. Deep Sea Res. Part II Top. Stud. Oceanogr. 47, 1563–1579. doi: 10.1016/s0967-0645(99)00154-x
Castillo C. E. D., Coble P. G., Morell J. M., López J. M., Corredor J. E. (1999). Analysis of the optical properties of the Orinoco river plume by absorption and fluorescence spectroscopy. Mar. Chem. 66, 35–51. doi: 10.1016/s0304-4203(99)00023-7
Catalá T. S., Reche I., Fuentes-Lema A., Romera-Castillo C., Nieto-Cid M., Ortega-Retuerta E., et al. (2015). Turnover time of fluorescent dissolved organic matter in the dark global ocean. Nat. Commun. 6, 5986. doi: 10.1038/ncomms6986
Cauwet C., Sidorov I. (1996). The biogeochemistry of Lena river: organic carbon and nutrients distribution. Mar. Chem. 53, 211–217. doi: 10.1016/0304-4203(95)00090-9
Cavalieri D. J., Parkinson C. L. (2012). Arctic Sea ice variability and trends 1979–2010. Cryosphere 6, 881–889. doi: 10.5194/tc-6-881-2012
Chang B. X., Devol A. H. (2009). Seasonal and spatial patterns of sedimentary denitrification rates in the chukchi sea. Deep Sea Res. Part II Top. Stud. Oceanogr. 56, 1339–1350. doi: 10.1016/j.dsr2.2008.10.024
Chen M., Jung J., Lee Y. K., Hur J. (2018). Surface accumulation of low molecular weight dissolved organic matter in surface waters and horizontal off-shelf spreading of nutrients and humic-like fluorescence in the chukchi Sea of the Arctic ocean. Sci. Total Environ. 639, 624–632. doi: 10.1016/j.scitotenv.2018.05.205
Chen M., Kim J.-H., Nam S.-I., Niessen F., Hong W.-L., Kang M.-H., et al. (2016). Production of fluorescent dissolved organic matter in Arctic ocean sediments. Sci. Rep. 6, 39213. doi: 10.1038/srep39213
Chen M., Nam S.-I., Kim J.-H., Kwon Y.-J., Hong S., Jung J., et al. (2017). High abundance of protein-like fluorescence in the amerasian basin of Arctic ocean: potential implication of a fall phytoplankton bloom. Sci. Total Environ. 599, 355–363. doi: 10.1016/j.scitotenv.2017.04.233
Coble P. G. (1996). Characterization of marine and terrestrial DOM in seawater using excitation-emission matrix spectroscopy. Mar. Chem. 51, 325–346. doi: 10.1016/0304-4203(95)00062-3
Coble P. G. (2007). Marine optical biogeochemistry: the chemistry of ocean color. Chem. Rev. 107, 402–418. doi: 10.1021/cr050350+
Codispoti L. A., Flagg C., Kelly V., Swift J. H. (2005). Hydrographic conditions during the 2002 SBI process experiments. Deep Sea Res. Part II Top. Stud. Oceanogr. 52, 3199–3226. doi: 10.1016/j.dsr2.2005.10.007
Codispoti L. A., Flagg C. N., Swift J. H. (2009). Hydrographic conditions during the 2004 SBI process experiments. Deep Sea Res. Part II Top. Stud. Oceanogr. 56, 1144–1163. doi: 10.1016/j.dsr2.2008.10.013
Cooper L. W., McClelland J. W., Holmes R. M., Raymond P. A., Gibson J. J., Guay C. K., et al. (2008). Flow-weighted values of runoff tracers (δ18O, DOC, ba, alkalinity) from the six largest Arctic rivers. Geophys. Res. Lett. 35, L18606. doi: 10.1029/2008gl035007
Coupel P., Ruiz-Pino D., Sicre M. A., Chen J. F., Lee S. H., Schiffrine N., et al. (2015). The impact of freshening on phytoplankton production in the pacific Arctic ocean. Prog. Oceanogr. 131, 113–125. doi: 10.1016/j.pocean.2014.12.003
Dainard P. G., Guéguen C. (2013). Distribution of PARAFAC modeled CDOM components in the North Pacific Ocean, Bering, chukchi and Beaufort seas. Mar. Chem. 157, 216–223. doi: 10.1016/j.marchem.2013.10.007
Dainard P. G., Guéguen C., Yamamoto-Kawai M., Williams W. J., Hutchings J. K. (2019). Interannual variability in the absorption and fluorescence characteristics of dissolved organic matter in the Canada basin polar mixed waters. J. Geophys. Res.: Oceans 124, 5258–5269. doi: 10.1029/2018jc014896
Danielson S. L., Eisner L., Ladd C., Mordy C., Sousa L., Weingartner T. J. (2017). A comparison between late summer 2012 and 2013 water masses, macronutrients, and phytoplankton standing crops in the Northern Bering and Chukchi seas. Deep Sea Res. Part II Top. Stud. Oceanogr. 135, 7–26. doi: 10.1016/j.dsr2.2016.05.024
DeFrancesco C., Guéguen C. (2021). Long-term trends in dissolved organic matter composition and its relation to sea ice in the Canada basin, Arctic ocean (2007–2017). J. Geophys. Res.: Oceans 126, e2020JC016578. doi: 10.1029/2020jc016578
Determann S., Lobbes J. M., Reuter R., Rullkötter J. (1998). Ultraviolet fluorescence excitation and emission spectroscopy of marine algae and bacteria. Mar. Chem. 62, 137–156. doi: 10.1016/s0304-4203(98)00026-7
Determann S., Reuter R., Wagner P., Willkomm R. (1994). Fluorescent matter in the eastern Atlantic ocean. part 1: method of measurement and near-surface distribution. Deep Sea Res. Part I: Oceanogr. Res. Pap. 41, 659–675. doi: 10.1016/0967-0637(94)90048-5
Deutsch C., Weber T. (2012). Nutrient ratios as a tracer and driver of ocean biogeochemistry. Annu. Rev. Mar. Sci. 4, 113–141. doi: 10.1146/annurev-marine-120709-142821
Devol A. H., Codispoti L. A., Christensen J. P. (1997). Summer and winter denitrification rates in Western Arctic shelf sediments. Cont. Shelf Res. 17, 1029–1050. doi: 10.1016/s0278-4343(97)00003-4
Dittmar T., Kattner G. (2003). The biogeochemistry of the river and shelf ecosystem of the Arctic ocean: a review. Mar. Chem. 83, 103–120. doi: 10.1016/s0304-4203(03)00105-1
Drozdova A. N., Krylov I. N., Nedospasov A. A., Arashkevich E. G., Labutin T. A. (2022). Fluorescent signatures of autochthonous dissolved organic matter production in Siberian shelf seas. Front. Mar. Sci. 9. doi: 10.3389/fmars.2022.872557
Fellman J. B., Hood E., D’Amore D. V., Edwards R. T., White D. (2009). Seasonal changes in the chemical quality and biodegradability of dissolved organic matter exported from soils to streams in coastal temperate rainforest watersheds. Biogeochemistry 95, 277–293. doi: 10.1007/s10533-009-9336-6
Feng X., Vonk J. E., van Dongen B. E., Gustafsson Ö., Semiletov I. P., Dudarev O. V., et al. (2013). Differential mobilization of terrestrial carbon pools in Eurasian Arctic river basins. Proc. Natl. Acad. Sci. U. S. A. 110, 14168–14173. doi: 10.1073/pnas.1307031110
Fichot C. G., Benner R. (2012). The spectral slope coefficient of chromophoric dissolved organic matter (S275–295) as a tracer of terrigenous dissolved organic carbon in river-influenced ocean margins. Limnol. Oceanogr. 57, 1453–1466. doi: 10.4319/lo.2012.57.5.1453
Frey K. E., McClelland J. W. (2009). Impacts of permafrost degradation on arctic river biogeochemistry. Hydrol. Process. 23, 169–182. doi: 10.1002/hyp.7196
Gao Z., Guéguen C. (2017). Size distribution of absorbing and fluorescing DOM in Beaufort Sea, Canada basin. Deep Sea Res. Part I: Oceanogr. Res. Pap. 121, 30–37. doi: 10.1016/j.dsr.2016.12.014
Gao T., Kang S., Chen R., Zhang T., Zhang T., Han C., et al. (2019). Riverine dissolved organic carbon and its optical properties in a permafrost region of the upper heihe river basin in the Northern Tibetan Plateau. Sci. total Environ. 686, 370–381. doi: 10.1016/j.scitotenv.2019.05.478
Gonçalves-Araujo R., Granskog M. A., Bracher A., Azetsu-Scott K., Dodd P. A., Stedmon C. A. (2016). Using fluorescent dissolved organic matter to trace and distinguish the origin of Arctic surface waters. Sci. Rep. 6, 33978. doi: 10.1038/srep33978
Gonçalves-Araujo R., Stedmon C. A., Heim B., Dubinenkov I., Kraberg A., Moiseev D., et al. (2015). From fresh to marine waters: characterization and fate of dissolved organic matter in the Lena river delta region, Siberia. Front. Mar. Sci. 2. doi: 10.3389/fmars.2015.00108
Gordeev V. V., Martin J. M., Sidorov I. S., Sidorova M. V. (1996). A reassessment of the Eurasian river input of water, sediment, major elements, and nutrients to the Arctic ocean. Am. J. Sci. 296, 664–691. doi: 10.2475/ajs.296.6.664
Gordon L. I., Jennings J. C. Jr, Ross A. A., Krest J. M. (1993). A suggested protocol for continuous flow automated analysis of seawater nutrients (phosphate, nitrate, nitrite and silicic acid) in the WOCE hydrographic program and the joint global ocean fluxes study. Methods Manual WHPO, 91–91.
Granskog M. A. (2012). Changes in spectral slopes of colored dissolved organic matter absorption with mixing and removal in a terrestrially dominated marine system (Hudson bay, Canada). Mar. Chem. 134–135, 10–17. doi: 10.1016/j.marchem.2012.02.008
Granskog M. A., Kaartokallio H., Thomas D. N., Kuosa H. (2005). The influence of freshwater inflow on the inorganic nutrient and dissolved organic matter within coastal sea ice and underlying waters in the gulf of Finland (Baltic Sea). Estuar. Coast. Shelf Sci. 65, 109–122. doi: 10.1016/j.ecss.2005.05.011
Granskog M. A., Stedmon C. A., Dodd P. A., Amon R. M. W., Pavlov A. K., Steur L., et al. (2012). Characteristics of colored dissolved organic matter (CDOM) in the Arctic outflow in the fram strait: assessing the changes and fate of terrigenous CDOM in the Arctic ocean. J. Geophys. Res.: Oceans 117, C12021. doi: 10.1029/2012jc008075
Green S. A., Blough N. V. (1994). Optical absorption and fluorescence properties of chromophoric dissolved organic matter in natural waters. Limnol. Oceangr. 39, 1903–1916. doi: 10.4319/lo.1994.39.8.1903
Gruber N., Sarmiento J. L. (1997). Global patterns of marine nitrogen fixation and denitrification. Global Biogeochem. Cycles 11, 235–266. doi: 10.1029/97gb00077
Guéguen C., Guo L., Yamamoto-Kawai M., Tanaka N. (2007). Colored dissolved organic matter dynamics across the shelf-basin interface in the Western Arctic Ocean. J. Geophys. Res.: Oceans 112, C05038. doi: 10.1029/2006jc003584
Guéguen C., Itoh M., Kikuchi T., Eert J., Williams W. J. (2015). Variability in dissolved organic matter optical properties in surface waters in the amerasian basin. Front. Mar. Sci. 2. doi: 10.3389/fmars.2015.00078
Guéguen C., McLaughlin F. A., Carmack E. C., Itoh M., Narita H., Nishino S. (2012). The nature of colored dissolved organic matter in the Southern Canada basin and East Siberian Sea. Deep Sea Res. Part II Top. Stud. Oceanogr. 81, 102–113. doi: 10.1016/j.dsr2.2011.05.004
Hansell D. A. (2013). Recalcitrant dissolved organic carbon fractions. Ann. Rev. Mar. Sci. 5, 421–445. doi: 10.1146/annurev-marine-120710-100757
Heller M. I., Gaiero D. M., Croot P. L. (2013). Basin scale survey of marine humic fluorescence in the Atlantic: relationship to iron solubility and H2O2. Global Biogeochem. Cycles 27, 88–100. doi: 10.1029/2012gb004427
Helms J. R., Stubbins A., Perdue E. M., Green N. W., Chen H., Mopper K. (2013). Photochemical bleaching of oceanic dissolved organic matter and its effect on absorption spectral slope and fluorescence. Mar. Chem. 155, 81–91. doi: 10.1016/j.marchem.2013.05.015
Helms J. R., Stubbins A., Ritchie J. D., Minor E. C., Kieber D. J., Mopper K. (2008). Absorption spectral slopes and slope ratios as indicators of molecular weight, source, and photobleaching of chromophoric dissolved organic matter. Limnol. Oceanogr. 53, 955–969. doi: 10.4319/lo.2008.53.3.0955
Hernes P. J., Benner R., Cowie G. L., Gonãi M. A., Bergamaschi B. A., Hedges J. I. (2001). Tannin diagenesis in mangrove leaves from a tropical estuary: a novel molecular approach. Geochim. Cosmochim. Acta 65, 3109–3122. doi: 10.1016/S0016-7037(01)00641-x
Hernes P. J., Bergamaschi B. A., Eckard R. S., Spencer R. G. M. (2009). Fluorescence-based proxies for lignin in freshwater dissolved organic matter. J. Geophys. Res.: Biogeosci. 114, G00F03. doi: 10.1029/2009jg000938
Hill V. J. (2008). Impacts of chromophoric dissolved organic material on surface ocean heating in the chukchi Sea. J. Geophys. Res. 113, C07024. doi: 10.1029/2007jc004119
Hioki N., Kuma K., Morita Y., Sasayama R., Ooki A., Kondo Y., et al. (2014). Laterally spreading iron, humic-like dissolved organic matter and nutrients in cold, dense subsurface water of the Arctic ocean. Sci. Rep. 4, 6775. doi: 10.1038/srep06775
Hirawake T., Oida J., Yamashita Y., Waga H., Abe H., Nishioka J., et al. (2021). Water mass distribution in the Northern Bering and Southern Chukchi seas using light absorption of chromophoric dissolved organic matter. Prog. Oceanogr. 197, 102641. doi: 10.1016/j.pocean.2021.102641
Holmes R. M., McClelland J. W., Peterson B. J., Tank S. E., Bulygina E., Eglinton T. I., et al. (2012). Seasonal and annual fluxes of nutrients and organic matter from large rivers to the Arctic ocean and surrounding seas. Estuaries Coast. 35, 369–382. doi: 10.1007/s12237-011-9386-6
Holmes R. M., McClelland J. W., Raymond P. A., Frazer B. B., Peterson B. J., Stieglitz M. (2008). Lability of DOC transported by alaskan rivers to the Arctic ocean. Geophys. Res. Lett. 35, L03402. doi: 10.1029/2007GL032837
Holmes R. M., Shiklomanov A. I., Suslova A., Tretiakov M., McClelland J. W., Scott L., et al. (2021)River discharge. In: Arctic Report card 2021. Available at: https://arctic.noaa.gov/Report-Card/Report-Card-2021 (Accessed April 27, 2022).
Hood E., Fellman J., Spencer R. G. M., Hernes P. J., Edwards R., D’Amore D., et al. (2009). Glaciers as a source of ancient and labile organic matter to the marine environment. Nature 462, 1044–1047. doi: 10.1038/nature08580
Ishii S. K. L., Boyer T. H. (2012). Behavior of reoccurring PARAFAC components in fluorescent dissolved organic matter in natural and engineered systems: a critical review. Environ. Sci. Technol. 46, 2006–2017. doi: 10.1021/es2043504
Itoh M., Pickart R. S., Kikuchi T., Fukamachi Y., Ohshima K. I., Simizu D., et al. (2015). Water properties, heat and volume fluxes of pacific water in Barrow canyon during summer 2010. Deep Sea Res. Part I: Oceanogr. Res. Pap. 102, 43–54. doi: 10.1016/j.dsr.2015.04.004
Jeon M. H., Jung J., Park M. O., Aoki S., Kim T.-W., Kim S.-K. (2021). Tracing circumpolar deep water and glacial meltwater using humic-like fluorescent dissolved organic matter in the amundsen Sea, Antarctica. Mar. Chem. 235, 104008. doi: 10.1016/j.marchem.2021.104008
Johnson M. A., Polyakov I. V. (2001). The laptev Sea as a source for recent Arctic ocean salinity changes. Geophys. Res. Lett. 28, 2017–2020. doi: 10.1029/2000gl012740
Johnston S. E., Shorina N., Bulygina E., Vorobjeva T., Chupakova A., Klimov S. I., et al. (2018). Flux and seasonality of dissolved organic matter from the Northern Dvina (Severnaya Dvina) River, Russia. J. Geophys. Res.: Biogeosci. 123, 1041–1056. doi: 10.1002/2017jg004337
Jørgensen L., Stedmon C. A., Granskog M. A., Middelboe M. (2014). Tracing the long-term microbial production of recalcitrant fluorescent dissolved organic matter in seawater. Geophys. Res. Lett. 41, 2481–2488. doi: 10.1002/2014gl059428
Jørgensen L., Stedmon C. A., Kaartokallio H., Middelboe M., Thomas D. N. (2015). Changes in the composition and bioavailability of dissolved organic matter during sea ice formation. Limnol. Oceanogr. 60, 817–830. doi: 10.1002/lno.10058
Jung J., Cho K., Park T., Yoshizawa E., Lee Y., Yang E. J., et al. (2021a). Atlantic-Origin cold saline water intrusion and shoaling of the nutricline in the pacific Arctic. Geophys. Res. Lett. 48, e2020GL090907. doi: 10.1029/2020gl090907
Jung J., Lee Y., Cho K.-H., Yang E. J., Kang S.-H. (2022). Spatial distributions of riverine and marine dissolved organic carbon in the Western Arctic Ocean: results from the 2018 Korean expedition. J. Geophys. Res.: Oceans 127, e2021JC017718. doi: 10.1029/2021JC017718
Jung J., Son J. E., Lee Y. K., Cho K.-H., Lee Y., Yang E. J., et al. (2021b). Tracing riverine dissolved organic carbon and its transport to the halocline layer in the Chukchi Sea (Western Arctic Ocean) using humic-like fluorescence fingerprinting. Sci. Total Environ. 772, 145542. doi: 10.1016/j.scitotenv.2021.145542
Kaiser K., Benner R., Amon R. M. W. (2017a). The fate of terrigenous dissolved organic carbon on the Eurasian shelves and export to the North Atlantic. J. Geophys. Res.: Oceans 122, 4–22. doi: 10.1002/2016jc012380
Kaiser K., Canedo-Oropeza M., McMahon R., Amon R. M. W. (2017b). Origins and transformations of dissolved organic matter in large Arctic rivers. Sci. Rep. 7, 13064. doi: 10.1038/s41598-017-12729-1
Kazmiruk Z. V., Capelle D. W., Kamula C. M., Rysgaard S., Papakyriakou T., Kuzyk Z. A. (2021). High biodegradability of riverine dissolved organic carbon in late winter in Hudson bay, Canada. Elem.: Sci. Anthr. 9, 1. doi: 10.1525/elementa.2020.00123
Kim J., Kim Y., Kang H.-W., Kim S. H., Rho T., Kang D.-J. (2020). Tracing water mass fractions in the deep Western Indian ocean using fluorescent dissolved organic matter. Mar. Chem. 218, 103720. doi: 10.1016/j.marchem.2019.103720
Kirk J. T. O. (1988). Solar heating of water bodies as influenced by their inherent optical properties. J. Geophys. Res. 93, 10897–10908. doi: 10.1029/JD093iD09p10897
Koühler H., Meon B., Gordeev V. V., Spitzy A., Amon R. M. W. (2003). “Dissolved organic matter (DOM) in the estuaries of ob and yenisei and the adjacent kara Sea, Russia,” in Siberian River run-off in the kara Sea: characterization, quantification, variability, and environmental significance. Eds. Stein R., Fahl K., Futterer D. K., Galimov E. M., Stepanets O. V. (Netherlands, Amsterdam: Elsevier), 281–308.
Kondo Y., Obata H., Hioki N., Ooki A., Nishino S., Kikuchi T., et al. (2016). Transport of trace metals (Mn, fe, Ni, zn and cd) in the Western Arctic Ocean (Chukchi Sea and Canada Basin) in late summer 2012. Deep-Sea Res. I: Oceanogr. Res. Pap. 116, 236–252. doi: 10.1016/j.dsr.2016.08.010
Lancelot C. (1984). Extracellular release of small and large molecules by phytoplankton in the Southern Bight of the North Sea. Estuar. Coast. Shelf Sci. 18, 65–77. doi: 10.1016/0272-7714(84)90007-6
Lee S. H., Joo H. M., Liu Z., Chen J., He J. (2012). Phytoplankton productivity in newly opened waters of the Western Arctic ocean. Deep Sea Res. Part II Top. Stud. Oceanogr. 81, 18–27. doi: 10.1016/j.dsr2.2011.06.005
Lee Y. C., Park M. O., Jung J., Yang E. J., Lee. S. H. (2016). Taxonomic variability of phytoplankton and relationship with production of CDOM in the polynya of the amundsen Sea, Antarctic. Deep Sea Res. Part II Top. Stud. Oceanogr. 123, 30–41. doi: 10.1016/j.dsr2.2015.09.002
Lewis K. M., van Dijken G. L., Arrigo K. R. (2020). Changes in phytoplankton concentration now drive increased Arctic ocean primary production. Science 369, 198–202. doi: 10.1126/science.aay8380
Logvinova C. L., Frey K. E., Cooper L. W. (2016). The potential role of sea ice melt in the distribution of chromophoric dissolved organic matter in the chukchi and Beaufort seas. Deep Sea Res. Part II Top. Stud. Oceanogr. 130, 28–42. doi: 10.1016/j.dsr2.2016.04.017
Logvinova C. L., Frey K. E., Mann P. J., Stubbins A., Spencer R. G. M. (2015). Assessing the potential impacts of declining Arctic sea ice cover on the photochemical degradation of dissolved organic matter in the chukchi and Beaufort seas. J. Geophys. Res.: Biogeosci. 120, 2326–2344. doi: 10.1002/2015jg003052
Lønborg C., Yokokawa T., Herndl G. J., Álvarez-Salgado X. A. (2015). Production and degradation of fluorescent dissolved organic matter in surface waters of the eastern North Atlantic ocean. Deep Sea Res. Part I: Oceanogr. Res. Pap. 96, 28–37. doi: 10.1016/j.dsr.2014.11.001
Lu C.-J., Benner R., Fichot C. G., Fukuda H., Yamashita Y., Ogawa H. (2016). Sources and transformations of dissolved lignin phenols and chromophoric dissolved organic matter in otsuchi bay, Japan. Front. Mar. Sci. 3. doi: 10.3389/fmars.2016.0085
Maie N., Scully N. M., Pisani O., Jaffé R. (2007). Composition of a protein-like fluorophore of dissolved organic matter in coastal wetland and estuarine ecosystems. Water Res. 41, 563–570. doi: 10.1016/j.watres.2006.11.006
Makarewicz A., Kowalczuk P., Sagan S., Granskog M. A., Pavlov A. K., Zdun A., et al. (2018). Characteristics of chromophoric and fluorescent dissolved organic matter in the Nordic seas. Ocean Sci. 14, 543–562. doi: 10.5194/os-14-543-2018
Mann P. J., Davydova A., Zimov N., Spencer R. G. M., Davydov S., Bulygina E., et al. (2012). Controls on the composition and lability of dissolved organic matter in siberia's kolyma river basin. J. Geophys. Res. 117, G01028. doi: 10.1029/2011JG001798
Mathew K. A., Ardelan M. V., Gonzalez S. V., Vadstein O., Vezhapparambu V. S., Leiknes Ø., et al. (2021). Temporal dynamics of carbon sequestration in coastal North Atlantic Fjord system as seen through dissolved organic matter characterisation. Sci. Total Environ. 782, 146402. doi: 10.1016/j.scitotenv.2021.146402
Mathis J. T., Hansell D. A., Kadko D., Bates N. R., Cooper L. W. (2007). Determining net dissolved organic carbon production in the hydrographically complex Western Arctic Ocean. Limnol. Oceanogr. 52, 1789–1799. doi: 10.4319/lo.2007.52.5.1789
Meier W. N., Perovich D., Farrell S., Haas C., Hendricks S., Petty A. A., et al. (2021)Sea Ice. In: Arctic Report card 2021. Available at: https://arctic.noaa.gov/Report-Card/Report-Card-2021 (Accessed May 30, 2022).
Mendoza W. G., Weiss E. L., Schieber B., Mitchell B. G. (2017). Controls on the distribution of fluorescent dissolved organic matter during an under-ice algal bloom in the Western Arctic Ocean. Global Biogeochem. Cycles 31, 1118–1140. doi: 10.1002/2016gb005569
Mopper K., Zhou X., Kieber R. J., Kieber D. J., Sikorski R. J., Jones R. D. (1991). Photochemical degradation of dissolved organic carbon and its impact on the oceanic carbon cycle. Nature 353, 60–62. doi: 10.1038/353060a0
Moran M. A., Sheldon W. M., Zepp R. G. (2000). Carbon loss and optical property changes during long-term photochemical and biological degradation of estuarine dissolved organic matter. Limnol. Oceanogr. 45, 1254–1264. doi: 10.4319/lo.2000.45.6.1254
Müller O., Seuthe L., Bratbak G., Paulsen M. L. (2018). Bacterial response to permafrost derived organic matter input in an Arctic fjord. Front. Mar. Sci. 5. doi: 10.3389/fmars.2018.00263
Müller S., Vähätalo A. V., Stedmon C. A., Granskog M. A., Norman L., Aslam S. N., et al. (2013). Selective incorporation of dissolved organic matter (DOM) during sea ice formation. Mar. Chem. 155, 148–157. doi: 10.1016/j.marchem.2013.06.008
Murphy K. R., Stedmon C. A., Waite T. D., Ruiz G. M. (2008). Distinguishing between terrestrial and autochthonous organic matter sources in marine environments using fluorescence spectroscopy. Mar. Chem. 108, 40–58. doi: 10.1016/j.marchem.2007.10.003
Murphy K. R., Stedmon C. A., Wenig P., Bro R. (2014). OpenFluor– an online spectral library of auto-fluorescence by organic compounds in the environment. Anal. Methods 6, 658–661. doi: 10.1039/c3ay41935e
Nakayama Y., Fujita S., Kuma K., Shimada K. (2011). Iron and humic-type fluorescent dissolved organic matter in the chukchi Sea and Canada basin of the Western Arctic Ocean. J. Geophys. Res.: Oceans 116, C07031. doi: 10.1029/2010jc006779
Nayar S., Chou L. M. (2003). Relative efficiencies of different filters in retaining phytoplankton for pigment and productivity studies. Estuar. Coast. Shelf Sci. 58, 241–248. doi: 10.1016/s0272-7714(03)00075-1
Nguyen H. T., Lee Y. M., Hong J. K., Hong S., Chen M., Hur J. (2022). Climate warming-driven changes in the fluux of dissolved organic matter and its effects on bacterial communities in the Arctic ocean: a review. Front. Mar. Sci. 9. doi: 10.3389/fmars.2022.968583
Nicolaus M., Katlein C., Maslanik K., Hendricks S. (2012). Changes in Arctic sea ice result in increasing light transmittance and absorption. Geophys. Res. Lett. 39, L24501. doi: 10.1029/2012GL053738
Nishino S., Itoh M., Williams W. J., Semiletov I. (2013). Shoaling of the nutricline with an increase in near-freezing temperature water in the makarov basin. J. Geophys. Res.: Oceans 118, 635–649. doi: 10.1029/2012jc008234
Noble R., Fuhrman J. (1998). Use of SYBR green I for rapid epifluorescence counts of marine viruses and bacteria. Aquat. Microb. Ecol. 14, 113–118. doi: 10.3354/ame014113
Ogawa H., Amagai Y., Koike I., Kaiser K., Benner R. (2001). Production of refractory dissolved organic matter by bacteria. Science 292, 917–920. doi: 10.1126/science.1057627
Opsahl S., Benner R., Amon R. M. W. (1999). Major flux of terrigenous dissolved organic matter through the Arctic ocean. Limnol. Oceanogr. 44, 2017–2023. doi: 10.4319/lo.1999.44.8.2017
Osburn C. L., Vecchio R. D., Boyd T. J. (2014). “Physicochemical effects on dissolved organic matter fluorescence in natural waters,” in Aquatic organic matter fluorescence. Eds. Coble P. G., Lead J., Baker A., Reynolds D. M., Spencer R. G. M. (New York: Cambridge University Press), 233–277.
Parsons T. R., Maita Y., Lalli C. M. (1984). A manual of chemical & biological methods for seawater analysis (Oxford: Pergamon Press). doi: 10.1016/0025-326x(84)90262-5
Peterson B. J., Holmes R. M., McClelland J. W., Vörösmarty C. J., Lammers R. B., Shiklomanov A. I., et al. (2002). Increasing river discharge to the Arctic ocean. Science 298, 2171–2173. doi: 10.1126/science.1077445
Polyakov I. V., Alkire M. B., Bluhm B. A., Brown K. A., Carmack E. C., Chierici M., et al. (2020). Borealization of the Arctic ocean in response to anomalous advection from sub-Arctic seas. Front. Mar. Sci. 7. doi: 10.3389/fmars.2020.00491
Polyakov I. V., Pnyushkov A. V., Alkire M. B., Ashik I. M., Baumann T. M., Carmack E. C., et al. (2017). Greater role for Atlantic inflows on sea-ice loss in the Eurasian basin of the Arctic ocean. Science 356, 285–291. doi: 10.1126/science.aai8204
Poulton A. J., Daniels C. J., Esposito M., Humphreys M. P., Mitchell E., Ribas-Ribas M., et al. (2016). Production of dissolved organic carbon by Arctic plankton communities: responses to elevated carbon dioxide and the availability of light and nutrients. Deep Sea Res. Part II Top. Stud. Oceanogr. 127, 60–74. doi: 10.1016/j.dsr2.2016.01.002
Rantanen M., Karpechko A., Lipponen A., Nordling K., Hyvärinen O., Ruosteenoja K., et al. (2022). The Arctic has warmed nearly four times faster than the globe since 1979. Commun. Earth Environ. 3, 168. doi: 10.1038/s43247-022-00498-3
Raymond P. A., Spencer R. G. M. (2015). “Riverine DOM,” in Biogeochemistry of marine dissolved organic matter. Eds. Hansell D. A., Carlson C. A. (Boston: Academic Press), 509–533.
Rich J. H., Ducklow H. W., Kirchman D. L. (1996). Concentrations and uptake of neutral monosaccharides along 14°W in the equatorial pacific: contribution of glucose to heterotrophic bacterial activity and the DOM flux. Limnol. Oceanogr. 41, 595–604. doi: 10.4319/lo.1996.41.4.0595
Rochelle-Newall E. J., Fisher T. R. (2002). Production of chromophoric dissolved organic matter fluorescence in marine and estuarine environments: an investigation into the role of phytoplankton. Mar. Chem. 77, 7–21. doi: 10.1016/s0304-4203(01)00072-x
Romera-Castillo C., Álvarez-Salgado X. A., Galí M., Gasol J. M., Marrasé C. (2013). Combined effect of light exposure and microbial activity on distinct dissolved organic matter pools. a seasonal field study in an oligotrophic coastal system (Blanes bay, NW Mediterranean). Mar. Chem. 148, 44–51. doi: 10.1016/j.marchem.2012.10.004
Romera-Castillo C., Sarmento H., Álvarez-Salgado X. A., Gasol J. M., Marraséa C. (2010). Production of chromophoric dissolved organic matter by marine phytoplankton. Limnol. Oceanogr. 55, 446–454. doi: 10.4319/lo.2010.55.1.0446
Romera-Castillo C., Sarmento H., Álvarez-Salgado X. A., Gasol J. M., Marraséa C. (2011). Net production and consumption of fluorescent colored dissolved organic matter by natural bacterial assemblages growing on marine phytoplankton exudates. Appl. Environ. Microbiol. 77, 7490–7498. doi: 10.1128/aem.00200-11
Saiz-Jimenez C., Leeuw J. W. D. (1986). Lignin pyrolysis products: their structures and their significance as biomarkers. Org. Geochem. 10, 869–876. doi: 10.1016/s0146-6380(86)80024-9
Scully N., Miller M. W. L. (2000). Spatial and temporal dynamics of colored dissolved organic matter in the north water polynya. Geophys. Res. Lett. 27, 1009–1011. doi: 10.1029/1999GL007002
Shen Y., Benner R. (2018). Mixing it up in the ocean carbon cycle and the removal of refractory dissolved organic carbon. Sci. Rep. 8, 2542. doi: 10.1038/s41598-018-20857-5
Shen Y., Benner R., Robbins L. L., Wynn J. G. (2016a). Sources, distributions, and dynamics of dissolved organic matter in the Canada and makarov basins. Front. Mar. Sci. 3. doi: 10.3389/fmars.2016.00198
Shen Y., Fichot C. G., Liang S., Benner R. (2016b). Biological hot spots and the accumulation of marine dissolved organic matter in a highly productive ocean margin. Limnol. Oceanogr. 61, 1287–1300. doi: 10.1002/lno.10290
Spencer R. G., Coble P. G. (2014). “Sampling design for organic matter fluorescence analysis,” in Aquatic organic matter fluorescence. Eds. Coble R. G., Lead J., Baker A., Reynolds D. M., Spencer R. G. M. (United states of America, New York: Cambridge University Press), 125–146.
Stedmon C. A., Bro R. (2008). Characterizing dissolved organic matter fluorescence with parallel factor analysis: a tutorial. Limnol. Oceanogr. Methods 6, 572–579. doi: 10.4319/lom.2008.6.572
Stedmon C. A., Markager S. (2005a). Resolving the variability in dissolved organic matter fluorescence in a temperate estuary and its catchment using PARAFAC analysis. Limnol. Oceanogr. 50, 686–697. doi: 10.4319/lo.2005.50.2.0686
Stedmon C. A., Markager S. (2005b). Tracing the production and degradation of autochthonous fractions of dissolved organic matter by fluorescence analysis. Limnol. Oceanogr. 50, 1415–1426. doi: 10.4319/lo.2005.50.5.1415
Stedmon C. A., Markager S., Bro R. (2003). Tracing dissolved organic matter in aquatic environments using a new approach to fluorescence spectroscopy. Mar. Chem. 82, 239–254. doi: 10.1016/s0304-4203(03)00072-0
Stedmon C. A., Thomas D. N., Granskog M., Kaartokallio H., Papadimitriou S., Kuosa H. (2007). Characteristics of dissolved organic matter in Baltic coastal sea ice: allochthonous or autochthonous origins? Environ. Sci. Technol. 41, 7273–7279. doi: 10.1021/es071210f
Stedmon C. A., Thomas D. N., Papadimitriou S., Granskog M. A., Dieckmann G. S. (2011). Using fluorescence to characterize dissolved organic matter in Antarctic sea ice brines. J. Geophys. Res.: Biogeosci. 116, G03027. doi: 10.1029/2011jg001716
Steele M., Boyd T. (1998). Retreat of the cold halocline layer in the Arctic ocean. J. Geophys. Res.: Oceans 103, 10419–10435. doi: 10.1029/98jc00580
Tanaka T., Guo L., Deal C., Tanaka N., Whitledge T., Murata A. (2004). N deficiency in a well-oxygenated cold bottom water over the Bering Sea shelf: influence of sedimentary denitrification. Cont. Shelf Res. 24, 1271–1283. doi: 10.1016/j.csr.2004.04.004
Tranvik L. J., Bertilsson S. (2001). Contrasting effects of solar UV radiation on dissolved organic sources for bacterial growth. Ecol. Lett. 4, 458–463. doi: 10.1046/j.1461-0248.2001.00245.x
Underwood G. J. C., Fietz S., Papadimitriou S., Thomas D. N., Dieckmann G. S. (2010). Distribution and composition of dissolved extracellular polymeric substances (EPS) in Antarctic sea ice. Mar. Ecol. Prog. Ser. 404, 1–19. doi: 10.2307/24873850
Urban-Rich J., McCarty J. T., Fernández D., Acuña J. L. (2006). Larvaceans and copepods excrete fluorescent dissolved organic matter (FDOM). J. Exp. Mar. Biol. Ecol. 332, 96–105. doi: 10.1016/j.jembe.2005.11.023
Urban-Rich J., McCarty J. T., Shailer M. (2004). Effects of food concentration and diet on chromophoric dissolved organic matter accumulation and fluorescent composition during grazing experiments with the copepod calanus finmarchicus. ICES J. Mar. Sci. 61, 542–551. doi: 10.1016/j.icesjms.2004.03.024
Vecchio R. D., Blough N. V. (2002). Photobleaching of chromophoric dissolved organic matter in natural waters: kinetics and modeling. Mar. Chem. 78, 231–253. doi: 10.1016/S0304-4203(02)00036-1
Vonk J. E., Mann P. J., Davydov S., Davydova A., Spencer R. G. M., Schade J., et al. (2013). High biolability of ancient permafrost carbon upon thaw. Geophys. Res. Lett. 40, 2689–2693. doi: 10.1002/grl.50348
Wilske C., Herzsprung P., Lechtenfeld O. J., Kamjunke N., von Tümpling W. (2020). Photochemically induced changes of dissolved organic matter in a humic-rich and forested stream. Water 12, 331. doi: 10.3390/w12020331
Yamamoto-Kawai M., Carmack E., McLaughlin F. (2006). Nitrogen balance and Arctic throughflow. Nature 443, 43. doi: 10.1038/443043a
Yamamoto-Kawai M., McLaughlin F. A., Carmack E. C., Nishino S., Shimada K. (2008). Freshwater budget of the Canada basin, Arctic ocean, from salinity, δ18O, and nutrients. J. Geophys. Res. 113. doi: 10.1029/2006JC003858
Yamashita Y., Boyer J. N., Jaffé R. (2013a). Evaluating the distribution of terrestrial dissolved organic matter in a complex coastal ecosystem using fluorescence spectroscopy. Cont. Shelf Res. 66, 136–144. doi: 10.1016/j.csr.2013.06.010
Yamashita Y., Hashihama F., Saito H., Fukuda H., Ogawa H. (2017). Factors controlling the geographical distribution of fluorescent dissolved organic matter in the surface waters of the pacific ocean. Limnol. Oceanogr. 62, 2360–2374. doi: 10.1002/lno.10570
Yamashita Y., Jaffe R., Maie N., Tanoue E. (2008). Assessing the dynamics of dissolved organic matter (DOM) in coastal environments by excitation emission matrix fluorescence and parallel factor analysis (EEM-PARAFAC). Limnol. Oceanogr. 53, 1900–1908. doi: 10.4319/lo.2008.53.5.1900
Yamashita Y., Nosaka Y., Suzuki K., Ogawa H., Takahasi K., Saito H. (2013b). Photobleaching as a factor controlling spectral characteristics of chromophoric dissolved organic matter in open ocean. Biogeosci. Discuss. 10, 7207–7217. doi: 10.5194/bg-10-7207-2013
Yamashita Y., Tanoue E. (2003). Chemical characterization of protein-like fluorophores in DOM in relation to aromatic amino acids. Mar. Chem. 82, 255–271. doi: 10.1016/s0304-4203(03)00073-2
Yamashita Y., Tanoue E. (2008). Production of bio-refractory fluorescent dissolved organic matter in the ocean interior. Nat. Geosci. 1, 579–582. doi: 10.1038/ngeo279
Yamashita Y., Yagi Y., Ueno H., Ooki A., Hirawake T. (2019). Characterization of the water masses in the shelf region of the Bering and chukchi seas with fluorescent organic matter. J. Geophys. Res.: Oceans 124, 7545–7556. doi: 10.1029/2019jc015476
Yang F., Song G., Massicotte P., Wei H., Xie H. (2020). Depth-resolved photochemical lability of dissolved organic matter in the Western Tropical Pacific Ocean. J. Geophys. Res.: Biogeosci. 125, C01007. doi: 10.1029/2019jg005425
Yao X., Zhang Y., Zhu G., Qin B., Feng L., Cai L., et al. (2011). Resolving the variability of CDOM fluorescence to differentiate the sources and fate of DOM in lake taihu and its tributaries. Chemosphere 82, 145–155. doi: 10.1016/j.chemosphere.2010.10.049
Zabłocka M., Kowalczuk P., Meler J., Peeken I., Dragańska-Deja K., Winogradow A. (2020). Compositional differences of fluorescent dissolved organic matter in Arctic ocean spring sea ice and surface waters North of Svalbard. Mar. Chem. 227, 103893. doi: 10.1016/j.marchem.2020.103893
Zhang Y., Kang S., Gao T., Sprenger M., Dou T., Han W., et al. (2020). Dissolved organic carbon in alaskan Arctic snow: concentrations, light-absorption properties, and bioavailability. Tellus B: Chem. Phys. Meteorol. 72, 1–19. doi: 10.1080/16000889.2020.1778968
Keywords: fluorescent dissolved organic matter, shelf sediment, shoaling, river discharge, Western Arctic Ocean
Citation: Jeon MH, Jung J, Park MO, Cho K-H, Lee Y, Yang EJ and Kang S-H (2023) Characterization and source of fluorescent dissolved organic matter in the Western Arctic Ocean: new insights from the 2019 summer study. Front. Mar. Sci. 10:1199893. doi: 10.3389/fmars.2023.1199893
Received: 04 April 2023; Accepted: 29 June 2023;
Published: 18 July 2023.
Edited by:
Liyang Yang, Fuzhou University, ChinaReviewed by:
Morgane Derrien, Universidad De O’Higgins, ChileJeonghyun Kim, Jeju National University, Republic of Korea
Copyright © 2023 Jeon, Jung, Park, Cho, Lee, Yang and Kang. This is an open-access article distributed under the terms of the Creative Commons Attribution License (CC BY). The use, distribution or reproduction in other forums is permitted, provided the original author(s) and the copyright owner(s) are credited and that the original publication in this journal is cited, in accordance with accepted academic practice. No use, distribution or reproduction is permitted which does not comply with these terms.
*Correspondence: Jinyoung Jung, amlueW91bmdqdW5nQGtvcHJpLnJlLmty; Mi Ok Park, bW9wYXJrQHBrbnUuYWMua3I=