 Vanessa Pitusi
 Rolf Gradinger
 Janne E. Søreide1†
- 1Department of Arctic Biology, The University Centre in Svalbard (UNIS), Longyearbyen, Norway
- 2Department of Arctic and Marine Biology, UiT – The Arctic University of Norway, Tromsø, Norway
Svalbard is one of the fastest warming regions in the Arctic including massive loss in fjord sea ice both in terms of area coverage, ice thickness and duration. Sea ice is a habitat for a wide variety of microscopic flora and fauna, and we know little about the impact of accelerated loss of sea ice on this unique sea ice community. Here, we present the first study on the seasonal progression and spatial distribution of the sympagic meiofauna community, in a Svalbard fjord. Further, the meiofauna community in sea ice versus the water column below were compared to investigate the link between the two habitats. In total, we found 12 taxa associated with the sea ice and 15 taxa in the water column below with 11 taxa occurring in both habitats. However, a Canonical-analysis (CA) showed that despite similarities in taxa the two mediums were distinctly different (potentially) due to the low abundance of ice nematodes and polychaete juveniles, in pelagic samples. Temporally, ice meiofauna abundances ranged from 9.7 to 25.3 x 10³ ind m-2 from beginning of March to end of April, following the seasonal build-up of ice algal biomass from 0.02 to 15.99 mg Chl a m-2 during the same time span. For the transect stations, the lowest ice meiofauna abundance was recorded at the outermost station (VMF2) with 1.6 x 10³ ind m-2 and the highest abundance at the mid-station MS with 25.3 x 10³ ind m-2. Our results indicate that fjord ice harbors most ice algae and sympagic meiofauna in its lower 10-cm with highest values in the lowermost 2-cm, at the sea ice water interface. Sympagic meiofauna communities were mostly dominated by nematodes or polychaete juveniles. We observed the phenology of ice nematodes through the maturation of females and hatching of juveniles from eggs. Polychaete larvae developed (quickly) into juveniles and grew morphological features indicative of readiness for settlement. Thus, we propose, that as with other parts of the Arctic, sea ice in Svalbard fjords plays an important role in the life cycle of ice nematodes and for accelerating the growth of polychaete larvae. Loss of coastal sea ice may therefore negatively impact coastal biodiversity and affect recruitment for some benthic infauna in Svalbard.
Introduction
The Arctic is highly impacted by global change with warmer air and sea temperatures, sea ice decline, and increasing coastal erosion. Over the past four decades, sea ice has undergone one of the most significant changes of any habitat on earth. Not only is sea ice becoming less present in the Arctic specifically in summer, but the thickness, age and pre-dominant type are changing on a pan-Arctic scale (e.g. Kwok, 2018). The once abundant, thick, and often deformed multi-year ice is progressively being replaced by younger, thinner and less deformed first-year sea ice (Bi et al., 2018; Stroeve and Notz, 2018; Sumata et al., 2023). Currently, Arctic sea ice extent ranges from 4.72 (summer) to 12.83 (winter) million km2 (National Snow and Ice Data Center, 2023) compared to 7 to 14 million km2 (Walsh and Johnson, 1979) about 40 years ago. Sea ice loss has been more pronounced than predicted by models, especially in Arctic fjords (Muckenhuber et al., 2016). The timing of formation and break-up/melt of sea ice has shifted, which has led to an overall shorter sea ice season in Svalbard and elsewhere in the Arctic (Nicolaus et al., 2012; Pavlova et al., 2019; Urbański and Litwicka, 2022). Snow-covered sea ice has a high albedo, reflecting most of the incoming solar shortwave radiation. However, with a decrease in sea ice extent a larger area of seawater is exposed, which absorbs solar heat, called the ice-albedo feedback (Kashiwase et al., 2017). This combined with warmer winter air temperatures is delaying sea ice formation and the overall duration of ice cover (Urbański and Litwicka, 2022). Subsequently, a positive feedback loop has been created resulting in an increasingly larger fraction of open water and less sea ice formation, due to an increasing heat budget in Arctic waters. The physical impacts of this change are being intensely studied using satellite information and models (e.g. Bi et al., 2018; Peng et al., 2018; Screen et al., 2018). For measurements on biological life inside of sea ice, however, we still depend on in situ investigations, and thus we have very restricted information both in time and space, and sea ice biodiversity and functioning are, therefore, still poorly understood.
When sea ice forms salt is rejected and partially collects in the form of brine in interstitial channels and pockets between the ice crystals. This creates a small (< 1 mm diameter), but inhabitable space for a sympagic (“ice-associated”) community consisting of virus, bacteria, protozoans, over 1,000 species of microscopic algae, and metazoans, such as predacious hydroids, nematodes and benthic polychaete larvae and juveniles (Marquardt et al., 2011; Bluhm et al., 2018) contributing a significant fraction to the Arctic Ocean carbon cycling (Ehrlich et al., 2020). Metazoans occurring within sea ice have both physiological and morphological adaptations to survive within the challenging ice environment (Patrohay et al., 2022). Sea ice over shallow coastal areas (< 50 m) is pre-dominantly inhabited by larvae and juveniles of benthic organisms, whereas sea ice over deeper areas and even pack ice favors pelagic or, for the central Arctic, ice endemic taxa (Bluhm et al., 2018). Larvae and juveniles utilize sea ice as a nursery ground using the readily available food, in the form of algae and bacteria, to grow and develop (e.g. McConnell et al., 2012). Additionally, through the presence of eggs and gravid fauna, sea ice is a breeding and reproduction ground for meiofauna (Marquardt et al., 2011). Sea ice is not solely utilized by in-ice fauna, but also offers a feeding platform at the ice-water interface to larger pelagic organisms that are excluded from the narrow brine channels. Especially important after the dark season, copepods feed on the underside of the ice prior to the phytoplankton bloom (Conover and Huntley, 1991) when ice algae present an early and concentrated food source of energy for zooplankton (e.g. Calanus glacialis) to fuel secondary production (Søreide et al., 2010).
Svalbard, which is located between 74° and 81° N, is one of the most rapidly changing Arctic regions. Fjordic systems either have or are in the transition toward becoming dominated by warmer Atlantic derived water (Tverberg et al., 2019; Skogseth et al., 2020). Subsequently, the sea ice season has changed with less reliable formation and an early under-ice melt caused by the presence of warmer water and air temperatures (Muckenhuber et al., 2016; Pavlova et al., 2019; Urbański and Litwicka, 2022). A recent study in Svalbard showed that in 2005-2019 the extent of the landfast sea ice with duration of 2 months or more was only half of that found in 1973-2000, and in the near future there will barely be any coastal sea ice lasting two months or more in Svalbard (Urbański and Litwicka, 2022). The implications of such changes in sea ice regimes have been investigated for marine mammals (e.g. Kovacs et al., 2020), and discussed for zooplankton (Søreide et al., 2010; Kohlbach et al., 2016) and benthos (e.g. Kohlbach et al., 2019). For Arctic ice-associated flora and fauna in general, Hop et al. (2021) reported a reduction in the abundance of ice-associated macrofauna from the 1980s to the 2010s related to changed ice properties. For sea ice algae, Hop et al. (2020) demonstrated the relevance of presence of old multi-year ice for seeding newly formed ice with diverse algal communities. For meiofauna, the recent study by Ehrlich et al. (2020) indicated that the loss of older ice had caused a marked decrease in sea ice meiofauna diversity compared to older studies. While sea ice around Svalbard has been the focus of physical and ice algal studies (e.g. Leu et al., 2010; Leu et al., 2020), we lack baseline data on the sympagic meiofauna to detect ongoing biological changes. Given the significant loss of ice in general, and specifically in Svalbard fjords, identifying the inhabitants of sea ice is an urgent task as this habitat might be lost within decades. Our knowledge of this specialized fauna is far from sufficient to assess how sea ice metazoans will be impacted by the changing sea ice conditions in Arctic fjords.
Thus, this study provides critical baseline data from a southwestern Spitsbergen fjord. Our study addressed the following questions:
1. Do sympagic meiofauna fjord community composition and abundance vary seasonally and along a depth gradient?
2. What role does sea ice play in the life history of sympagic meiofauna?
3. Is there a link between sea ice and the underlying water column, in Van Mijenfjorden?
Materials and methods
Study site, sample collection and processing
Van Mijenfjorden (77.7°N, 15.5°E) is located on the south-western coast of Spitsbergen (Svalbard) and is a semi-enclosed fjord with an island (Akseløya) at its mouth. The fjord is 70-km long and consists of an inner and outer basin with mean depths of 30-and 100-m (Høyland, 2009), respectively. The presence of Akseløya, at the entrance of Van Mijenfjorden, shields it from the regular intrusion of warm and saline Atlantic water, via the West Spitsbergen Current, making sea ice formation relatively reliable (Høyland, 2009). The water masses in the fjord are influenced by glacial melt and the formation of sea ice. Despite being partially enclosed, elevated winter temperatures in Svalbard have influenced sea ice formation in Van Mijenfjorden and the sea ice period has shortened in the past 10 years (Osuch and Wawrzyniak, 2017). Today, sea ice tends to start forming around January/February and melts around late May/June rather than previously forming in December/January and melting in June/July. During our study, the age of the sea ice within Van Mijenfjorden at the time of sampling was determined based on sea ice charts created by the Norwegian Meteorological Office (see https://cryo.met.no/en/latest-ice-charts). The charts were checked for when landfast-ice was first recorded at the sampling stations and the age was determined by establishing the time elapsed (in weeks) between the date of formation and sampling.
Sampling occurred from March to May 2017 at the main station (MS) in Van Mijenfjorden, Svalbard, and along a depth transect in the end of April (Figure 1) to investigate both the temporal and spatial distribution of sympagic meiofauna. The depth transect consisted of five stations including stations IS (water depths: 2-m), IM (14-m), MS (54-m), VMF1 (78-m), and VMF2 (61-m). These stations were chosen based on their difference in bottom depth and to contrast the inner fjord stations (IS & IM) with more outer stations (e.g. VMF2). An ice corer (KOVACS, ø = 9-cm) was used to retrieve sea ice cores from level landfast-ice for sympagic meiofauna, chlorophyll a, ice temperature and bulk salinity (Table 1). For the biotic parameters, three cores were taken approximately 0.5 m from each other. Snow depth, ice thickness and freeboard were noted for each coring site. Sea ice cores were cut immediately after coring into sections (distances given from ice-water interface) of 0-1, 1-2, 2-3 and 3-10-cm. They were transported back to the lab for further processing in the dark in a cooler. To avoid osmotic shock of ice fauna and algae, the sections for meiofauna determination and ice chlorophyll a were melted in 100-mL of 0.7 μm-filtered seawater per 1-cm of ice thickness (Garrison and Buck, 1986; Spindler and Dieckmann, 1986), while direct melt was used for bulk salinity. Sea ice cores were kept in separate bags and melting occurred in the dark at + 4 °C at the field station in Sveagruva, Spitsbergen.
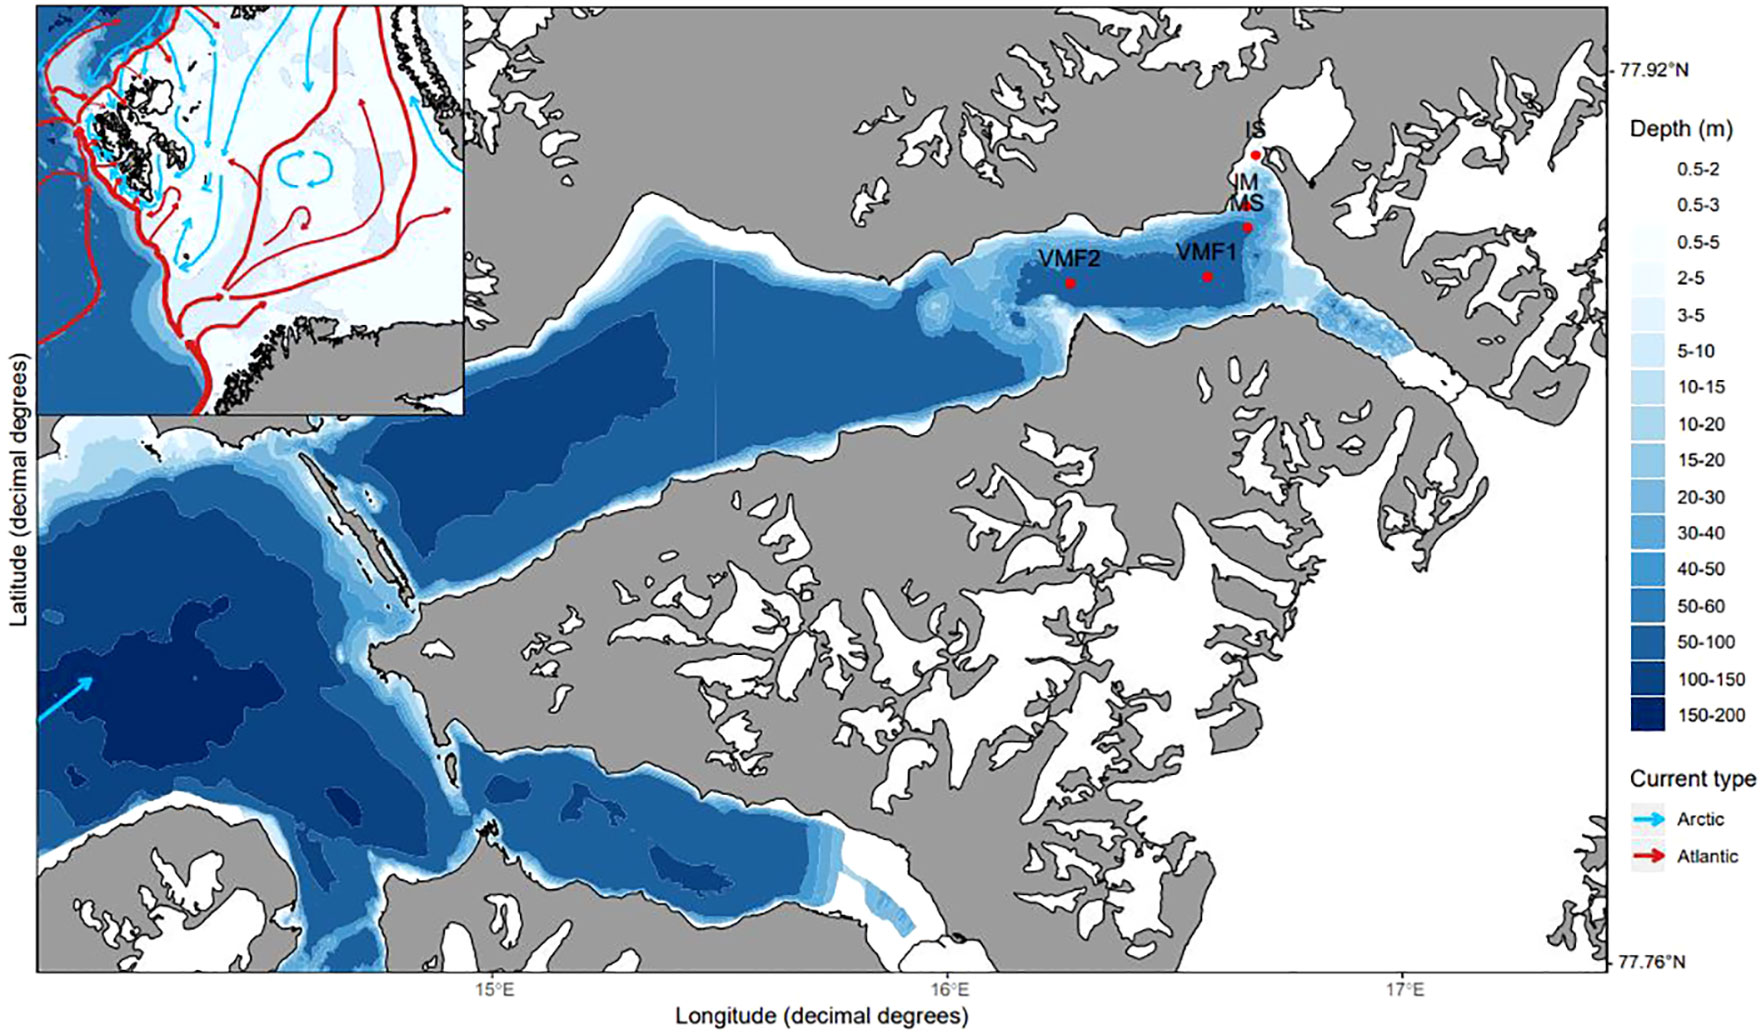
Figure 1 Map of Svalbard with major oceanic currents and Van Mijenfjorden with sampling stations marked. Stations IS (2-m), IM (14-m), MS (54-m), VMF1 (78-m) and VMF2 (62-m).
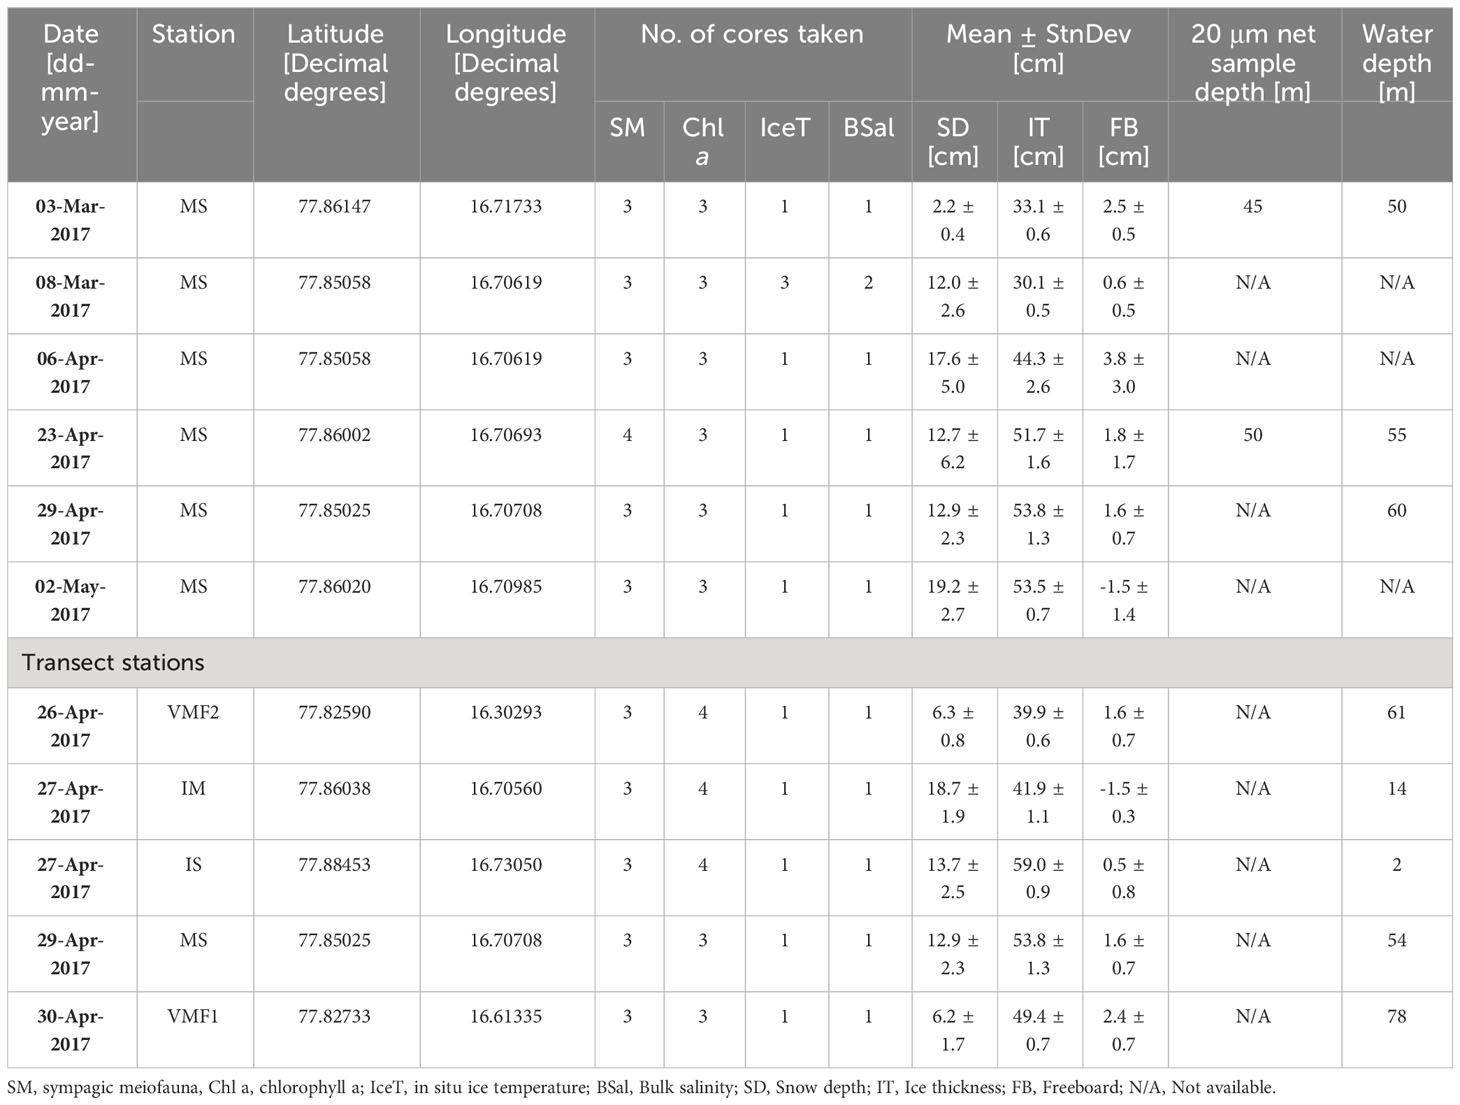
Table 1 Number of samples for abiotic and biotic factors collected from sea ice, in Van Mijenfjorden, in 2017.
In situ sea ice temperature was determined in the field with a hand-held thermometer (VWR Traceable Digital Thermometer, VWR, USA) by placing it in pre-drilled holes at 0, 1, 2, 5-cm and then every 10-cm (measured from the ice – water interface).
Bulk salinity was measured by placing a conductivity meter (VWR symphony SP90M5 Handheld Meter with Electrode salinity probe, VWR, USA) into melted core sections. Based on these measurements, brine salinity and volume fraction were calculated using the equations from Cox and Weeks (1983). Salinity values are given according to the practical salinity scale and have therefore no units.
Melted sea ice cores sections for chlorophyll a were filtered through 0.7-μm GF/F glass fiber filters (Whatman, England) and extracted for 24 hours in 10-mL of pure methanol at + 4°C. Chlorophyll a concentrations were determined before and after acidification with 5% HCl, with a 10AU-Flurometer (Turner Designs, USA) (Parsons et al., 1984).
Alongside the sea ice samples, 20-μm net (Hydro BIOS, Germany, ø = 40-cm) and water samples were taken through a hole in the ice (Table 1). Water samples were collected from directly underneath the ice with a 5-L Niskin bottle (Hydro-Bios, Germany) and stored in black 5-L canisters until filtration. Water chlorophyll a samples were filtered and processed as the melted sea ice a samples.
The 20-μm net was lowered to approximately 5-m above the sea floor and slowly pulled to the surface. The net samples were then transferred to 250-mL bottles and preserved in a final concentration of 4 % formaldehyde-sea water solution. Net samples were concentrated in a 20- μm sieve and soaked in 0.7 μm-filtered seawater for 30 mins. The samples were rinsed off the sieve and diluted to a known volume from which 2 or 5-mL sub-samples were taken. From the sample, 300 individuals were counted and identified under a Leica stereomicroscope (Leica M16, 0.71 – 11.5 x, Wetzler, Germany).
Sympagic meiofauna abundance and community composition
Individual melted ice sections for sympagic meiofauna were concentrated over a 20-μm sieve and the total volume of each melted section was measured. Samples were analyzed either alive or after fixation in 96 % ethanol or 4 % formaldehyde (Table 1, Supplementary material 1). Both ethanol and formalin were used to have samples available for DNA extraction (see Pitusi et al., 2021), as well as purely for community count and composition. A Leica stereomicroscope (Leica M16, 0.71 – 11.5 x, Wetzler, Germany) was used to identify and count sympagic meiofauna. General taxonomic literature (e.g. Larnik and Westheide, 2011) was used to identify fauna. Meiofauna was identified to the lowest possible taxonomic level, whereas most pelagic organisms were identified to species due to the extensive literature available from Svalbard (e.g Klekowski and Węsεsawski, 1991). No identification keys for eggs were available and thus photographs were taken, and their width and color was noted. A sub-sample of eggs was identified molecularly (see Pitusi et al., 2021). Although eggs do not represent distinct taxa, in this study, we considered them as a unique part of the community and included them in the abundance count.
Nematodes were targeted in this study given that they are abundant (Pitusi, 2019) and since they are identified as endemic to the Arctic ice system, and thus appear to be very susceptible to changing ice conditions (Ehrlich et al., 2020). After the initial analysis of sympagic meiofauna community samples, nematodes were studied in more detail by measuring the total body length of a sub-sample of fixed specimens. In total, 135 nematodes were measured from the samples of the main station (MS). The number of nematodes varied depending on their abundance, which meant that only up to 15 ice nematodes were measured from samples taken between 03-Mar and 06-Apr. The number increased to 51 and 42 for 23-Apr and 02-May, respectively, as their presence also increased. While this did not provide species identification it allowed to separate juveniles and adults based on the available literature values for known Arctic ice nematode species (Table 2). Due to the nature of overlapping sizes between ice nematode species, juveniles were classified as any specimen <1200 µm and adults as >1200 µm.
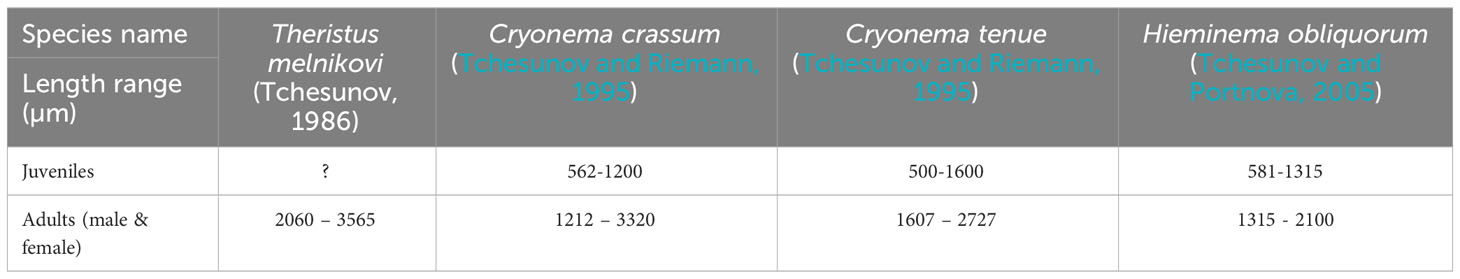
Table 2 Literature based lengths data of adult ice nematode specimens, used for identifying ice nematode species in our study.
While other Arctic meiofauna studies (e.g. Marquardt et al., 2011) included ciliates, this study focused on sea ice metazoans. However it should be noted that ciliates were present but not enumerated. Integrated sympagic meiofauna abundance was calculated based on Bluhm et al. (2018), but with a lower ice-water density conversion factor (C) of 0.92 units for first-year sea ice (Timco and Frederking, 1996). This factor is used to account for the volume difference between ice and melted ice.
Statistical analysis
To investigate the strength of the link between sea ice and the underlying water column, in Van Mijenfjorden, a Correspondence analysis (CA) (e.g. Greenacre, 2010) based on chi-squared distance was applied to the pelagic and sea ice metazoan community data. This was done for the time points when both environments were sampled; namely 03-Mar and 23-Apr-17. Prior to the CA, abundance data from the sea ice and water were normalized by taking the proportion and multiplying by the median of the data used. No statistical test were run on these data due to the limited sample pool (n = 4) that would not meet the requirements for testing.
A CA based on chi-squared distance was applied to spatial dataset to visualize if the stations sampled differed in sympagic meiofauna occurrence. Prior to the CA, abundance data from the depth transect were normalized by taking the proportion and multiplying by the median. The non-parametric Kruskal-Wallis test was applied to the spatial data to test for significant differences in abundance between the sea ice communities at the transect station (IS, IM, MS, VMF1, and VMF2), and to investigate if there was a significant difference between sampled dates at the main station (MS) in the period from March to May.
An RDA (redundancy analysis) was run using environmental data as explanatory variables and meiofauna abundances (ind m-2) as response variables from the depth transect stations - IS (2-m), IM (14-m), MS (54-m), VMF1 (78-m) & VMF2 (61-m). The following environmental variables were used: ice age (weeks), brine volume (%), freeboard (cm), snow depth (cm), water depth (m), and sea ice chlorophyll a (mg Chl a m-2). No auto-correlated variables were included. Triplicate data (ind m-2, combined 0-10-cm section) for each sampling station were used and meiofauna abundance was fourth root transformed prior to constructing the RDA. The significance and fit of the overall RDA model, containing the above variables, was assessed using a permutation test with 999 unrestricted permutations.
Linear regression analysis was conducted to look at the relationship between ice algal biomass and meiofaunal abundance. These tests were run separately for the 0-1, 0-3, and combined 0-10-cm section together with overall sympagic meiofauna abundance, and ice nematode occurrence, for the temporal data from station MS.
For all tests, the significance level was set at p < 0.1 to account for our small sample pool.
Statistical analysis were conducted with RStudio v 4.1.1 (R Core Team, 2021) and by using packages ggplot2 (Wickham, 2016), vegan (Oksanen et al., 2022), tidyverse (Wickham et al., 2019), readxl (Wickham and Bryan, 2023), openxlsx (Schauberger et al., 2023), dplyr (Wickham and Ruiz, 2018), and tidyr (Wickham et al., 2023). The Svalbard map was created with packages ggOceanMaps (Vihtakari, 2022), tidyverse (Wickham et al., 2019), and cowplot (Wilke et al., 2019).
Results
The result section is split into three parts – environmental parameters, ice & water chlorophyll a concentration, and meiofauna abundance in the ice & water.
Environmental variables
Temporal data – station MS
At the main station (MS), ice thickness increased over the season by 20 cm from 33.1 (March) to 53.5 cm (end of April). Much like ice thickness, snow cover increased from March (2.2 cm) to May (19.2 cm). Measured freeboard fluctuated throughout the season (-1.5 to 3.8 cm) with the negative value occurring in May related to the highest snow depth (Table 3).
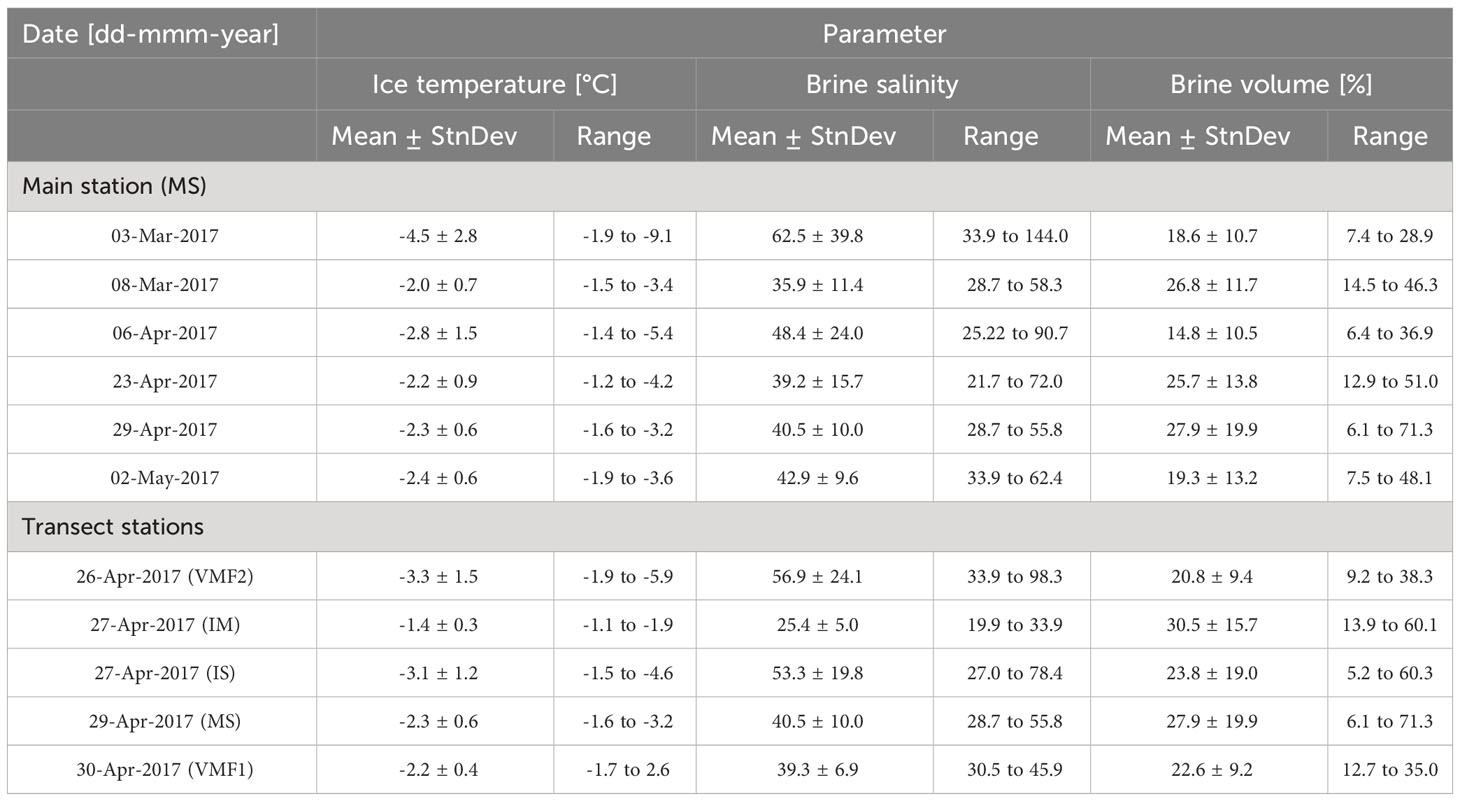
Table 3 Mean (± StnDev) and ranges of physical sea ice parameters measured from sea ice cores at the main station (MS) and the transect stations (IS, IM, MS, VMF1, VMF2), in Van Mijenfjorden.
In situ ice temperature ranged between -9.1 and -1.2 °C with lower temperatures at the ice-air interface and higher temperatures toward the ice-water interface. The ice temperature at the ice-water interface fluctuated between -2.0 and -1.4 °C with higher temperatures recorded in early April. The calculated resulting brine salinities were consequently highest at the top of the core compared to the bottom and ranged from 21.7 to 144.0. At the ice-water interface, brine salinity variability was small and ranged from 25.2 to 35.9 across the season with the lowest value recorded in early April (06-Apr). Bulk salinity ranged from 3.4 to 30.0 with generally higher values at the ice-air and water interface compared to the middle of the core, leading to that all dates (except 06-Apr) exhibited the characteristic C-shape of first-year ice (Nakawo and Sinha, 1981). Brine volume fractions ranged between 6.1 and 89.8 % with larger values calculated for the lower 10-cm of the sea-ice cores where bulk salinity and temperatures were highest.
Depth transect
The sea ice cover in Van Mijenfjorden was generally poor in 2017. At maximum (mid-April), sea ice only covered 2/3 of the fjord. Landfast-ice formed in the innermost part (Stations IS, IM, MS, and VMF1) around 09-Feb-17, and the ice present at the time of first sampling was therefore ca. 10 weeks old. Comparatively, the sea ice at the outermost station VMF2 started to form at a later date (03-Apr-17) and was therefore younger with an estimate age of only 3 weeks at the time of sampling. Consequently, along the depth transect (stations IS to VMF2), ice was not uniformly thick, related to the duration of sea ice growth prior to sampling. The thinnest sea ice was recorded at the outermost station VMF2 (61-m deep), where the ice growth period had been the shortest, while considerably thicker ice (max 59.0 cm, station MS, 54-m) was recorded at older ice stations in the inner part of the fjord.
Snow depth was similarly variable with the lowest depth at the second outermost station VMF1 (6.2 cm) and the highest snow depth (18.7 cm) at second innermost station IM. Freeboard was variable (-1.5 to 2.4 cm) between transect stations with positive values at all stations except at the 14-m deep station IM with the highest snow depth.
In situ ice temperature at the transect stations ranged between -5.9 and -1.1°C with the lowest temperatures at the ice-air interface (Table 3). Ice temperatures at the sea ice-water interface ranged between -2.3 and -1.3°C, with the coldest value recorded at VMF2 and the warmest value at station IM. The resulting calculated brine salinities ranged from 19.9 to 98.3 with high values at the ice-air interface and lower values at the ice-water interface. At the ice-water interface, station VMF2 had the highest brine salinity of all stations with 40.8, whereas the other stations ranged between 23.4 (IM) and 32.2 (VMF1). Bulk salinity varied between 3.4 and 22.8 with generally higher values at the ice-air and water interface compared to the middle of the core. Most profiles had a characteristic C-shape except at station IS (2-m) and IM (14-m). Brine volume fraction varied between 5.2 and 71.3 % with the highest values found in the lower 10-cm of the ice. Thus, the lower 10-cm were considered the largest inhabitable and permeable space for sea ice biota in general.
Chlorophyll a concentrations in ice and water
Temporal data – station MS
Integrated ice algal biomass was extremely low in March (<0.1 mg Chl a m-2) but increased strongly toward the end of April (Figure 2A). Chlorophyll a concentrations increased from 0.38 to 15.99 mg Chl a m-2 from early to the maximum in late April in the lowermost 10-cm. By the start of May, ice algal biomass dropped to 8.7 mg Chl a m-2.
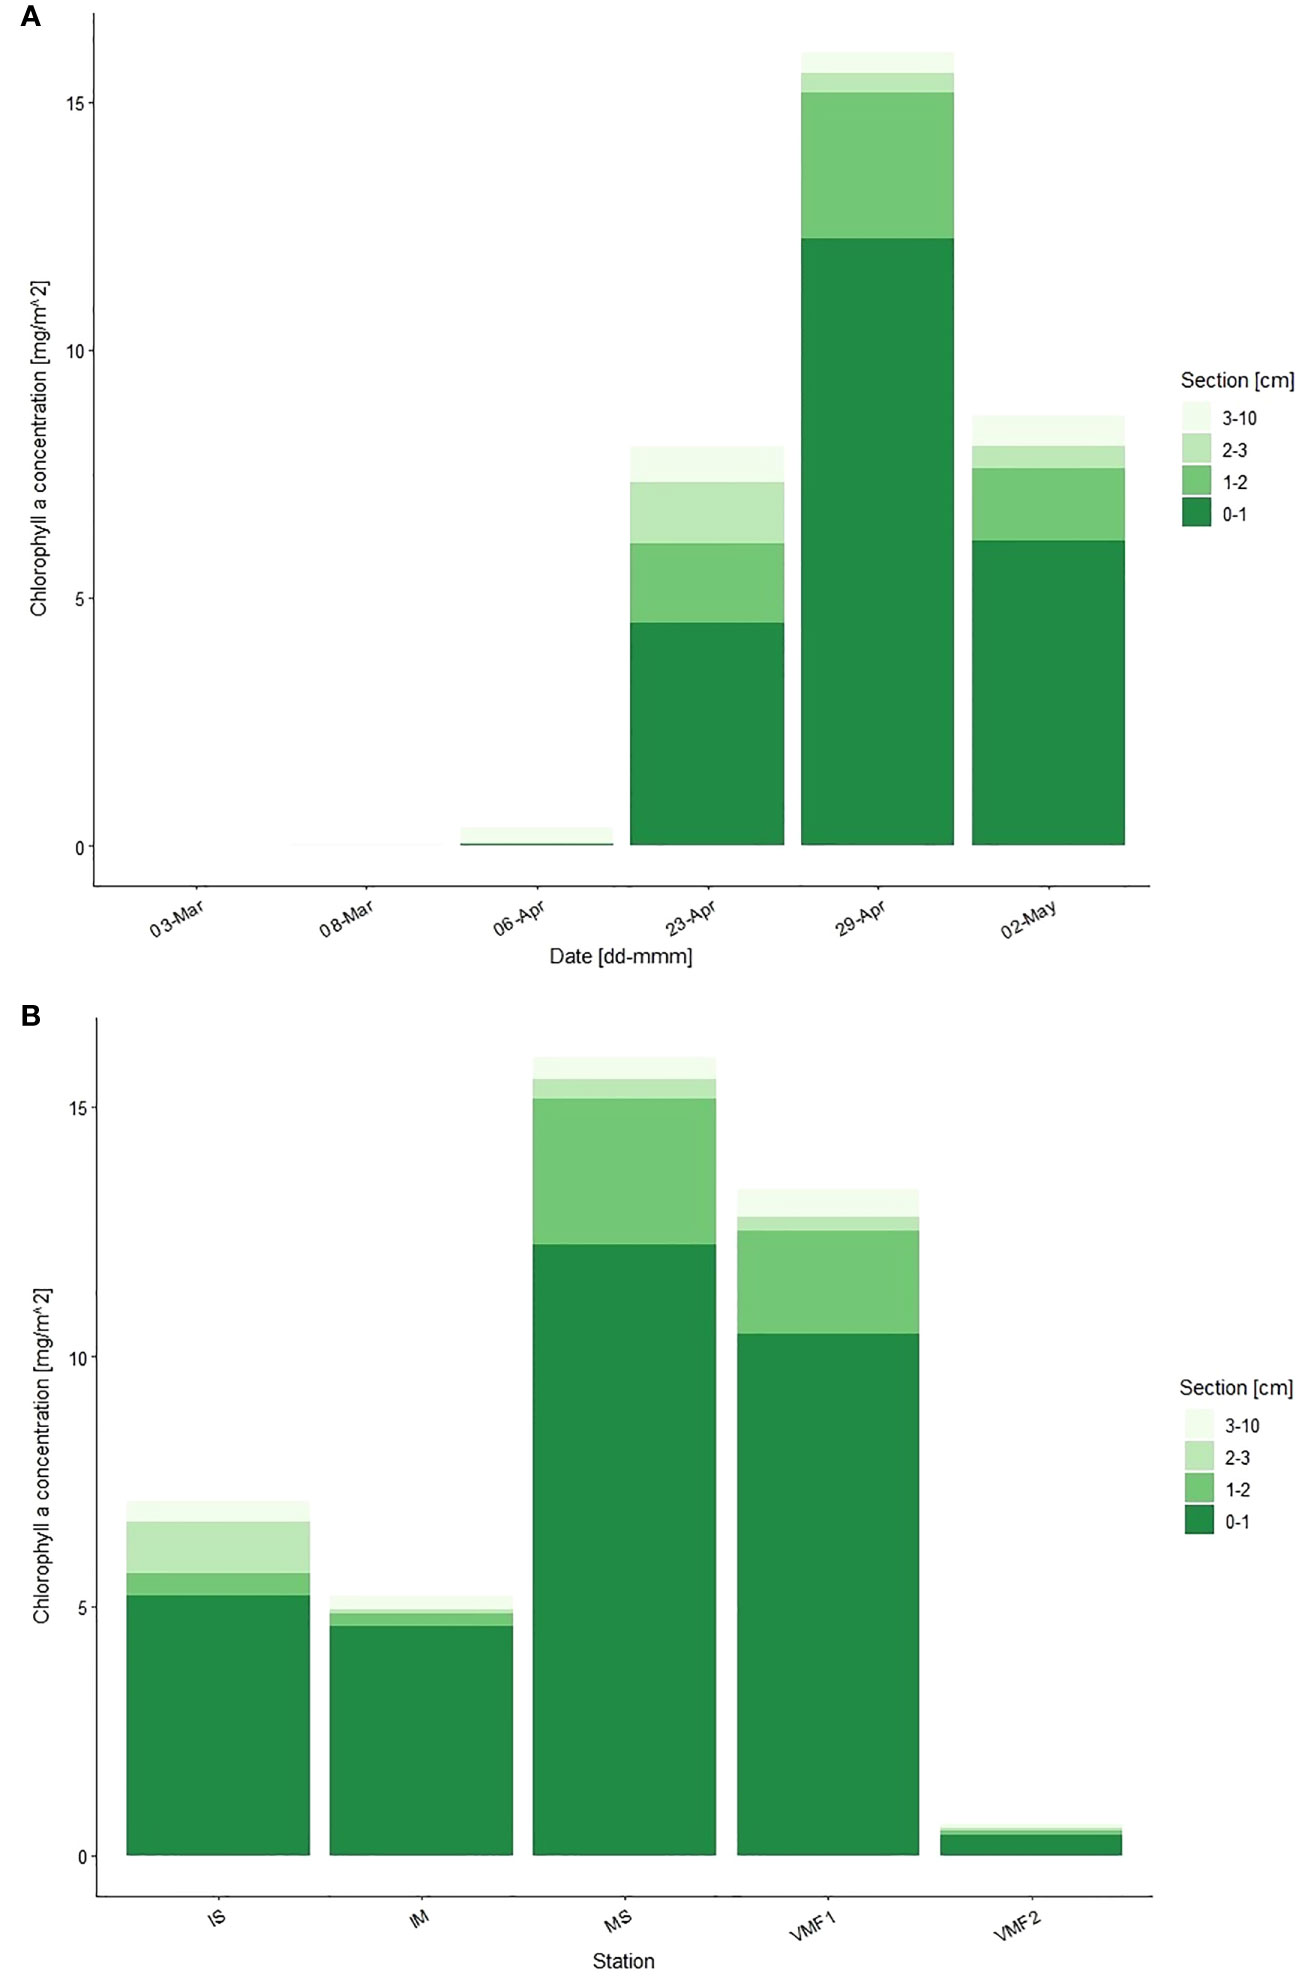
Figure 2 Integrated chlorophyll a concentration (mg Chl a m-2) at (A) the main station, over the sampling season, and (B) at the transect stations, in the lowermost 10-cm of the ice. Section equals distance from water (cm). Transect stations were sampled on the following days – IS 27-Apr-17; IM 27-Apr-17; MS 29-Apr-17; VMF1 30-Apr-17; VMF2 26-Apr-17.
In March, the low ice algal biomass present (0.003-0.012 mg Chl a m-2) was distributed relatively evenly throughout the ice (Figure 2A). Later, the chlorophyll a concentrations increased in all sections, but up to 95 % were located within the lowermost 3-cm of the ice. The highest concentrations were measured at the end of April in the lowermost 2-cm with up to 12.23 mg Chl a m-2 in the 0-1-cm section compared to ≤ 0.39 mg Chl a m-2 in the 2-3-cm section.
Depth transect
Along the transect stations, ice algal biomass ranged from 0.65 (VMF2) to 16.00 (MS) mg Chl a m-2 (Figure 2B). The chlorophyll a concentrations were similar at the two shallow and innermost stations IS (2-m) and IM (14-m) with 7.11 and 5.20 mg Chl a m-2, respectively, in the lower 10-cm. Ice algal biomass increased along the depth transect and was measured to be 15.99 and 13.36 mg Chl a m-2 at stations MS (54-m) and VMF1 (78-m), respectively. Station VMF2, which was furthest out had the lowest chlorophyll a values. At all stations, the majority of the ice algal biomass was located in the lower 3-cm of the core and more specifically in the 0-1-cm section (Figure 2B).
Integrated sympagic meiofauna abundance
In total, across the temporal and spatial data, 12 categories of metazoan were identified from sea ice samples in Van Mijenfjorden. These included nematodes, benthic polychaete juveniles, trochophore larvae, rarer taxa such as copepods Pseudocalanus spp. and Oithona similis, rotifers, cnidarians, and an unidentified fraction (Table 4). Rarer taxa, only contributed between 1-8 % toward the total sea ice metazoan count. The calanoid Pseudocalanus spp. and cyclopoid Oithona similis are hereafter referred to collectively as “copepods”, as they were rare occurrences, in the temporal dataset from station MS. Harpacticoids were only found along the transect stations IM & VMF1 and, thus, are not seen in the temporal dataset from station MS. Consequently, 11 taxa were recorded over a season at station MS, and at the depth transect 9 taxa were observed. The difference arising from the absence of cnidarians, Pseudocalanus spp. and Oithona similis along the depth transect stations.
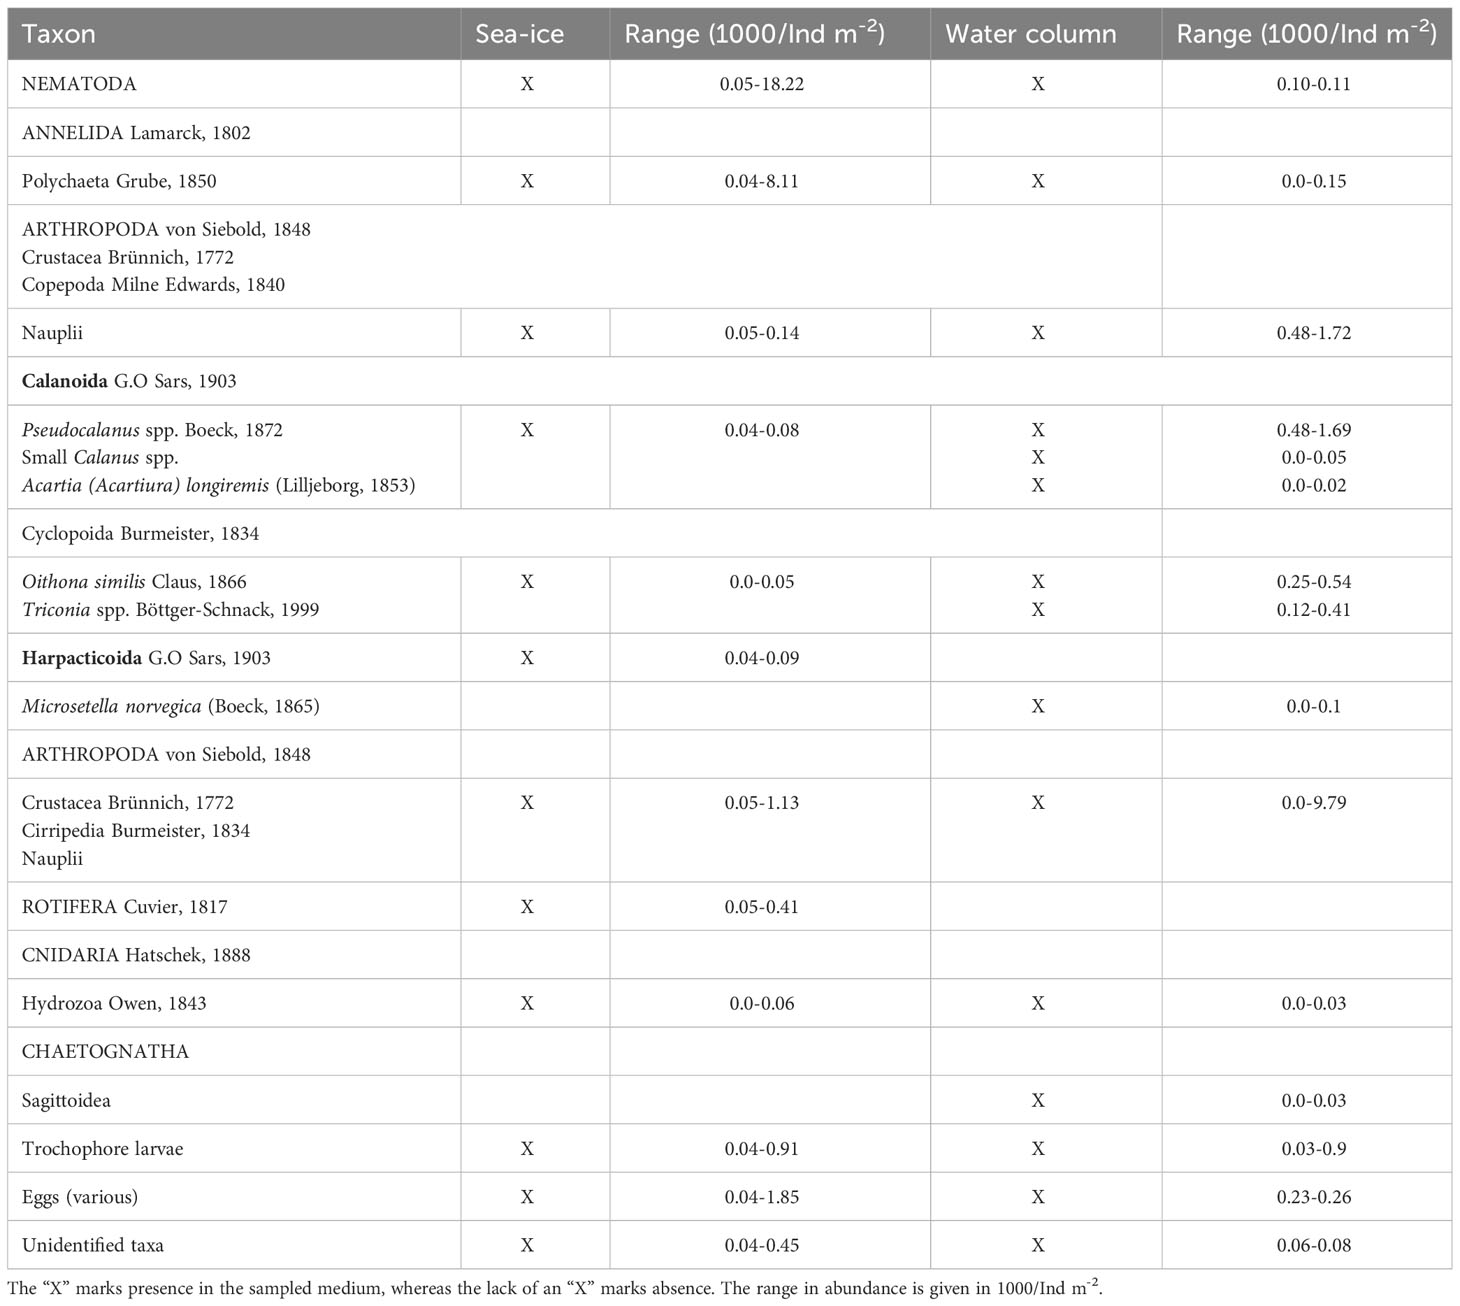
Table 4 List of taxa found in sea-ice and water column samples in all samples and at all stations, in Van Mijenfjorden.
Temporal data – station MS
Total metazoan abundance ranged from 6.8 to 25.3 x 10³ ind m-2 with the lowest abundance recorded on 06-Apr and peak abundance on 29-Apr (Figure 3A), shortly after the Chl a maximum. The Kruskal-Wallis test deemed seasonal change in abundance to be insignificant (p > 0.1). However, the abundance doubled from 23-Apr to 29-Apr (Figure 4A), which points toward significant biological activity that should not be disregarded on the basis of statistical insignificance. Additionally, there was variability between sections within and between stations (Figure 3), which should not be disregarded on the basis of insignificant test results.
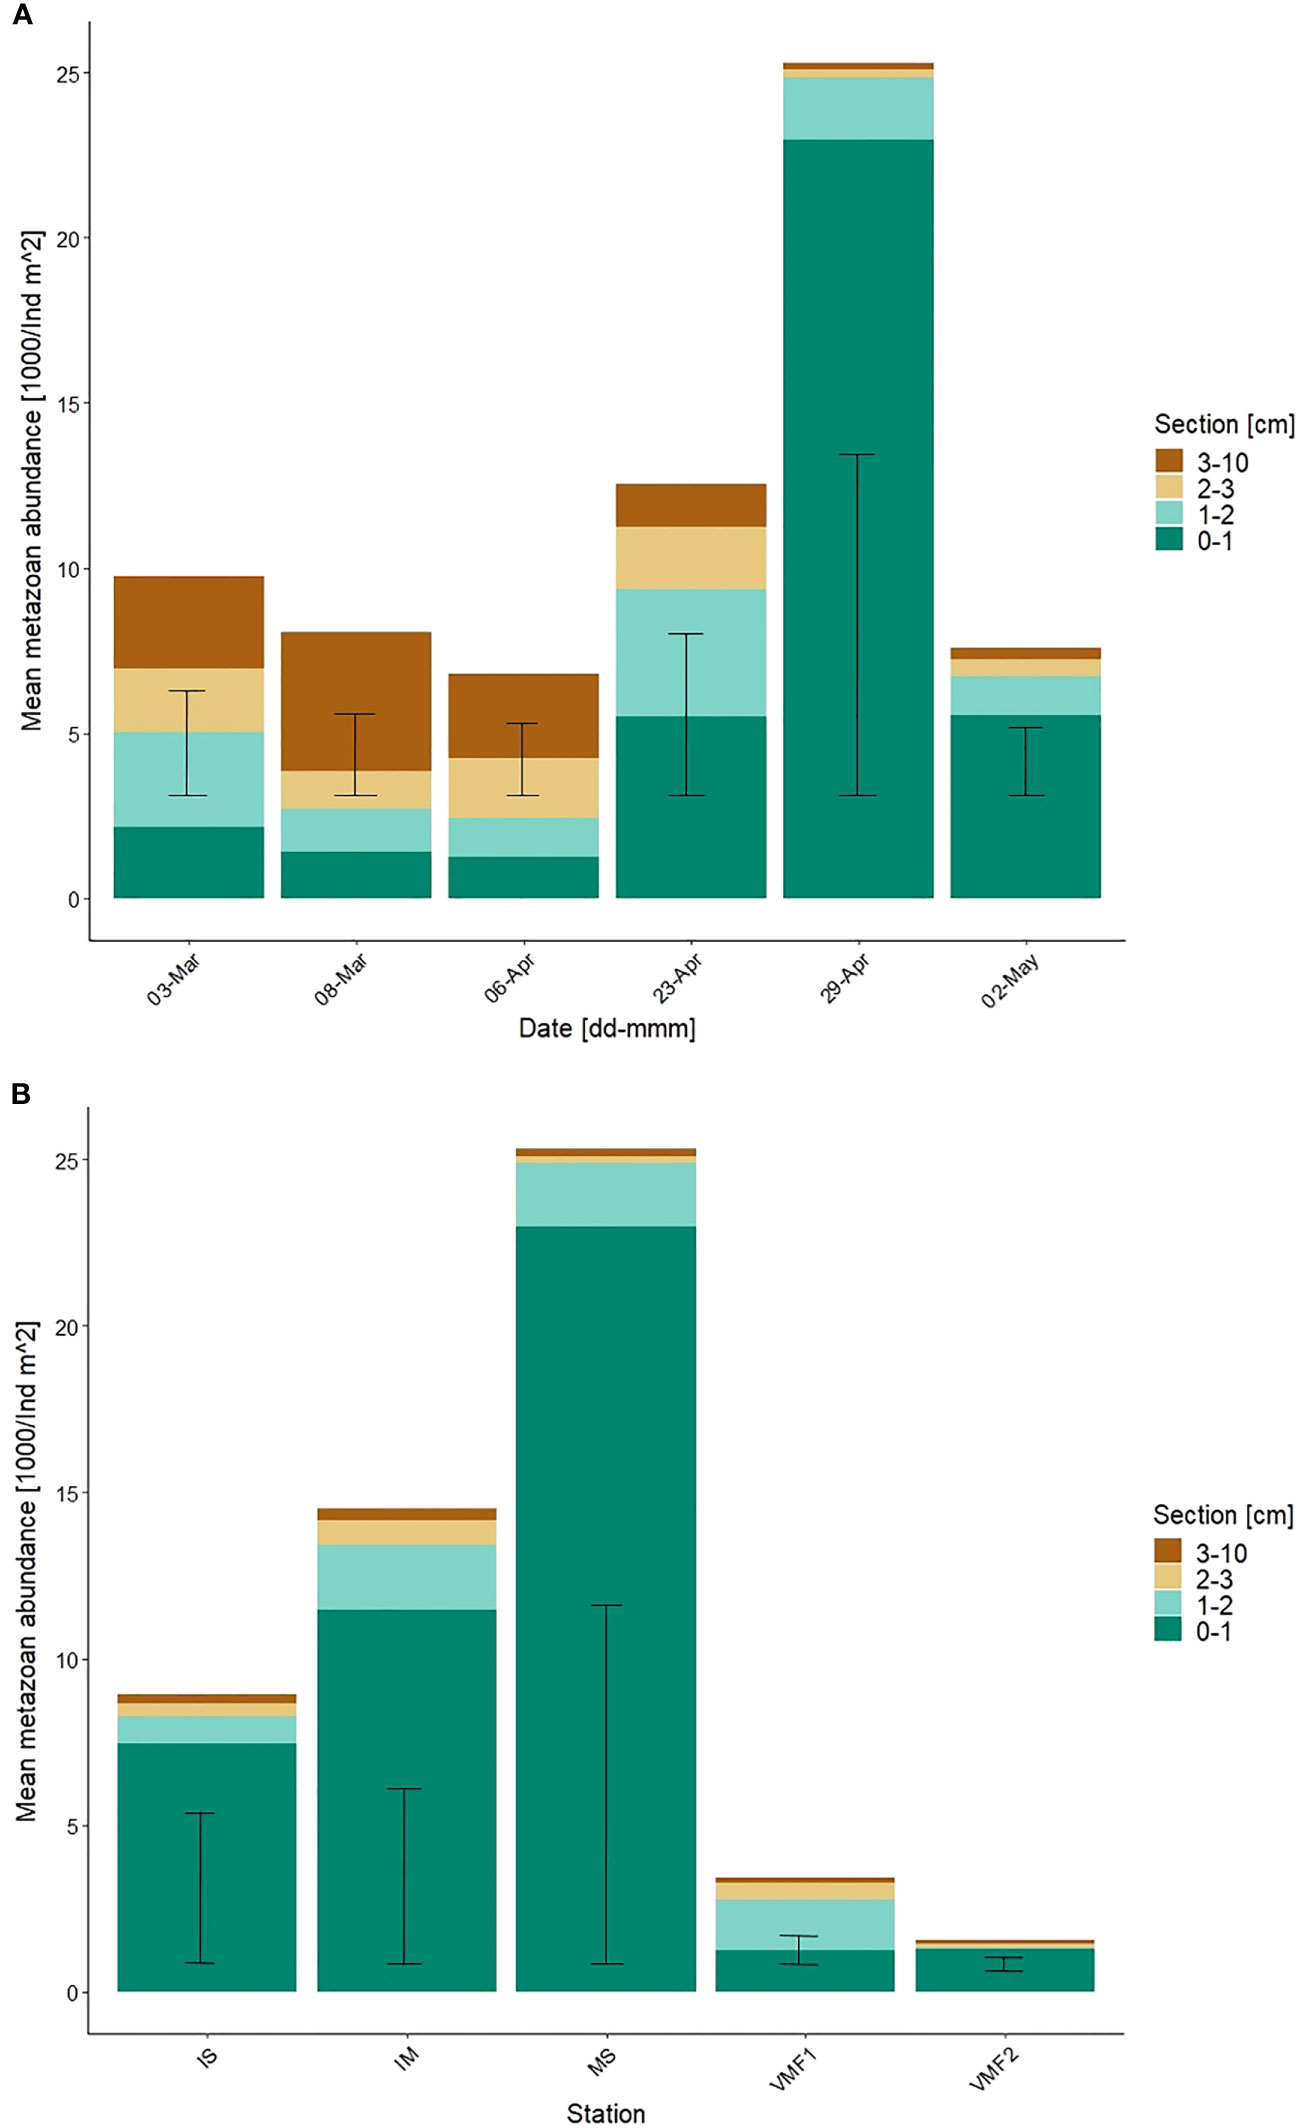
Figure 3 Integrated mean metazoan abundance (1000/ind m-2) at (A) the main station, over the sampling season, and (B) at the transect stations with standard deviation, in the lowermost 10-cm of the ice. Section equals distance from water (cm). Transect stations were sampled on the following days – IS 27-Apr-17; IM 27-Apr-17; MS 29-Apr-17; VMF1 30-Apr-17; VMF2 26-Apr-17.
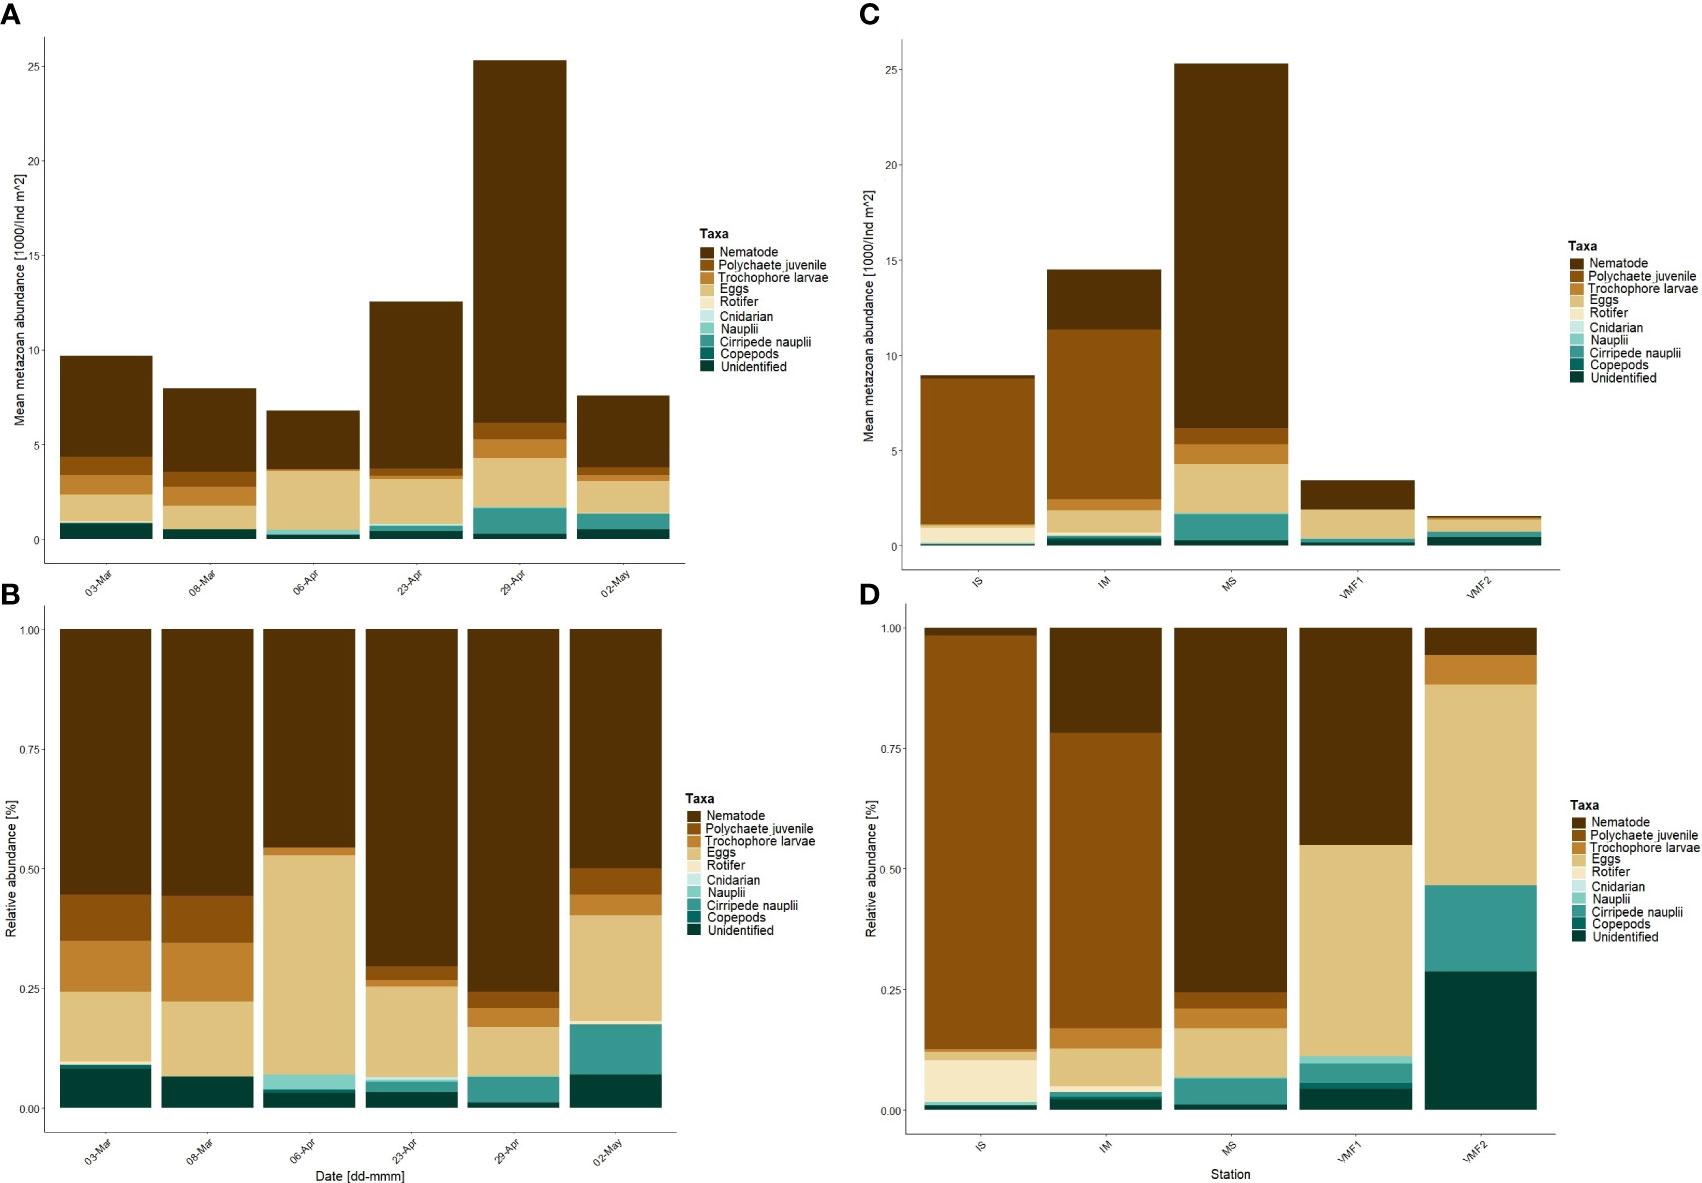
Figure 4 Integrated mean metazoan abundance (1000/ind m-2) (A) and relative abundance (B) the main station, over the sampling season, and integrated mean metazoan abundance (1000/ind m-2) (C) and relative abundance (D) at the transect stations, in the lowermost 10-cm of the ice. Section equals distance from water (cm). Transect stations were sampled on the following days – IS 27-Apr-17; IM 27-Apr-17; MS 29-Apr-17; VMF1 30-Apr-17; VMF2 26-Apr-17.
Numerically, nematodes were the most abundant taxon throughout the sampling season, especially in the lowermost 0-1-cm section in late April and early May (Table 1; Supplementary material 2). They comprised between 45 to 75 % of the total sympagic metazoan abundance (Figure 4B).
Vertically, little sympagic meiofauna was found in the 3-10-cm section from 23-Apr onward. Most organisms were located within the lower 3-cm and specifically within the 0-1-cm section (Table 1; Supplementary material 2), where up to 90 % of all meiofauna were found. Only on 08-Mar, the split was more even with 52 % of all individuals located in the 3-10-cm section.
Eggs contributed greatly (up to 85 %) toward the total meiofaunal count, and their abundance ranged from 0.04 to 3.11 x 10³ eggs m-2 with the highest count recorded on 06-Apr (Figure 4A). Five egg morphotypes were identified ranging from individual eggs to clusters, transparent to colored (Figure 1; Supplementary material 3). Measured egg sizes ranged from 40 to 1,646 µm; the largest eggs were the fish eggs. Three morphotypes were identified based on observations of hatching and larval development within the egg as nematode, arrow worm and fish eggs. For nematode eggs, these were also identified molecularly (see Pitusi et al., 2021).
Throughout the season, the contribution of each egg type changed (Figure 5). Four kind of eggs (e.g. fish and arrow worm eggs) only occurred in the first half of the season (March-April), whereas others started to appear later (April/May) such as the nematode eggs. Arrow worm eggs were only present in March and contributed 25 % toward the total egg count. Nematode eggs were first observed from 06-Apr until the end of May contributing between 5-25 %. Alongside this morphotype, other cluster of eggs were observed as well as eggs not classified.
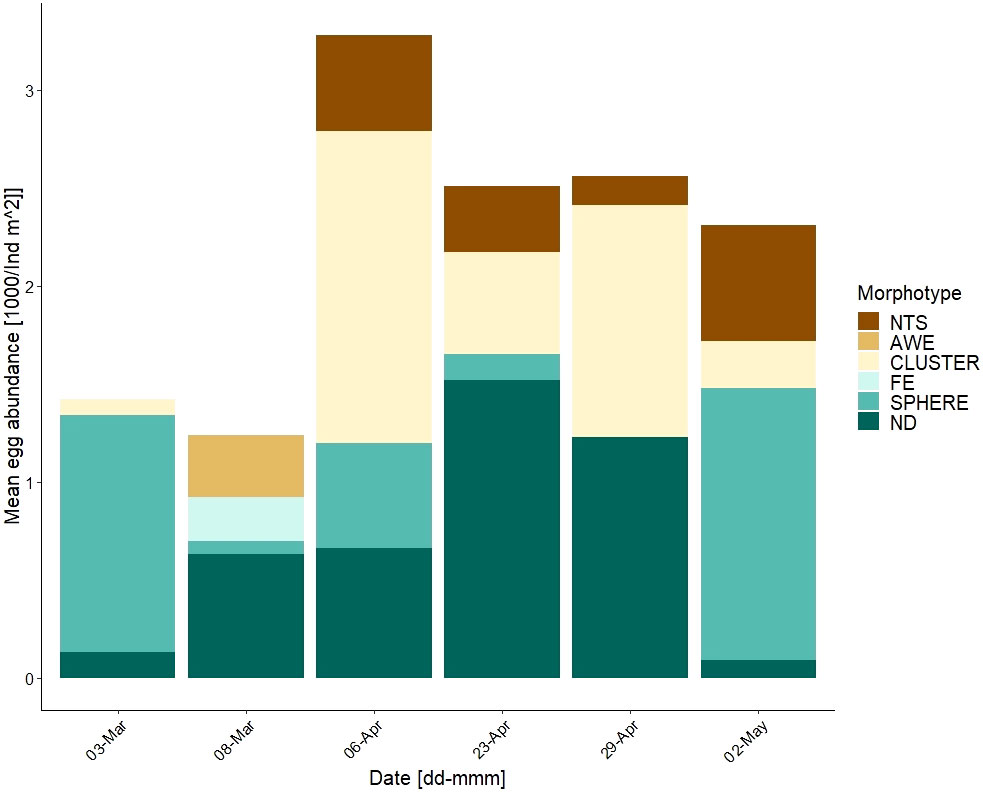
Figure 5 Integrated egg abundance (1000/ind m-2), in the lowermost 10-cm of the ice at station MS. Identified eggs were split into 5 morphotypes and one undescribed fraction – NTS = nematode egg sack; AWE = arrow worm egg; CLUSTER = clustering eggs; FE = fish egg; SPHERE = spherical/round eggs, various sizes & colors; ND = not described.
The regression analysis showed a significant positive relationship between ice nematode abundance and ice algal biomass in the lower 1-cm of the ice (R2=0.806, p = 0.0095), as well as for total meiofaunal abundance (R2 = 0.854, p =0.0053). This relationship was not found for either the lower 3 or integrated 10-cm section, where the regression produced a p-value > 0.1.
Depth transect
Based on the count data, the five transect stations sampled, from the shallow 2-m deep station IS to the deeper station VMF1 (78-m) showed not only differences in abundance, but also in community composition (Table 1; Supplementary material 4). Unfortunately, the Kruskal-Wallis test did not support this (p > 0.1), but the CA created for the transect data showed distinct difference between the stations (Figure 1; Supplementary Material 5). The total meiofauna abundance along the transect ranged between 1.6 (VMF2) to 25.3 (MS) x 103 ind m-2 (Figure 4C). Similarly, to the temporal data, the majority of the meiofauna was found within the lower 3-cm of the ice cores at the transect stations (Figure 3B). To be more precise, at all stations, but VMF1, 80-90% of the meiofauna was located within the lower 1-cm of the sample.
At the two shallowest stations (IS with 2-m and IM with 14-m), the numerically most abundant taxon was polychaete juveniles contributing 85 and 61 % toward the total meiofauna count, respectively (Figure 4D).
At the three deeper stations (MS, VMF1 and VMF2), either nematodes or the “other” fraction, which consisted of polychaete juveniles, trochophore larvae, eggs, rotifers, copepod and cirripede nauplii, harpacticoids, and the unidentified fraction, dominated with up to 75 % (Figure 4D). Within the “other” fraction, eggs contributed over 50 % toward the total taxa count at all stations apart from station IS, where no eggs were found.
For the transect stations (IS, IM, MS, VMF1, & VMF2), environmental variables explained 51.6% of the variance in the fourth-root transformed abundance of sympagic meiofauna (Figure 6). The two canonical axes could explain 31.7 % and 16.0 %, respectively.
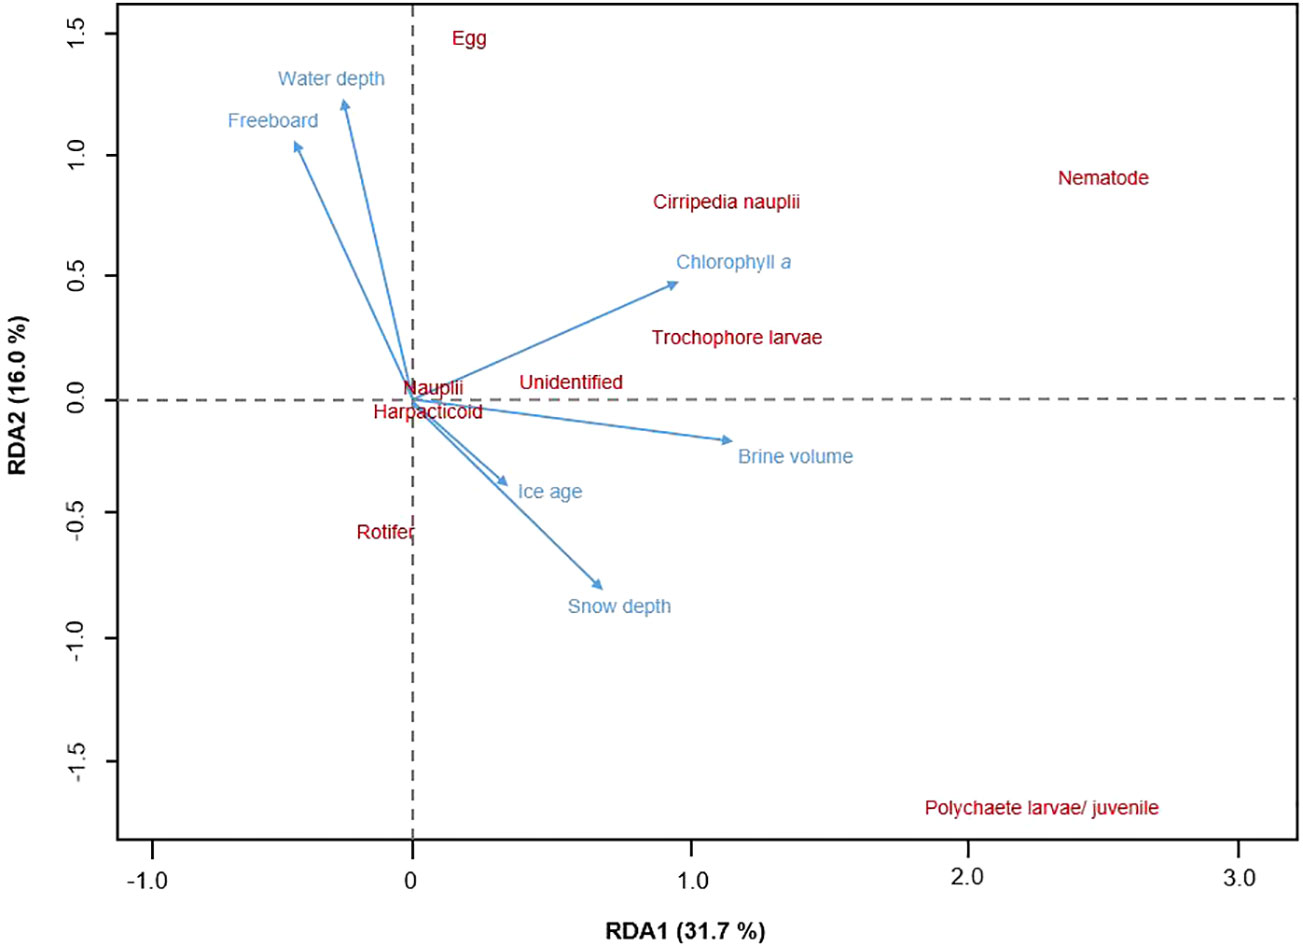
Figure 6 Redundancy analysis (RDA) ordination shows how sympagic meiofauna occurrence (n = 9) was correlated with abiotic variables (n = 6) along the transect stations - IS (2-m), IM (14- m), MS (54-m), VMF1 (78-m) & VMF2 (61-m). Vector direction and length reflects the strength of the correlation, and only statistically significant variables are shown. Ice age, brine volume and water depth with p < 0.1, and snow depth, freeboard, and sea ice chlorophyll a with p < 0.05.
Figure 6 shows the significant environmental variables that had an influence on the abundance of sympagic meiofauna. Sea ice chlorophyll a was positively correlated to the RDA axes and seemed to be the main driver for the abundance of cirripede nauplii, trochophore larvae, and nematodes among others (p < 0.05; Table 5). The occurrence of polychaete larvae/juveniles was negatively correlated to water depth and freeboard (p < 0.05), but positively correlated to ice age (p < 0.1), brine volume, and snow depth (p < 0.05). Nematodes and eggs appeared to be positively correlated to water depth as well as freeboard.
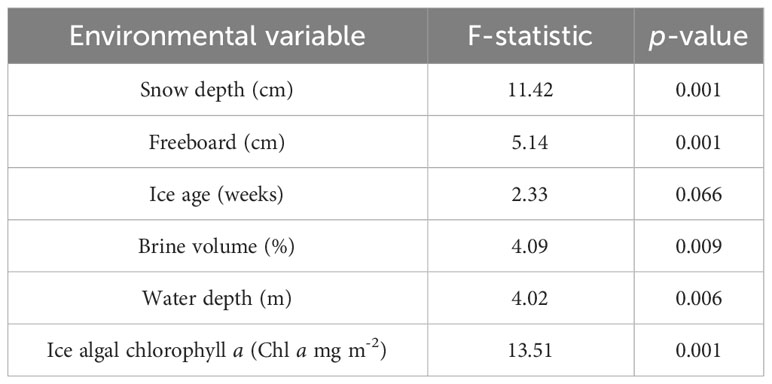
Table 5 Output of RDA analysis of environmental variables and sympagic meiofauna data at the transect stations.
The permutation test showed the RDA model to be significant (F6 = 6.75, p < 0.05) and, thus, for the included variables to be a good fit to test what environmental parameters influenced the sympagic meiofauna occurrence along the depth transect.
Nematode phenology at the main station (MS)
At the station MS, the phenology of sea ice nematodes was observed (Figure 1; Supplementary Material 6). Between March and May, abundance steeply increased from 0.2 to 18.2 x 10³ ind m-2 due to the hatching of juveniles from eggs in April/May.
Based on observations and length measurements, large-sized (> 1,200 μm) adult nematodes made up 97 % of the nematode population in the ice samples in March and early April (Figure 2; Supplementary material 6). From mid-April to early May, smaller-sized (< 1,200 μm) juveniles started to appear and contribute toward the overall nematode count. Starting in April, sexually mature female nematodes were observed with oocytes inside of them. Nematode eggs were first observed on 06-Apr and were counted until the end of the season; abundances of this morphotype ranged from 0.15 to 0.59 x 10³ eggs m-2. Sacks filled with clusters of up to nine eggs reaching sizes up to 238 µm were identified as nematode eggs (this study; Pitusi et al., 2021). Different development stages of the eggs were observed with visible larvae inside and hatching occurred toward mid- and end of April. Subsequently, the observed ice nematode community in May consisted mainly of juveniles. Most juveniles appeared to have gut coloration due to the ingestion of ice algae. Adults found in March lacked gut coloration, which changed as ice algal biomass started to establish itself.
Pelagic chlorophyll a and microzooplankton community
The pelagic chlorophyll a concentrations were several orders of magnitude lower than in the ice (Table 6). For example, in April and May, the Chl a values in the water varied between 0.12 to 9.40 µg L-1, while the non-integrated ice chlorophyll a concentrations ranged from 2.21 to 979.02 µg L-1.
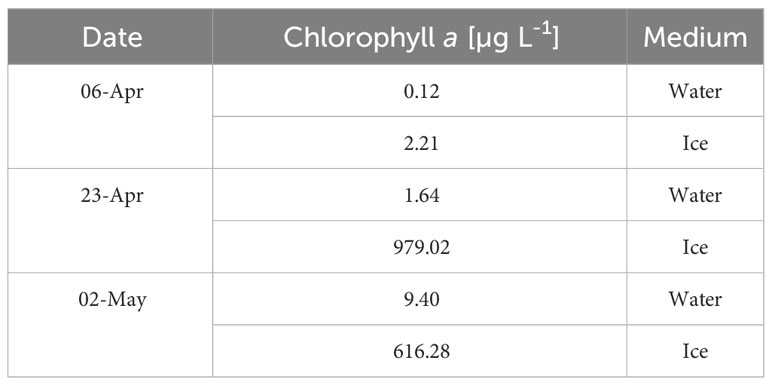
Table 6 Chlorophyll a concentrations (µg L-1) measured on selected dates in the water and in the ice.
The net samples, from station MS, yielded a slightly higher species richness than the sea ice samples with 15 taxa identified, including eggs and an unidentified fraction (Table 4). Taxa present in the ice (e.g. nematodes and polychaete juveniles) were also present in the net samples, but they weremuch less abundant (Supplementary material 7; Table 1).
For the net sampling dates, nematode abundance in the water column only ranged from 0.10 to 0.11 x 10³ ind m-2, compared to 0.2 to 18.2 x 10³ ind m-2, in sea ice. Similarly, polychaete juvenile abundance in the water column ranged between 0 to 0.15 x 10³ ind m-2 compared to 0.06 to 0.7 x 10³ ind m-2, in sea ice. The CA shows how the sea ice and pelagic samples do not cluster together, but are clearly apart from each other (Figure 7). The sea ice samples from 03-Mar and 23-Apr are close to each other with the same taxa grouping closely to both dates. Comparatively, the pelagic samples not only do no cluster with the sea ice samples, but also appear to be different from each other with the pelagic sample from 03-Mar close to three different species of copepods, whereas the pelagic sample from 23-Apr is closer to cirripede nauplii.
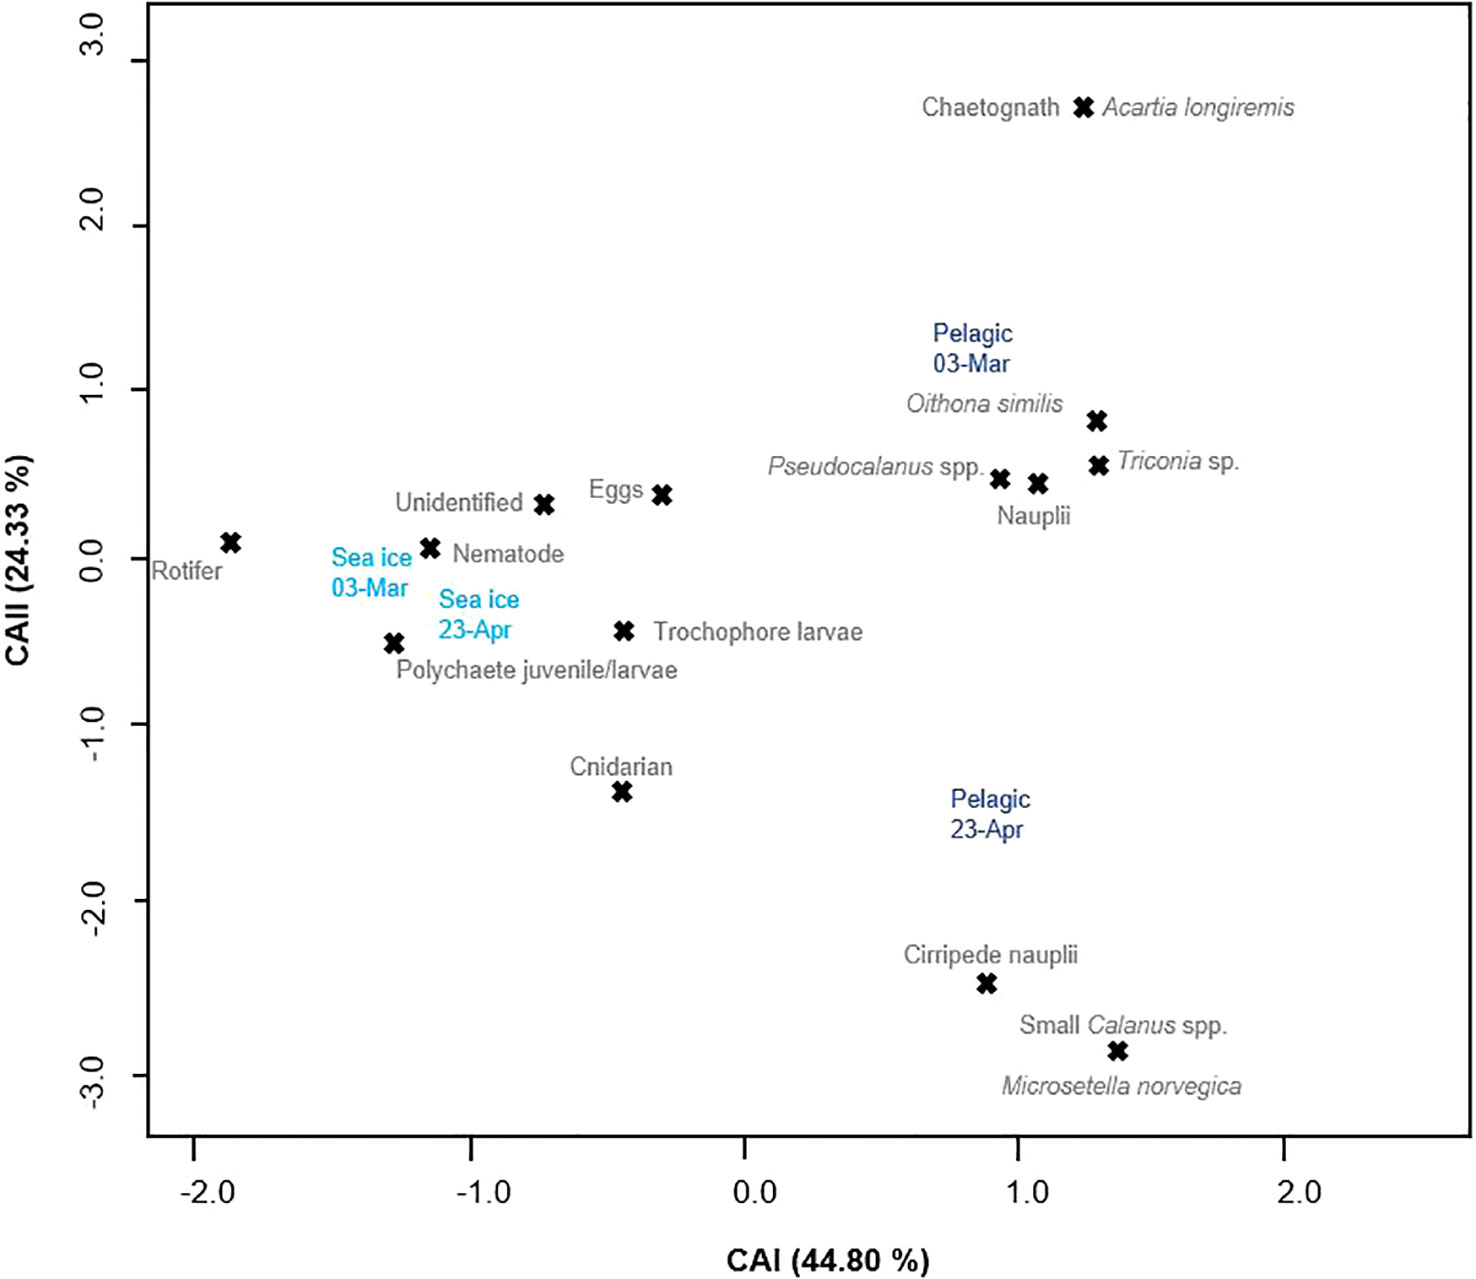
Figure 7 Canonical-analysis (CA) of the simultaneously collected sea ice and pelagic 20-µm net samples from 03-Mar and 23-Apr. The sampled mediums were plotted together with the observed sympagic meiofauna and microzooplankton to illustrate the dissimilarity between the samples.
Discussion
Sea ice metazoan community
This is the first study on metazoan in and under sea ice with a note on the phenology of ice nematodes in landfast-ice, in Svalbard. In this study, the sympagic organisms identified are well-known components of in-ice communities from other parts of the Arctic – nematodes, benthic polychaete juveniles, and eggs (Kern and Carey, 1983; Marquardt et al., 2011; Bluhm et al., 2018).
Sympagic meiofauna abundances found in Svalbard can be compared to other regions of the Arctic (Bluhm et al., 2018 and references herein). Subsequently, mean peak meiofaunal abundance (25.3 x 10³ ind m-2) was greater in Svalbard than the results of Carey (1992) from inshore Narwhal Island (Beaufort Sea), where abundances ranged between 4.5 to 8.0 x 10³ ind m-2. Abundances were, however, lower than those recorded by Cross and Martin (1987) (Baffin Island) and Marquardt et al. (2011) (Canadian Beaufort Sea), who found up to 54.0 x 10³ ind m-2 and 4.1 to 473.8 x 10³ ind m-2, respectively. The total number of ice meiofauna discovered in Van Mijenfjorden is most similar to Nozais et al. (2001), who recorded an abundance of 1.73 to 33.25 x 10³ ind m-2 at their landfast-ice station in Baffin Bay from April to May 1998. Additionally, Nozais et al. (2001) found that nematodes contributed between 80.5 to 98.5 % toward the total community count; a similar pattern to what was observed in the present study in Van Mijenfjorden. Similar abundance patterns were also observed by Gradinger et al. (2009) in sediment laden sea ice, where meiofaunal abundances never exceeded 17 x 103 ind m-2 compared to the sediment free site where abundance increased from 18 to 276 x 103 ind m-2.
The differences in abundance between Svalbard and other Arctic locations could arise from discrepancies in ice algal biomass, local hydrography, or other parameters such as sea ice duration. For example, ice algal biomass in our study was relatively low compared to data from the Canadian Arctic and Pacific sector (see Leu et al., 2015). This could be linked to differences in the nutrient and/or light availability. Alternatively, the extent of the sea ice period might play an important role, too. The duration of the sea ice period in Svalbard has been changing (Urbański and Litwicka, 2022) and a shorter ice cover period means that communities do not have as much time to establish themselves. In Svalbard, sea ice melt can also be initiated pre-maturely by the intrusion of Atlantic water, which is present on the west coast of Spitsbergen as the West Spitsbergen Current. Although Van Mijenfjorden is partially protected by Akseløya, Atlantic water can still enter the fjord due to tidal currents and initiate the melt from below causing release of the ice biota from the lower centimeters. Widell (2005) showed that advected warm (> 0°C) water can lead to melt of several centimeters a day. We suggest that this Atlantic-influenced setting with no direct connection to the Arctic Ocean might contribute toward the observed lower sympagic meiofaunal abundance compared other Arctic regions.
Sympagic meiofauna diversity did not vary greatly across months. Most of the 12 taxa/categories were present from the start of the sampling season until the end. The community mostly consisted of nematodes, polychaete larvae/juveniles, eggs and lesser abundant organisms such as copepods and their nauplii. Although there were a couple of new taxa at the end of the season, their appearance can be attributed mainly to seasonal immigration of occasionally pelagic taxa. For example, cirripede nauplii appeared only at the end of April and start of May when they are highly abundant in the water column in Spitsbergen, comprising up to 46 % of the mesozooplankton abundance in late spring (own data; Stübner et al., 2016). The sea ice algae at the undersurface of sea ice offers highly concentrated and nutritious food for cirripedia. A pattern that can be seen in the RDA, where cirripede nauplii were positively correlated to ice chlorophyll a. Thus, their appearance in the sea ice can be seen as a by-product of the highly abundant food, but not due to their direct development in the ice. This is also supported by the CA that showed that the cirripede nauplii lay closest to the water sample from 23-Apr, and not the sea ice samples.
Other taxa, such as nematodes, had a continuous presence in the ice throughout the season. They displayed a relatively constant abundance until the end of April when meiofaunal density was highest, due to the reproduction of ice nematodes rather than the movement of new taxa into the sea ice. This points toward the hypothesis that, in Svalbard fjords, the meiofauna that is incorporated at the start of the season forms a standing stock, which reproduce and develops rather than a seasonal turnover in taxa groups.
The role of sea ice
Based on our observations, sea ice appears to be a reproduction and nursery ground. Like nematodes, eggs were consistently found within samples, and they have also been observed to be a significant contributor toward the sympagic community in other studies (e.g. Kramer, 2011; Kiko et al., 2017). Five morphotypes of eggs were identified, which are few in comparison to the 21 morphologically different eggs Marquardt et al. (2011) found in the Canadian high-Arctic. Nonetheless, the presence of different eggs and the development of larvae inside eggs support the hypothesis that seasonal sea ice is an important reproductive ground for pelagic and benthic organism (Marquardt et al., 2011; Bluhm et al., 2018). This held especially true for three kinds of eggs from arrow worms, fish, and nematodes. We know that nematode eggs were directly produced within the sea ice and underwent full development. Contrarily, arrow worm and fish eggs were most likely produced outside the sea ice and incorporated during freezing. This assumption stems from the body size of the adults, which are too large to live within sea ice themselves. Marquardt et al. (2011) also recorded arrow worm eggs in their samples but did not see larvae developing inside like we did. In Van Mijenfjorden, the chaetognath Parasagitta elegans dominates and the more oceanic Eukrhonia hamata is hardly observed (Svendheim, 2017). Chaetognaths are thought to produce eggs already in March (Svendheim, 2017), which would agree with what we found. We did not find any arrow worm eggs after March, which might just be due to the patchiness of sympagic communities, but neither did we find Chaetognath juveniles. This might imply that after hatching they either exploit the water column rather than the sea ice, or they die off within sea ice and provide food for heterotrophs.
Sea ice did serve as a nursery ground and refuge for meroplanktonic polychaete larvae/juveniles. In March, both trochophore larvae and nectochaetes (referred to as polychaete larvae) were present. A similar pattern was observed by Grainger and Hsiao (1990) that noted a much higher presence of polychaete offspring in March compared to the rest of the spring. Polychaete larvae present had bushy chaete and displayed four black eyespots. As the season progressed, they grew setiger and not only increased in body size, but by late April/early May also in body width. As their body size increased, bushy chaete were lost and other morphological features developed, such as feeding palps. Development of such morphological features points toward a stage where juveniles are ready to settle on the seafloor and metamorphose into adults. Bluhm et al. (2018) stated that with an increase in body size comes a decrease in their abundance, which we also observed (e.g. IS & MS). At this point, juveniles are over 1 mm in size and, thus, might not easily move through the brine channels anymore.
This fast growth due to favorable conditions within sea ice was verified by McConnell et al. (2012). They conducted an experiment that looked at the growth of ice-associated polychaete larvae at different food concentrations. The authors determined that at full saturation, polychaete larvae were able to develop into fully developed juveniles within 46 days opposed to the 1 % food saturation where the development was slow. Consequently, not only does growth progress much more rapidly within sea ice, but they are also not subjected to high predation pressure within sea ice. The ice hydroid Sympagohydra tuuli might pose a potential threat (Kramer et al., 2011), but this species does not tend to occur in high abundances within sea ice. Thus, utilization of sea ice by polychaete larvae might lead to high recruitment, as opposed to larvae staying in the water column where growth might be slower, predation pressure higher, and recruitment potentially lower.
Nematode phenology
Nematodes are one of the most abundant and characteristic meiofaunal groups being highly abundant in sediment and sea ice (Bluhm et al., 2018). Within Arctic sea ice, four species of nematodes have been identified morphologically - Theristus melnikovi (Tchesunov, 1986), Cryonema crassum and C. tenue (Tchesunov and Riemann, 1995), and Hieminema obliquorum (Tchesunov and Portnova, 2005). In Svalbard, the presence of Theristus sp. was confirmed through molecular work, as well as the presence of Halomonhystera sp. (Pitusi et al., 2021). In this study, we unfortunately did not identify the ice nematodes counted. Although we were not able to distinguish which genus/species dominated, we can state that this taxa group was abundant not only at the main station (MS) but present at all stations sampled during this study. This widespread occurrence could be linked to the adaptation nematodes display that would facilitate the colonization of sea ice. Nematodes have needle-like and elongated bodies that enable them to move not only easily through sediment grains, but also the narrow brine channels within sea ice. Additionally, they are known to be anhydrobiotic (Rebecchi et al., 2020) and able to survive extremely high salinities and low temperatures (Heip et al., 1985). Friedrich (1997) showed in an experiment that ice nematodes can survive brine salinities as high as 100 and temperatures as low as -6.8°C.
Tchesunov (1986) who described Theristus melnikovi from multi-year ice, previously assumed that ice nematodes are autochthonous. However, with the discovery of ice nematodes in seasonal ice, this view was challenged by Riemann & Sime-Ngando (1997). They suggested that ice nematodes are allochthonous, and reproduction takes place outside the ice. With the reproduction of ice nematodes recorded in Alaska’s landfast-ice (Gradinger and Bluhm, 2020) and now in Svalbard, where the whole reproduction cycle was captured, we disagree with Riemann & Sime-Ngando (1997).
In March, we observed adults with seemingly no trace of food in their guts, which changed as the season progressed. This is not to say that individuals did not feed. Based on gut content and live observations, it is known that ice nematodes feed on each other, protist and ice algae (e.g. Tchesunov and Riemann, 1995; Patrohay et al., 2022; this study). However, little ice algal biomass was available in early March. Thus, if they were not solely feeding on each other, bacteria or dissolved organic matter (DOM) might have been another food source. Nematodes are known to switch food source based on what the highest available quality food source is (Jensen, 1987).
As ice algal biomass started to accumulate, nematodes started to show distinct green/brown gut coloration, and they were seen to be located within the lumps of ice algae. Whether they ingested ice algae purposely or as a by-product of consuming other food we cannot say for certain. With the presence of food in their guts came the presence of mature females with developed oocytes. Although males have been described for two of the four ice nematode species, namely Theristus melnikovi and Hieminema obliquorum, we did not observe any males or copulation taking place. Thus, we assume that reproduction occurred through parthenogenesis, which is the second most common form of reproduction in nematodes (Lee, 2002). It has also been proposed for ice nematodes Cryonema crassum and C.tenue (Riemann & Sime-Ngando, 1997), which we assume to be the matured females observed in our samples. After females with oocytes were noted in early April, clusters of eggs in a sack started to appear (Figure 8). Eggs were seen in different stages of cleavage until juveniles gradually developed. These juveniles started hatching in late April, which caused a stark peak in nematode abundance, which has also been observed in Alaska coastal fast ice (Gradinger and Bluhm, 2020). After hatching, the nematode community consisted mainly of juveniles. These juveniles were observed to feed, had green/brownish guts, and were often found within lumps of algae. From 29-Apr to 02-May, nematode abundance decreased by 80 % due to the onset of ice melt and flushing out of organisms.
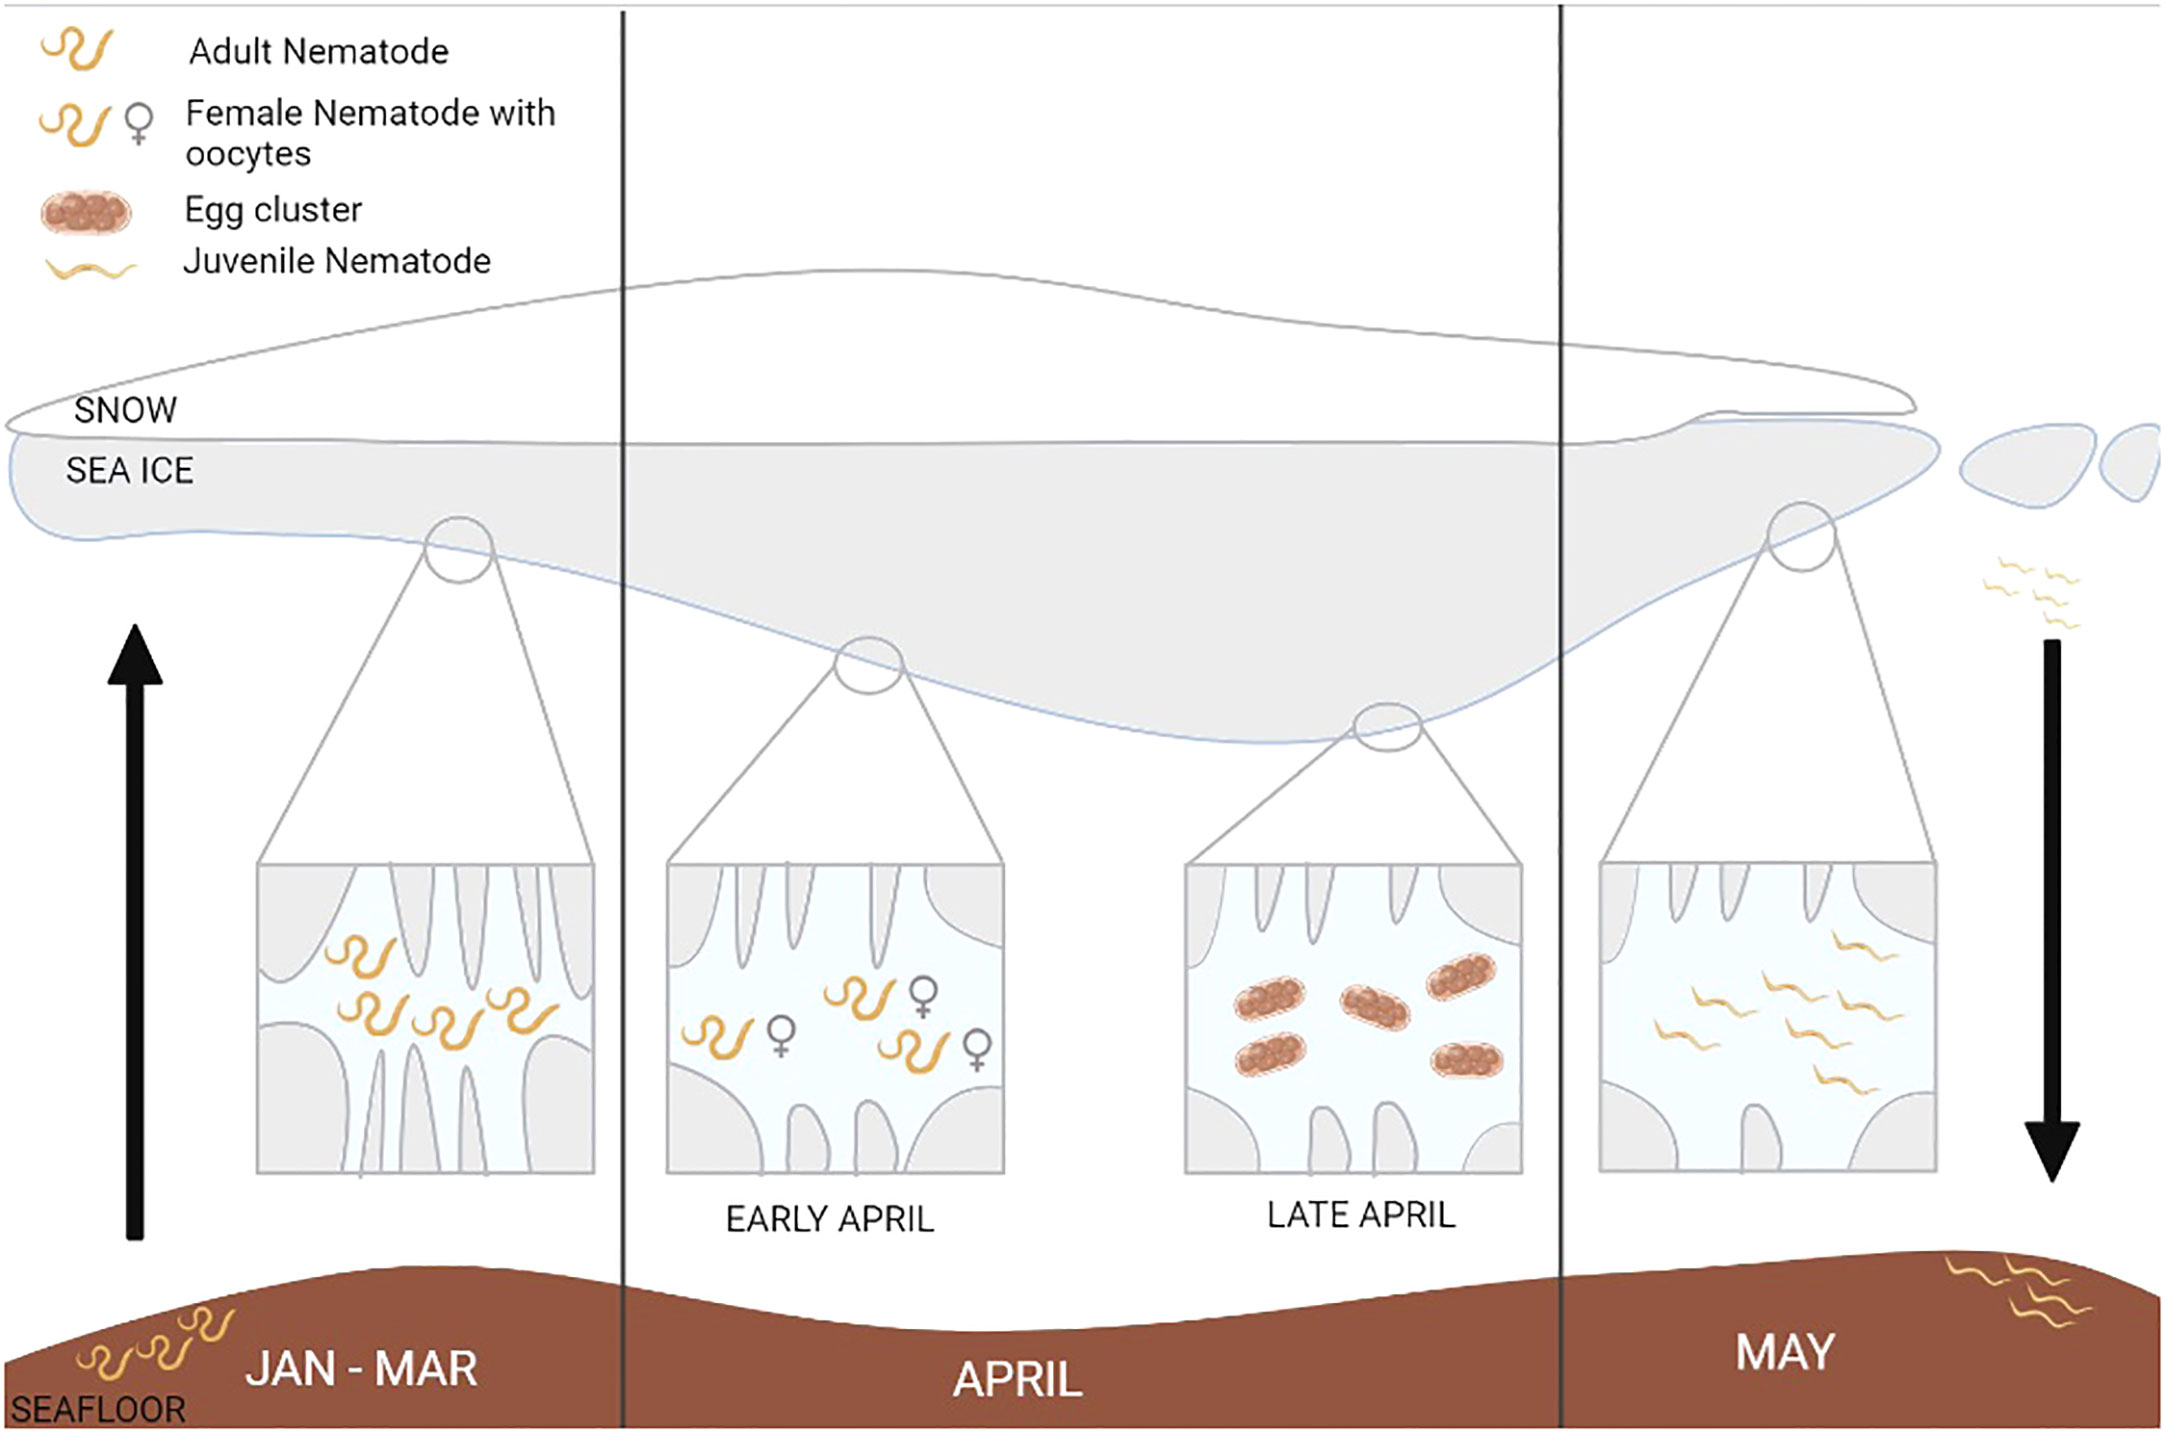
Figure 8 Illustration of the observed nematode life cycle within sea ice created with BioRender.com (2023). © Vanessa Pitusi.
What happens to ice nematodes after has only been speculated so far, which impedes the assessment of the importance of sea ice in their life cycle. However, Portnova et al. (2019) found the first specimens of Cryonema spp. in sediment samples from the Laptev Sea. The authors discussed the fate of Cryonema spp. after ice melt and proposed a potential life cycle based on the sediment dynamics and hydrography of the southern inner shelf of the Laptev Sea. The suggested one-year life cycle is split between time in the sea ice and sediment. In July, the sea ice would melt in the Laptev Sea and suspended matter would start to settle. Due to the additional input of riverine material, the water would become turbid and after some time a bottom nepheloid layer would start to form. This layer is a highly nutritious food source and, thus, this is where juvenile and adult ice nematodes would settle. The summer is ice-free and the freeze-up would occur in October. Wind and waves stir up the water and sediment leading to a resuspension of ice nematodes into the water column. As sea ice crystals form, they scavenge the suspended specimens, which are consequently incorporated into newly formed ice. The environmental change would induce transition to sexually mature individuals.
The latter is debatable for our samples, based on the maturation taking place after food availability started to increase rather than based on the physical environment.
As Portnova et al. (2019) did not find sexually active nematodes in the sediment samples, it could be argued that they require sea ice to complete their one-year life cycle. This means that nematodes could be among those taxa most impacted by the loss of sea ice, resulting in substantial reductions in occurrences in various parts of the Arctic ice cover (Melnikov et al., 2002; Ehrlich et al., 2020).
Spatial variability
Along the depth transect, abundances and diversity differed between the stations, which is also evident in the CA (Figure 1; Supplementary material 5). Statistical testing did not deem this to be a statistically significant difference, but this might be due to the small sample size. Differences in abundance and diversity were expected as water depth has been shown to be a controlling factor in structuring sea ice communities (Gulliksen and Lønne, 1989; Bluhm et al., 2018). We observed such structuring in a few of our samples, especially at the shallow stations (IS & IM). Here, we observed the highest abundance of polychaete juveniles, especially at IS, which might be due to strong benthic-sympagic coupling and the easy accessibility of sea ice to polychaete larvae/juveniles. An indication for this explanation was observed in the RDA for the transect stations, which showed that the occurrence of polychaete larvae/juveniles was inversely correlated to water depth. Sea ice offers a concentrated food supply of eukaryotic protists compared to the food-poor water column in the winter-spring. This was reflected in the low abundance of polychaete juveniles and low chlorophyll a concentrations in our pelagic samples compared to the ice. At the deeper stations (> 50 m), polychaete juveniles were less abundant or absent (VMF1 and VMF2), which could either be linked to the deeper water depth or other structuring factors (such as sea floor sediment type). The sediment type at the deeper stations was observed to consist of compact clay, opposed to the sandy sediment found at the innermost station (IS) (personal observation). Polychaetes of the Family Spionidae, which are represented in the ice, prefer sandy sediment to build tubes in (Hartmann-Schröder, 1996).
The outer stations (MS, VMF1 and VMF2) had highly variable meiofaunal abundances but similar diversity. At all stations, nematodes, eggs, cirripede nauplii, and an unidentified fraction were present. Differences in the community arose from the presence of polychaete juveniles, which were only found at the main station (MS) and Harpacticoids at station VMF1. Considering that these stations did not vary too greatly in depth, the stark difference in meiofaunal count could not have been influenced solely by bottom depth. Station MS had the highest abundance due to nematode larval hatchment, but VMF1 and VMF2 had low meiofaunal counts, in comparison. According to Leu et al. (2020), VMF1 and VMF2 had low nutrient concentrations, which points toward a passed bloom. Moreover, the snow cover at these stations was low (6.2-6.3 cm), which has been shown to negatively affect ice algae and, hence, lead to poor food quality (Leu et al., 2010). Additionally, sea ice at station VMF2 had formed relatively late compared to the other stations making it “young” essentially (Figure 1; Supplementary material 8). Young ice implies little time for colonization by either ice algae or sympagic meiofauna, which is supported by the RDA that deemed ice age a significant variable. Consequently, the combination of young ice with low snow cover resulted in unfavorable conditions for the establishment of a well-developed sympagic meiofauna community. Another factor that could have affected the communities at the outer stations is the proximity to open water. Although Van Mijenfjorden is largely protected from the intrusion of warm Atlantic water through the presence of Akseløya (Høyland, 2009), it can occur. The presence of warm water under the ice would lead to slugging-off of any biological life in the lower few centimeters of the ice, and result in low abundance counts.
Vertical distribution of sympagic meiofauna
Previous studies revealed that within landfast-ice, the biological activity is largely constrained to the lowermost 10-cm of the sea ice (Bluhm et al., 2018). Especially, the lower 3-cm houses most of the ice flora and fauna due to its proximity to the underlying water column offering stable living conditions and a constant re-supply of nutrients (Gradinger and Bluhm, 2005). We found the same, as little to no fauna was found past the lower 10-cm of the ice. In the lower 3-cm, where most of the biological activity was located, none of the measured sea ice physical variables were limiting. Sea ice in the bottom layer was fully permeable with brine volume fractions above 5 % (Golden et al., 1998) and therefore habitable space for meiofauna. Also neither brine salinity nor ice temperature were within uninhabitable ranges (e.g. Grainger and Mohammed, 1990; Patrohay et al., 2022). Potentially the negative freeboard at some locations could provide suitable habitat at the flooded ice-snow interface as recently observed for Arctic algae (Fernandez-Mendez et al., 2018), which we however did not study. In the few cases when we studied whole ice cores no fauna was found higher up the core due to low temperatures, high brine salinities and low brine volume fractions, thus leading to the accumulation of biological activity in the lower 10-cm of the ice
In our main station samples, we observed that in the early part of the winter-spring (March and early April), meiofauna was distributed relatively evenly within the lower 10-cm of the ice. Only on 08-Mar, we observed a slightly higher proportion (52 %) of meiofauna in the 3-10-cm section, which could be related to the fast increase in ice thicknesses during this period, leaving biota a few cm above the vertically progressing ice front. At that point, ice algal biomass had not built yet due to environmental limitations such as low light. As the season progressed, most ice meiofauna concentrated in the lower 2-cm, which was mirrored in the ice algae, and a pattern supported by the significant results of the linear regression that showed that sympagic meiofauna abundance in the lower 1-cm was positively correlated to ice algal biomass. This supports the known positive correlation between ice algal and meiofaunal abundance (Nozais et al., 2001; Bluhm et al., 2018). Simply put, ice meiofauna follow their food, which is needed to fuel reproduction and growth.
Sea ice algal concentrations
Sea ice chlorophyll a concentrations can be used as a proxy for ice algal biomass and, thus, food availability to omni- and herbivorous fauna.
The ice algal biomass at the main station (MS) followed the three-phase bloom scenario as described in Leu et al. (2015). Low concentrations were observed in March, which increased toward the end of April before declining in May. On average, the range of chlorophyll a concentrations was low compared to the range found in the Canadian Arctic Archipelago, where values as high as 300 mg Chl a m-2 have been measured (e.g. Cota et al., 1991). Though this could be considered an extraordinarily high value, other studies have recorded ice algal biomass up to 160 mg Chl a m-2 (Resolute Passage, Canadian Arctic) (see Leu et al., 2015), which is already three times the maximum value recorded for Rijpfjorden (Leu et al., 2010) and ten times for Van Mijenfjorden (this study). Chlorophyll a concentrations are more comparable to the Young Sound, NE Greenland with 3 mg Chl a m-2 (Glud et al., 2007). Spatially, the chlorophyll a concentrations measured at the transect stations did not follow the same pattern as observed for the ice meiofauna. The chlorophyll a values steadily increased toward the outer stations up until VMF1. Station VMF2 had very low concentrations, which might be linked to the low nutrient concentrations (Leu et al., 2020) or the young age of the ice resulting in a short establishment time for ice algae. Additionally, snow might have played a role. Snow cover greatly influences the amount of light that is able to penetrate sea ice and reach the under-ice surface.
Sympagic-pelagic coupling
Considering the low abundance of pelagic fauna in our sea ice samples and the minimal sea ice fauna in the pelagic net samples, we propose for the connection between sea ice and the underlying water column to be weak and benthic-sympagic coupling to be higher in Van Mijenfjorden. When taking a closer look at the CA, it becomes apparent that most metazoans clustering closely to the sea ice samples are of benthic origin, as opposed to the pelagic ones that lay closest to the water samples.
Broadly speaking, the majority of taxa groups overlapped between sea ice and the water column, but they vary greatly in abundance. Albeit the statistical testing did not deem the sea ice and pelagic samples to be significantly different, this might be linked due to our very small sample size. Samples from the water column revealed a slightly higher biodiversity compared to sea ice, with 15 taxa represented instead of 12. However, target organisms, such as nematodes, were more abundant in the sympagic realm throughout the spring. Additional support arises from the CA that showed that nematodes clustered with the sea ice samples rather than the pelagic samples. The lack of nematodes in the water could be linked to their rather poor swimming abilities (Cross and Martin, 1987; Kiko et al., 2017).
Conversely, an overlap in taxa between the sea ice and underlying water column might occur due to animals living mostly in the lower 1-cm of the ice and being flushed into the water column below during sea ice sampling. This could especially apply for the fauna with poor swimming abilities (e.g., nematodes, see Palmer, 1984; Kiko et al., 2017). Additionally, low concentrations in the water column could be due to low food availability compared to the ice, which makes it a less desirable habitat, in the winter-spring. We found a significant positive relationship between the abundance of ice nematodes and chlorophyll a in the lower 1-cm of the ice, where the bulk of the biomass was located.
Even though we found no statistical significance to support this, but higher food availability, might also explain why polychaete juveniles were more abundant in sea ice than the water column. It is common for polychaetes to have planktonic larvae with good swimming abilities. We did find a small number of polychaete larvae/juveniles in the water column, but nothing in the range of what we observed in the sea ice. Due to their swimming abilities they are can be more proactive about their choice of habitat. Evidently, they chose to inhabit the fjord ice due to the highly concentrated food, which has been shown to lead to faster growth and development (McConnell et al., 2012).
Additionally, the taxa resolution in this paper is relatively coarse meaning that even though groups overlap we do not know if they are necessarily the same species or not. For example, we find cnidarians both in the water column and in the ice. We did, however, note that these were not the same kind.
Conclusion
This is the first study to document the spatial and temporal abundance of meiofauna in and under fjord ice in Svalbard. Most of the meiofauna was located in the lowermost 2-cm of the ice especially during peak abundance at the end of April. However, there seemed to be weak sympagic-pelagic coupling despite the organisms being located so closely to the ice-water interface. From our data, we conclude that there is a seasonal development of an ice meiofauna standing stock that is comprised of numerous well-known sympagic organisms, especially nematodes. Nematodes completed part of their previously proposed one-year life cycle in the ice meaning that less reliable sea ice formation and loss of sea ice could severely impact ice nematode populations, in the near future. Parallelly, polychaete larvae utilized the highly abundant and concentrated ice algae to develop and grow into juveniles ensuring recruitment to the seafloor as early as May.
Thus, we propose that for these two meiofauna taxa sea ice plays an important role in their life cycle when present. We propose that the next step would be to determine the species of nematode and polychaete inhabiting the sea ice to compile all information on them, and to see if they are commonly found in ice-free habitats. This information is necessary to evaluate how crucial a role sea ice plays in their life cycle, and how changing sea ice conditions might (negatively) affect recruitment of these taxa.
Data availability statement
The original contributions presented in the study are included in the article/Supplementary Material. Further inquiries can be directed to the corresponding author.
Ethics statement
The manuscript presents research on animals that do not require ethical approval for their study.
Author contributions
VP, JS, and RG contributed toward the study concept and design. Funding for this research was acquired by VP, JS, and RG. Sample collection was performed by VP and JS. Laboratory analysis was performed by VP. Data analysis and evaluation was done by VP, JS, and RG. The first draft was written by VP, and the other authors commented on the draft before everyone agreed on the final version. All authors contributed to the article and approved the submitted version.
Funding
This research was supported by the Fram Centre, Norway (Flagship Arctic Ocean, FADE, pgpj. nr 1182018; 2018-2021) and the 2017-2018 Belmont Forum and BiodivERsA joint call for research proposals, under the BiodivScen ERA-Net COFUND programme, and the funding organisation RCN ((pcp). nr. 296836; 2019-2022). This research was also supported by the Norwegian Research Council, project nr 243702 (FAABulous) and the Arctic Field Grant with Research in Svalbard project nr 10641.
Acknowledgments
The authors would like to thank the UNIS logistics department for facilitating fieldwork. Thank you to all fellow colleagues of the FAABulous project for lending a hand in field. The authors wish to express their gratitude to Miriam Marquardt and Stuart Thompson for advice with laboratory analysis and helping set things up. Thanks to Vegard Stürzinger for help with the map and Cheshtaa Chitkara for advice with the statistical analysis. The authors would like to thank the reviewers for their constructive feedback.
Conflict of interest
The authors declare that the research was conducted in the absence of any commercial or financial relationships that could be construed as a potential conflict of interest.
Publisher’s note
All claims expressed in this article are solely those of the authors and do not necessarily represent those of their affiliated organizations, or those of the publisher, the editors and the reviewers. Any product that may be evaluated in this article, or claim that may be made by its manufacturer, is not guaranteed or endorsed by the publisher.
Supplementary material
The Supplementary Material for this article can be found online at: https://www.frontiersin.org/articles/10.3389/fmars.2023.1201359/full#supplementary-material
References
Bi H., Zhang J., Wang Y., Zhang Z., Zhang Y., Fu M., et al. (2018). Arctic sea ice volume changes in terms of age as revealed from satellite observations. IEEE J. Selected Topics Appl. Earth Observ. Remote Sens. 11 (7), 2223–2237. doi: 10.1109/JSTARS.2018.2823735
Bluhm B. A., Hop H., Vihtakari M., Gradinger R., Iken K., Melnikov I. A., et al. (2018). Sea ice meiofauna distribution on local to pan-Arctic scales. Ecol. Evol. 8 (4), pp.2350–2364. doi: 10.1002/ece3.3797
Carey A. G. Jr. (1992). The ice fauna in the shallow southwestern Beaufort Sea, Arctic Ocean. J. Mar. Syst. 3 (3), 225–236. doi: 10.1016/0924-7963(92)90002-P
Conover R. J., Huntley M. (1991). Copepods in ice-covered seas—distribution, adaptations to seasonally limited food, metabolism, growth patterns and life cycle strategies in polar seas. J. Mar. Syst. 2 (1-2), 1–41.
Cota G. F., Legendre L., Gosselin M., Ingram R. G. (1991). Ecology of bottom ice algae: I. Environmental controls and variability. J. Mar. Syst. 2 (3-4), 257–277.
Cox G. F., Weeks W. F. (1983). Equations for determining the gas and brine volumes in sea-ice samples. J. Glaciol. 29 (102), 306–316. doi: 10.3189/S0022143000008364
Cross W. E. (1982). Under-ice biota at the Pond Inlet ice edge and in adjacent fast ice areas during spring. Arctic, 13–27. doi: 10.14430/arctic2304
Cross W. E., Martin C. M. (1987). Effects of oil and chemically treated oil on nearshore under-ice meiofauna studied in situ. Arctic, 258–265. doi: 10.14430/arctic1819
Ehrlich J., Schaafsma F. L., Bluhm B. A., Peeken I., Castellani G., Brandt A., et al. (2020). Sympagic fauna in and under Arctic pack ice in the annual sea-ice system of the new Arctic. Front. Mar. Sci. 7, 452. doi: 10.3389/fmars.2020.00452
Fernandez-Mendez M., Olsen L. M., Kauko H. M., Meyer A., Rösel A., Merkouriadi I., et al. (2018). Algal hot spots in a changing Arctic Ocean: Sea-ice ridges and the snow-ice interface. Front. Mar. Sci. 5, 75. doi: 10.3389/fmars.2018.00075
Friedrich C. (1997). Ökologische Untersuchungen zur Fauna des arktischen Meereises (Alfred-Wegener-Inst. für Polar-und Meeresforschung). Available at: https://epic.awi.de/id/eprint/26424/.
Garrison D. L., Buck K. R. (1986). Organism losses during ice melting: a serious bias in sea ice community studies. Polar Biol. 6 (4), 237–239. doi: 10.1007/BF00443401
Glud R. N., Rysgaard S., Kühl M., Hansen J. W. (2007). The sea ice in Young Sound: Implications for carbon cycling. Carbon Cycling Arctic Mar. Ecosystems: Case Study Young Sund. Meddr. Grønland Biosci. 58, 62–85.
Golden K. M., Ackley S. F., Lytle V. I. (1998). The percolation phase transition in sea ice. Science 282 (5397), 2238–2241.
Gradinger R. R., Bluhm B. A. (2005). Susceptibility of sea ice biota to disturbance in the shallow Beaufort Sea: Phase 1: Biological coupling of sea ice with the pelagic and benthic realms. University of Alaska Coastal Marine Institute, OCS Study MMS 2005-062, pp. 50–59. Available at: https://www.arlis.org/docs/vol1/C/35130626/35130626-2004.pdf#page=58
Gradinger R., Bluhm B. A. (2020). First analysis of an Arctic sea ice meiofauna food web based on abundance, biomass and stable isotope ratios. Mar. Ecol. Prog. Ser. 634, 29–43. doi: 10.3354/meps13170
Gradinger R. R., Kaufman M. R., Bluhm B. A. (2009). Pivotal role of sea ice sediments in the seasonal development of near-shore Arctic fast ice biota. Mar. Ecol. Prog. Ser. 394, 49–63. doi: 10.3354/meps08320
Grainger E. H., Hsiao S. I. (1990). Trophic relationships of the sea ice meiofauna in Frobisher Bay, Arctic Canada. Polar Biology 10 (4), 283–292.
Grainger E. H., Mohammed A. A. (1990). High salinity tolerance in sea ice copepods. Ophelia 31 (3), pp.177–pp.185. doi: 10.1080/00785326.1990.10430860
Greenacre M. J. (2010). Correspondence analysis. Wiley Interdiscip. Rev.: Comput. Stat 2 (5), 613–619. doi: 10.1002/wics.114
Gulliksen B., Lønne O. J. (1989). Distribution, abundance, and ecological importance of marine sympagic fauna in the Arctic. Rapp PV Reun. Cons. Int. Explor. Mer. 188, 133–138.
Hartmann-Schröder G. (1996). Annelida. Borstenwürmer Polychaete Tierwelt Deutschlands Teil 58. Gustav Fischer Verlag Jena, 648.
Heip C. H. R., Vincx M., Vranken G. (1985). The ecology of marine nematodes. Oceanogr. Mar. Biol.: Annu. Rev.
Hop H., Vihtakari M., Bluhm B. A., Assmy P., Poulin M., Gradinger R., et al. (2020). Changes in sea-ice protist diversity with declining sea ice in the Arctic Ocean from the 1980s to 2010s. Front. Mar. Sci. 7, 243. doi: 10.3389/fmars.2020.00243
Hop H., Vihtakari M., Bluhm B. A., Daase M., Gradinger R., Melnikov I. A. (2021). Ice-associated amphipods in a pan-arctic scenario of declining sea ice. Front. Mar. Sci. 8, 743152. doi: 10.3389/fmars.2021.743152
Høyland K. V. (2009). Ice thickness, growth and salinity in Van Mijenfjorden, Svalbard, Norway. Polar Res. 28 (3), 339–352. doi: 10.1111/j.1751-8369.2009.00133.x
Jensen P. (1987). Feeding ecology of free-living aquatic nematodes. Mar. Ecol. Prog. Ser. 35, 87–196. doi: 10.3354/meps035187
Kashiwase H., Ohshima K. I., Nihashi S., Eicken H. (2017). Evidence for ice-ocean albedo feedback in the Arctic Ocean shifting to a seasonal ice zone. Sci. Rep. 7 (1), 1–10. doi: 10.1038/s41598-017-08467-z
Kern J. C., Carey A. G. Jr. (1983). The faunal assemblage inhabiting seasonal sea ice in the nearshore Arctic Ocean with emphasis on copepods. Mar. Ecol. Prog. Series Oldendorf 10 (2), 159–167. doi: 10.3354/meps010159
Kiko R., Kern S., Kramer M., Mütze H. (2017). Colonization of newly forming Arctic sea ice by meiofauna: a case study for the future Arctic? Polar Biol. 40 (6), 277–1288. doi: 10.1007/s00300-016-2052-5
Klekowski R. Z., Węsεsawski J. M. (1991). “Atlas of the marine fauna of South Spitsbergen. Vol. 2,” in Invertebrates (Ossolineum, Gdansk: Polish Academy of Sciences).
Kohlbach D., Ferguson S. H., Brown T. A., Michel C. (2019). Landfast sea ice-benthic coupling during spring and potential impacts of system changes on food web dynamics in Eclipse Sound, Canadian Arctic. Mar. Ecol. Prog. Ser. 627, 33–48. doi: 10.3354/meps13071
Kohlbach D., Graeve M., A. Lange B., David C., Peeken I., Flores H. (2016). The importance of ice algae-produced carbon in the central Arctic Ocean ecosystem: Food web relationships revealed by lipid and stable isotope analyses. Limnol. Oceanogr. 61 (6), 2027–2044. doi: 10.1002/lno.10351
Kovacs K. M., Krafft B. A., Lydersen C. (2020). Bearded seal (Erignathus barbatus) birth mass and pup growth in periods with contrasting ice conditions in Svalbard, Norway. Mar. Mammal Sci. 36 (1), 276–284. doi: 10.1111/mms.12647
Kramer M. (2011). The role of sympagic meiofauna in Arctic and Antarctic sea-ice food webs (Doctoral dissertation). Institute for Polar Ecology (IPÖ), Christian-Albrechts Universität zu Kiel. Available at: https://oceanrep.geomar.de/id/eprint/14719/1/diss_kramer_ipoe_2010.pdf.
Krembs C., Gradinger R., Spindler M. (2000). Implications of brine channel geometry and surface area for the interaction of sympagic organisms in Arctic sea ice. J. Exp. Mar. Biol. Ecol. 243 (1), 55–80. doi: 10.1016/S0022-0981(99)00111-2
Kwok R. (2018). Arctic sea ice thickness, volume, and multiyear ice coverage: losses and coupled variability, (1958–2018). Environ. Res. Lett. 13 (10), p.105005. doi: 10.1088/1748-9326/aae3ec
Larink O., Westheide W. (2011). Coastal Plankton: Photo Guide for European Seas. Germany: Pfeil Verlag.
Lee D. L. (2002). The biology of nematodes (CRC Press). Available at: https://www.taylorfrancis.com/books/edit/10.1201/b12614/biology-nematodes-donald-lee.
Leu E., Brown T. A., Graeve M., Wiktor J., Hoppe C. J., Chierici M., et al. (2020). Spatial and temporal variability of ice algal trophic markers—with recommendations about their application. J. Mar. Sci. Eng. 8 (9), 676.
Leu E., Mundy C. J., Assmy P., Campbell K., Gabrielsen T. M., Gosselin M., et al. (2015). Arctic spring awakening–Steering principles behind the phenology of vernal ice algal blooms. Prog. Oceanogr. 139, 151–170. doi: 10.1016/j.pocean.2015.07.012
Leu E., Wiktor J., Søreide J. E., Berge J., Falk-Petersen S. (2010). Increased irradiance reduces food quality of sea ice algae. Mar. Ecol. Prog. Ser. 411, 49–60. doi: 10.3354/meps08647
Marquardt M., Kramer M., Carnat G., Werner I. (2011). Vertical distribution of sympagic meiofauna in sea ice in the Canadian Beaufort Sea. Polar Biol. 34 (12), 1887–1900. doi: 10.1007/s00300-011-1078-y
Marquardt M., Majaneva S., Pitusi V., Søreide J. E. (2018). Pan-Arctic distribution of the hydrozoan Sympagohydra tuuli? First record in sea ice from Svalbard (European Arctic). Polar Biol. 41 (3), 583–588. doi: 10.1007/s00300-017-2219-8
McConnell B., Gradinger R., Iken K., Bluhm B. A. (2012). Growth rates of arctic juvenile Scolelepis squamata (Polychaeta: Spionidae) isolated from Chukchi Sea fast ice. Polar Biol. 35 (10), 1487–1494. doi: 10.1007/s00300-012-1187-2
Melnikov I. A., Kolosova E. G., Welch H. E., Zhitina L. S. (2002). Sea ice biological communities and nutrient dynamics in the Canada Basin of the Arctic Ocean. Deep Sea Res. Part I: Oceanogr. Res. Papers 49 (9), 1623–1649. doi: 10.1016/S0967-0637(02)00042-0
Muckenhuber S., Nilsen F., Korosov A., Sandven S. (2016). Sea ice cover in Isfjorden and Hornsund, Svalbard, (2000–2014) from remote sensing data. Cryosphere 10 (1), 149–158. doi: 10.5194/tc-10-149-2016
Nakawo M., Sinha N. K. (1981). Growth rate and salinity profile of first-year sea ice in the high Arctic. J. Glaciol. 27 (96), 315–330. doi: 10.3189/S0022143000015409
National Snow and Ice Data Center (2023) Arctic Sea Ice News & Analysis. Available at: http://nsidc.org/arcticseaicenews/.
Nicolaus M., Katlein C., Maslanik J., Hendricks S. (2012). Changes in Arctic sea ice result in increasing light transmittance and absorption. Geophys. Res. Lett. 39 (24). doi: 10.1029/2012GL053738
Norwegian Meteorological Institute (2023). Available at: https://cryo.met.no/archive/ice-service/icecharts/quicklooks/.
Nozais C., Gosselin M., Michel C., Tita G. (2001). Abundance, biomass, composition and grazing impact of the sea-ice meiofauna in the North Water, northern Baffin Bay. Mar. Ecol. Prog. Ser. 217, 235–250. doi: 10.3354/meps217235
Oksanen J., Simpson G. L., Blanchet F. G., Kindt R., Legendre P., Minchin P. R., et al. (2022). ‘vegan’: Community Ecology Package. R package version 2.6-4 October 2022. vegan: Community Ecology Package (r-project.org). Available at: https://cran.r-project.org/web/packages/vegan/vegan.pdf.
Osuch M., Wawrzyniak T. (2017). Inter-and intra-annual changes in air temperature and precipitation in western Spitsbergen. Int. J. Climatol. 37 (7), 3082–3097. doi: 10.1002/joc.4901
Palmer M. A. (1984). Invertebrate drift: behavioral experiments with intertidal meiobenthos. Mar. Freshw. Behav. Physiol. 10 (3), 235–253. doi: 10.1080/10236248409378620
Parsons T. R., Maita Y., Lalli C. M. (1984). A manual of chemical and biological methods for seawater analysis (New York: Pergamon Press).
Patrohay E., Gradinger R., Marquardt M., Bluhm B. A. (2022). First trait-based characterization of Arctic ice meiofauna taxa. Polar Biol. 45 (12), 1673–1688. doi: 10.1007/s00300-022-03099-0
Pavlova O., Gerland S., Hop H. (2019). Changes in sea-ice extent and thickness in Kongsfjorden, Svalbard, (2003–2016). Ecosystem Kongsfjorden Svalbard, 105–136. doi: 10.1007/978-3-319-46425-1_4
Peng G., Steele M., Bliss A. C., Meier W. N., Dickinson S. (2018). Temporal means and variability of Arctic sea ice melt and freeze season climate indicators using a satellite climate data record. Remote Sens. 10 (9), 1328. doi: 10.3390/rs10091328
Pitusi V. (2019). Seasonal abundance and activity of sympagic meiofauna in Van Mijenfjorden, Svalbard (UiT Norges arktiske universitet). Available at: https://munin.uit.no/bitstream/handle/10037/15941/thesis.pdf?isAllowed=y&sequence=2
Pitusi V., Søreide J. E., Hassett B. T., Marquardt M., Andreasen M. H. (2021). The occurrence of Nematoda in coastal sea ice on Svalbard (European Arctic) determined with the 18S small subunit rRNA gene. Polar Biol. 44 (6), 1153–1162. doi: 10.1007/s00300-021-02863-y
Portnova D., Fedyaeva M. A., Udalov A. A., Tchesunov A. V. (2019). Community structure of nematodes in the Laptev Sea shelf with notes on the lives of ice nematodes. Regional Stud. Mar. Sci. 31, 100757. doi: 10.1016/j.rsma.2019.100757
R Core Team (2021). R: A language and environment for statistical computing (Vienna, Austria: R Foundation for Statistical Computing). Available at: https://www.r-project.org/.
Rebecchi L., Boschetti C., Nelson D. R. (2020). Extreme-tolerance mechanisms in meiofaunal organisms: a case study with tardigrades, rotifers and nematodes. Hydrobiologia 847 (12), 2779–2799. doi: 10.1007/s10750-019-04144-6
Riemann F., Sime-Ngando T. (1997). Note on sea-ice nematodes (Monhysteroidea) from Resolute Passage, Canadian high Arctic. Polar Biol. 18, 70–75. doi: 10.1007/s003000050160
Schauberger P., Walker A., Braglia L., Sturm J., Garbuszus J. M., Barbone J. M. (2023). openxlsx: read, write and edit xlsx files. https://cran.r-project.org/web/packages/openxlsx/index.html
Schratzberger M., Holterman M., van Oevelen D., Helder J. (2019). A worm's world: Ecological flexibility pays off for free-living nematodes in sediments and soils. BioScience 69 (11), 867–876. doi: 10.1093/biosci/biz086
Screen J. A., Deser C., Smith D. M., Zhang X., Blackport R., Kushner P. J., et al. (2018). Consistency and discrepancy in the atmospheric response to Arctic sea-ice loss across climate models. Nat. Geosci. 11 (3), 155–163. doi: 10.1038/s41561-018-0059-y
Skogseth R., Olivier L. L., Nilsen F., Falck E., Fraser N., Tverberg V., et al. (2020). Variability and decadal trends in the Isfjorden (Svalbard) ocean climate and circulation–An indicator for climate change in the European Arctic. Prog. Oceanogr. 187, 102394. doi: 10.1016/j.pocean.2020.102394
Søreide J. E., Leu E. V., Berge J., Graeve M., Falk-Petersen S. T. I. G. (2010). Timing of blooms, algal food quality and Calanus glacialis reproduction and growth in a changing Arctic. Global Change Biol. 16 (11), 3154–3163.
Spindler M., Dieckmann G. S. (1986). Distribution and abundance of the planktic foraminifer Neogloboquadrina pachyderma in sea ice of the Weddell Sea (Antarctica). Polar Biol. 5 (3), 185–191. doi: 10.1007/BF00441699
Stübner E. I., Søreide J. E., Reigstad M., Marquardt M., Blachowiak-Samolyk K. (2016). Year-round meroplankton dynamics in high-Arctic Svalbard. J Plankton Res 38 (3), 522–536.
Stroeve J., Notz D. (2018). Changing state of Arctic sea ice across all seasons. Environ. Res. Lett. 13 (10), 103001. doi: 10.1088/1748-9326/aade56
Sumata H., de Steur L., Divine D. V., Granskog M. A., Gerland S. (2023). Regime shift in Arctic Ocean sea ice thickness. Nature 615 (7952), 443–449.
Svendheim L. H. (2017). Seasonal progression of the zooplankton community in a high Arctic fjord and the main physical and biological drivers. Master’s thesis, Nord university. Available at: https://nordopen.nord.no/nord-xmlui/bitstream/handle/11250/2458294/Master_thesis_LinnHSvendheim.pdf?sequence=1.
Tchesunov A. V. (1986). A new free-living nematode connected with sea Arctic ice (in Russian). Zool Zh 65, 1782–1787.
Tchesunov A. V. (1988). A new free-living nematode connected with Arctic sea ice (National Research Council, Canada Institute for Scientific and Technical Information).
Tchesunov A. V., Portnova D. A. (2005). Free-living nematodes in seasonal coastal ice of the White Sea. Description of Hieminema obliquorum gen. et sp. n.(Nematoda, Monhysteroidea). Zoologicheskii Zhurnal 84 (8), 899–914.
Tchesunov A. V., Riemann F. (1995). Arctic sea ice nematodes (Monhysteroidea), with descriptions of Cryonema crassum gen. n., sp. n. and C. tenue sp. n. Nematologica 41 (1-4), 35–50.
Timco G. W., Frederking R. M. W. (1996). A review of sea ice density. Cold Reg Sci Technol 24 (1), 1–6.
Tverberg V., Skogseth R., Cottier F., Sundfjord A., Walczowski W., Inall M. E., et al. (2019). The Kongsfjorden transect: seasonal and inter-annual variability in hydrography. Ecosystem Kongsfjorden Svalbard, 49–104. doi: 10.1007/978-3-319-46425-1_3
Urbański J. A., Litwicka D. (2022). The decline of Svalbard land-fast sea ice extent as a result of climate change. Oceanologia. doi: 10.1016/j.oceano.2022.03.008
Vihtakari M. (2022) _ggOceanMaps: Plot Data on Oceanographic Maps using 'ggplot2'. Available at: https://mikkovihtakari.github.io/ggOceanMaps/.
Walsh J. E., Johnson C. M. (1979). An analysis of Arctic sea ice fluctuations 1953–77. J. Phys. Oceanogr. 9 (3), 580–591. doi: 10.1175/1520-0485(1979)009<0580:AAOASI>2.0.CO;2
Wickham H. (2016) (New York: Springer-Verlag). Available at: https://ggplot2.tidyverse.org.
Wickham H., Averick M., Bryan J., Chang W., McGowan L. D., François R., et al. (2019). “Welcome to the tidyverse.” 4, 43, 1686. doi: 10.21105/joss.01686
Wickham H., Bryan J. (2023) readxl: Read Excel Files. Available at: https://readxl.tidyverse.orghttps://github.com/tidyverse/readxl.
Wickham H., Ruiz E. (2018). dbplyr: A’dplyr’Back End for Databases. https://dbplyr.tidyverse.org/
Wickham H., Vaughan D., Girlich M. (2023) tidyr: Tidy Messy Data. Available at: https://tidyr.tidyverse.orghttps://github.com/tidyverse/tidyr.
Widell K. (2005). “Turbulent mixing in the under-ice boundary layer in Van Mijenfjorden (Svalbard), melt season 2004,” in 8th Conference on Polar Meteorology and Oceanography.
Wieser W. (1953). The relationship between the mouth cavity form, feeding habit and occurrence in free-living marine nematodes. An ecological-morphological study. Arkiv Zoologi 4 (5), 439–484.
Wilke C. O., Wickham H., Wilke M. C. O. (2019). Package ‘cowplot’ (Streamlined plot theme and plot annotations for ‘ggplot2). Available at: https://wilkelab.org/cowplot/.
Keywords: Arctic, Svalbard, sea ice meiofauna, nematode, community composition, biodiversity
Citation: Pitusi V, Gradinger R and Søreide JE (2023) Temporal and spatial variability of sympagic metazoans in a high-Arctic fjord, Svalbard. Front. Mar. Sci. 10:1201359. doi: 10.3389/fmars.2023.1201359
Received: 06 April 2023; Accepted: 17 August 2023;
Published: 08 September 2023.
Edited by:
Satya Panigrahi, Indira Gandhi Centre for Atomic Research (IGCAR), IndiaReviewed by:
Jayachandran Paravanparambil Rajakumar, King Fahd University of Petroleum and Minerals, Saudi ArabiaKatarzyna Grzelak, Polish Academy of Sciences, Poland
Copyright © 2023 Pitusi, Gradinger and Søreide. This is an open-access article distributed under the terms of the Creative Commons Attribution License (CC BY). The use, distribution or reproduction in other forums is permitted, provided the original author(s) and the copyright owner(s) are credited and that the original publication in this journal is cited, in accordance with accepted academic practice. No use, distribution or reproduction is permitted which does not comply with these terms.
*Correspondence: Vanessa Pitusi, dmFuZXNzYS5waXR1c2lAZ21haWwuY29t
†ORCID: Vanessa Pitusi, orcid.org/0000-0003-0761-2280
Rolf R. Gradinger, orcid.org/0000-0001-6035-3957
Janne E. Søreide, orcid.org/0000-0002-6386-2471