 Xiao Chen
 Hao Zhang1,2*
 Yong Gao
- 1Department of Electronic Engineering, Ocean University of China, Qingdao, China
- 2Department of Electrical and Computer Engineering, University of Victoria, Victoria, BC, Canada
A coprime array with fewer sensors can achieve the same resolution as a uniform linear array. However, when detecting co-frequency targets, there can be prominent false alarms due to overlaps between the main and grating lobes of subarrays. This study proposes a direction-of-arrival (DOA) estimation method to obtain the co-frequency target directions from high grating lobes. The method utilizes joint processing of sound pressure and vibration velocity data from vector hydrophones of a coprime vector hydrophone array and designs joint-cross terms (JCTs) using channel combinations. Based on JCTs, we establish a characteristic data point identification algorithm. The method in this paper can stably and accurately acquire co-frequency target directions from high grating lobes without decoherence operation. Simulation results demonstrate that the proposed algorithm achieves accurate DOA estimation even with reduced signal-to-noise ratio (SNR) and fewer data points. Additionally, a sea experiment confirms the rationality and efficiency of the proposed algorithm, providing new ideas for co-frequency source detection using coprime vector sensor arrays.
1 Introduction
Direction-of-arrival (DOA) estimation is an essential aspect of array signal processing that holds immense significance in multiple fields, including acoustics, radar, and wireless communications (Zhang et al., 2022; Xie et al., 2023; Zhang et al., 2023). Classic techniques for DOA estimation involve subspace theory and typically utilize methods such as multiple signal classification (MUSIC) (Schmidt, 1986) and estimating signal parameters via rotational invariance techniques (ESPRIT) (Roy and Kailath, 1989). In these algorithms, uncorrelated incident signals are assumed, and coherent signals will fail due to the covariance matrix’s rank deficit. To handle coherent signal situations, several techniques have been suggested, such as spatial smoothing (SS) (Pillai and Kwon, 1989) and forward/backward SS (FBSS) (Shan et al., 1985). The SS method achieves DOA estimation of coherent signals but at the cost of decreasing array aperture. The FBSS method can enhance estimation accuracy but does not fully address signal decoherence. Furthermore, these techniques typically consider ULAs, with sparse linear arrays being less commonly employed.
Coprime line arrays (CLAs) offer a systematic array setup beyond Nyquist sampling while minimizing mutual coupling between array elements (Vaidyanathan and Pal, 2010; Vaidyanathan and Pal, 2011; Adhikari et al., 2013; Zhang et al., 2013; Tan et al., 2014; Adhikari and Buck, 2015; Di Martino and Iodice, 2017; Qin et al., 2017; Zhou et al., 2017; Alawsh and Muqaibel, 2018; Mei et al., 2018; Adhikari, 2019; Moghadam and Shirazi, 2019; Alawsh and Muqaibel, 2020; Alawsh and Muqaibel, 2021; Moghadam and Shirazi, 2022). The research on DOA estimation of the coprime array is mainly carried out from two aspects. On the one hand, it is implemented from the physical array domain. On the other hand, it is achieved in the virtual array domain. For processing the physical array elements, a DOA estimation method utilizes a decomposed CLA and solves a joint covariance matrix optimization problem. The method enables the reconstruction of the interference-plus-noise covariance matrix and weight vector computation for the minimum variance distortionless response (MVDR) beamformer that minimizes variance distortion (Zhou et al., 2016; Zhou et al., 2017). The DOA estimation in the physical array domain suffers from high grating lobes caused by the intersensor spacing, which is greater than (where λ is the wavelength of the signal), and many methods have been investigated in order to reduce the effect of grating lobes. For scalar CLAs, Product and Min algorithms were proposed to calculate the signal spatial power spectral density (PSD) and resolve the grating lobe problems (Adhikari and Buck, 2017). The array factors can be established based on a uniform linear array for single-target direction estimation. The array factors should satisfy that the beam response of the uniform linear array has the opposite amplitude with one subarray of the CLA (Liu and Buck, 2015). Extending the coprime array is also a way to settle the grating lobe matters. Some methods have been suggested to extend CLAs by changing the positions of grating lobes and sidelobes of the beam output for two coprime subarrays (Adhikari et al., 2013; Adhikari et al., 2014; Chen et al., 2023). The methods above for suppressing grating lobes are developed when the signals are incoherent. In the virtual array domain, the investigation of the coprime vector sensor array has received more attention. Nowadays, DOA estimation for coprime vector sensor arrays has already been developed in the radar field. A six-sensor coprime electromagnetic vector-sensor (EMVS) array (Fu et al., 2021) was used in a new method. The method involved a nuclear norm minimization (NNM) problem to create an extended covariance matrix for DOA information. Then, the issue of DOA estimating in a two-dimensional space was examined for a multiple-input multiple-output (MIMO) radar with coprime EMVS arrays operating in a bistatic configuration (Yang et al., 2021). However, these methods are used to process uncorrelated signals for the coprime vector sensor array, while coherent signals are less considered in the application. Moreover, the main advantage of these algorithms in the radar field is the high degree of freedom for DOA estimation. For underwater array target detection, such a high degree of freedom is not an urgent need to be achieved.
In underwater signal detection, vector hydrophone linear arrays are often used. Each vector hydrophone can be composed of hydrophone and velocity sensors. Owing to the frequency-independent dipole directivity of the vector hydrophone, a vector hydrophone linear array has similar performance but with a smaller array aperture compared with a sound pressure array. Moreover, vector hydrophone arrays have attracted wide attention for their left–right discrimination, which acoustic pressure arrays cannot provide (Hawkes and Nehorai, 1998). Furthermore, when the signals of vibration velocity and sound pressure are combined, the combination holds strong anti-isotropic noise ability (Santos et al., 2011; Felisberto et al., 2016; Felisberto et al., 2018). As for practical applications, fulfilling coprime array configuration in underwater vector sensor arrays is a recently new attempt (Chen et al., 2023). Moreover, the issue about DOA estimation of co-frequency signals for underwater coprime vector sensor array is still expected to be addressed.
When the target is incoherent, the array will output high grating sidelobes but not exceed the magnitude of the output in the direction where the targets are located, and this issue has been studied. However, when the targets are co-frequency, overlapping high grating sidelobes can cause higher array output than the magnitudes of the target directions. As a result, the actual targets may be obscured, and the DOA estimation performance will deteriorate. In this paper, we propose an algorithm that utilizes a coprime vector hydrophone array to achieve DOA estimation of two co-frequency signals. We aim to address the issue of concealed targets due to high grating lobes. Thus, the target directions can be identified accurately from the high grating lobes, thereby avoiding false alarms. To enhance robustness, we employ the conventional beamformer (CBF) based on the entire coprime array as the preprocessing method. Joint-cross terms (JCTs) are constructed based on the vector hydrophone subarrays, and the channel combinations of vector hydrophones are utilized in the algorithm. Additionally, we design a characteristic data point identification method based on JCTs. Unlike existing techniques, the proposed method does not perform spatial smoothing, but it is highly effective in processing coherent signals with the same frequency. Simulation results and experimental data analysis validate the effectiveness of the proposed algorithm. The paper’s contributions can be summarized as follows.
1. Firstly, the paper analyzes the cause of the high grating lobes in coprime vector sensor arrays when two co-frequency signals are present. JCTs are constructed using the characteristics of coprime arrays and vector hydrophones, which imply the DOA information.
2. Secondly, a DOA estimation method based on characteristic data point identification algorithm using JCTs is designed, which achieves stable extraction of co-frequency targets’ directions.
This paper is organized as follows. In Section 2, we establish the mathematical signal model of the coprime vector sensor array and attain the array beam output. Next, we advance the situation in which strong grating lobes appear and present an example. In Section 3, we present the DOA estimation method. The DOA estimation method based on characteristic data point identification is introduced based on JCTs to achieve the direction extraction. We validate the method through simulation in Section 4 and experimental data processing in Section 5. Finally, we summarize the article in Section 6.
Notations: The uppercase bold characters denote matrices, while their lowercase counterparts denote vectors. , , and represent the complex conjugate, conjugate transpose, and transpose, respectively. bmI stands for the unit matrix. represents the Kronecker product.
2 Co-frequency signals model
An underwater acoustic vector sensor linear array consists of two sparse uniform vector sensor linear subarrays with M and N physical sensors, respectively. The values of M and N are coprime. The first subarray containing M sensors is spaced apart by Nd, whereas Md spaces apart the second subarray containing N sensors. Here, represents the intersensor unit spacing, where λ indicates the wavelength of the narrowband signal received by the array. With two subarrays sharing the first sensor, the other sensors of each subarray are arranged according to the original structure, and the array configuration is represented in Figure 1 and Equation (1).

Figure 1 Coprime array configuration.
Assuming that the far-field narrowband co-frequency coherent signal impinges on the coprime vector hydrophone from the direction , the received signal can be modeled as:
where. denotes the signal waveform vector and denotes statistically independent Gaussian noise component with , where is the noise power. Here, and , , and denote the pressure component and the horizontal velocity x and y direction components of the noise vector at the ith element, and they are mutually independent. is the steering vector connected with DOA given by:
where . Here, by taking the first array element as a reference, which can be shown in Figure 1. The velocity components of three-dimensional vector hydrophones are displayed in Figure 2. For two-dimensional vector hydrophones in practical application, the 3 × 1 steering vector can be obtained as:
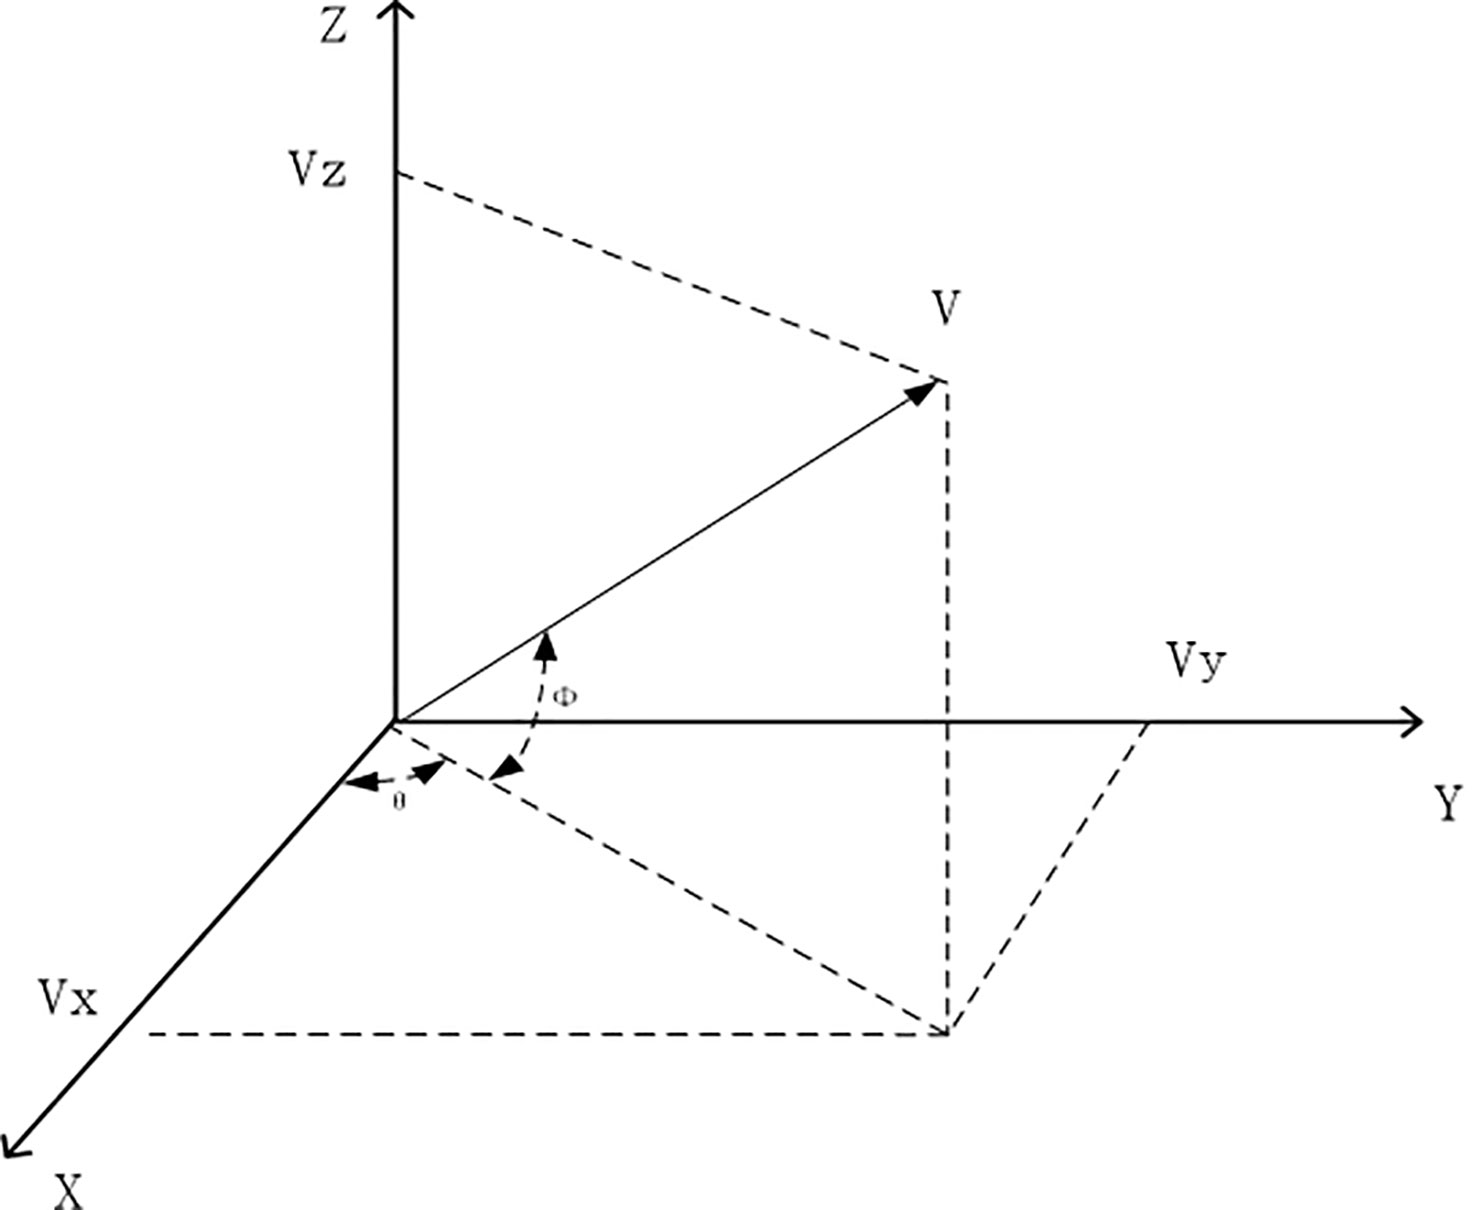
Figure 2 The view of a vector hydrophone geometry.
Without regard to the noise component, the CBF is given by the following equation (Yang and Ye, 2019):
where denotes the weight of the array beamformer and . When there is only one source, the beam output of the array can achieve the maximum output in the source direction. However, when two sources have the same frequency, the large cross-term appears in Eq. (5). The large cross-term will result in large beam outputs in other non-target directions, ultimately leading to false alarms or incorrect bearing estimation results. Figure 3 also explains the situation. The positions indicated by the arrows in the figure represent the grating lobe locations for a coprime vector sensor array. When two subarrays’ grating lobes caused by co-frequency signals overlap, a high output will be generated for the whole array. The directions with grating lobes relation can be explained by the following formula (Adhikari et al., 2014):
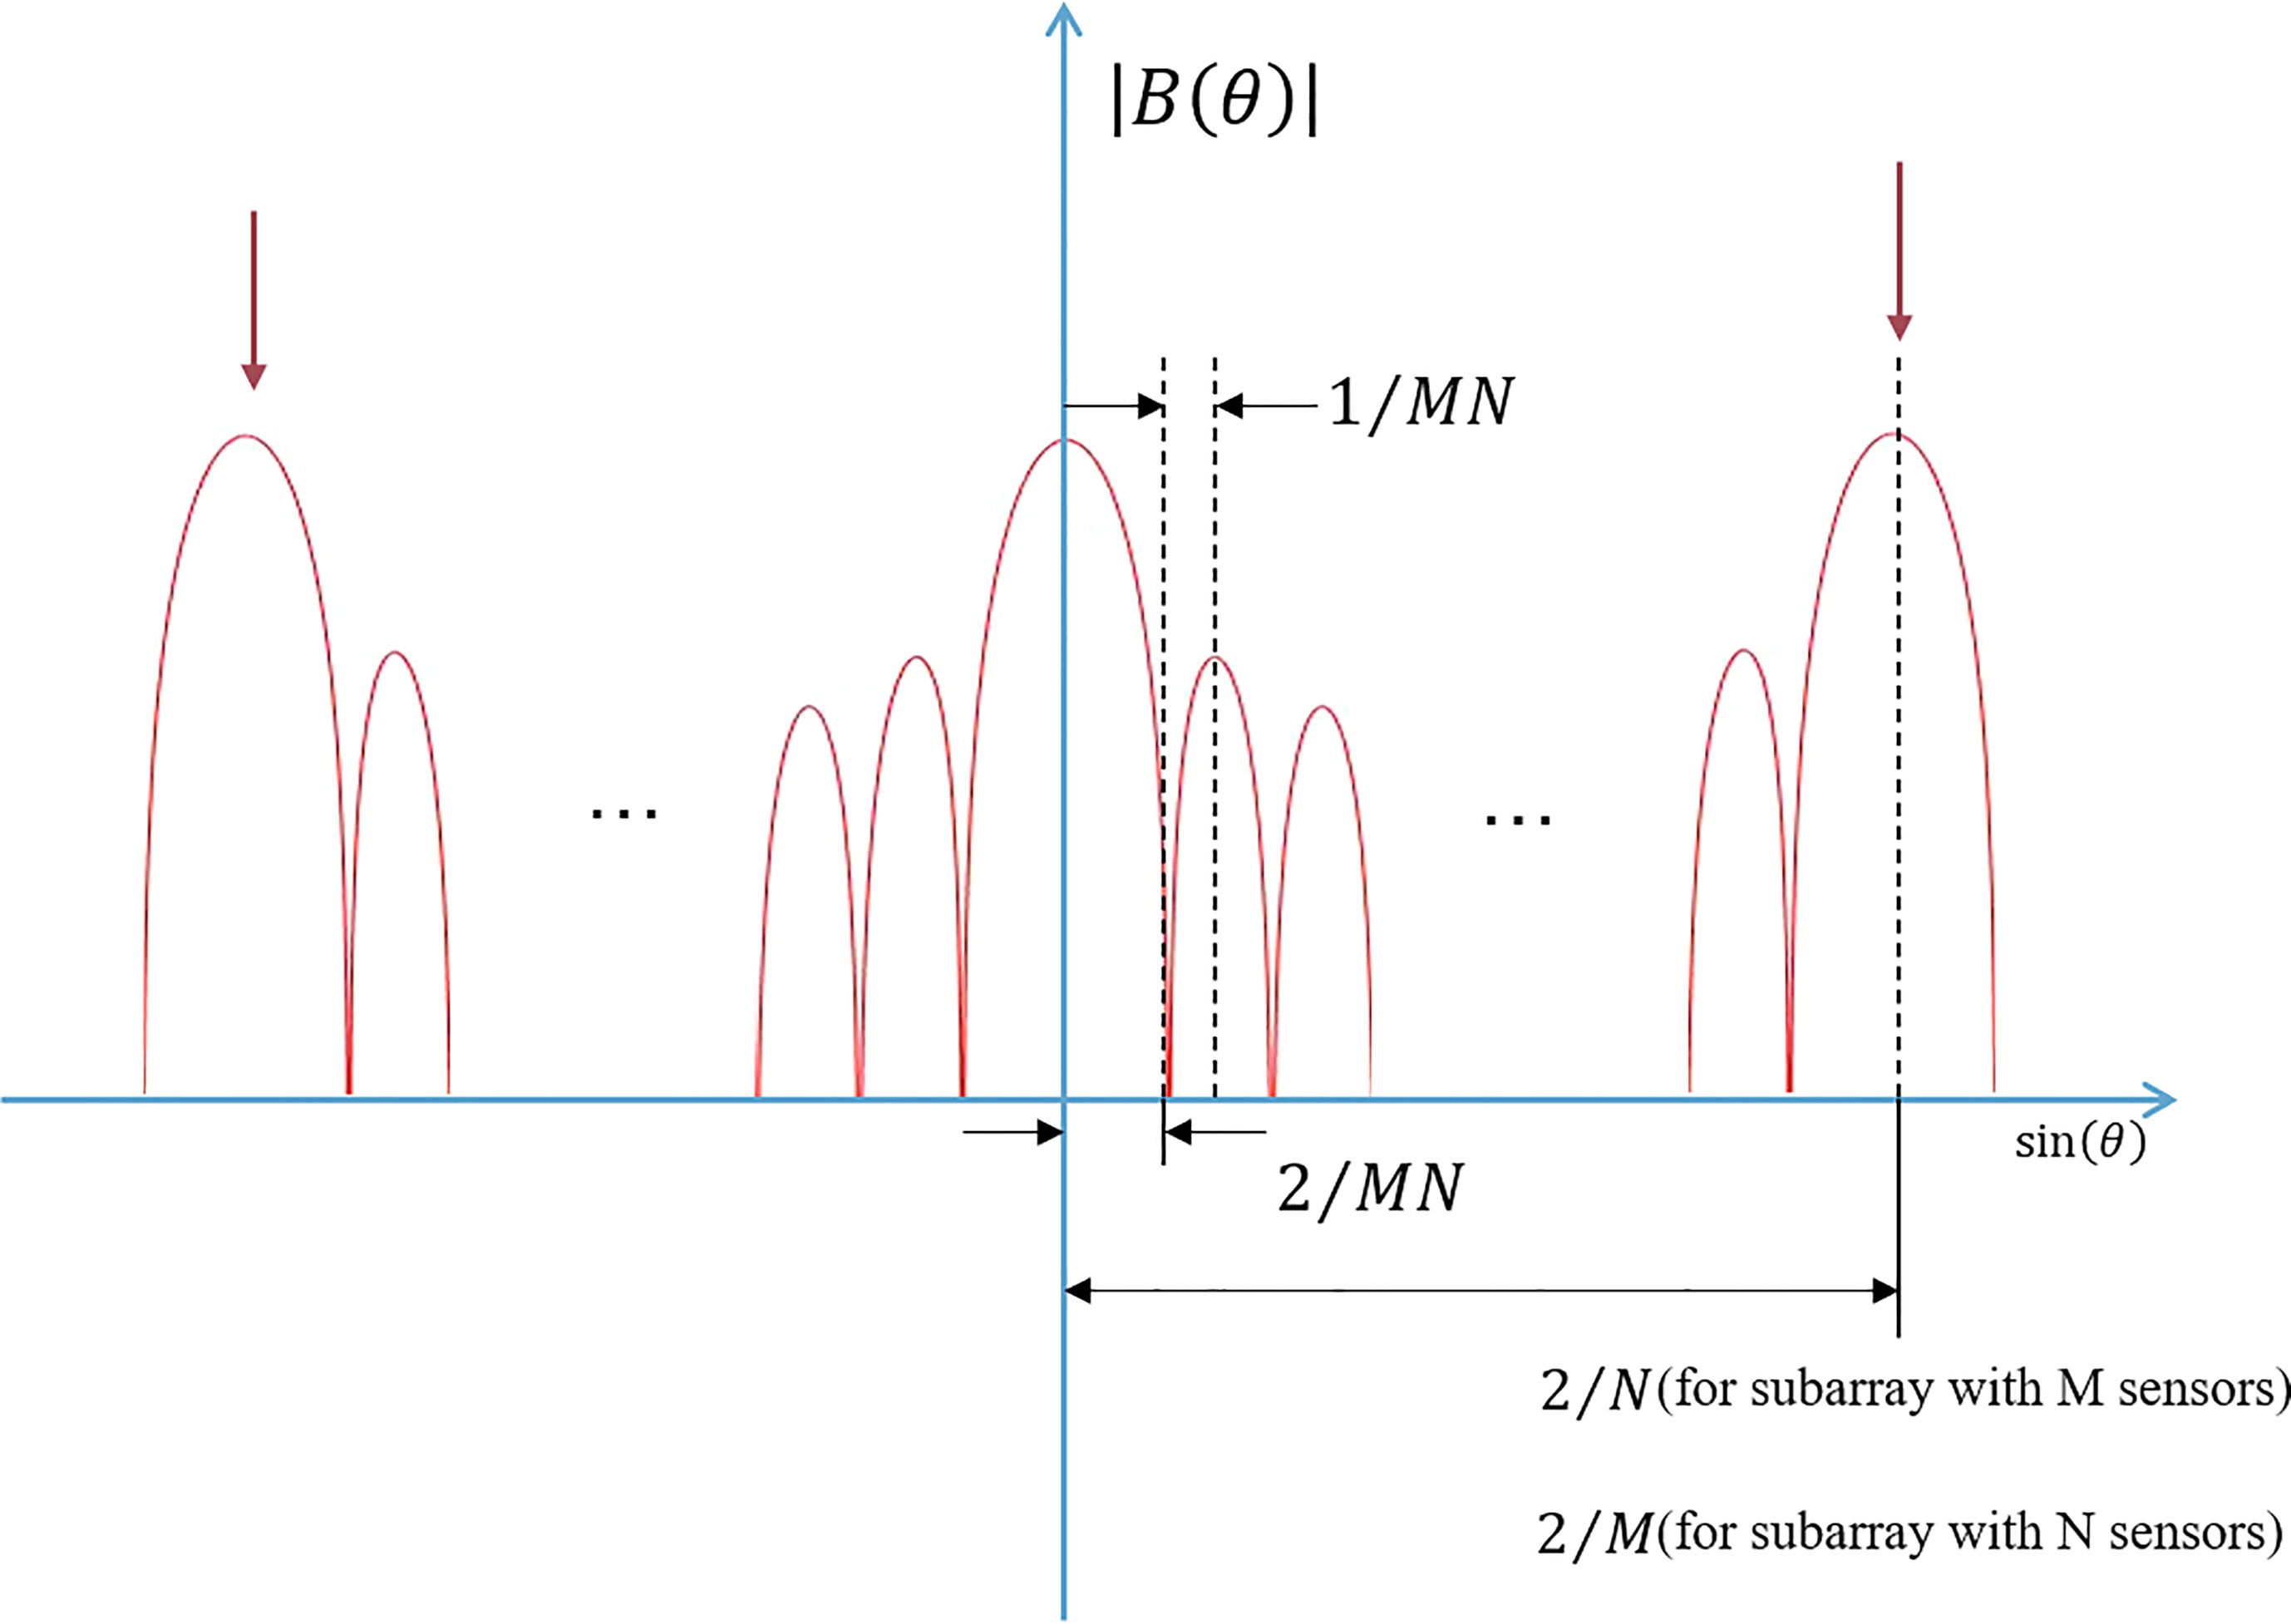
Figure 3 The distribution characteristics of zero point, grating lobes, and sidelobes of a coprime vector sensor array output.
where , , and α and β are two angles satisfying the overlapping relationship of grating lobes. For instance, as shown in Figure 4, the directions of and marked by the black dotted lines are the true co-frequency sources’ directions, whereas the directions of and marked by the red dotted boxes are the false-alarm directions. In Figure 4A, the main lobe of one subarray and the grating lobe of the other subarray coincide, or the grating lobe of one subarray and the grating lobe of the other subarray coincide (as shown in red dotted boxes). Consequently, ambiguity emerges in comparable amplitude beam output to true sources, as shown in Figure 4B.
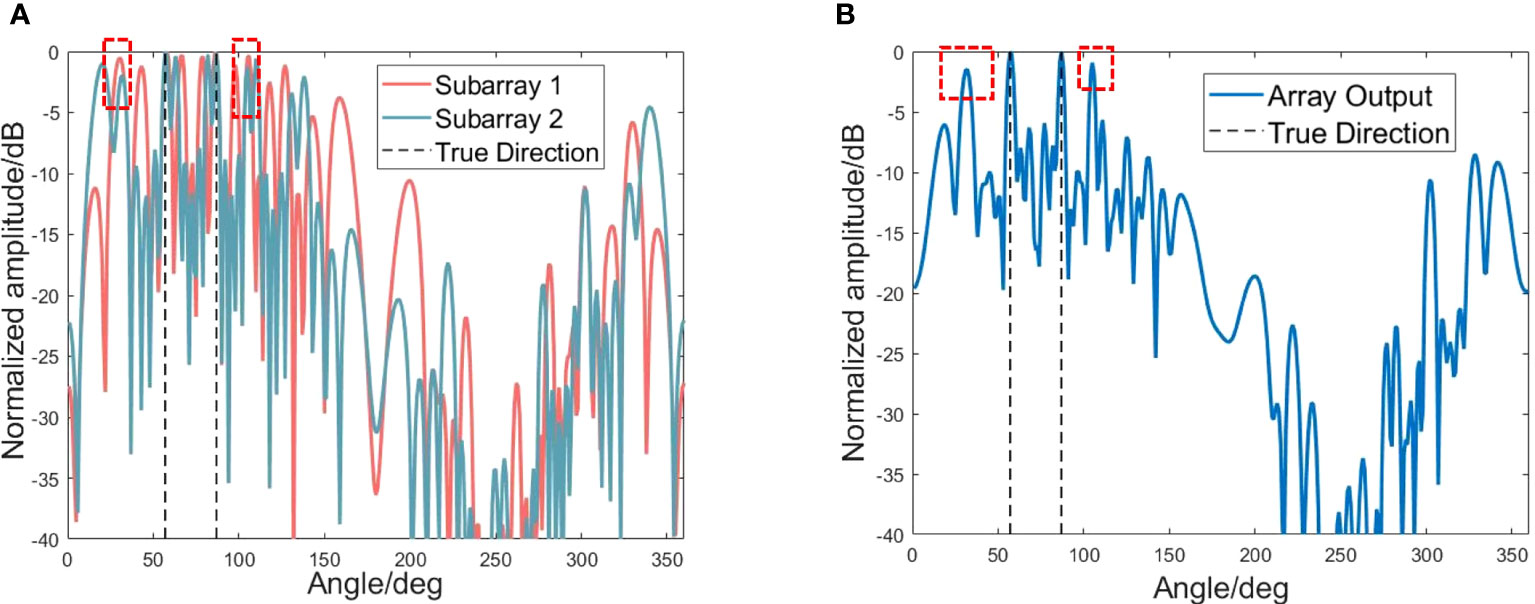
Figure 4 The situation of the blurred orientation output caused by the overlapping of subarray grating lobes. (A) Beam output for two subarrays of the coprime vector sensor array. (B) Beam output of the whole coprime vector sensor array.
3 DOA estimation for two co-frequency sources
3.1 Constructing joint-cross terms for coprime vector hydrophone array
The correlation coefficient between sound pressure and vibration velocity in the isotropic noise field is 0, which means that the joint processing of sound pressure and vibration velocity for the acoustic vector signal suppresses the noise. Therefore, without regard to the noise component, the data channel of the acoustic vector hydrophone is transformed by rotation and combination, and Eq. (9) is obtained
where and represent the velocity components of a vector hydrophone, and they are mutually orthogonal. and stand for the combined transformation of the velocity channel of vector hydrophone, where φ is the electron rotation angle and is the sound pressure signal received by the hydrophone. In this paper, the combination of sound pressure and vibration velocity is used as
where
indicates the sound pressure of a vector hydrophone. We can see that when and the noise reduction process is carried out by using the correlation characteristics between signal and noise. Therefore, by rotating the acoustic vector hydrophone data and selecting an appropriate rotation angle φ, the noise can be reduced, thereby reducing the SNR threshold and making it possible to explore weak targets.
For a single uniform sparse vector hydrophone array, when there is a target from a certain orientation (take the target with an orientation of 40° as an example), the spatial spectrum output of the sparse vector array using conventional beamforming obtained based on Eq. (12) can be shown as Figure 5. It can be seen that the spatial spectrum output based on vector hydrophone combined channels shows a concave point at target orientation. However, there is an unreliability in using concave points to determine target orientations when the noise is considered. Moreover, for a single sparse array, this unreliability will become more acute as the spacing of array elements increases.
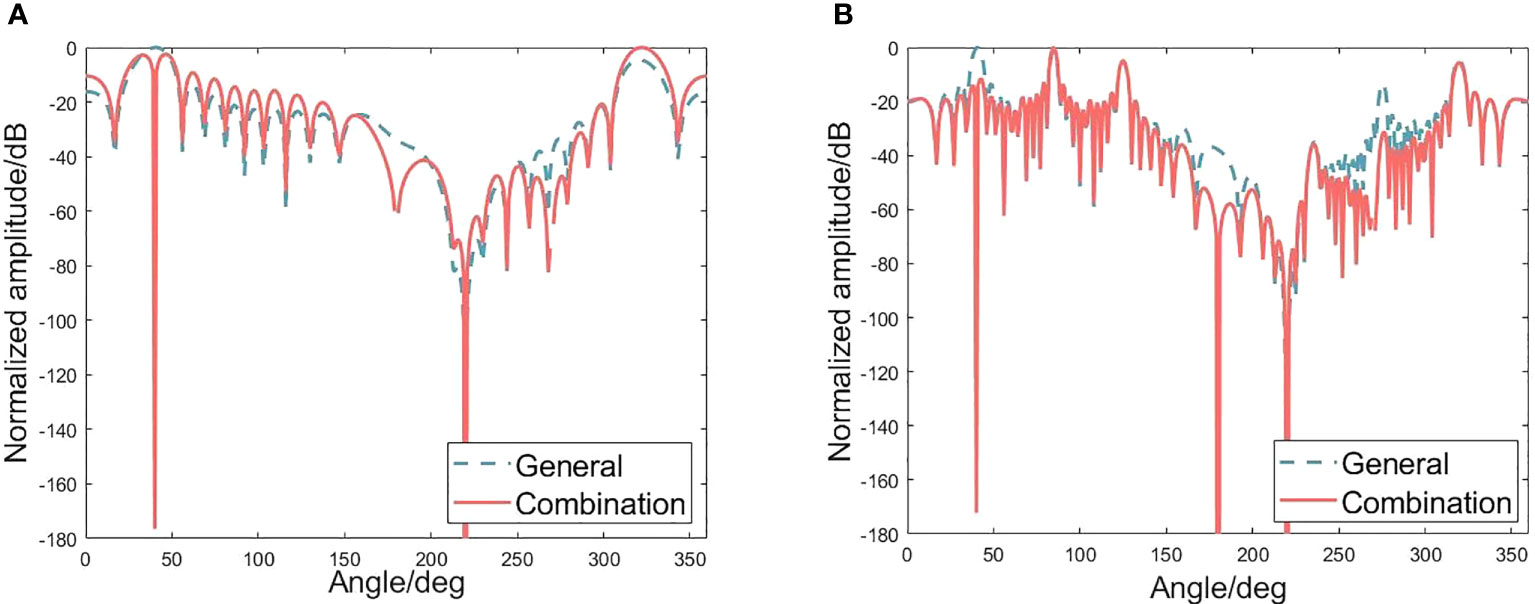
Figure 5 Comparison of treating each channel as normal and combining channels for a vector hydrophone. (A) Spatial spectrum output of a vector uniform line array without considering noise. (B) Spatial spectrum output of a vector sparse line array without considering noise.
The CBF for a coprime vector hydrophone array produces two spatial spectra but contains ambiguous orientation concave points due to the spatial undersampling of the subarrays. Inspired by the Product theorem (Adhikari et al., 2014; Adhikari and Buck, 2017), which resolves the spatial frequency ambiguities by performing complex conjugate multiplication between two coprime subarrays (Vaidyanathan and Pal, 2010), we proposed a DOA estimation method based on JCTs for coprime vector hydrophone array. Let , , and be the acoustic pressure and the x-axis and y-axis velocity data of acoustic particles received by the vector hydrophones from the subarray with M sensors, respectively. Meanwhile, let , , and be the acoustic pressure and the x-axis and y-axis velocity data of acoustic particles received by the vector hydrophones from the subarray with N sensors. The JCTs for coprime vector hydrophone array can be constructed as
where for the subarray with M sensors
and for the subarray with N sensors
3.2 Estimating DOA based on JCTs for coprime vector hydrophone array
Based on CBF, we define the spatial spectrum output concave point discriminant algorithm
where and are the subarray beam output obtained by beamforming after vector coprime array channel combination based on Eqs. (4) to (7), and Eqs. (13) to (15). Compared with one single sparse array, the relation between two sparse subarrays of the coprime vector hydrophone array is established, thus improving the reliability of the concave points judgment. Let be the search step and be the suspected target’s orientation. The discriminating process can be expressed as
where "IF()" indicates if conditional operation.
3.3 Major steps and practical application
The algorithm steps mainly focus on the data preprocessing, the constructions of JCTs and characteristic data point identification algorithm, and the source directions determination. The preprocessing is conducted based on Eq. (5), and the result can be robust because of the CBF, which can be validated in Section 4. The suspected targets’ orientations are predetermined with the beam output of the whole coprime vector sensor array. The JCTs are established by taking advantage of the channel data combination of the vector sensor array on Eq. (13). Based on JCTs, the discriminant algorithm for identifying the concave points can be achieved by Eq. (16). In either case, one single target or two detected with a specified detection threshold, the source direction can be determined. Since there is no possibility of false-alarm lobes of array output in either case, only the true output is presented. Furthermore, for more suspected directions, whether there are false targets will be determined according to Eq. (8), and coherent sources can be identified efficiently based on Eq. (17). The pseudo-code of the proposed method is exhibited in Algorithm 1.
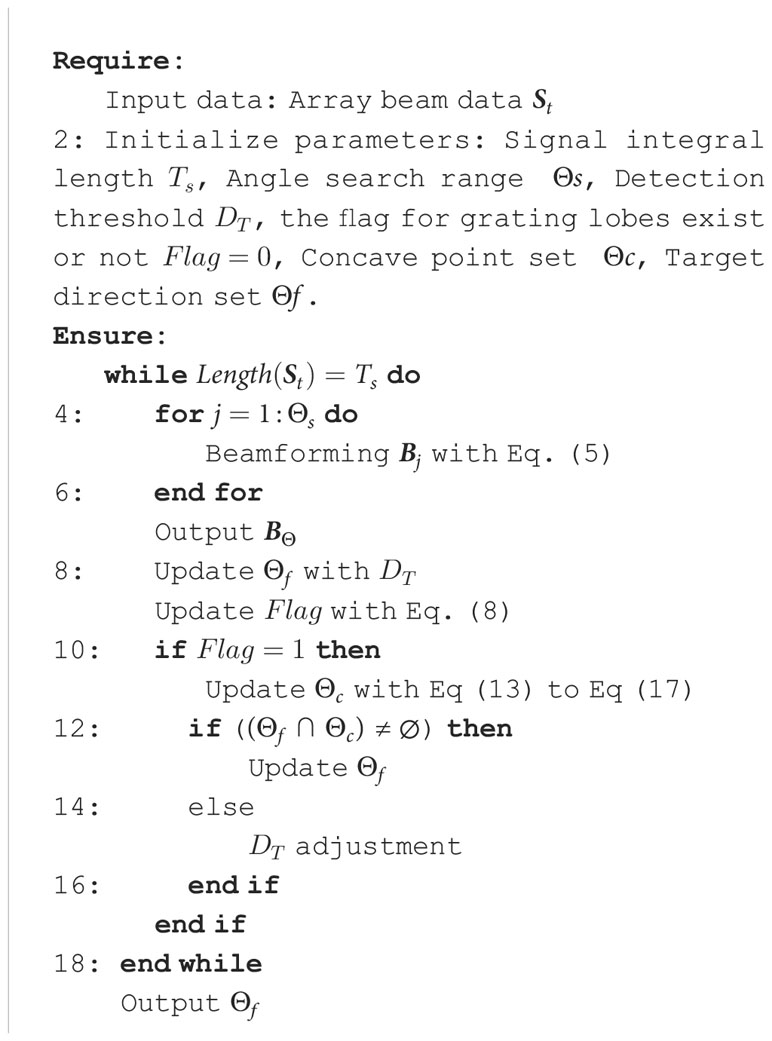
Algorithm 1 Pseudo code of the major steps for the overall algorithm..
4 Simulation analysis
4.1 Accuracy performance
Numerical simulations are conducted to assess the performance of the proposed method. Furthermore, MUSIC based on the SS (Pillai and Kwon, 1989) and FBSS methods (Shan et al., 1985) are used as comparison methods. A coprime vector hydrophone array with 10 sensors (M = 5 and N = 6) is adopted in all examples.
The first part of the simulations investigates the situation in Figure 4. Two coherent sources with the same frequency, 500 Hz, come from the directions and , respectively, which are shown in red circles in Figure 4B. The grating lobe caused by the same frequency and coherence of the signal leads to wrong target directions of and , which are presented in blue circles. The DOA estimation performance of different algorithms is evaluated using the root-mean-square error (RMSE), which is described as
where denotes the estimated DOA of for the th independent trial and I and K, respectively, denote the number of Monte Carlo simulation experiments and the number of sources. The suggested method, as shown in Figure 6, consistently produces reliable estimates of true DOAs. When the SNR varies from −15 dB to 15 dB, the quantity of snapshots is set to a constant value of 1,000. As shown in Figure 7, the RMSE is reduced with the increase of SNR. Furthermore, when the SNR is fixed at 10 dB, it can be observed that three estimation results become more stable, and the proposed method demonstrates enhanced accuracy as the number of snapshots increases.
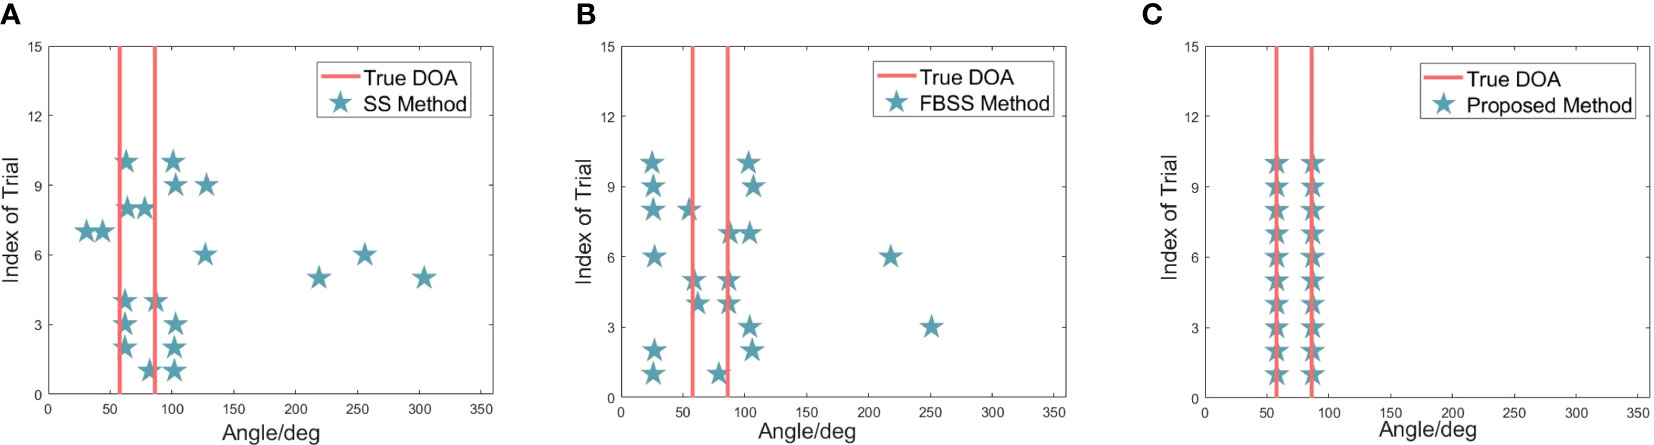
Figure 6 Estimation reliability comparison for two coherent sources with the same frequency when SNR = 10 dB and snapshot is 1000. (A) Results of the Pillai and Kwon (1989) method. (B) Results of the Shan et al. (1985) method. (C) Result of the proposed method.
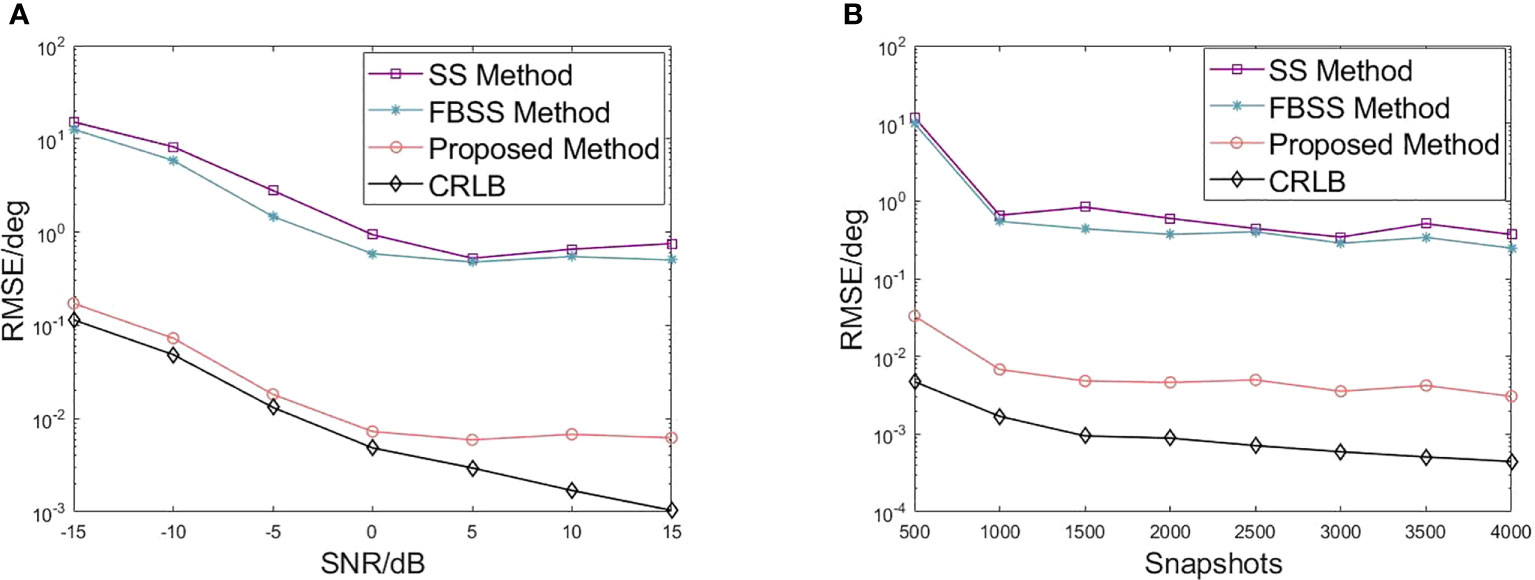
Figure 7 RMSE of DOA estimation. Each simulated point is averaged based on 500 trials. (A) RMSE versus SNR for two coherent sources with the same frequency. The snapshot is 1,000. (B) RMSE versus snapshot for two coherent sources with the same frequency. The SNR is 10 dB.
The technique of spatial smoothing processing is a widely employed method for decorrelation in practical applications, serving as a foundation for numerous studies. Next, we implement and compare the approaches based on signal covariance matrix recovery (CMR) (Pan et al., 2022) and sparse signal reconstruction using compressive sensing (CS) (Das et al., 2016) with our method. The directions of co-frequency signals are 47.9° and 78.5°, with an SNR of 10 dB and a signal snapshot of 1000. From Figure 8A, it can be observed that the proposed and the CS methods can obtain the target direction information. The CMR method also achieves high-amplitude output in target directions but suffers from ambiguity. In Figure 8B, when the SNR decreases, both the method in this paper and the CMR method show ambiguous orientation, and the CS method shows direction misjudgment.
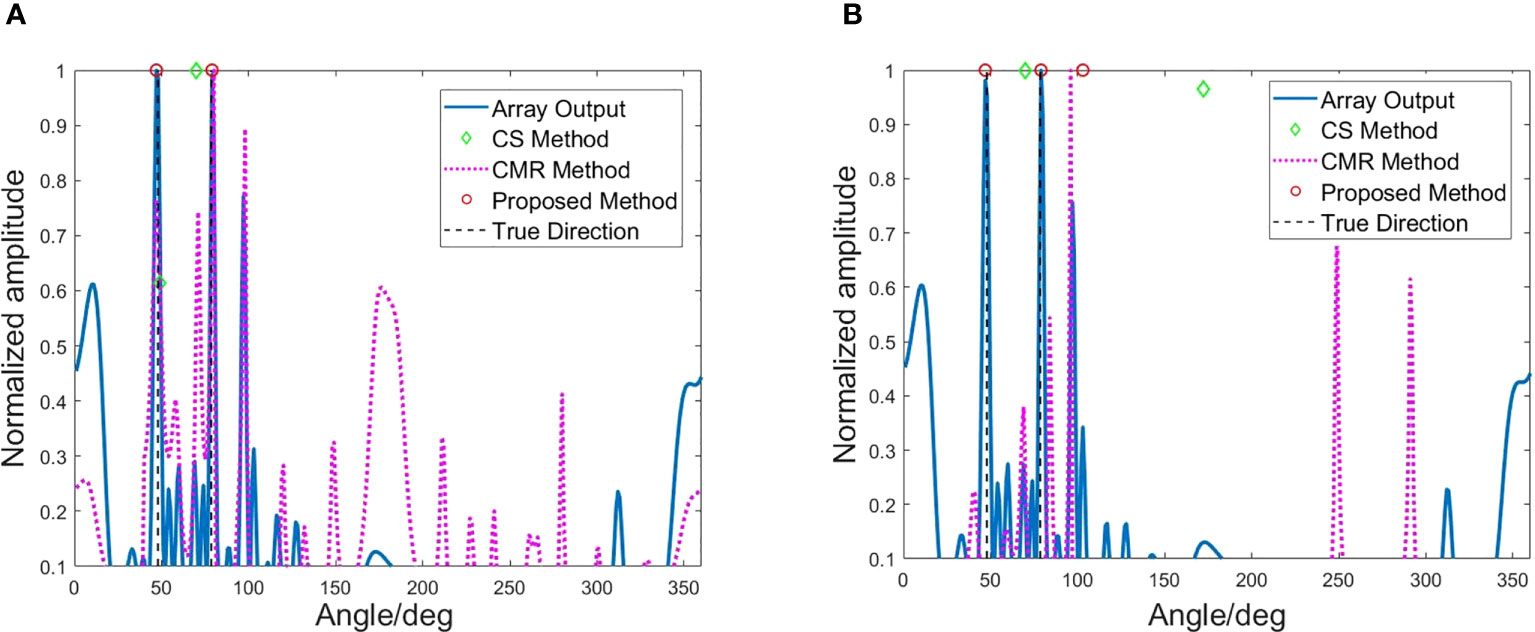
Figure 8 Method performance comparison. (A) Method performance comparison when the SNR = 10 dB and the signal snapshot is 1,000. (B) Method performance comparison when the SNR = −10 dB and the signal snapshot is 1,000.
4.2 Sensitivity to position errors
In array signal processing, the signal mismatch is a critical issue. In this part, the element position errors are considered to assess the impact of signal mismatch on the proposed method (Yang, 2017). The spacings between array elements were assumed to hold the random error with a mean of 15% of the unit spacing between two sensors, which can be shown as Figure 9A. Receiver positions are represented by symbols, with the desired locations denoted by "" and the actual locations denoted by "". In Figure 9B, one can find that in the presence of array element errors, the SS method has a DOA estimation bias. In comparison, the FBSS method performs a better DOA estimation accuracy. Compared with the two methods, the method of this work can obtain more accurate DOA estimation results. In addition, it can be seen from Figure 9C that the DOA estimation results of the method depend on the beam output obtained by the conventional beamforming (shown in the legend of "Array output" in the figure). Therefore, the DOA estimation error of the method will be affected by the array beamforming output. However, the algorithm still inherits the robustness of CBFs.
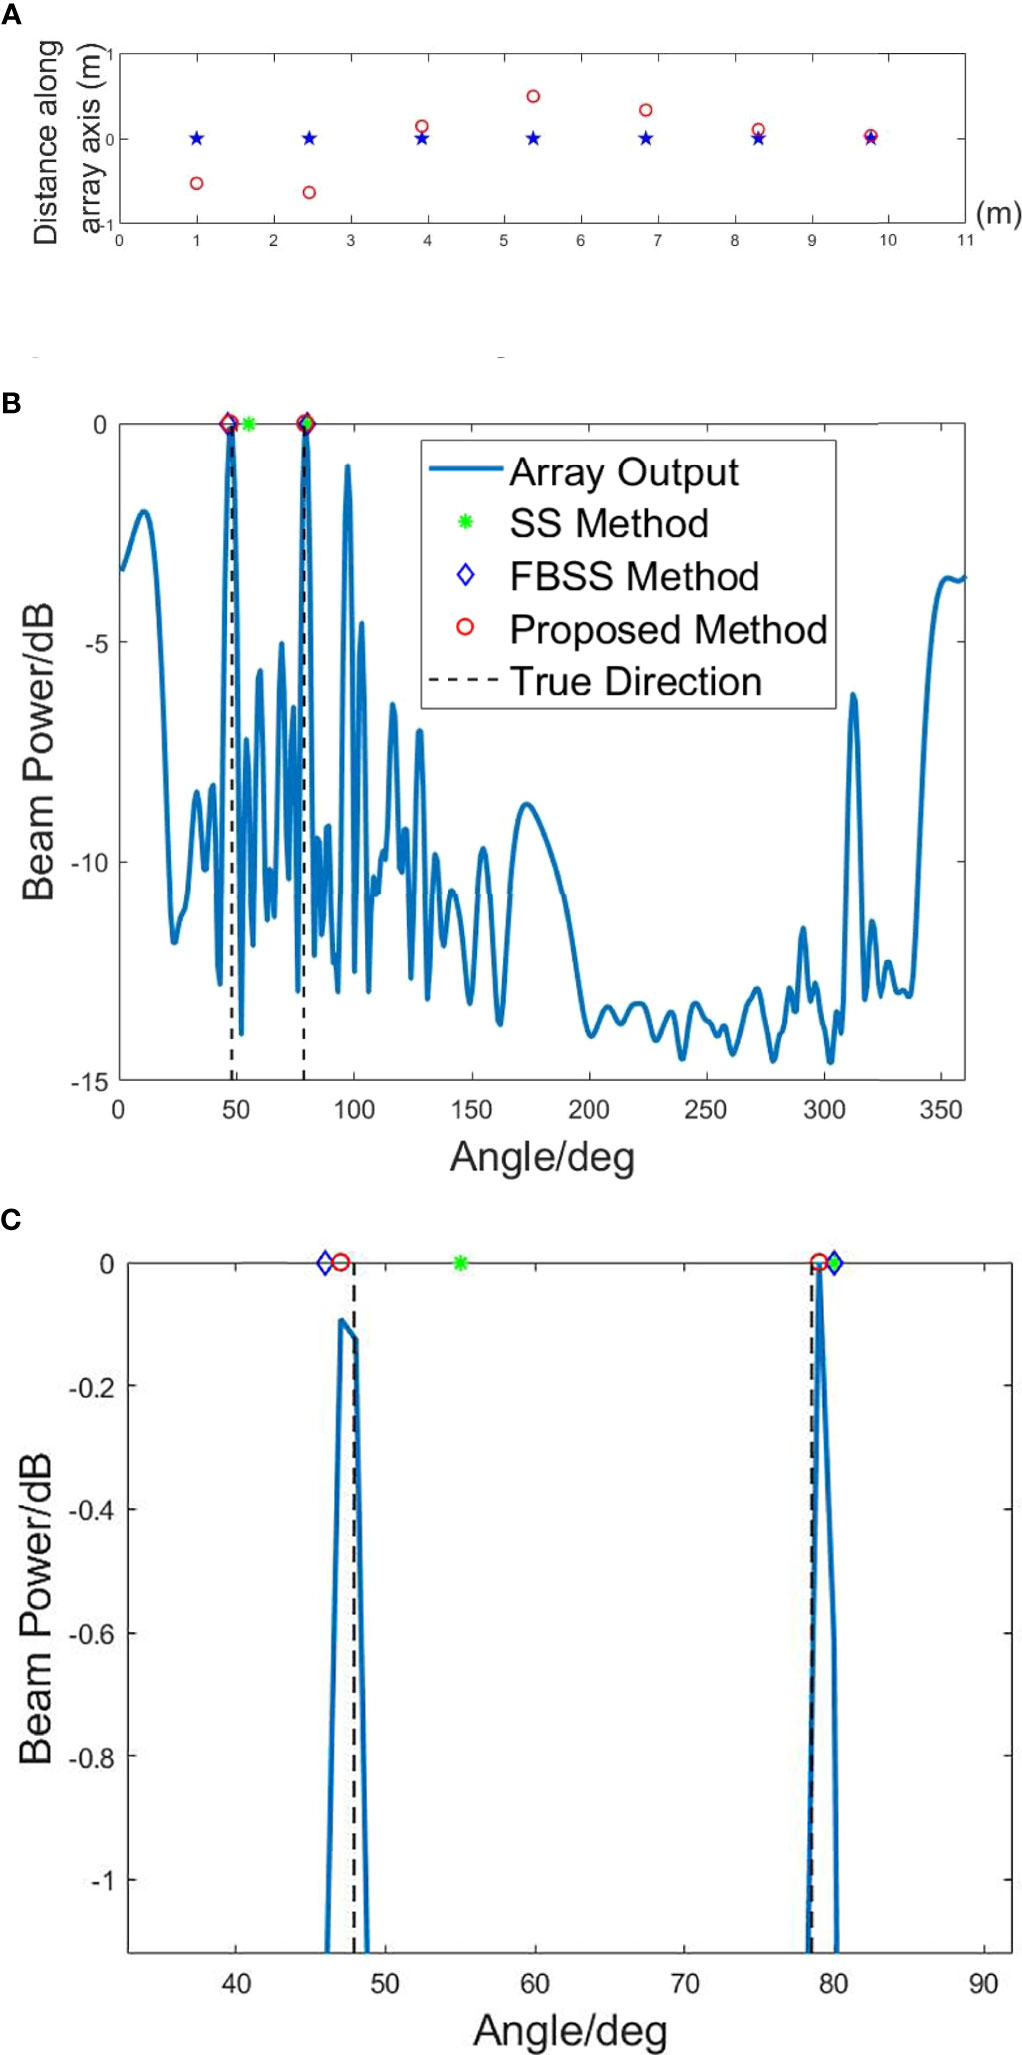
Figure 9 Sensitivity of the algorithm to array element position errors. (A) Array setup with and without element position errors. (B) DOA results based on different methods with element position errors, SNR = 0 dB, θ1 = 47.9°C and θ2 = 78.5°C. (C) The magnified details for DOA results.
4.3 Bearing time record performance
This part simulates the bearing time record (BTR) under low SNR. As shown in Figure 10, the red "*" represents the detection result of the algorithm. Figure 10A conducts the simulation for two targets with directions changing. Furthermore, the simulation design ensures high grating lobe interference in the direction change interval (SNR = 0 dB). It can be seen from the figure that many high grating lobe interferences have a severe impact on the target detection results. However, this paper’s method can detect targets’ actual orientations more stably and accurately. Figure 10B depicts the scenario where two co-frequency targets generate the high grating lobes, with the SNR of both targets being −5 dB, while the targets move in a constant azimuth. It can be seen that there is substantial interference in the direction of the end fire of the array, which will seriously deteriorate the performance of DOA detection. The red "*" shows that the proposed algorithm in this paper demonstrates a stable estimation of true DOAs.
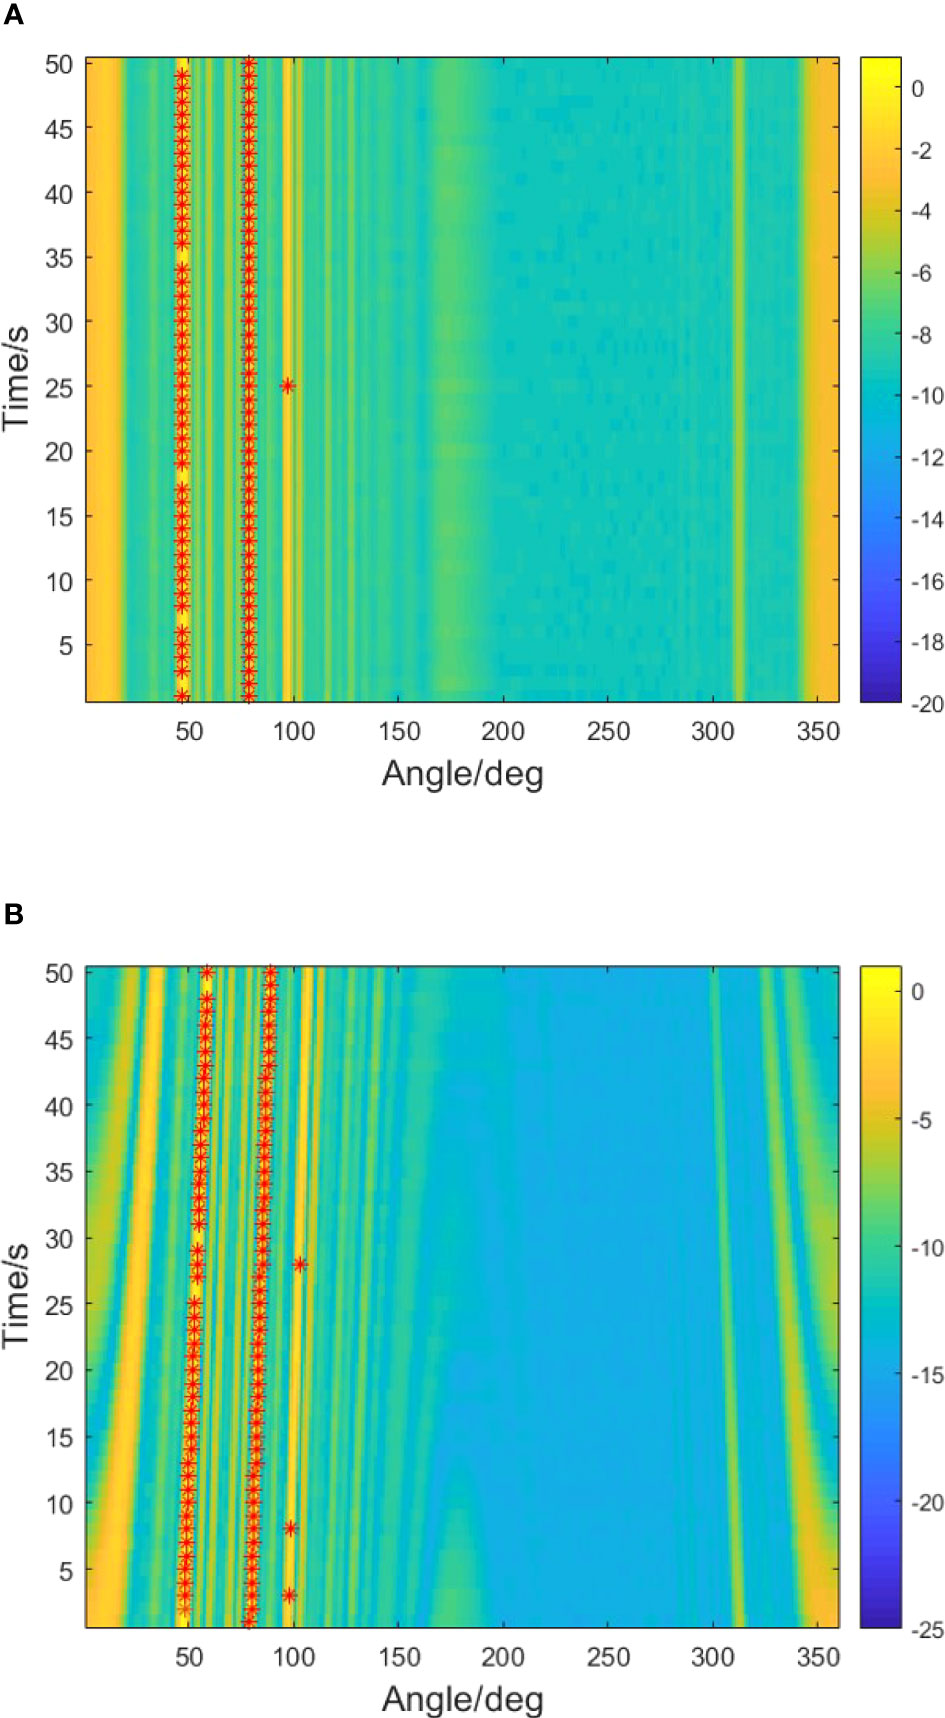
Figure 10 BTR for bearing-changing targets. (A) SNR = 0 dB. (B) SNR = −5 dB.
4.4 Attempts in the case of multiple targets
Multiple co-frequency target detection can be divided into three main cases: (1) All targets fall into the relation of overlapping grating lobes. (2) None of the targets fall into the relationship of overlapping grating lobes. (3) Some of the targets hold overlapping grating lobe relation. We set M = 5, N = 6, SNR = −7 dB, and f = 500 Hz. For the first case, there are targets from the directions of 47.9°, 57.8°, 78.5°, and 86.2° respectively, and all of them satisfy the grating lobe overlapping relation. In Figure 11A, one can find that due to the grating lobes, the real directions are submerged within the false alarms, affecting the accurate detection of targets. For the second case, the source directions are set as 30°, 38°, 50°, and 63°. These directions are not in the relationship of grating lobes overlapping. In Figure 11B, without the grating lobes overlapping, array grating lobes will not mask the true direction, and the algorithm can directly obtain the correct target directions’ information. However, when some of the targets fall into the relation of overlapping grating lobes, they are from the directions of 20°, 30°, 47.9°, and 78.5°, respectively. As shown in Figure 11C, the method proposed in this article cannot accurately determine the target’s true direction from the overlapped lobes of partial targets. Because of the complex grating lobe relationships caused by multiple targets, the feature relationships of the JCTs are affected. Future research will focus on studying and attempting array interference suppression techniques to address this issue.
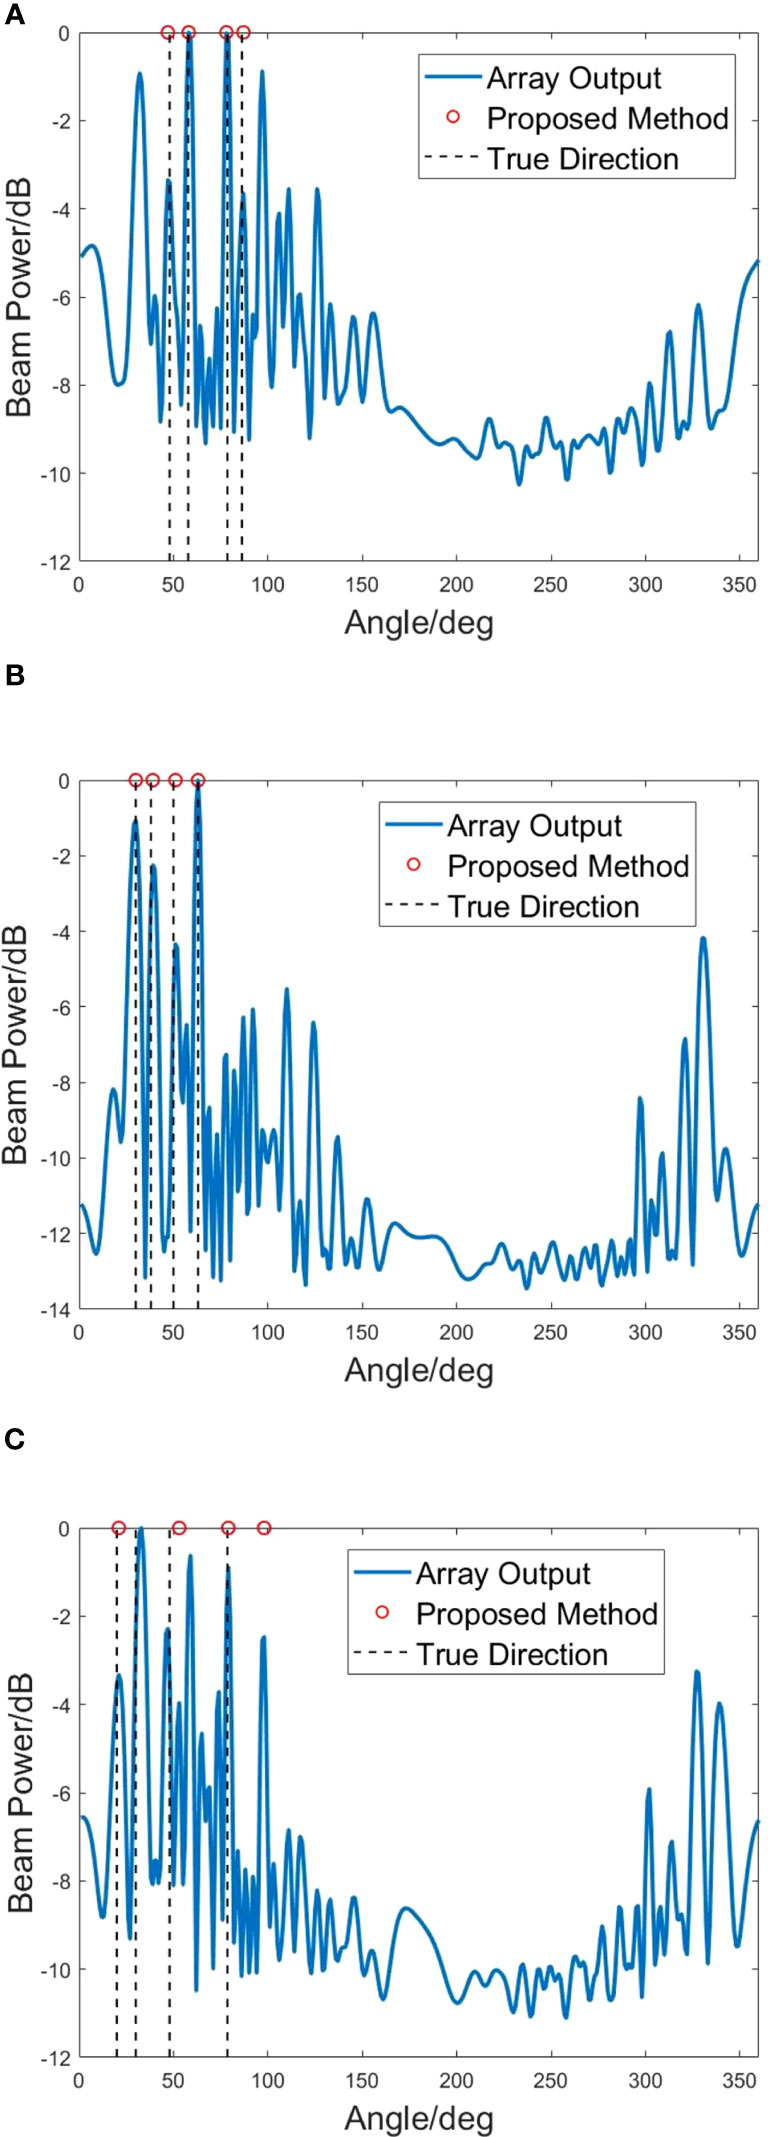
Figure 11 Simulation results of algorithm performance in multiple targets case. (A) All targets satisfy the grating lobes overlapping relation. (B) None of the targets satisfy the grating lobes overlapping relation. (C) Some of the targets satisfy the grating lobes overlapping relation.
5 Experiment data analysis
The experiment data analysis has been presented in this part. As shown in Figure 12, the experiment data were collected on an extended coprime vector hydrophone array with 12 sensors on the ocean bottom at a (water) depth of 35 m. The shipborne sound source emits signals to simulate the sound source. The vector hydrophone picks up the underwater sound signal, then transmits the data to the base station through the hydrophone array’s data acquisition and transmission system. The base station performs signal processing and realizes the display and reporting of the target detection results. M = 2 and N = 3 for the extended coprime vector hydrophone and the array expansion factor e =3 (Chen et al., 2023). A moving sound source transmitting at the frequency of 375 Hz moves in a straight line along the direction of 57°. In order to validate the proposed algorithm, the signal data from the direction of 86° have been added to the received signals of the coprime array. The added signal will produce grating lobes in the array output that overlap with the source array output. In Figure 13A, one can find that many strong grating lobe interferences show up after the signal was added, deteriorating the performance of source detection and DOA estimation. The proposed method can obtain the DOA information of targets more accurately. Because the signal data from the direction of 86° are artificially added, the DOA estimation method shows more stable results, which are shown in Figure 13B. In the second experiment, the sound source transmits the signal at the frequency of 315 Hz and moves in the direction of 43°, as shown in Figure 14A. In order to increase the grating lobe interferences, the signal from 67° has been included in the original received array signal. Owing to the additional signal, the grating lobes from two sources coincide, resulting in many grating lobe interferences in the array output. The real targets have been buried in strong grating lobe interferences and wide array beams. It can be observed that the proposed method achieves the extraction of real targets from the strong grating lobe interferences and then realizes the targets’ DOA estimation, as shown in Figure 14B.
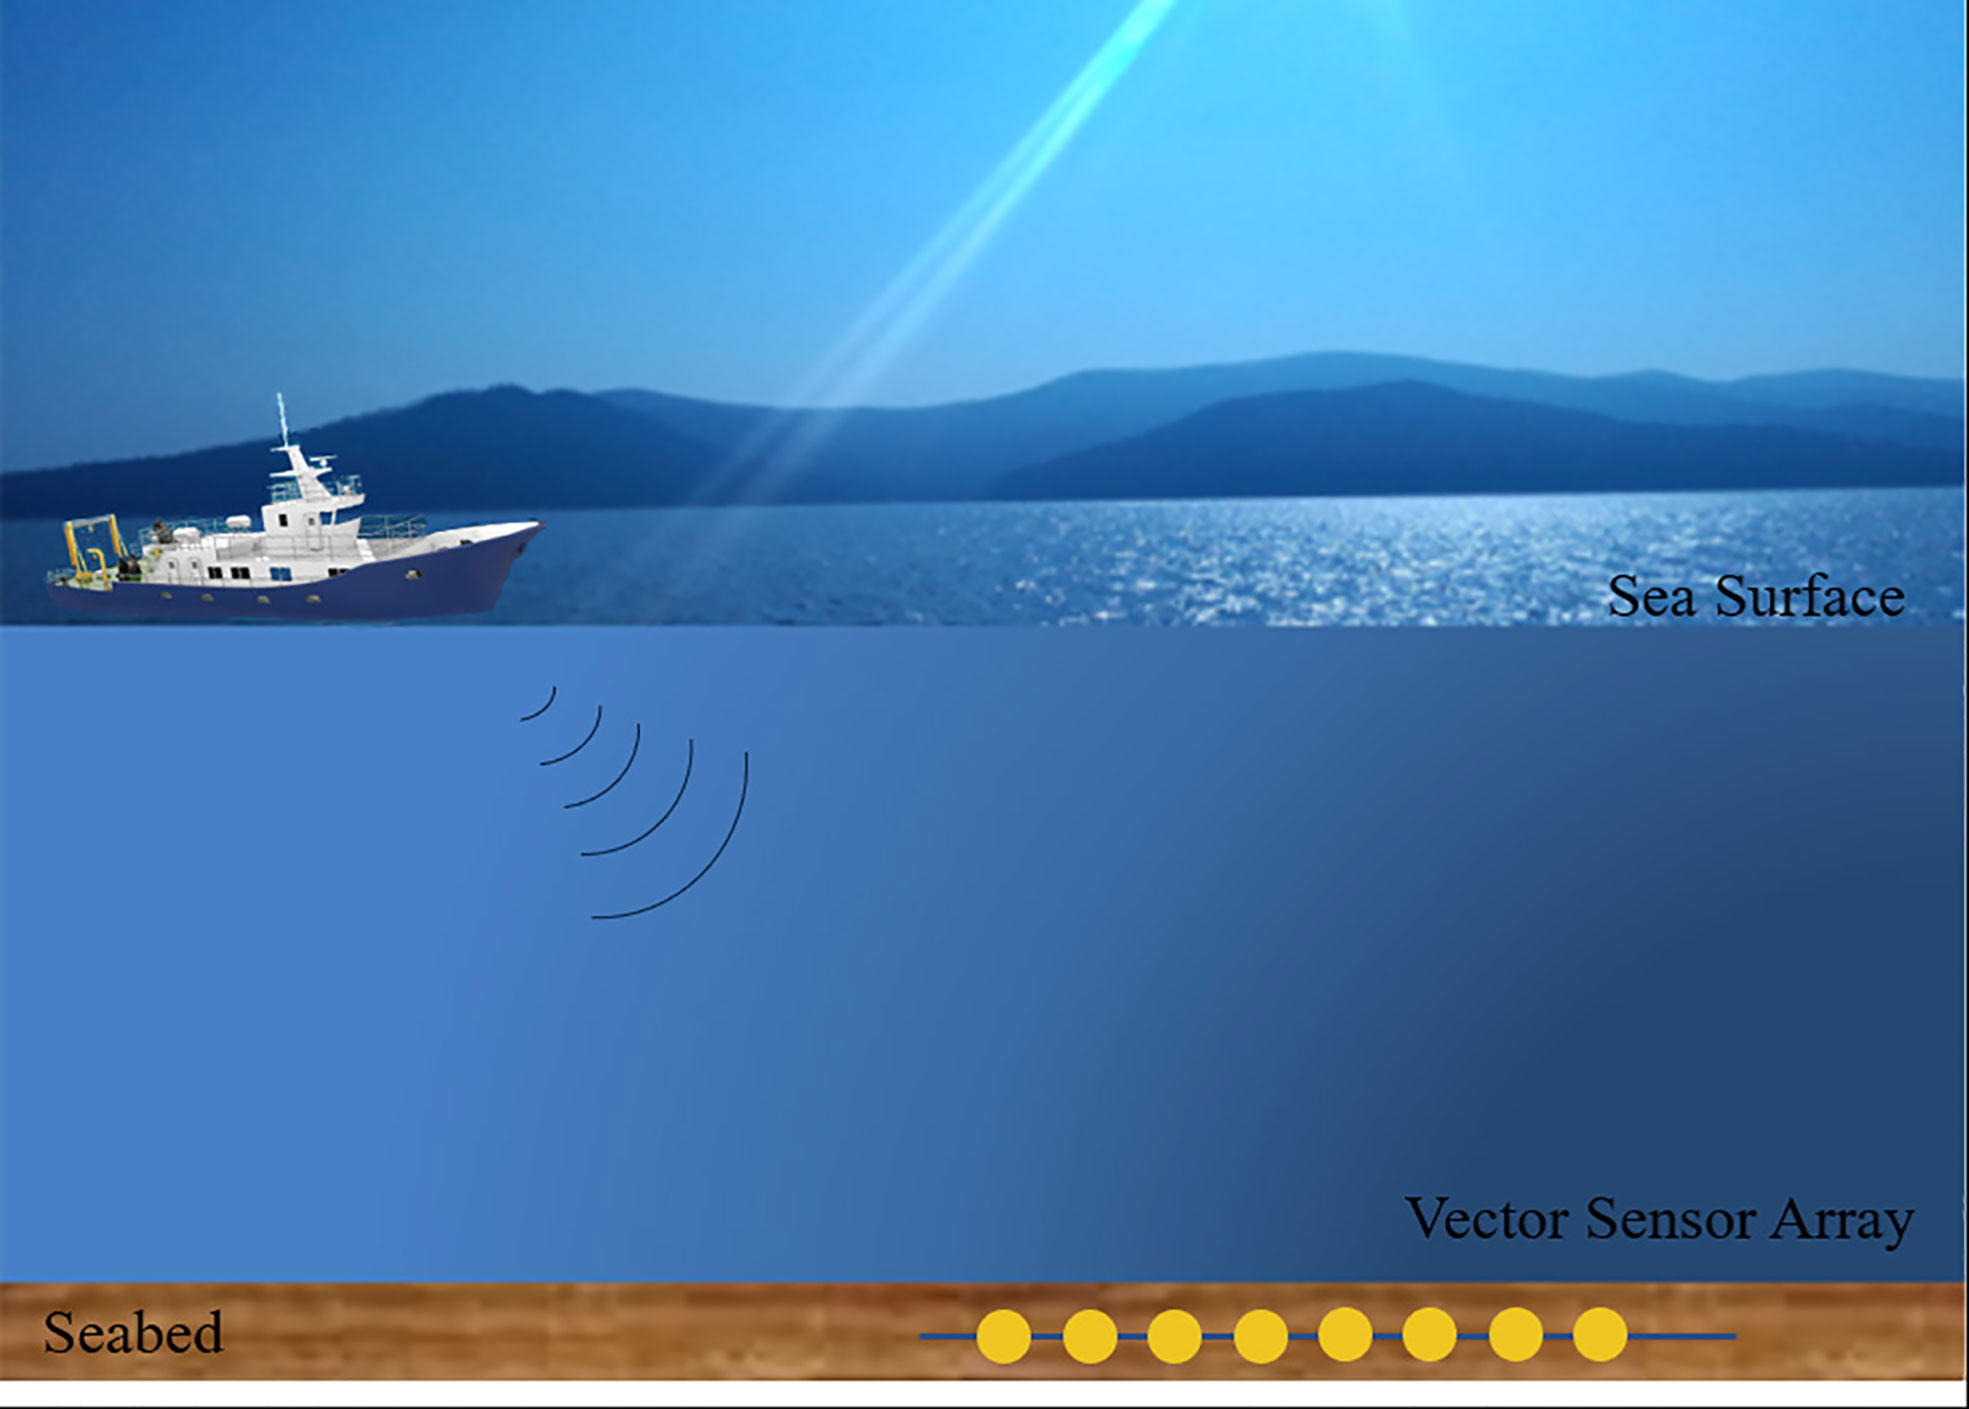
Figure 12 The experimental layout.
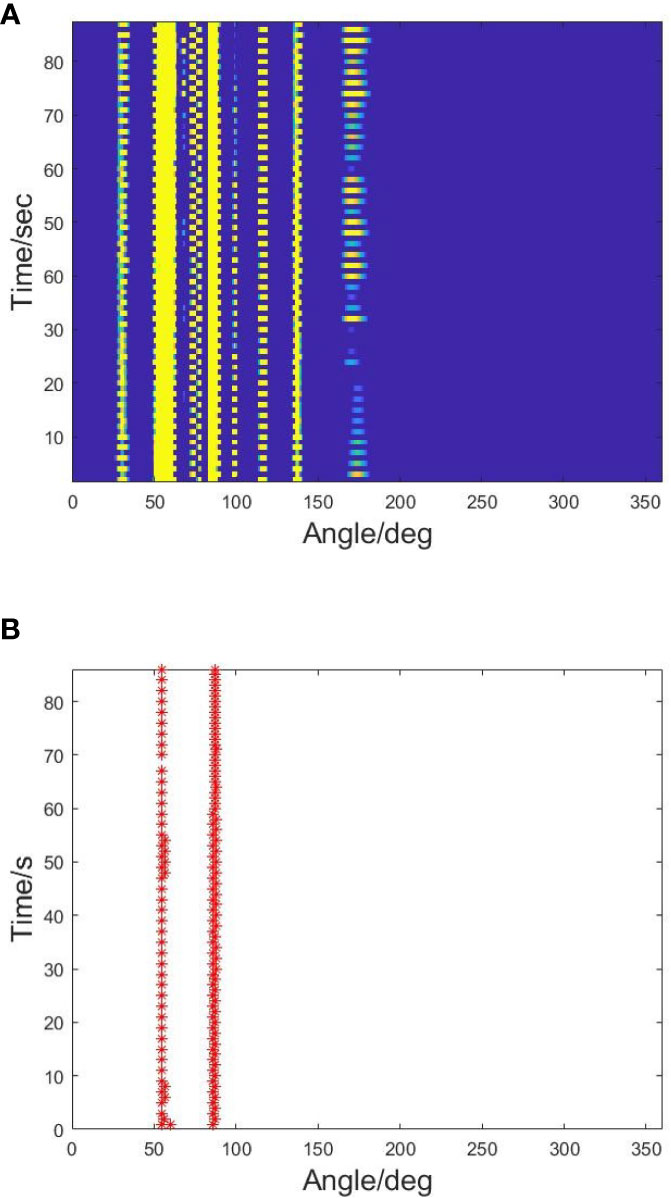
Figure 13 BTR in experiment. (A) θ1 = 57°C and θ2 = 86°C. (B) Results of the proposed method.
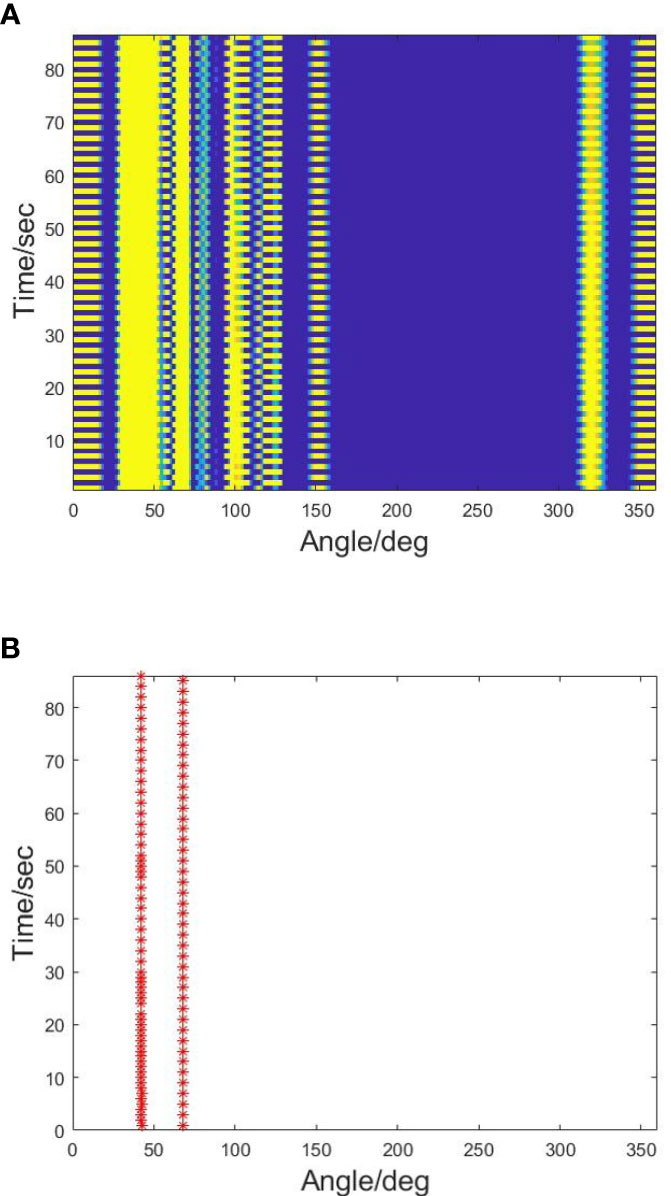
Figure 14 BTR in experiment. (A) θ1 = 43°C and θ2 = 67°C. (B) Results of the proposed method.
6 Conclusion
This paper investigates the problem of false alarms that can deteriorate the performance of DOA estimation for two co-frequency sources in a coprime vector hydrophone array. These false alarms are caused by the overlap of main lobes and grating lobes from subarrays. To address this issue, we propose a DOA estimation method that involves JCTs connected with subarrays from a coprime vector hydrophone array. Based on JCTs, we design a method to identify characteristic data points. The proposed method eliminates false-alarm directions without smoothing and detects true DOAs without ambiguity. Simulation and BTR results from the sea experiment data demonstrate that the algorithm performs well and provides a new approach for DOA estimation of coprime vector sensor arrays. Applying large aperture arrays will be a major trend in ocean observation and maritime combat, like marine life detection, UUV (unmanned underwater vehicle), and USV (unmanned surface vehicle) operations. Coprime arrays and their related signal-processing methods will play an important role in the marine domain. The method proposed in this article can also be applied to combined active and passive sonar detection and multi-base sonar cooperative detection. Furthermore, with the application of deep learning in ocean observation, combining deep learning concepts with the method presented in this article may achieve more efficient results in ocean observation, such as target recognition and tracking.
Data availability statement
The original contributions presented in the study are included in the article/supplementary material. Further inquiries can be directed to the corresponding author.
Author contributions
XC: Conceptualization, methodology, and writing—original draft. HZ: Validation, supervision, funding acquisition, and project administration. YG and ZW: Graphical abstract preparation. All authors contributed to the article and approved the submitted version.
Funding
This work was financially supported by Marine S and T fund of Shandong Province for Pilot National Laboratory for Marine Science and Technology (Qingdao) (No. 2018SDKJ0210).
Conflict of interest
The authors declare that the research was conducted in the absence of any commercial or financial relationships that could be construed as a potential conflict of interest.
Publisher’s note
All claims expressed in this article are solely those of the authors and do not necessarily represent those of their affiliated organizations, or those of the publisher, the editors and the reviewers. Any product that may be evaluated in this article, or claim that may be made by its manufacturer, is not guaranteed or endorsed by the publisher.
References
Adhikari K. (2019). Beamforming with semi-coprime arrays. J. Acoustical Soc. America 145, 2841–2850. doi: 10.1121/1.5100281
Adhikari K., Buck J. R. (2015). “Gaussian signal detection by coprime sensor arrays,” in South Brisbane, QLD: 2015 IEEE International Conference on acoustics, speech and signal processing (ICASSP) (South Brisbane, QLD: IEEE). 2379–2383.
Adhikari K., Buck J. R. (2017). Spatial spectral estimation with product processing of a pair of colinear arrays. IEEE Trans. Signal Process. 65, 2389–2401. doi: 10.1109/TSP.2017.2659642
Adhikari K., Buck J. R., Wage K. E. (2013). “Beamforming with extended co-prime sensor arrays,” in 2013 IEEE international conference on acoustics, speech and signal processing (Vancouver, BC: IEEE), 4183–4186.
Adhikari K., Buck J. R., Wage K. E. (2014). Extending coprime sensor arrays to achieve the peak side lobe height of a full uniform linear array. EURASIP J. Adv. Signal Process. 2014, 1–17. doi: 10.1186/1687-6180-2014-148
Alawsh S. A., Muqaibel A. H. (2018). Multi-level prime array for sparse sampling. IET Signal Process. 12, 688–699. doi: 10.1049/iet-spr.2017.0252
Alawsh S. A., Muqaibel A. H. (2020). Achievable degree-of-freedom for three-level prime arrays. Signal Process. 171, 107523. doi: 10.1016/j.sigpro.2020.107523
Alawsh S. A., Muqaibel A. H. (2021). “Optimized multi-level prime array configurations,” in 2021 International Symposium on Networks, Computers and Communications (ISNCC) (Dubai, United Arab Emirates: IEEE), 1–4.
Chen X., Zhang H., Lv Y. (2023). Improving the beamforming performance of a vector sensor line array with a coprime array configuration. Appl. Acoustics 207, 109329. doi: 10.1016/j.apacoust.2023.109329
Das A., Hodgkiss W. S., Gerstoft P. (2016). Coherent multipath direction-of-arrival resolution using compressed sensing. IEEE J. Oceanic Eng. 42, 494–505. doi: 10.1109/JOE.2016.2576198
Di Martino G., Iodice A. (2017). Passive beamforming with coprime arrays. IET Radar Sonar Navigation 11, 964–971. doi: 10.1049/iet-rsn.2016.0517
Felisberto P., Santos P., Jesus S. M. (2018). Acoustic pressure and particle velocity for spatial filtering of bottom arrivals. IEEE J. Oceanic Eng. 44, 179–192. doi: 10.1109/JOE.2018.2807898
Felisberto P., Santos P., Maslov D., Jesus S. (2016). “Combining pressure and particle velocity sensors for seismic processing,” in OCEANS 2016 MTS/IEEE Monterey (Monterey, CA: IEEE), 1–6.
Fu M., Zheng Z., Wang W.-Q., So H. C. (2021). Coarray interpolation for doa estimation using coprime emvs array. IEEE Signal Process. Lett. 28, 548–552. doi: 10.1109/LSP.2021.3061272
Hawkes M., Nehorai A. (1998). Acoustic vector-sensor beamforming and capon direction estimation. IEEE Trans. Signal Process. 46, 2291–2304. doi: 10.1109/78.709509
Liu Y., Buck J. R. (2015). “Detecting gaussian signals in the presence of interferers using the coprime sensor arrays with the min processor,” in 2015 49th Asilomar conference on signals, systems and computers (Pacific Grove, CA: IEEE), 370–374.
Mei J., Sun D., Zhou Y., Shi J. (2018). Study on the problem of coherent source resolution with same frequency for the coprime array. J. Acoustical Soc. America 144, 1971–1971. doi: 10.1121/1.5068615
Moghadam G. S., Shirazi A. A. B. (2019). “Doa estimation with extended optimum co-prime sensor array (eocsa),” in 2019 Sixth Iranian Conference on Radar and Surveillance Systems (Isfahan, Iran: IEEE), 1–6.
Moghadam G. S., Shirazi A. B. (2022). Direction of arrival (doa) estimation with extended optimum co-prime sensor array (eocsa). Multidimensional Syst. Signal Process. 33, 17–37. doi: 10.1109/ICRSS48293.2019.9026546
Pan H., Pan J., Zhang X. (2022). “Time-delay estimation of coherent gpr signal by using sparse frequency sampling and imusic method,” in 2022 International Symposium on Wireless Communication Systems (ISWCS), (Hangzhou, China: IEEE). 1–6.
Pillai S. U., Kwon B. H. (1989). Forward/backward spatial smoothing techniques for coherent signal identification. IEEE Trans. Acoustics Speech Signal Process. 37, 8–15. doi: 10.1109/29.17496
Qin S., Zhang Y. D., Amin M. G., Himed B. (2017). Doa estimation exploiting a uniform linear array with multiple co-prime frequencies. Signal Process. 130, 37–46. doi: 10.1016/j.sigpro.2016.06.008
Roy R., Kailath T. (1989). Esprit-estimation of signal parameters via rotational invariance techniques. IEEE Trans. acoustics speech Signal Process. 37, 984–995. doi: 10.1109/29.32276
Santos P., João J., Rodríguez O. C., Felisberto P., Jesus S. M. (2011). “Geometric and seabed parameter estimation using a vector sensor arrayexperimental results from makai experiment 2005,” in OCEANS 2011 IEEE-Spain (IEEE), 1–10.
Schmidt R. (1986). Multiple emitter location and signal parameter estimation. IEEE Trans. antennas propagation 34, 276–280. doi: 10.1109/TAP.1986.1143830
Shan T.-J., Wax M., Kailath T. (1985). On spatial smoothing for direction-of-arrival estimation of coherent signals. IEEE Trans. Acoustics Speech Signal Process. 33, 806–811. doi: 10.1109/TASSP.1985.1164649
Tan Z., Eldar Y. C., Nehorai A. (2014). Direction of arrival estimation using co-prime arrays: A super resolution viewpoint. IEEE Trans. Signal Process. 62, 5565–5576. doi: 10.1109/TSP.2014.2354316
Vaidyanathan P. P., Pal P. (2010). Sparse sensing with co-prime samplers and arrays. IEEE Trans. Signal Process. 59, 573–586. doi: 10.1109/TSP.2010.2089682
Vaidyanathan P., Pal P. (2011). Theory of sparse coprime sensing in multiple dimensions. IEEE Trans. Signal Process. 59, 3592–3608. doi: 10.1109/TSP.2011.2135348
Xie Z., Lin R., Wang L., Zhang A., Lin J., Tang X. (2023). Data augmentation and deep neural network classification based on ship radiated noise. Front. Mar. Sci. 10, 1113224. doi: 10.3389/fmars.2023.1113224
Yang T. (2017). Deconvolved conventional beamforming for a horizontal line array. IEEE J. Oceanic Eng. 43, 160–172. doi: 10.1109/JOE.2017.2680818
Yang Y., Ruan N., Huang G., Shi J., Wen F. (2021). A propagator method for bistatic coprime emvs-mimo radar. Math. Problems Eng. 2021, 1–11. doi: 10.1155/2021/9954573
Yang T., Ye Z. (2019). Array gain of coprime arrays. J. Acoustical Soc. America 146, EL306–EL309. doi: 10.1121/1.5126924
Zhang Y. D., Amin M. G., Himed B. (2013). “Sparsity-based doa estimation using co-prime arrays,” in 2013 IEEE International Conference on Acoustics, Speech and Signal Processing (Vancouver, BC: IEEE), 3967–3971.
Zhang G., Liu K., Fu J., Sun S. (2022). Covariance matrix reconstruction method based on amplitude and phase constraints with application to extend array aperture. J. Acoustical Soc. America 151, 3164–3176. doi: 10.1121/10.0010383
Zhang X., Yang P., Zhou M. (2023). “Multireceiver sas imagery with generalized pca,” in IEEE Geoscience and Remote Sensing Letters (USA: IEEE).
Zhou C., Gu Y., He S., Shi Z. (2017). A robust and efficient algorithm for coprime array adaptive beamforming. IEEE Trans. Vehicular Technol. 67, 1099–1112. doi: 10.1109/TVT.2017.2704610
Keywords: direction-of-arrival (DOA) estimation, co-frequency sources, coprime vector sensor array, sound pressure and vibration velocity joint processing, vector hydrophone
Citation: Chen X, Zhang H, Gao Y and Wang Z (2023) DOA estimation of underwater acoustic co-frequency sources for the coprime vector sensor array. Front. Mar. Sci. 10:1211234. doi: 10.3389/fmars.2023.1211234
Received: 24 April 2023; Accepted: 12 July 2023;
Published: 09 August 2023.
Edited by:
Xuebo Zhang, Northwest Normal University, ChinaReviewed by:
Keyu Chen, Xiamen University, ChinaRongbin Lin, Shenzhen Research Institute of Xiamen University, China
Pan Huang, Weifang University, China
Copyright © 2023 Chen, Zhang, Gao and Wang. This is an open-access article distributed under the terms of the Creative Commons Attribution License (CC BY). The use, distribution or reproduction in other forums is permitted, provided the original author(s) and the copyright owner(s) are credited and that the original publication in this journal is cited, in accordance with accepted academic practice. No use, distribution or reproduction is permitted which does not comply with these terms.
*Correspondence: Hao Zhang, emhhbmdoYW9Ab3VjLmVkdS5jbg==