 Liupeng Jiang
 Shuangshi Tang1
- 1College of Harbour, Coastal and Offshore Engineering, Hohai University, Nanjing, China
- 2China Harbour Engineering Company Ltd, Beijing, China
The collection and distribution network of ports is the main cause of carbon emissions. The carbon peak is a basic policy in China, and the subsidy policy is one of the common measures used by the government to incentivize carbon reduction. We analyzed the transportation methods and the flow direction of a port and proposed a carbon emission calculation method based on emission factors. Based on the transportation time and the cost, a generalized transportation utility function was constructed, and the logit model was used to analyze the impacts of subsidy policies on transportation, thus calculating the effects of the subsidies on carbon reduction. We used Guangzhou Port as a case study, and calculated the carbon reduction effects in six different subsidy policy scenarios and concluded that the absolute carbon reduction value was proportional to the subsidy intensity. In addition, we constructed a subsidy carbon reduction efficiency index and found that the Guangzhou Port collection and distribution network had higher subsidy carbon reduction efficiency in low-subsidy scenarios. Finally, a sensitivity analysis was conducted on the subsidy parameters, and scenario 8 was found to have the highest subsidy carbon reduction efficiency. This achievement can provide decision support for the carbon emission strategy of the port collection and distribution network.
1 Introduction
The transportation industry is a key emitter of carbon emissions. From the perspective of total emissions, the current carbon emissions in China’s transportation sector ac-count for about 10.7% of the country’s total carbon emissions. As an important part of the transportation industry, the carbon emissions of ports have become a concern for the industry. Port carbon emissions can be classified into two categories. The first category is the carbon emissions generated by port production operations within the port checkpoint. The second category is the carbon emissions generated by the port collection and distribution network, including emissions from leased ships, trucks, and railway locomotives. The collection and distribution network of ports are important bridges for connecting the port with the hinterland. Specifically, “collection” refers to the process of transporting goods from the shipper’s designated address to the port and storing them in the port yard or warehouse for export. “Distribution” refers to the process of unloading goods from the ship, storing them in the port yard or warehouse, or directly transporting the goods from the ship to the vehicle, and then using various transportation methods to transport them to the receiver’s designated location. For most ports, the carbon emissions of the port col-lection and distribution networks are the main sources of carbon emissions. With the promotion of green ecological concepts and the proposal of the “dual-carbon” target, it is of great significance to explore how to establish a carbon emission calculation framework for the port collection and distribution network and to study the formulation of reasonable emission reduction strategies.
2 Related work
The development concept of a “green and low-carbon port” has become a consensus in the port industry to respond to the challenges brought by greenhouse gas emissions from ports, reduce carbon dioxide emissions, and mitigate climate change (Davarzani et al., 2016). In 2005, the Port of Long Beach introduced the “Green Port” policy and launched a series of environmental protection plans (Wan et al., 2018). To promote the development of green shipping and improve the air quality in China’s coastal areas, the Chinese government officially issued the plan to establish the Emission Control Area (ECA) for ships in December 2015 (Wan et al., 2019). In September 2020, the Chinese government proposed the “dual-carbon” target, which aims to reach peak carbon dioxide emissions before 2030 and achieve carbon neutrality before 2060. This target sets higher development requirements for China’s transportation industry (Xiong et al., 2023).
The transportation system has a significant impact on climate change, with the transportation industry accounting for 20–25% of the world’s energy consumption and carbon dioxide emissions. The growth rate of greenhouse gas emissions from transportation is faster than that of any other industry (Moriarty and Honnery, 2008). Winnes et al. (2015) developed a model for calculating the carbon emissions from ships and found that without any intervention measures, greenhouse gas emissions from ports will increase by 40% by 2030. However, with relevant management measures, greenhouse gas emissions can be reduced by 10% compared to the state where no measures are taken.
Scholars have conducted extensive research on measures to reduce port carbon emissions, mainly focusing on the application of green energy, the use of port plug-in power, and improvements in port management. Regarding the application of green energy, Geerlings and van Duin (2011) studied the example of Rotterdam port and found that mixing 30% biofuels into existing fuels can reduce terminal emissions by 13–26% and container transport emissions by 21%. Similarly, Styhre et al. (2017) concluded that the use of clean energy, such as LNG and electricity, can significantly reduce port carbon emissions. Hoang et al. (2022) believed that the use of renewable energy can greatly reduce CO2 emissions from ships arriving at ports. Xu et al. (2021) constructed a tripartite evolutionary game model, suggesting that active supervision in both upstream and downstream governments, and using clean energy in shipping companies could realize effective governance of inland shipping pollution. Regarding the use of port plug-in power, Hall (2010) concluded through a comparative analysis of emissions generated from the use of plug-in power and current emissions that the use of plug-in power can effectively reduce carbon dioxide emissions. Tseng and Pilcher (2015) believed that introducing plug-in power has significant financial, environmental, and socio-economic emission benefits. Vaishnav et al. (2016) found that by retrofitting 1/4 to 2/3 of ships docking in US ports and providing them with grid power, air quality improvement benefits of USD 70 million to USD 150 million per year can be achieved. Regarding port management measures, Giuliano and O'Brien (2007) studied the ports of Los Angeles and Long Beach and found that establishing a port truck appointment system can reduce truck wait times and thereby reduce carbon emissions related to port trucks. Qin et al. (2017) studied Shanghai port and found that sailing at a speed of 12 knots in the emission control area within 12 nautical miles can reduce CO2 emissions by approximately 830,000 tons. In terms of port multimodal transportation, Hanaoka and Regmi (2011) found that encouraging a mode shift to multimodal transportation can help alleviate road traffic congestion and reduce carbon dioxide emissions. Lattila et al. (2013) analyzed the impact of dry ports, using Finnish ports as an example, and determined the extent to which dry ports can reduce transport carbon emissions. Their research results were similar to the estimation that the implementation of certain measures in a dry port could potentially reduce carbon emissions by about 25% (Roso, 2007). Tsao and Linh (2018) proposed a highway–railway intermodal transportation method in which containers are transported by road from the consignor to the dry ports for rapid delivery and then transferred to the seaport by rail to save costs and reduce carbon emissions. Yin et al. (2021) constructed an integer programming model from the perspective of dividing the hinterland and coordinating transportation organization methods; optimized the port transportation route; and reduced the total costs, transportation time, and carbon emissions. Against the backdrop of the global outbreak of the COVID-19 epidemic, Xu et al. (2023) analyzed the changes in global carbon emissions from international shipping during the COVID-19 epidemic and proposed measures to achieve energy conservation and emission reduction in the post-epidemic era, such as optimizing port operating processes, improving energy efficiency, and strengthening cooperation.
In 1995, the Intergovernmental Panel on Climate Change (IPCC) released a set of national greenhouse gas inventory guidelines, which were revised and updated in 2006, and further updated in 2019 to calculate greenhouse gas emissions by various sectors. Currently, there is a global CO2 calculation framework, methods, tools, and reporting formats, but there is a lack of applicability to specific regions or industries. Noteworthily, research on carbon emissions in port collection and distribution network is limited. Lam and Gu (2016) established an optimization model for port collection and distribution network that meet time, cost, and carbon emission requirements, using genetic algorithms to solve it, and analyzed it using an inland Chinese city as an example. Davarzani et al. (2016) suggested that to reduce carbon dioxide emissions in the entire transportation system, it is necessary to consider the overall architecture of transportation and use various methods to calculate carbon emissions. Yang et al. (2017) proposed the concept of an integrated logistics system for ports and provided a measurement method for carbon emissions in the integrated logistics system of Shenzhen Port. Wang et al. (2020) proposed an easily implemented method for calculating CO2 emissions from port container distribution and investigated their spatial characteristics and driving factors. Yaacob et al. (2020) had a review of carbon dioxide emissions from transportation and presented the different formulas used to measure CO2 emissions from transportation, including the methods of five factors. Taking the Shanghai port and the Yangtze River Delta hinterland as a case, Guo et al. (2022) estimated the carbon emission of the hinterland-based container intermodal network under the Well-to-Wheel and the Tank-to-Wheel modes in the past ten years. However, each method has its specialization and the appropriate method depends on the aim of the research.
In summary, on one hand, current research mainly focuses on carbon emissions and emission reduction measures within the port, overlooking the carbon emissions of port collection and distribution network formed by a combination of multiple transportation modes starting from the port. On the other hand, current research mainly concentrates on the carbon emission reduction effects of clean energy applications in ports and the optimization of port transportation organization but lacks analyses of the carbon emission reduction effects of government guidance policies. To fill the gaps mentioned above, this paper takes the carbon emissions of port collection and distribution network as the research object and calculates the impact of government subsidy policies on the carbon emissions of port collection and distribution network by analyzing the influence of government subsidy policies on the network and the changes in the transportation structure. The research results can evaluate the carbon reduction effects of government subsidy policies and can provide evaluation tools and decision-making support for port emission reduction policies formulated by relevant departments.
3 Materials and methods
3.1 Estimation method for emissions from port collection and distribution network
The port collection and distribution network is the link between the inland cities and the port, as shown in Figure 1, which can provide a platform for the connection of different transportation modes and is the key to integrated transportation organization (Yang and Guo, 2020).
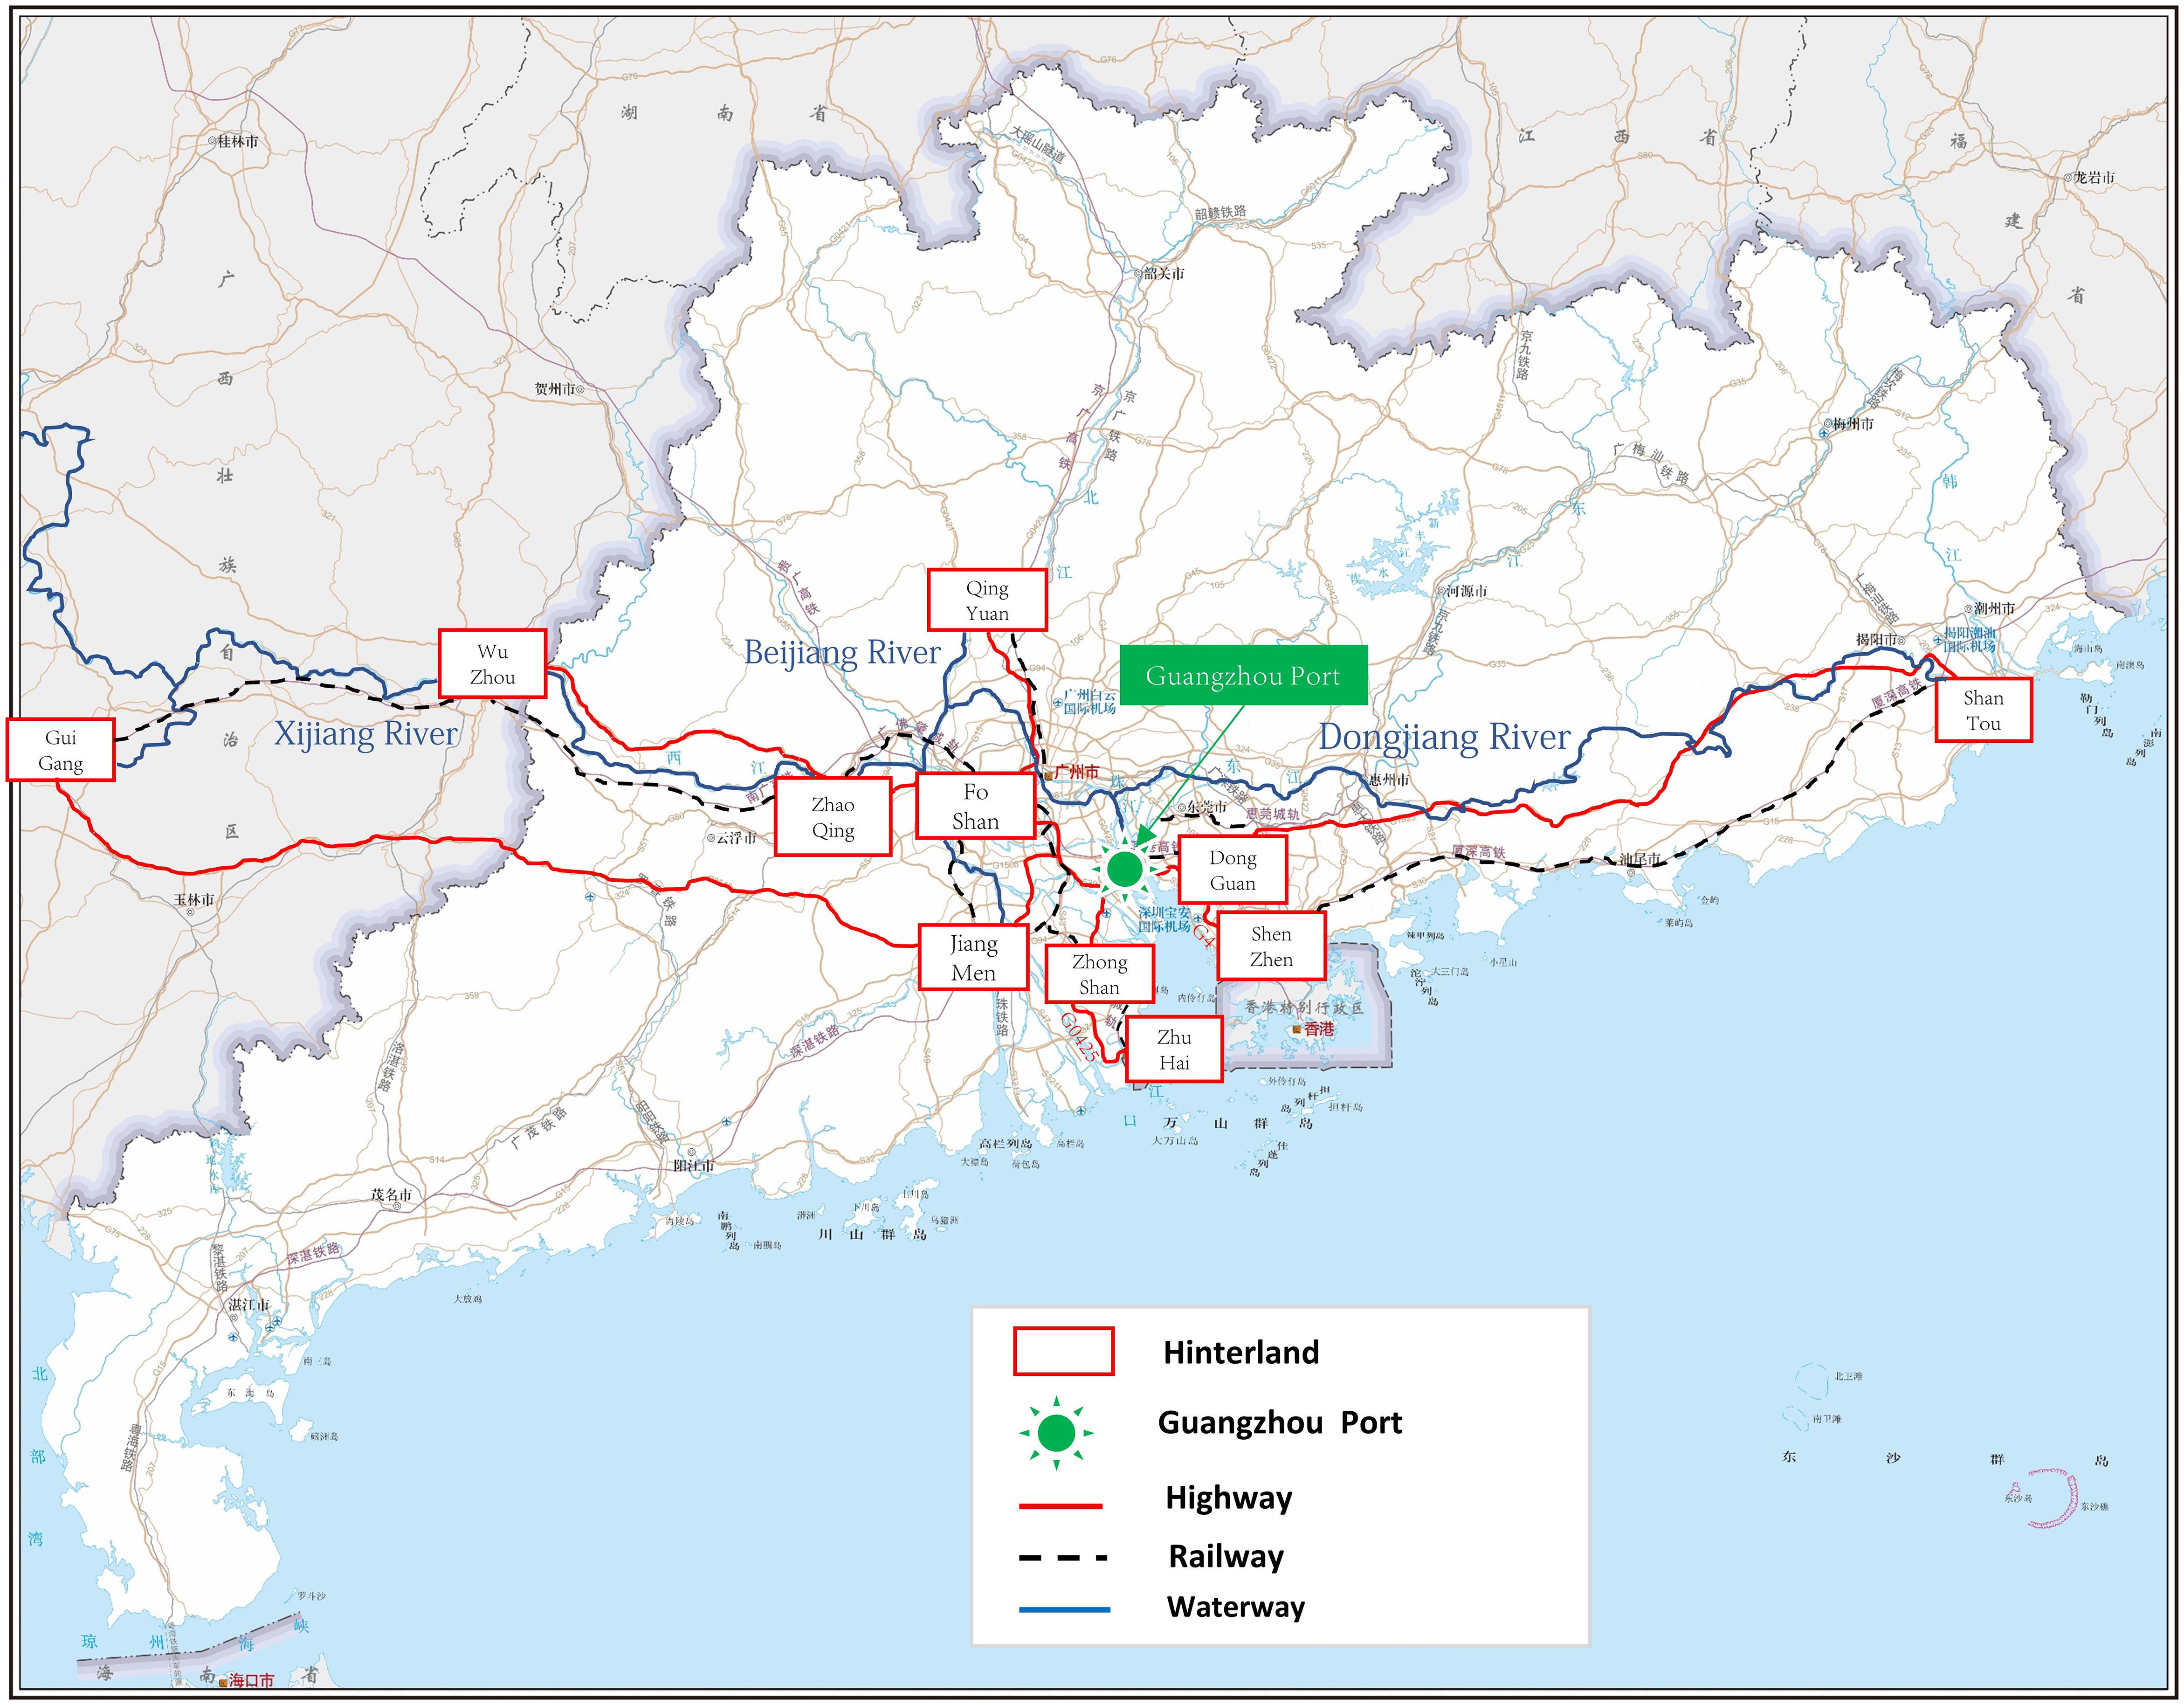
Figure 1 Port collection and distribution network (Taking Guangzhou Port as an example).
Assuming the port collection and distribution volume is Q, there are i inland areas within the radius of the port, and j transportation modes exist in each inland area, the total port collection and distribution volume (Q) can be expressed as:
In Equation (1), qij represents the volume of transportation between hinterland i and the port using transportation mode j.
Considering the convenience of model construction, this paper makes the following assumptions based on the port collection and distribution network:
Hypothesis 1 (H1). Due to the low proportion of transit in the port collection and distribution network, the transit process in the port collection and distribution network is not considered and the carbon emissions generated by the transit process are not considered.
Hypothesis 2 (H2). The distance from each hinterland city to the local port and railway hub station varies greatly, and the carbon emissions generated by the short-distance transportation at both ends of the waterway and railway are not considered for the time being.
The present study estimates the carbon emissions from container collection and distribution transport in the port using the emission-factor approach. The emission-factor approach is a method for estimating carbon emissions that was proposed by IPCC. It calculates the estimated carbon emissions of a specific emission source by multiplying its activity data by its corresponding carbon emission factor listed in the carbon emission inventory. The calculation formula for the emission-factor approach is as follows:
In Equation (2), Emission represents the estimated carbon emissions of the port collection and distribution network; AD represents the activity data of the carbon emission sources in the carbon emission inventory of the port collection and distribution network; and EF represents the emission factor, which is the amount of greenhouse gases released per unit of usage of a certain emission source. The AD data are obtained from monitoring and survey data of carbon emission sources for carbon emission projects or relevant national statistical data. The EF is mainly obtained using the default values given in IPCC reports or by constructing them based on the actual situation of the carbon emission project itself.
The main sources of consumption in the transportation network system of the port collection and distribution are mobile combustion sources, which involve different modes of transportation, including road, rail, water, air, and pipeline. The fuel consumption can be calculated based on data such as the type of transportation, the distance traveled, and the fuel consumption per unit distance for different vehicles in order to calculate the CO2 emissions. The calculation method for the carbon dioxide emission factor (EF) is as follows:
In Equation (3), EFj is the carbon emission coefficient for the j-th mode of transportation; Mis the average lower heating value; N1is the carbon content per unit calorific value; N2 is the carbon oxidation rate; k is the carbon atom conversion coefficient; Kjis the fuel consumption per unit of load and distance for the mode of transportation; and G is the average weight of the loaded containers.
In the port container collection and distribution network, the carbon dioxide emissions can be calculated by multiplying the carbon dioxide emission factor of each transportation mode by its corresponding transportation distance and container transportation volume and then summing them up. The formula is as follows:
In Equation (4), E represents the total carbon emissions of the port container collection and distribution network; Eij represents the carbon emissions generated by transportation mode j from hinterland i to the port; Lijrepresents the distance from hinterland i to the port by transportation mode j; Qi represents the container volume of hinterland i; and Pij represents the probability of hinterland i choosing transportation mode j.
3.2 The evaluation of government subsidy policies on port collection and distribution network
This article studies the choice of transportation modes in the port collection and distribution network under government subsidies based on the logit model. Previous researcher (Veldman et al., 2013; Al-Salih and Esztergar-Kiss, 2021; Perez-Lopez et al., 2022) has shown that the logit model is a mature method for analyzing the mode choice behavior of various products in the port hinterland. Researchers often use binary logit models, multinomial logit models, nested logit models, ordered logit models, and mixed logit models in experimental designs. The core of the logit model is based on the theory of utility maximization, where the hinterland considers the utility value generated by each option and selects the option that can bring the maximum utility (Arencibia et al., 2015; Williams, 2016; Bel et al., 2018).
This article constructs a utility function for the hinterland to choose different transportation modes, which is composed of a fixed term obtained through observed factors and a random term composed of unobservable factors:
In Equation (5), Ujis the utility of the i-th hinterland choosing the j-th transportation mode; Vij represents the fixed part of the utility function for hinterland i to select transport mode j; and ϵij represents the random part of the utility function for hinterland i to select transport mode j.
The fixed term of the utility function is affected by the characteristics of the hinterland and the transport mode and can be quantified and calibrated through statistical analysis as:
In Equation (6), Xkij represents the k utility-influencing factors that affect the fixed term Vij and represents the functional relationship between the utility-influencing factor Xkij and the fixed term Vij.
Time costs and economic costs are widely recognized as the two most important factors in transportation decision-making. Time costs, such as transportation time and waiting time, are significant because they affect the convenience and efficiency of transportation (Al-Salih and Esztergar-Kiss, 2021). Economic costs, such as fuel costs and tolls, are important because they have a direct impact on the financial bottom line of transportation operations. Combined with the actual situation of the port container collection and distribution network, this article uses time costs and economic costs as the basis of benefit calculation and adopts the logit model to calculate the probability distribution of the different transportation modes so as to obtain the flow distribution proportion of each transportation mode. Since time costs and economic costs use two different units of measurement, before calibrating the coefficients of the utility terms, each parameter is normalized. and for normalization. After normalization, the time cost is and the economic cost is . The utility of transportation mode j is expressed as:
In Equation (7), ω represents the weight of the economic cost and 1-ω represents the weight of the time cost.
The probability distribution function of the different transportation modes is then given by:
The probability distribution function for the allocation of port collection and distribution modes under the influence of government subsidy policies is given by:
The change in the allocation probability of port collection and distribution modes before and after government subsidies is:
In Equations (8)–(10), Pijrepresents the probability of selecting transportation mode j between the port and hinterland i; uij represents the utility of selecting transportation mode j between the port and hinterland i; represents the probability of selecting transportation mode j between the port and hinterland i after subsidy policies; represents the utility of selecting transportation mode j between the port and hinterland i after subsidy policies; and represents the change in the probability of selecting transportation mode j between the port and hinterland i before and after subsidy policies.
Combined with the previous calculation method for the carbon emissions in port container collection and distribution network, the change in carbon emissions under the subsidy policies can be given by:
In Equation (11), ΔErepresents the change in carbon emissions of container transportation in the port collection and distribution network under the subsidy policies and represents the change in carbon emissions of transportation mode j from hinterland i to the port under the subsidy policies.
4 Results: case study of Guangzhou Port
4.1 Port collection and distribution network of Guangzhou Port
We selected the container collection and distribution network of Guangzhou Port as an example to analyze the impact of government subsidy policies on the transport network. Guangzhou Port is the fifth largest container port in the world; a major coastal port in China; an important hub of the national comprehensive transportation system; and a crucial channel for energy, raw material, and foreign trade material transportation in southern China. In 2022, Guangzhou Port handled a cargo throughput of 656 million tons and a container throughput of 24.86 million TEUs. Currently, Guangzhou Port has multiple transport modes for container transport, including road, railway, and waterway. Its hinterland mainly covers Guangdong Province and the Guangxi Region. This paper studies the network using cities as nodes in the OD flow, including cities in the Pearl River Delta such as Guangzhou, Zhaoqing, Foshan, Jiangmen, and Zhongshan as well as eastern, western, and northern Guangdong, including Qingyuan and Shantou, and cities along the Xijiang River such as Wuzhou, Guigang, and Nanning.
4.2 Parameter determination
Parameter qij determination: based on the selected collection and distribution nodes and the research and statistical results of Guangzhou Port, the basic data of the container collection and distribution volume for each hinterland city in 2022 are shown in Table 1.
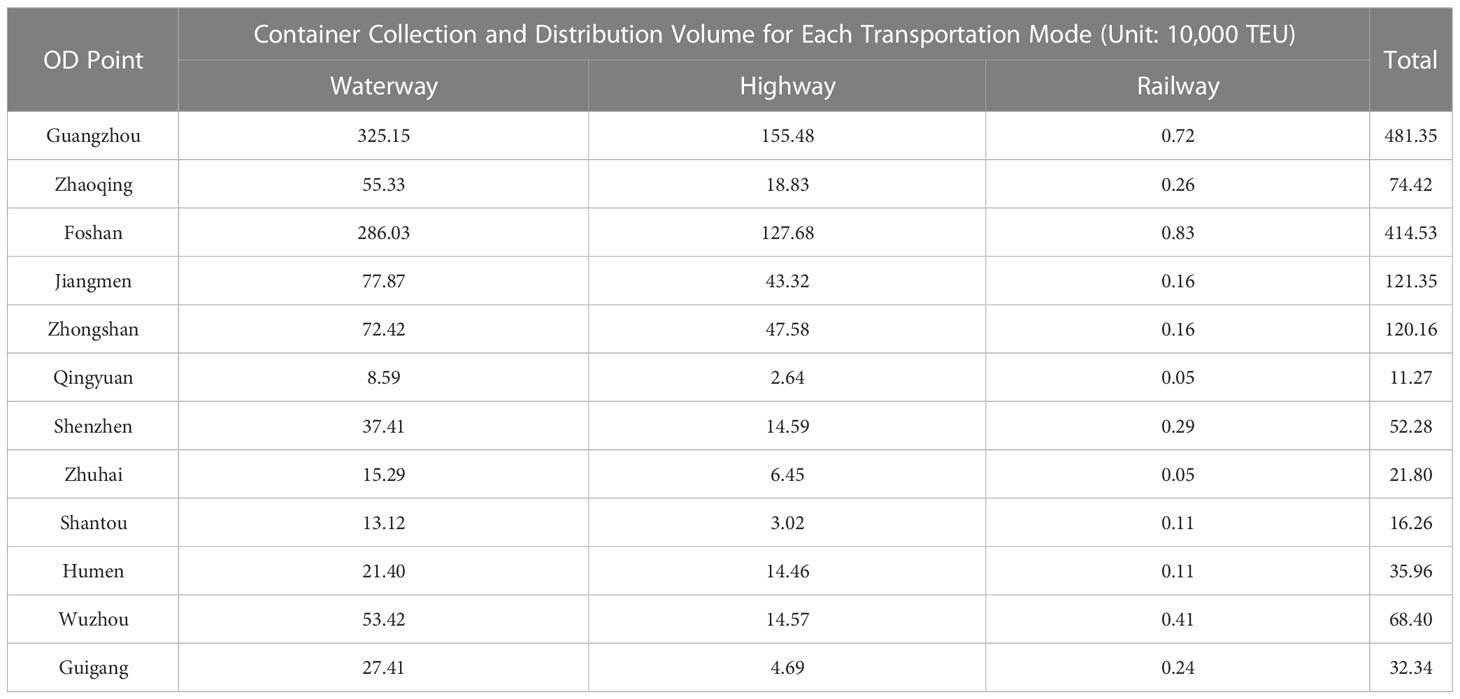
Table 1 The volume of port collection and distribution freight by different transportation modes at Guangzhou Port (sourced from Guangzhou Port Group).
The determination of parameter Lij: using measurement data from the 91 satellite map (https://www.91weitu.com, accessed on 1 January 2023.), the transportation distances from Guangzhou Port to each inland city (Lij) were obtained and are shown in Table 2.
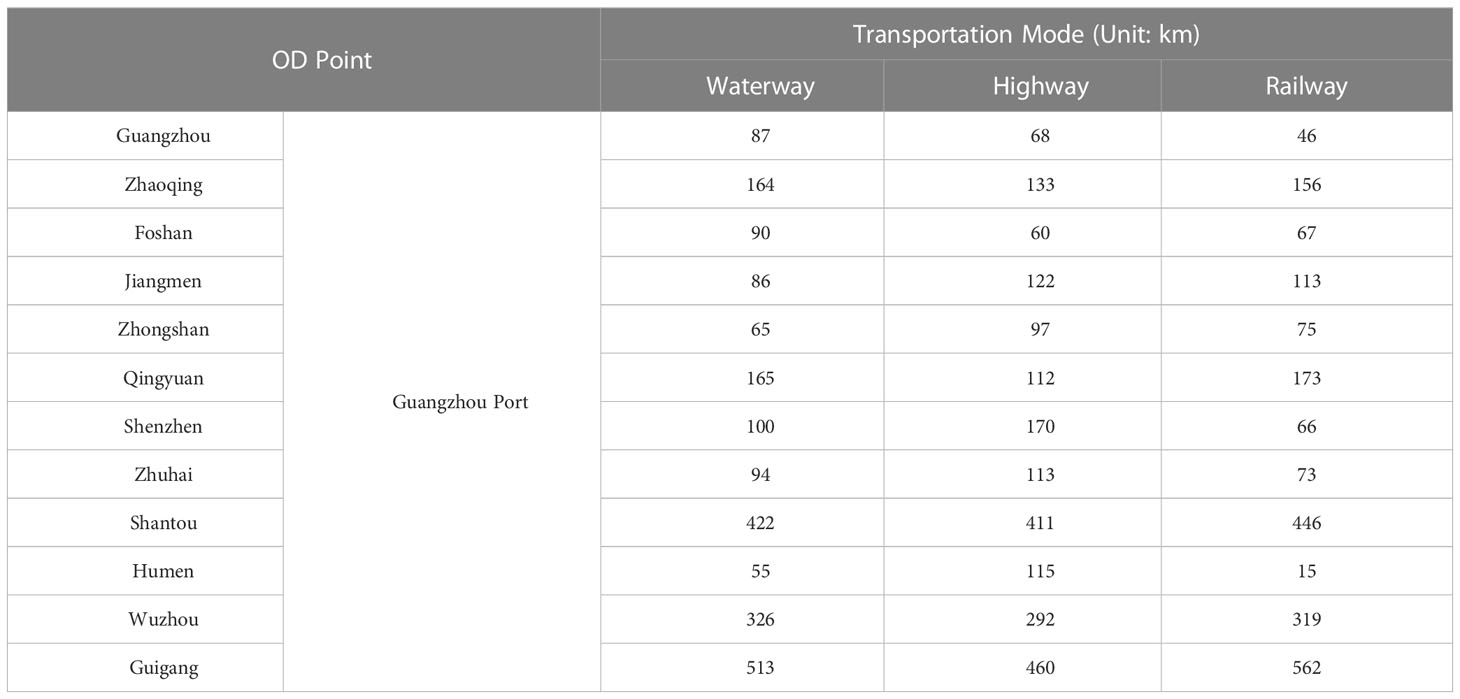
Table 2 Distance of transport from Guangzhou Port to various hinterland cities.
The determination of carbon dioxide emission factor EFj: according to the IPCC guidelines, the carbon dioxide emission factors for the Guangzhou port container collection and distribution network transport modes were calculated, as shown in Table 3.
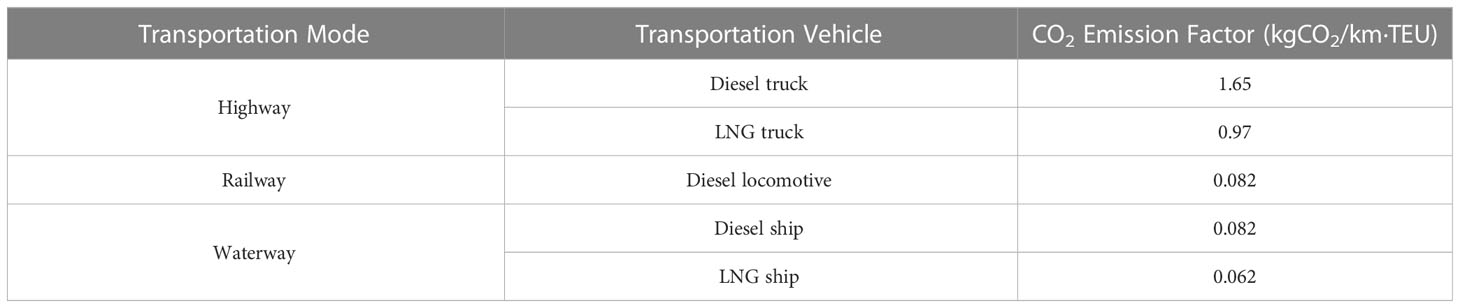
Table 3 Carbon dioxide emission factors for Guangzhou Port container collection and distribution network.
The determination of time costs (T) and economic costs (F): Based on research on the transportation market, the economic and time costs of transporting from Guangzhou Port to each hinterland city were determined, as shown in Table 4. The weight (ω) was set to 0.3, which means that in the transportation utility (U), the economic cost (F) accounted for 70%, the time cost (T) accounted for 30%, and the average container weight (G) was 17.8 tons (sourced from the Guangzhou Statistics Bureau).
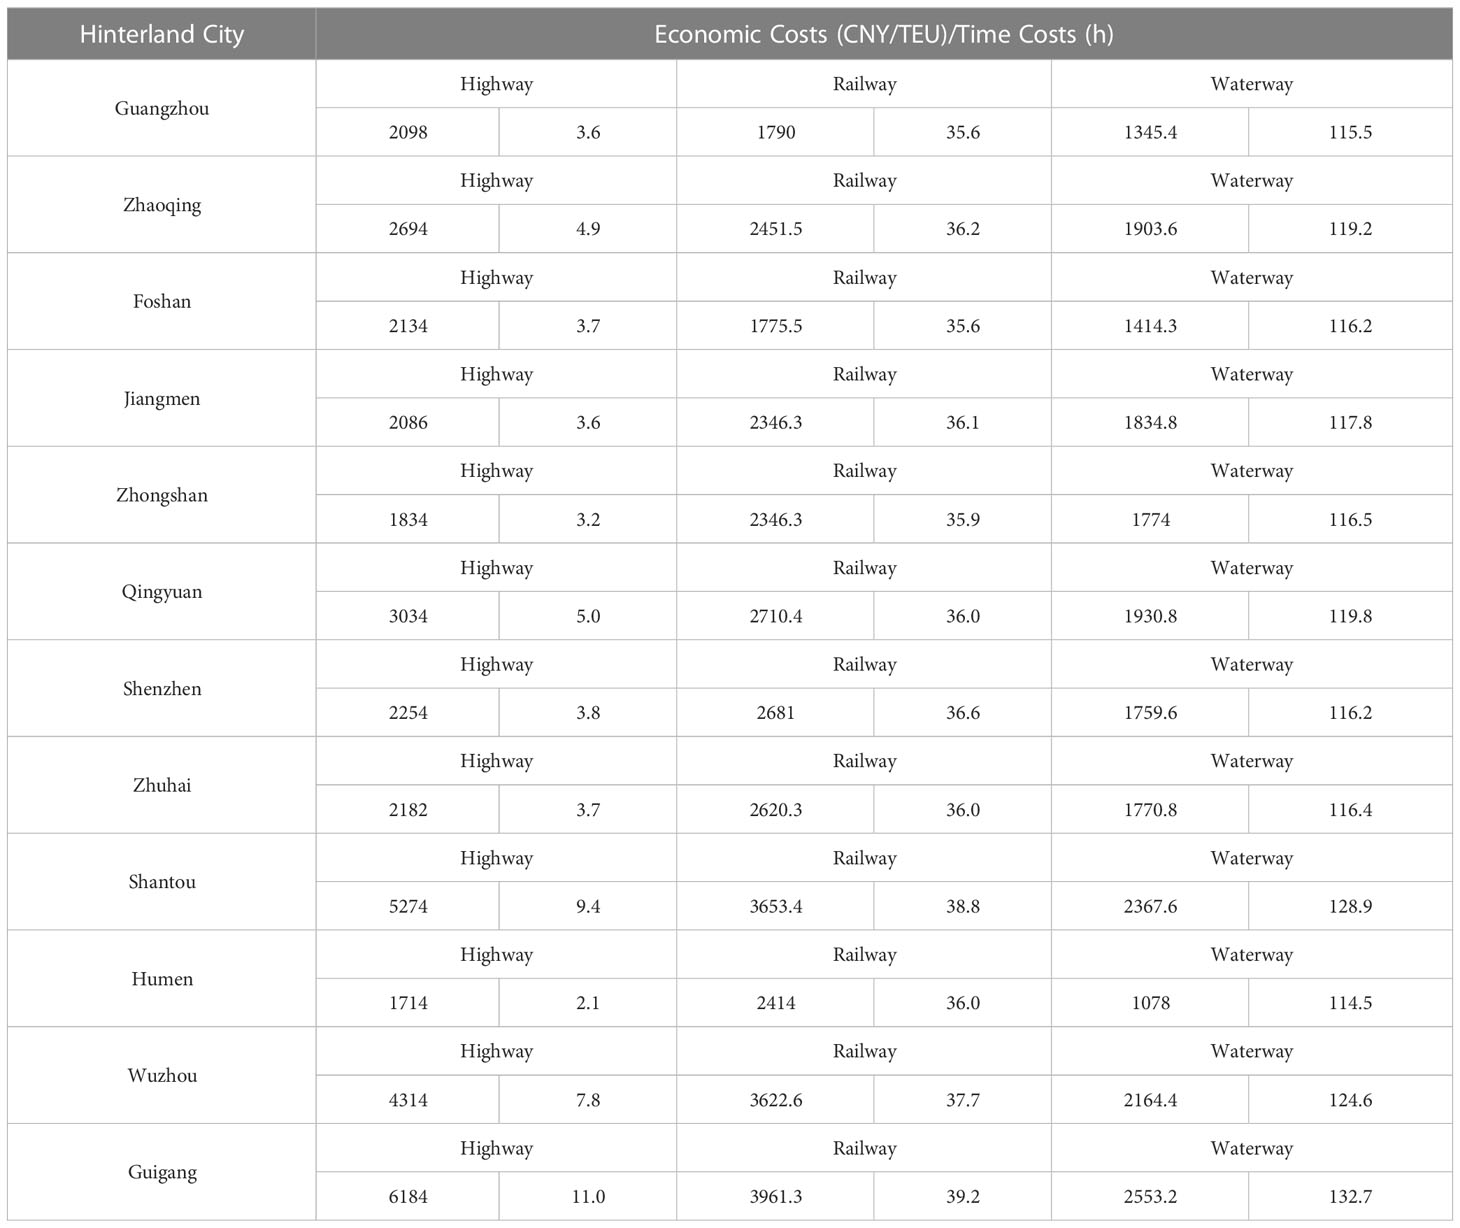
Table 4 Time costs (T) and economic costs (F) of Guangzhou Port container collection and distribution network.
4.3 Calculation of carbon emissions for Guangzhou Port collection and distribution network
The study is based on the 2022 data of the container collection and distribution volume. According to the carbon emission calculation method of the port container collection and distribution network mentioned earlier, the total carbon emissions of the Guangzhou port container collection and distribution network in 2022 equaled 831,300 tons. The carbon emissions of various transportation modes are shown in Table 5.
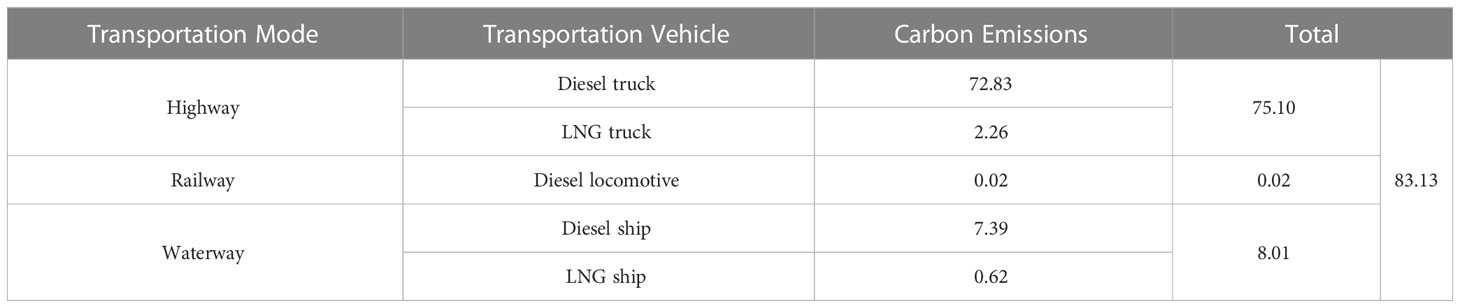
Table 5 Calculation of carbon emissions for Guangzhou Port container collection and distribution network in 2022 (unit: 10,000 tons).
As LNG energy was less applied in Guangzhou Port, the proportion of carbon emissions from transportation vehicles using LNG as a fuel was relatively low. If classified by transportation mode, the carbon emissions from road transportation in the Guangzhou port container collection and distribution network were the highest, reaching 90.4%, while water transportation had a relatively low proportion of carbon emissions, accounting for only 9.6%. The proportions of Guangzhou Port’s three transportation modes, namely road, rail, and waterway, were approximately 32.0%, 0.8%, and 67.2%, respectively, which was significantly different from the proportion of carbon emissions in the container collection and distribution network. Road transportation accounted for 30% of the container transportation volume but contributed to 90% of the carbon emissions, while waterway transportation accounts for 60% of the container transportation volume but only contributed to 10% of the carbon emissions. It can be seen that the government’s formulation of subsidy policies to promote the transformation of Guangzhou Port’s container collection and distribution from road transportation to rail and waterway transportation is beneficial for reducing the total carbon emissions of the network.
4.4 The evaluation of government subsidy policies on carbon emissions
We focused on considering the variable of transportation cost and proposed two factors to reduce the railway freight rates and subsidize the container shipping rates. In order to differentiate subsidy policies for different hinterlands more effectively, it was decided to base subsidies for waterway transportation on the transportation distance. Six different subsidy policy scenarios were set up, as shown in Table 6.
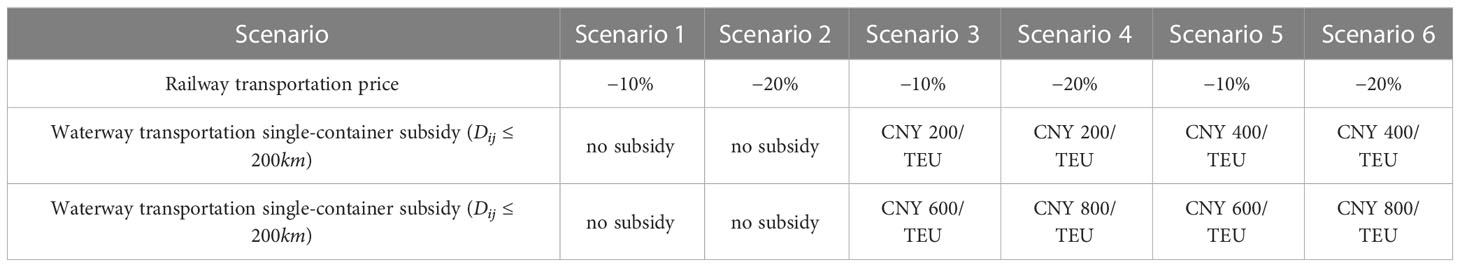
Table 6 Policy scenarios of government subsidies for Guangzhou Port collection and distribution network.
Based on the six combinations, including railway transportation prices, single-box subsidies for waterway transportation, and no subsidies, the transfer of the market share of each hinterland city was calculated using the logit model introduced earlier. The carbon reductions of each hinterland city segment under the subsidy policy scenarios are shown in Table 7.
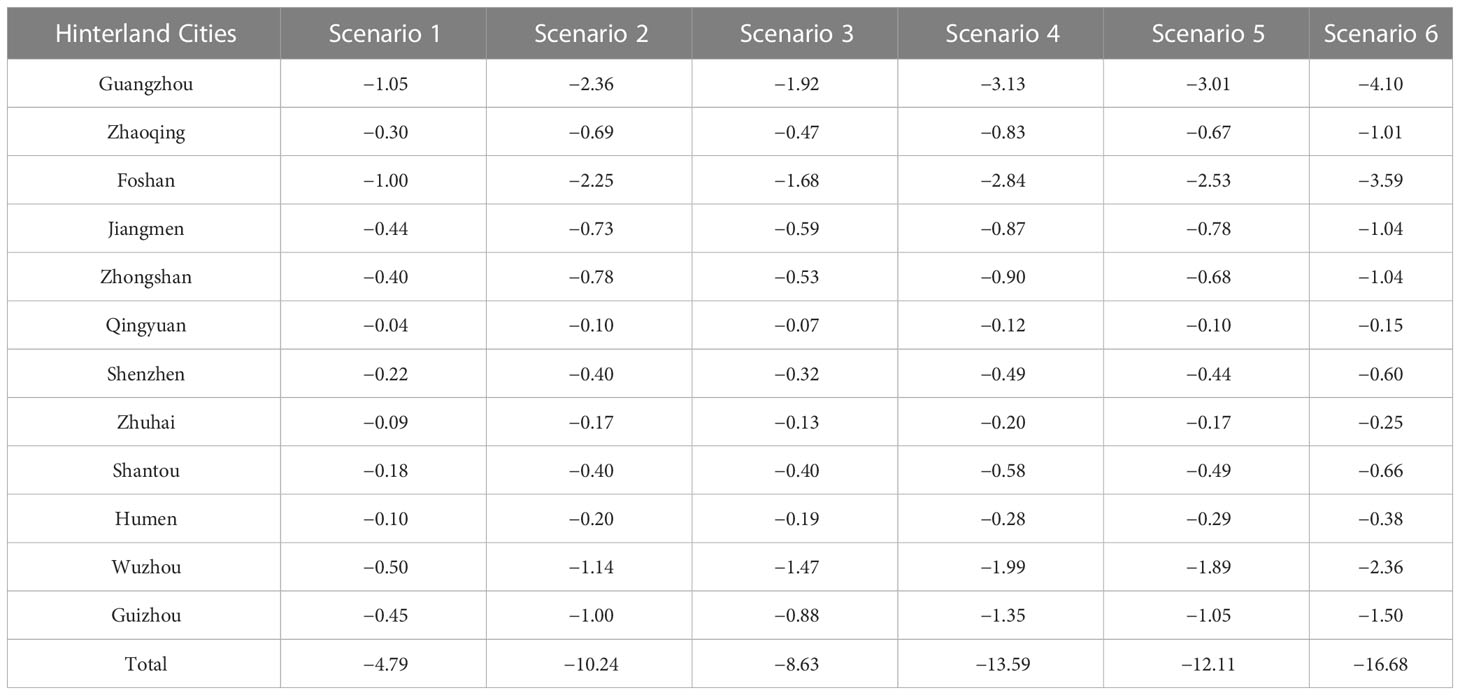
Table 7 Carbon reductions of hinterland cities in Guangzhou port collection and distribution network in six subsidy scenarios (unit: 10,000 tons).
Based on the total reduction in carbon emissions from the Guangzhou port container collection and distribution network, scenario 1 had the lowest carbon reduction effect, with a decrease of 47.9 thousand tons of carbon emissions, while scenario 6 had the highest carbon reduction effect, with a decrease of 166.8 thousand tons of carbon emissions. As shown in Table 7, the greater the intensity of the subsidy policies, the greater the corresponding reduction in carbon emissions.
We defined scenario 1 as a low subsidy and scenario 6 as a high subsidy. The carbon reduction effects of the two subsidy scenarios on the Guangzhou port container collection and distribution network were compared and analyzed, and the total carbon reduction effects of the low and High subsidies on each hinterland and the overall port collection and distribution network are shown in Figure 2.
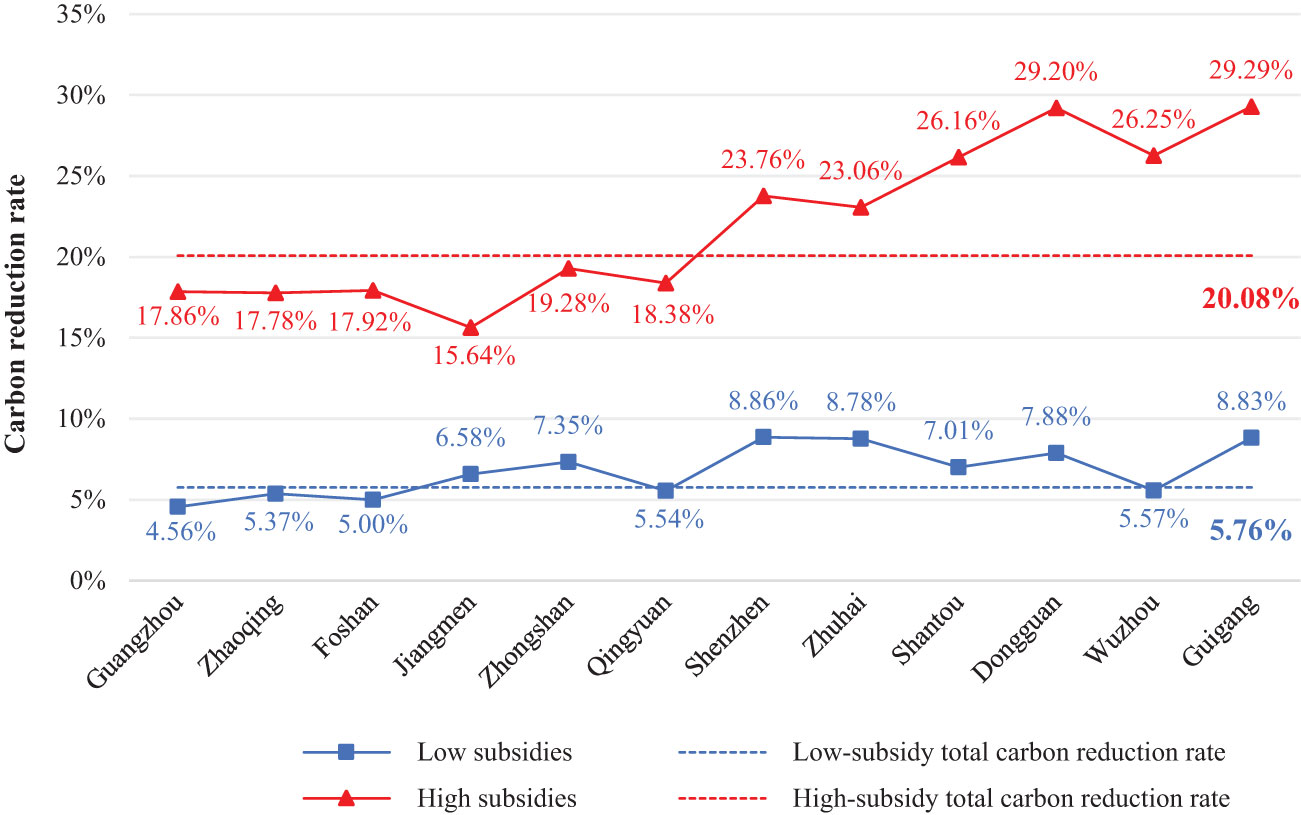
Figure 2 Total carbon reduction effect of Guangzhou Port’s hinterland and port collection and distribution network in low and high subsidy scenarios.
Looking at the total reduction in carbon emissions from the Guangzhou port container collection and distribution network, in the low subsidy scenario, carbon emissions were reduced by 47,900 tons, with a reduction rate of 5.76%. In the high subsidy scenario, carbon emissions were reduced by 166,800 tons, with a reduction rate of 20.08%. High subsidies can significantly reduce the absolute amount of carbon emissions from the Guangzhou port container collection and distribution network. In the high subsidy scenario, the carbon reduction rates of Shantou, Humen, Wuzhou, and Guigang were relatively high, at 26.16%, 29.20%, 26.25%, and 29.29%, respectively. Currently, the proportion of Humen’s road transportation is as high as 40.20%, and subsidies for railway transportation and waterway transportation could cause a large amount of road transportation to be transferred, leading to a higher carbon reduction rate. However, Shantou, Wuzhou, and Guigang are far from Guangzhou Port, and road transportation costs are high. Under high subsidies, they could also cause a large amount of road transportation to be transferred to railway and water transportation. Meanwhile, because road transportation covers longer distances, it generates more carbon emissions. Therefore, transferring road transportation to railway and water transportation can effectively reduce carbon emissions.
High subsidies had significant carbon reduction effects, but their subsidy costs are worth considering. Combining the container collection and distribution volumes of the various hinterlands in the Guangzhou port collection and distribution network in 2022 and the changes in the proportion of container transportation, the total subsidy costs of the Guangzhou port multimodal transportation network under the low and High subsidies were CNY 99.98 million and CNY 411.69 million, respectively. The total subsidy costs for each hinterland are shown in Figure 3.
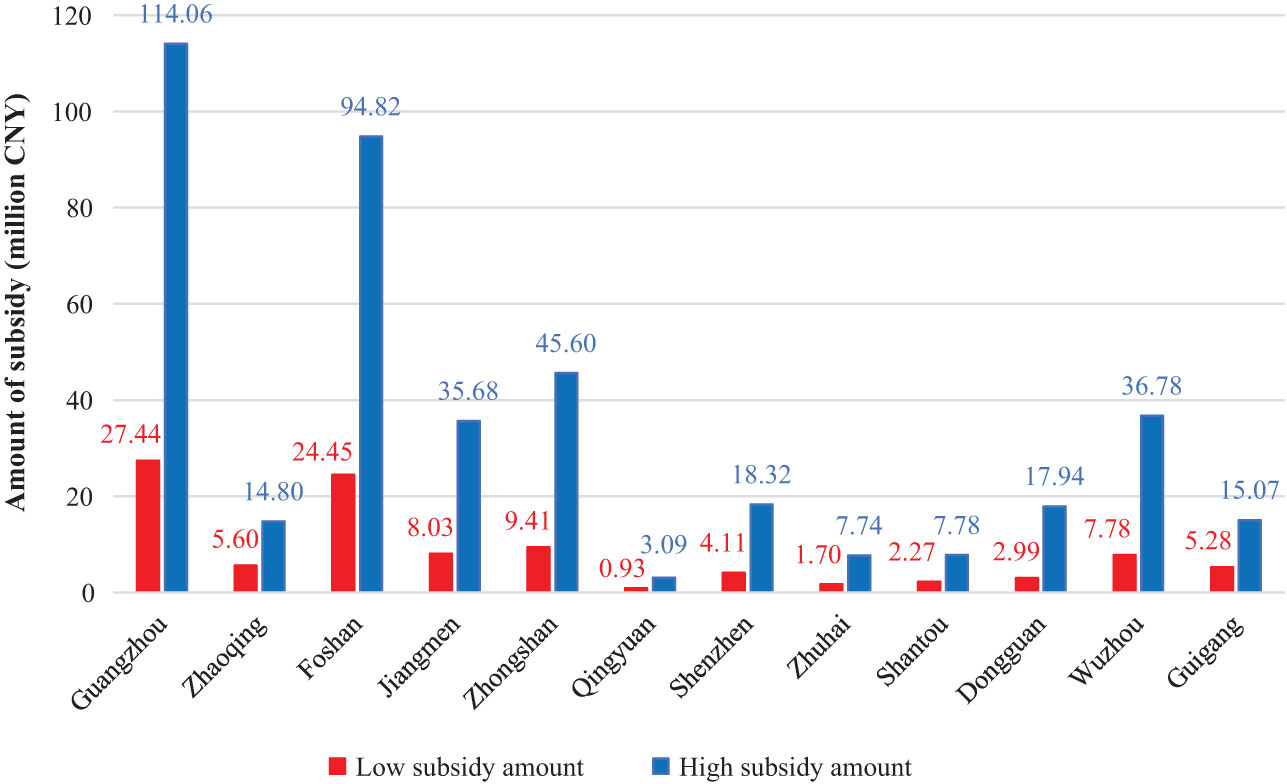
Figure 3 Total subsidy costs of Guangzhou Port container collection and distribution network in low and high subsidy scenarios.
To comprehensively analyze the cost-effectiveness of the subsidy policy for the Guangzhou port container collection and distribution network and its corresponding carbon reduction effect, we constructed a subsidy carbon reduction efficiency index as follows:
In Equation (12), η is the subsidy carbon reduction efficiency, ΔE is the carbon emission reduction corresponding to the subsidy scenario, and totalcost is the cost of the subsidy scenario. The carbon reduction efficiency of the weak and strong subsidies can be calculated using Equation (12), as shown in Figure 4.
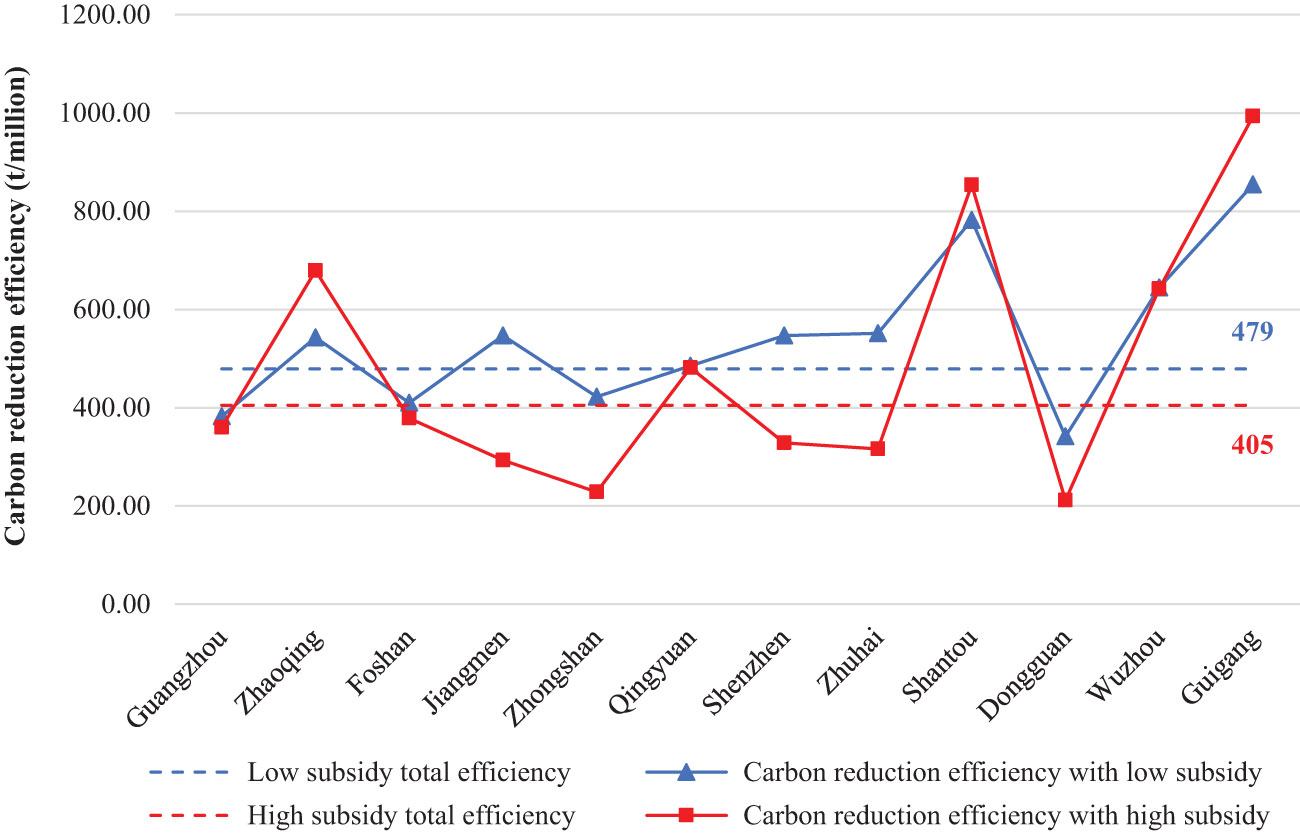
Figure 4 Carbon reduction efficiency of subsidy policies for Guangzhou Port container collection and distribution network in low and high subsidy scenarios.
In the low subsidy scenario, the carbon reduction efficiency of the Guangzhou port multimodal container transportation network was 479 tons/million, while in the high subsidy scenario, it was 405 tons/million. In terms of carbon reduction efficiency, for each specific city, the low subsidy was superior to the high subsidy. However, in terms of carbon emission reduction, the corresponding reduction rates for the low and high subsidies were 5.76% and 20.08%, respectively. Thus, the high subsidy had the best carbon reduction effect and the greatest carbon emission reduction.
5 Discussion
Because the total subsidy cost had a significant impact on the carbon reduction of the Guangzhou Port container collection and distribution network under different subsidy policies, we conducted a sensitivity analysis on the subsidy cost to improve the applicability of the model.
Based on the analysis in Table 8, combined with the previous content, it can be concluded that in subsidy scenarios 7 to 12, the subsidy policy in scenario 8 resulted in the highest carbon reduction efficiency for the Guangzhou port container collection and distribution network, which was 578.3 tons/million CNY. With the same subsidy for railway transportation, the carbon reduction efficiency first increased and then decreased with the increase in the subsidy for waterway transportation. In particular, when the total subsidy cost was high, the carbon reduction efficiency decreased more significantly.
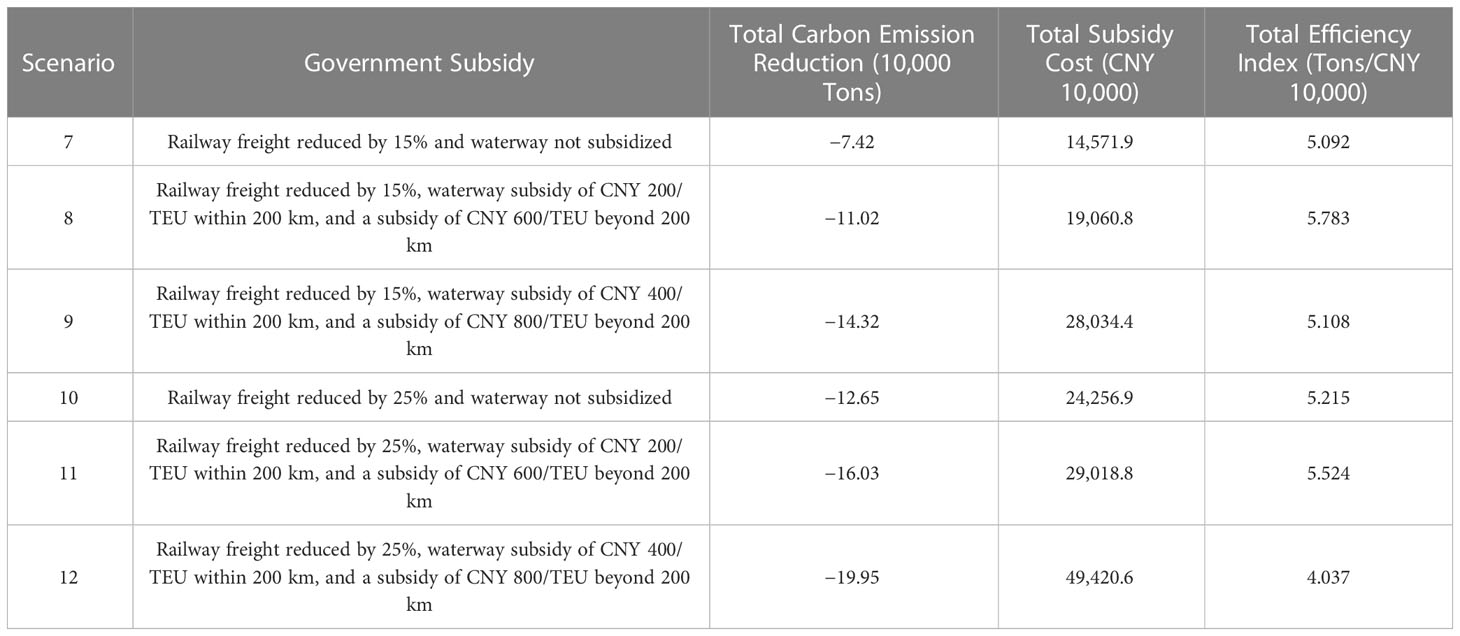
Table 8 Analysis of the evaluation of government financial subsidies on the carbon reduction effect of the Guangzhou Port container collection and distribution network.
Therefore, there are two choices for the carbon reduction subsidy policy for the Guangzhou port collection and distribution network. The first option is to consider the best carbon reduction efficiency and adopt the subsidy measures in scenario 8, with a total subsidy cost of CNY 190.6 million, a total carbon emission reduction of 110.2 thousand tons, and a carbon reduction efficiency of 13.27%. The second option is to consider the maximum carbon reduction and adopt the subsidy measures in scenario 12, with a total subsidy cost of CNY 494.2 million, a total carbon emission reduction of 199.5 thousand tons, and a carbon reduction efficiency of 23.98%. Compared with the indicators under high subsidies, the subsidy cost increases by CNY 82.51 million, and the total carbon emission reduction increases by 32.7 thousand tons, with a lower carbon reduction efficiency of 396.3 tons/million CNY in the incremental part.
6 Conclusions
We constructed a calculation framework for the carbon emissions of port container collection and distribution network and introduced the logit model to study and analyze the evaluation of subsidy policies on container transportation carbon emissions. Taking the Guangzhou Port container collection and distribution network as a case study, the total amount and composition of carbon emissions in the network were analyzed. The results showed that road transportation is the main source of carbon emissions, accounting for over 90%. Six different subsidy scenarios were set in this article, and the carbon emission reduction in each scenario for the Guangzhou Port container collection and distribution network was calculated. The results showed that as the intensity of the subsidy policies increased, the absolute value of the carbon emission reduction also increased, indicating that stronger subsidy policies can effectively guide containers from road transportation to railway transportation, and the carbon reduction effect of the Guangzhou Port container collection and distribution network became more apparent.
We defined scenario 1 as a low subsidy and scenario 6 as a high subsidy, calculated the subsidy carbon reduction efficiency (η) as the ratio of subsidy cost to carbon emission reduction, and compared and analyzed the subsidy carbon reduction efficiency in the two subsidy scenarios. It was found that in the low subsidy scenario, the carbon reduction efficiency (η) of the Guangzhou Port container collection and distribution network was 479 tons/million, while in the high subsidy scenario, η was 405 tons/million. In terms of carbon reduction efficiency, the low subsidy was better than the high subsidy for specific hinterland cities.
We conducted a sensitivity analysis on key parameters of the subsidy policy and set different subsidy scenarios from scenario 7 to scenario 12. Among them, scenario 8, in which railway transportation fees were reduced by 15% and subsidies of CNY 200/TEU within 200 km and CNY 600/TEU outside 200 km were given for waterway transportation, had the highest subsidy carbon reduction efficiency (η) for the Guangzhou Port container collection and distribution network, which was 578.3 tons/million CNY. Under the same railway cost subsidy, the subsidy carbon reduction efficiency (η) showed a trend of first increasing and then decreasing with the increase in the waterway subsidy. In particular, when the total subsidy cost was high, the decrease in the subsidy carbon reduction efficiency (η) was more obvious.
Therefore, it is suggested that there are two choices for the carbon reduction subsidy policy of the Guangzhou Port container collection and distribution network. The first is to consider the optimal carbon reduction efficiency and adopt the subsidy measures in scenario 8, with a total subsidy cost of CNY 190.6 million, a total carbon emission reduction of 110,200 tons, and a carbon reduction effect of 13.27%. The second choice is to consider the maximum carbon reduction and adopt the subsidy measures in scenario 12, with a total subsidy cost of CNY 494.2 million, a total carbon emission reduction of 199,500 tons, and a carbon reduction effect of 23.98%. These research results provide methodological support for the evaluation of government carbon reduction subsidy policies and decision-making support for relevant management departments.
Currently, the application limitations of the carbon emissions calculation framework for port container collection and distribution network primarily lie in the variability of cargo types and the uncertainty of data. There are still some points deserve investigate. First, it can extend the research object from container to all types of cargo (e.g. general cargo, dry bulk cargo). Second, more actual port cases can be introduced into the research to obtain more scientific comparative results, making the study more instructive. Third, in order to more effectively reduce carbon emissions, it is recommended to consider parallel subsidies for both transportation and energy structure transition to increase the promotion of clean energy.
Data availability statement
The original contributions presented in the study are included in the article/supplementary material. Further inquiries can be directed to the corresponding author.
Author contributions
Conceptualization: LJ, TY and GW. Methodology: ST and TY. Validation: LJ and JY. Formal analysis: ST and JY. Investigation: ST and JY. Data curation: LJ, GW, and ST. Writing original draft preparation: LJ, ST, and JY. Project administration: LJ. All authors have read and agreed to the published version of the manuscript. All authors contributed to the article and approved the submitted version.
Funding
Research for this paper was funded by the Fundamental Research Funds for the Central Universities (grant numbers: B210202030).
Acknowledgments
Thanks to the editors and reviewers for helping to improve the quality of this article.
Conflict of interest
Author GW and TY were employed by China Harbour Engineering Company Ltd.
The remaining authors declare that the research was conducted in the absence of any commercial or financial relationships that could be construed as a potential conflict of interest.
Publisher’s note
All claims expressed in this article are solely those of the authors and do not necessarily represent those of their affiliated organizations, or those of the publisher, the editors and the reviewers. Any product that may be evaluated in this article, or claim that may be made by its manufacturer, is not guaranteed or endorsed by the publisher.
References
Al-Salih W. Q., Esztergar-Kiss D. (2021). Linking mode choice with travel behavior by using logit model based on utility function. Sustainability 13 (8), 4332. doi: 10.3390/su13084332
Arencibia A. I., Feo-Valero M., Garcia-Menendez L., Roman C. (2015). Modelling mode choice for freight transport using advanced choice experiments. Transportation Res. Part a-Policy Pract. 75, 252–267. doi: 10.1016/j.tra.2015.03.027
Bel K., Fok D., Paap R. (2018). Parameter estimation in multivariate logit models with many binary choices. Econometric Rev. 37, 534–550. doi: 10.1080/07474938.2015.1093780
Davarzani H., Fahimnia B., Bell M., Sarkis J. (2016). Greening ports and maritime logistics: a review. Transportation Res. Part D-Transport Environ. 48, 473–487. doi: 10.1016/j.trd.2015.07.007
Geerlings H., van Duin R. (2011). A new method for assessing CO2-emissions from container terminals: a promising approach applied in Rotterdam. J. Cleaner Production 19, 657–666. doi: 10.1016/j.jclepro.2010.10.012
Giuliano G., O'Brien T. (2007). Reducing port-related truck emissions: the terminal gate appointment system at the ports of Los Angeles and long beach. Transportation Res. Part D-Transport Environ. 12, 460–473. doi: 10.1016/j.trd.2007.06.004
Guo X. Y., He J. L., Lan M., Yu H., Yan W. (2022). Modeling carbon emission estimation for hinterland-based container intermodal network. J. Cleaner Production 378, 134593. doi: 10.1016/j.jclepro.2022.134593
Hall W. J. (2010). Assessment of CO2 and priority pollutant reduction by installation of shoreside power. Resour. Conserv. Recycling 54, 462–467. doi: 10.1016/j.resconrec.2009.10.002
Hanaoka S., Regmi M. B. (2011). Promoting intermodal freight transport through the development of dry ports in Asia: an environmental perspective. IATSS Res. 35, 16–23. doi: 10.1016/j.iatssr.2011.06.001
Hoang A. T., Foley A. M., Nizetic S., Huang Z. H., Ong H. C., Olcer A. I., et al. (2022). Energy-related approach for reduction of CO2 emissions: a critical strategy on the port-to-ship pathway. J. Cleaner Production 355, 131772. doi: 10.1016/j.jclepro.2022.131772
Lam J. S. L., Gu Y. (2016). A market-oriented approach for intermodal network optimisation meeting cost, time and environmental requirements. Int. J. Production Economics 171, 266–274. doi: 10.1016/j.ijpe.2015.09.024
Lattila L., Henttu V., Hilmola O. P. (2013). Hinterland operations of sea ports do matter: dry port usage effects on transportation costs and CO2 emissions. Transportation Res. Part E-Logistics Transportation Rev. 55, 23–42. doi: 10.1016/j.tre.2013.03.007
Moriarty P., Honnery D. (2008). The prospects for global green car mobility. J. Cleaner Production 16, 1717–1726. doi: 10.1016/j.jclepro.2007.10.025
Perez-Lopez J. B., Novales M., Orro A. (2022). Spatially correlated nested logit model for spatial location choice. Transportation Res. Part B-Methodological 161, 1–12. doi: 10.1016/j.trb.2022.05.007
Qin Z. R., Yin J. B., Cao Z. Q. (2017). Evaluation of effects of ship emissions control areas case study of shanghai port in China. Transportation Res. Rec., 50–55. doi: 10.3141/2611-06
Roso V. (2007). Evaluation of the dry port concept from an environmental perspective: a note. Transportation Res. Part D-Transport Environ. 12, 523–527. doi: 10.1016/j.trd.2007.07.001
Styhre L., Winnes H., Black J., Lee J., Le-Griffin H. (2017). Greenhouse gas emissions from ships in ports - case studies in four continents. Transportation Res. Part D-Transport Environ. 54, 212–224. doi: 10.1016/j.trd.2017.04.033
Tsao Y. C., Linh V. T. (2018). Seaport-dry port network design considering multimodal transport and carbon emissions. J. Cleaner Production 199, 481–492. doi: 10.1016/j.jclepro.2018.07.137
Tseng P.-H., Pilcher N. (2015). A study of the potential of shore power for the port of kaohsiung, Taiwan: to introduce or not to introduce? Res. Transportation Business Manage. 17, 83–91. doi: 10.1016/j.rtbm.2015.09.001
Vaishnav P., Fischbeck P. S., Morgan M. G., Corbett J. J. (2016). Shore power for vessels calling at US ports: benefits and costs. Environ. Sci. Technol. 50, 1102–1110. doi: 10.1021/acs.est.5b04860
Veldman S., Garcia-Alonso L., Vallejo-Pinto J. A. (2013). A port choice model with logit models: a case study for the Spanish container trade. Int. J. Shipping Transport Logistics 5, 373–389. doi: 10.1504/IJSTL.2013.055277
Wan Z., Zhang Q., Xu Z. P., Chen J. H., Wang Q. (2019). Impact of emission control areas on atmospheric pollutant emissions from major ocean-going ships entering the shanghai port, China. Mar. pollut. Bull. 142, 525–532. doi: 10.1016/j.marpolbul.2019.03.053
Wan C. P., Zhang D., Yan X. P., Yang Z. L. (2018). A novel model for the quantitative evaluation of green port development - a case study of major ports in China. Transportation Res. Part D-Transport Environ. 61, 431–443. doi: 10.1016/j.trd.2017.06.021
Wang L. K., Peng C., Shi W. M., Zhu M. (2020). Carbon dioxide emissions from port container distribution: spatial characteristics and driving factors. Transportation Res. Part D-Transport Environ. 82, 102318. doi: 10.1016/j.trd.2020.102318
Williams R. (2016). Understanding and interpreting generalized ordered logit models. J. Math. Sociology 40, 7–20. doi: 10.1080/0022250X.2015.1112384
Winnes H., Styhre L., Fridell E. (2015). Reducing GHG emissions from ships in port areas. Res. Transportation Business Manage. 17, 73–82. doi: 10.1016/j.rtbm.2015.10.008
Xiong S. Q., Yuan Y., Zhang C. L. (2023). Achievement of carbon peak goals in china?s road transport-possibilities and pathways. J. Cleaner Production 388, 135894. doi: 10.1016/j.jclepro.2023.135894
Xu L., Di Z. J., Chen J. H. (2021). Evolutionary game of inland shipping pollution control under government co-supervision. Mar. pollut. Bull. 171, 112730. doi: 10.1016/j.marpolbul.2021.112730
Xu L., Yang Z., Chen J., Zou Z. (2023). Impacts of the COVID-19 epidemic on carbon emissions from international shipping. Mar. pollut. Bull. 189, 114730. doi: 10.1016/j.marpolbul.2023.114730
Yaacob N. F. F., Yazid M. R. M., Maulud K. N. A., Basri N. E. A. (2020). A review of the measurement method, analysis and implementation policy of carbon dioxide emission from transportation. Sustainability 12 (14), 5873. doi: 10.3390/su12145873
Yang L., Cai Y. J., Zhong X. Z., Shi Y. Q., Zhang Z. Y. (2017). A carbon emission evaluation for an integrated logistics SystemA case study of the port of shenzhen. Sustainability 9 (3), 462. doi: 10.3390/su9030462
Yang J. H., Guo L. (2020). Optimization of marine port logistics collection and distribution network: a perspective of supply chain management. J. Coast. Res., 473–476. doi: 10.2112/SI106-106.1
Keywords: logit model, government subsidy policies, Guangzhou port, port collection and distribution network, carbon emissions
Citation: Jiang L, Tang S, Wang G, Yu T and Yuan J (2023) The evaluation of government subsidy policies on carbon emissions in the port collection and distribution network: a case study of Guangzhou Port. Front. Mar. Sci. 10:1213701. doi: 10.3389/fmars.2023.1213701
Received: 28 April 2023; Accepted: 31 May 2023;
Published: 13 June 2023.
Edited by:
Lang Xu, Shanghai Maritime University, ChinaReviewed by:
Guolei Tang, Dalian University of Technology, ChinaLing Sun, Fudan University, China
Xuhui Yu, Dalian Maritime University, China
Copyright © 2023 Jiang, Tang, Wang, Yu and Yuan. This is an open-access article distributed under the terms of the Creative Commons Attribution License (CC BY). The use, distribution or reproduction in other forums is permitted, provided the original author(s) and the copyright owner(s) are credited and that the original publication in this journal is cited, in accordance with accepted academic practice. No use, distribution or reproduction is permitted which does not comply with these terms.
*Correspondence: Liupeng Jiang, anNqbHBAaGh1LmVkdS5jbg==