 P. Sathish Kumar1,2*
 G. Dharani1
 J. Santhanakumar1
 Dilip Kumar Jha1
 Vikas Pandey1,3
 S. Venkatnarayanan1
 J. Prince Prakash Jebakumar4
 C. Muthukumar2,5
 R. Arthur James2
- 1Ocean Science and Technology for Islands, National Institute of Ocean Technology (NIOT), Ministry of Earth Sciences, Government of India, Chennai, Tamil Nadu, India
- 2Department of Marine Science, Bharathidasan University, Tiruchirappalli, Tamil Nadu, India
- 3Biological Oceanography Division, CSIR - National Institute of Oceanography, Dona Paula, Goa, India
- 4Coastal and Environmental Engineering, National Institute of Ocean Technology, Ministry of Earth Sciences, Government of India, Chennai, Tamil Nadu, India
- 5National Centre for Coastal Research, Ministry of Earth Sciences, Government of India, Chennai, Tamil Nadu, India
Coastal waters are dynamic because of anthropogenic activities that contribute nutrients and contaminants. These changes have the potential to alter patterns of primary production and thus pelagic food webs. Here, we investigated the spatial variation of the phytoplankton community and its response to changing environmental variables at 84 stations along the five coastal districts of Tamil Nadu (TN). During the present study, 85 phytoplankton species were recorded, such as diatoms (64), dinoflagellates (18), silicoflagellates (1), and Cyanophyceae (2). The maximum phytoplankton abundance was recorded on the Thanjavur coast and gradually decreased towards the south coast of Tamil Nadu. Among the phytoplankton community, 50% was dominated by pennate diatoms, attributed to higher NO3− concentrations in the coastal waters due to agricultural discharge. Cluster analysis revealed that Ramanathapuram and Tirunelveli formed a closed cluster, whereas Thanjavur and Pudukottai formed a separate closed cluster associated with higher nutrient and metal concentrations, highlighting the difference in physicochemical parameters between the northern and southern districts of the TN coast. Relatively high nutrient concentrations in the coastal waters of northern districts are of greater concern, which could impact the coastal ecosystem. Coastal eutrophication is becoming a widespread phenomenon, causing disruption in the food chain and ecosystem balances and hence requiring regular monitoring and management.
Introduction
Phytoplankton is key component in coastal ecosystems and serve as primary producers in the marine food chain (Ananthan et al., 2004; Tas and Gonulol, 2007). In addition to being the foundation of the marine food web, they are responsible for adding oxygen to the ocean and play a key role in carbon sequestration. The growth and abundance of phytoplankton are predominantly controlled by interactions between biotic and abiotic factors (Dayala et al., 2014). Ambient temperature can significantly influence the growth and distribution of phytoplankton in coastal waters by affecting the photosynthetic activity of these primary producers (Trombetta et al., 2019). Similarly, salinity also plays a major role in controlling the structure and composition of phytoplankton communities because each species responds to salinity differently (Larson and Belovsky, 2013). Changes in salinity can affect the mixing and transport of nutrients throughout the water column, which can affect nutrient availability (Marcarelli et al., 2006). Nitrogen and phosphorus are critical nutrients for phytoplankton growth and metabolism, and variations in nutrient availability can have a significant impact on phytoplankton diversity (Smith et al., 1999). Therefore, understanding the interaction between these variables is critical for estimating phytoplankton communities in coastal ecosystems (Sin et al., 1999).
Several studies have been conducted along the east coast of India to examine the seasonal and spatial pattern of coastal waters and their impact on phytoplankton productivity (Naqvi et al., 1978; Satpathy et al., 2011; Sahu et al., 2012; Prakash et al., 2023). The nearshore and estuaries, which are impacted by both natural and anthropogenic disturbances (Jarvie et al., 1998), vary significantly depending on the local environmental setup, such as rainfall, amount of freshwater inflow, tidal incursion, and biological activities (Satpathy et al., 2011). The primary source of organic and inorganic variables (including nutrients) in the coastal ecosystem is wastewater discharges (Specchiulli et al., 2010). Previous studies have shown that such discharges can alter the dynamics of food webs in coastal environments (Nixon, 1995; Halpern et al., 2008). One of the key environmental parameters that reflect the turbidity of an eroding coastline or the introduction of suspended materials into coastal waters via land runoff is total suspended solids (TSS), which also affect the composition and abundance of the plankton community (Wu et al., 2011; Kumar et al., 2022).
Tamil Nadu (TN) has the third-longest coastline in India, comprising the Palk Bay (PB) and the Gulf of Mannar (GoM), which account for approximately 15% of the country’s total coastline (Pandey et al., 2022). Thousands of traditional fisherfolk in both GoM and PB rely on seagrass beds for their fishing and livelihood (Balasubramanian et al., 2011). Rainfall occurs in the TN region from late August (southwest monsoon) to early November (northeast monsoon). The average annual rainfall in TN is approximately 950 mm (IMD). The coastal waters of the PB resemble the Bay of Bengal in terms of low salinity and higher turbidity, whereas the coastal waters of the GoM exhibit a mixed character of both the Bay of Bengal and the Arabian Sea (Rao et al., 2008). The objectives of the present study were: 1) to investigate the spatial patterns of environmental variables; and 2) to investigate the spatial variations of the phytoplankton community and its response to changing environmental factors.
Materials and methods
Sampling was conducted at 84 stations in five coastal districts, namely Thanjavur (THA1 to THA10), Pudukottai (PUD1 to PUD10), Ramanathapuram (RAM1 to RAM9), Thoothukudi (THO1 to THO7), and Tirunelveli (TIR1 to TIR6), covering 537 km along the coastal waters of TN, on the southeast coast of India. A total of 84 samples were collected from 42 locations offshore (within 15 km from the shore) and nearshore (within 1 km from the shore) (Figure 1). Sample collection and analysis of physio-chemical and biological parameters were conducted from January to March 2020. Seawater samples were collected from the surface (~0.5 m) using a 5 L Niskin sampler for the analysis of dissolved oxygen (DO), biochemical oxygen demand (BOD), total suspended solids (TSS), nutrients, trace metals, chlorophyll-a (Chl-a), and phytoplankton. Air temperature (AT) was measured with a mercury thermometer (accuracy ±0.1°C). A calibrated portable multi-parameter water quality instrument (model HI 9829, Hanna) was used to measure sea surface temperature (SST), salinity, and pH. The DO and BOD were measured using the modified Winkler’s method of Carrit and Carpenter (1966). TSS was determined by filtering a known volume of seawater through pre-dried and pre-weighed filter paper (0.45 µm, Millipore GF/C) (APHA, 2012). Analysis of nutrients like ammonia (NH4+), nitrite (NO2¯), nitrate (NO3¯), phosphate (PO43¯), and silicate (SiO24¯) was performed using standard spectrophotometric techniques described by Grasshoff et al. (1999). The heavy metal analysis was carried out according to the US Environmental Protection Agency’s (USEPA, 2001) technique. A detailed methodology for heavy metal analysis was adopted by Jha et al. (2019). The standard method for spectrofluorometric analysis of Chl-a was followed (Parsons et al., 1984). For phytoplankton assessment, 1L of the surface seawater sample was collected and preserved with Lugol's iodine solution. Qualitative and quantitative analysis of phytoplankton was carried out using Utermöhl's (1958) method. The conventional taxonomic keys were used for the identification (Subrahmanyan, 1946, 1959; Tomas, 1997). The Shannon-Wiener diversity index (H’), Margalef species richness (d), and Pielou evenness (J’) of univariate measures were calculated using PRIMER-6 (PRIMER–E Ltd., Plymouth, UK). The linear relationship between phytoplankton abundance and environmental variables was assessed using Pearson correlation and multivariate regression analysis. A one-way ANOVA was performed using XLSTAT software to determine the significant variation in physicochemical parameters. The spatial pattern of environmental variables was examined using hierarchical agglomerative clustering with group average linkage using Euclidean distance in PRIMER-6. Factor analysis (FA) of environmental variables was performed using SPSS software (version 18.0), and the results were categorized as strong (> 0.75), moderate (0.75-0.50), and weak (0.50-0.30) factor loadings. The Kaiser-Meyer-Olkin (KMO) criterion was adopted for sample adequacy, and the parameters were standardized using a Z-scale transformation (mean = 0; variance = 1) before analysis to make the data dimensionless.
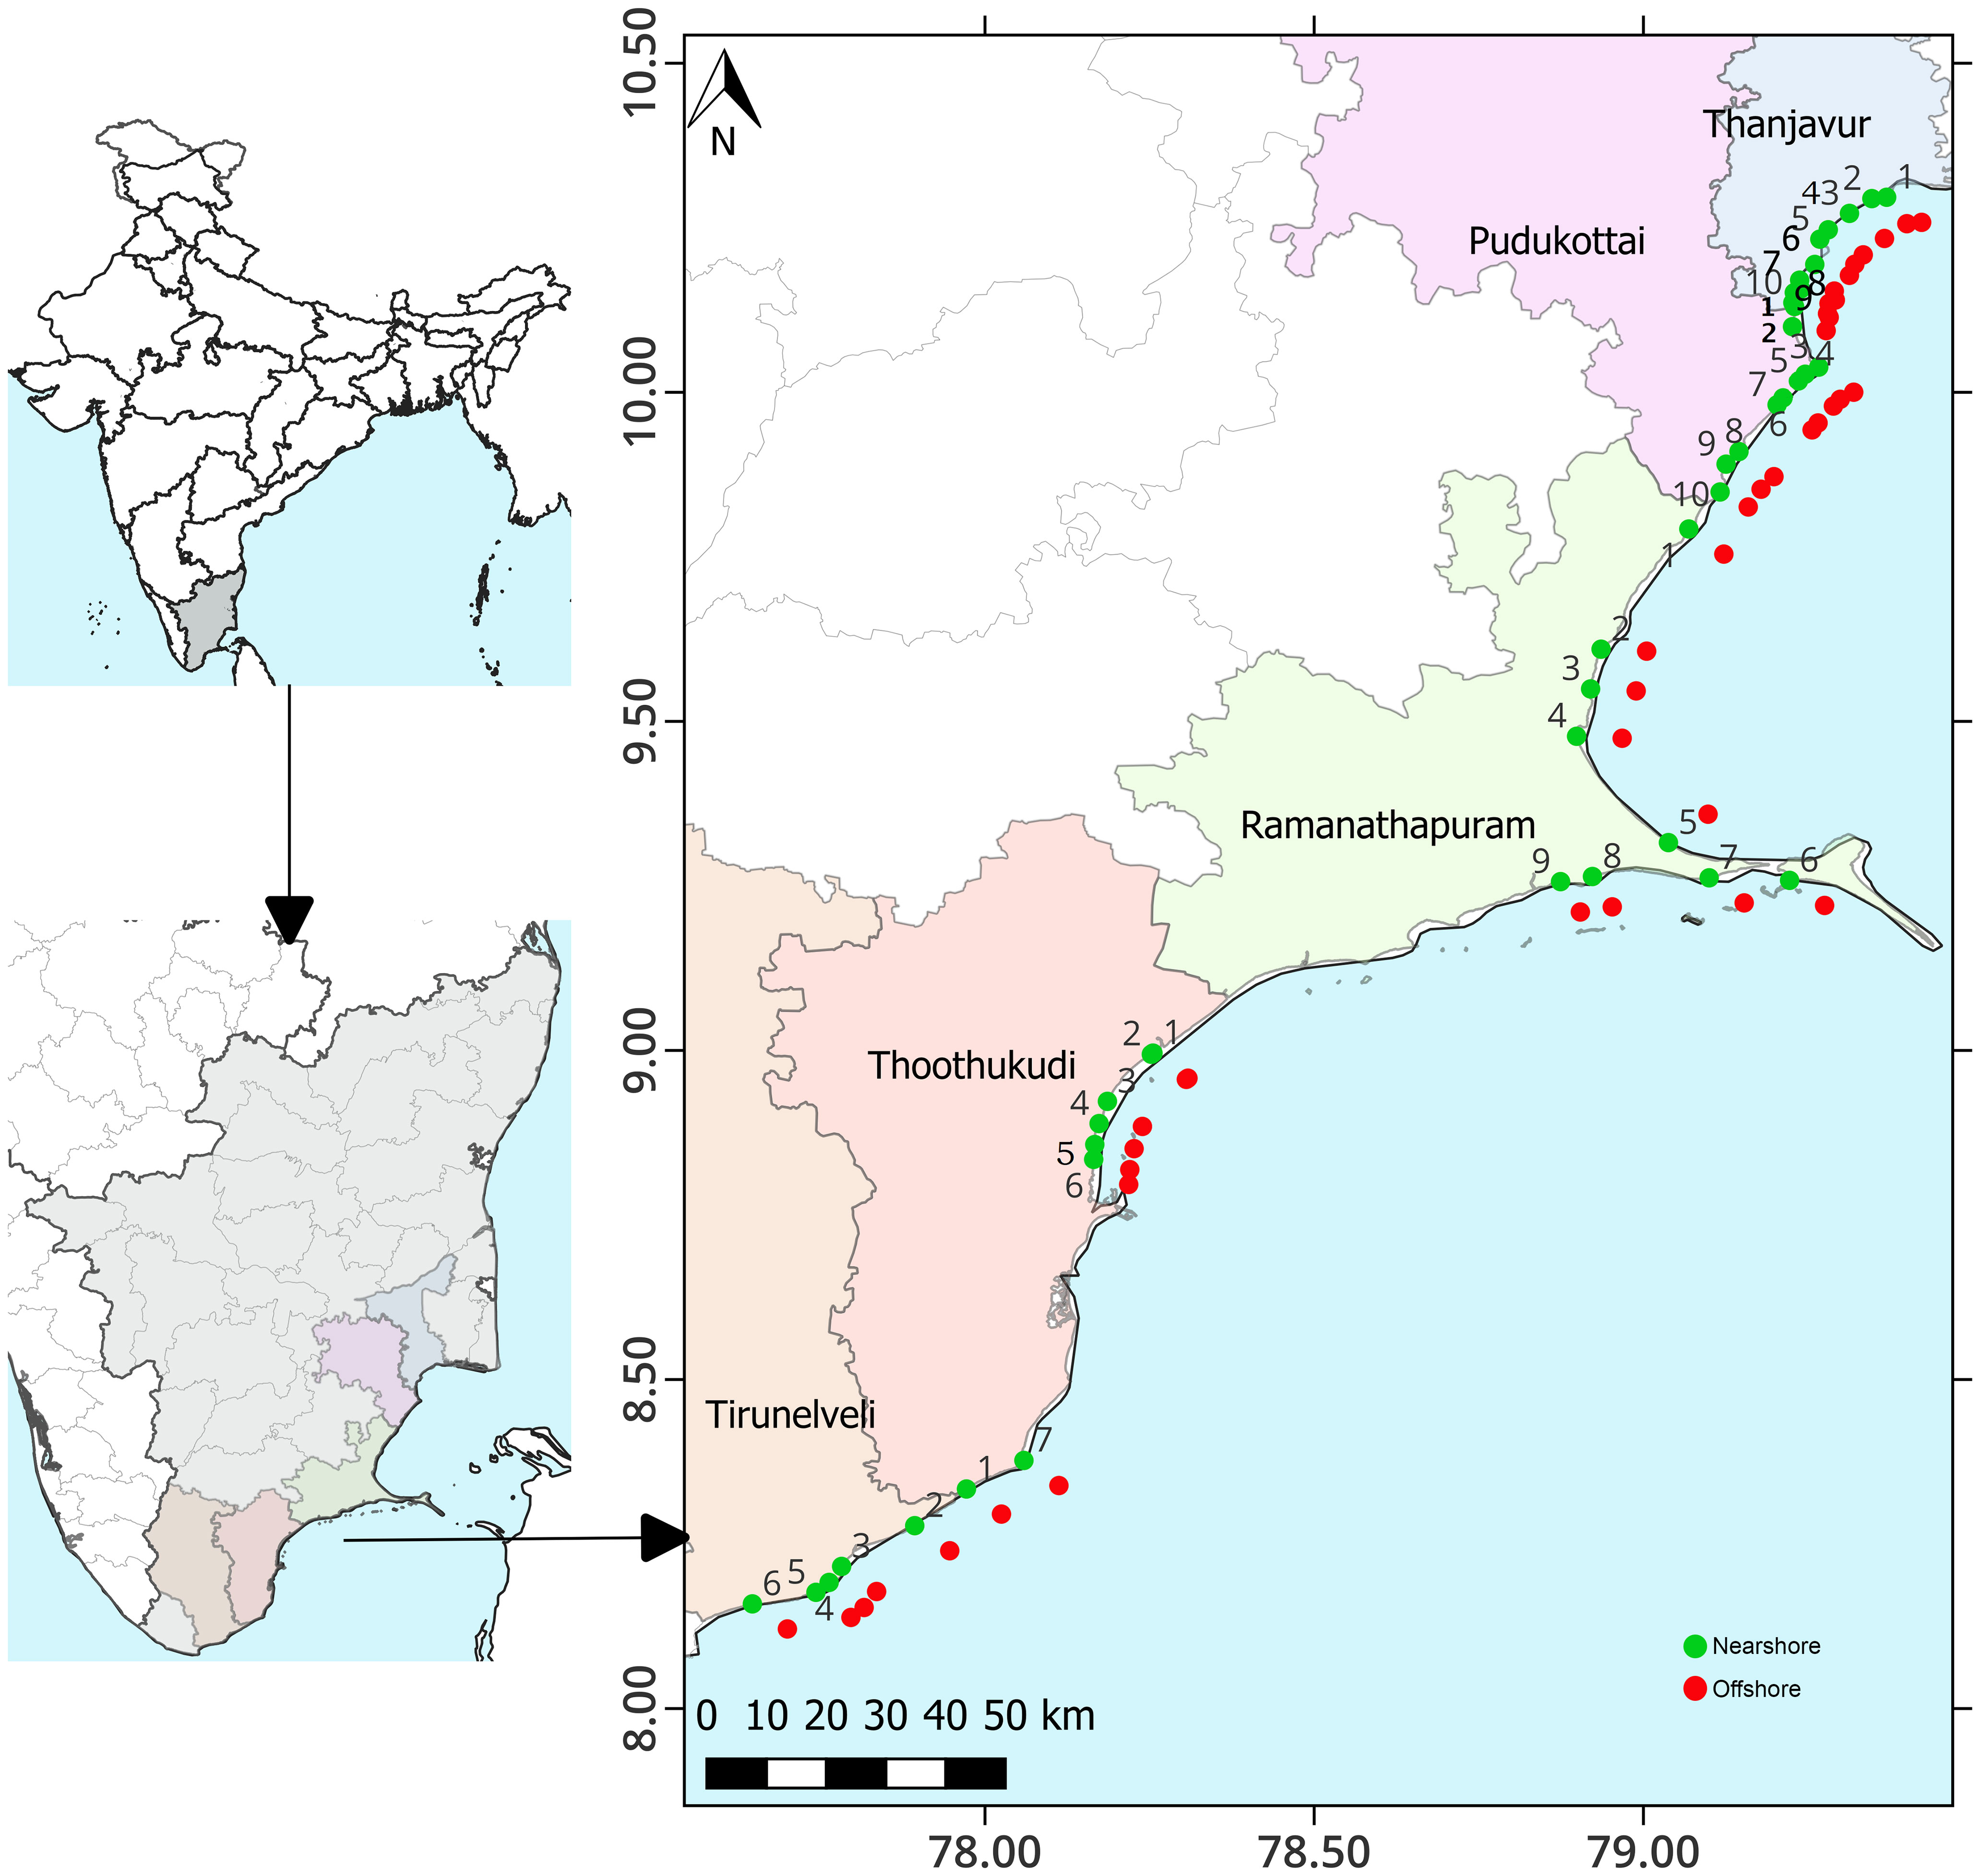
Figure 1 Map showing study locations along the coastal waters of Tamil Nadu on the southeast coast of India.
Results and discussion
Environmental parameters
The spatial variation of physicochemical parameters observed during the present study is shown in Figure 2. The SST ranged from 26.54 to 30.01°C, with the highest and lowest SST recorded at RAM (offshore) and THA (offshore) stations, respectively. The pH decreased from north to south, with a maximum (8.47) at PUD and a minimum (8.05) at the TIR region. Salinity ranged from 28.35 to 34.38 PSU, with higher and lower salinities observed offshore of RAM (RAM7) and PUD (PUD3), respectively. The mean salinity was higher (31.96 ± 1.42 PSU) at RAM. Compared to the nearshore, the offshore recorded optimal DO and TSS, which might be attributed to less disturbance in the water column leading to good transparency and productivity. The THA stations recorded lower DO and higher BOD, which could be attributed to organic influx from sewage discharge into the marine environment causing oxidative degradation by bacteria, resulting in high BOD and reduced DO (Sahu et al., 2013; Pandey and Ganesh, 2019). TSS showed a significant spatial variation (F=11.785, p < 0.01), which ranged from 15.8 to 67.8 mg/L, with a maximum recorded at the nearshore stations. Freshwater input from many perennial (Krishna, Godavari, and Mahanadi) and seasonal (Palar, Vellar, and Coleroon) rivers in the nearshore region could be attributed to the higher TSS (Shanthi et al., 2013). In addition, three minor rivers, Tamiraparani, Vembar, and Vaipar, drain into the GoM (Rao et al., 2008). Variations in dissolved nutrient levels between the nearshore and offshore of each district are shown in Figure 2. Most of the nutrients were recorded as comparatively high at the northern stations and low at the southern stations, which could be attributed to anthropogenic activities in the surrounding vicinity. Nutrients such as NO3−, PO43−, and SiO42− were low in the southern stations and increased toward the north, which could be due to anthropogenic activities such as untreated domestic sewage, industrial wastewater, and agricultural runoff (Xu et al., 2010; Kumar et al., 2018). SiO42− (18.95 ± 11.1 µM) and NH4+ (4.85 ± 1.9 µM) were found to be high at PUD and RAM nearshore stations, respectively, while NO3− (3.49 ± 0.4 µM) was found to be high at THA stations.
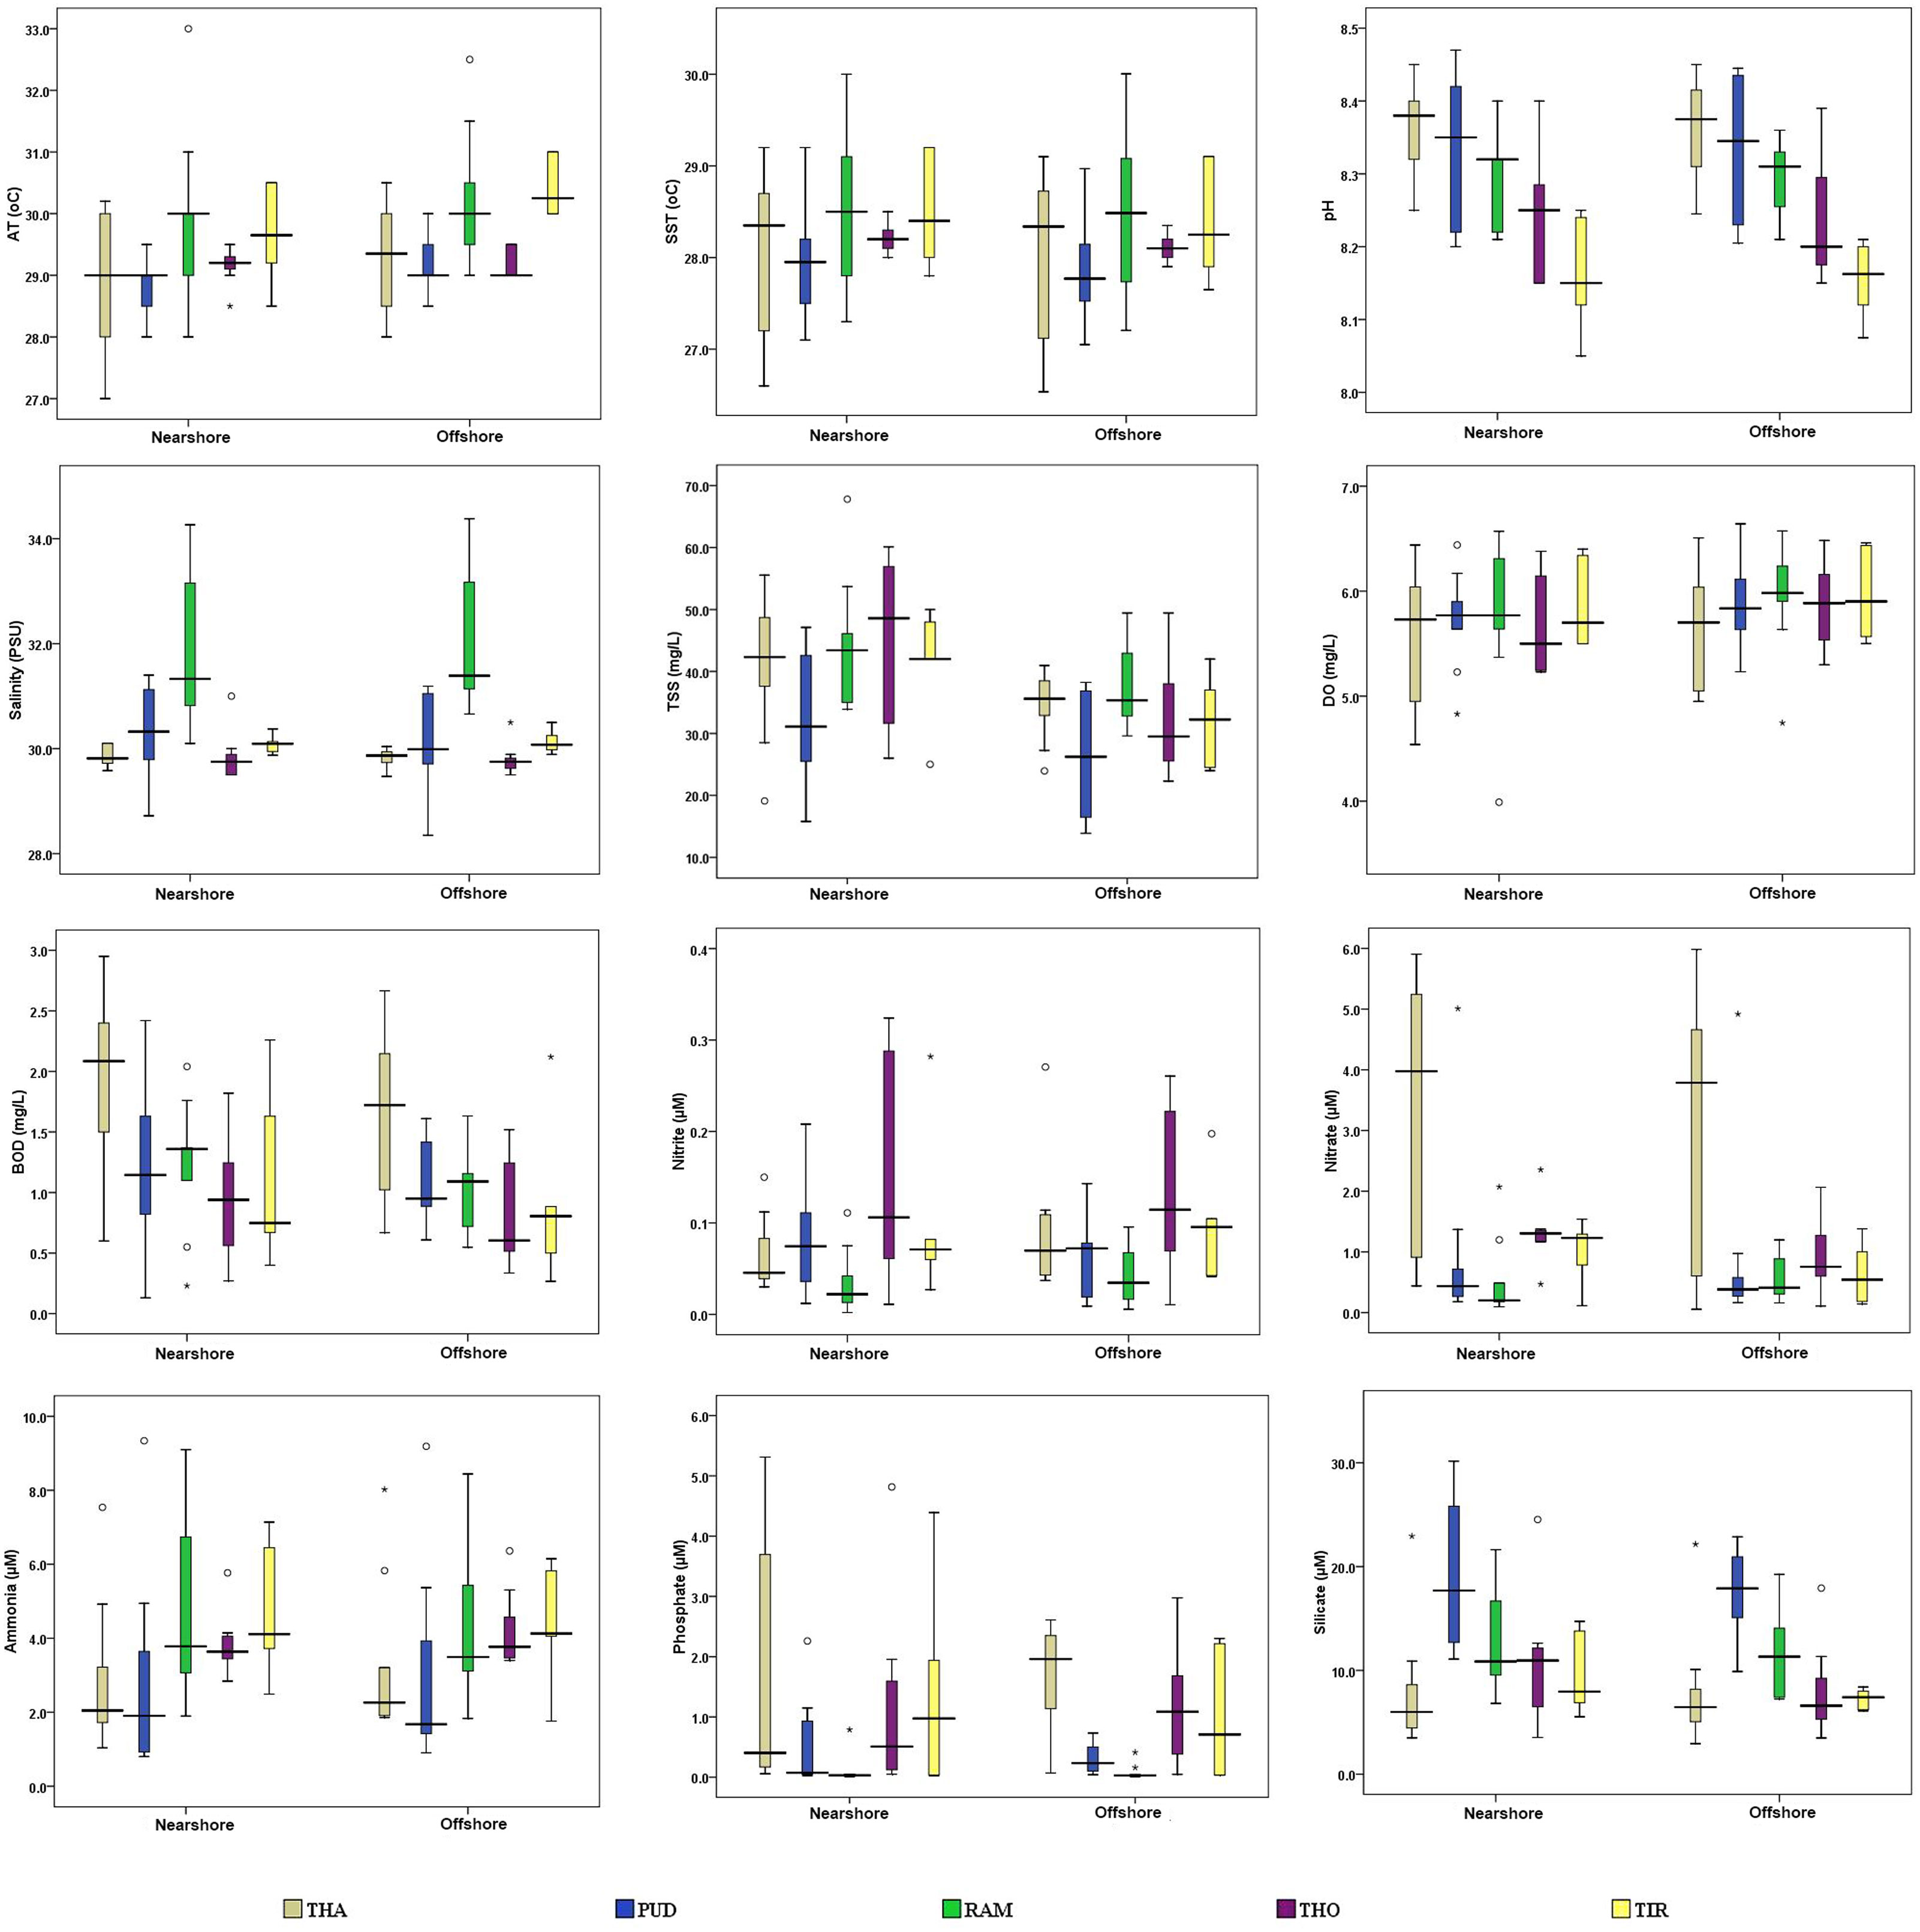
Figure 2 Spatial variations of physicochemical parameters along the coastal waters of Tamil Nadu on the southeast coast of India (* indicates extreme outliers, and ° indicates mild outliers). THA, Thanjavur district; PUD, Pudukottai district; RAM, Ramanathapuram district; THO, Tuthukudi district; TIR, Tirunelveli district.
In addition to the hydrographic parameters, 11 important heavy metals were also examined in the present study and are summarized in Table 1, with Cd and Hg being below the detection limit (BDL). The mean concentration of heavy metals were in the order of Al >Fe >Zn >Cu >Mn >Cr >Pb >Ni >Co. Al ranged from 14.4 to 420.3 ppb, with a maximum recorded at the THA station, which was above the permissible level (Conama, 2003). The concentrations of Fe (225.6 ppb) and Zn (67.2 ppb) were high at RAM. The concentrations of Cu (26.01 ppb) and Mn (12.5 ppb), which were found to be high in the PUD region, could be due to the usage of biocides attributed to anthropogenic activities (Anbuselvan et al., 2018). Ni (0.51 ppb) was high at THA stations, while Cr (1.52 ppb) was high at THO and PUD stations. Higher Ni concentrations at THA stations could increase phytoplankton production as Ni is essential for algal growth (Price and Morel, 1991). However, the recorded Fe and Ni concentrations were comparatively lower than in nearby coastal regions (Jha et al., 2019). During the present study, most of the metal concentrations were comparatively higher at northern stations. However, the lower concentration of metals like Fe at southern stations could be one of the reason for the lower phytoplankton abundance. Continuous monitoring could help regulate coastal water quality and thus support the fishing industry. Additionally, metal analysis can help identify the sources of contamination and prevent further pollution of the marine ecosystem.
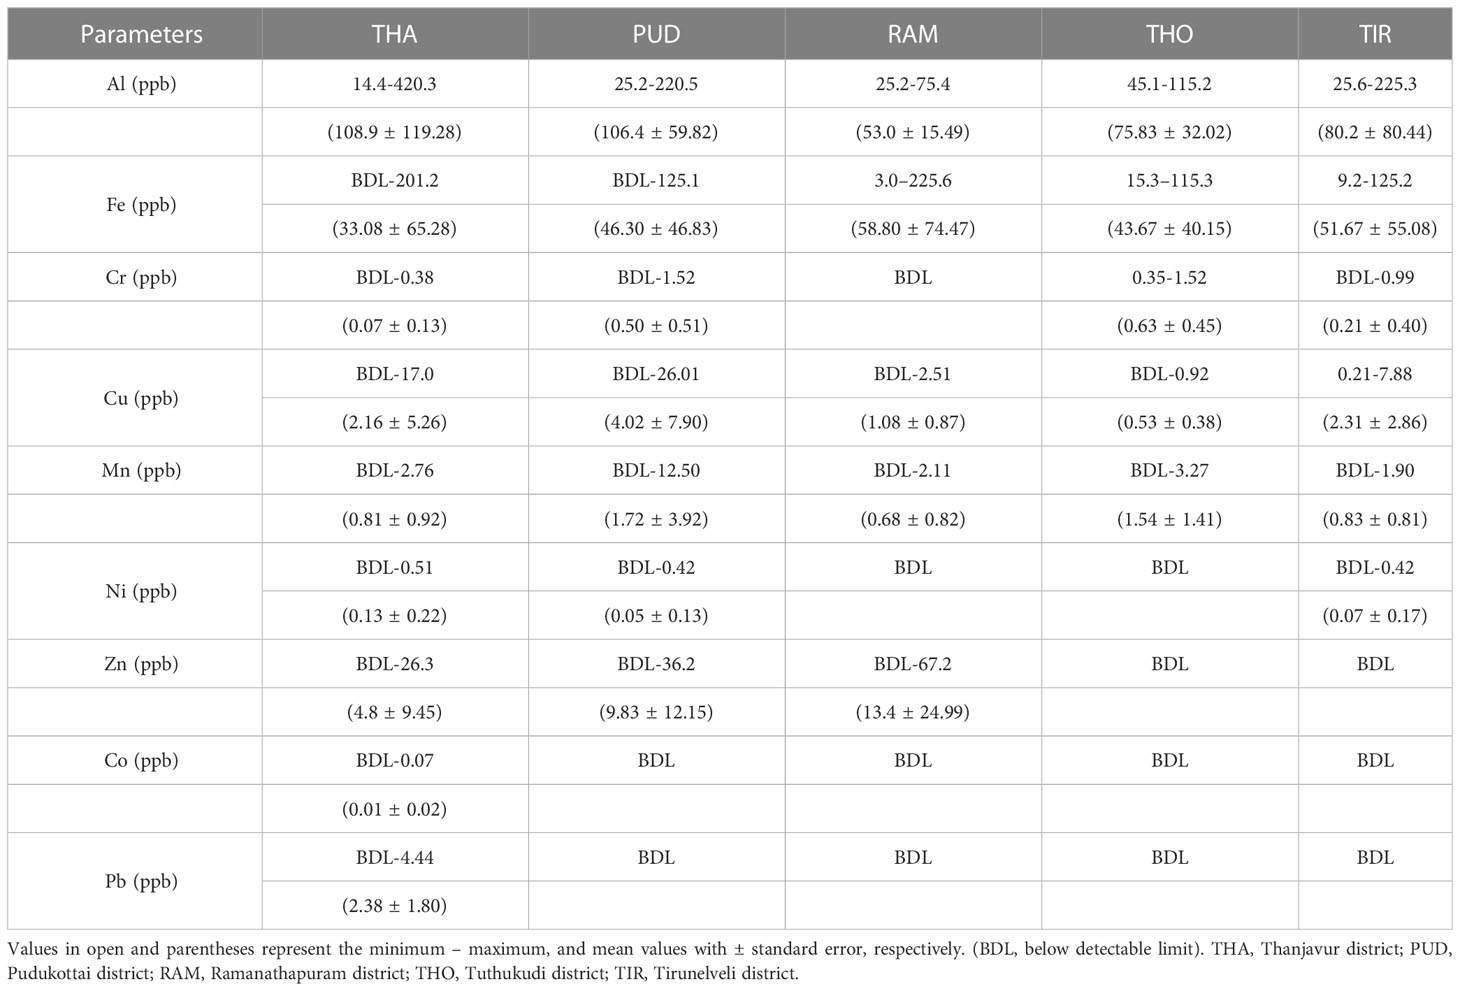
Table 1 Spatial variation of trace metal concentrations in the coastal waters of Tamil Nadu on the southwest Bay of Bengal.
Cluster analysis was used to assess the relationship of physicochemical parameters among the five coastal districts, and the study revealed two statistically significant clusters (Figure 3A). In the present study, lower activities such as industrial and pesticides use might have contributed fewer contaminants and nutrients in PUD, RAM, and TIR districts, thus forming cluster 1. Wherein RAM and TIR districts formed clusters with less distance could be attributed to similar sea water quality with lower nutrient and anthropogenic activity, which resulted these two districts as undisturbed (Pandey et al., 2022). Higher concentrations of NO3−and PO43− could be the reason for the formation of cluster 2 between THO and THA. This could be attributed to higher domestic sewage, solid waste disposal, industries, agriculture, and aquaculture activities around the coastal districts. The results are similar to earlier observations that indicated a higher concentration of NO3−and PO43− in THO due to domestic and industrial waste through anthropogenic runoff (Muthukumar et al., 2022).
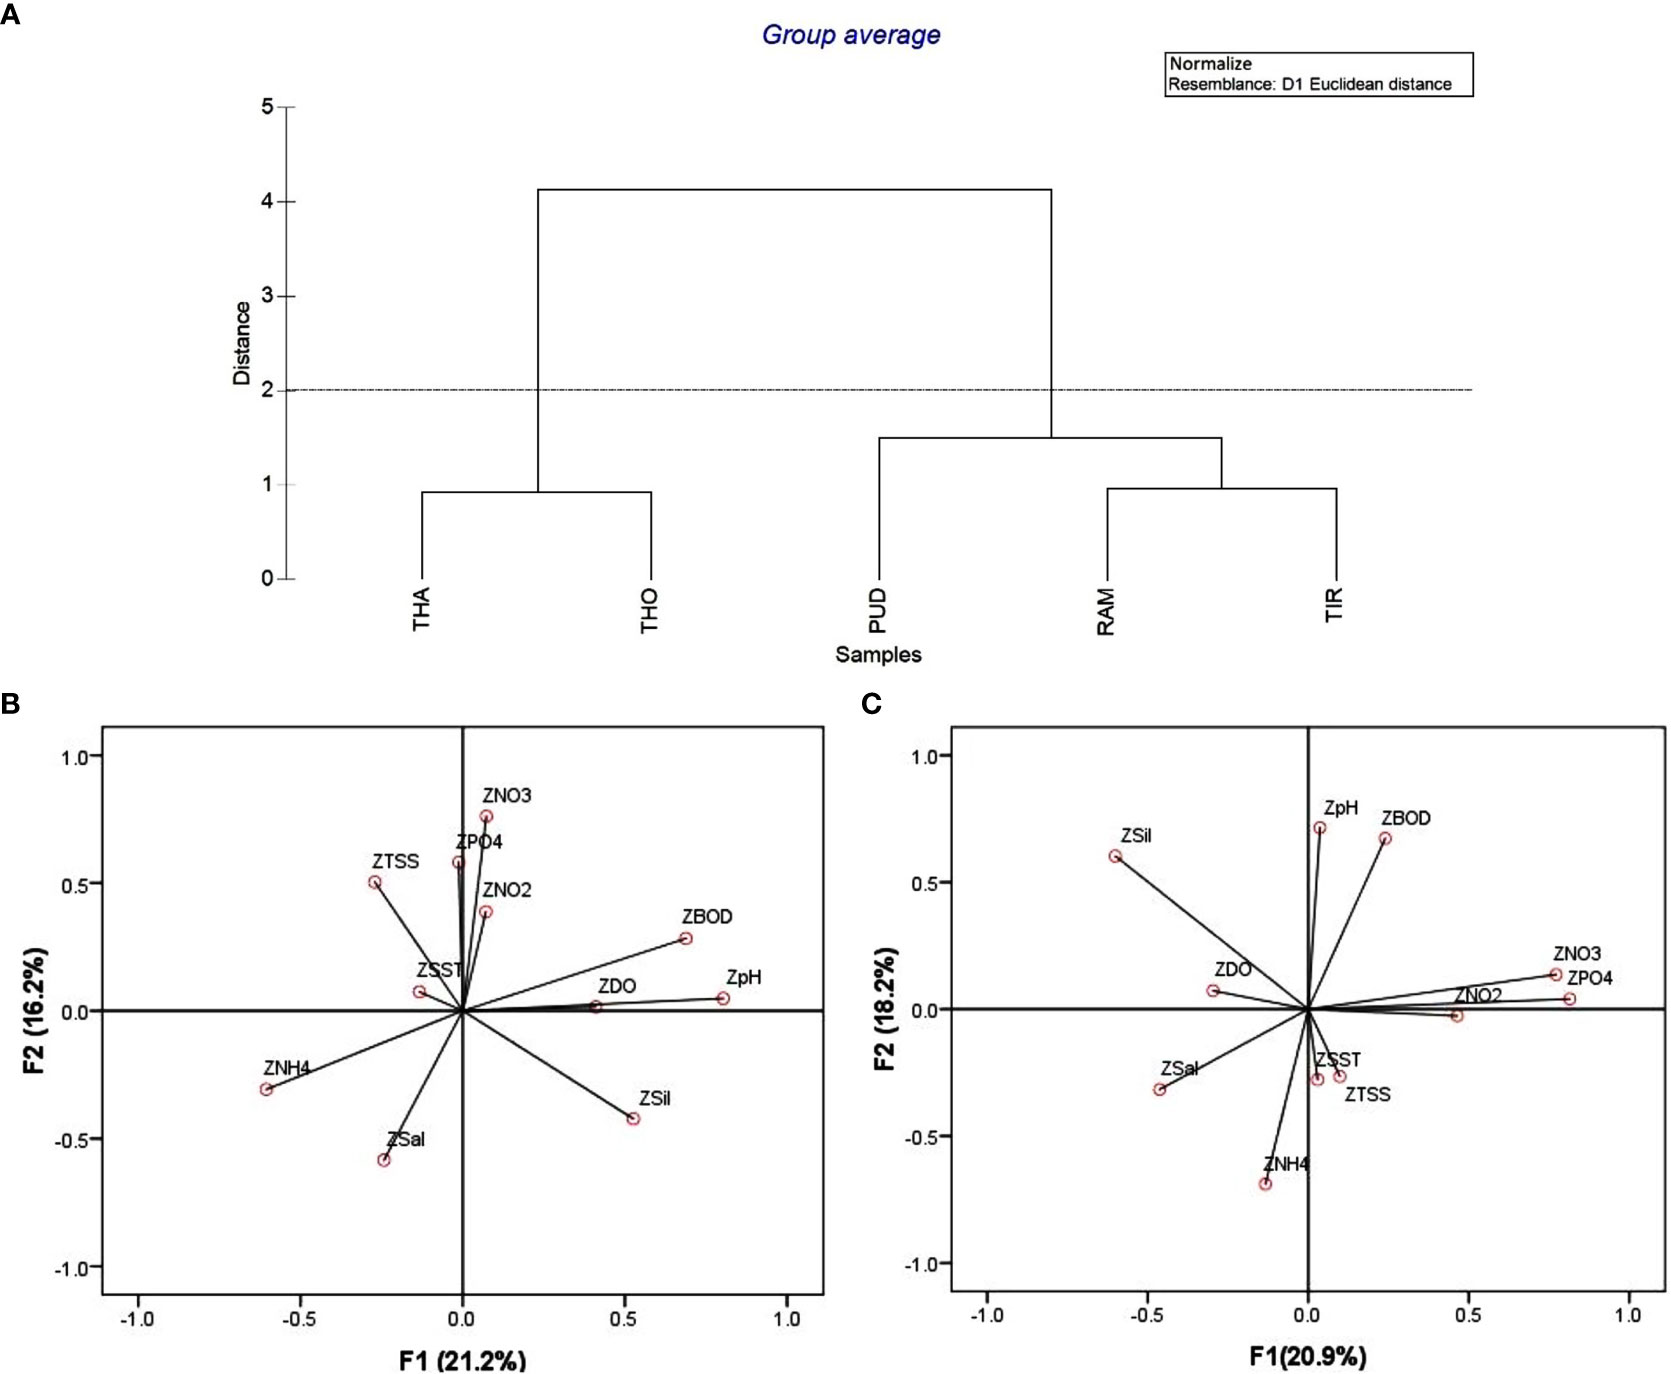
Figure 3 (A) Cluster analysis of physicochemical parameters, (B) Factor analysis of water quality parameters at nearshore, and (C) offshore locations. THA, Thanjavur district; PUD, Pudukottai district; RAM, Ramanathapuram district; THO, Tuthukudi district; TIR, Tirunelveli district.
KMO values were used to assess the sampling efficiency, which revealed variance significance. For the nearshore (Figure 3B) data, the KMO was 0.52, indicating that FA can significantly reduce the dimensionality of the original dataset (Wu et al., 2010). Four factors (eigenvalue >1) identified by factor analysis explained 62.5% of the overall variation in the dataset, but the first two factors were selected for detailed discussion (Table S1; Supplementary Material). Factor 1 showed strong positive loadings of BOD (0.85) and pH (0.84) with a 21.2% variance. In factor 2, moderate positive loadings of PO43¯ (0.64), NO2¯ (0.59), and moderate negative loadings of salinity (-0.71) and NH4+ (-0.53) were observed, accounting for 16.2% of the total variation. This could be attributed to higher nutrient loading in the nearshore area due to river inflow (Zhou et al., 2007; Sahu et al., 2013). The offshore area (Figure 3C) indicated a significant reduction of the original dataset with 0.565 KMO, and FA explained 65.2% of the total variance with four factors (>1 eigenvalue). Factors 1 and 2 explained 20.9% and 18.2% of the total variance, respectively. Factor 1 showed strong positive loadings of NO3¯(0.78), PO43¯(0.75), and moderate negative loading of SiO24¯ (-0.73). On the other hand, factor 2 showed strong and moderate positive loadings of pH (0.81) and BOD (0.68), respectively. Nevertheless, a similar hydrographic condition was observed in the nearshore and offshore areas. However, TSS and nutrients were comparatively high at the nearshore, which could be due to the anthropogenic input from land runoff (Iscen et al., 2008). The FA analysis revealed a significant correlation matrix between different environmental parameters and their influence on phytoplankton density and diversity.
Spatial variation of phytoplankton diversity, distribution, and biomass
Phytoplankton biomass (Chl-a) ranged from 0.03 to 0.5 mgm-3 (Table S2; Supplementary Material). The mean Chl-a concentration was higher in TIR (0.30 ± 0.03 mgm-3) and lower in RAM (0.15 ± 0.02 mgm-3). A similar trend was observed for pheophytin concentrations, which ranged from 0.05 to 0.60 mgm-3. However, nearshore stations showed comparatively higher biomass than offshore stations, which could be attributed to higher nutrient loading from land runoff. During the present study, 85 phytoplankton species were recorded, such as diatoms (64), dinoflagellates (18), silicoflagellates (1), and cyanophyceae (2). A detailed list of phytoplankton recorded in the present study is shown in Table S3 (Supplementary Material). As with Chl-a, phytoplankton abundance was comparatively higher in the nearshore than the offshore stations due to the nutrient input from the land. Phytoplankton densities ranged from 0.7 to 210×103cells L-1, with lower and higher densities observed in the THA at offshore (Stn-8) and nearshore (Stn-2) stations, respectively. The mean phytoplankton density was observed as being maximum at THA (59.8 ± 16.2×10³cells L-1) and decreasing abruptly toward the southern stations, with the lowest density at THO (6.3 ± 1.4×10³cells L-1). Although THO receives more nutrients from the land runoff, the phytoplankton biomass and abundance were low. This could be due to changes in the hydrographic features, such as a decrease in salinity, pH and an increase in turbidity due to the inflow of freshwater (Bharathi et al., 2018). THA alone contributed 60% of the total phytoplankton abundance, which was ~6 times higher than the other coastal stations in TN. This could be attributed to higher nutrient concentrations at THA, resulting in higher phytoplankton abundance. The phytoplankton community was dominated by diatoms (75.2%), followed by cyanophyceae (17.4%), and dinoflagellates (7.3%). Among the diatoms, pennate diatoms contributed 66% and centric diatoms contributed 34%. The dominance of pennate diatoms could lead to higher fouling rates (Mitbavkar and Anil, 2008). During the present study, seven species dominated the phytoplankton community, i.e., Pseudo-nitzschia sp., Cylindrotheca closterium, Chaetoceros diversus, Cyanobacteria sp. 1 in nearshore stations and Rhizosolenia styliformis, Pleurosigma sp. 1, Rhizosolenia sp. 2 in offshore stations. Most of the species belonged to the pennate diatoms at many stations.
The Shannon-Wiener diversity index (H’) ranged from 0.16 to 2.50 (Table S2). The mean high diversity was observed in TIR (1.99 ± 0.13), followed by RAM (1.80 ± 0.08), and lower in THA (1.43 ± 0.17). Phytoplankton taxa ranged from 4 to 18 at nearshore stations and from 2 to 26 at offshore stations. Optimal hydrographic conditions may have supported the higher phytoplankton taxa at RAM and TIR, while anthropogenic disturbance may have reduced the taxa at THO stations. Maximum phytoplankton abundance and minimum species diversity & evenness were observed at THA, which could be attributed to the dominance of one phytoplankton species (Pseudo-nitzschia sp.) as reported previously (Sahu et al., 2012; Kumar et al., 2018). Species richness and evenness ranged from 0.11 to 2.49 and 0.07 to 1.0, respectively, in the present study. Higher diversity, richness, and evenness were recorded at the TIR stations, where the maximum number of phytoplankton taxa (26) was also recorded. In contrast, lower phytoplankton species richness and diversity were recorded in the THO region, both nearshore and offshore, due to intense anthropogenic activities such as power plants, ports, and various other industrial activities (Bharathi et al., 2018; Jha et al., 2022a).
Influence of hydrographic parameters on phytoplankton communities
Pearson correlation was used to identify the significant relationships between phytoplankton and hydrographic factors. In offshore stations, phytoplankton density was positively correlated with NO3− (r = 0.67, P< 0.05), followed by PO43−(r = 0.51, P< 0.05), pH (r = 0.32, P< 0.05) and negatively correlated with SiO42−(r = - 0.27, P< 0.05). A similar result was also observed through multivariate regression analysis, which revealed a positive correlation of NO3− with phytoplankton (r2 = 0.18, P< 0.05) and pennate diatoms (r2 = 0.33, P< 0.05). The Chl-a biomass was positively and negatively correlated with NO2−(r = 0.22, P < 0.05), and salinity (r = - 0.31, P< 0.05), respectively. In the nearshore, phytoplankton showed the positive and negative correlation with NO3−(r = 0.36, P< 0.05) and SiO42−(r = - 0.24, P< 0.05). Compared to the offshore, NO3−and SiO42− were comparatively high in the nearshore, which might be due to the nutrient input from land runoff (Zhou et al., 2008). However, the low nutrient concentration leads to low phytoplankton abundance under natural oceanic conditions, which was evident in the present study except for THA stations. At the same time, increased TSS concentrations in the southern stations may also be one of the reasons for the lower phytoplankton productivity. Previous studies also indicated that increasing TSS as a primary limiting factor by reducing light penetration resulted in lower phytoplankton abundance (Yuvaraj et al., 2018; Kumar et al., 2022). It is understood that NO3− was the main factor that influenced the phytoplankton especially the pennate diatoms in the present study. The ability of diatoms to quickly absorb and store NO3− resulted in rapid growth (Cermeno et al., 2011), which could support fisheries by implementing artificial reefs. One earlier study also revealed the importance of fisheries production by maintaining good water quality, productivity and through the deployment of artificial reefs (Jha et al., 2022b).
Conclusion
The present study revealed that Ramanathapuram is an undisturbed coastal area due to fewer anthropogenic activities in the surrounding area. On the other hand, increased anthropogenic activities resulted in lower phytoplankton productivity in the Thoothukudi district. Increased TSS levels limited phytoplankton productivity in the southern stations. The present investigation revealed that the northern stations were found to be dominated by pennate diatoms due to higher NO3¯ concentrations. Comparatively higher metal concentrations in the northern stations could be attributed to anthropogenic discharges, which could pose a threat to fish and other seafood products if left unregulated. As these areas are highly dependent on the fishing industry, continuous monitoring will help identify the source of contamination and may promote the adoption of mitigation measures.
Data availability statement
The original contributions presented in the study are included in the article/Supplementary Material. Further inquiries can be directed to the corresponding author.
Author contributions
PSK: Conceptualization, sample collection, laboratory analysis, data processing, and writing-original manuscript. GD: Reviewing the manuscript, suggestion, and project administration, JS: Data validation, and manuscript review. DKJ: Data validation, and manuscript review. VP: Field investigation. SV: Field investigation. JPPJ: Reviewing the manuscript, suggestion. CM: Analysis of nutrient samples and data processing. RAJ: Data validation, suggestion, and manuscript review. All authors contributed to the article and approved the submitted version.
Acknowledgments
The authors are grateful to the Ministry of Earth Sciences, Government of India, for funding the present study. We are grateful to Dr. G. A. Ramadass, Director, NIOT, Chennai, for his continuous encouragement, support, and guidance. We would also like to thank the scientific and support staff of NIOT and NCCR for their field and laboratory assistance throughout the course of this study. Finally, we are thankful to our colleagues, Mr. S. Ragumaran, Mr. B. Ranjan Babu, and Mr. G. Nanadhagopal, for their kind support during the fieldwork.
Conflict of interest
The authors declare that the research was conducted in the absence of any commercial or financial relationships that could be construed as a potential conflict of interest.
The reviewer JE declared a shared affiliation with the author MC to the handling editor at the time of review.
Publisher’s note
All claims expressed in this article are solely those of the authors and do not necessarily represent those of their affiliated organizations, or those of the publisher, the editors and the reviewers. Any product that may be evaluated in this article, or claim that may be made by its manufacturer, is not guaranteed or endorsed by the publisher.
Supplementary material
The Supplementary Material for this article can be found online at: https://www.frontiersin.org/articles/10.3389/fmars.2023.1215627/full#supplementary-material
References
Ananthan G., Sampathkumar P., Soundarapandian P., Kannan L. (2004). Observations on environmental characteristics of Ariyankuppam estuary and Verampattinam coast of Pondicherry. J. Aqua. Biol. 19, 67–72.
Anbuselvan N., Senthil Nathan D., Sridharan M. (2018). Heavy metal assessment in surface sediments off Coromandel Coast of India: implication on marine pollution. Mar. pollut. Bull. 131, 712–726. doi: 10.1016/j.marpolbul.2018.04.074
APHA (2012). “Standard methods for the examination of water and wastewater,” in Total Suspended Solids Dried at 103–105, 22nd edition (Washington, DC: APHA), 2–56.
Balasubramanian T., Anantharaman P., Thangaradjou T. (2011). “Seagrass productivity and mapping in the Gulf of Mannar Biosphere Reserve,” in Compendium of Research Findings on Biodiversity Conservation and Sustainable Use in the Gulf of Mannar Bioshere Reserve, Gulf of Mannar Biosphere Reserve Trust (Ramnathapuram, India:Science Outreach Series), 1, 18–40.
Bharathi M. D., Patra S., Sundaramoorthy S., Madeswaran P., Chandrasekar D., Sundaramanickam A. (2018). Seasonal variability in plankton food web composition in Tuticorin coastal waters, South east coast of India. Mar. pollut. Bull. 137, 408–417. doi: 10.1016/j.marpolbul.2018.10.042
Carrit D. E., Carpenter J. H. (1966). Recommendation procedure for Winkler analyses of sea water for dissolved oxygen. J. Plankton Res. 24, 313–318.
Cermeno P., Lee J. B., Wyman K., Schofield O., Falkowski P. G. (2011). Competitive dynamics in two species of marine phytoplankton under non-equilibrium conditions. Mar. Ecol. Prog. Ser. 429, 19–28. doi: 10.3354/meps09088
Conama (2003). Proyecto def initivo de normas de calidad primaria para la protección de las aguas marinas (Comisión Nacional de Medioambiente, Santiago, Chile), 20.
Dayala V. T., Salas P. M., Sujatha C. H. (2014). Spatial and seasonal variations of phytoplankton species and their relationship to physicochemical variables in the Cochin estuarine waters, Southwest Coast of India. Ind. J. Mar. Sci. 43, 937–947.
Grasshoff K., Kremling K., Ehrhardt M. (1999). Methods of seawater analysis -chapter 10- nutrients. Methods Seawater Anal., 159–228. doi: 10.1002/9783527613984
Halpern B. S., Walbridge S., Selkoe K. A., Kappel C. V., Micheli F., d'Agrosa C., et al. (2008). A global map of human impact on marine ecosystems. science 319 (5865), 948–952.
Iscen C. F., Emiroglu O., Ilhan S., Arslan N., Yilmaz V., Ahiska S. (2008). Application of multivariate statistical techniques in the assessment of surface water quality in Uluabat Lake, Turkey. Environ. Monit. Assess. 144, 269–276. doi: 10.1007/s10661-007-9989-3
Jarvie H. P., Whitton B. A., Neal C. (1998). Nitrogen and phosphorus in east coast Britishrivers: speciation, sources and biological significance. Sci. Total Environ. 210–211, 79–109. doi: 10.1016/S0048-9697(98)00109-0
Jha D. K., Pandey V., Muthukumar C., Sathish Kumar P., Venkatnarayanan S., Jebakumar J. P. P., et al. (2022a). Investigation of coastal water characteristics along the Southeast Coast of India: A multivariate approach. Front. Mar. Sci. 9, 269. doi: 10.3389/fmars.2022.945495
Jha D. K., Pandey V., Santhanakumar J., Sathish Kumar P., Venkatnarayanan S., Jebakumar J., et al. (2022b). Evaluation of site suitability for artificial reefs deployment in southeast coast of India using geographical information system as a management tool. Front. Mar. Sci. 8, 2028. doi: 10.3389/fmars.2021.817975
Jha D. K., Ratnam K., Rajaguru S., Dharani G., Devi M. P., Kirubagaran R. (2019). Evaluation of trace metals in seawater, sediments, and bivalves of Nellore, Southeast coast of India, by using multivariate and ecological tool. Mar. pollut. Bull. 146, 1–10. doi: 10.1016/j.marpolbul.2019.05.044
Kumar P. S., Kumaraswami M., Rao G. D., Ezhilarasan P., Sivasankar R., Rao V. R., et al. (2018). Influence of nutrient fluxes on phytoplankton community and harmful algal blooms along the coastal waters of Southeastern Arabian Sea. Cont. Shelf Res. 161, 20–28. doi: 10.1016/j.csr.2018.04.012
Kumar P. S., Venkatnarayanan S., Pandey V., Ratnam K., Jha D. K., Rajaguru S., et al. (2022). Multivariate approach to evaluate the factors controlling the phytoplankton abundance and diversity along the coastal waters of Diu, Northeastern Arabian Sea. Oceanologia 64 (2), 267–275. doi: 10.1016/j.oceano.2021.11.005
Larson C. A., Belovsky G. E. (2013). Salinity and nutrients influence species richness and evenness of phytoplankton communities in microcosm experiments from Great Salt Lake, Utah, USA. J. Plankton Res. 35 (5), 1154–1166. doi: 10.1093/plankt/fbt053
Marcarelli A. M., Wurtsbaugh W. A., Griset O. (2006). Salinity controls phytoplankton response to nutrient enrichment in the Great Salt Lake, Utah, USA. Can. J. Fish. Aquat 63 (10), 2236–2248. doi: 10.1139/f06-113
Mitbavkar S., Anil A. C. (2008). Seasonal variations in the fouling diatom community structure from a monsoon influenced tropical estuary. Biofouling 24 (6), 415–426. doi: 10.1080/08927010802340317
Muthukumar C., Balasubramaniyan S., Garlapati D., Bharathi M. D., Kumar B. C., James R. A., et al. (2022). Impact of untreated sewage and thermal effluent discharges on the air-sea CO2 fluxes in a highly urbanized tropical coastal region. Mar. pollut. Bull. 175, 113166. doi: 10.1016/j.marpolbul.2021.113166
Naqvi S. W. A., De Souza S. N., Reddy C. V. G. (1978). Relationship between nutrients and dissolved oxygen with special references to water masses in western Bay of Bengal. Ind. J. Mar. Sci. 7, 15–17.
Nixon S. W. (1995). Coastal marine eutrophication: A definition, social causes, and future concerns. Ophelia 41, 199–219. doi: 10.1080/00785236.1995.10422044
Pandey V., Ganesh T. (2019). Spatial and temporal variability of sandy intertidal macrobenthic communities and their relationship with environmental factors in a tropical island. Estuar. Coast. Shelf Sci. 224, 73–83. doi: 10.1016/j.ecss.2019.04.045
Pandey V., Jha D. K., Kumar P. S., Santhanakumar J., Venkatnarayanan S., Jebakumar J. P. P., et al. (2022). Effect of multiple stressors on the functional traits of sub-tidal macrobenthic fauna: A case study of the southeast coast of India. Mar. pollut. Bull. 175, 113355. doi: 10.1016/j.marpolbul.2022.113355
Parsons T. R., Maita Y., Lalli C. M. (1984). A manual of chemical and biological methods for seawater analysis. Pergamon Press, Oxford 173 pp.
Prakash D., Tiwary C. B., Kumar R. (2023). Ecosystem variability along the estuarine salinity gradient: A case study of hooghly river estuary, West Bengal, India. J. Mar. Sci. 11 (1), 88. doi: 10.3390/jmse11010088
Price N. M., Morel F. M. M. (1991). Co-limitation of phytoplankton growth by nickel and ni- trogen. Limnol. Oceanogr. 36, 1071–1077. doi: 10.4319/lo.1991.36.6.1071
Rao S. D. V., Rao S. K., Iyer C. S. P., Chittibabu P. (2008). Possible ecological consequences from the Sethu Samudram Canal Project, India. Mar. pollut. Bull. 56, 170–186. doi: 10.1016/j.marpolbul.2007.10.018
Sahu B. K., Begum M., Khadanga M. K., Jha D. K., Vinithkumar N. V., Kirubagaran R. (2013). Evaluation of significant sources influencing the variation of physico chemical parameters in Port Blair Bay, South Andaman, India by using multivariate statistics. Mar. pollut. Bull. 66, 246–251. doi: 10.1016/j.marpolbul.2012.09.021
Sahu G., Satpathy K. K., Mohanty A. K., Sarkar S. K. (2012). Variations in community structure of phytoplankton in relation to physicochemical properties of coastal waters, Southeast Coast of India. Indian J. Mar. Sci. 41, 223–241.
Satpathy K. K., Mohanty A. K., Sahu G., Sarguru S., Sarkar S. K., Natesan U. (2011). Spatio-temporal variation in physico-chemical properties of coastal waters off Kalpakkam, Southeast Coast of India, during summer, pre-monsoon and post-monsoon period. Environ. Monit. Assess. 180, 41–62. doi: 10.1007/s10661-010-1771-2
Shanthi R., Poornima D., Raja S., Sethubathi G. V., Thangaradjou T., Balasubramanian T., et al. (2013). Validation of OCM-2 sensor performance in retrieving chlorophyll and TSM along the Southwest Bay of Bengal coast. J. Earth Syst. Sci. 122, 479–489. doi: 10.1007/s12040-013-0286-y
Sin Y., Wetzel R. L., Anderson I. C. (1999). Spatial and temporal characteristics of nutrient and phytoplankton dynamics in the York River estuary, Virginia: analyses of long-term data. Estuaries 22, 260–275. doi: 10.2307/1352982
Smith V. H., Tilman G. D., Nekola J. C. (1999). Eutrophication: impacts of excess nutrient inputs on freshwater, marine, and terrestrial ecosystems. Environ. pollut. 100 (1-3), 179–196. doi: 10.1016/S0269-7491(99)00091-3
Specchiulli A., Scirocco T., Cilenti L., Florios M., Renzi M., Breber P. (2010). Spatial and temporal variations of nutrients and chlorophyll a in a Mediterranean coastal lagoon: Varano Lagoon, Italy. Transit. Water Bull. 2, 49–62.
Subrahmanyan R. (1946). A systematic account of the marine plankton diatoms of the Madras coast. Proc. Indian Acad. Sci. 24, 85-197.
Subrahmanyan R. (1959). Studies on the phytoplankton of the west coast of India. parts I and II. Proc. Indian Acad. Sci. 50B, 113-187.
Tas B., Gonulol A. (2007). An ecologic and taxonomic study on phytoplankton of a shallow lake, Turkey. J. Environ. Biol. 28, 439.
Trombetta T., Vidussi F., Mas S., Parin D., Simier M., Mostajir B. (2019). Water temperature drives phytoplankton blooms in coastal waters. PLoS One 14 (4), e0214933. doi: 10.1371/journal.pone.0214933
USEPA (2001). Methods for Collection, Storage and Manipulation of Sediments for Chemical and Toxicological Analyses: Technical Manual. EPA-823-B-01-002 (Washington, DC: Office of Water).
Utermöhl H. (1958). Zur vervollkommnung der quantitativen phytoplankton Methodik. Mitt. int. Ver. ther. angew. Limnol. 9, 1–38.
Wu N., Schmalz B., Fohrer N. (2011). Distribution of phytoplankton in a German lowland river in relation to environmental factors. J. Plankton Res. 33 (5), 807–820. doi: 10.1093/plankt/fbq139
Wu M. L., Wang Y. S., Sun C. C., Wang H., Dong J. D., Yin J. P., et al. (2010). Identification of coastal water quality by statistical analysis methods in Daya Bay, South China Sea. Mar. pollut. Bull. 60, 852–860. doi: 10.1016/j.marpolbul.2010.01.007
Xu H., Paerl H. W., Qin B., Zhu G., Gao G. (2010). Nitrogen and phosphorus inputs control phytoplankton growth in Eutrophic Lake. Limno. Oceanogr. 55, 420e432. doi: 10.4319/lo.2010.55.1.0420
Yuvaraj P., Satheeswaran T., Damotharan P., Karthikeyan V., Jha D. K., Dharani G., et al. (2018). Evaluation of the environmental quality of Parangipettai, Southeast Coast of India, by using multivariate and geospatial tool. Mar. pollut. Bull. 131, 239–247. doi: 10.1016/j.marpolbul.2018.04.022
Zhou F., Guo H. C., Liu Y., Jiang Y. M. (2007). Chemometrics data analysis of marine water quality and source identification in Southern Hong Kong. Mar. pollut. Bull. 54, 745–756. doi: 10.1016/j.marpolbul.2007.01.006
Keywords: phytoplankton, nutrient, heavy metal, multivariate, Gulf of Mannar, Tamil Nadu
Citation: Sathish Kumar P, Dharani G, Santhanakumar J, Jha DK, Pandey V, Venkatnarayanan S, Jebakumar JPP, Muthukumar C and James RA (2023) Assessment of phytoplankton diversity, distribution, and environmental variables along the southeast coast of India. Front. Mar. Sci. 10:1215627. doi: 10.3389/fmars.2023.1215627
Received: 02 May 2023; Accepted: 10 July 2023;
Published: 16 August 2023.
Edited by:
Ram Kumar, Central University of Bihar, IndiaReviewed by:
Jawed Equbal, National Centre for Coastal Research, IndiaDiwakar Prakash, Central University of South Bihar, India
Malayaj Rai, Silliman University, Philippines
Copyright © 2023 Sathish Kumar, Dharani, Santhanakumar, Jha, Pandey, Venkatnarayanan, Jebakumar, Muthukumar and James. This is an open-access article distributed under the terms of the Creative Commons Attribution License (CC BY). The use, distribution or reproduction in other forums is permitted, provided the original author(s) and the copyright owner(s) are credited and that the original publication in this journal is cited, in accordance with accepted academic practice. No use, distribution or reproduction is permitted which does not comply with these terms.
*Correspondence: P. Sathish Kumar, bWFyaW5lc2F0aGlzQGdtYWlsLmNvbQ==