 Lukas DeFilippo1*†
 Stan Kotwicki1
 Lewis Barnett1
 Jon Richar2Michael A. Litzow2
 William T. Stockhausen3
 Katie Palof4
- 1Resource Assessment and Conservation Engineering Division, Alaska Fisheries Science Center, National Oceanic and Atmospheric Administration (NOAA), Seattle, WA, United States
- 2Resource Assessment and Conservation Engineering Division, Alaska Fisheries Science Center, National Oceanic and Atmospheric Administration (NOAA), Kodiak, AK, United States
- 3Resource Ecology and Fisheries Management Division, Alaska Fisheries Science Center, National Oceanic and Atmospheric Administration (NOAA), Seattle, WA, United States
- 4Alaska Department of Fish and Game, Division of Commercial Fisheries, Juneau, AK, United States
Fisheries-independent surveys provide critical data products used to estimate stock status and inform management decisions. While it can be possible to redistribute sampling effort to improve survey efficiency and address changing monitoring needs in the face of unforeseen challenges, it is important to assess the consequences of such changes. Here, we present an approach that relies on existing survey data and simulations to evaluate the impacts of strategic reductions in survey sampling effort. We apply this approach to assess the potential effects of reducing high density sampling near St. Matthew Island and the Pribilof Islands in the NOAA eastern Bering Sea (EBS) bottom trawl survey. These areas contain high density “corner stations” that were implemented for finer-scale monitoring of associated blue king crab stocks (Paralithodes platypus) which historically supported commercial fisheries but have since declined and are seldom eligible for harvest. We investigate the effects of removing these corner stations on survey data quality for focal P. platypus stocks and other crab and groundfish species monitored by the EBS survey. We find that removing the St. Matthew and Pribilof Islands corner stations has negligible effects on data quality for most stocks, except for those whose distributions are concentrated in these areas. However, the data quality for such stocks was relatively low even with higher density sampling, and corner station removal had only minor effects on stock assessment outcomes. The analysis we present here provides a generic approach for evaluating strategic reductions in sampling effort for systematic survey designs and can be applied by scientists and managers facing similar decisions elsewhere.
1 Introduction
Fisheries-independent surveys provide some of the most important data used to inform stock assessments and management decisions (Gunderson, 1993; Chen et al., 2003). Indices of abundance generated from survey data are typically assumed to be proportional to the true abundance of target populations, a relationship which is expressed via the catchability parameter (q) in assessment models (Quinn and Deriso, 1999). The relationship between the survey index and population size is assumed to be constant in most cases, violation of which can lead to spurious estimates of stock dynamics (Pope and Shepherd, 1985; Wilberg et al., 2009; Thorson et al., 2013; Kotwicki et al., 2014). Consequently, changes to survey designs and operations that affect catchability may disrupt the stationarity of this relationship and confound true population trends if not accounted for (Godo, 1994; Kimura and Somerton, 2006; Cadigan et al., 2022). Changes in gear selectivity and effort allocation across space may also shift the composition of ages and sizes sampled, potentially affecting estimates of population age and size structure (Ono et al., 2015; Kotwicki et al., 2017; O’Leary et al., 2020). As such, to the extent possible, fisheries monitoring agencies typically avoid altering survey designs and sampling procedures in order to minimize the impacts such changes could have on data products and population estimates.
While long-term time series of fisheries-independent survey data with minimal interruptions or modifications are desirable (Godo, 1994; Stompe et al., 2020), circumstances may arise where changes are unavoidable or beneficial. For instance, sections of historically surveyed areas may become inaccessible due to marine protected area designations or wind energy development (Field et al., 2006; Methratta et al., 2020; Hare et al., 2022). Similarly, hazardous weather, vessel breakdowns, staffing and budget shortages, as well as pandemics, international conflicts, and economic turmoil can disrupt monitoring agencies’ ability to complete surveys (ICES, 2020; Santora et al., 2021; ICES, 2023). Changes may also offer advantages, such as modernizing fishing gear or improving the efficiency of sampling designs (Brown et al., 2007; Oyafuso et al., 2021; Oyafuso et al., 2022). Moreover, marine ecosystems are dynamic, and updating survey designs may be necessary to adapt to shifting species distributions, abundance trends, and management priorities (Dulvy et al., 2008; Pinsky and Mantua, 2014; Maureaud et al., 2021; DeFilippo et al., 2023). While some fisheries-independent survey designs can readily accommodate changes in sampling density (e.g., stratified random), others are less flexible (e.g., systematic) (Cochran, 1977) and may require more detailed evaluation of the consequences of such changes.
The U.S. National Oceanic and Atmospheric Administration (NOAA) eastern Bering Sea (EBS) bottom trawl survey provides critical data in support of stock assessment and management for some of the world’s most commercially valuable fish and crab stocks. The EBS survey follows a stratified systematic design composed of 350 rectangular grid cells which are each sampled as part of annual surveys (Lauth et al., 2019). However, near St. Matthew Island and the Pribilof Islands the corners of the grid cells are sampled in addition to the centers. The rationale for finer-scale sampling near St. Matthew and the Pribilof Islands has been to improve monitoring and data products for blue king crab (Paralithodes platypus) stocks in these areas, which historically supported valuable commercial fisheries. Blue king crab exhibit a sparse and patchy distribution, resulting in highly uncertain abundance estimates. Sampling these corner stations was instituted to increase the probability of encountering concentrated patches of blue king crab and reduce uncertainty in survey data products. However, both the Pribilof and St. Matthew stocks of blue king crab have declined substantially and are now closed to fishing with little sign of rebuilding to harvestable levels in the near future (Palof et al., 2020; Stockhausen, 2021a). Consequently, it is unclear if the effort and funds required to continue sampling the corner stations is justifiable, or if resources might be better allocated to other priorities, such as improving data quality for other species.
Here, we present an approach for evaluating the consequences of reduced sampling effort in systematic survey designs and apply it to estimate the effects of removing the St. Matthew and Pribilof Island corner stations from the EBS survey. While changes to survey fishing gear and sampling protocols can be resolved by paired fishing and intercalibration studies (e.g., Cadigan and Dowden, 2010; Miller, 2013; Kotwicki et al., 2017; Cadigan et al., 2022), there is less guidance for evaluating changes in sampling effort (but see Zimmermann and Enberg, 2017; ICES, 2020; ICES, 2023), particularly for systematic survey designs. Using existing survey time-series and simulation analyses, our approach estimates the impacts of effort reduction on the precision and accuracy of survey data products, as well as stock assessment output and biological and management reference points. As fisheries management agencies are tasked with monitoring changing marine ecosystems under static or declining budgets, tools for addressing effort reduction and reallocation decisions will be essential for optimizing survey efficiency and ensuring reliable data products (ICES, 2020; ICES, 2023). The approach we present here is generic and flexible and can be widely applied to other species and regions by scientists and managers facing survey effort reduction decisions.
2 Methods
2.1 Case study background
The NOAA EBS bottom trawl survey occurs southeast of the U.S. – Russian international maritime boundary from Bristol Bay and the Alaska Peninsula to the south, to north of Nunivak and St. Matthew Island (Figure 1). Occurring annually from May to early August, the EBS survey samples a fixed set of 350 rectangular grid cells as part of a systematic design with a minimum grid resolution of 37.04 km2 and a maximum depth of 200m (Lauth et al., 2019). The EBS survey begins in Bristol Bay and proceeds west using two chartered commercial vessels. Each vessel tows a standard 83’-112’ eastern otter trawl with 10cm mesh for a duration of 30 minutes at a target speed of 3 knots (Lauth et al., 2019). Survey effort is measured as the area swept by the trawl gear, which is calculated as the product of the distance fished (measured with a GPS and a bottom contact sensor) and net width (measured by an acoustic sensor). Catches of commercially important fishes are identified to species and weighed, with a subset selected for length measurements and otolith extraction following protocols outlined in Lauth et al. (2019) and Stauffer (2004). Catches of commercially important crab species are sexed, assigned a shell condition and maturity status as per classifications in Jadamec et al. (1999), and carapace width (Chionoecetes spp.) or carapace length (Lithodes/Paralithodes spp.) is measured to the nearest 0.1 mm using either Vernier (prior to 2016) or digital (2016 and later) calipers.
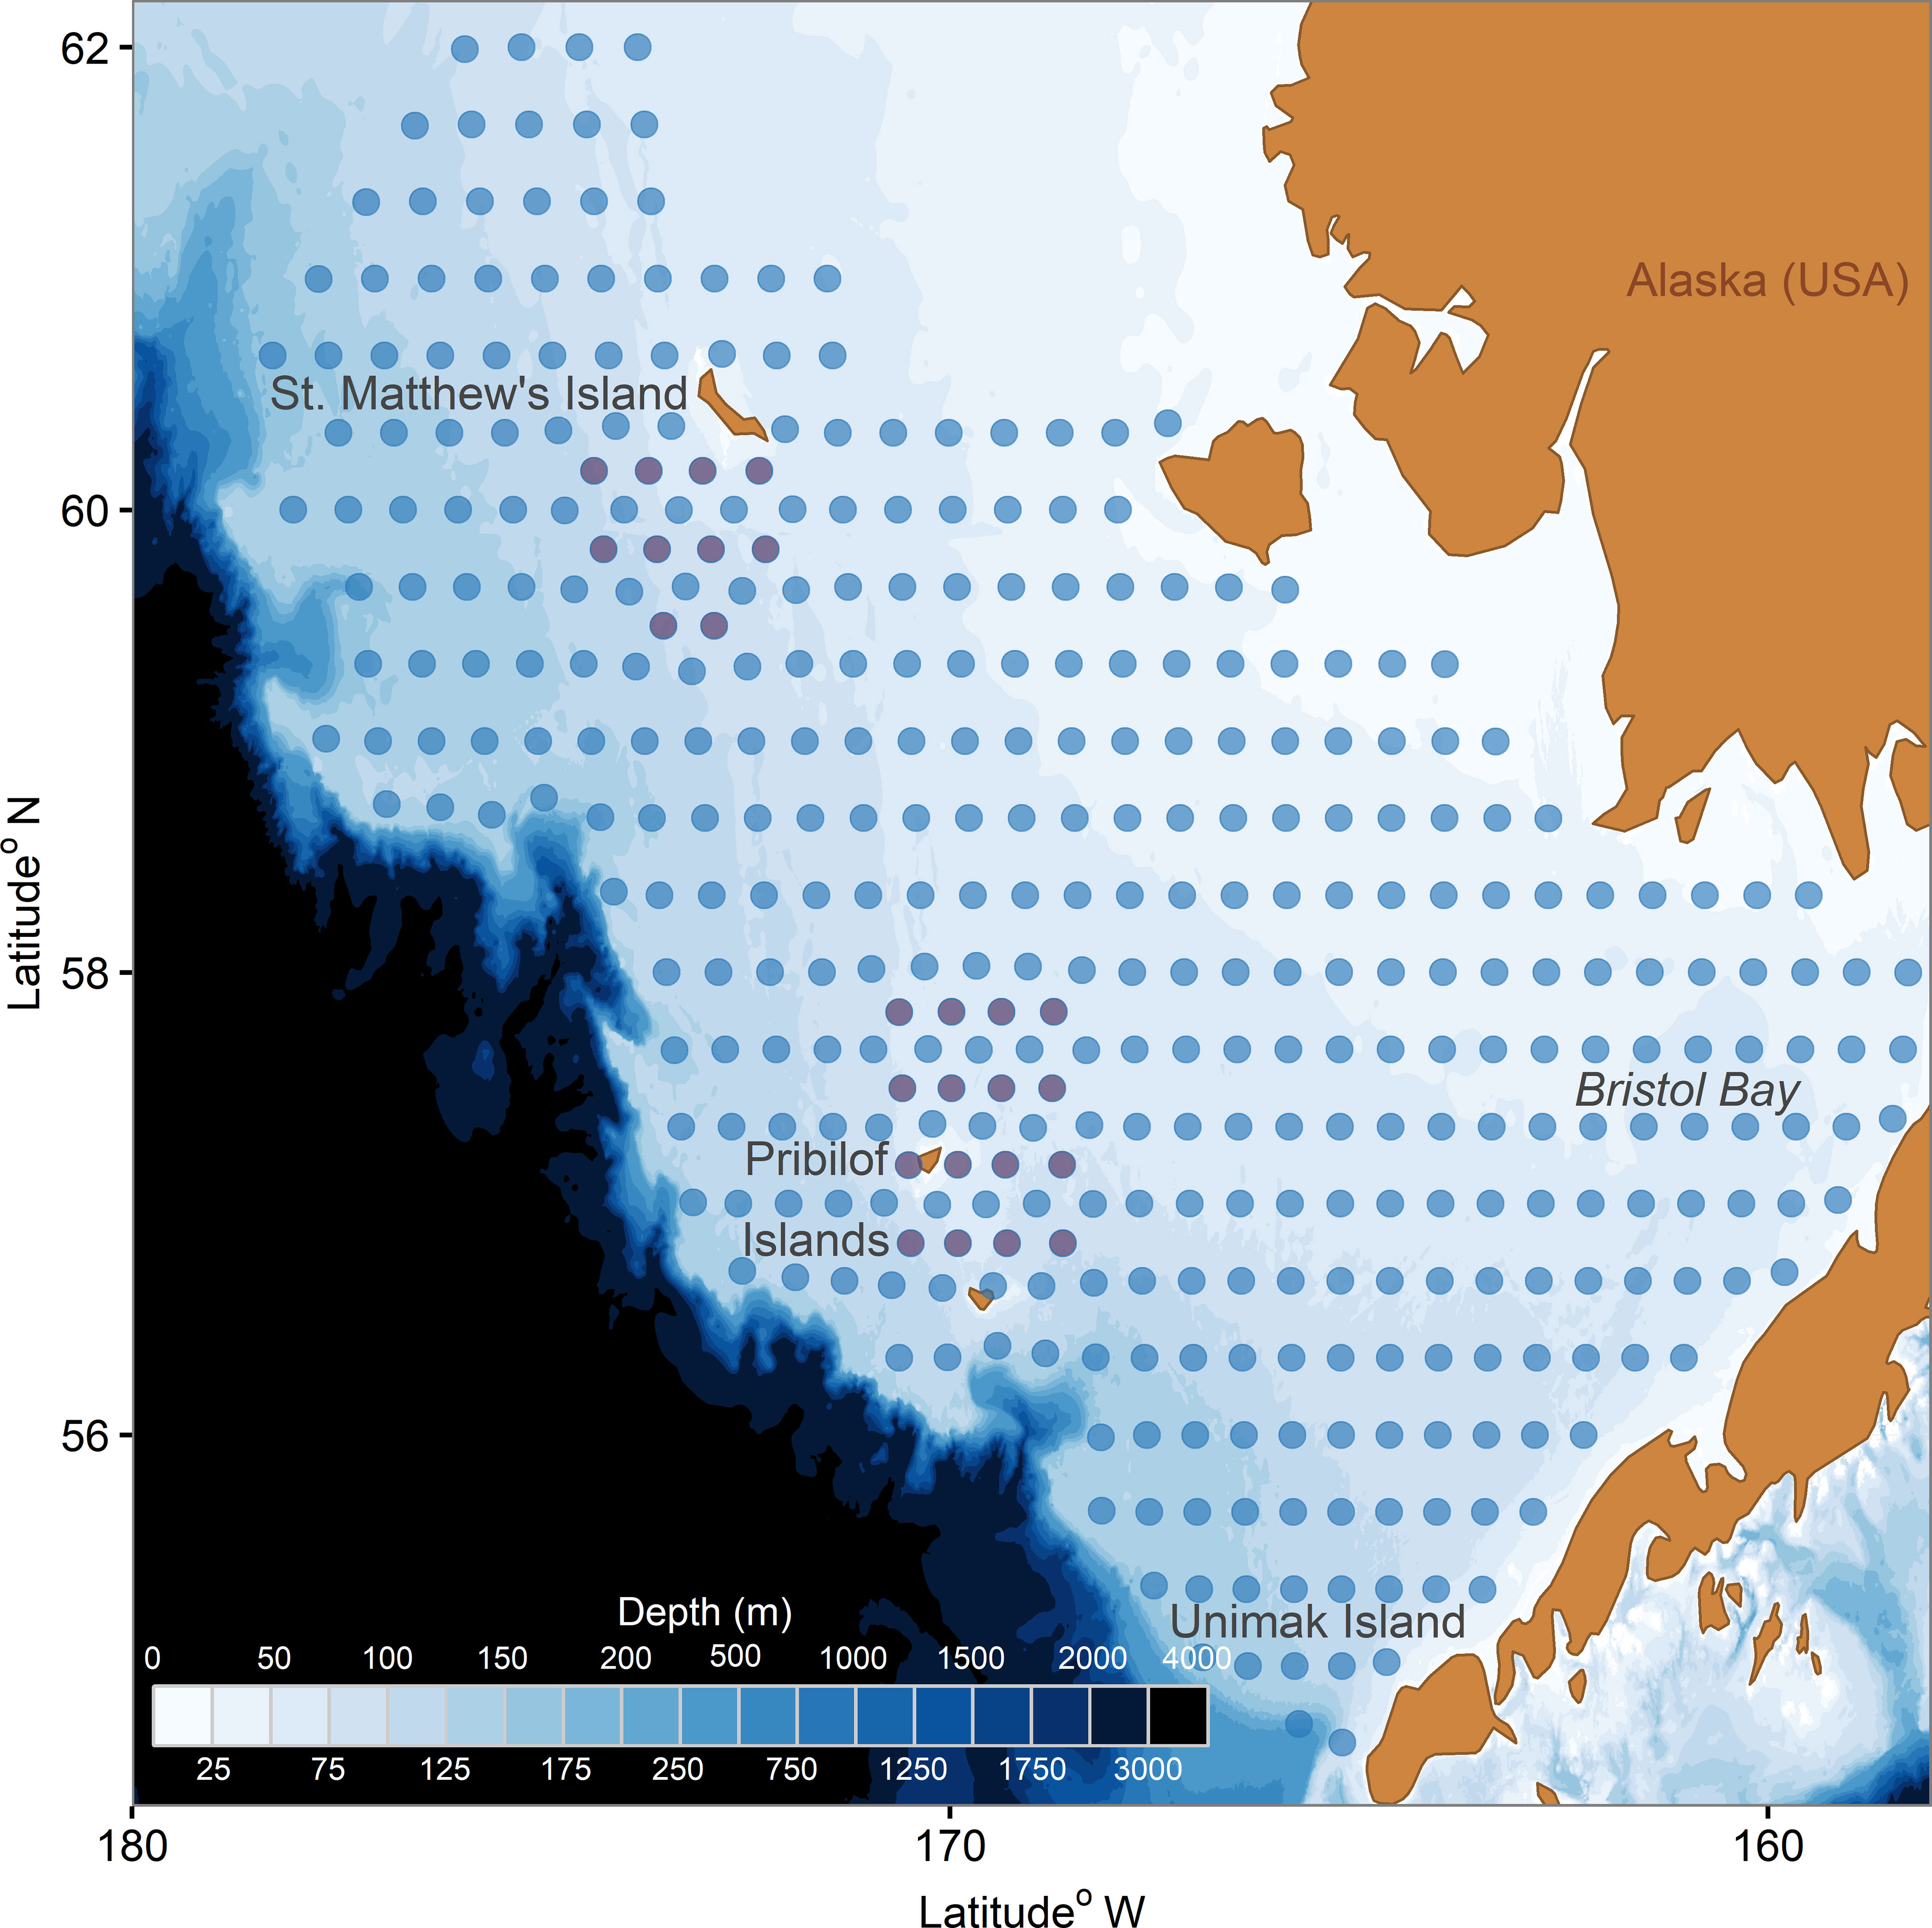
Figure 1 Bathymetric map of the southeastern Bering Sea shelf and centroids of the NOAA EBS bottom trawl survey grid. The St. Matthew’s and Pribilof Islands corner stations are shown in purple, while the standard grid center stations are shown in blue.
Surrounding St. Matthew and the Pribilof Islands, the corners of the EBS survey grid cells are sampled in addition to the centers, leading to higher density sampling in these areas (Figure 1). There are 26 of these “corner stations” in total, which, at an average rate of 4 stations/day, require roughly one week of vessel time to sample. This additional sampling effort was initiated in 1981 for the Pribilof Islands, and 1983 for St. Matthew Island in order to improve the quality of data products for blue king crab stocks in these areas. Blue king crab exhibit a “contagious” distribution, in which individuals tend to be encountered in sparse, concentrated patches. Moreover, blue king crab (particularly females) are often found on rocky substrate and thus are difficult to sample by the EBS bottom trawl survey which primarily occurs in soft bottom habitat (Zacher et al., 2020; Vølstad, 2012). As a result, bottom trawl survey data products for blue king crab are highly uncertain (Stockhausen, 2021a; Palof, 2022). Sampling at a finer spatial resolution via the addition of the corner stations was intended to reduce uncertainty by increasing both the probability of encountering patches of blue king crab, and overall sample sizes. However, following pronounced declines in abundance, the St. Matthew blue king crab stock was declared overfished and closed to harvest in 1999. After a 10-year rebuilding plan, fishing resumed in 2009/2010 but after three years of modest harvest, the fishery was closed again in 2013/2014 due to declining survey abundance estimates and concerns about the productivity of the stock. Fishing resumed in 2014/2015 but fishery catches were poor and harvest has remained closed since 2016; the stock was once again declared overfished in 2018 when it entered into the current rebuilding plan (Palof, 2022). The Pribilof blue king crab stock has been closed to fishing since 1999, was declared overfished in 2002 and subsequently put on a rebuilding plan (Stockhausen, 2021a).
2.2 Analysis overview
Our approach to evaluating the effects of survey effort reduction proceeds in three general stages. In the first stage (Empirical Analysis, section 2.2.1), we quantify the retrospective effects of station removal on core survey data products (i.e. biomass, compositional estimates) that are used as inputs in stock assessment models. This stage of the analysis is focused on (1) identifying qualitative differences in survey data products as a result of station removal (i.e. changes in estimated stock biomass trajectories), and (2) evaluating effects on the uncertainty/precision of the survey data products (i.e. changes in the estimated variance of survey biomass indices). This first stage of the analysis uses historical survey data, generating survey data products without any corner station data and comparing them to estimates produced with the data from these stations. The second stage of our analysis focuses on assessing the effects of station removal on the accuracy of the survey data products using simulations (section 2.2.2. Simulation Analysis). Specifically, new survey datasets are simulated from spatiotemporal operating models and we examine how removing the corner stations from these simulated datasets affects the accuracy of estimated biomass indices relative to the true values specified in the operating models. In the third stage of our approach, we propagate the effects of station removal into the stock assessment models (section 2.2.3. Stock Assessment Analysis). This is accomplished in our case study by fitting stock assessment models to the biomass and compositional survey data products generated without corner station data and comparing the output to that from model fits that included the corner station data. Because integrated stock assessment models are complex and time consuming to fit, we do not perform this exercise for the full suite of stocks under consideration in our analysis, but select a representative subset to evaluate. Given that the corner stations were specifically intended to improve data quality for crab, our case study focuses more heavily on crab stocks, with a similar but limited set of analyses performed for groundfish.
2.2.1 Empirical analysis
For the first stage of our analyses, we retrospectively evaluated the effects of removing corner station data from the existing survey time-series on derived data products. To do so, we withheld all data collected from the 26 corner stations from 1982-2019 and produced design-based (i.e. area-swept catch-per-unit effort expansions) and model-based (i.e. standardized indices produced via spatiotemporal models) estimates using only data from the remaining stations. While the corner stations were implemented to improve data quality specifically for blue king crab, it is important to understand the effects of their removal on estimates for other species that occur in these areas as well. As such, in addition to both the St. Matthew and Pribilof Islands blue king crab stocks, we evaluated the effects of corner station removal on Pribilof Islands red king crab (P. camtschaticus), snow crab (Chionoecetes opilio) and Tanner crab (C. bairdi) biomass indices. For all crab biomass estimates, we focused on key size classes for each stock that are particularly important from a management standpoint. Specifically, we examined biomass estimates for the GE103 (GE=greater than or equal to) size class (103 – 189 mm) of male Tanner crab, the GE95 size class (95mm – 178 mm) of male snow crab, the GE120 size class of male Pribilof blue and red king crab (120 – 173 mm and 120 – 209 mm respectively), and both the GE90 (90 – 173 mm) and GE105 (105–173 mm) size classes of St. Matthew blue king crab. Additionally, we evaluated the effects of corner station removal on data products for ten groundfish species that inhabit these areas: Pacific cod (Gadus macrocephalus), walleye pollock (G. chalcogrammus), yellow Irish lord (Hemilepidotus jordani), Alaska plaice (Pleuronectes quadrituberculatus), northern rock sole (Lepidopsetta polyxystra), yellowfin sole (Limanda aspera), Bering flounder (Hippoglossoides robustus), flathead sole (H. elassodon), Alaska skate (Bathyraja parmifera), and Bering skate (B. interrupta). While improving data quality for groundfish stocks was not a consideration in implementing the corner stations as part of the EBS survey, groundfish are nonetheless sampled at these locations and it is useful to consider impacts on these stocks’ data as well.
Design-based biomass indices for all species in our study were produced following the methods outlined in Wakabayashi et al. (1985) and using standard protocols for EBS groundfish and crab index production (Lauth et al., 2019; Zacher et al., 2020). For the crab stocks in our analysis, we also produced design-based size compositional estimates with and without the corner station data; these results are presented in Appendix A.
Model-based estimators are increasingly being used for index standardization, as they can often improve the precision of indices from fisheries-independent survey data (Thorson et al., 2015; Cao et al., 2017; Thorson and Haltuch, 2019). Model-based estimates are currently included in stock assessments for some of the groundfish species considered in this study, but none of the crab stocks. However, by leveraging spatial autocorrelation to extrapolate to unsampled areas, some model-based estimators may be more robust to reductions in survey effort. As such, we compared model-based biomass indices produced with and without the corner station data to explore how these estimates responded to station removal. Model-based estimates were generated using spatiotemporal models built via the Vector Autoregressive Spatiotemporal (VAST) package (release number 3.9.0) (Thorson and Barnett, 2017) in R-4.1.2 (R Core Team, 2021). The specification of the spatiotemporal models used here is standard for abundance index production, and further details can be found in Thorson (2019). Briefly, VAST models are an extension of a generalized linear mixed model (GLMM) that estimates dependent variable(s) via two linear predictors and a link function. Variation in the response variable(s) over space and time is partitioned into three components: (1) temporal variation (, which represents changes from year-to-year that are equal across all locations, (2) spatial patterns (), which correspond to variation over space that is constant over time (i.e. long-term habitat associations), and (3) spatiotemporal variation (), which represents changes from year-to-year that are expressed differently across locations. To account for zero-inflated and skewed distributions, a Poisson-link delta modeling approach is used with two estimated linear predictors, and , which represent expected numerical density and biomass-per-individual, respectively, such that gives the expected biomass density () of sample (survey haul) (Thorson, 2019):
where and are the location and year associated with sample . The annual intercepts () were specified as fixed effects independent among years, and the spatial variation terms () were estimated as random effects following a multivariate normal distribution:
where is the marginal spatial variance and is the correlation matrix among locations () which is modeled as a Matérn function with decorrelation distance of and a transformation matrix that allows for geometric anisotropy such that decorrelation distance varies with cardinal direction (Thorson et al., 2015). Spatiotemporal effects were specified similarly:
where represents the marginal spatiotemporal variance. The predicted density of individuals for each sample follows a Poisson process with expectation such that the encounter probability () is defined as:
where is the area swept for bottom trawl sample . For any years in which a given species exhibited a 100% encounter rate across the EBS survey (i.e. at least one individual encountered at every station) the encounter probability () was fixed at one. The positive catch rate for sample is obtained from the numerical density () and average biomass per individual () as:
Given the predicted encounter probability and positive catch rate , the probability distribution of the biomass for sample was specified as:
where is the probability associated with a biomass of zero, and is the probability of biomass given the expected encounter probability and positive catch rate with estimated Gamma shape and scale parameters and .
The model form described here was fitted individually to each of the ten species of groundfish considered and each of the six crab stocks/size classes, with the exceptions of Pribilof blue and red king crab. The full model configuration described above failed to converge for these latter two stocks, likely due to a limited spatial distribution and low encounter rates. As such, we removed the second spatiotemporal term from the Pribilof blue king crab model and the second temporal ( and spatial (), and both spatiotemporal terms () from the Pribilof red king crab model. Additionally, to account for years in which no Pribilof red king crab were observed, the first temporal intercept () was specified as an independent annual random effect rather than as a fixed effect.
2.2.2 Simulation analysis
The empirical analysis described above was focused on assessing the (1) qualitative impacts (i.e. changes in biomass trends) and (2) effects on precision (i.e. coefficients of variation (CVs) of biomass estimates) of corner station removal on existing survey data products. However, it is not possible from these analyses to evaluate the effects of corner station removal on the accuracy of survey data products. To do so, we conducted a simulation analysis using the VAST model fits for each species as the basis for spatiotemporal operating models (OMs). New fixed and random effects were simulated from the joint precision matrix of the spatiotemporal model fits (i.e. conditional on the original data), and new data were then simulated conditional upon these new fixed and random effects via parametric bootstrapping (e.g., Thorson et al., 2021). New observations were simulated at each location and year in which sampling occurred in the original survey data set (including both positive observations, and observations of zero biomass). Data were simulated from model fits that included the corner station data and thus included simulated data points at the corner station locations. These simulated corner station data were then either withheld or retained as design and model-based biomass estimates were obtained using the simulated data. The accuracy of these estimates was measured using the log accuracy ratio (LAR):
where is the estimated (design or model-based) biomass index from year and simulation replicate , and is the true biomass value specified in the OM. LAR was summarized across years and simulation replicates via the median symmetric accuracy (MSA):
LAR and MSA offer a number of advantages over other accuracy metrics (e.g., mean absolute percentage error (MAPE), root mean square error (RMSE)), including scale independence, robustness to outliers, symmetry, and interpretability (Morley et al., 2018). LAR and MSA are interpretable such that values of zero represent perfect accuracy, and larger values indicate progressively worse accuracy.
The VAST operating models for Pribilof blue and red king crab and St. Matthew blue king crab were poorly conditioned, likely due to the low abundance levels, restricted ranges, and infrequent encounters for these stocks. Consequently, simulated datasets for Pribilof and St. Matthew king crab generated with the same procedures used for other stocks exhibited unrealistic distributions, with frequent positive encounters outside the Pribilof or St. Matthew management areas. As such, a modified simulation procedure was used for these stocks in which new data were simulated conditional upon the estimated fixed and random effects rather than simulating new fixed and random effects. Additionally, simulated datasets for St. Matthew and Pribilof king crab stocks were generated from operating models with spatial extents that were limited to the St. Matthew and Pribilof management areas respectively, thereby constraining the simulated observations within these boundaries. Given the difficulty of conditioning the operating models, we recommend that the results of the simulation analyses for St. Matthew’s blue and Pribilof blue and red king crab be interpreted cautiously.
2.2.3 Stock assessment analysis
In addition to examining the effects of corner station removal on the precision and accuracy of survey data products themselves, we also investigated how these effects propagated into stock assessment output. For this phase of the analysis, we focus solely on crab stocks as these were the primary consideration for the implementation of the corner stations. We fitted stock assessment models using survey estimates of biomass (Methods: 2.2.2. Empirical analysis) and size composition (Appendix A) produced without the corner stations. We compared the resulting assessment model predictions and estimated biological and management reference points to those from model fits to data products that included corner station data. For this analysis we focused on Tanner crab and St. Matthew blue king crab. We selected these two stocks to investigate the effects of corner station removal on assessment output for stocks for which the corner stations are (St. Matthew blue king crab) and are not (Tanner crab) focal areas of the stocks’ distributions.
The Tanner crab assessment model is a stage/size-based population dynamics model that incorporates sex (male, female), shell condition (new shell, old shell), and maturity (immature, mature) as different categories into which the overall stock is divided on a size-specific basis (Stockhausen, 2021b). The model is fit using a penalized maximum likelihood approach to the design-based survey biomass and size composition time-series, molt increment data, retained catch biomass and size composition time series from the directed fishery, bycatch data (biomass and size composition time series) from the directed fishery (sub-legal males, all females), and bycatch data (biomass and size composition time series) from several other crab and groundfish fisheries. Management quantities are subsequently derived from the maximum likelihood solution using spawner-per-recruit proxies for FMSY and BMSY. For this analysis, the 2021 assessment model was fitted using the design-based survey biomass and size composition time series estimated without the corner stations and compared to existing assessment output produced with the corner stations. Model results for the estimated sex/maturity-specific population biomass time series, recruitment time series, management quantities, and rates of natural mortality from the two scenarios were compared.
The St. Matthew’s blue king crab stock assessment is a simpler form of the Tanner crab model, using only mature male crab in the size/stage structured model (Palof, 2022). The stock is modeled via the Generalized Modeling for Crustacean Stocks (GMACS) framework in which it is fit using a penalized maximum likelihood approach to design-based survey biomass and size composition time series, retained catch biomass and size composition time series from the directed fishery, bycatch data (biomass and size composition time series) from the directed fishery, and bycatch data (biomass) from several other crab and groundfish fisheries. Estimates of life history parameters, such as natural mortality and growth for this stock are borrowed from other well studied king crab stocks, such as Bristol Bay red king crab. Management quantities are approximated from the long term average of mature male biomass, as directed by the Bering Sea and Aleutian Island (BSAI) crab fishery management plan. For this analysis, the 2021 model was fit using the design-based EBS bottom trawl survey biomass and size composition time series with and without corner stations. Resulting time series of mature male biomass and recruitment, as well as management quantities were compared between model fits.
3 Results
3.1 Empirical analyses
For the six stocks/size classes of crab that we examined, corner station removal had little qualitative impact on either design or model-based biomass estimates. Biomass trends were generally coherent with one another regardless of corner station inclusion, with some notable transient discrepancies for St. Matthew blue king crab and Pribilof blue and red king crab (Figure 2). Corner station removal had little effect on the precision of design and model-based estimates for both snow crab and Tanner crab (Figure 2; Table 1), with increases in average CV (Δ CV) of<0.02 for these species. More substantial declines in precision were observed for the other crab stocks, particularly for design-based biomass estimates (Figure 2; Table 1). For the two size classes of St. Matthew blue king crab, average design-based CVs estimates increased by ~ 0.1, while model-based CVs were much less affected by removing the corner stations (Table 1). The average design-based CV increased by 0.185 without the corner station data for Pribilof blue king crab, and 0.071 for Pribilof red king crab, while average the model-based CV for these stocks increased by 0.143 and 0.077 (Table 1). While the precision of model-based estimates was generally more robust to corner station removal compared to that of design-based estimates, we note that this was not the case for Pribilof red king crab; the average model-based CV for this stock increased by more than its design-based counterpart as a result of corner station removal, although the model-based CVs themselves were smaller in all scenarios (Table 1).
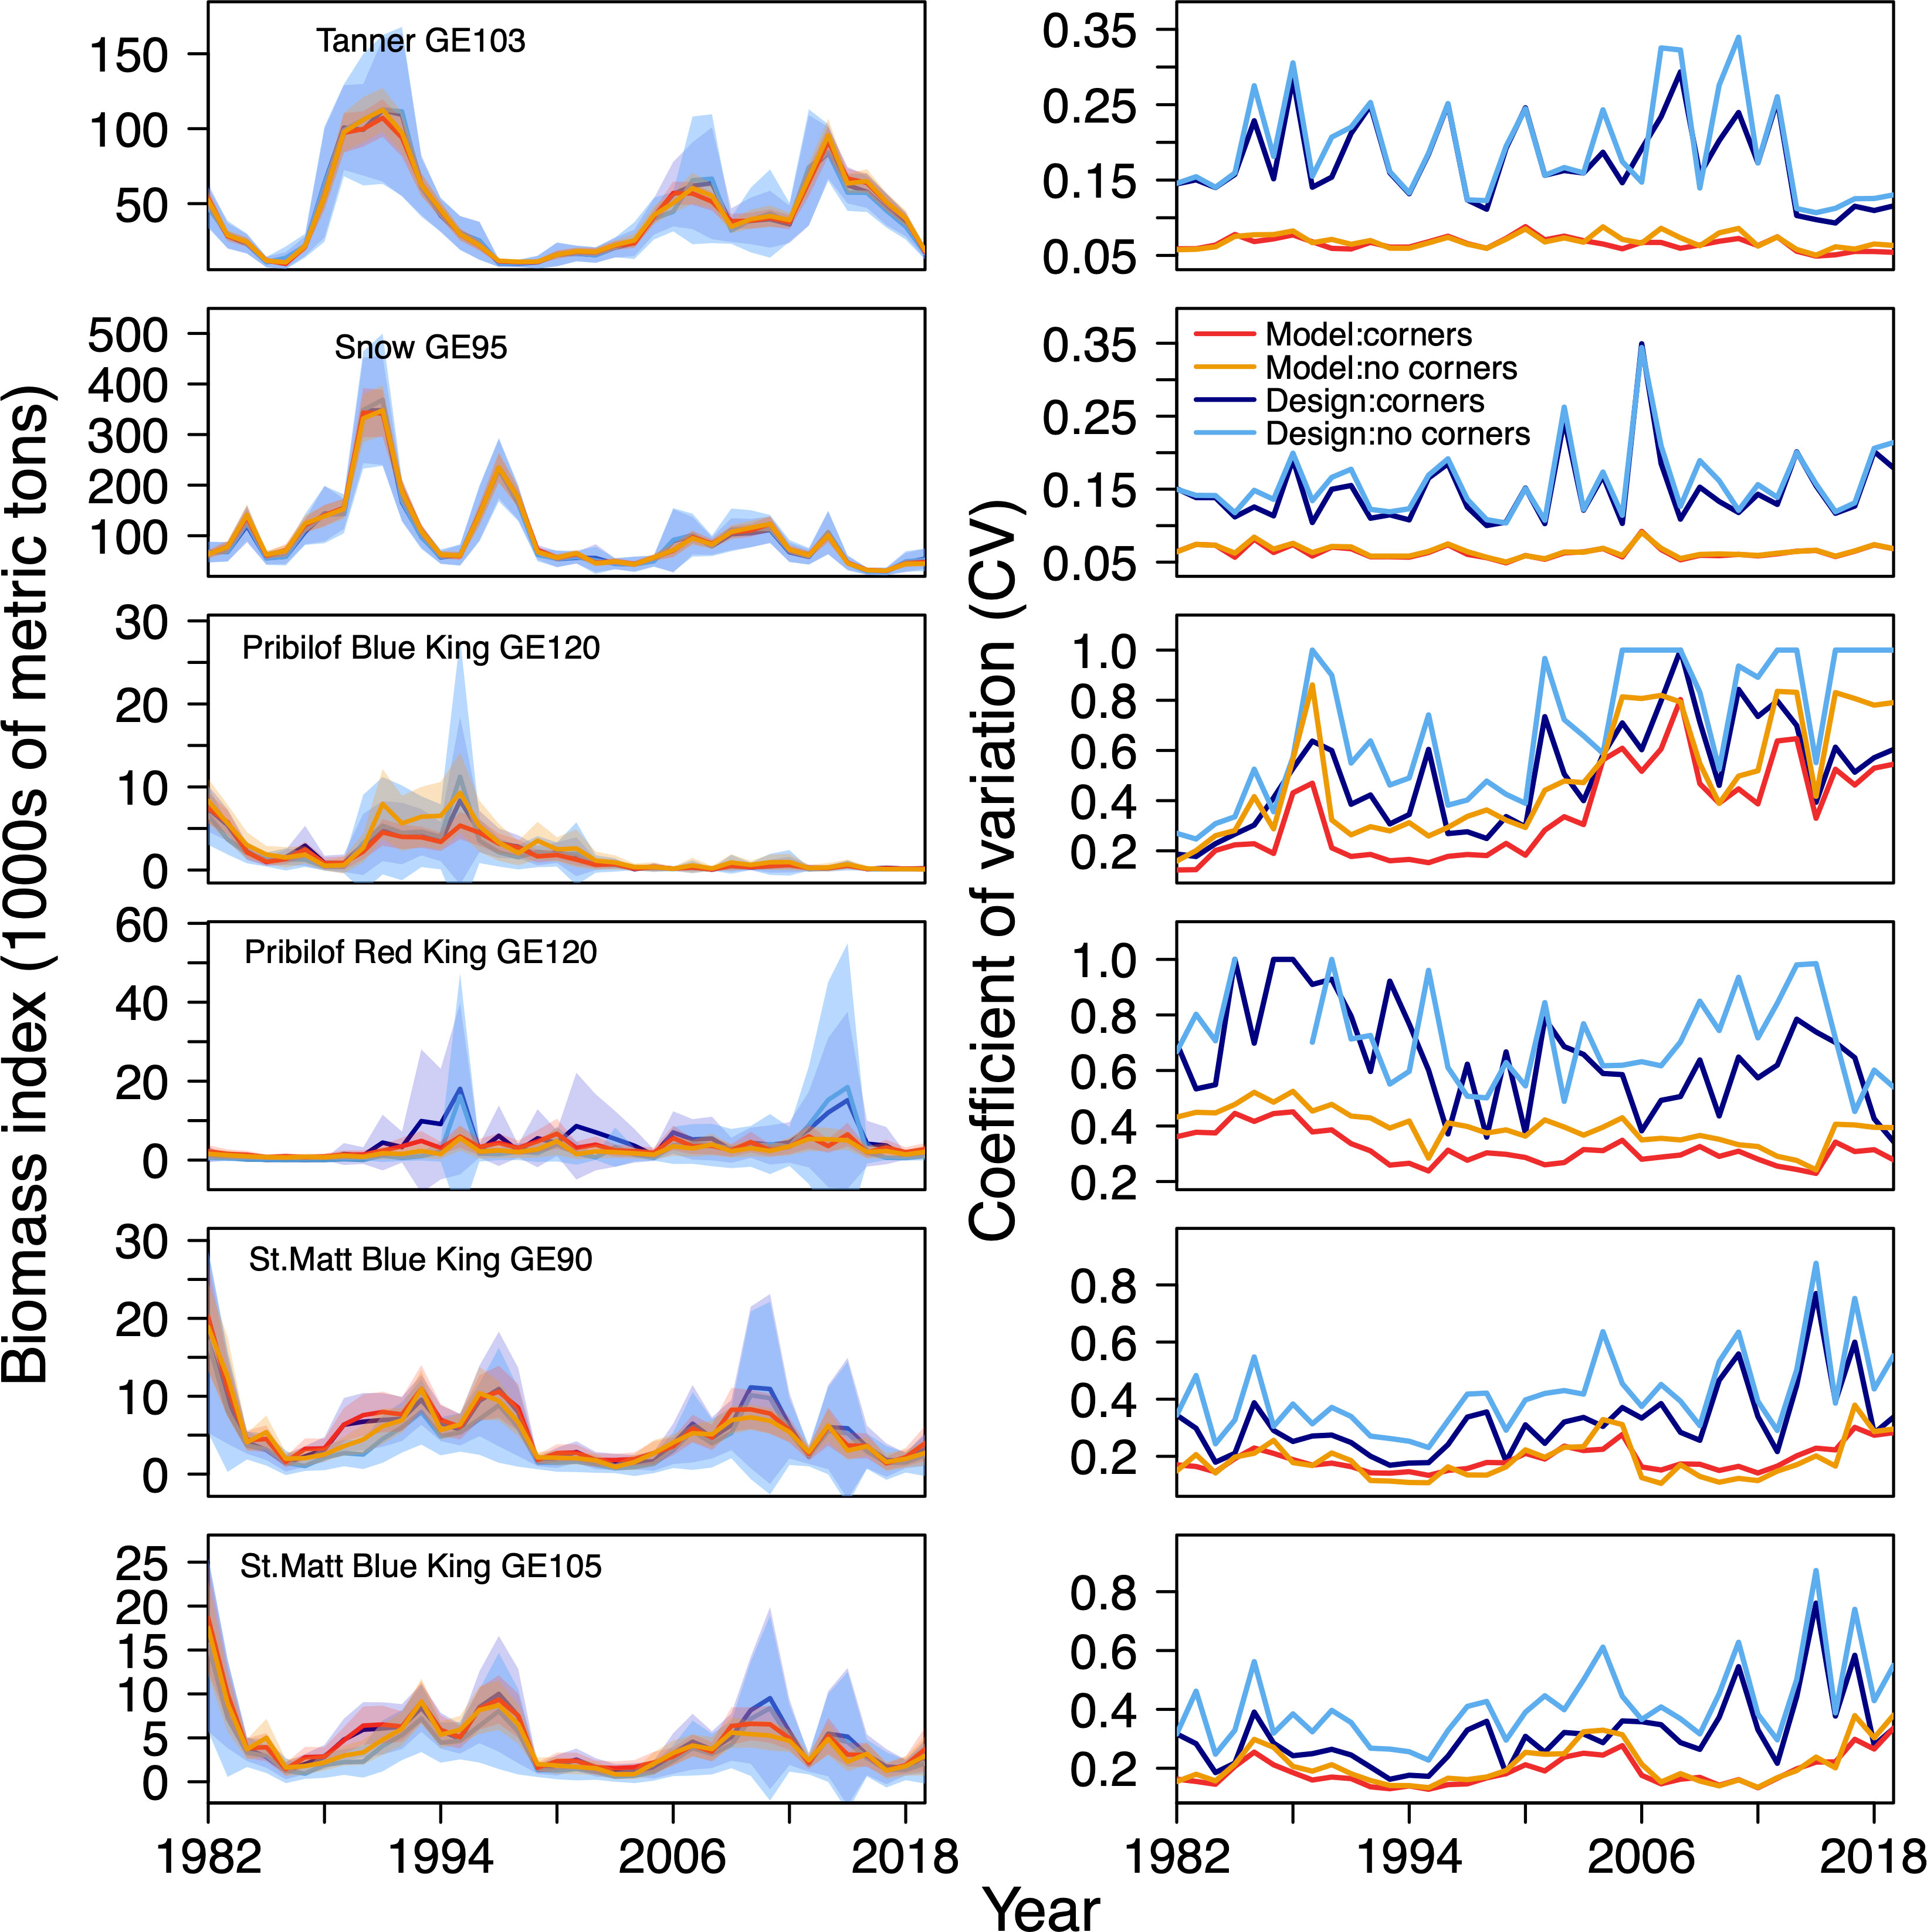
Figure 2 Design and model-based survey biomass estimates (left) and associated CVs (right) produced with and without corner station data for crab stocks/size classes.
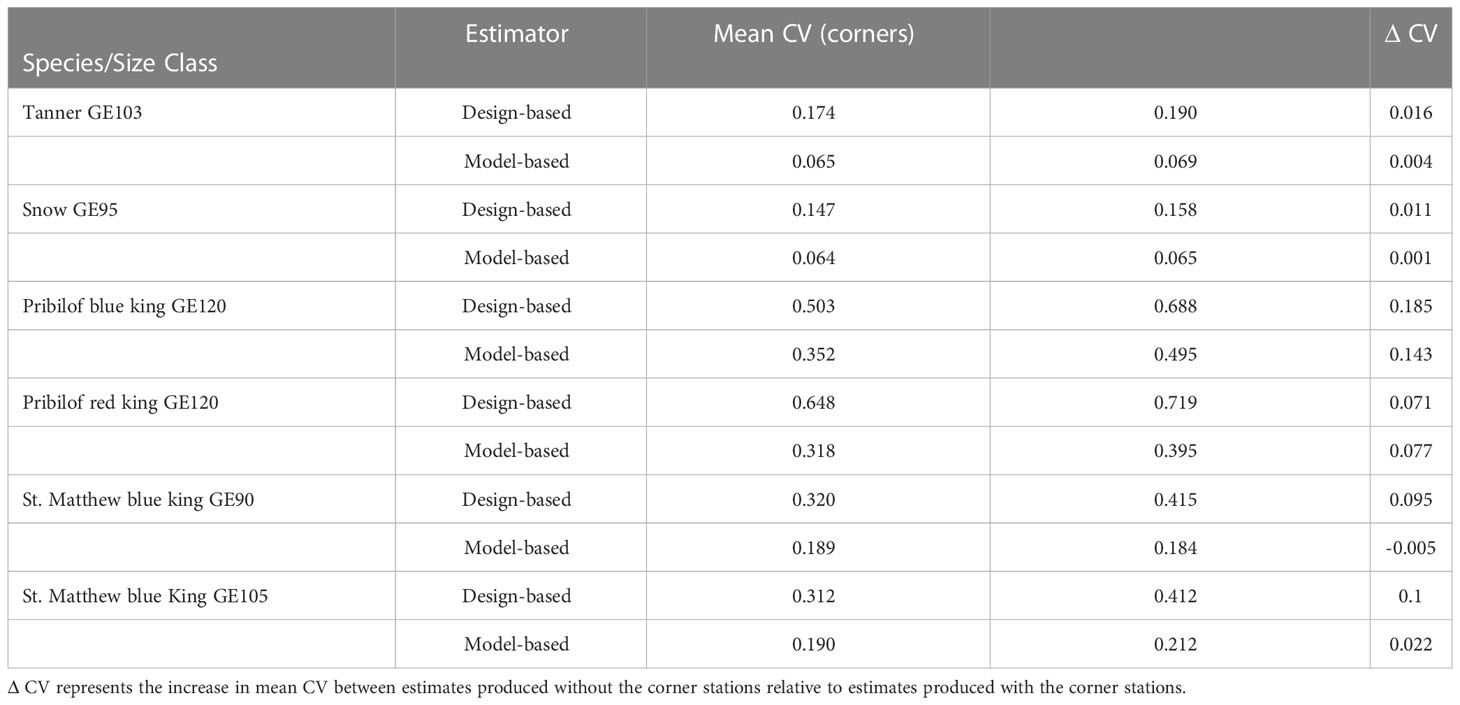
Table 1 Mean coefficients of variation (CV) of design and model-based biomass estimates for crab species produced with versus without the corner stations.
For nine of the ten groundfish species that we examined, there was no qualitative effect of corner station removal on the trend or scale of either design or model-based biomass estimates (Figure 3). Similarly, for most of the groundfish species we considered, differences in the precision of biomass estimates produced with and without corner station data were negligible (Figure 3; Table 2). The precision of model-based groundfish biomass estimates was generally more robust to corner station removal than their design-based counterparts (Table 2). The only groundfish species for which corner station removal caused a substantial increase in biomass CVs was yellow Irish lord (Figure 3; Table 2). Average design-based CV for this species increased by 0.096, while model-based CVs were more robust and increased by 0.05 without the corner station data. However, it is worth noting that even with the corner station data included, the biomass CVs for yellow Irish lord were large in many years (e.g., 0.3-0.6), and were the highest of any of the groundfish species we examined (Table 2).
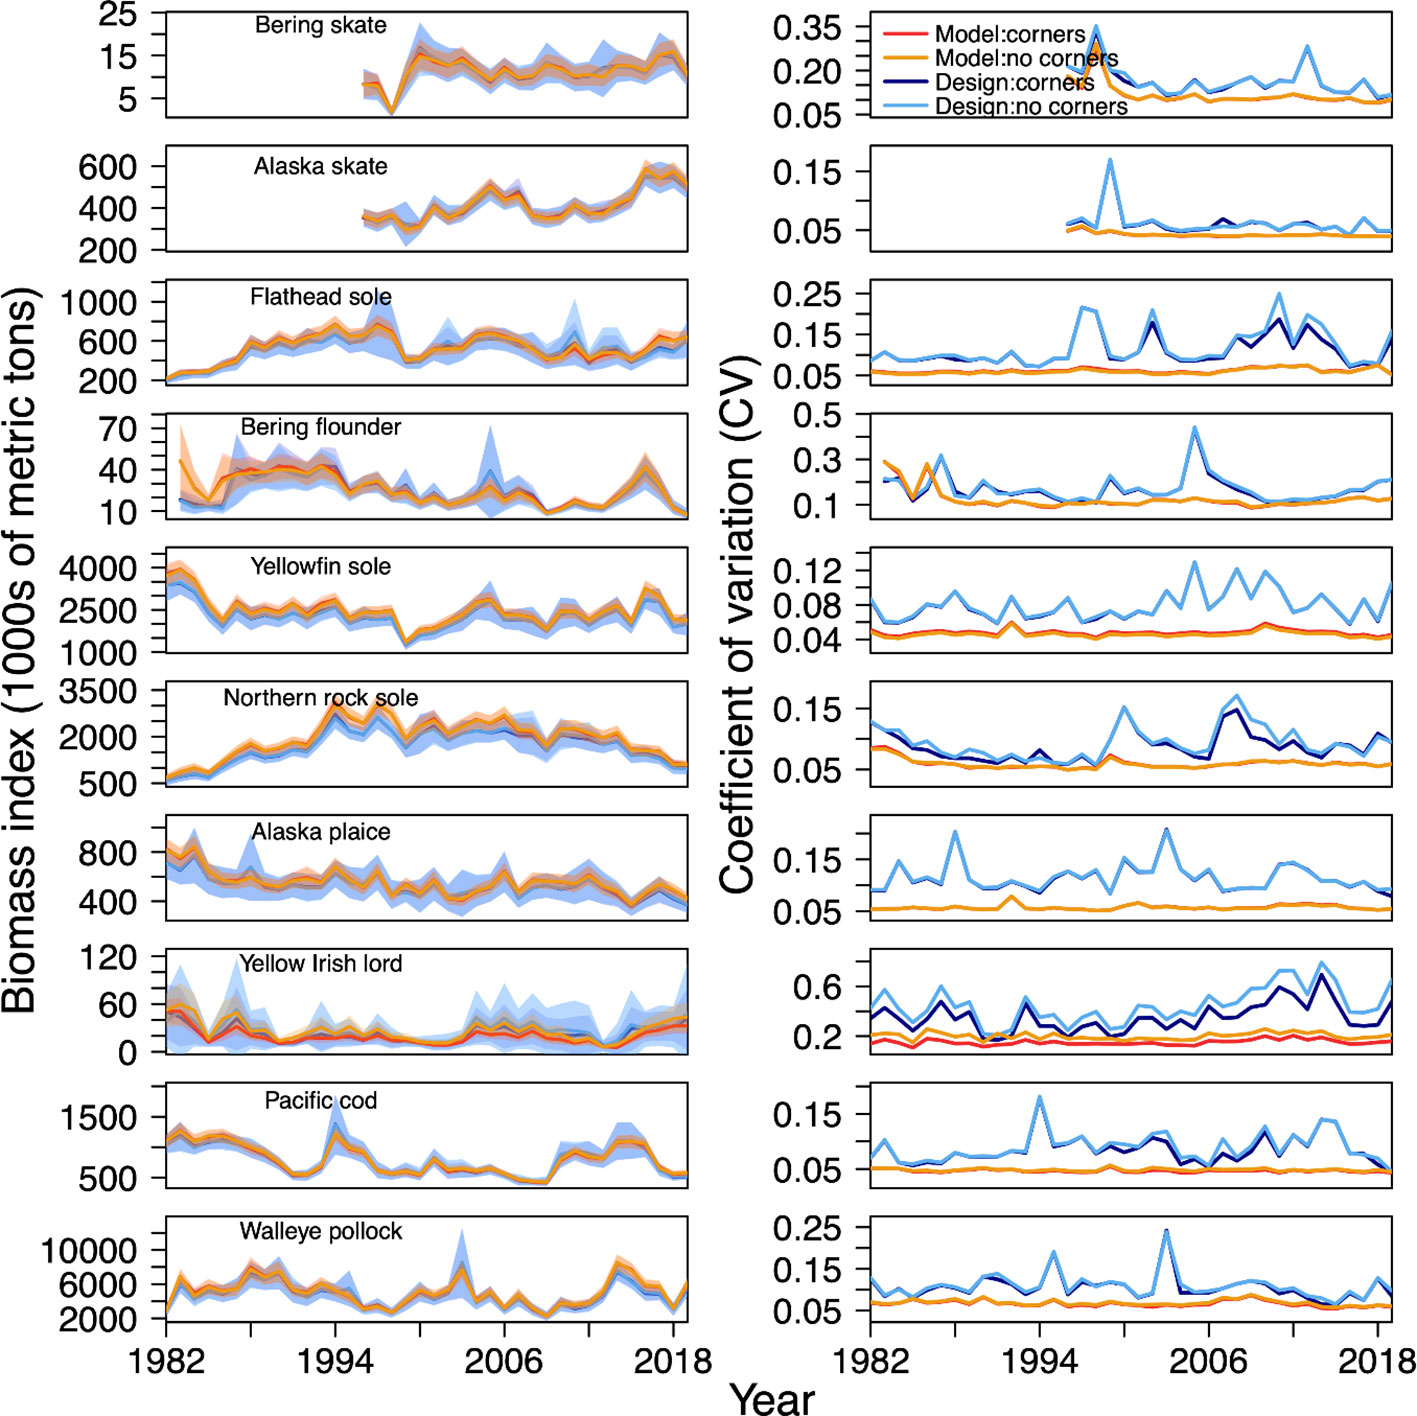
Figure 3 Design and model-based survey biomass estimates (left) and associated CVs (right) produced with and without corner station data for groundfish species. Note that Bering skate and Alaska skate were not distinguished on the NOAA EBS bottom trawl survey until 1996, hence why the time-series for those species do not begin until 1996.
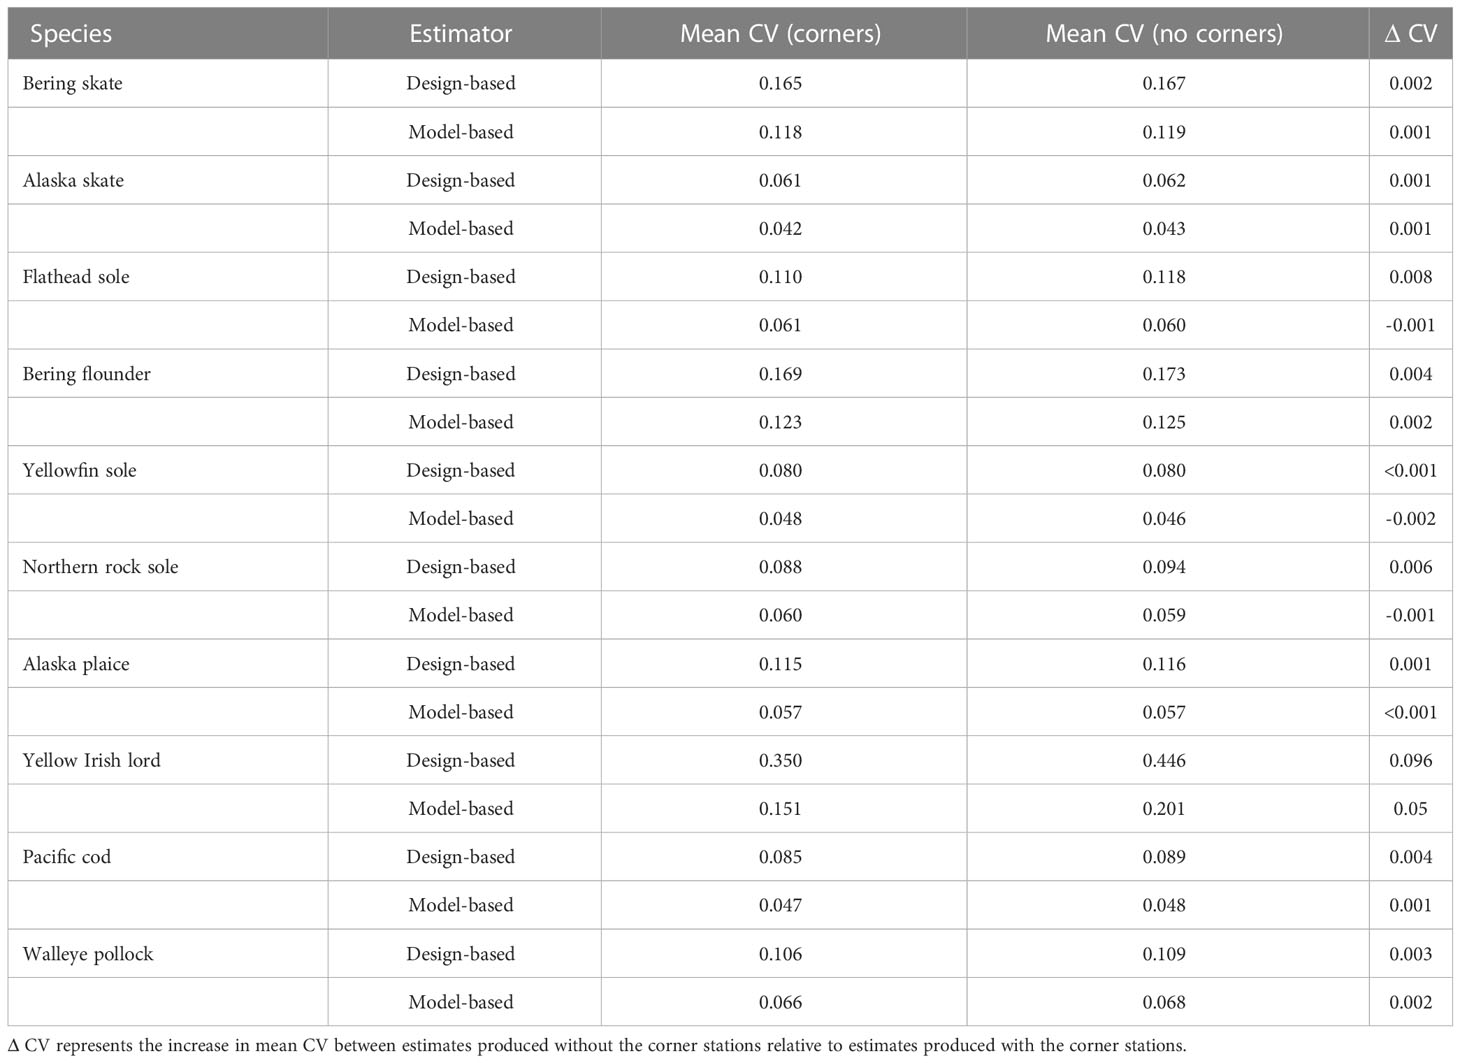
Table 2 Mean coefficients of variation (CV) of design and model-based biomass estimates for groundfish species produced with versus without the corner stations.
3.2 Simulation analyses
For snow and Tanner crab, the accuracy of design and model-based estimates was relatively robust to removal of the corner station data (Figure 4; Table 3). Conversely, the accuracy of biomass estimates for Pribilof blue and red king crab and St. Matthew blue king crab showed more substantial declines resulting from corner station removal (Table 3). The accuracy of model-based biomass estimates for the Pribilof and St. Matthew’s king crab stocks was considerably more robust to corner station removal than were their design-based counterparts (Figure 4; Table 3). For instance, removing simulated corner station data for Pribilof red king crab resulted in declines in accuracy that were an order of magnitude lower for the model-based (Δ MSA=0.170) compared to design-based (Δ MSA=2.106) estimates (Table 3).
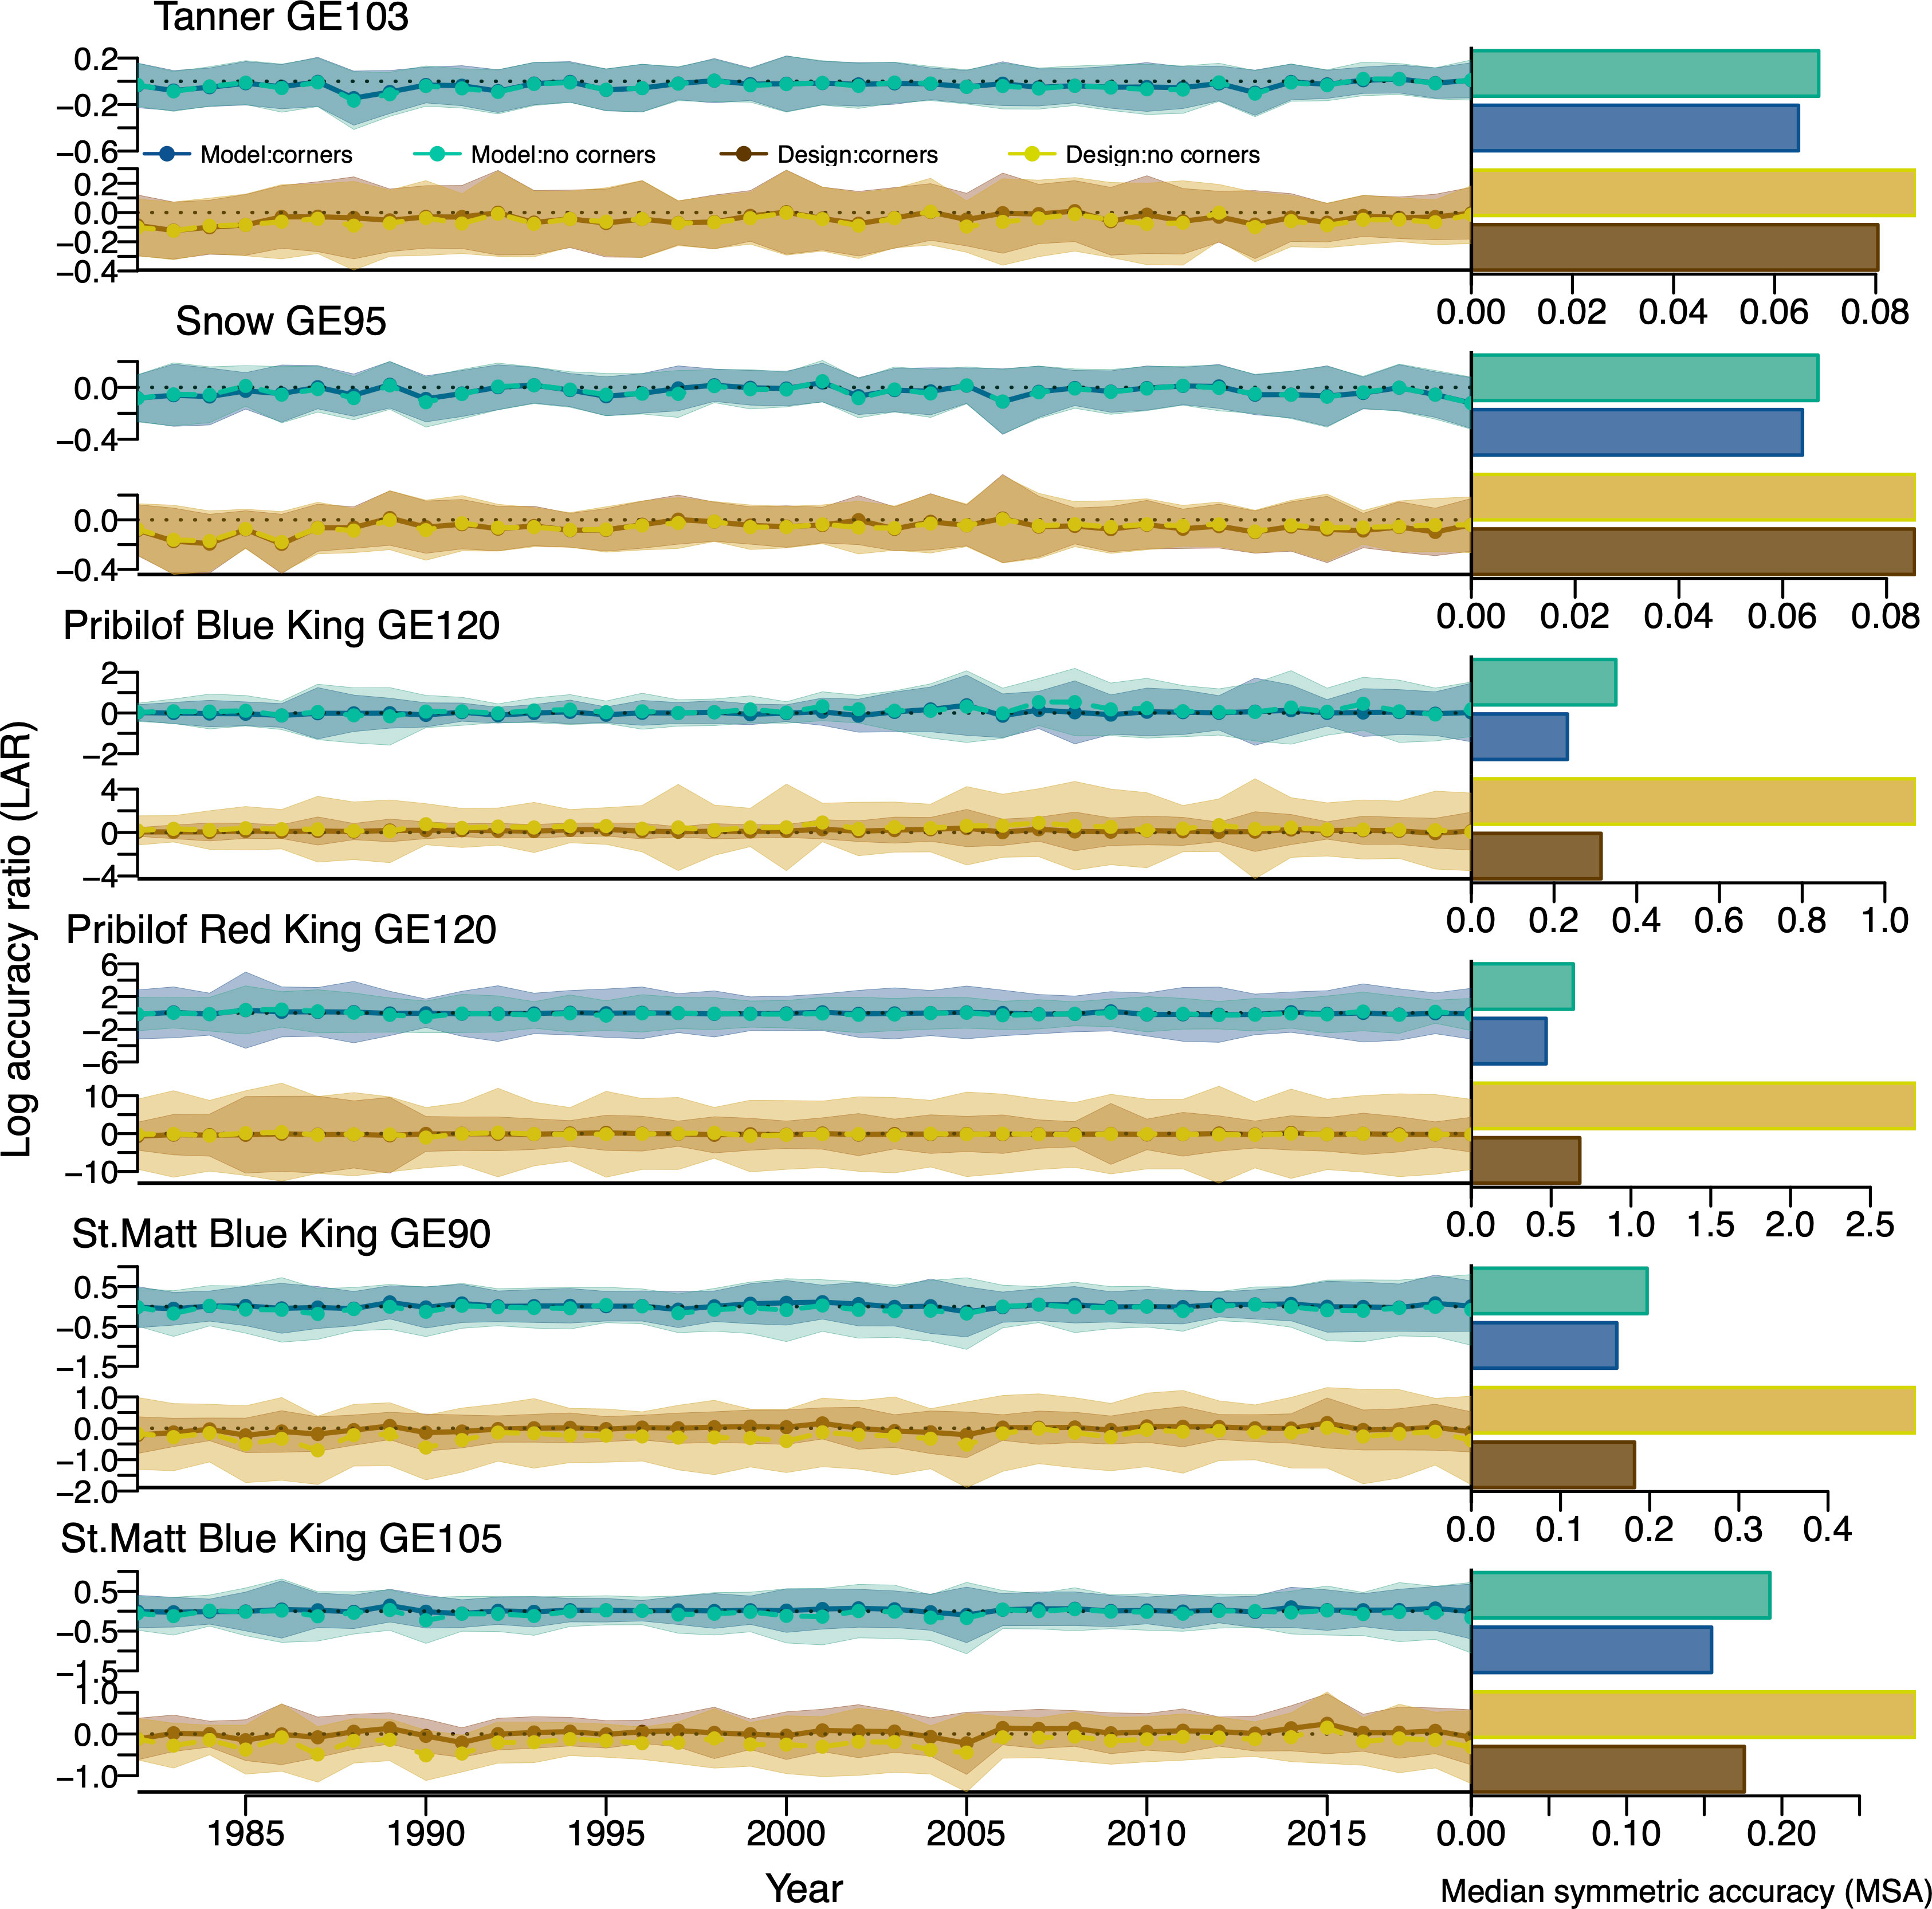
Figure 4 Accuracy of design and model-based survey biomass estimates with and without corner station data for crab stocks/size classes. Time-series on the left show the log accuracy ratio (LAR) over time for design and model-based biomass estimates with and without corner station data. The median LAR across simulation replicates over time is shown as solid/dashed lines, while the 95% distribution across simulation replicates is shown as shaded boundaries. Histograms on the right show the median symmetric accuracy (MSA) across years and simulation replicates. A LAR/MSA value of 0 indicates perfect accuracy while larger values indicate progressively worse accuracy.
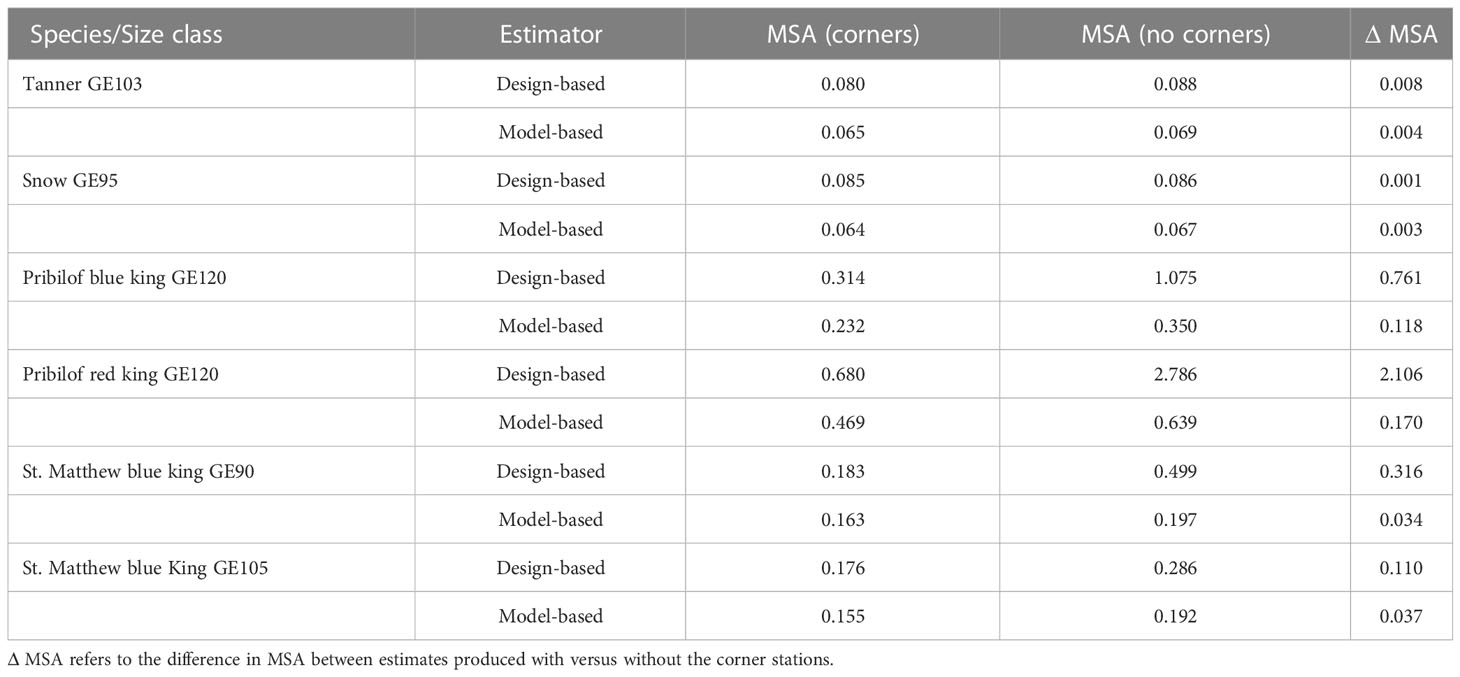
Table 3 Median symmetric accuracy (MSA) of design and model-based biomass estimates for crab species/size classes produced with versus without the corner stations.
For nine of the ten groundfish species we examined, the accuracy of both design and model-based biomass estimates was robust to corner station removal (Figure 5; Table 4). There were modest declines (~13%) in the accuracy of design-based estimates for northern rock sole arising from corner station removal (Table 4). The only species for which substantial declines (~20-30%) in accuracy occurred as a result of removing the corner station data was yellow Irish lord (Table 4). However, the accuracy of both design and model-based biomass estimates for yellow Irish lord was limited even with the corner stations included, and the lowest of any groundfish species that we considered (Figure 5; Table 4).
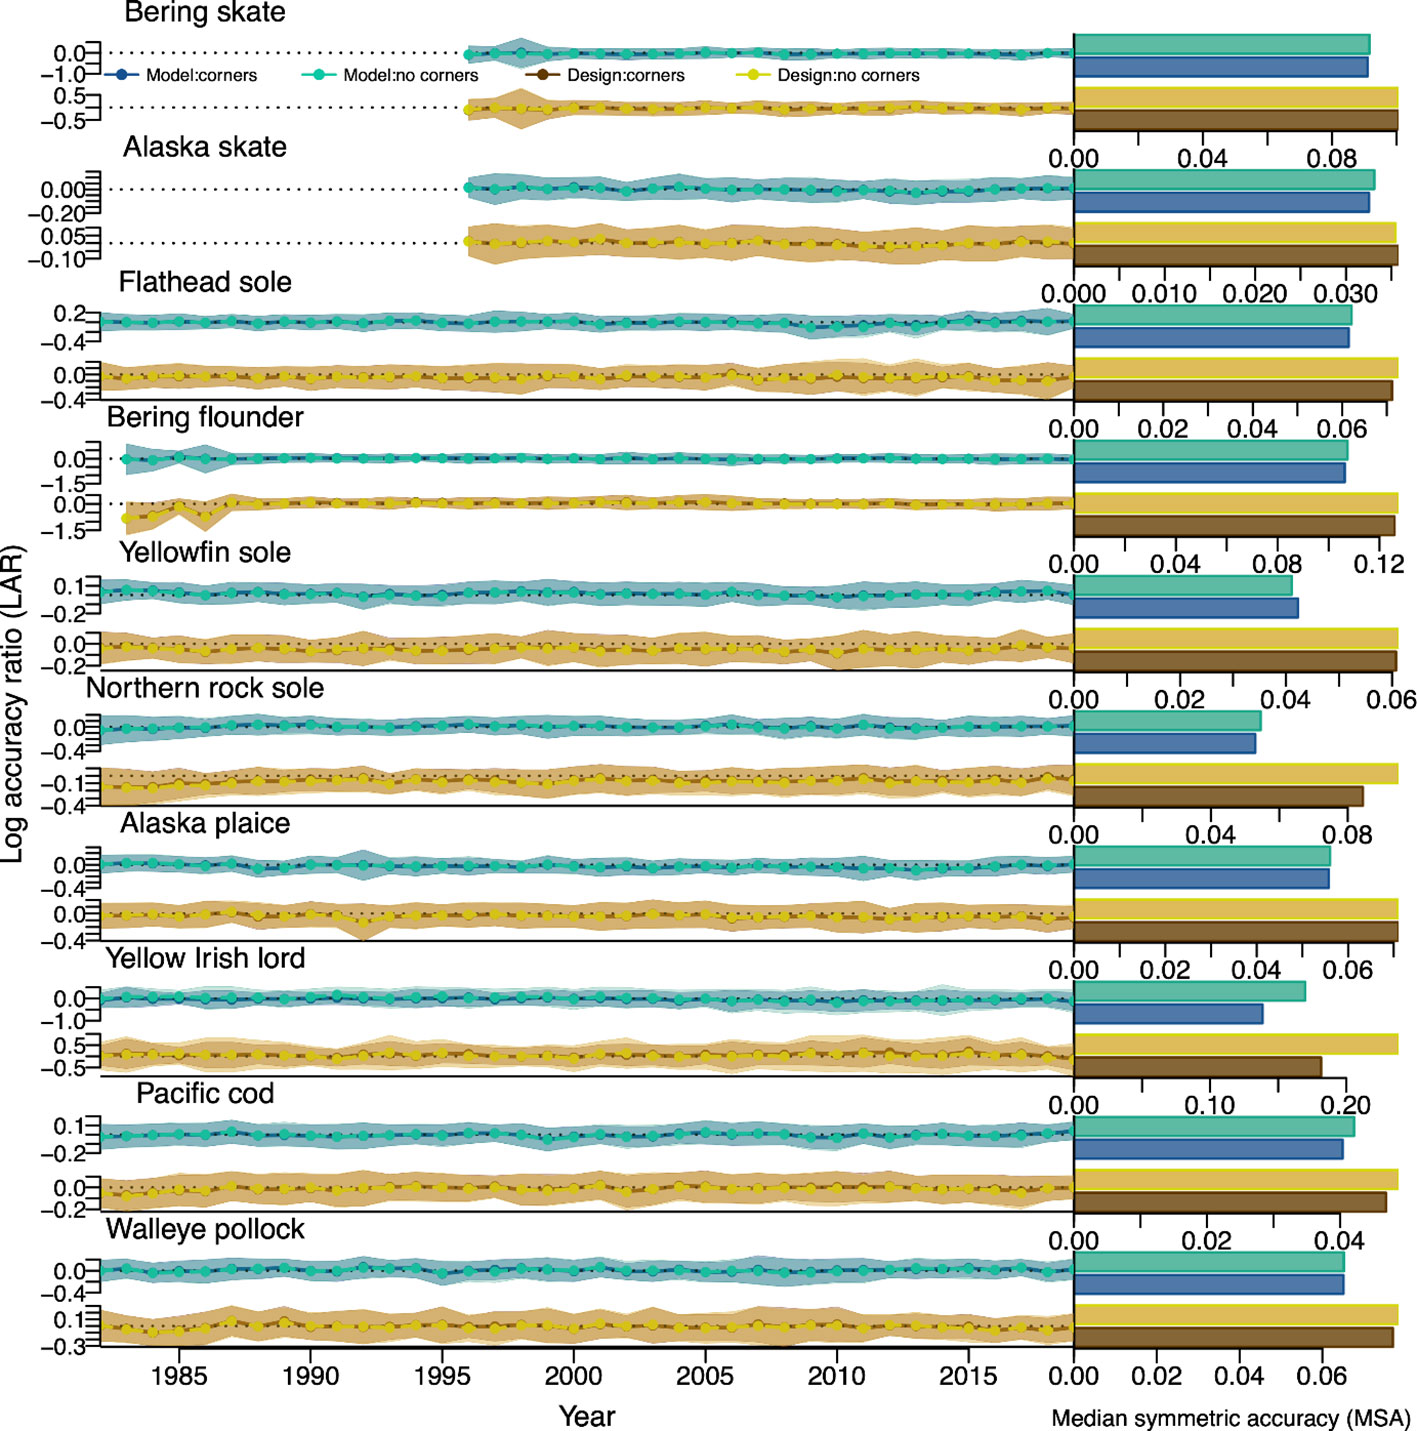
Figure 5 Accuracy of design and model-based survey biomass estimates with and without corner station data for groundfishes. Time-series on the left show the log accuracy ratio (LAR) over time for design and model-based biomass estimates with and without corner station data. The median LAR across simulation replicates over time is shown as solid/dashed lines, while the 95% distribution across simulation replicates is shown as shaded boundaries. Histograms on the right show the median symmetric accuracy (MSA) across years and simulation replicates. A LAR/MSA value of 0 indicates perfect accuracy while larger values indicate progressively worse accuracy.
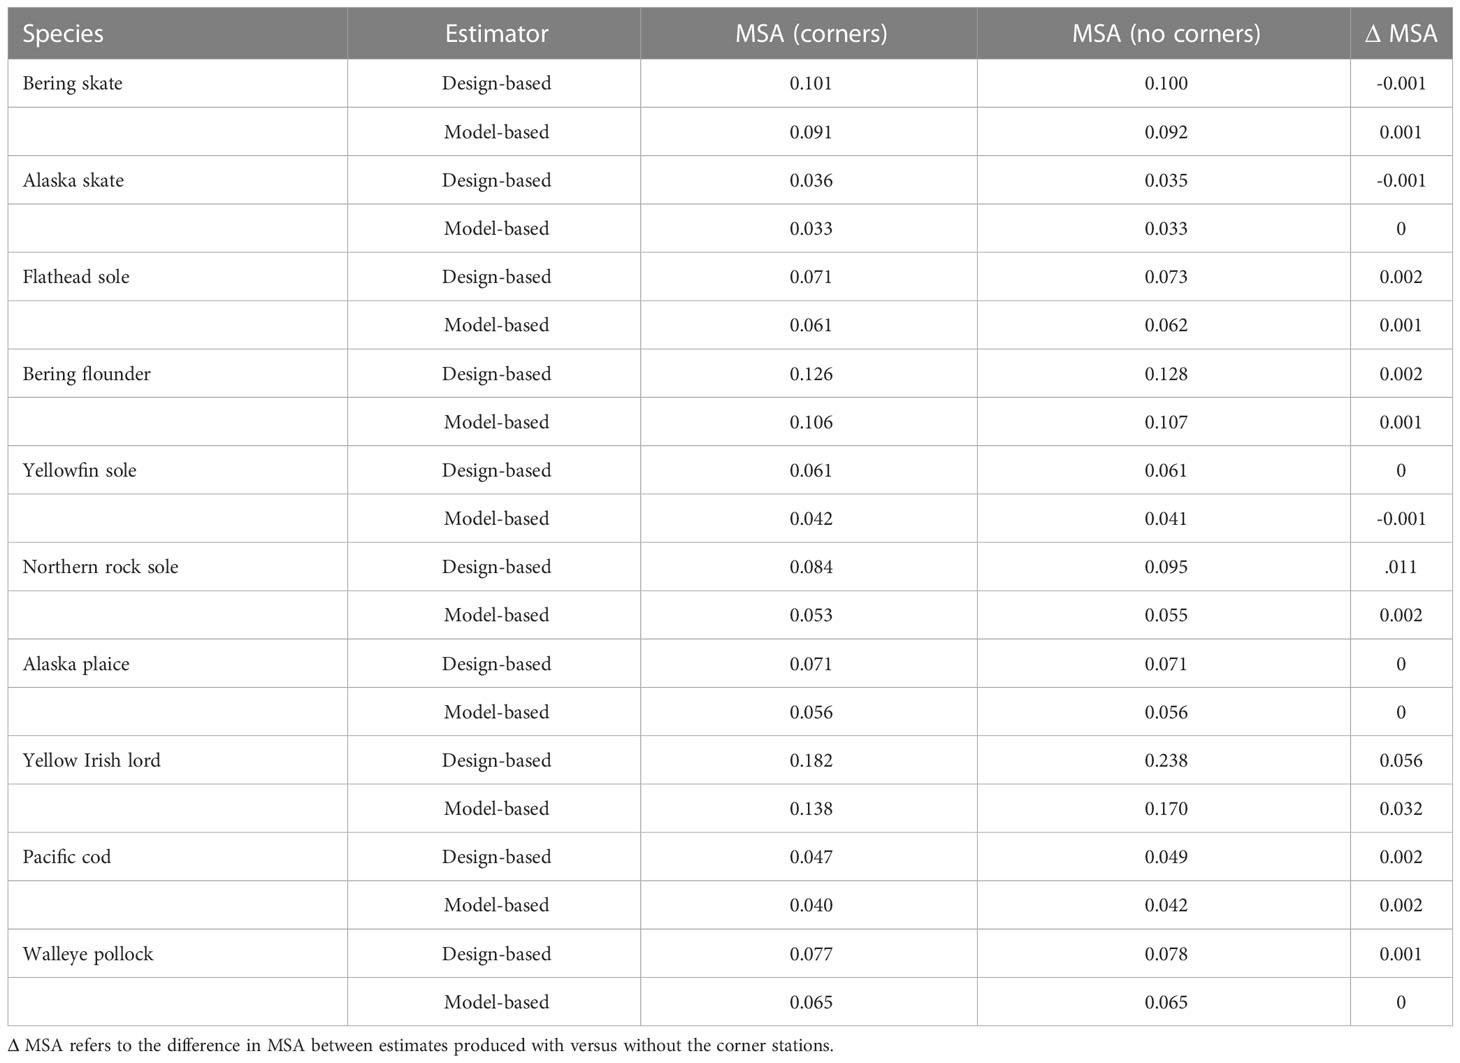
Table 4 Median symmetric accuracy (MSA) of design and model-based biomass estimates for groundfish species produced with versus without the corner stations.
3.3 Stock assessment analyses
Predictions of Tanner crab biomass over time were nearly identical with and without the corner station data for immature and mature males and females (Figure 6). Similarly, estimates of Tanner crab recruitment over time were virtually unchanged (Figure 6), and average recruitment was only marginally greater without the corner station data (Figure 6). Biomass-related reference points were also slightly greater in model runs without the corner station data (Figure 6). The biomass at which maximum spawning potential occurs (B100) was estimated to be ~3.5% greater without the corner station data, while estimates of current and projected biomass were ~5% and ~6% greater respectively without the corner station data. Estimates of fishing mortality rates associated with maximum sustained yield (FMSY) and the overfishing limit (FOFL) were nearly identical regardless of whether the corner station data were included (Figure 6), while estimates of MSY and the overfishing limit (OFL) themselves were ~1.5% and ~4.4% greater without the corner station data. Estimated natural mortality rates for both mature males and females were slightly lower in model runs without the corner station data (Figure S1), likely contributing to the slightly higher estimates of biomass-related reference points.
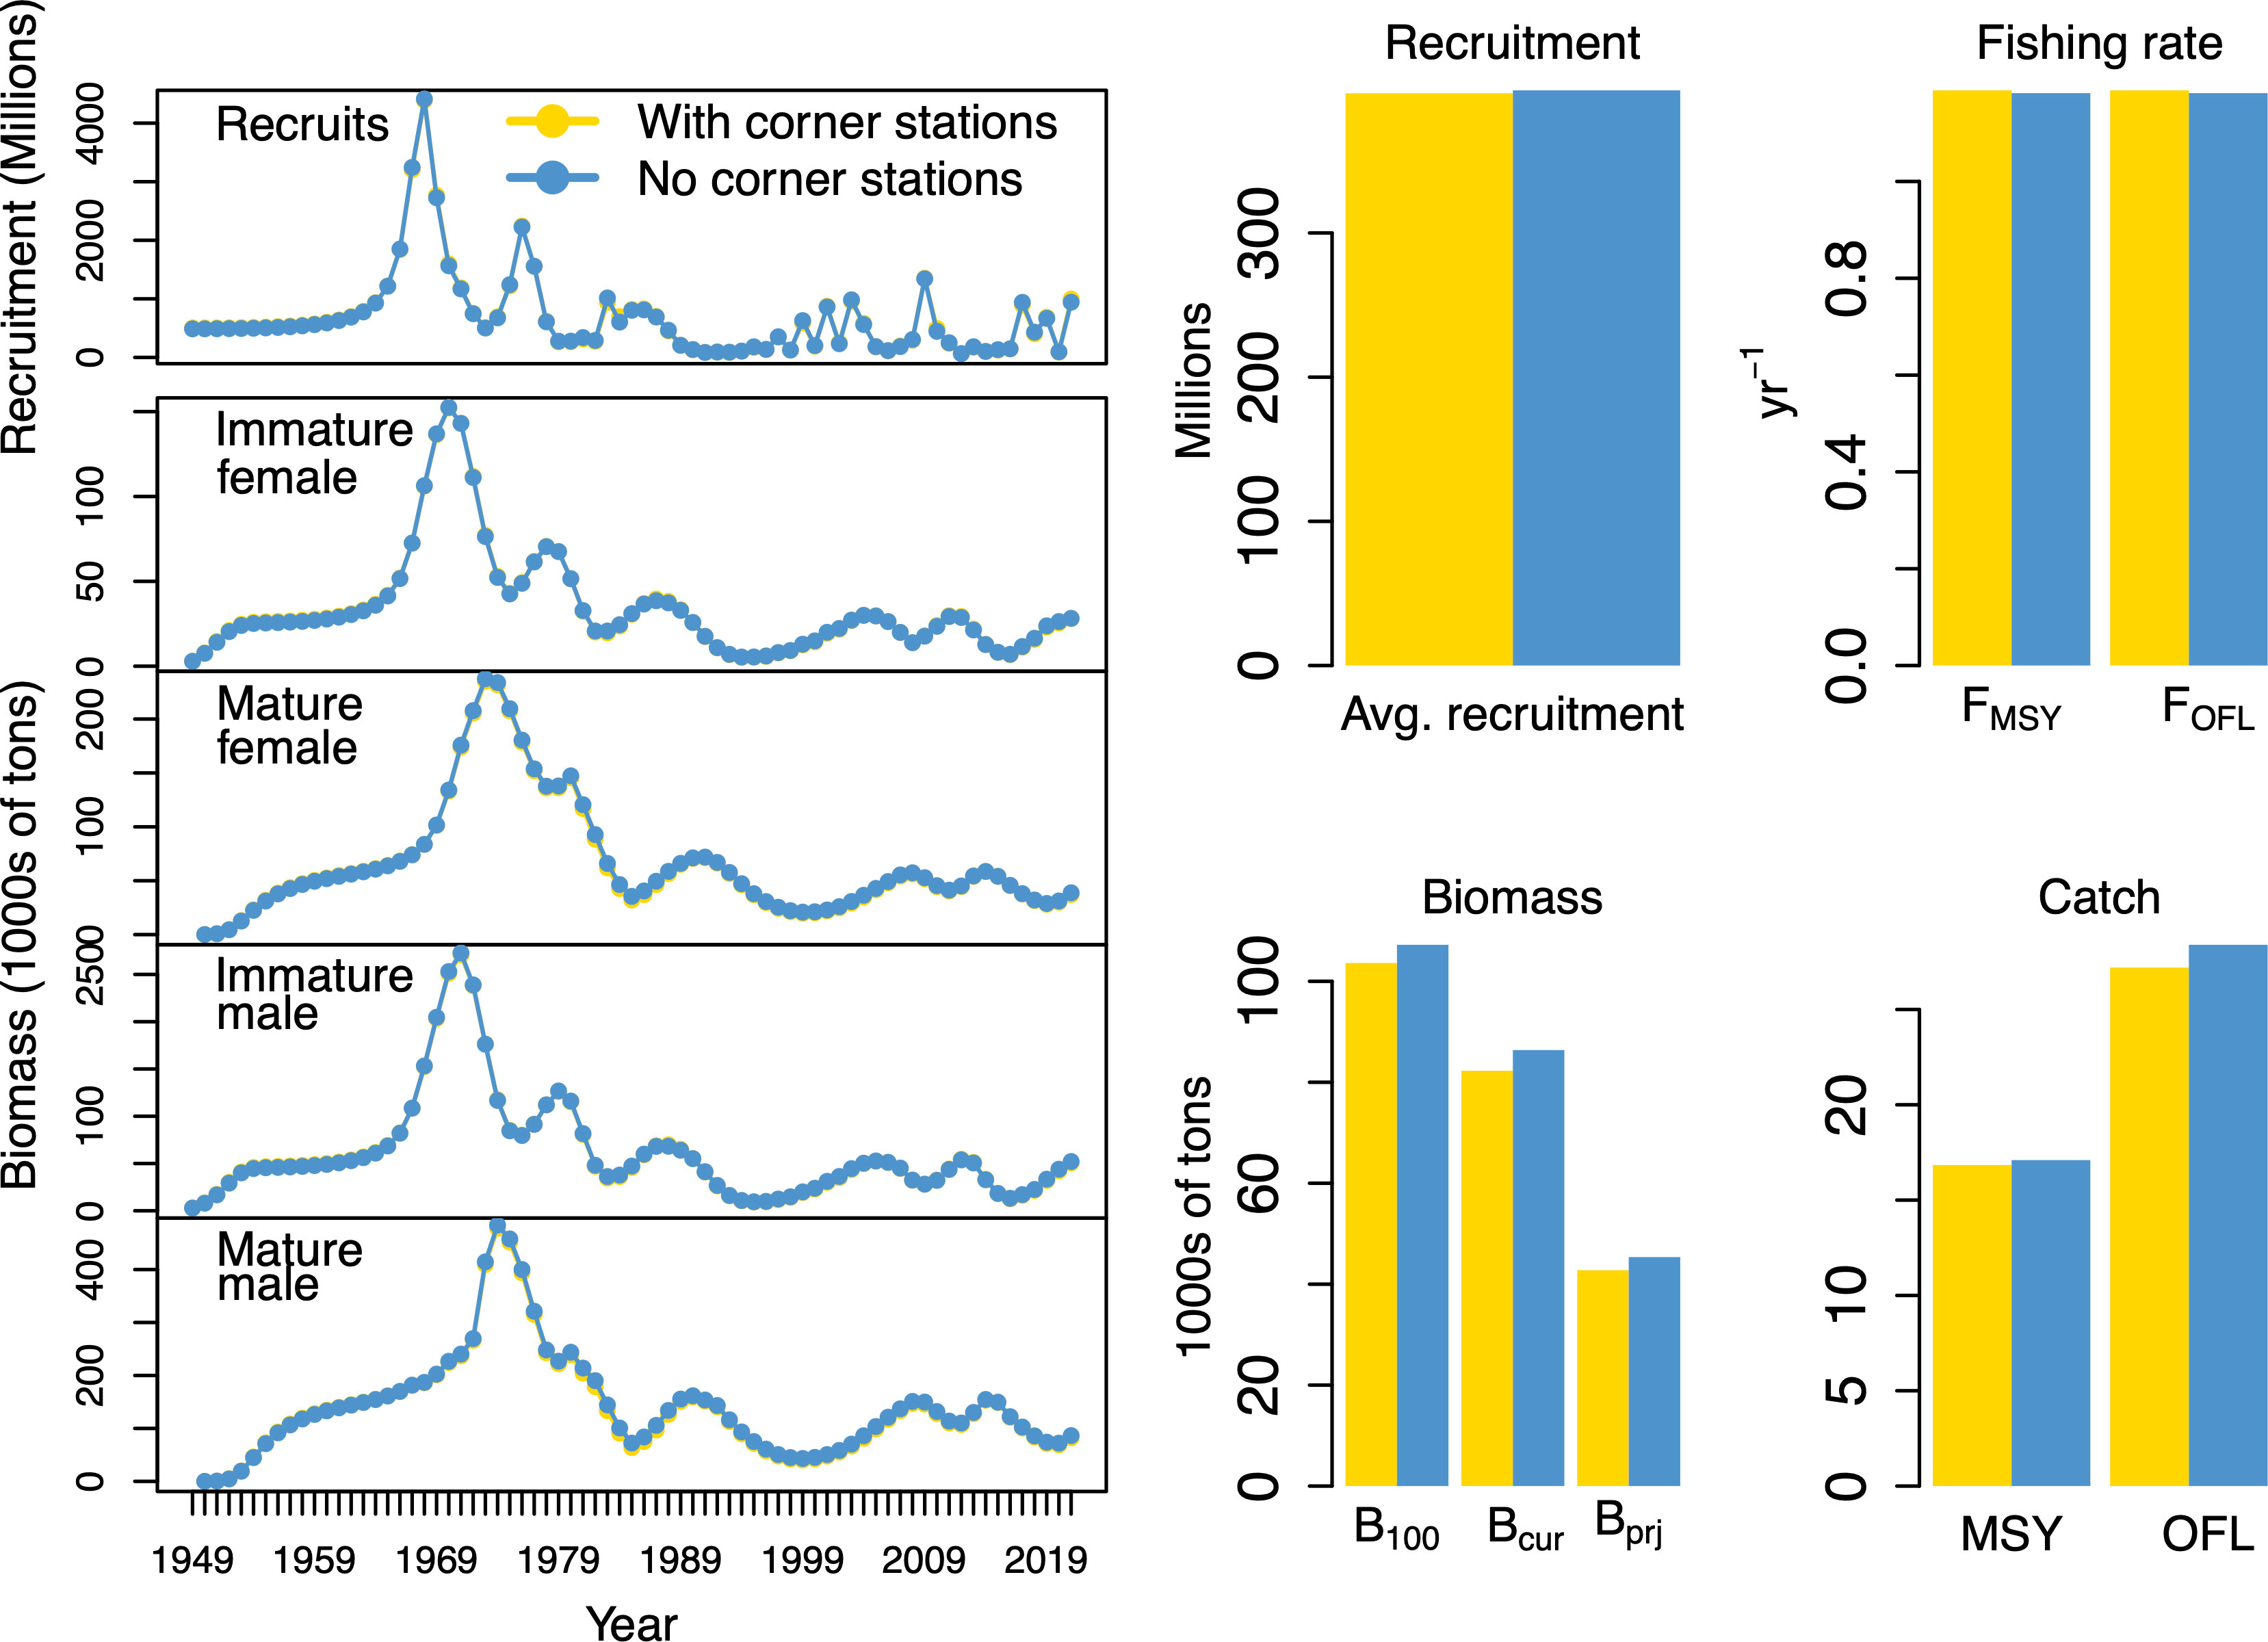
Figure 6 Tanner crab stock assessment model output. Left-hand panels show model predictions with (yellow) and without (teal) corner stations for recruits (top row) immature females (second row), mature females (third row), immature males (fourth row), and mature males (fifth row). Barplots on the right show estimated tanner crab reference points produced with (yellow) and without (teal) corner stations. Average recruitment is shown in the top left barplot. Biomass-related reference points are shown in the top-right barplots, including B100, current biomass (Bcur), and projected biomass (Bprj). Estimates of fishing mortality rates associated with MSY (FMSY) and the OFL (FOFL) are shown in the bottom barplots. Estimates of MSY and OFL themselves are shown in the bottom right barplot.
Stock assessment model runs for St. Matthew blue king crab completed without the corner station data resulted in biomass estimates that were slightly lower than those produced with the corner station data (Figure 7). However, the biomass time-series of these two scenarios were highly correlated with one another (lag-zero cross correlation coefficient = 0.998), exhibiting nearly identical trends (Figure 7). Estimates of BMSY and mature male biomass (MMB) produced without the corner stations were 324 tons and 166 tons lower respectively compared to model fits that included corner station data (Figure 7). However, the estimated ratio of current biomass relative to BMSY (B/BMSY) was identical regardless of corner station inclusion (Figure 7). Model predictions of recruitment over time were similar regardless of corner station inclusion, though average recruitment was slightly lower in the absence of the corner station data (Figure 7). The estimated overfishing limit from model runs without the corner station data was 0.01 tons lower compared to model runs that included corner station data (Figure 7).
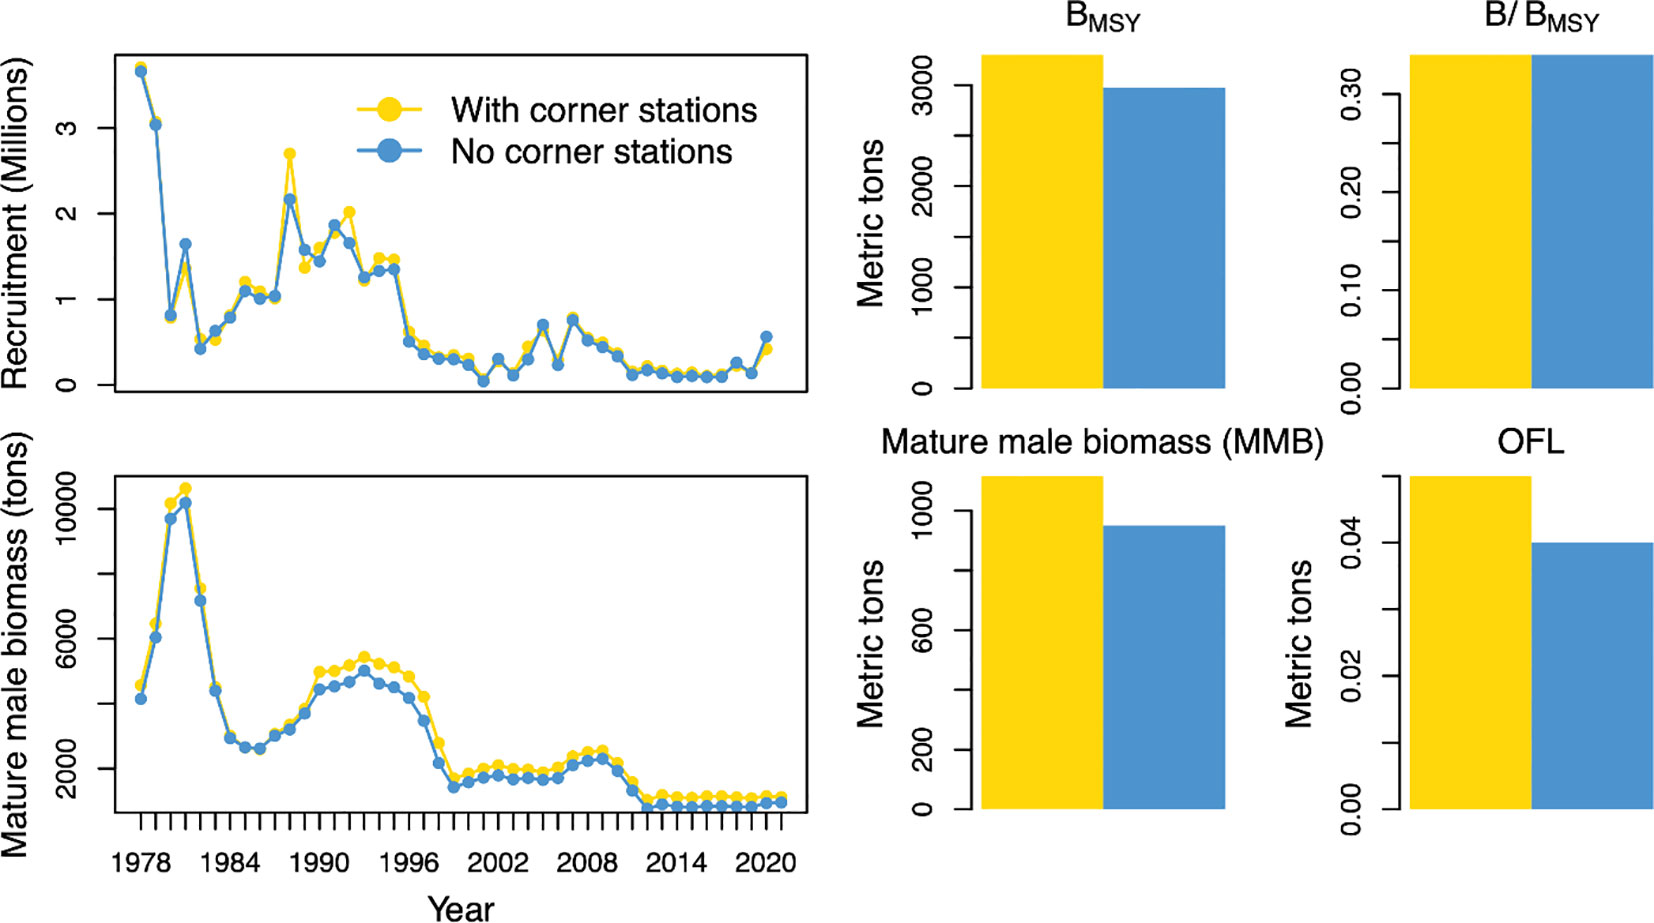
Figure 7 St. Matthew blue king crab stock assessment model output. Left-hand panels show model predictions with (yellow) and without (teal) corner stations for recruits (top row) mature male biomass (second row). Barplots on the right show estimated reference points produced with (yellow) and without (teal) corner stations. The biomass at which maximum sustained yield (BMSY) is shown in the top left barplot, and the ratio of current biomass to BMSY (B/BMSY) is shown in the top right barplot. The current level of mature male biomass is shown in the bottom left barplot, and the estimated overfishing limit (OFL) is shown in the bottom right barplot.
4 Discussion
The crab stocks for which corner station removal had the greatest impacts on data quality were those whose distributions are concentrated around St. Matthew and the Pribilof Islands. However, it is important to note that the uncertainty in these stocks’ data products was often substantial even with the corner station data included. The difficulty of producing high quality biomass estimates for the St. Matthew and Pribilof Island king crab stocks may be partially due to these species’ associations with hard-bottom habitats that the EBS bottom trawl survey cannot sample effectively (e.g., female blue king crab; Vølstad, 2012; Zacher et al., 2020), and/or limited ranges and low abundance levels (e.g., Pribilof red king crab; Zacher et al., 2020). At such levels of uncertainty, the contributions these data make to stock assessment models are limited and further declines in precision from corner station removal may not represent a meaningful erosion of their information content. For instance, the annual survey biomass estimates for Pribilof blue and red king crab are considered too variable and uncertain for use in stock assessment models even with the corner station data, such that these assessments rely on post hoc smoothing of the survey biomass time series (Stockhausen, 2021a; Szuwalski, 2022). In some cases the declines in data precision and accuracy arising from corner station removal were mitigated to some extent by using a model-based versus design-based estimator.
The impacts of corner station removal on both the precision and accuracy of biomass estimates were minor for all groundfish species that we investigated except for yellow Irish lord, which exhibits high concentrations around the Pribilof Islands (Figure S2). The other groundfish species we examined exhibit broader distributions, either due to lack of association with the St. Matthew or Pribilof Island habitat areas or because their distributions are more strongly driven by dynamic environmental conditions than by static habitat characteristics. For instance, Alaska skate are widely distributed throughout the outer EBS shelf area (Figure S3), and yellowfin sole are broadly associated with shallow, inshore areas of the shelf (Figure S4). Moreover, many groundfishes are mobile and alter their distributions in response to environmental conditions. For example, walleye pollock and Pacific cod actively avoid a mass of <2° C subsurface water (the cold pool) that occurs on the EBS shelf (Wyllie-Echeverria and Wooster, 1998; Kotwicki and Lauth, 2013). As such, static habitat associations are likely a less important component of these species’ distributions. Importantly, with the exception of yellow Irish lord (which does not have a stock assessment and is of no commercial importance) it is unlikely that the removal of corner stations from the EBS survey would meaningfully impact estimates of stock status or management recommendations for any of the groundfish species we examined.
Our analysis of the effects of corner station removal on stock assessment outcomes showed negligible effects for Tanner crab. The Tanner crab assessment model predictions were nearly identical regardless of whether or not the corner station data were included. The only appreciable changes in model output arising from corner station removal were marginally greater estimates of biomass-related reference points and the OFL, likely attributable to the slightly lower estimates of natural mortality produced without the corner station data. Such minor changes in model predictions and reference points seem unlikely to affect decision-making for this stock, indicating that assessment and management of Tanner crab would be robust to removal of the corner stations.
Not surprisingly, we found somewhat greater effects of corner station removal on stock assessment output for St. Matthew blue king crab. Assessment model predictions made without the corner station for this stock indicated slightly lower mature male biomass and recruitment over time compared to baseline model output that included the corner stations. However, the trends in biomass and recruitment were nearly identical regardless of corner station inclusion. Despite the minor differences between time-series produced with versus without the corner stations, the coherence of trends across data scenarios suggests that ability to detect stock recovery would not be impaired without the corner station data. Similarly, the estimated ratio of current biomass relative to BMSY (B/BMSY), the reference point used for tracking stock rebuilding, was not affected by removal of the corner station data. As such, despite the substantial effects of corner station removal on survey data products for St. Matthew blue king crab, it does not appear that there is a correspondingly appreciable effect on assessment outcomes for this stock, at least with respect to monitoring stock rebuilding. This may be partially due to the fact that the EBS bottom trawl survey data is not the only source of fisheries-independent data that are used in the St. Matthew blue king crab stock assessment, the other being the Alaska Department of Fish and Game (ADFG) pot survey (Palof, 2022).
While our analysis focuses on the effects of survey effort reduction on stock assessment inputs (survey data products) and outputs (biological/management reference points), there are other objectives that can be important to fisheries and ecosystem management. For instance, there may be benefits to finer-scale sampling of ecologically important areas – beyond those to stock assessment outcomes – in improving understanding of crucial habitats. Indeed, the Pribilof Islands are important habitat for many fish, invertebrate, seabird and marine mammal species (Craighead and Oppenheim, 1985; Gentry, 1998; Ferrero et al., 2000) and one of the most productive regions in the Bering Sea (Cooney and Coyle, 1982; Coyle and Cooney, 1993), with oceanographic and ecological dynamics that are distinct from the rest of the EBS shelf (Hunt et al., 2008; Ciannelli et al., 2004). However, it is difficult to quantitatively assess the value of finer-scale survey observations for understanding ecological and oceanographic processes. Nonetheless, objectives beyond utility to stock assessment such as ecosystem considerations may be important to managers, and it is important to note that such concerns cannot be assessed using the approach we present here.
We found that the stocks for which corner station removal caused substantial declines in data quality were also those with the lowest quality data to begin with. This result suggests that while sampling the corner stations may improve data quality for some stocks, the extent of improvement may not be sufficient to produce satisfactorily informative data products. The limited data quality for Pribilof and St. Matthew king crab and yellow Irish lord may simply reflect the fact that the EBS bottom trawl survey is not optimized for sampling certain species, a challenge that naturally arises in fisheries-independent survey designs with multispecies objectives (Cochran, 1977; Godo, 1994; Oyafuso et al., 2021). Data quality for these stocks may be more effectively improved by alternative approaches beyond increased bottom trawl sampling density, such as expanded collection of other forms of fisheries-independent data (e.g., pot surveys for king crab; Gish and Vanek, 2010; Palof, 2022), or building capacity for generating and using model-based indices (Thorson, 2019). While we found that model-based biomass estimates were more robust to corner station removal than their design-based counterparts, adequate model performance was difficult to achieve in some cases (e.g., St. Matthew blue king crab, Pribilof red and blue king crab) and stock assessments for Bering Sea crab still rely entirely on design-based abundance and compositional estimates (Stockhausen, 2014; Szuwalski et al., 2014; Szuwalski and Turnock, 2016; Palof et al., 2020; Stockhausen, 2021a; Stockhausen, 2021b; Szuwalski, 2022). Continued innovation in model-based index production methods for crab, as well as expanded capacity to use model-based indices in crab assessment models may lead to improved inference on stock status and mitigate adverse consequences from potential survey effort reduction. Model-based indices can also incorporate environmental covariates to facilitate extrapolation to unsampled areas (Thorson, 2019; O'Leary et al., 2022) which may also help offset the impacts of reductions in sampling effort.
While stock assessment models are sensitive to the precision of input data, reductions in data quality beyond a certain point may not exert a corresponding effect on their information content. This is due to the integrated design of many contemporary stock assessment models (including those for Tanner and St. Matthew blue king crab), in which multiple data sources contribute to parameter estimates via a joint likelihood (Fournier and Archibald, 1982; Maunder and Punt, 2013). In such integrated models, the greater the uncertainty in one data source, the less information it will contribute to the model, whether by explicit data weighting procedures (e.g., Francis, 2011) or via the joint likelihood itself (e.g., DeFilippo et al., 2021). In our analysis, this effect is best demonstrated by St. Matthew blue king crab, for which corner station removal had a minor effect on assessment model outputs despite exerting a large influence on the input survey data products. This result emphasizes the importance of propagating the impacts of survey effort reduction through stock assessment models to understand the impacts of proposed survey design changes. Indeed, contemporary stock assessment models are complex, with multiple contributing (and often conflicting) sources of information that can interact to affect parameter estimates in unpredictable ways (Maunder and Punt, 2013; Ichinokawa et al., 2014; Peterson et al., 2021).
The approach we demonstrate here is flexible and can be used to evaluate the potential effects of removing any set of existing stations from a systematic fisheries-independent survey. The corner stations we considered for removal in our analysis were selected because they represent an area of higher sampling density than the rest of the survey grid and because the stocks that motivated their implementation have remained below harvestable levels for a prolonged period of time. However, there are other situations in which a set of stations may be identified a priori as candidates for removal. For instance, a particular area within a survey’s boundaries may be under consideration for wind energy development or MPA designation, or become inaccessible due to political (e.g., international strife) or logistical (e.g., prohibitive fuel costs for reaching remote areas) reasons (Field et al., 2006; ICES, 2020; Methratta et al., 2020; Hare et al., 2022; ICES, 2023). In such scenarios, scientists could follow the general approach outlined here to quantify the expected impacts of removing the stations in question on data quality and stock assessment outcomes. These results could be used to understand and predict the impacts of the effort reduction on scientific inference, and/or be used to develop calibration factors to correct for these effects in the survey data time series. Conversely, there may be a need to reduce sampling effort more generally (e.g., due to budgetary and staffing shortages), without a specific subset of stations indicated as leading options for removal (ICES, 2020; ICES, 2023). In response to such a need to reduce sampling effort without obvious candidates for station removal, scientists may use our approach to evaluate a range of alternative scenarios (e.g., thinning the sampling density of the entire survey grid by a specified fraction, removing stations from various areas based on expert opinion), and compare the impacts of each effort reduction scenario on data quality and stock assessment output to inform decision-making.
While evaluating the effects of station removal on all survey data products and stock assessment outcomes is optimal, scientists may prioritize certain stocks to focus effort on (e.g., crab in our case study) and conduct more limited investigations on others for which expected impacts are lower (e.g., groundfish in our case study). As shifting ecosystems and species distributions place growing demands on fisheries-independent monitoring amid rising costs and limited institutional budgets, unavoidable reductions in survey effort are likely to become increasingly common (ICES, 2020; ICES, 2023). Consequently, it is imperative that scientists can evaluate the effects of survey effort reductions to inform decision-making on such actions and understand their consequences. The analysis we present here demonstrates a generic set of steps for evaluating reductions in sampling density for systematic survey designs that can be applied in similar situations elsewhere to provide a quantitative basis for decision-making.
Data availability statement
Publicly available datasets were analyzed in this study. This data can be found here: https://www.fisheries.noaa.gov/foss/f?p=215%3A28.
Ethics statement
The manuscript presents research on animals that do not require ethical approval for their study.
Author contributions
SK and LD conceived the study. LD designed and executed the analyses and wrote the paper. WS and KP conducted and helped interpret the stock assessment model runs. JR and ML contributed crab data and input on their use and interpretation. LB, LD, and SK contributed input on interpreting study results. All authors contributed to manuscript writing. All authors contributed to the article and approved the submitted version.
Conflict of interest
The authors declare that the research was conducted in the absence of any commercial or financial relationships that could be construed as a potential conflict of interest.
Publisher's note
All claims expressed in this article are solely those of the authors and do not necessarily represent those of their affiliated organizations, or those of the publisher, the editors and the reviewers. Any product that may be evaluated in this article, or claim that may be made by its manufacturer, is not guaranteed or endorsed by the publisher.
Supplementary material
The Supplementary Material for this article can be found online at: https://www.frontiersin.org/articles/10.3389/fmars.2023.1219283/full#supplementary-material
References
Brown R. W., Fogarty M., Legault C., Miller T., Nordahl V., Politis P., et al. (2007). Survey transition and calibration of bottom trawl surveys along the northeastern continental shelf of the United States. Int. Council Explor. Sea CM.
Cadigan N. G., Dowden J. J. (2010). Statistical inference about the relative efficiency of a new survey protocol, based on paired-tow survey calibration data. Fishery Bull. 108 (1).
Cadigan N., Yin Y., Benoît H. P., Walsh S. J. (2022). A nonparametric-monotone regression model and robust estimation for paired-tow bottom-trawl survey comparative fishing data. Fisheries Res. 254, 106422. doi: 10.1016/j.fishres.2022.106422
Cao J., Thorson J. T., Richards R. A., Chen Y. (2017). Spatiotemporal index standardization improves the stock assessment of northern shrimp in the Gulf of Maine. Can. J. Fisheries Aquat. Sci. 74 (11), 1781–1793. doi: 10.1139/cjfas-2016-0137
Chen Y., Chen L., Stergiou K. I. (2003). Impacts of data quantity on fisheries stock assessment. Aquat. Sci. 65 (1), 92–98. doi: 10.1007/s000270300008
Ciannelli L., Robson B. W., Francis R. C., Aydin K., Brodeur R. D. (2004). Boundaries of open marine ecosystems: an application to the Pribilof Archipelago, southeast Bering Sea. Ecol. Appl. 14 (3), 942–953. doi: 10.1890/03-5016
Cooney R. T., Coyle K. O. (1982). Trophic implications of cross-shelf copepod distributions in the southeastern Bering Sea. Mar. Biol. 70 (2), 187–196. doi: 10.1007/BF00397684
Coyle K. O., Cooney R. T. (1993). Water column sound scattering and hydrography around the Pribilof Islands, Bering Sea. Continental Shelf Res. 13 (7), 803–827. doi: 10.1016/0278-4343(93)90028-V
Craighead F. L., Oppenheim J. (1985). “Population estimates and temporal trends of Pribilof Island seabirds,” in Outer Continental Shelf Environmental Assessment Program (OCSEAP) (Anchorage Alaska:U.S. Department of Commerce) Final Report, vol. 30. , 307–356.
DeFilippo L. B., Buehrens T. W., Scheuerell M., Kendall N. W., Schindler D. E. (2021). Improving short-term recruitment forecasts for coho salmon using a spatiotemporal integrated population model. Fisheries Res. 242, 106014. doi: 10.1016/j.fishres.2021.106014
DeFilippo L. B., Thorson J. T., O'Leary C. A., Kotwicki S., Hoff J., Ianelli J. N., et al. (2023). Characterizing dominant patterns of spatiotemporal variation for a transboundary groundfish assemblage. Fisheries Oceanography. doi: 10.1111/fog.12651
Dulvy N. K., Rogers S. I., Jennings S., Stelzenmüller V., Dye S. R., Skjoldal H. R. (2008). Climate change and deepening of the North Sea fish assemblage: a biotic indicator of warming seas. J. Appl. Ecol. 45 (4), 1029–1039. doi: 10.1111/j.1365-2664.2008.01488.x
Ferrero R. C., DeMaster D. P., Hill P. S., Muto M., Lopez A. L., Brix K. (2000). Alaska marine mammal stock assessment. NOAA technical memorandum NMFS-AFSC. p 119.
Field J. C., Punt A. E., Methot R. D., Thomson C. J. (2006). Does MPA mean ‘Major Problem for Assessments'? Considering the consequences of place-based management systems. Fish Fisheries 7 (4), 284–302. doi: 10.1111/j.1467-2979.2006.00226.x
Fournier D., Archibald C. P. (1982). A general theory for analyzing catch at age data. Can. J. Fisheries Aquat. Sci. 39 (8), 1195–1207. doi: 10.1139/f82-157
Francis R. C. (2011). Data weighting in statistical fisheries stock assessment models. Can. J. Fisheries Aquat. Sci. 68 (6), 1124–1138. doi: 10.1139/f2011-025
Gentry R. L. (1998). Behavior and ecology of the northern fur seal Vol. 382 (Princeton, New Jersey: Princeton University Press).
Gish R. K., Vanek V. A. (2010). Project operational plan for the 2010 St. Matthew Island blue king crab survey (Kodiak: Alaska Department of Fish and Game, Regional Information Report 4K10-12).
Godo O. R. (1994). “Factors affecting the reliability of groundfish abundance estimates from bottom trawl surveys,” in Marine fish behavior in capture and abundance estimation. (Hoboken New Jersey:Wiley and Sons)
Hare J., Blythe B., Ford K., Hooker B., Jensen B., Lipsky A., et al. (2022). NOAA fisheries and BOEM federal survey mitigation implementation strategy - northeast U.S. Region. NOAA Technical Memorandum 292, 33. doi: 10.25923/jqse-x746
Hunt G. L. Jr., Stabeno P. J., Strom S., Napp J. M. (2008). Patterns of spatial and temporal variation in the marine ecosystem of the southeastern Bering Sea, with special reference to the Pribilof Domain. Deep Sea Res. Part II: Topical Stud. Oceanography 55 (16-17), 1919–1944. doi: 10.1016/j.dsr2.2008.04.032
ICES (2020). Workshop on unavoidable survey effort reduction (WKUSER). ICES Sci. Rep. 2. doi: 10.17895/ices.pub.7453. 72.92pp(ICES, 2020).
ICES (2023). Workshop on unavoidable survey effort reduction 2 (WKUSER2). ICES Sci. Rep. doi: 10.17895/ices.pub.22086845.v1
Ichinokawa M., Okamura H., Takeuchi Y. (2014). Data conflict caused by model mis-specification of selectivity in an integrated stock assessment model and its potential effects on stock status estimation. Fisheries Res. 158, 147–157. doi: 10.1016/j.fishres.2014.02.003
Jadamec L. S., Donaldson W. E., Cullenberg P. (1999). Biological field techniques for Chionoecetes crabs (Fairbanks, AK: University of Alaska Sea Grant Program Report 99-02). 80 p.
Kimura D. K., Somerton D. A. (2006). Review of statistical aspects of survey sampling for marine fisheries. Rev. Fisheries Sci. 14 (3), 245–283. doi: 10.1080/10641260600621761
Kotwicki S., Ianelli J. N., Punt A. E. (2014). Correcting density-dependent effects in abundance estimates from bottom-trawl surveys. ICES J. Mar. Sci. 71 (5), 1107–1116. doi: 10.1093/icesjms/fst208
Kotwicki S., Lauth R. R. (2013). Detecting temporal trends and environmentally-driven changes in the spatial distribution of bottom fishes and crabs on the eastern Bering Sea shelf. Deep Sea Res. Part II: Topical Stud. Oceanography 94, 231–243. doi: 10.1016/j.dsr2.2013.03.017
Kotwicki S., Lauth R. R., Williams K., Goodman S. E. (2017). Selectivity ratio: a useful tool for comparing size selectivity of multiple survey gears. Fisheries Res. 191, 76–86. doi: 10.1016/j.fishres.2017.02.012
Lauth R. R., Dawson E. J., Conner J. (2019). Results of the 2017 eastern and northern bering sea continental shelf bottom trawl survey of groundfish and invertebrate fauna. Natl. Mar. Fish. Serv., 396, 1–265. doi: 10.25923/h118-nw41
Maunder M. N., Punt A. E. (2013). A review of integrated analysis in fisheries stock assessment. Fisheries Res. 142, 61–74. doi: 10.1016/j.fishres.2012.07.025
Maureaud A., Frelat R., Pécuchet L., Shackell N., Mérigot B., Pinsky M. L., et al. (2021). Are we ready to track climate-driven shifts in marine species across international boundaries?-A global survey of scientific bottom trawl data. Global Change Biol. 27 (2), 220–236. doi: 10.1111/gcb.15404
Methratta E. T., Hawkins A., Hooker B. R., Lipsky A., Hare J. A. (2020). Offshore wind development in the Northeast US Shelf large marine ecosystem. Oceanography 33 (4), 16–27. doi: 10.5670/oceanog.2020.402
Miller T. J. (2013). A comparison of hierarchical models for relative catch efficiency based on paired-gear data for US Northwest Atlantic fish stocks. Can. J. Fisheries Aquat. Sci. 70 (9), 1306–1316. doi: 10.1139/cjfas-2013-0136
Morley S. K., Brito T. V., Welling D. T. (2018). Measures of model performance based on the log accuracy ratio. Space Weather 16 (1), 69–88. doi: 10.1002/2017SW001669
O'Leary C. A., DeFilippo L. B., Thorson J. T., Kotwicki S., Hoff G. R., Kulik V. V., et al. (2022). Understanding transboundary stocks’ availability by combining multiple fisheries-independent surveys and oceanographic conditions in spatiotemporal models. ICES J. Mar. Sci. 79 (4), 1063–1074. doi: 10.1093/icesjms/fsac046
O’Leary C. A., Thorson J. T., Ianelli J. N., Kotwicki S. (2020). Adapting to climate-driven distribution shifts using model-based indices and age composition from multiple surveys in the walleye pollock (Gadus chalcogrammus) stock assessment. Fisheries Oceanography 29 (6), 541–557. doi: 10.1111/fog.12494
Ono K., Licandeo R., Muradian M. L., Cunningham C. J., Anderson S. C., Hurtado-Ferro F., et al. (2015). The importance of length and age composition data in statistical age-structured models for marine species. ICES J. Mar. Sci. 72 (1), 31–43. doi: 10.1093/icesjms/fsu007
Oyafuso Z. S., Barnett L. A., Kotwicki S. (2021). Incorporating spatiotemporal variability in multispecies survey design optimization addresses trade-offs in uncertainty. ICES J. Mar. Sci. 78 (4), 1288–1300. doi: 10.1093/icesjms/fsab038
Oyafuso Z. S., Barnett L. A. K., Siple M. C., Kotwicki S. (2022). A flexible approach to optimizing the Gulf of Alaska groundfish bottom trawl survey design for abundance estimation (Seattle, WA: U.S. Dep. Commer., NOAA Tech. Memo. NMFS-AFSC-434). 142 p.
Palof K. (2022). Saint matthew island blue king crab stock assesssment (Anchorage, AK: Alaska Department of Fish and Game).
Palof K., Zheng J., Ianelli J. (2020). “Saint matthew island blue king crab stock assessment, (2020),” in Stock assessment and fishery evaluation report for the king and Tanner crab fisheries of the Bering Sea and Aleutian Islands regions (Alaska: North Pacific Fishery Management Council, Anchorage). 2020 Final Crab SAFE.
Peterson C. D., Courtney D. L., Cortés E., Latour R. J. (2021). Reconciling conflicting survey indices of abundance prior to stock assessment. ICES J. Mar. Sci. 78 (9), 3101–3120. doi: 10.1093/icesjms/fsab179
Pinsky M. L., Mantua N. J. (2014). Emerging adaptation approaches for climate-ready fisheries management. Oceanography 27 (4), 146–159. doi: 10.5670/oceanog.2014.93
Pope J. G., Shepherd J. G. (1985). A comparison of the performance of various methods for tuning VPAs using effort data. Ices J. Mar. Sci. 42 (2), 129–151. doi: 10.1093/icesjms/42.2.129
Quinn T. J., Deriso R. B. (1999). Quantitative fish dynamics (New York, New York: Oxford university Press).
R Core Team (2021). R: A language and environment for statistical computing (Vienna, Austria: R foundation for Statistical Computing). Available at: https://www.R-project.org/.
Santora J. A., Rogers T. L., Cimino M. A., Sakuma K. M., Hanson K. D., Dick E. J., et al. (2021). Diverse integrated ecosystem approach overcomes pandemic-related fisheries monitoring challenges. Nat. Commun. 12 (1), 1–10. doi: 10.1038/s41467-021-26484-5
Stauffer G. D. (2004). NOAA protocols for groundfish bottom trawl surveys of the nation's fishery resources, March 16, 2003. (Seattle WA:U.S. Department of Commerce)
Stockhausen W. T. (2014). 2014 stock assessment and fishery evaluation report for the tanner crab fisheries of the bering sea and aleutian islands regions. (Anchorage AK:North Pacific Fishery Management Council)
Stockhausen W. T. (2021a). 2021 stock assessment and fishery evaluation report for the pribilof islands blue king crab fisheries of the bering sea and aleutian islands regions. (Anchorage AK:North Pacific Fishery Management Council)
Stockhausen W. T. (2021b). 2021 stock assessment and fishery evaluation report for the tanner crab fisheries of the bering sea and aleutian islands regions (Anchorage, AK: North Pacific Fishery Management Council). Available at: https://meetings.npfmc.org/CommentReview/DownloadFile?p=55d56b05-4f74-4c5d-9372-28ced4a2bfc2.pdf&fileName=C1%20Tanner%20Crab%20SAFE.pdf.
Stompe D. K., Moyle P. B., Kruger A., Durand J. R. (2020). Comparing and integrating fish surveys in the San Francisco Estuary: why diverse long-term monitoring programs are important. San Francisco Estuary Watershed Sci. 18 (2). doi: 10.15447/sfews.2020v18iss2art4
Szuwalski C. S. (2022) 2022 assessment for Pribilof Islands red king crab. Available at: https://meetings.npfmc.org/CommentReview/DownloadFile?p=4783b2a2-e8a2-4efe-bdfb-37f89216c1b3.pdf&fileName=PIRKC%20SAFE%202022%20Final.pdf.
Szuwalski C. S., Foy R. J., Turnock B. J. (2014). “2014 Stock assessment and fishery evaluation report for the Pribilof Islands red king crab fishery of the Bering Sea and Aleutian Islands Regions,” in Stock assessment and fishery evaluation report for the king and tanner crab fisheries of the bering sea and aleutian islands regions (605 W. 4th Avenue, no. 306, Anchorage, AK 99501: North Pacific Fishery Management Council), 546–605.
Szuwalski C., Turnock J. (2016). A stock assessment for eastern Bering Sea snow crab 167–251. Stock Assessment and Fishery Evaluation Report for the King and Tanner Crab Fisheries of the Bering Sea and Aleutian Islands Regions. North Pacific Fishery Management Council, Stock Assessment and Fishery Evaluation Report
Thorson J. T. (2019). Guidance for decisions using the Vector Autoregressive Spatio-Temporal (VAST) package in stock, ecosystem, habitat and climate assessments. Fisheries Res. 210, 143–161. doi: 10.1016/j.fishres.2018.10.013
Thorson J. T., Barbeaux S. J., Goethel D. R., Kearney K. A., Laman E. A., Nielsen J. K., et al. (2021). Estimating fine-scale movement rates and habitat preferences using multiple data sources. Fish Fisheries 22 (6), 1359–1376. doi: 10.1111/faf.12592
Thorson J. T., Barnett L. A. (2017). Comparing estimates of abundance trends and distribution shifts using single-and multispecies models of fishes and biogenic habitat. ICES J. Mar. Sci. 74 (5), 1311–1321. doi: 10.1093/icesjms/fsw193
Thorson J. T., Clarke M. E., Stewart I. J., Punt A. E. (2013). The implications of spatially varying catchability on bottom trawl surveys of fish abundance: a proposed solution involving underwater vehicles. Can. J. Fisheries Aquat. Sci. 70 (2), 294–306. doi: 10.1139/cjfas-2012-0330
Thorson J. T., Haltuch M. A. (2019). Spatiotemporal analysis of compositional data: increased precision and improved workflow using model-based inputs to stock assessment. Can. J. Fisheries Aquat. Sci. 76 (3), 401–414. doi: 10.1139/cjfas-2018-0015
Thorson J. T., Shelton A. O., Ward E. J., Skaug H. J. (2015). Geostatistical delta-generalized linear mixed models improve precision for estimated abundance indices for West Coast groundfishes. ICES J. Mar. Sci. 72 (5), 1297–1310. doi: 10.1093/icesjms/fsu243
Vølstad J. H. (2012). CIE independent peer review report. (Bergen Norway:Center for Independent Experts) https://www.st.nmfs.noaa.gov/science-quality-assurance/cie-peer-reviews/cie-review-2012.
Wakabayashi K., Bakkala R. G., Alton. M. S. (1985). “Methods of the U.S.-Japan demersal trawl surveys,” in Results of cooperative U.S.-Japan groundfish investigations in the Bering Sea during May-August 1979. Eds. Bakkala R. G., Wakabayashi K. (Vancouver, CA: Int. North Pac. Fish. Comm. Bull. 44), 7–29.
Wilberg M. J., Thorson J. T., Linton B. C., Berkson J. (2009). Incorporating time-varying catchability into population dynamic stock assessment models. Rev. Fisheries Sci. 18 (1), 7–24. doi: 10.1080/10641260903294647
Wyllie-Echeverria T. I. N. A., Wooster W. S. (1998). Year-to-year variations in Bering Sea ice cover and some consequences for fish distributions. Fisheries Oceanography 7 (2), 159–170. doi: 10.1046/j.1365-2419.1998.00058.x
Zacher L. S., Richar J. I., Foy R. J. (2020). The 2019 eastern and northern Bering Sea continental shelf trawl surveys: Results for commercial crab species (Anchorage, AK: U.S. Department of Commerce NOAA Technical Memorandum NMFS-AFSC-400). 234 p.
Keywords: survey design, stock assessment, groundfish, crab, spatiotemporal model
Citation: DeFilippo L, Kotwicki S, Barnett L, Richar J, Litzow MA, Stockhausen WT and Palof K (2023) Evaluating the impacts of reduced sampling density in a systematic fisheries-independent survey design. Front. Mar. Sci. 10:1219283. doi: 10.3389/fmars.2023.1219283
Received: 08 May 2023; Accepted: 07 August 2023;
Published: 25 August 2023.
Edited by:
Nathan Bacheler, Beaufort Laboratory, Southeast Fisheries Science Center (NOAA), United StatesReviewed by:
Sarah Roberts, University of North Carolina at Chapel Hill, United StatesMatthew Vincent, Southeast Fisheries Science Center (NOAA), United States
Copyright © 2023 DeFilippo, Kotwicki, Barnett, Richar, Litzow, Stockhausen and Palof. This is an open-access article distributed under the terms of the Creative Commons Attribution License (CC BY). The use, distribution or reproduction in other forums is permitted, provided the original author(s) and the copyright owner(s) are credited and that the original publication in this journal is cited, in accordance with accepted academic practice. No use, distribution or reproduction is permitted which does not comply with these terms.
*Correspondence: Lukas DeFilippo, bHVrYXMuZGVmaWxpcHBvQG5vYWEuZ292
†Present address: Lukas DeFilippo, Ecosystem Monitoring and Assessment Program, Alaska Fisheries Science Center, NOAA, Seattle, WA, United States