 Shao’e Sun
 Gang Ni
 Wansheng Wang5
 Zhongli Sha
 Ning Xiao
 Zeng Xiaoqi
- 1Department of Marine Organism Taxonomy and Phylogeny, Institute of Oceanology, Chinese Academy of Sciences, Qingdao, China
- 2Laboratory for Marine Biology and Biotechnology, Qingdao National Laboratory for Marine Science and Technology, Qingdao, China
- 3Shandong Province Key Laboratory of Experimental Marine Biology, Institute of Oceanology, Chinese Academy of Sciences, Qingdao, China
- 4College of Biological Sciences, University of Chinese Academy of Sciences, Beijing, China
- 5Ministry of Education Key Laboratory of Mariculture, Ocean University of China, Qingdao, China
Mitochondrial genome (mitogenome) is a frequently-used tool for phylogenetic and evolutionary studies among metazoans, however, it was still poorly represented in some invertebrate groups, including holothurians. Apodida is one of the most ancient orders of Holothuroidea, with unique characteristics in lacking tube feet and the respiratory tree. Here, we sequenced six mitogenomes from the holothurian order Apodida (Synaptidae and Chiridotidae) and compared them with other available holothurian mitogenomes. The apodan mitogenomes present positive GC skews and negative AT skews, a pattern diametrically opposite to that found in the mitogenomes of other holothurians. The amino acid genetic distances of the 13 protein-coding genes (PCGs) were the highest between Apodida and other holothurians. The mitochondrial gene orders within Apodida were extensively rearranged at the species level, and also were unique from the arrangement patterns of other holothurians. Phylogenetic relationships based on two different criteria: (i) nucleotides sequences with all codon positions (PCG123) and (ii) Neutral Transitions Excluded model (NTE) confirmed the monophyly and basal position of the order Apodida with a long branch. The NTE phylogeny generated a low variation of branch length, but it did not ameliorate the long branch length of Apodida. The divergence time estimation suggested that the Apodida originated in the Middle Carboniferous, implying that they survived the extinction event that occurred in the boundary of the Permian and Triassic. The NTE dataset revealed younger age than that generated by PCG123 dataset. Apodida is accompanied by a faster evolutionary rate than other holothurians (0.0069 vs 0.0043 subs/s/my). The absence of tube feet and the respiratory tree may play an important role in the dramatic evolutionary changes of apodan mitogenomes.
Introduction
In metazoans, the mitochondrial genome (mitogenome) contains a broad range of characteristics, such as small genome size, rare recombination, fast evolutionary rates and high copy number, sometimes, showing high gene rearrangement and novel genetic code (Boore and Brown, 1998; Macey et al., 2000; Telford et al., 2000; Barr et al., 2005; Gissi et al., 2008; Bernt et al., 2013a; Li et al., 2019). These advantages have made it widely used in the phylogenetic investigations and basic evolutionary biological studies of metazoans. In invertebrates, researchers paid more attention to some groups, especially arthropods, mollusks and annelids (Lee et al., 2009; Stöger and Schrödl., 2013; Cameron, 2014; Weigert et al., 2016; Zhang et al., 2018; Ghiselli et al., 2021; Sun et al., 2021a). Our knowledge on the structure and evolution of mitogenomes in some major invertebrate groups is still limited. Holothuroidea is one of the most diverse echinoderms class, with about 1700 accepted extant species (Paulay and Hansson, 2013). The recent classification divided Holothuroidea into two subclasses: Actinopoda Ludwig, 1891 and Paractinopoda Ludwig, 1891. Actinopoda encompassed six orders: Dendrochirotida, Holothuriida, Molpadida, Persiculida, Synallactida and Elasipodida. Paractinopoda contained the only order Apodida (Miller et al., 2017; WoRMS, 2023).
Despite their high diversity and abundance, the mitogenome database is still under-represented in the class Holothuroidea. There are only approximately 40 mitogenomes of holothurians available, representing 10 families of 6 orders. This paucity of mitogenome data is conspicuous for the order Apodida, a unique group of holothuroids lacking tube feet and the respiratory tree (Kerr, 2001). The order Apodida are invariably vermiform infaunal sea cucumbers with a thin and transparent body wall, which range from a few millimetres to more than three metres in body length. Hence, they were considered to be the largest echinoderms (Kerr, 2001). They are distributed worldwide, from littoral to deep-sea, with about 300 valid species in 40 genera and three families, Myriotrochidae, Chiridotidae and Synaptidae (WoRMS, 2023). The order Apodida was placed in Holothuroidea as sister of all other extant holothuroids, being the earliest lineage in the evolution of the holothuroids in a morphology-based analysis (Kerr and Kim, 2001), which was also supported by recent molecular phylogenetic analyses (Miller et al., 2017). This is consistent with fossil records (Reich, 2010, Reich, 2015).
Thus far, five mitogenomes of Apodida species (Chiridota heheva [GenBank accession number, MW357261], Chiridota sp. [MW357262], Protankyra sp. IDXB3 [ON018239], Chiridotidae sp. KJ-Belize-E1_1 [MT877116], and Euapta godeffroyi [LC704718]) were available in the NCBI nucleotide database. Our previous studies lead to the notion that the mitochondrial gene order of C. heheva and Chiridota sp._MW357262, two Apodida species from deep-sea chemoautotrophic environments, completely deviated from any recorded holothurian and echinoderm ground pattern (Sun et al., 2021b). These two mitogenomes were the first from the Holothuroidea that show protein-coding gene rearrangements. Further published mitogenomes of apodans indeed supported this notion. The gene order of synaptid E. godeffroyi mitogenome seems to be equally very different from those of any recorded holothurian mitogenomes (Ogawa et al., 2022). Furthermore, the substitution rate of the mitogenome of Apodida species is faster than that of the other available apodans mitogenomes (Sun et al., 2021b). These phenomenons call for further studies to investigate whether the gene rearrangement and rapid evolutionary rates were an isolated case for these species or it represents a uniform pattern for the entire order Apodida. Therefore, it is crucial to discover more apodans mitogenomes to expand our knowledge on the evolution of Apodida.
In this study, we newly determined six mitogenomes of Apodida, of which one (Polycheira rufescens (Brandt, 1835) is from the family Chiridotidae and five (Synapta maculata (Chamisso & Eysenhardt, 1821), Euapta sp., Protankyra bidentata (Woodward and Barrett, 1858), Patinapta ooplax (von Marenzeller, 1882), Synaptula reticulata (Semper, 1867) from Synaptidae. Together with the available Apodida mitogenomes, we investigated both the phylogenetic relationships and the general evolutionary biological features of the mitogenome within the order Apodida. These include i) analysis of mitogenome organization, base composition and codon usage bias, ii) analysis of phylogenetic relationships and divergence time within Apodida, and iii) insights into gene rearrangements and evolutionary rates of Apodida mitogenomes. The results will greatly improve our understanding of the phylogeny and mitochondrial evolutionary biology within Apodida.
Materials and methods
Sample collection, mitochondrial genome sequencing and assembly
Specimens of P. rufescens, S. maculata, Euapta sp., P. bidentata, P. ooplax and S. reticulata were collected along the China coast (Table 1). All specimens were preserved in 95% ethanol prior to DNA extraction. Total genomic DNA of each single specimen was extracted using E.Z.N.A® Tissue DNA kit (OMEGA) according to the manufacturer’s protocol. The paired-end libraries were constructed by TruSeq™ Nano DNA Sample Prep Kit (Illumina) and sequenced to produce 2×150 bp paired-end reads on an Illumina HiSeq 4000 platform in Shanghai Lingen Biotechnology Co., Ltd. The Trimmomatic V0.33 software (Bolger et al., 2014) was used to remove low quality sequences from the raw reads. De novo assemblies were conducted with SPAdes v3.10.1 (k-mer = 21-77) (http://bioinf.spbau.ru/spades). To identify the putative mitochondrial contigs, BLASTN searches (Altschul et al., 1997) were conducted using the apodan mitogenomes available from the NCBI database. All mitogenomes sequenced in this study have been deposited to GenBank (Table 1).
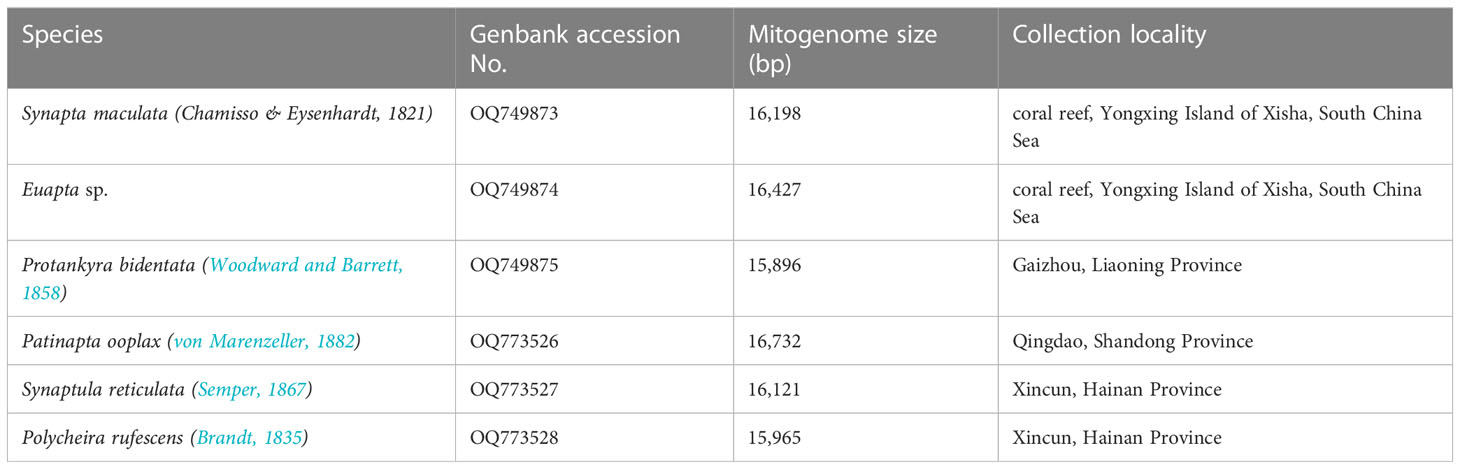
Table 1 New mitochondrial genomes analyzed in present study.
Gene annotation and sequence analyses
The protein coding genes (PCGs), rRNA and tRNA genes were identified by the MITOS web server (Bernt et al., 2013b) using the genetic code for invertebrate mitochondria. Gene boundaries of the PCGs and rRNAs were further manually examined and adjusted by comparing them with other related apodan mitogenomes. Base composition was calculated using MEGA 5 (Tamura et al., 2011). The AT and GC-skews were calculated following the formulae: AT-skew = (A-T)/(A + T); GC-skew = (G-C)/(G + C) (Perna and Kocher, 1995), where positive values in skewness indicate that the coding strand favour more A and G, while negative values infer more Ts and Cs. The codon usage was counted by MEGA 5 (Tamura et al., 2011) based on the invertebrate mitochondrial genetic code. The mitochondrial codons were partitioned into GT-rich codons (GT, TG, GG, TT codons at the first and second positions), CA-rich codons (CA, AC, CC, AA codons at the first and second positions) and other codons. All statistical analysis was performed using IBM SPSS Statistics 19.
Comparison of gene order and ancestral state estimation
CREx (Bernt et al., 2007) was used to conduct pairwise comparisons of mitochondrial gene order patterns among the holothurian mitogenomes. The gene rearrangement events include transpositions (T), reversals (R), reverse transpositions (RT), and tandem-duplication-random-loss (TDRL). The gene order distances were measured by common intervals parameter. MLGO web server (http://www.geneorder.org/server.php, Hu et al., 2014) was used to reconstruct the ancestral state and gene rearrangement history in Apodida. The tRNA genes were not included in the MLGO analysis, because of their variable arrangements among the Apodida mitogenomes. The reference tree used for mapping gene arrangements was modified from the phylogenetic analyses in our study.
Phylogenetic analyses
The phylogenetic relationships were constructed by partitioning sequences of 13 PCGs using Bayesian inference (BI) and maximum likelihood (ML). The dataset comprised 53 taxa, including 49 Holothuroidea species representing six orders (Apodida, Molpadida, Synallactida, Holothuriida, Elasipodida and Dendrochirotida) and four Ophiuroidea species used as outgroups (Supplementary Table 1). Each of the 13 mitochondrial genes was aligned individually by MEGA 5 (Tamura et al., 2011) using the codon based alignment algorithm. The aligned genes were concatenated into a single supermatrix by Sequencematrix (Vaidya et al., 2011). The best-fit partition model was selected by PartitionFinder 2 (Lanfear et al., 2017), respectively. The phylogenetic relationships were analysed based on two data matrixes, i.e. nucleotide sequence from all codon positions (PCG123), and a Neutral Transitions Excluded (NTE) recoding scheme, which can ameliorate the misleading influence of strand-bias in the data set by recoding bases at neutral and quasi-neutral positions (Hassanin et al., 2005). The NTE data were obtained using Tidyverse package in R v.4.3 (Wickham, 2017). The ML analysis was conducted by IQ-TREE web server (Trifinopoulos et al., 2016) with the best-fit partition schemes, using 1000 ultrafast bootstrap (UFBoot) replicates (Minh et al., 2013). The BI analysis was performed by MrBayes 3.2.6 (Ronquist and Huelsenbeck, 2003) applying the best-fit models, with the Markov chain Monte Carlo (MCMC) runs of 10,000,000 generations. The effective sampling size (ESS) (>200) was checked by Tracer v1.7 (Rambaut et al., 2013, 2018). The first 2500 trees (25%) were burning and the remaining 2500 sampled trees were used to compute the 50% majority-rule consensus tree and the posterior probabilities (PP). Pairwise amino acid distances (p-distance) were calculated in MEGA 5 (Tamura et al., 2011). And the results are presented as boxplots, which were constructed by IBM SPSS Statistics 19.
Divergence time estimation
The divergence time was estimated by BEAST 1.8.1 (uncorrelated lognormal relaxed clock, Yule prior) (Drummond et al., 2012), with two criteria (PCG123 and NTE) set as before. For each criterion, the BEAST analyses were performed for 10,000,000 steps, with sampling every 1000 steps, following a burn-in of 25% of the tree. The convergence was also checked by Tracer v1.7 (Rambaut et al., 2013, 2018) as the above BI analyses. The TreeAnnotator (Drummond et al., 2012) was used to summarize the maximum-clade-credibility tree topology with median ages and the 95% highest posterior densities (HPD). Divergence times were constrained with three time points from the fossil record according to a previous study (Miller et al., 2017). The crown group of Holothuroidea was constrained with a median age of 435 Ma with a lognormal distribution (431-449 Ma) (Reich, 2010; Reich et al., 2015). The median age of the stem Elasipodida was constrained at 387 Ma using a lognormal distribution (384-394 Ma) (Boczarowski, 2001). The stem Holothuriidae was calibrated at 246 Ma with a lognormal distribution (244-257 Ma) (Reich, 2004).
Evolutionary rates analyses
The dN, dS and dN/dS (ω) were estimated for each 13 individual PCG and the concatenated PCGs data set by PAML v.4.9e (Yang, 2007) under a phylogenetic context. Combining the divergence time and selection tests, we analysed and compared the evolutionary rates of mitogenomes between Apodida and other holothurians. The evolutionary rate was calculated as Vsubs = K/2T, where K represent the mean number of substitutions for each nucleotide site, and T is the divergence time (Pesole et al., 1999). The synonymous substitution rate (Vsyn) and non-synonymous substitution rate (Vnonsyn) were also calculated for every lineage. The divergence time and substitution numbers were extracted from the result file generated by TreeAnnotator and PAML v.4.9e, respectively. The p values with significant differences were constructed by IBM SPSS Statistics 19.
Results
Reversals of strand-compositional bias in Apodida mitogenomes
The six new mitogenomes of Apodida were all assembled into a closed circular contig and varied in length from 15,896 (P. bidentata) to 16,732 bp (P. ooplax). In the six species, the mitogenome contained 13 PCGs, two rRNA genes and 22 tRNA genes (Supplementary Table 2). However, the gene arrangement differed from those of other Apodida mitogenomes, as well as other Holothuroidea ones (Figure 1). The A+T content was from 61.44% in P. rufescens to 66.86% in P. bidentata on the coding strand of the whole mitogenome. The third codon position (PCG3) exhibited the highest A+T content in E. godeffroyi (67.24%), P. bidentata (76.76%), P. ooplax (69.52%) and P. rufescens (65.74%). While in S. maculata and S. reticulata, the highest AT content occurred in major non-coding region (MNR) (75.56%) and rRNA (67.15%), respectively (Supplementary Table 3, Figure 2A). The AT and GC skews were calculated for 49 holothurian mitogenomes (Supplementary Table 3, Figure 2B) to measure the strand asymmetry. All the holothurian species fell into two groups: the first one contained thirty-seven species, i.e., ten species in Synallactida and all species in Molpadida, Holothuriida, Elasipodida and Dendrochirotida, presenting negative GC skews and weak negative or positive AT skews; and the second one included twelve species, i.e., one species in Synallactida and all species in Apodida, which are characterized by positive GC skews and negative AT skews. These results indicated that the apodan species have strand asymmetry reversal on the entire plus strand compared to other holothuroids.
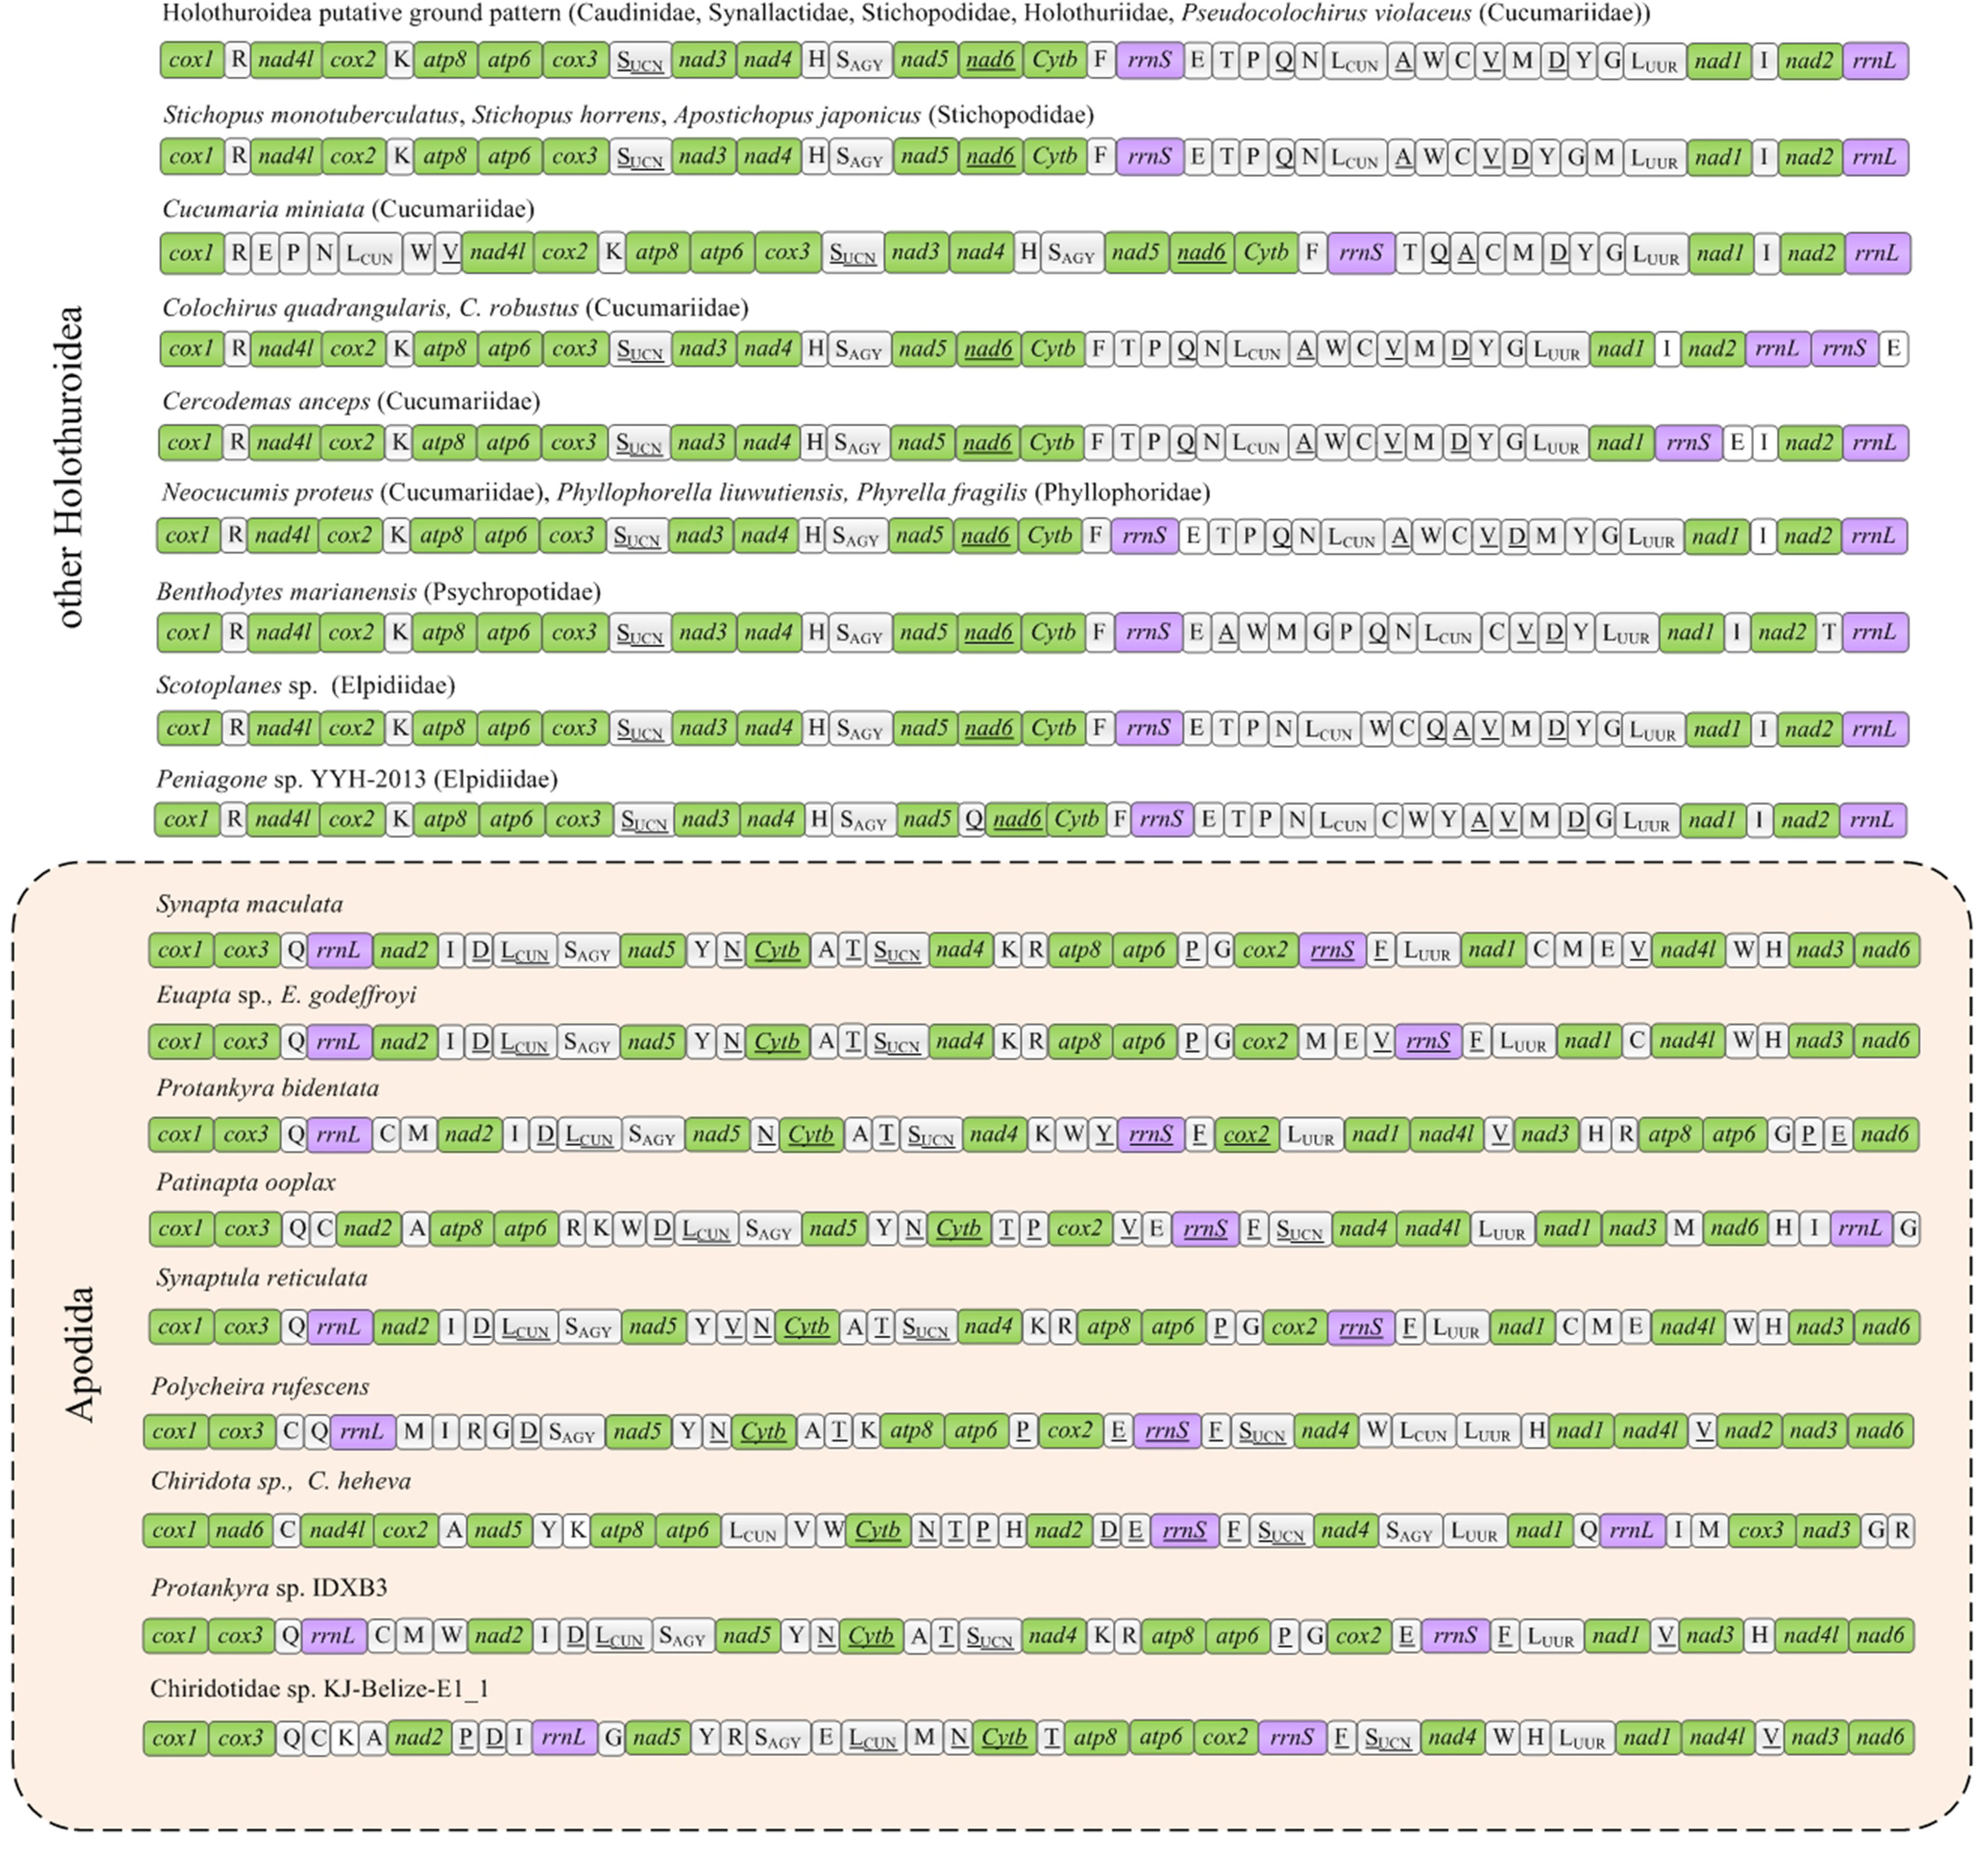
Figure 1 Gene arrangements of Holothuroidea mitochondrial genomes. The PCGs, rRNAs and tRNAs were indicated by green, purple and white, respectively. The genes encoded on the negative strand were underlined.
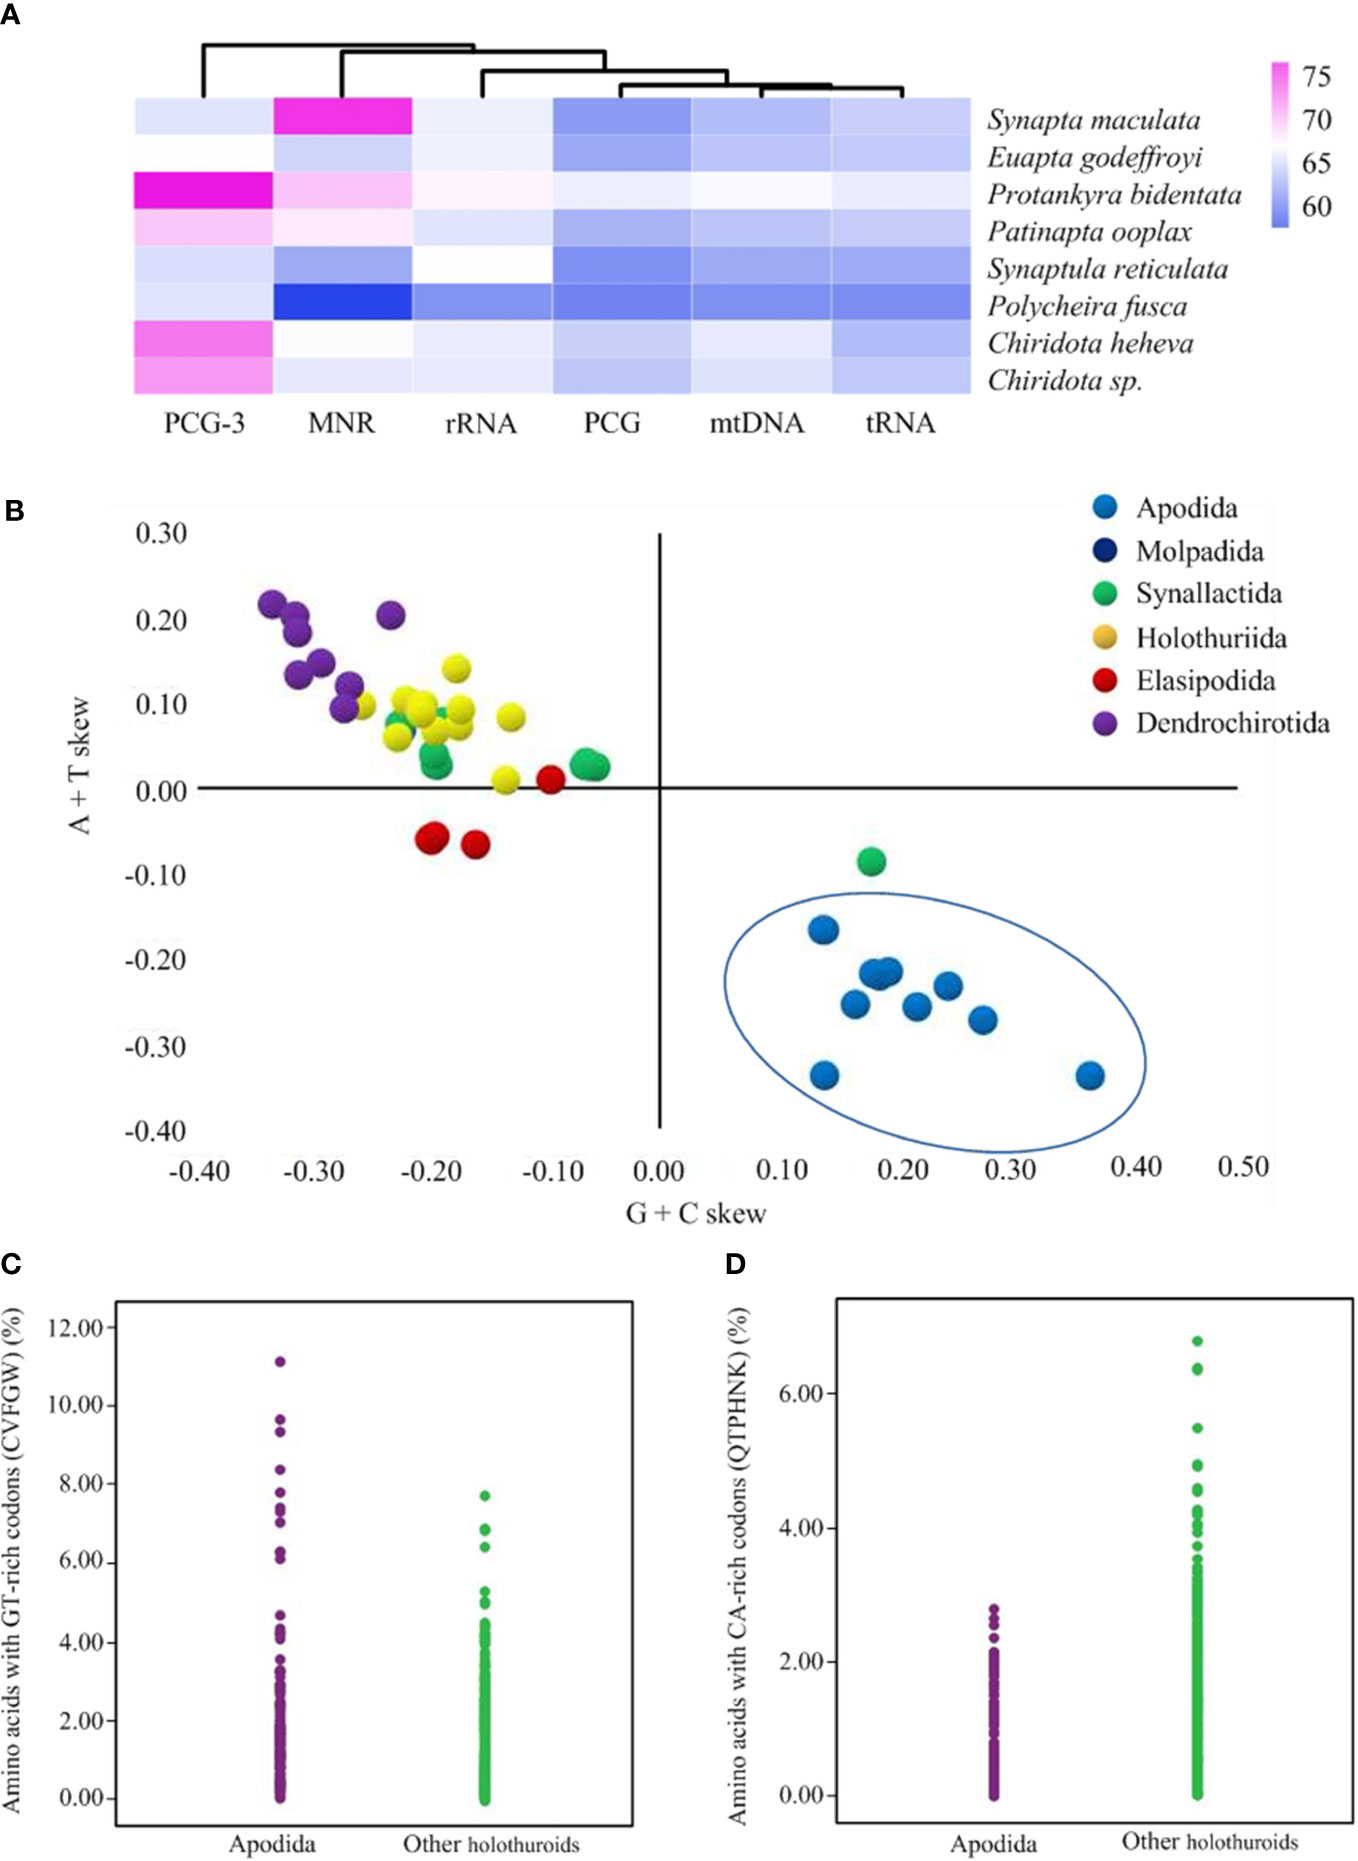
Figure 2 (A) The A+T content of Apodida mitochondrial genomes. (B) The AT and GC-skews of the holothuroid mtDNA. The orders Apodida, Molpadida, Synallactida, Holothuriida, Elasipodida and Dendrochirotida were represented by blue, cyan, green, yellow, red and purple dots, respectively. (C) The proportions of amino acids with GT-rich codons were higher in Apodida than in other holothuroids. (D) The proportions of amino acids with CA-rich codons were lower in Apodida than in other holothuroids.
Considering the contrasting patterns of strand compositional asymmetry in apodans, we chose eleven mitochondrial protein-coding genes on the plus-strand (atp6, atp8, cox1, cox2, cox3, nad1, nad2, nad3, nad4, nad4l, nad5) to explore if DNA asymmetric strand bias affects the amino acid composition in apodans. The abundance of amino acids encoded by GT-rich codons (C, V, F, G and W) was significantly higher in Apodida (Mann-Whitney U test, p < 0.001) (Figure 2C), while that of the CA-rich codons was significantly higher in other holothuroids (p < 0.001) (Figure 2D). Moreover, this significant differences (P < 0.001) occurred at almost all the individual amino acids, except I, N and E (Supplementary Table 4), indicating their clear responses to shifting nucleotide use. Especially, Apodida contains twice as many LUUR and V as do their orthologs in other holothuroids. On the other hand, the proportions of LCUN, T and K in Apodida are approximately half the value found in the orthologs of other holothuroids. So the amino acid composition was influenced by the reversals of strand-compositional bias.
Analysis of pairwise amino acid distances of 13 PCGs showed a significantly higher genetic divergence between Apodida and the other holothuroid mitogenomes than any other pairs (Supplementary Table 5, Figure 3). Between Apodida spp. and other holothuroid species, the nad2 gene showed the highest genetic divergence from 0.632 to 0.657 and the cox1 gene presented the lowest genetic divergence from 0.222 to 0.245.
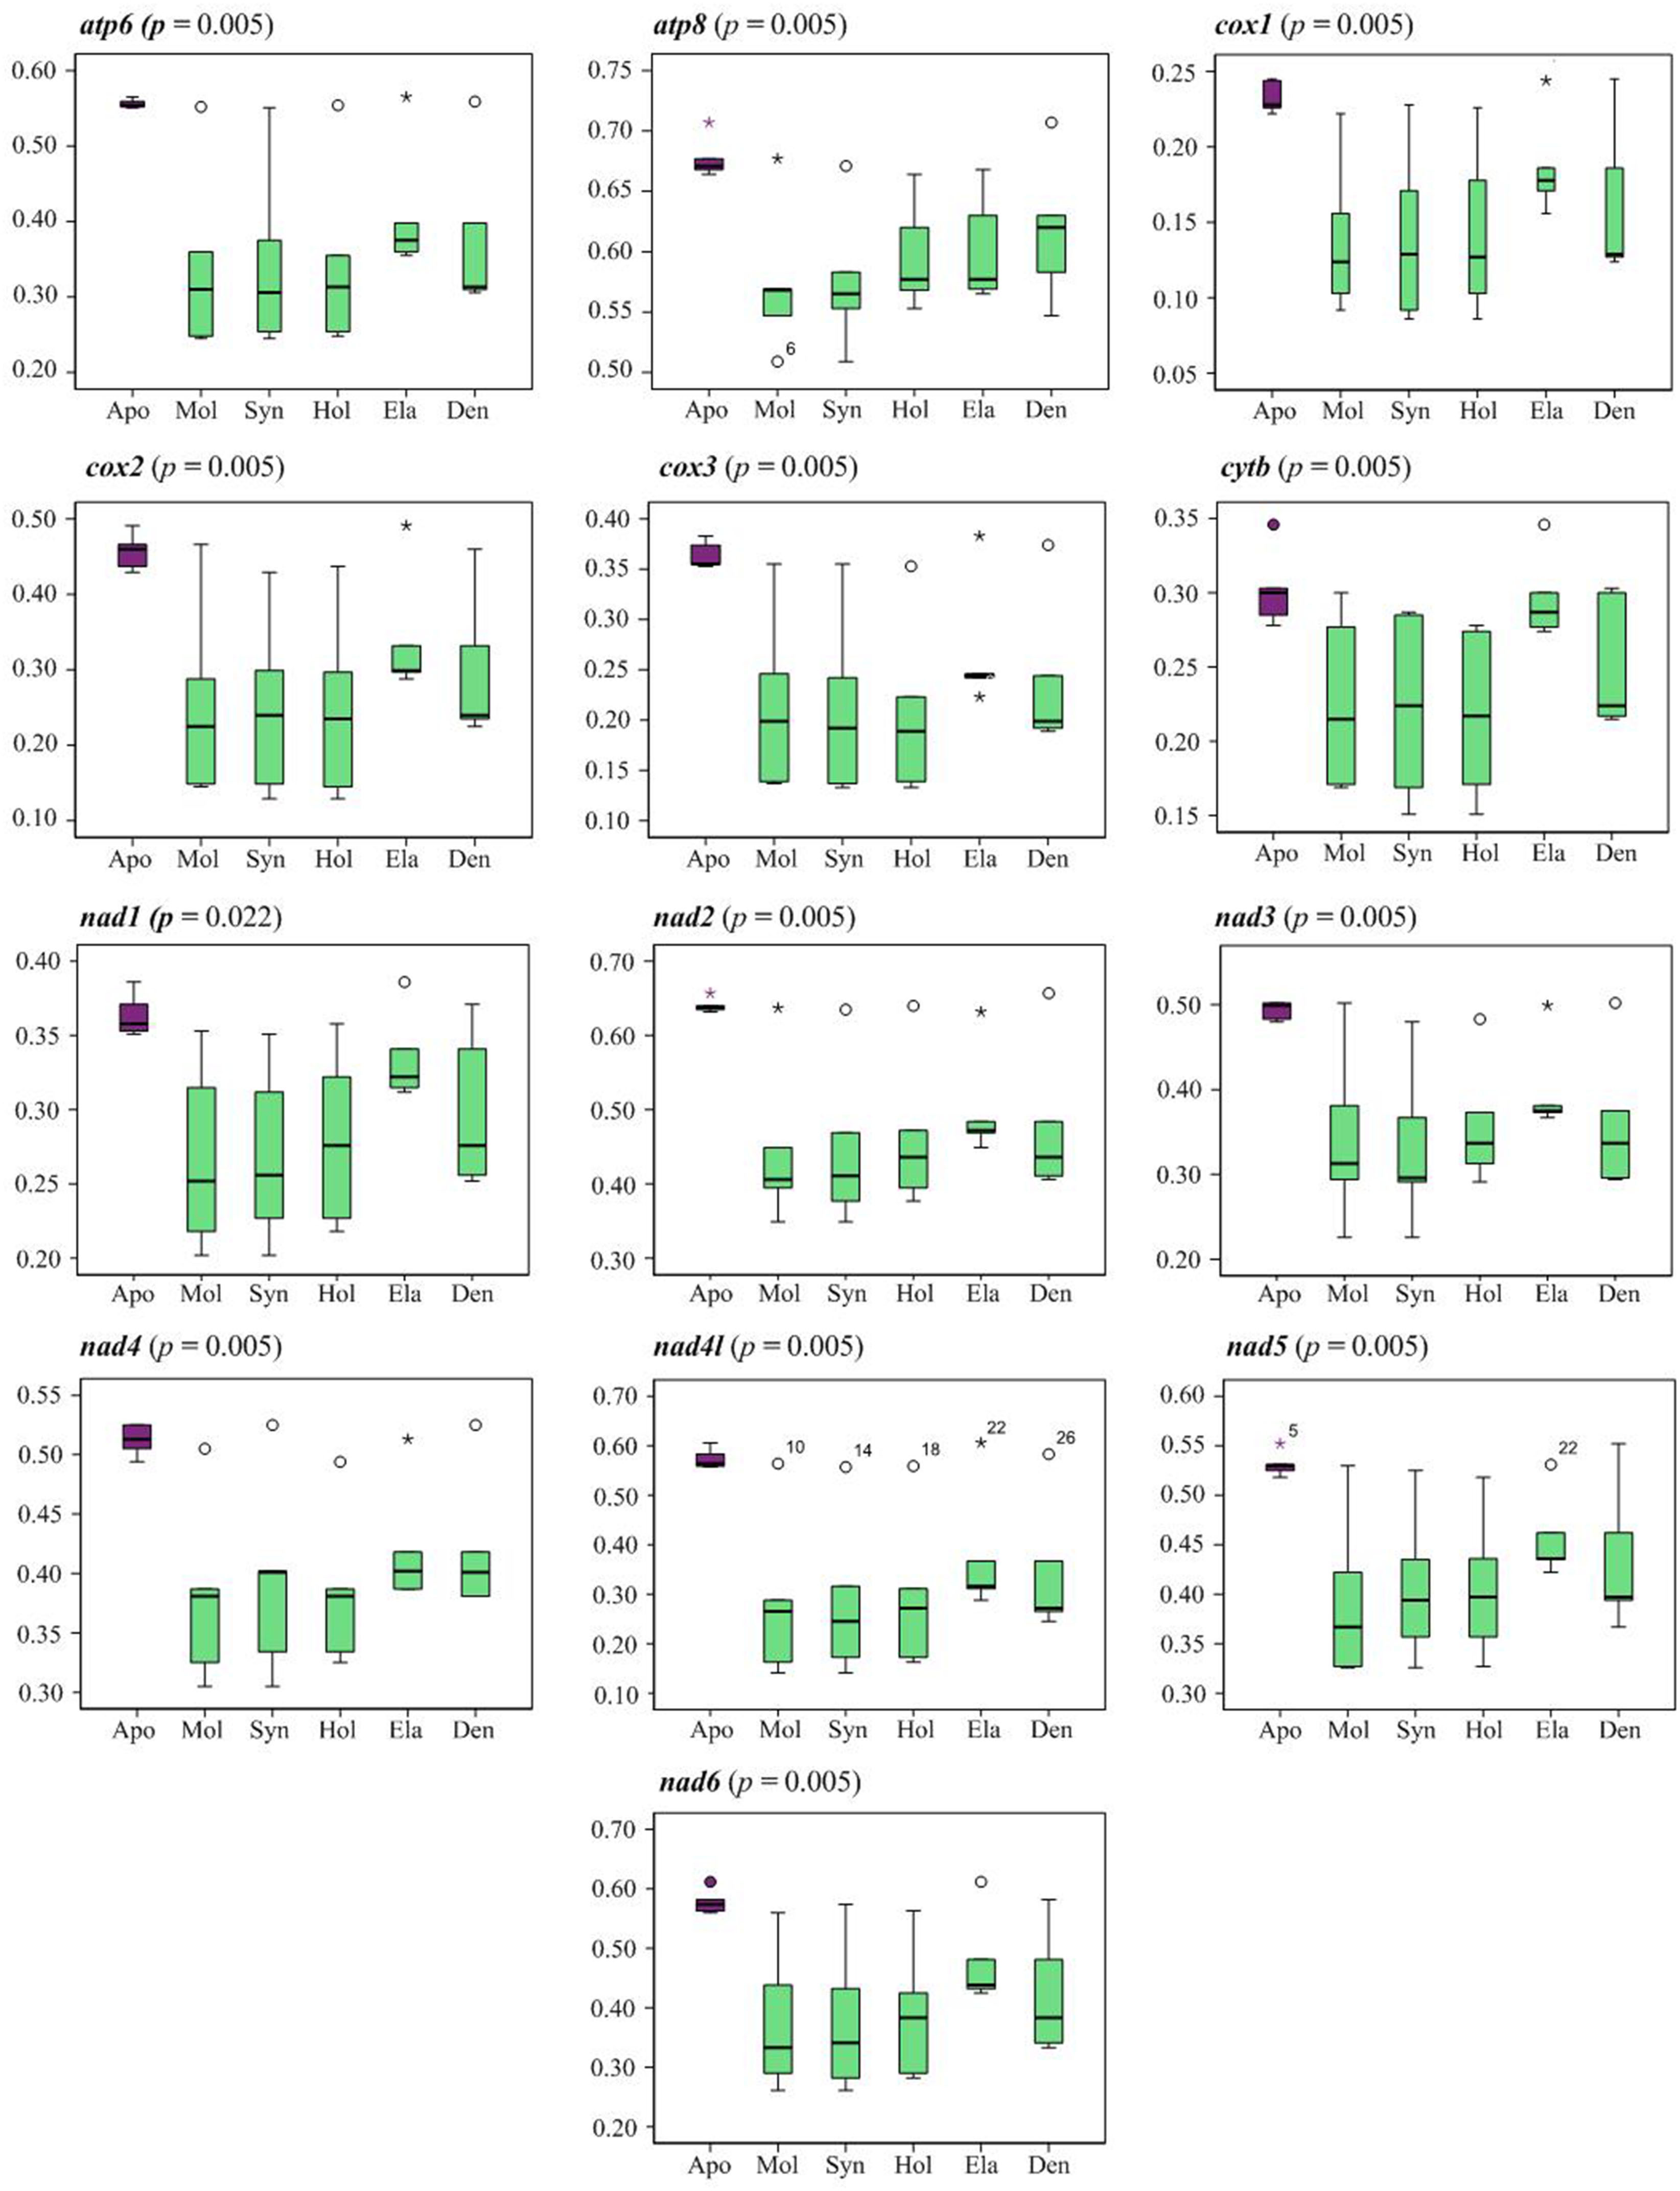
Figure 3 Boxplot graph indicating the pairwise genetic distance of amino acid among the orders of Holothuroidea. Apo (Apodida); Mol (Molpadida); Syn (Synallactida); Hol (Holothuriida); Ela (Elasipodida); Den (Dendrochirotida).
Mitochondrial gene order rearrangements
The gene order among the eleven mitogenomes of Apodida differed from each other, with the arrangement of both PCGs and tRNAs varying significantly (Figure 1). A total of nine gene order patterns were known for the eleven available apodan mtgenomes. No conserved gene block was found for the Apodida mitogenomes. In the CREx analysis, the gene order distance ranged from 4 to 24 between Apodida spp. and other holothuroids, and from 12 to 22 between Apodida spp. and the Holothuroidea putative ground pattern. The lowest gene order distance among the apodan species was 16, and the highest one was 956. The gene order of Chiridota spp. was highly different from those of other apodan species (Table 2).
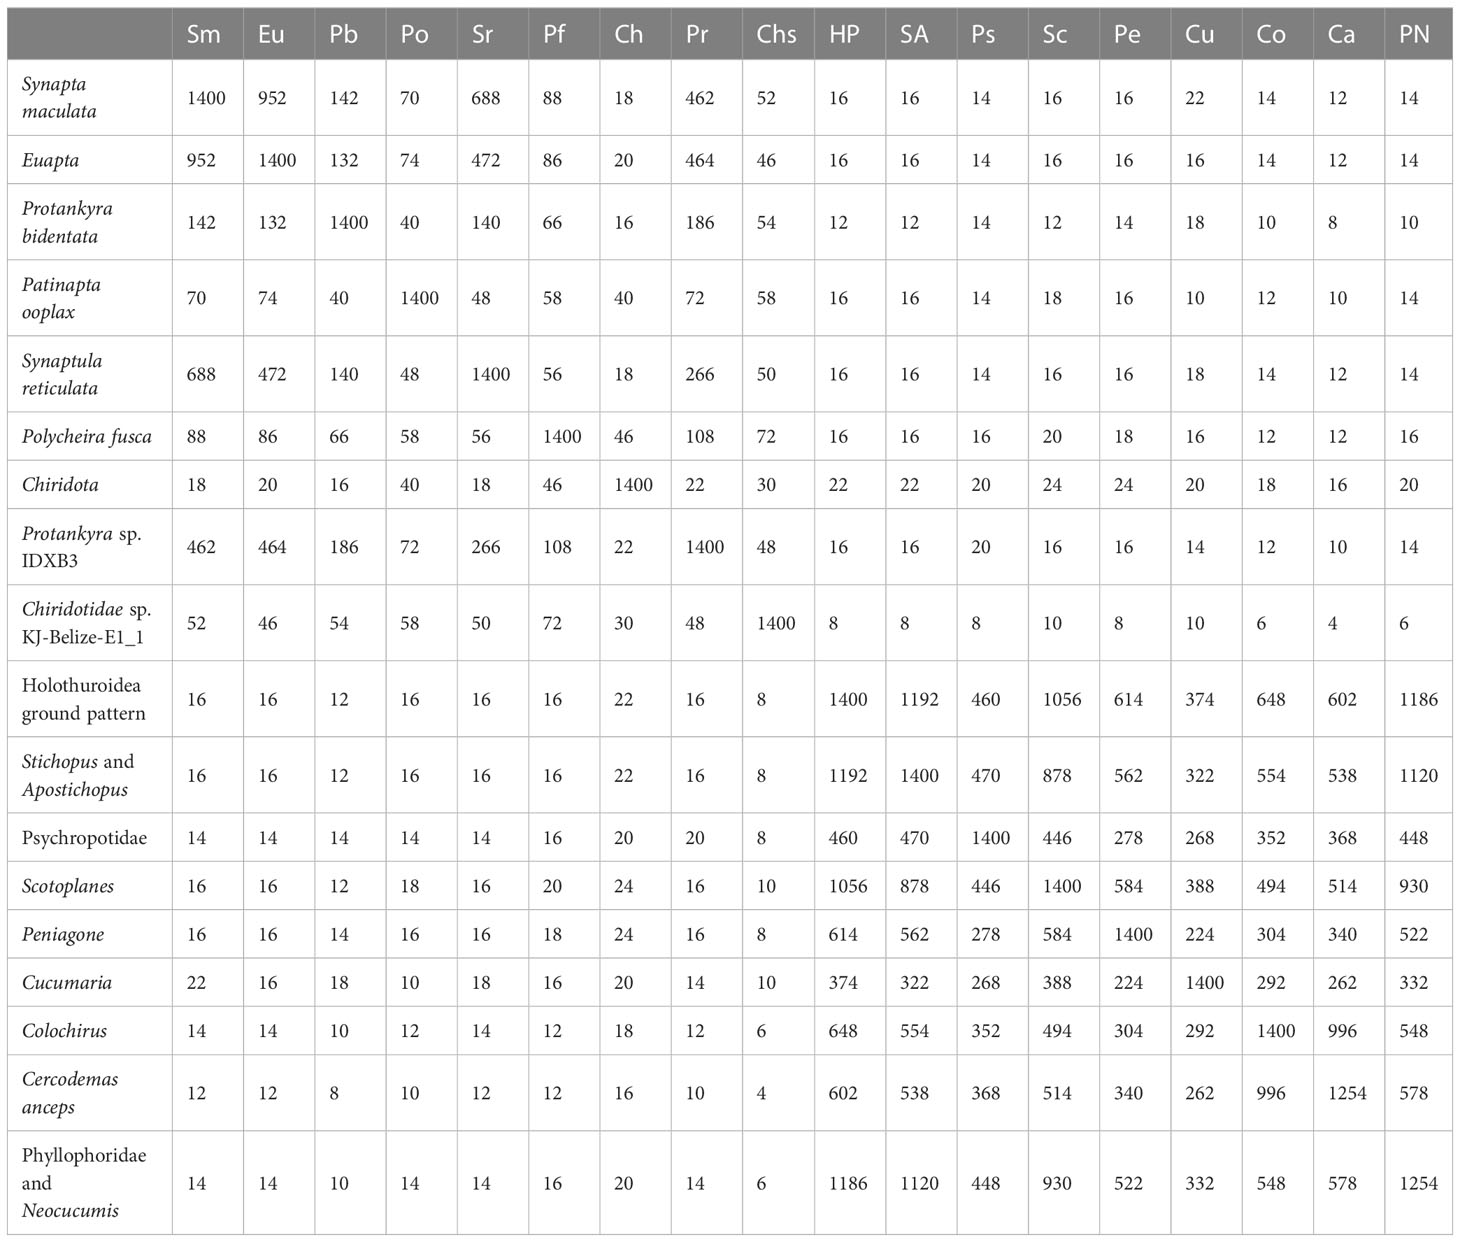
Table 2 Pairwise comparisons of mitochondrial gene orders in Holothuroidea species.
Only the PCGs and rRNAs were included in the ancestral gene order reconstruction. The gene orders were mapped on the phylogenetic tree to recover the evolutionary pattern of PCG and rRNA genes (Figure 4A). Inference of gene arrangement evolution revealed the most likely ancestral gene order for Apodida (Node A1) as cox1-cox3-nad2-rrnL-nad5-cytb-atp8-atp6-cox2-rrnS-nad4-nad1-nad4l-nad3-nad6 (Figure 4B), which is retained by the most recent common ancestor (MRCA) of Synaptidae (A2) and that of the Chiridotidae sp. KJ-Belize-E1_1-P. ooplax clade (A8). One reversal even and three transposition events might have occurred in Chiridotidae sp. KJ-Belize-E1_1 (Pattern 7) and P. ooplax (Pattern 8), respectively. Two transposition and one reversal events have occurred in the MRCA of the S. reticulata-S. maculata-E. godeffroyi-Euapta sp.-Protankyra sp. IDXB3-P. bidentata clade (A3) and the Protankyra sp. IDXB3-P. bidentata clade (A7). The gene order of Protankyra sp. IDXB3 featured a transposition (Pattern 5), and P. bidentata displayed a transposition and one reversal event (Pattern 6). The gene order of the S. reticulata-S. maculata-E. godeffroyi-Euapta sp. clade can be explained by a reversal of the rrnS gene (A4), which was also retained by the four extant species (Pattern 1-4). The differences between the gene orders in the MRCA of Chiridotidae (A9) and Apodida (A1) can be explained by four transpositions, one reverse transposition and one reversal event. The cox3-nad3 gene block translocated their positions in Chiridota sp. and C. heheva mitogenomes. The difference in gene order between P. rufescens and the MRCA of Chiridotidae (A9) can be explained by two transpositions, four reversals and a tandem-duplication-random-loss (TDRL) event.
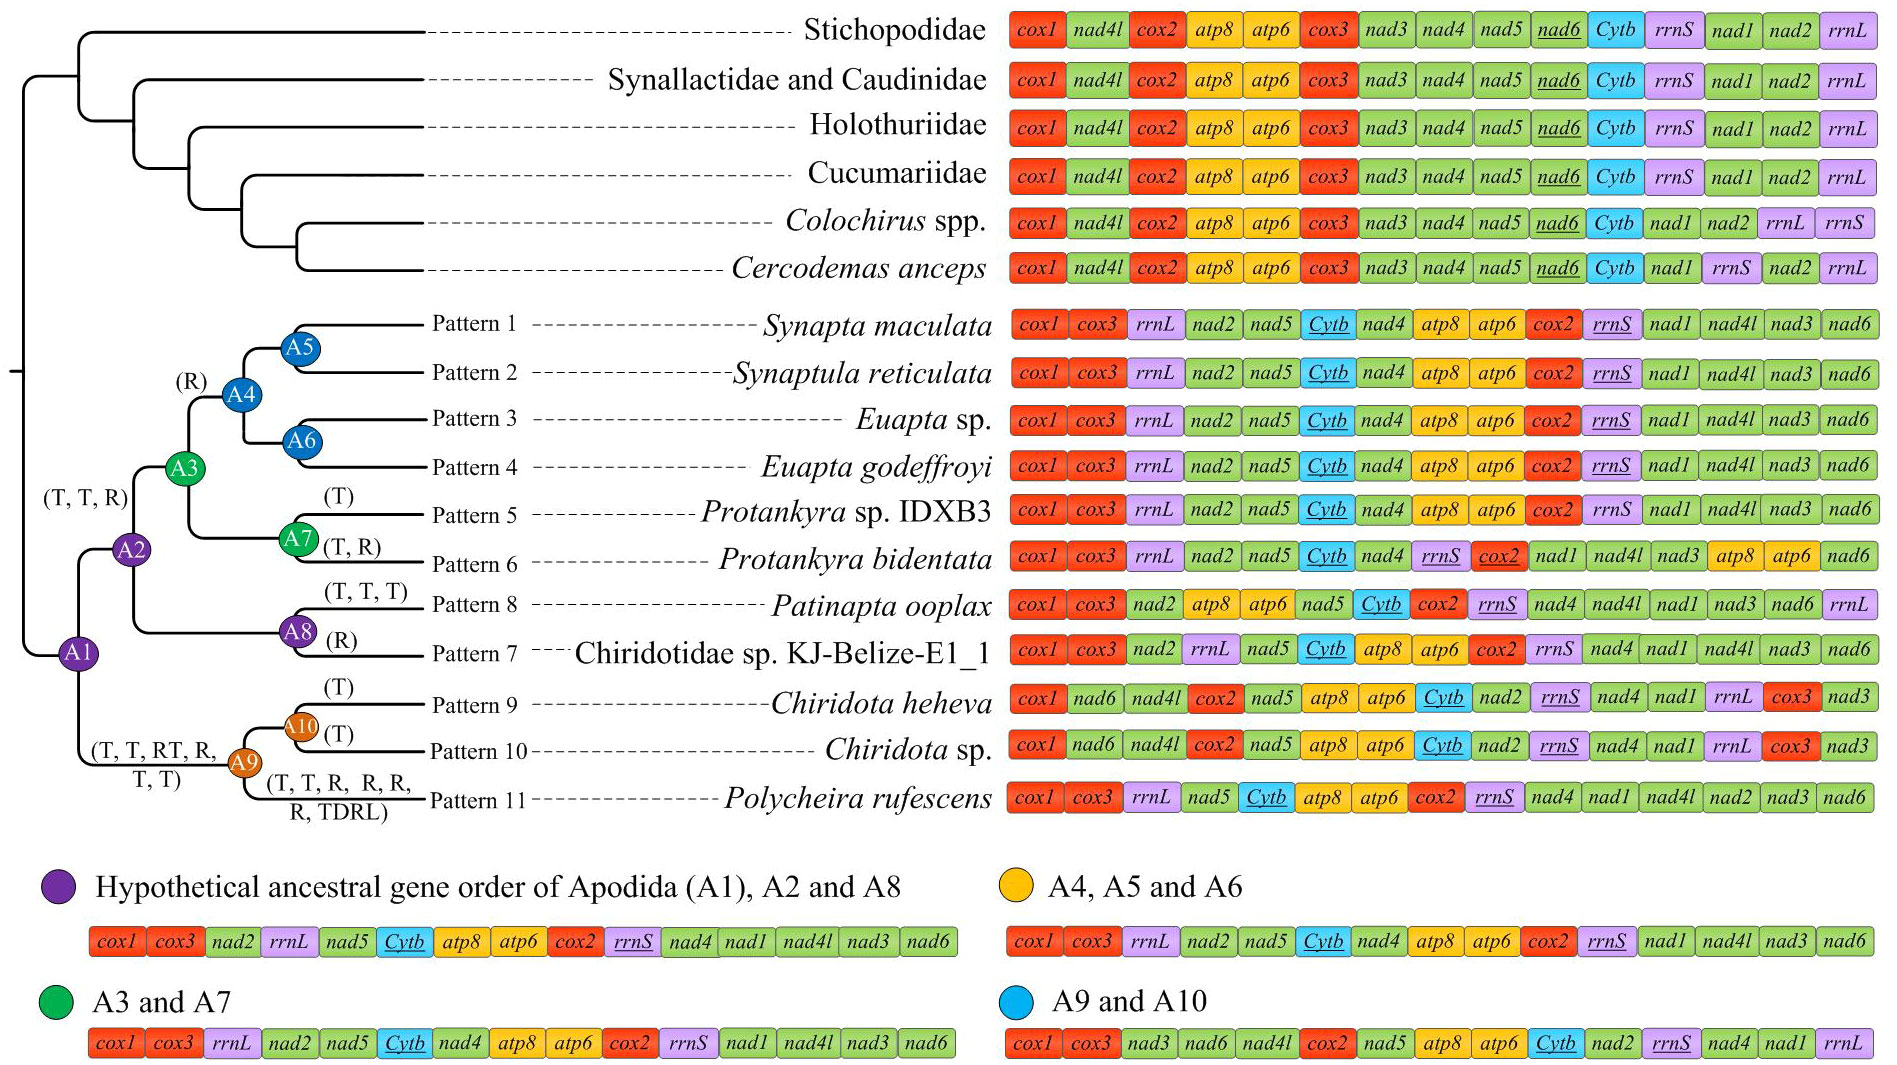
Figure 4 Comparison of gene arrangements of Apodida and the putative apodan ground patterns. tRNAs were excluded. The gene rearrangement events were estimated by CREx with “R” representing reversal event; “RT” representing reverse transposition; “T” representing transpositions; “TDRL” representing tandem-duplication-random-loss.
Phylogenetic relationships based on nucleotides with all codon positions and neutral transitions excluded model
The ML and BI based on nucleotide sequences from all codon positions (PCG123) recovered that the holothuroid species grouped into five well supported clades (Figure 5A). The orders Holothuriida, Dendrochirotida, Elasipodida and Apodida formed monophyletic clades, respectively, while Molpadida was not recovered as a sister group to Synallactida, instead appeared as a poorly supported subgroup within Synallactida. The order Apodida was placed in a well-supported basal branch, as a sister to the well-supported lineage containing all the remaining holothuroids. Notably, Apodida exhibits a long branch length in the tree, as well as the subclades. The eleven apodan species used in this analysis were grouped into Synaptidae + Chiridotidae clade. Within Synaptidae, the species were split into four sub-groups with high support values. The Protankyra and Euapta species formed two different branches. S. reticulata and S. maculata were grouped as a well-supported clade. The analyses showed a Chiridotidae sp. KJ-Belize-E1_1 + Patinapta ooplax clade as sister to other Synaptidae groups. Based on this topology, the Chiridotidae sp. KJ-Belize-E1_1 should be put in Synaptidae, but not as marked as its name. Three species belonging to the family Chiridotidae were clustered together.
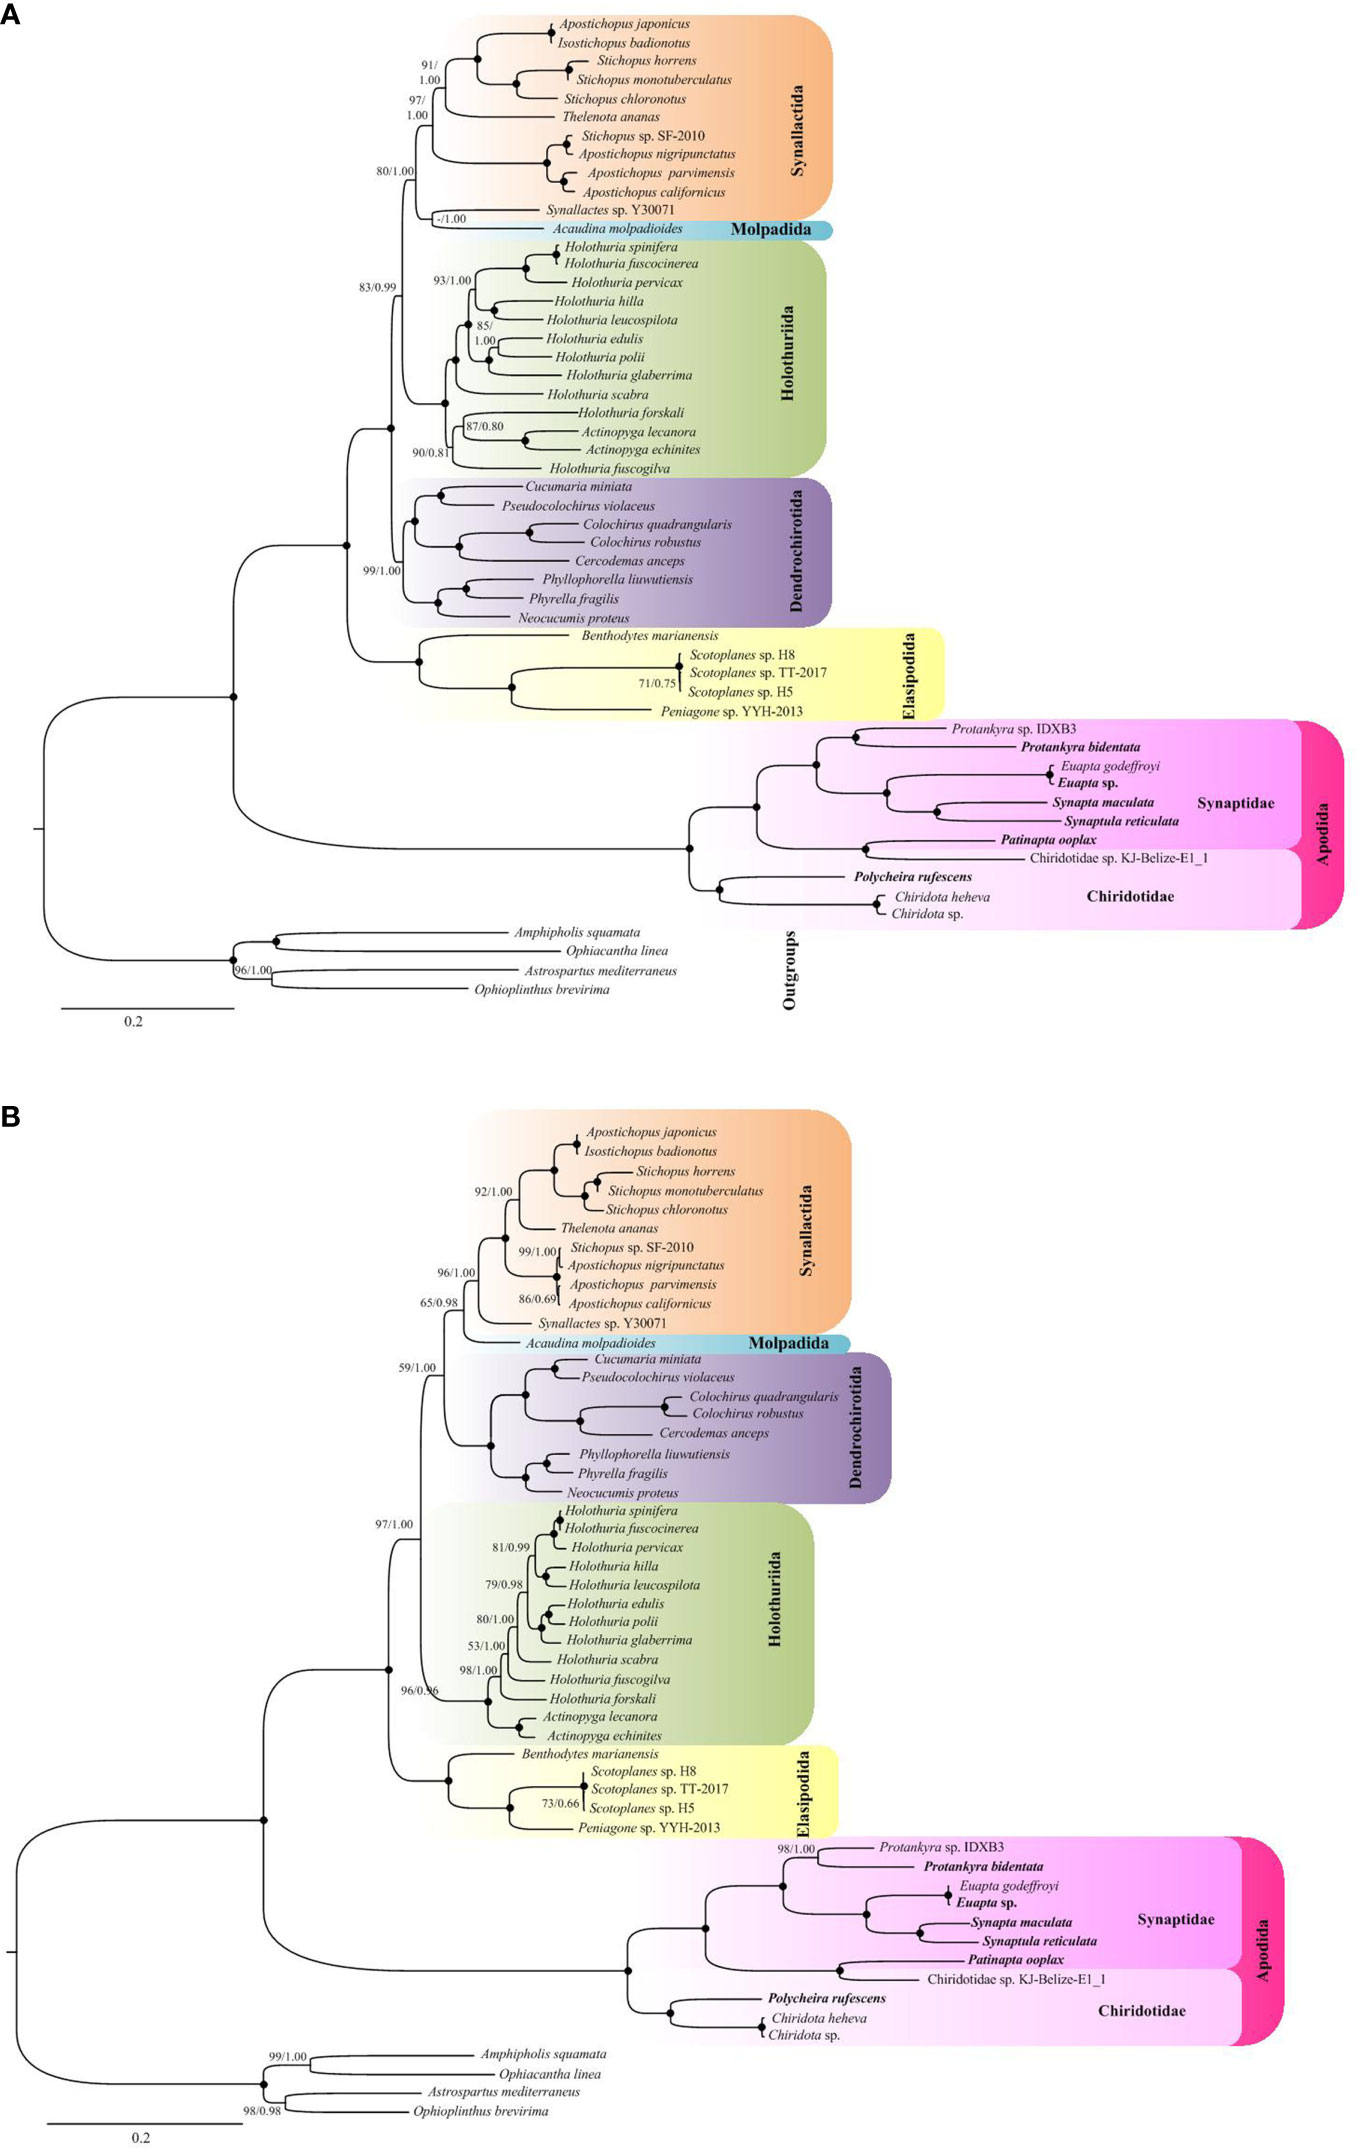
Figure 5 ML and BI trees based on (A) nucleotide sequences of 13 PCGs from all codon positions (PCG123) and (B) the neutral transitions excluded (NTE) model. The bootstrap probability and the Bayesian posterior probability were indicated at each node (BP/PP). The six newly sequenced apodan species were shown by bold taxa.
The recoded nucleotide data according to the Neutral Transitions Excluded (NTE) model yielded a phylogenetic tree that is slightly different from that of the full nucleotide data (Figure 5B). Unlike in the analysis with PCG123, all the five orders with multiple taxa were recovered as monophyletic in the NTE phylogeny. The order Molpadida with single species was recovered as sister group to the Synallactida clade, albeit with low support (65/0.98). In the NTE phylogenetic tree, Dendrochirotida, instead of Holothuriidaand, showed sister relationship with Molpadida + Synallactida. Relatively, the NTE analysis revealed a low variation in branch length. However, it did not ameliorate the long branch length of Apodida.
Divergence time and evolutionary rates
The molecular dating analysis under PCG123 and NTE dataset generated similar patterns of node ages, but NTE data produced younger ages for most nodes. (Figure 6). The split date between Apodida and the other holothuroids occurred in the boundary of Ordovician and Silurian (PCG123 vs NTE, 434.59 vs 434.09 Mya). The Apodida split into Chiridotidae and Synaptidae branches in the Middle Carboniferous (351.78 vs 321.46 Mya). In the Late Permian (283.23 vs 261.87 Mya), the family Synaptidae diverged into two lineages. Chiridotidae sp. KJ-Belize-E1_1 and P. ooplax shared a common ancestor, which diversified in the Lower Cretaceous (127.23 vs 113.52 Mya). Other Synaptidae species shared a common ancestor, starting their divergence in the boundary of the Triassic and Jurassic (225.62 vs 198.01 Mya). The modern Protankyra species diverged in the Early Cretaceous (125.14 vs 117.48 Mya). The split date between the Euapta species and S. maculata + S. reticulata group occurred in the boundary of the Jurassic and Cretaceous (149.01 vs 121.83 Mya). The lineage of Chiridotidae diversified in the Middle Jurassic (171.58 vs 166.11 Mya).
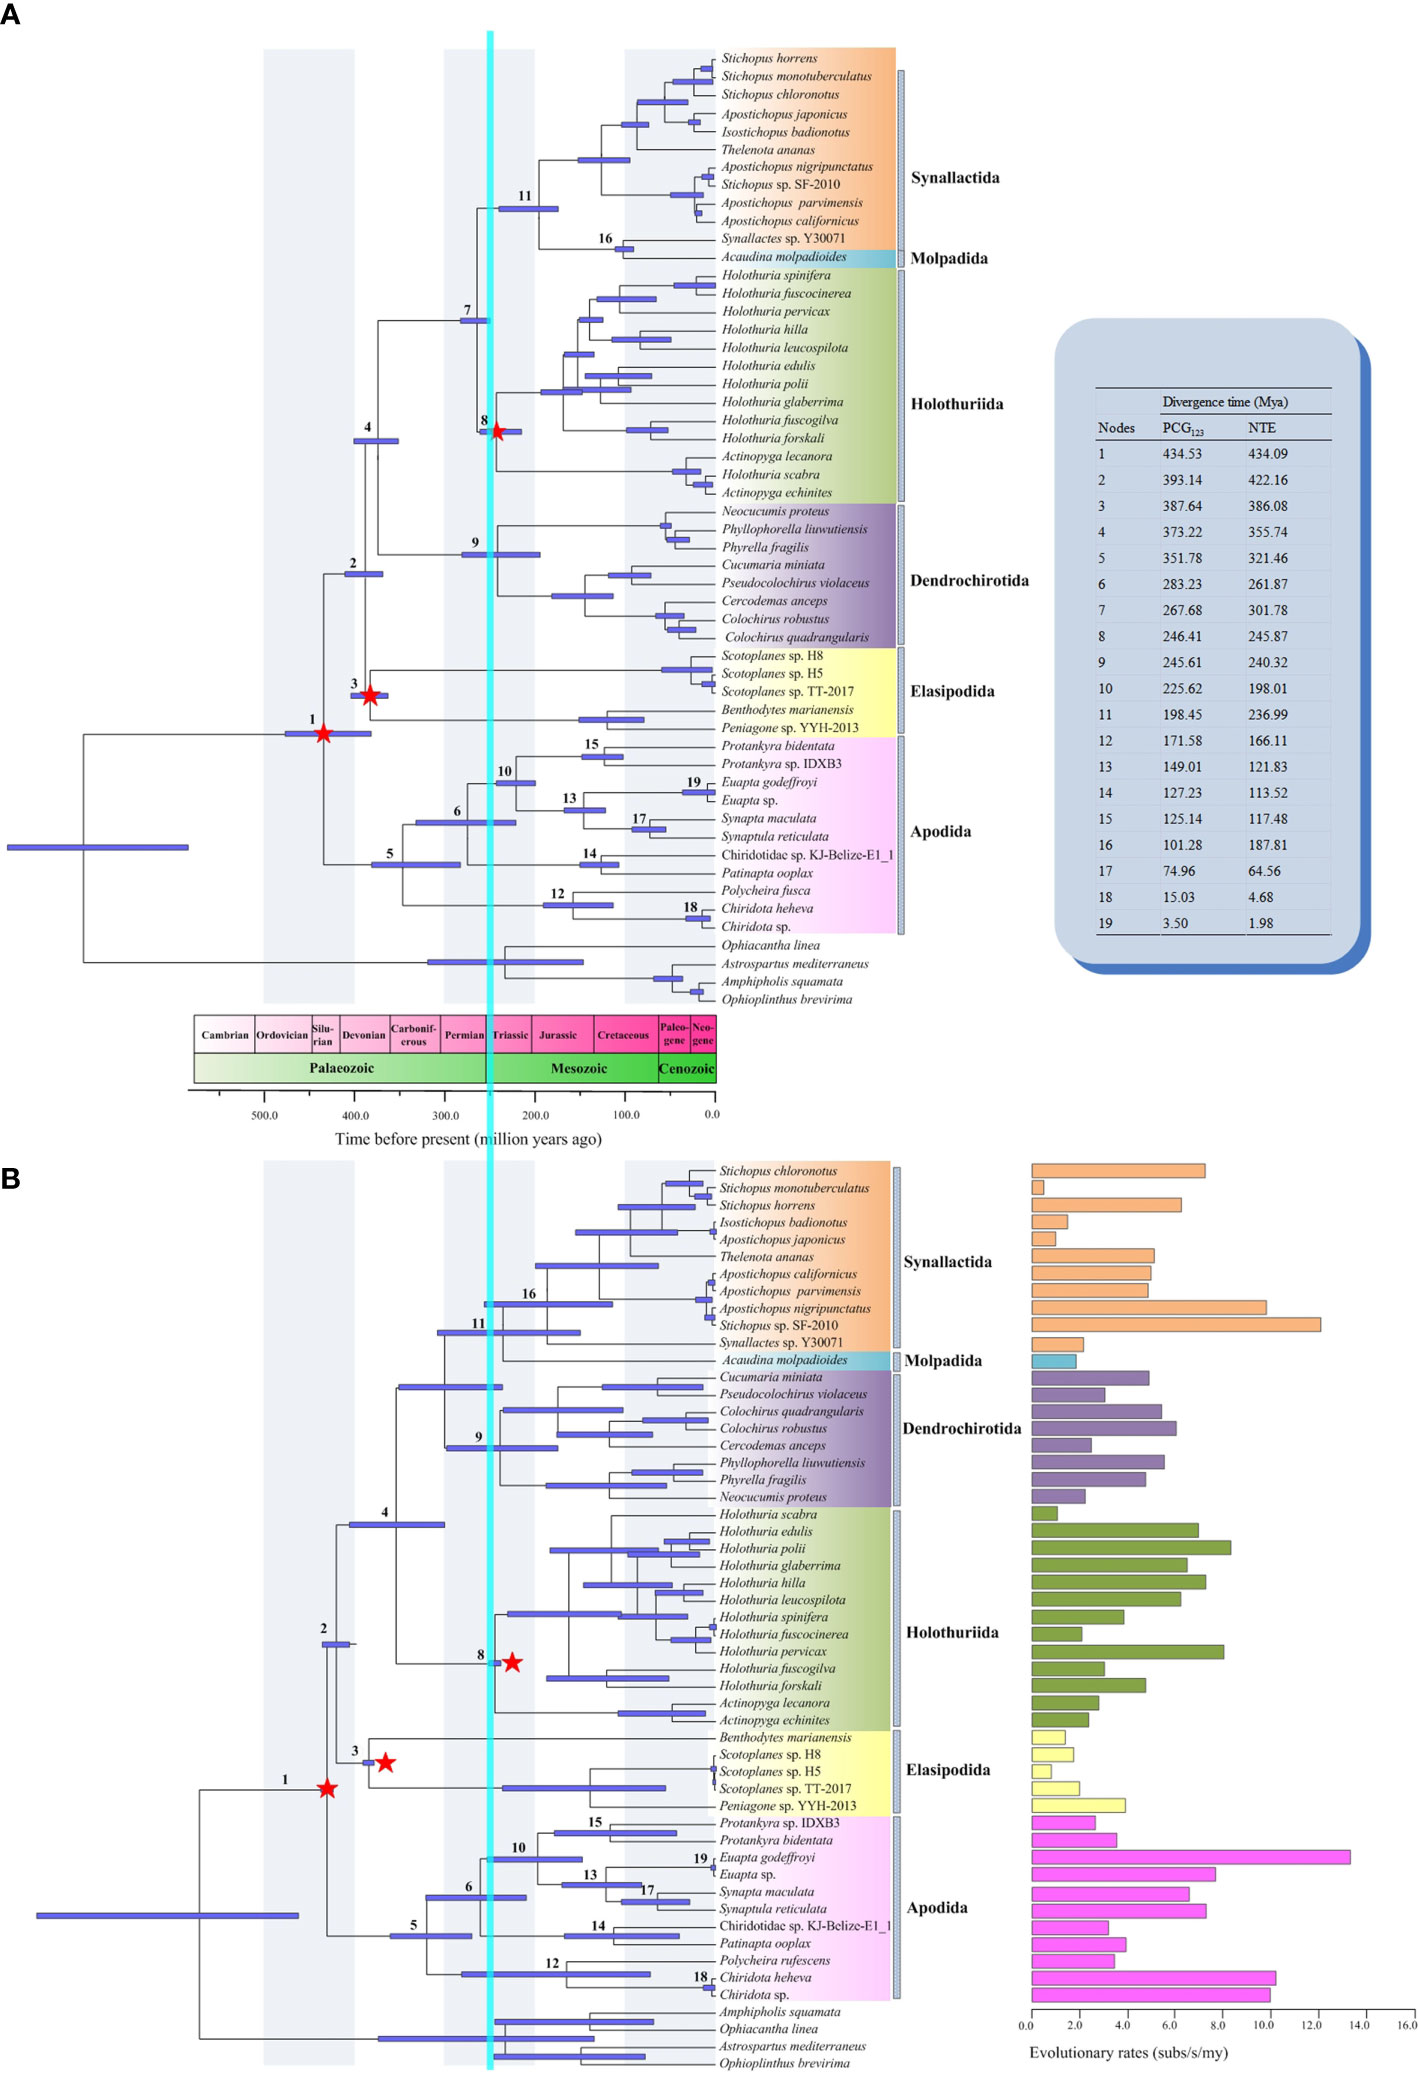
Figure 6 Divergence time chronograms of Holothuroidea estimated by BEAST based on (A) all codon positions (PCG123) and (B) the neutral transitions excluded (NTE) model. The divergence time of some nodes was shown in the upper right. The evolutionary rates were shown in the lower right. The 95% confidence intervals (HPD) for each node were indicated by light purple bars. The calibrated nodes were marked with red stars. The mass extinction between the Permian and Triassic was indicated by the vertical blue bar.
The nucleotide evolutionary rate (Vsubs) of the 13 PCGs in the 49 Holothuroidea mitogenomes were estimated and fixed in the topology of the NTE tree (Figure 6). The mean substitution rates of Holothuroidea was 0.0048 subs/s/my, and different order had different evolutionary rates. The mean substitution rate of Apodida was 0.0069 subs/s/my, which was significantly higher than that of other holothuroids (0.0043 subs/s/my) (Mann-Whitney U-test, p = 0.039) (Supplementary Table 6). The order of the average Vsubs among the 13 PCGs in Holothuroidea was as follows: cox1 < cox3 < cytb < cox2 < nad4l < atp6 < nad1 < nad5 < nad2 < nad3 < nad4 < atp8 < nad6.
Discussion
Mitogenome strand asymmetry and gene order organization
The strand asymmetry in nucleotide composition is one of the most remarkable features in animal mitogenomes, which may be mainly generated by the reversed asymmetric mutational constraints during the mtDNA replication process (Hassanin et al., 2005). The AT and GC-skew values are used to measure the nucleotide compositional asymmetry (Frank and Lobry, 1999). A negative GC-skew and negative or positive AT-skew are found in other holothuroids and other echinoderms (Sun et al., 2022a; Sun et al., 2023). However, apodans present an opposite pattern with positive GC-skews and negative AT-skews, suggesting their nucleotide usage bias towards an excess of T relative to A and of G relative to C nucleotides. The reverse strand compositional bias of Apodida presents in all the individual gene data sets, including PCGs, thus, may affect the amino acid composition (Min and Hickey, 2007; Sun et al., 2018), and further promote the homoplasious substitutions in the apodan holothuroids. Consequently, these biases may hamper the phylogeny reconstruction from the PCGs.
In the Metazoa, the taxa with reverse strand biases are usually coupled with rearranged gene order in the mitogenome (Hassanin et al., 2005). The Apodida seems a good representative. The gene order of the eleven apodan mitogenomes diverged substantially with other available holothuroid mitogenomes, and also present high interspecific variability. This association was also found in some molluscs, echinoderms and annelids (Scouras and Smith, 2006; Sun et al., 2018; Sun et al., 2021a). Sun et al. (2018) compared the strand asymmetry across 140 mollusc species and suggested that both the presence of the strand asymmetry and rearranged gene order maybe result from the same mechanism. The inversion of the control region is hypothesised to explain the occurrence of both the nucleotide bias and gene rearrangement (Hassanin et al., 2005; Scouras and Smith, 2006).
Mitochondrial genome rearrangement
No putative ground pattern of Holothuroidea was found in Apodida, and the gene order in the two Apodida clades, Synaptidae and Chiridotidae, differed dramatically from each other, as well as from other holothuroids. Although the tRNA genes were not considered in the reconstruction of ancestral gene order, the gene arrangement of apodans still diversified. The conserved gene block cox1-cox3-rrnL-nad2-nad5-cytb-nad4 might represent the ground pattern for Synaptidae. The estimation of ancestral gene order reveals a total of four ancestral states (as marked in Figure 4). Only S. reticulata, S. maculata, Euapta sp. and E. godeffroyi shared the gene order of their most recent common ancestor, and none of other apodan gene arrangement pattern can represent their ancestral states. We suggest that higher variation in Apodida mitochondrial gene order may be not restricted to the analysed species, but should be found order-wide.
In the metazoans, high-level mitochondrial gene rearrangement usually corresponds to accelerated nucleotide substitution rates. This correlation has been observed in the nematode, insect, molluscs, brachiopod and crustacean mitogenomes (Hu et al., 2003; Shao et al., 2003; Rawlings et al., 2010; Luo et al., 2015; Plazzi et al., 2016; Sun et al., 2022b). Also, the high diversity of mitochondrial gene order in Apodida coupled with the high evolutionary rates observed in our present study. Some underlying factors, like relaxed repair mechanisms, and high mutational stress in combination with lower importance of mitochondrial efficiency, have been hypothesised to affect both gene rearrangement and substitution rate (Bernt et al., 2013a; Sun et al., 2021a).
Phylogenetic relationships recovered by the mitochondrial genome
In this study, we presented the first mitochondrial phylogenetic study for apodan holothuroids. Phylogenetic analyses supported the monophyly and basal position of Apodida (Synaptidae + Chiridotidae), which agree with the previous results base on morphology and molecular phylogenetic studies of multiple gene fragments (Becher, 1909; Haude, 1992; Smith, 1997; Kerr and Kim, 2001; Lacey et al., 2005; Reich, 2010; Smirnov, 2012; Miller et al., 2017). Within the Apodida lineage, an unnamed species Chiridotidae sp. KJ-Belize-E1_1 (MT877116) was placed in a branch as a sister group to synaptid P. ooplax, instead of Chiridotidae species. So the two families, Synaptidae and Chiridotidae, were not recovered as monophyletic, which seems not consistent with that reconstructed based on morphology data, as suggested by Smirnov (1998). In the study of Smirnov (1998), Synaptidae and Chiridotidae formed well supported sister group. Using cladistic analyses of 34 morphological characters, Kerr (2001) revealed the Chiridotidae was paraphyletic at the subfamily level, in which Chiridotinae was clustered with the Synaptidae clade instead of being a sister group to species of Taeniogyrinae. Owing to the absence of taxon sampling from Taeniogyrinae, the relationship between Chiridotinae and Taeniogyrinae cannot be validated in our study. The family Synaptidae was previously recognised as a paraphyletic clade in a phylogeny based on six gene fragments (COI, 16S, 12S, H3, 18S, 28S) (Miller et al., 2017). A similar placement of Synaptidae was also revealed based on mitogenomes in our analysis. Of course, if the species Chiridotidae sp. KJ-Belize-E1_1 was from the family Synaptidae, instead of Chiridotidae, the relationship between Synaptidae and Chiridotidae needs to be revised.
It has been suggested that a reverse strand compositional bias in the mitogenome can drive convergent nucleotide substitutions, which may further mislead phylogenetic analyses (Hassanin et al., 2005; Hassanin, 2006). This scheme has been used to overcome the confounded phylogenetic inference caused by the strand bias (Hassanin, 2006; Jones et al., 2007; Sun et al., 2023). In the NTE model, all neutral and nearly-neutral sites were removed, because the substitution types of these sites are most likely to be influenced by the reverse strand bias. To ameliorate the misleading effects of reversed patterns in nucleotide bias, a Neutral Transitions Excluded (NTE) strategy was applied in our analysis. In the present study, almost all the same lineages were recovered using both codon positions and the NTE model. The most notable exception was that the order Synallactida was revealed as monophyletic in the NTE phylogeny, with Molpadida as a sister group. The monophyly of Synallactida and Molpadida has been supported in recent molecular analyses (Miller et al., 2017). On the other hand, in the NTE phylogeny, the order Holothuriida was noticed as the next group to diverge after the order Elasipodida. These results are consistent with previous views (Miller et al., 2017; Sun et al., 2021b). Thus, we believe the NTE-phylogeny may be a more accurate summary of holothuroid relationships. However, the order Apodida still showed a long branch in the NTE-phylogeny. It’s difficult to know why this is, but we see an alternative explanation. The NTE algorithm recommends RY recoding of the first codon positions of CTN (LCUN) and TTN (F and LUUR), and of all three codon positions of ACN (T), ATN (I and M), GCN (A), and GTN (V) (Hassanin et al., 2005). Our results indicate that, the greatest differences in amino acid abundance between Apodida and other holothuroids are in LCUN, LUUR, V, T and K. Thus, NTE recoding may lead to a loss of some useful information for phylogenetic relationships. In addition, the abundance of Lysine (K) is significantly different between Apodida and other holothuroids, while NTE recoding cannot account for this bias.
Former phylogenetic analyses of bilateralian mitogenomes revealed that some taxa with long-branch frequently present a negative AT skew and positive GC skew (Bernt et al., 2013a). Similar patterns of the AT and GC skews were discovered in the apodan species examined in this study. This coincides with the hypothesis that taxa featured by reverse strand bias tend to gather together owning to the long-branch attraction artifacts (Hassanin et al., 2005). The strand asymmetry and the high amino acid genetic distance between Apodida spp. and other holothuroid species indicated distinct selective pressures and faster evolutionary rates in apodan mitogenomes. In the phylogenetic analysis using mitochondrial (COI, 16S, 12S) and nuclear (H3, 18S, 28S) gene fragments, Synaptidae and Chiridotidae did not show long branches, while the branch length for Myriotrochidae (Myriotrochus spp.) was much longer than other branches, and the authors believe that this disparity resulted from COI sequence (Miller et al., 2017). Thus, the accelerated substitution rate may occur more in the mitogenomes of Apodida as indicated by (Sun et al., 2021b).
Origin time of Apodida
The divergence time estimated here provided insights into the understanding of the apodan evolutionary history. Apodida represents one of the most ancient clades within Holothuroidea, and the split between the Apodida and other holothuroid orders occurred between Silurian and Ordovician. Under PCG123 data, the ancestor of Apodida originated in the Early Carboniferous (351.78 Mya) and the major diversification happened in the Cretaceous. The NTE algorithm reduced the influence of strand bias by removing the bases at neutral and nearly-neutral positions, thus generating younger origin time (321.46 Mya). Our estimated origin time is much earlier than the estimation of Miller et al. (2017) (259-282 Mya) based on gene fragments (COI, 16S, 12S, H3, 18S, 28S). However, one matter of agreement is that both two studies support that the apodans radiation transitioned the Permian-Triassic mass extinction event, which was believed to result in approximately 80% marine biodiversity loss (Alroy et al., 2008). This result suggested that apodans can survive in the extinction events that occurred in the boundary of the Permian and Triassic, which were accompanied by abrupt climate change and widespread oceanic anoxic zones.
Evolutionary rates of Apodida
The evolutionary rate of mitogenomes and individual genes in Holothuroidea were estimated in our study. The average evolutionary rate of Holothuroidea mitogenomes was 0.0048 subs/s/my. The order of the mean Vsubs among the six holothuroid orders was as follows: Apodida (0.0069 subs/s/my) > Synallactida (0.0050 subs/s/my) > Holothuriida (0.0039 subs/s/my) > Dendrochirotida (0.0022 subs/s/my) > Elasipodida (0.0021 subs/s/my) > Molpadida (0.0018 subs/s/my). Apodida showed significantly higher Vsubs than that of other holothuroids (0.0043 subs/s/my), indicating that the mitogenome of Apodida was subjected to more relaxed selection pressure. One possible explanation for the accelerated evolutionary rate discovered in apodans is an adaptation to their special motion and respiratory patterns. The two remarkable features of Apodida are the absence of tube feet and the respiratory tree (Martins and Souto, 2020). Thus, various parts of the body, such as the body wall, tentacles, papillae and/or dermal ossicles, are used to locomote (Kerr, 2000), and gas exchange is achieved through their thin body wall (Smiley et al., 1991). The locomotory capacity and respiratory efficiency can affect the evolution of animal mitogenome (Das, 2006). Furthermore, the positive correlation between the low locomotory capacity and the stronger purifying selection on the mitogenome has been confirmed in molluscs, crustaceans and insects (Mitterboeck and Adamowicz, 2013; Sun et al., 2017; Jakovlić et al., 2021). Following the evidence that mitogenomic evolution is faster in the species with low locomotory ability, we hypothesise that locomotory capacity may be one of the factors which explain the higher mitogenomic evolutionary rates. In other words, the apodans may have evolved specific adaptive mechanisms for locomotion and respiration, which is linked to the fast evolution of the mitochondrial respiratory genes.
The individual genes showed different evolutionary rates in our analysis. The nad6 gene has the fastest evolutionary rate (1.8031 subs/s/my), while cox1 has the slowest one (0.0035 subs/s/my). This pattern indicated that the nad6 gene was under relaxed selection pressures, at the same time, the cox1 gene received strict selection constrains. It is noteworthy that the evolutionary rate of the cox1 gene estimated by our molecular clock differs drastically from that of echinoderms (0.02-0.05 per million years) based on the divergence after the closure of the Isthmus of Panama (Benzie, 1999; Lessios et al., 2001). Thus, the evolutionary rate of cox1 corresponding to the closure of the Central American Seaway should be used with caution. Just as suggested by Marko (2002) and Borrero-Perez et al. (2010), the rates of molecular evolution can be greatly overestimated when the clocks of marine organisms were calibrated with final seaway closure.
Conclusions
In this study, we discovered that the mitogenomes of apodans have experienced dramatic evolutionary changes, exhibiting shifts in both nucleotide and amino acid usage, extensive gene rearrangements and accelerated substitution rate. Rapid substitution of the mitochondrial PCGs resulted in the long branches of Apodida in the phylogenetic tree. The NTE-phylogeny showed a more accurate summary of holothuroid relationships with low variation of branch length. The time-calibrated phylogenetic tree revealed that Apodida has evolved more than 300 Mya and survived the extinction events that occurred in the boundary of the Permian and Triassic. The PCG123 dataset was produced relatively earlier age than that from NTE. The average evolutionary rate of Apodida was 0.0069 subs/s/my, which is significantly higher than that of other holothuroids. The absence of tube feet and the respiratory tree make apodans unique among holothuroids and might also be an important factor for the unusually fast evolution of mitogenome in this old holothuroid group.
Data availability statement
The datasets presented in this study can be found in online repositories. The names of the repository/repositories and accession number(s) can be found in the article/Supplementary Material.
Ethics statement
Ethical review and approval was not required for the study on animals in accordance with the local legislation and institutional requirements.
Author contributions
Data curation, S’ES. Funding acquisition, ZS and GN. Software, S’ES, WW, and NX. Writing - original draft, S’ES. Writing - review and editing, S’ES, GN, WW, ZS, NX, and ZX. All authors contributed to the article and approved the submitted version.
Funding
This study was supported by research grants from the Ministry of Science and Technology of China (2021YFF0502801), the Young Talent Program of Ocean University of China (No. 862201013143) and the National Key R&D Program of China (2022YFC3102403).
Conflict of interest
The authors declare that the research was conducted in the absence of any commercial or financial relationships that could be construed as a potential conflict of interest.
Publisher’s note
All claims expressed in this article are solely those of the authors and do not necessarily represent those of their affiliated organizations, or those of the publisher, the editors and the reviewers. Any product that may be evaluated in this article, or claim that may be made by its manufacturer, is not guaranteed or endorsed by the publisher.
Supplementary material
The Supplementary Material for this article can be found online at: https://www.frontiersin.org/articles/10.3389/fmars.2023.1219437/full#supplementary-material
References
Alroy J., Aberhan M., Bottjer D. J., Foote M., Fursich F. T., Harries P. J., et al. (2008). Phanerozoic trends in the global diversity of marine invertebrates. Science 321, 97–100. doi: 10.1126/science.1156963
Altschul S. F., Madden T. L., Schaffer A. A., Zhang J. H., Zhang Z., Miller W., et al. (1997). Gapped BLAST and PSI-BLAST: a new generation of protein database search programs. Nucleic Acids Res. 25, 3389–3402. doi: 10.1093/nar/25.17.3389
Barr C. M., Neiman M., Taylor D. R. (2005). Inheritance and recombination of mitochondrial genomes in plants, fungi, and animals. New Phytologist. 168, 39–50. doi: 10.1111/j.1469-8137.2005.01492.x
Benzie J. A. H. (1999). Major genetic differences between crown-of-thorns starfish (Acanthaster planci) populations in the Indian and Pacific Oceans. Evolution 53, 1782–1795. doi: 10.1111/j.1558-5646.1999.tb04562.x
Bernt M., Bleidorn C., Braband A., Dambach J., Donath A., Fritzsch G., et al. (2013a). A comprehensive analysis of bilaterian mitochondrial genomes and phylogeny. Mol. Phylogenet. Evol. 69, 352–364. doi: 10.1016/j.ympev.2013.05.002
Bernt M., Donath A., Jühling F., Externbrink F., Florentz C., Fritzsch G., et al. (2013b). MITOS: Improved de novo Metazoan Mitochondrial Genome Annotation. Mol. Phylogenet. Evol. 69, 313–319. doi: 10.1016/j.ympev.2012.08.023
Bernt M., Merkle D., Ramsch K., Fritzsch G., Perseke M., Bernhard D., et al. (2007). CREx: inferring genomic rearrangements based on common intervals. Bioinformatics 23, 2957–2958. doi: 10.1093/bioinformatics/btm468
Boczarowski A. (2001). Isolated sclerites of Devonian non-pelmatozoan echinoderms. Palaeontol. Pol. 59, 3–220.
Bolger A. W., Lohse M., Usadel B. (2014). Trimmomatic: a flexible trimmer for Illumina sequence data. Bioinformatics 30, 2114–2120. doi: 10.1093/bioinformatics/btu170
Boore J. L., Brown W. M. (1998). Big trees from little genomes: mitochondrial gene order as a phylogenetic tool. Curr. Opin. Genet. Dev. 8, 668–674. doi: 10.1016/S0959-437X(98)80035-X
Borrero-Perez G. H., Gomez-Zurita J., Gonzalez-Wanguemert M., Marcos C., Perez-Ruzafa A. (2010). Molecular systematics of the genus Holothuria in the Mediterranean and Northeastern Atlantic and a molecular clock for the diversification of the Holothuriidae (Echinodermata: Holothuroidea). Mol. Phylogenet. Evol. 57, 899–906. doi: 10.1016/j.ympev.2010.08.019
Brandt J. F (1835). “Echinodermata ordo Holothurina. In: Prodromus Descriptionis Animalium ab H. Mertensio in Orbis Terrarum Circumnavigatione Observatorum,” in Fasc. I: 75 pps. Petropoli. pp.42–62.
Cameron S. L. (2014). Insect mitochondrial genomics: Implications for evolution and phylogeny. Annu. Rev. Entomol. 59, 95–117. doi: 10.1146/annurev-ento-011613-162007
Das J. (2006). The role of mitochondrial respiration in physiological and evolutionary adaptation. Bioessays. 28, 890–901. doi: 10.1002/bies.20463
Drummond A. J., Suchard M. A., Xie D., Rambaut A. (2012). Bayesian phylogenetics with BEAUti and the BEAST 1.7. Mol. Biol. Evol. 29, 1969–1973. doi: 10.1093/molbev/mss075
Frank A. C., Lobry J. R. (1999). Asymmetric substitution patterns: a review of possible underlying mutational or selective mechanisms. Gene 238, 65–77. doi: 10.1016/S0378-1119(99)00297-8
Ghiselli F., Gomes-dos-Santos A., Adema C. M., Lopes-Lima M., Sharbrough J., Boore J. L. (2021). Molluscan mitochondrial genomes break the rules. Philos. Trans. R. Soc B-Biol. Sci. 376, 20200159. doi: 10.1098/rstb.2020.0159
Gissi C., Iannelli F., Pesole G. (2008). Evolution of the mitochondrial genome of Metazoa as exemplified by comparison of congeneric species. Heredity 101, 301–320. doi: 10.1038/hdy.2008.62
Hassanin A. (2006). Phylogeny of Arthropoda inferred from mitochondrial sequences: strategies for limiting the misleading effects of multiple changes in pattern and rates of substitution. Mol. Phylogenet. Evol. 38, 100–116. doi: 10.1016/j.ympev.2005.09.012
Hassanin A., Leger N., Deutsch J. (2005). Evidence for multiple reversals of asymmetric mutational constraints during the evolution of the mitochondrial genome of Metazoa, and consequences for phylogenetic inferences. Syst. Biol. 54, 277–298. doi: 10.1080/10635150590947843
Haude R. (1992). “Fossil holothurians: sclerite aggregates as ‘‘good” species,” in Echinoderm Research 1991. Eds. Scalera-Liaci L., Canicatti C. (Rotterdam: A.A. Balkema), 29–33. doi: 10.1201/9781003077572-5
Hu M., Chilton N. B., Gasser R. B. (2003). The mitochondrial genome of Strongyloides stercoralis (Nematoda)-idiosyncratic gene order and evolutionary implications. Int. J. Parasitol. 33, 1393–1408. doi: 10.1016/S0020-7519(03)00130-9
Hu F., Lin Y., Tang J. (2014). MLGO: phylogeny reconstruction and ancestral inference from gene-order data. BMC Bioinf. 15, 354. doi: 10.1186/s12859-014-0354-6
Jakovlić I., Zou H., Chen J. H., Lei H. P., Wang G. T., Liu J. Q., et al. (2021). Slow crabs - fast genomes: locomotory capacity predicts skew magnitude in crustacean mitogenomes. Mol. Ecol. 30, 5488–5502. doi: 10.1111/mec.16138
Jones M., Gantenbein B., Fet V., Blaxter M. (2007). The effect of model choice on phylogenetic inference using mitochondrial sequence data: lessons from the scorpions. Mol. Phylogenet. Evol. 43, 583–595. doi: 10.1016/j.ympev.2006.11.017
Kerr A. M. (2000). Evolution and systematics of Holothuroidea (Echinodermata) [dissertation] (New Haven (CT: Yale University).
Kerr A. M. (2001). Phylogeny of the apodan holothurians (echinodermata) inferred from morphology. Zool. J. Linn. Soc 133, 53–62. doi: 10.1111/j.1096-3642.2001.tb00622.x
Kerr A. M., Kim J. (2001). Phylogeny of Holothuroidea (Echinodermata) inferred from morphology. Zool. J. Linn. Soc 133, 63–81. doi: 10.1111/j.1096-3642.2001.tb00623.x
Lacey K., McCormack G., Keegan B., Powell R. (2005). Phylogenetic relationships within the class Holothuroidea, inferred from 18S rRNA gene data. Mar. Biol. 147, 1149–1154. doi: 10.1007/s00227-005-0009-2
Lanfear R., Frandsen P. B., Wright A. M., Senfeld T., Calcott B. (2017). PartitionFinder 2: New methods for selecting partitioned models of evolution for molecular and morphological phylogenetic analyses. Mol. Biol. Evol. 34, 772–773. doi: 10.1093/molbev/msw260
Lee W., Park J., Choi J., Jung K., Park B., Kim D., et al. (2009). Imgd: an integrated platform supporting comparative genomics and phylogenetics of insect mitochondrial genomes. BMC Genomics 10, 148. doi: 10.1186/1471-2164-10-148
Lessios H. A., Kessing B. D., Pearse J. S. (2001). Population structure and speciation in tropical seas: Global phylogeography of the sea urchin Diadema. Evolution 55, 955–975. doi: 10.1554/0014-3820(2001)055[0955:PSASIT]2.0.CO;2
Li Y., Kocot K. M., Tassia M. G., Cannon J. T., Bernt M., Halanych K. M. (2019). Mitogenomics reveals a novel genetic code in Hemichordata. Genome Biol. Evol. 11, 29–41. doi: 10.1093/gbe/evy254
Luo Y. J., Satoh N., Endo K. (2015). Mitochondrial gene order variation in the brachiopod Lingula anatina and its implications for mitochondrial evolution in lophotrochozoans. Mar. Genomic. 24, 31–40. doi: 10.1016/j.margen.2015.08.005
Macey J. R., Schulte J. A., Larson A. (2000). Evolution and phylogenetic information content of mitochondrial genomic structural features illustrated with acrodont lizards. Syst. Biol. 49, 257–277. doi: 10.1093/sysbio/49.2.257
Marko P. (2002). Fossil calibration of molecular clocks and the divergence times of geminate species pairs separated by the Isthmus of Panama. Mol. Biol. Evol. 19, 2005–2021. doi: 10.1093/oxfordjournals.molbev.a004024
Martins L., Souto C. (2020). Taxonomy of the Brazilian Apodida (Holothuroidea), with the description of two new genera. Mar. Biol. Res. 16, 219–255. doi: 10.1080/17451000.2020.1761027
Miller A. K., Kerr A. M., Paulay G., Reich M., Wilson N. G., Carvajal J. I., et al. (2017). Molecular phylogeny of extant Holothuroidea (Echinodermata). Mol. Phylogenet. Evol. 111, 110–131. doi: 10.1016/j.ympev.2017.02.014
Min J. X., Hickey A. D. (2007). DNA Asymmetric Strand Bias Affects the Amino Acid Composition of Mitochondrial Proteins. DNA Res. 14, 201–206. doi: 10.1093/dnares/dsm019
Minh B. Q., Nguyen M. A. T., von Haeseler A. (2013). Ultrafast approximation for phylogenetic bootstrap. Mol. Biol. Evol. 30, 1188–1195. doi: 10.1093/molbev/mst024
Mitterboeck T. F., Adamowicz S. J. (2013). Flight loss linked to faster molecular evolution in insects. Proc. R. Soc B-Biol. Sci. 280, 20131128. doi: 10.1098/rspb.2013.1128
Ogawa A., Hiruta F. S., Aung M. M., Fujita T. (2022). Complete mitochondrial genome of a sea cucumber, Euapta godeffroyi (Echinodermata, Holothuroidea, Apodida, Synaptidae). Mitochondrial DNA Part B-Resour. 7, 1457–1459. doi: 10.1080/23802359.2022.2107462
Paulay G., Hansson H. (2013) Holothuroidea. Accessed Through: World Register of Marine Species. Available at: http://www.marinespecies.org/aphia.php?p=taxdetails&id=123083.
Perna N. T., Kocher T. D. (1995). Patterns of nucleotide composition at fourfold degenerate sites of animal mitochondrial genomes. J. Mol. Evol. 41, 353–358. doi: 10.1007/BF01215182
Pesole G., Gissi C., Chirico A. D., Saccone C. (1999). Nucleotide substitution rate of mammalian mitochondrial genomes. J. Mol. Evol. 48, 427–434. doi: 10.1007/PL00006487
Plazzi F., Puccio G., Passamonti M. (2016). Comparative Large-Scale Mitogenomics Evidences Clade-Specific Evolutionary Trends in Mitochondrial DNAs of Bivalvia. Genome Biol. Evol. 8, 2544–2564. doi: 10.1093/gbe/evw187
Rambaut A., Drummond A. J., Xie D., Baele G., Suchard M. A. (2018). Posterior summarization in Bayesian phylogenetics using tracer 1.7. Syst. Biol. 67, 901–904. doi: 10.1093/sysbio/syy032
Rambaut A., Suchard M. A., Xie D., Drummond A. J. (2013) Tracer v1.6. Available at: http://tree.bio.ed.ac.uk/software/tracer/.
Rawlings T. A., MacInnis M. J., Bieler R., Boore J. L., Collins T. M. (2010). Sessile snails, dynamic genomes: gene rearrangements within the mitochondrial genome of a family of caenogastropod molluscs. BMC Genom. 11, 440. doi: 10.1186/1471-2164-11-440
Reich M. (2004). “Aspidochirote holothurians (Echinodermata) from the Middle Triassic of southern Germany,” in Echinoderms. Eds. Heinzeller T., Nebelsick J. H. (Leiden: München. A.A. Balkema Publishers), 485–486. doi: 10.1201/9780203970881.ch80
Reich M. (2010). “The early evolution and diversification of holothurians (Echinozoa),” in Proceedings of the 12th International Echinoderm Conference. Eds. Harris L. G., Böttger S. A., Walker C. W., Lesser M. P. (Durham (NH: Taylor and Francis Group), 55–59. doi: 10.1201/9780203869543-c9
Reich M. (2015). “Different pathways in early evolution of the holothurian calcareous ring?,” in Progress in echinoderm Palaeobiology. Cuadernos del Museo Geominero, vol. 19 . Eds. : Zamora S., Rábano I. (Madrid: Instituto Geológico y Minero de España), 137–145.
Reich A., Dunn C., Akasaka K., Wessel G. (2015). Phylogenomic analyses of Echinodermata support the sister groups of Asterozoa and Echinozoa. PloS One 10, e0119627. doi: 10.1371/journal.pone.0119627
Ronquist F., Huelsenbeck J. P. (2003). MrBayes 3: Bayesian phylogenetic inference undermixed models. Bioinformatics 19, 1572–1574. doi: 10.1093/bioinformatics/btg180
Scouras A., Smith M. J. (2006). The complete mitochondrial genomes of the sea lily Gymnocrinus richeri and the feather star Phanogenia gracilis: Signature nucleotide bias and unique nad4L gene rearrangement within crinoids. Mol. Phylogenet. Evol. 39, 323–334. doi: 10.1016/j.ympev.2005.11.004
Semper C (1867). “Holothurien. In: Semper, C., ed,” in Reisen im Archipel der Philippinen. Zweiter Theil. Wissenschaftliche Resultate. Erster Band. Leipzig. Engelmann.. Mooi W., 40.
Shao R. F., Dowton M., Murrell A., Barker S. C. (2003). Rates of Gene Rearrangement and Nucleotide Substitution Are Correlated in the Mitochondrial Genomes of Insects. Mol. Biol. Evol. 20, 1612–1619. doi: 10.1093/molbev/msg176
Smiley S., McEuen F. S., Chaffee C., Krishnan S. (1991). “Echinodermata: Holothuroidea,” in Reproduction of marine invertebrates. Vol. VI. Echinoderms and lophophorates. Eds. Giese A. C., Pearse J. S., Pearse V. B. (Pacific Grove (CA: The Boxwood Press), 663–750.
Smirnov A. V. (1998). “On the classification of the apodid holothurians,” in Echinoderms: San Francisco. Eds. Mooi R., Telford M. (Rotterdam: Balkema), 517–522.
Smirnov A. V. (2012). System of the class Holothuroidea. Paleontol. J. 46, 793–832. doi: 10.1134/S0031030112080126
Smith A. B. (1997). Echinoderm larvae and phylogeny. Annu. Rev. Ecol. Syst. 28, 219–241. doi: 10.1146/annurev.ecolsys.28.1.219
Stöger I., Schrödl. M. (2013). Mitogenomics does not resolve deep molluscan relationships (yet?). Mol. Phylogenet. Evol. 376, 1825. doi: 10.1016/j.ympev.2012.11.017
Sun Y., Daffe G., Zhang Y., Pons J., Qiu J. W., Kupriyanova K. E. (2021a). Another blow to the conserved gene order in annelida: evidence from mitochondrial genomes of the calcareous tubeworm genus Hydroides. Mol. Phylogenet. Evol. 160, 107124. doi: 10.1016/j.ympev.2021.107124
Sun S., Jiang W., Yuan Z., Sha. Z. (2022b). Mitogenomes Provide Insights Into the Evolution of Thoracotremata (Brachyura: Eubrachyura). Front. Mar. Sci. 9. doi: 10.3389/fmars.2022.848203
Sun S., Li Q., Kong L., Yu H. (2017). Limited locomotive ability relaxed selective constraints on molluscs mitochondrial genomes. Sci. Rep. 7, 1–8. doi: 10.1038/s41598-017-11117-z
Sun S., Li Q., Kong L., Yu H. (2018). Multiple reversals of strand asymmetry in molluscs mitochondrial genomes, and consequences for phylogenetic inferences. Mol. Phylogenet. Evol. 118, 222–231. doi: 10.1016/j.ympev.2017.10.009
Sun S., Sha Z., Xiao N. (2021b). The first two complete mitogenomes of the order Apodida from deep-sea chemoautotrophic environments: New insights into the gene rearrangement, origin and evolution of the deep-sea sea cucumbers. Comp. Biochem. Physiol. D-Genomics Proteomics 39, 100839. doi: 10.1016/j.cbd.2021.100839
Sun S., Xiao N., Sha Z. (2022a). Complete mitochondrial genomes of four deep-sea echinoids: conserved mitogenome organization and new insights into the phylogeny and evolution of Echinoidea. PeerJ 10, e13730. doi: 10.7717/peerj.13730
Sun S., Xiao N., Sha Z. (2023). Mitogenomes provide insights into the phylogeny and evolution of brittle stars (Echinodermata, Ophiuroidea). Zool. Scr. 52, 17–30. doi: 10.1111/zsc.12576
Tamura K., Peterson D., Peterson N., Stecher G., Nei M., Kumar S. (2011). MEGA5: molecular evolutionary genetics analysis using maximum likelihood, evolutionary distance, and maximum parsimony methods. Mol. Biol. Evol. 28, 2731–2739. doi: 10.1093/molbev/msr121
Telford M. J., Herniou E. A., Russell R. B., Littlewood D. T. (2000). Changes in mitochondrial genetic codes as phylogenetic characters: two examples from the flatworms. Proc. Natl. Acad. Sci. U.S.A. 97, 11359–11364. doi: 10.1073/pnas.97.21.11359
Trifinopoulos J., Nguyen L. T., von Haeseler A., Minh B. Q. (2016). W-IQ-TREE: A fast online phylogenetic tool for maximum likelihood analysis. Nucleic Acids Res. 44, W232–W235. doi: 10.1093/nar/gkw256
Vaidya G., Lohman D. J., Meier R. (2011). Sequencematrix: concatenation software for the fast assembly of multi-gene datasets with character set and codon information. Cladistics-Int. J. Willi Hennig Soc 27, 171–180. doi: 10.1111/j.1096-0031.2010.00329.x
von Marenzeller E (1882). “Neue Holothurien von Japan und China. Verhandlungen der kaiserlich-königlichen zoologisch-botanischen Gesellschaft in Wien, 31 121–140.
Weigert A., Golombek A., Gerth M., Schwarz F., Struck T. H., Bleidorn C. (2016). Evolution of mitochondrial gene order in Annelida. Mol. Phylogenet. Evol. 94, 196–206. doi: 10.1016/j.ympev.2015.08.008
Wickham H. (2017) Tidyverse: Easily install and load the ‘tidyverse’. Available at: https://CRAN.R-project.org/package=tidyverse.
WoRMS (2023) Holothuroidea. Available at: https://www.marinespecies.org/aphia.php?p=taxdetails&id=123083.
Yang Z. (2007). PAML 4: phylogenetic analysis by maximum likelihood. Mol. Biol. Evol. 24, 1586–1591. doi: 10.1093/molbev/msm088
Keywords: mitochondrial genome, Holothuroidea, Apodida, gene order, phylogenetic relationships, evolutionary rate
Citation: Sun S’e, Ni G, Wang W, Sha Z, Xiao N and Xiaoqi Z (2023) Highly rearranged gene orders and rapid evolutionary rates in the mitochondrial genomes of Apodida (Echinodermata: Holothuroidea). Front. Mar. Sci. 10:1219437. doi: 10.3389/fmars.2023.1219437
Received: 09 May 2023; Accepted: 10 July 2023;
Published: 30 August 2023.
Edited by:
Li Gong, Zhejiang Ocean University, ChinaReviewed by:
Zhengfei Wang, Yancheng Teachers University, ChinaXin Shen, Jiangsu Ocean University, China
Copyright © 2023 Sun, Ni, Wang, Sha, Xiao and Xiaoqi. This is an open-access article distributed under the terms of the Creative Commons Attribution License (CC BY). The use, distribution or reproduction in other forums is permitted, provided the original author(s) and the copyright owner(s) are credited and that the original publication in this journal is cited, in accordance with accepted academic practice. No use, distribution or reproduction is permitted which does not comply with these terms.
*Correspondence: Zhongli Sha, c2hhemxAcWRpby5hYy5jbg==
†These authors have contributed equally to this work and share first authorship