 Defri Yona1,2*
 Pratiwi Nooraini1Sisylia Eka Narriyah Putri1Syarifah Hikmah Julinda Sari1,2Riski Agung Lestariadi3Akhmad Amirudin4
- 1Marine Science Department, Fisheries and Marine Science Faculty, Brawijaya University, Malang, Indonesia
- 2Marine Resources Exploration and Management (MEXMA) Research Group, Fisheries and Marine Science Faculty, Brawijaya University, Malang, Indonesia
- 3Fisheries Agrobusiness Department, Fisheries and Marine Science Faculty, Brawijaya University, Malang, Indonesia
- 4Public Administration Department, Faculty of Administrative Science, Brawijaya University, Malang, Indonesia
Marine litter in coastal areas can bring economic, social, and environmental damage, especially the loss of aesthetic value of a tourist site. Therefore, research on the composition of marine litter to identify its sources is important for planning strategic action to minimize the problem. This study analyzed beach litter composition on five beaches (Kondangmerak, Balekambang, Ungapan, Ngudel, and Goa Cina) along the Indian Ocean coastline in the eastern part of the south Java region, Indonesia. All the beaches are known as the famous touristic beaches of Malang City, and receive many visitors, especially during the holiday season. Beach litter composition was obtained by collecting different types of litter in a 5 x 5 m square transect. Five square transects were placed along the beach strandline at each beach, and intervals of 20 m separated each transect. In each transect, the litter was collected and counted based on its category (plastic, paper, rubber, fabric, processed wood, metal, glass, ceramic, and hazardous items) and size (0.5–2.5cm, 2.5–5cm, 5–10 cm, and > 10 cm). There was a statistically significant variation in the number of litters among the sizes (p<0.05). However, the distribution of beach litter remained consistent across beaches regardless of its size. In general, beach litter with a size > 10 cm was found least on all beaches (< 15%), while the other three size categories were found in similar numbers (in the range of 20% to 50%). Plastic was the dominating type of litter on all beaches. Based on the Clean Coastal Index, all beaches were considered dirty to extremely dirty. All litter on the beaches was the product of tourism activities, and littering habits play a significant role as the source of marine litter in the study areas. Since this is the first study on the marine litter composition in the eastern part of south Java, the results of this study can be used as a baseline for future studies to prevent marine debris pollution and to develop management strategies for reducing the impact of marine debris on the environment.
Introduction
Marine litter is defined as solid material manufactured, processed, discarded, disposed of, and abandoned in the coastal and marine environment (UNEP, 2005). This litter is considered persistent and accumulates in the environment for a long time, especially glass and plastics (Cheshire et al., 2009; GESAMP, 2019). Litter can be classified into several categories: plastic, paper, metal, fabric, glass, rubber, and wood. Some authors have classified marine litter into several technical terms. Tudor and Williams (2004) classified litter into two types: land-based sources, which is litter left by beach visitors and entering the sea via rivers; and marine-based sources, which is from ship activities and offshore installations. Silva-Iñiguez and Fischer (2003) categorized litter sources into three types: terrestrial key objects (TKO) and marine key objects (MKO) for objects that come from land or marine activities, respectively, and mixed origin (MiKO). According to its buoyancy properties, Rech et al. (2014) differentiates litter into three types: persistent buoyant litter (floating without sinking or decomposing), short-term buoyant (floating and is carried away by the current and will eventually sink or decompose) and non-buoyant items (do not float and are too heavy to be transported over long distances). Buoyancy influences the movement of litter and can be used to identify the source of litter (Maclean et al., 2021; Erüz et al., 2023). The classification of beach litter into several categories can be used to identify the most likely sources of the litter, such as beach users, land-based domestic activities, mixed, or fisheries (Silva-Iñiguez and Fischer, 2003; Araújo et al., 2018). Moreover, custom litter categories can be created to allow researchers to identify litter within a nationally-standardized format or to tract llitter that is relevant to their area (Lippiatt et al., 2013).
There have been reports on the effects of plastic pollution on the marine ecosystem, and numerous studies have found that plastics are the primary source of marine litter (Iñiguez et al., 2016). Plastic debris can cause entanglement and be ingested by marine biota, and the fragmentation of bigger plastic products into microplastic are one of the main concerns of plastic pollution (Costa et al., 2022). Microplastics in the ocean compartments, including the deep ocean, surface waters, and water columns, have been the subject of numerous studies (Cordova and Wahyudi, 2016; Cincinelli et al., 2017; Kanhai et al., 2018; Yona et al., 2019). The ingestion of microplastics has been studied in many different types of marine species, from small size plankton to bigger size fishes (Kosore et al., 2018; Sathish et al., 2020; Yona et al., 2021; Yona et al., 2022).
Human activities are the primary source of marine litter; studies have found that 90% of litter is related to land-based sources, and river transportation is the major contributor to its accumulation (Rangel-Buitrago et al., 2017; Terzi et al., 2020). Eventually, litter can be found far away from its sources due to the influence of oceanographic factors such as coastal currents, tides, wind, and waves (Dobler et al., 2022). One of the regions that is prone to marine litter pollution is the beach, being located between the land and the ocean. According to Araújo and Costa (2008), marine debris is one significant problem affecting recreational beach quality. Tourism is the main activity that could lead to the deterioration of beaches, followed by sewage, shipping, offshore installations, and fisheries activities (Schernewski et al., 2018).
Many studies have shown the abundance of beach litter worldwide due to tourism activities (Araújo et al., 2018; Sajorne et al., 2021; Pervez and Lai, 2022; Salazar et al., 2022). Those studies discovered that the litter found on beaches is mostly produced by the beachgoers. Cigarette buds, beverage cans, and food wrappers are the most often discovered litter items (Schernewski et al., 2018; Ribeiro et al., 2021). Rangel-Buitrago et al. (2017) found a relationship between tourism activities and the type of beaches regarding the presence of beach litter. According to the Bathing Area Registration and Evaluation (BARE) classification of beaches, resort, urban, rural, and village beaches contained litter from tourism and their related activities. In contrast, in remote beaches, vegetation debris is the most common item observed.
The study of marine litter is increasing in Indonesia. Purba et al. (2019), in their extensive review of the research and status of marine debris in Indonesia, found about 37 published manuscripts. The articles mainly focused on the environmental studies of marine litter in the coastal areas, surface, and water columns (Sur et al., 2018; Cordova and Nurhati, 2019; Ondara and Dhiauddin, 2020; Purba et al., 2020; Yona et al., 2020). The southern part of Java Island is a very long coastline facing the Indian Ocean. It has many beaches from the western to the eastern part of Java Island, some of which are well-known as tourist destinations. There have been studies on marine debris in the western part of south Java Island (Purba et al., 2018b; Faizal et al., 2022). However, studies have yet to be conducted in the eastern part. This study was conducted in Malang Regency, located in the eastern part of Java Island, with several well-known beaches for locals and visitors. While some beaches have limited accessibility owing to their location, others have easy access since they are well-developed tourist sites. We expected that different types of beaches would result in different compositions of beach litter since human activities are the leading cause of the litter.
This research aimed to identify the composition of beach litter found on five different beaches in Malang Regency, namely, Kondangmerak, Balekambang, Ungapan, Ngudel, and Goa Cina, and to describe the spatial distribution of beach litter among those beaches. The pollution level of the beaches was assessed using the Clean Coast Index (CCI). The results of this study are expected to provide the first baseline information on marine litter in the eastern part of south Java Island, as well as suggestions for management measures to lessen marine debris in coastal areas.
Materials and methods
Study area
This study was conducted on five different beaches along the Indian Ocean coastline in the Malang Regency. Malang is one of the popular cities in the East Java Province, Indonesia, and is known for its natural beauty including its coastline. Its famous sandy beaches attract many tourists, especially in the holiday season. The five beaches that are the subject of this study are: Kondang Merak (8°24.20’ S, 112°32.232’ E), Balekambang (8°23.7558’ S, 112°31.122’ E), Ngudel (8°24.9414’ S, 112°53.07’ E), Ungapan Beach (8°26.2578’ S, 112°38.55’ E), and Goa Cina Beach (8°26.8218’ S, 112°39.018’ E) (Figure 1). The studied beaches are characterized by their white sand and are dominated by coarse to medium sand.

Figure 1 Study area map showing all sampling beaches along the Indian Ocean coastline in the Malang Regency.
We divided the examined beaches into three categories using the BARE classification method. They are the remote area for Ngudel and Ungapan Beach, the village area for Kondang Merak, and the rural area for Balekambang and Goa Cina Beach. This classification is based on the accessibility, level of urbanization, and availability of public transportation and facilities to the beach (Asensio-Montesinos et al., 2020). Because they are situated outside of an urban setting and lack access to public transportation, Ngudel and Ungapan Beach are regarded as remote areas with a small number of visitors. This can result in a tiny amount of trash being discovered on the beach. Even though there is no public transportation to the beach, Kondang Merak is still regarded as a village area because the beach lies inside a small community. The village community’s domestic activities may cause the trash on this beach. Due to their location away from an urban setting, Balekambang and Goa Cina Beach are categorized as rural areas. The beaches are more managed than the other three and contain public amenities like stores and small food shops. Given that they are more well-known than the other three beaches, these beaches may experience issues with beach litter. Detailed information on the studied beaches is presented in Table 1.

Table 1 Characteristics of the studied beaches.
Sampling method and marine litter identification
Beach litter data were collected on December 2022 and the sampling method was modified from several protocols (OSPAR, 2010; Lippiatt et al., 2013; KLHK, 2020). December is the tourist season, as well as the wet or rainy season. During this time, the wind is stronger than usual and may affect the presence of marine debris. A 100 m line transect was set up at each beach, divided into five 20 m sections, and put perpendicular to the shoreline along the water’s edge. Since every beach has a long coastline, for comparison, we sampled in a 100 m line, and each beach’s sampled area was close to human or tourist activities. In each section, a 5 x 5 m quadrat transect was positioned randomly inside the foreshore area to the back of the beach (Figure 2). According to Lippiatt et al. (2013), the back of the shoreline is defined as the area of the first barrier or primary substrate change.
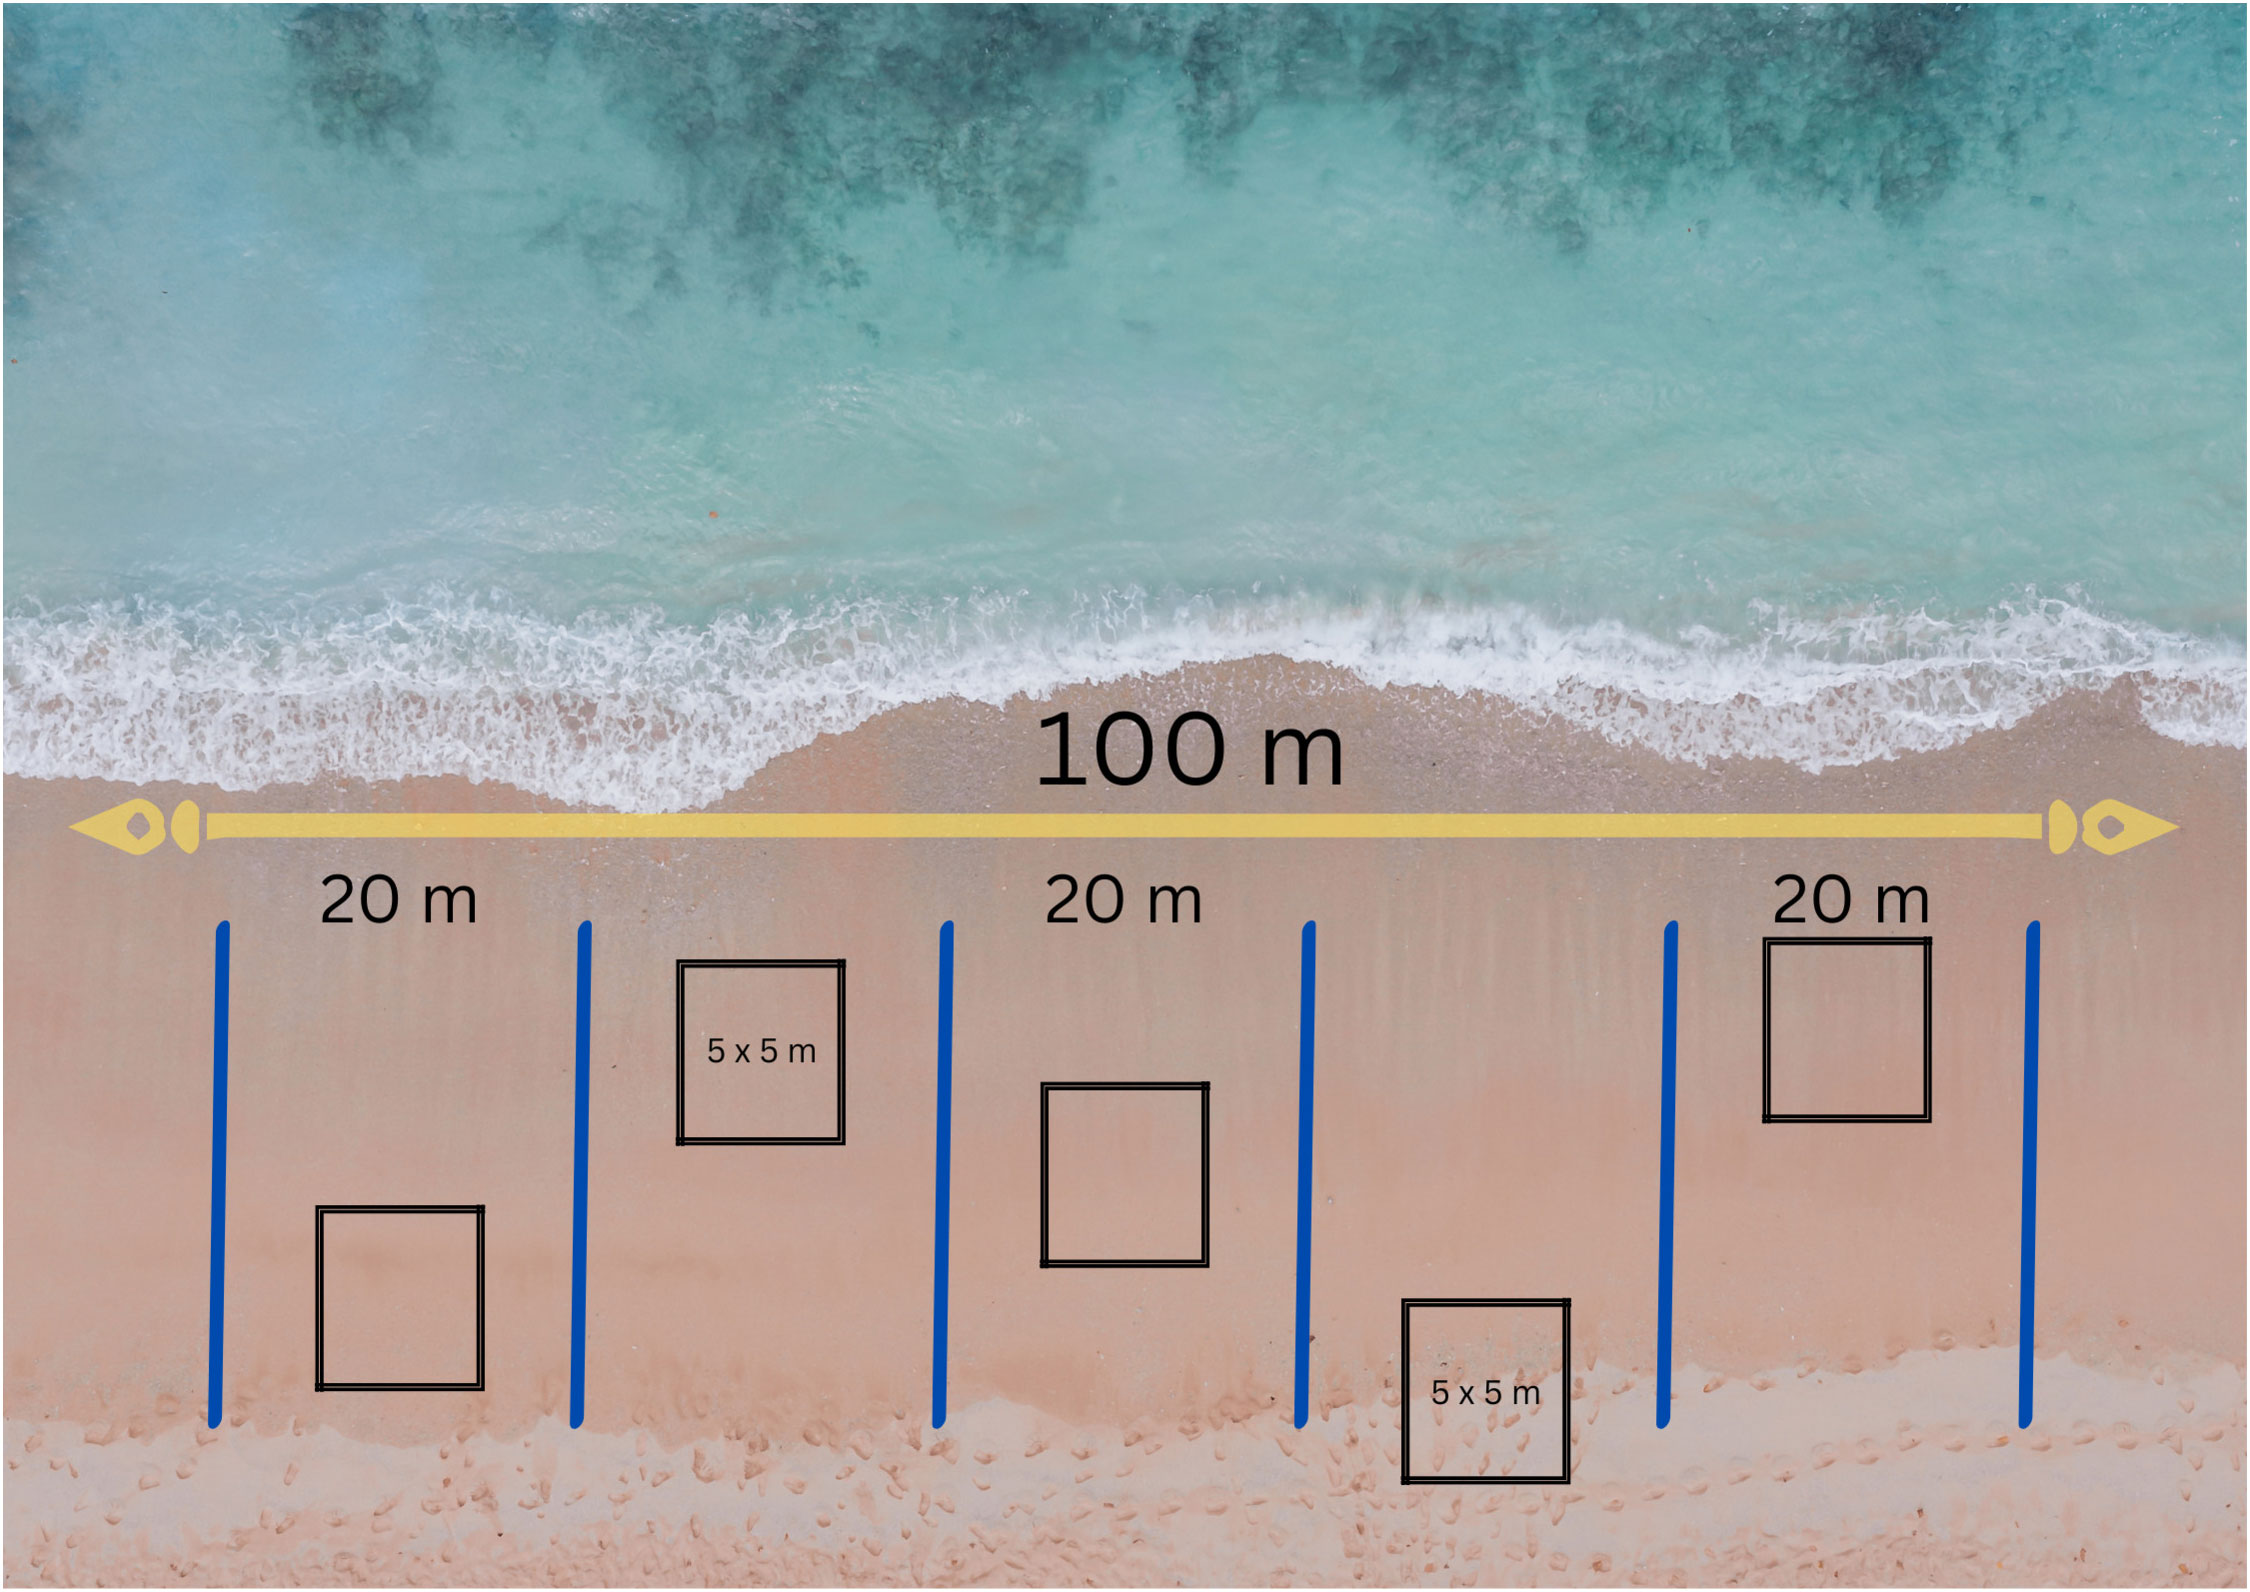
Figure 2 Visualization of the sampling method for litter collection.
Within the quadrats, the surface area was scanned carefully, and visually spotted litter was collected by hand. The litter was identified using the following categories: plastic, paper, rubber, fabric, processed wood, metal, glass, ceramic, and hazardous items. Hazardous items are defined as litter that can generate a potential direct or indirect danger to living creatures (Rangel-Buitrago et al., 2019). In each category, marine litter was classified into several sub-categories, and in total, there were 47 sub-categories. The 14 sub-categories of plastics can be separated again into single-use and recyclable plastics. Single-use plastics include plastic bags, cutlery, straws, polystyrene cup, and food containers, including cigarettes buds (Schnurr et al., 2018; Binetti et al., 2020), while recyclable plastics include plastic bottles, including their caps, toys, jerry cans, and others (Iñiguez et al., 2018; Stapleton et al., 2023). The litter was also categorized according to its buoyancy properties, which consist of three categories: persistent buoyancy (straw, plastic, and polystyrene), short-term buoyancy (cigarette buds, ropes, paper, rubber, fabric, processed wood, and sanitary waste), and non-buoyancy (metal, glass, and ceramic) (Rizzo et al., 2021).
Marine litter is classified into five size classes: nano (< 1 μm), micro (1 μm–5 mm), meso (5 mm–2.5 cm), macro (2.5 cm–1 m), and mega (> 1 m) (Lippiatt et al., 2013). In this study, the litter is differentiated into the sizes 0.5–2.5 cm, 2.5–5 cm, 5–10 cm, and > 10 cm, covering meso and macro size litter. The size is determined by the longest dimension for each litter item (Lippiatt et al., 2013). All litter was counted (number of items), weighed (g), and recorded on a datasheet to gather the information from each sampled beach. Each category was immediately weighed after the litter was removed from the sand because all of it was dry.
Data analysis
The density of beach litter was determined by dividing the quantity and weight of litter samples by the transect area (da Silva et al., 2022). The result is reported in items per square meter and grams per square meter, respectively. The Clean Coast Index (CCI), created by Alkalay et al. (2007), was used to assess the level of cleanliness of the beaches due to litter. The index rates the cleanliness of the beach according to the amount of trash on it, and the results are divided into five categories: very clean (0–2), clean (2–5), moderate (5–10), dirty (10–20), and extremely dirty (> 20). The litter density (number of items) and the coefficient factor, K (=20), are multiplied to determine the CCI. For practical reasons and to prevent the CCI values from falling between 0 and 1, the coefficient factor is used as a multiplier (Alkalay et al., 2007; Sajorne et al., 2021). Some studies have only used the CCI for plastic litter because it makes up the majority of marine litter (Alkalay et al., 2007; Paler et al., 2019; Akarsu et al., 2022; da Silva et al., 2022), whereas others have used it for all types of litter (Rangel-Buitrago et al., 2019; Terzi et al., 2020; Pervez and Lai, 2022). Additionally, Akarsu et al. (2022) estimated the CCI values using the diameters of plastic trash and discovered a substantial variation in the outcomes. To better understand the differences, this study calculated the CCI values for four different litter densities: all litter sizes, all plastic sizes, macro-size litter, and macro-size plastic (> 2.5 cm).
Statistical analysis was assessed for significance using a non-parametric (Kruskal–Wallis) test since the normality data criteria were unmet. The test was employed to determine the spatial variance of the litter between the studied beaches. If there was a significant difference, a post hoc test was conducted to test which groups were different (Schernewski et al., 2018; Salazar et al., 2022). A significance level of 0.05 was used in all tests. All statistical tests were calculated using SPSS software version 26.
Results
Composition and spatial distribution of beach litter
A total of 1,250 items and 6.6 kg of beach litter were collected from five separate beaches in the Malang Regency along the Indian Ocean, with an average of 250 ± 63.5 items of litter on each beach. The study area had an abundance of beach litter ranging from 0.4 items m-2 to 6.1 items m-2 with an average of 2.0 ± 1.5 item m-2. The abundance ranged from 1.6 g m-2 to 29.8 g m-2 with an average of 10.5 ± 9.1 g m-2 according to the litter weight. Figure 3 depicts the spatial distribution of litter abundance based on the quantity and weight of the litter on each beach. Litter items were observed in similar numbers for all beaches, while, according to weight, the most was found on Ungapan Beach, followed by Goa Cina, Kondang Merak, Balekambang, and Ngudel Beach. Statistically, the abundances of beach litter were not significantly different among the study sites in terms of both the amount and weight of litter (Kruskal–Wallis test; p > 0.05).
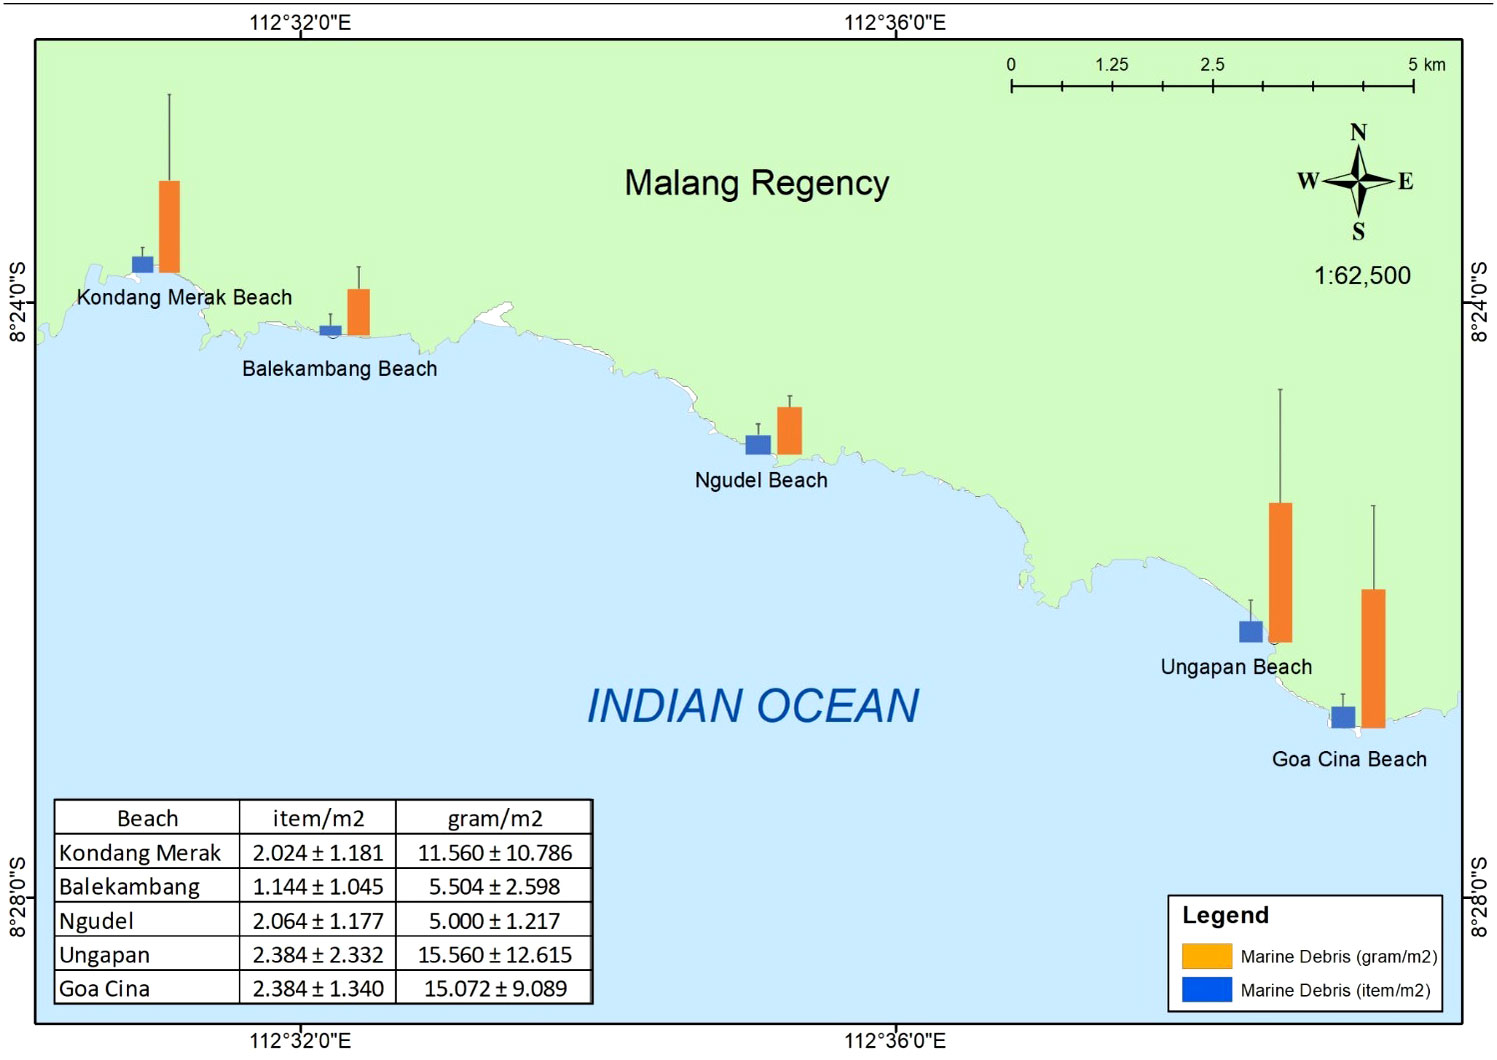
Figure 3 Spatial distribution of beach litter abundance (item m-2 and g m-2) in the study area.
The percentage of beach litter varied between beaches based on size (Figure 4). The majority of litter on Kondang Merak, Balekambang, and Ungapan Beach was between 0.5 cm and 2.5 cm (meso), while on Ngudel and Goa Cina Beach, it was between 2.5 cm and 5 cm. On all beaches, litter with a size of > 10 cm was collected in the lowest percentage. The Kruskal–Wallis test revealed a statistically significant difference between litter sizes regarding the amount of beach litter (p 0.05). The difference was only seen in sizes > 10 cm, according to a post hoc analysis; smaller sizes did not differ substantially.
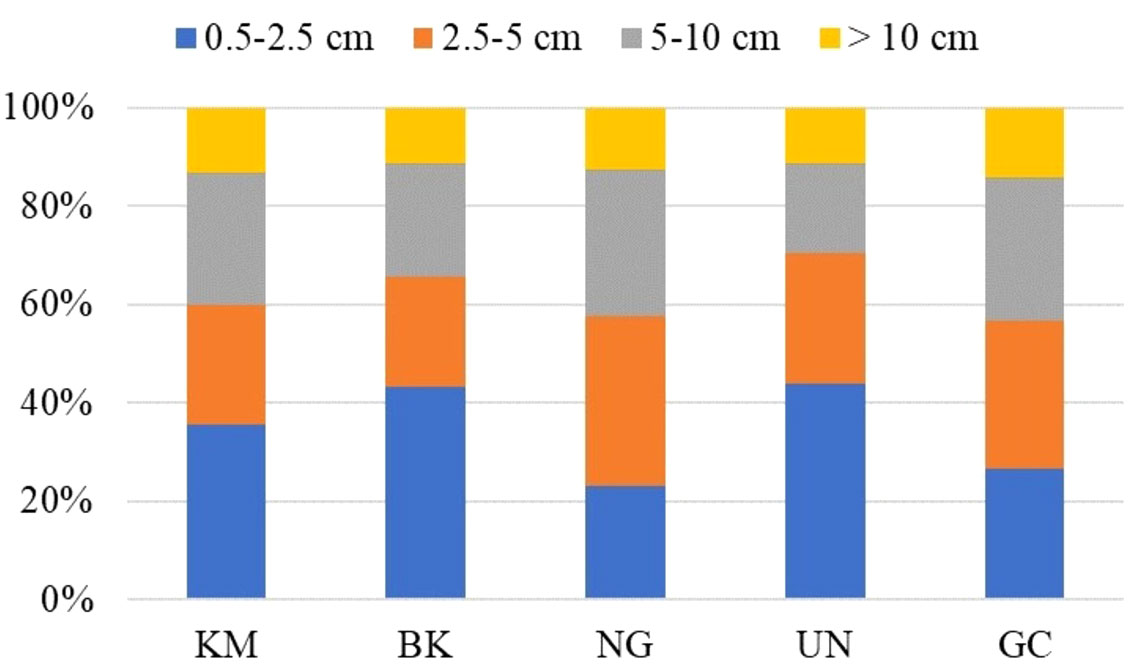
Figure 4 Percentages of beach litter according to the size in the sampling sites: Kondang Merak (KM), Balekambang (BK), Ungapan (UN), Ngudel (NG), and Goa Cina (GC).
Over 60% of all beach litter discovered on all sampling beaches was in the plastic category, which was the most prevalent (Figure 5). Except for paper, which was found on Balekambang Beach in a relatively high percentage (23%), the other forms of litter were detected in nearly identical amounts in the 1% to 6% range. The majority of the paper litter came from the tissues and food packaging that beachgoers left behind. Cigarette lighters, medical gloves, masks, and diapers—all harmful items—contributed to hazardous material. The variability of litter categories found in this study is supported by a statistical test that shows a significant difference in the percentage composition of beach litter according to its categories (p < 0.01).
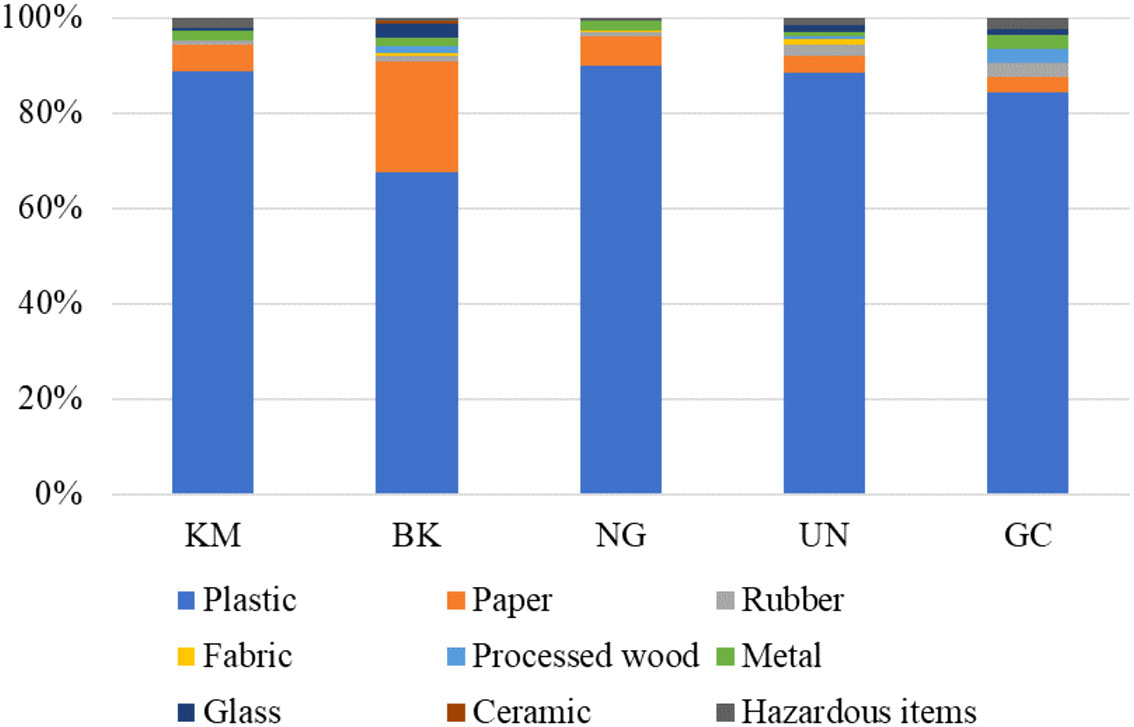
Figure 5 Composition of beach litter according to its categories on all beaches: Kondang Merak (KM), Balekambang (BK), Ungapan (UN), Ngudel (NG), and Goa Cina (GC).
We classified the 84% of litter in our study that was of the plastic-type into two sub-categories: recyclable and single-use plastics (Figure 6A). Out of 1,051 plastic items, 214 (20%) were recyclable items and 837 (80%) were single-use plastics (Figure 6B). Straws, plastic wrappers, and polystyrene from food packaging comprised most of the single-use items on the beaches. Cigarette buds were also included in this sub-category. Persistent and temporary buoyancy items were collected in nearly equal amounts (47% and 50%, respectively), while non-buoyant items only showed up in very small amounts (3%) (Figure 7). Except for Ungapan Beach, most beaches had more short-term buoyancy litter. The large percentage of persistent buoyancy litter was caused by the very high polystyrene items found on this beach.
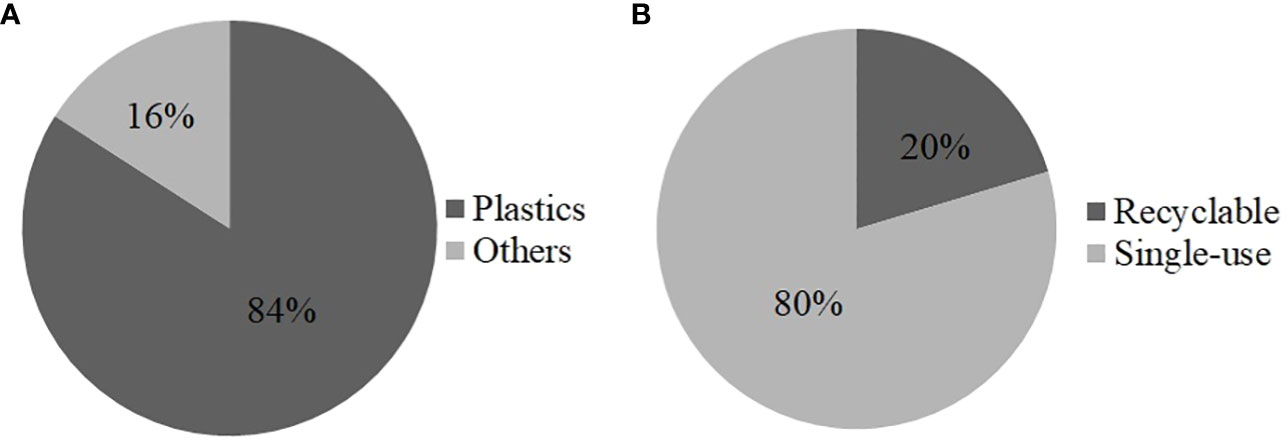
Figure 6 Composition of beach litter in this study; (A) percentage of plastics and other types of litter and (B) percentage of recyclable and single-use plastics.
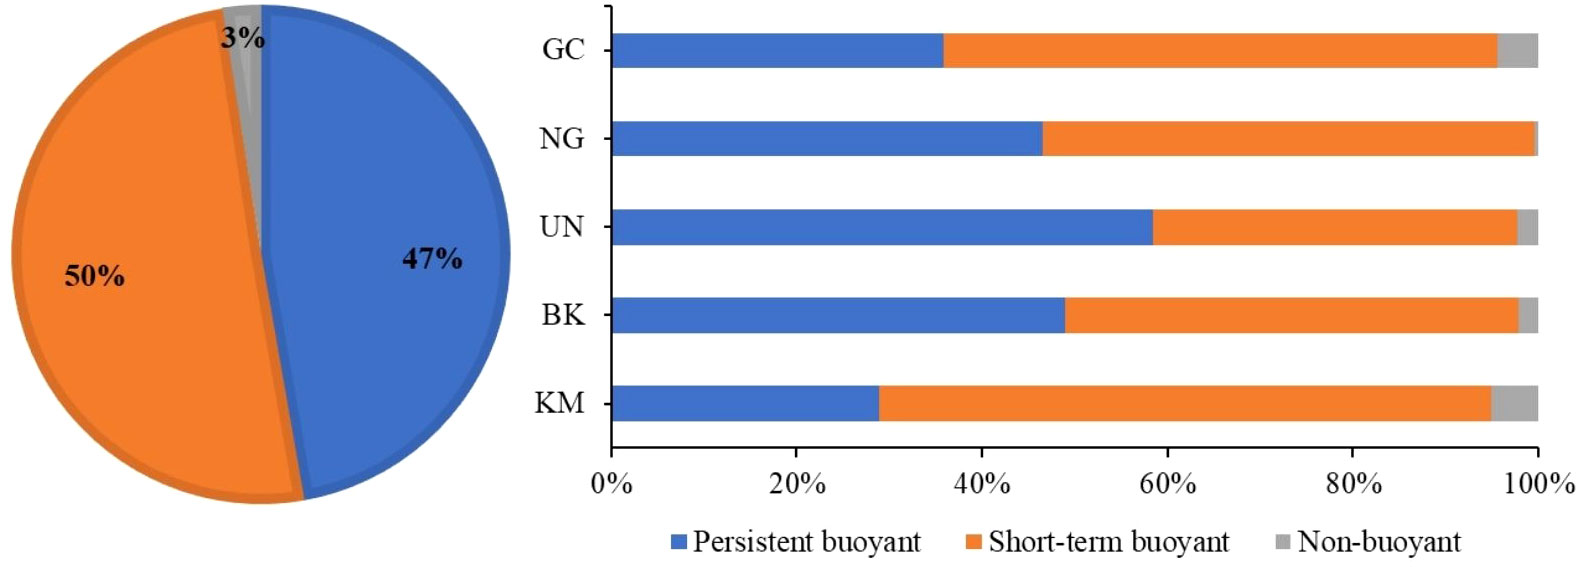
Figure 7 Beach litter percentages by buoyancy in the study area (left) and on each beach (right).
Clean Coast Index
The Clean Coast Index was calculated according to four categories: all litter type, only plastic-type, all types of litter, and plastic in the macro-size (> 2.5 cm). The findings varied significantly between some beaches (Figure 8). All beaches appeared extremely dirty (CCI > 20) when the CCI was computed using all types of beach litter and only plastic-type. However, Kondang Merak and Balekambang Beach produced slightly different findings when the computation was performed according to all litter sizes and only macro-size litters were counted. On Kondang Merak Beach, the index was smaller when the calculation was made based on the plastic litter in the macro size (CCI < 20). Meanwhile, on Balekambang Beach, the CCI was smaller if only macro-size litters were counted. According to the CCI, all beaches in the study area were considered dirty to extremely dirty.
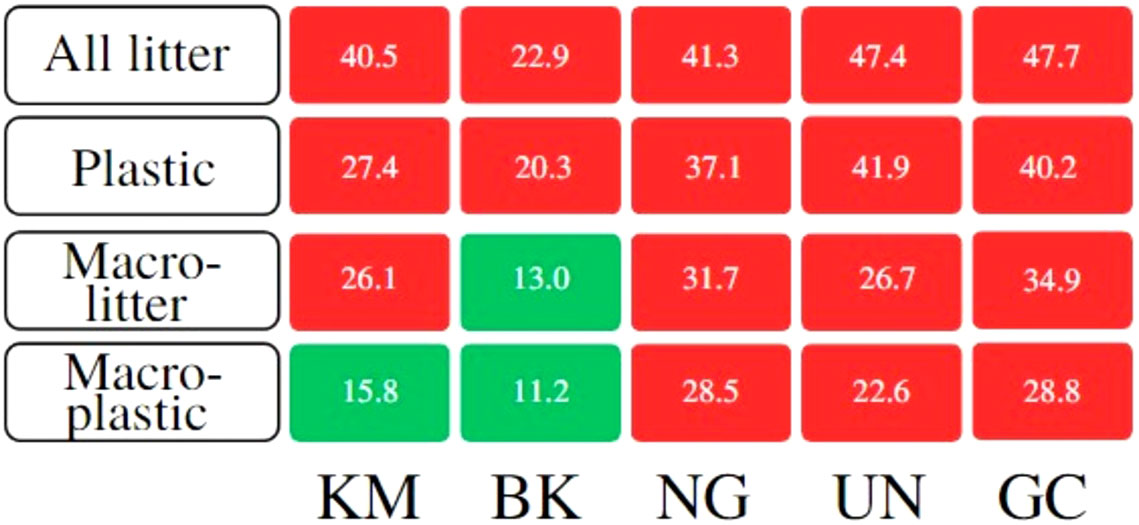
Figure 8 Clean Coast Index values of the study areas (Kondangmerak-KM; Balekambang-BK; Ngudel-NG; Ungapan-UN; and Goa Cina-GC) according to four different litter densities: all litter sizes, all plastic sizes, macro-size litter, and macro-size plastic (> 2.5 cm). Red represents an extremely dirty beach (CCI > 20), while green represents a dirty beach (CCI in the range of 10-20).
Discussion
Compared to monitoring floating or seabed litter, beach litter monitoring is seen to be the simplest because it takes little equipment or training and is frequently done in conjunction with beach clean-up initiatives (Nelms et al., 2017). Although considered the easiest form of monitoring, this study is the first to provide the results of the distribution and composition of beach litter along the Indian Ocean coastline in the southern part of the East Java Province, Indonesia. Even though this study only examined a small part of the eastern south Java coastline, the results can still be used to manage marine debris and provide a recommendation for the importance of waste management on public beaches.
The results of this study observed that the abundance of litter on the beaches was not statistically different. The distances between the studied beaches and the similarities in human activities could be the reason for the results. Terzi et al. (2020) found that their study sites separated by ~ 3 km distance did not give a statistically different result regarding litter density. The distances between the beaches in our study ranged from 2–16 km. The longest was between Kondang Merak and Goa Cina Beach (15.82 km), while the shortest was between Ungapan and Goa Cina Beach (1.86 km). Moreover, all beaches are famous for recreational activities, thus resulting in a similar composition of litter. This can be seen from the litter found, such as foams, cigarette buds, and food wrappers (Schernewski et al., 2018; Terzi et al., 2020; Ribeiro et al., 2021). Many studies have found that most litter that enters the sea comes from the riverine input of terrestrial origin (Turrell, 2020). However, in this study, the litter was dominantly from tourist activities, as most of the litter can be considered “fresh” litter that did not show (or showed little) signs of fragmentation (Purba et al., 2018a; Smith and Turrell, 2021).
Table 2 compares beach litter from several other studies worldwide, and the results were varied. The variability of beach litter found in every study is due to the different sampling methods, such as the size of the quadrat transects used in collecting the samples, the size of the litter collected, and the sampling periods. For example, Salazar et al. (2022) found a very high amount of beach litter (12,362 items) because they collected the samples during ten field surveys from three different beaches, and on each beach, six stations with a 3 x 3 m quadrat were used to collect the litter. In addition, they also collected the samples in the area that had yet to be cleaned regularly by the local tour operators. In this case, comparing beach litter according to the number per square meter is suitable. Variability of litter densities (item m-2) among studies might result from the differences in coastal land use that can affect the density and litter types (Jonidi Jafari et al., 2021). Coastal areas affected by population, industry, and port activities will experience an increase in litter density (Binetti et al., 2020; Anastácio et al., 2023).
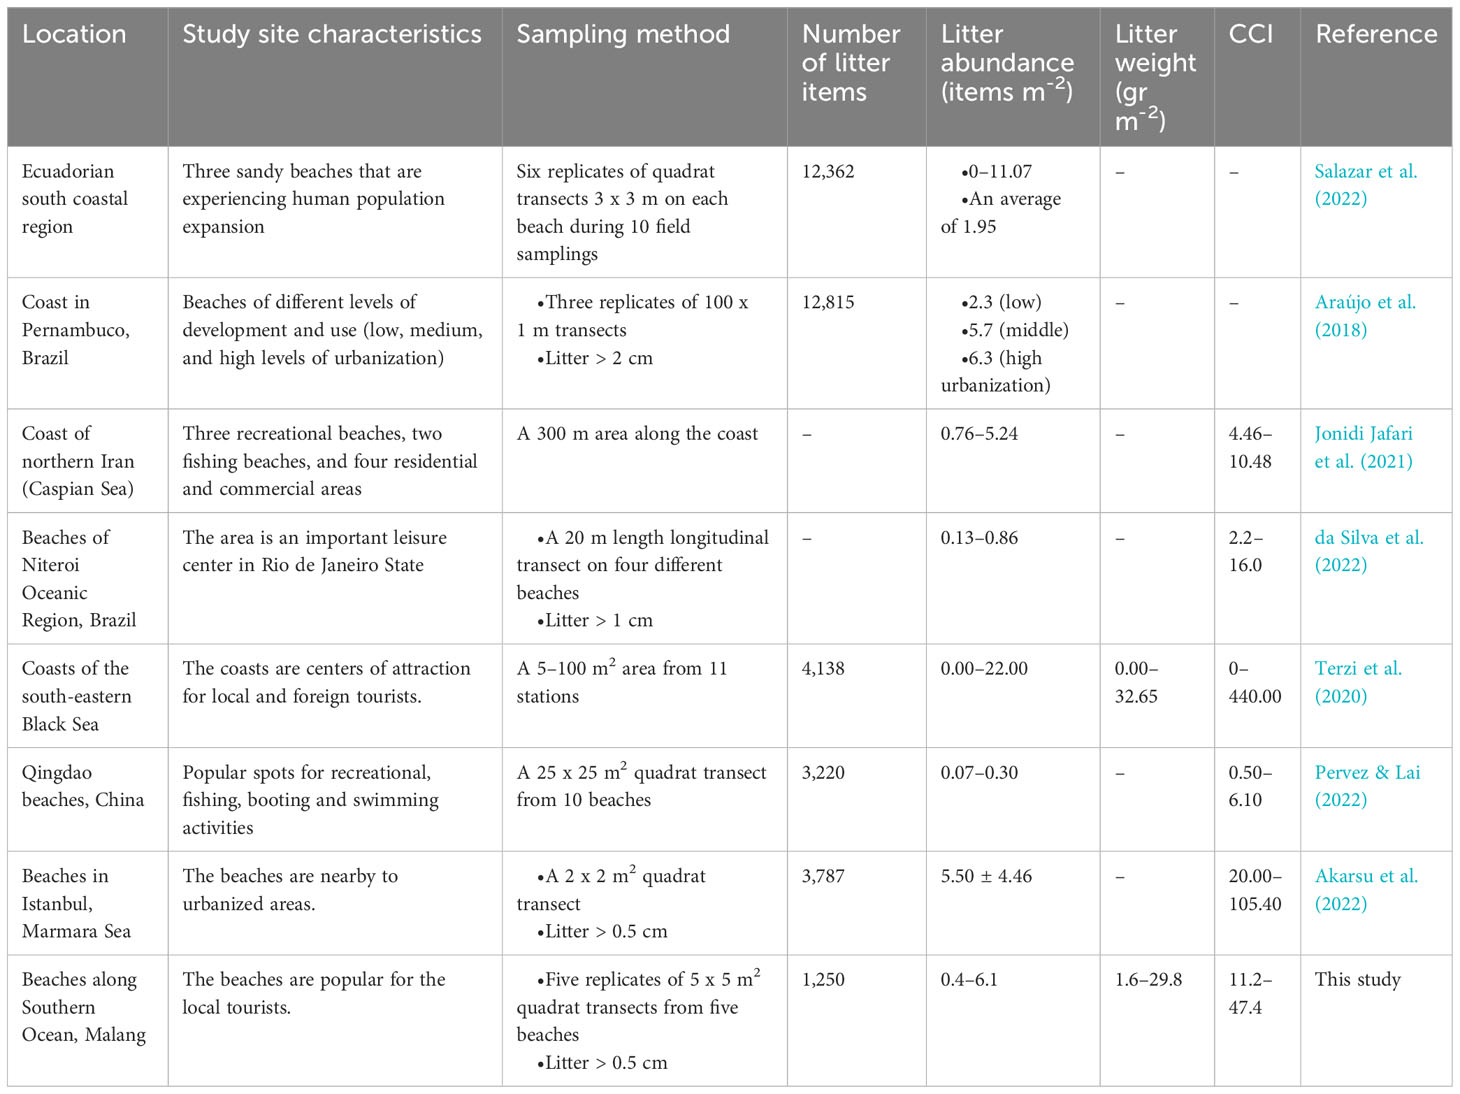
Table 2 Comparison of the abundance of beach litter with other studies.
Regarding number (item m-2), the litter was observed in similar values among the beaches. However, in term of weight (g m-2), Ungapan and Goa Cina Beach were observed to have higher values. This results from bigger, heavier litter such as glass, processed wood, and rubber being found on both beaches. Although these items were found in a small number, their weight could significantly increase the total litter mass. Thus, litter weight was not always in line with total number of litter items found (Purba et al., 2018a). We can predict the sources of beach litter based on its number and weight. In their study, Smith and Turrell (2021) differentiated the origin of litter into domestic activities and fishing activities. The study found that, according to the number of items, domestic activities accounted for a higher percentage of litter. In contrast, according to the weight, fishing activities contributed to more litter. In this study, domestic activities contributed the most to litter composition because all studied beaches were famous for their tourist activities rather than fishing activities.
Plastic was the most common item in this study, as was also found by many other studies (Araújo et al., 2018; Terzi et al., 2020; Smith and Turrell, 2021; Salazar et al., 2022). It is a problem worldwide, resulting from the high consumption of plastic products in society with poor waste management (Alpizar et al., 2020). The increased usage of single-use plastic items has worsened the situation. Single-use plastic items can be found everywhere, from beaches with good waste management to remote beaches with poor waste management (Baxter et al., 2022; Salazar et al., 2022). Plastic mainly contributed to persistent and short-term buoyancy items. The domination of persistent and short-term buoyancy items found in this study indicated that the litter came from nearby sources related to tourism activities (Rangel-Buitrago et al., 2019). This was supported by the high percentage of paper found on Balekambang Beach due to tourism activities. The paper mostly came from food wrappers, as beach visitors bring food to the beach and leave the paper wrappers behind. Among the studied beaches, Balekambang Beach is the most visited, resulting in more food wrapper litter.
Our study differentiated beach litter into four categories of size: 0.5–2.5 cm, 2.5–5 cm, 5–10 cm, and > 10 cm. Balekambang and Ungapan Beach contained a higher percentage (> 40%) of small litter in the meso-sized category (0.5–2.5 cm) compared with the other three beaches. Daily beach cleanups may cause variation in beach litter. Daily beach cleaning, according to da Silva et al. (2022), may only successfully eliminate larger pieces of litter; smaller pieces may build up in the sand. Both beaches are well-known for being recreational destinations, and they are regularly cleaned up to remove larger pieces of trash while leaving smaller ones behind. In their investigation, Lee et al. (2015) discovered a positive relationship between meso- and micro-sized litter. They proposed using meso-sized litter as a focal point to identify microplastic contamination. Thus, research on microplastics in beach sediment will be time-effective. Balekambang and Ungapan Beach were found to have a higher percentage of meso-sized litter (0.5–2.5 cm) than the other beaches, and they may have accumulated more microplastic. The litter distribution was fairly similar for each litter size on the other three beaches, ranging from 20% to 30%. Similar to the findings of this study, Smith and Turrell (2021) identified plastic particles between 2.5 cm and 5.0 cm as the most common type of litter. A minor percentage of litter larger than 10 cm was found on all beaches. We discovered a bag and a slipper (> 10 cm), indicating that they had been on the beach for a considerable amount of time (Figure 9A). As the daily cleanup only swept the rubbish on the beach’s surface, these items must have been missed.
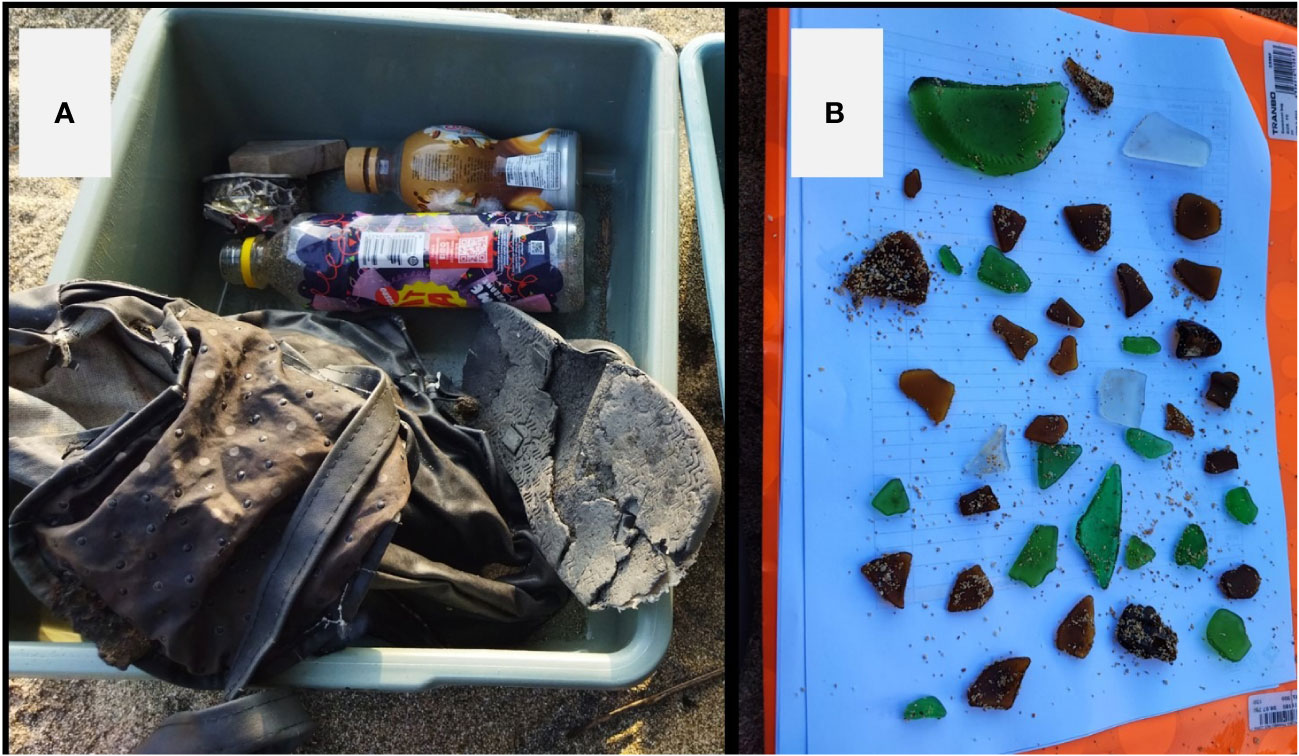
Figure 9 Found litter: (A) a bag and slipper that were found buried under the sand and (B) glass pieces from Balekambang Beach.
The small sizes of the litter collected in the study is mainly the result of the fragmentation of bigger-sized products. This fragmentation depends on several external factors: the duration of the litter from first entry into the sea, the material composing the litter, the intensity of UV radiation, and the physical structure of the foreshore (Smith and Turrell, 2021). Bigger-sized products such as plastic wrappers, styrofoam, and paper from food packaging are types of litter that break down quickly into small pieces and are too small to be collected during the beach clean-up (Lee et al., 2015). In this study, the physical structure of Balekambang Beach is also a reason for the high number of glass pieces found (Figure 9B). The combination of the wave energy and the rocky substrate of the beach breaks up the glass bottles into smaller pieces (Rangel-Buitrago et al., 2019).
The calculation of the CCI values showed that all five beaches in the study area were considered dirty to extremely dirty, with the highest value of 47.4. This value was higher than the results of Jonidi Jafari et al. (2021); da Silva et al. (2022), and Pervez and Lai (2022), while it was very much lower compared with the studies by Terzi et al. (2020) and Akarsu et al. (2022) (Table 2). Almost all of our study beaches are cleaned regularly, although we cannot say it is a daily clean-up. Despite the cleaning efforts from the beach management, the beaches are still considered dirty because of the lack of awareness of the beach visitors in disposing of their trash in the rubbish bins. Another reason might come from the oceanographic processes that could influence the accumulation of beach litter, such as weather conditions, ocean currents, wave actions, and coastal geomorphology (Asensio-Montesinos et al., 2021). Regarding this issue, in-depth research is required.
A beach’s cleanliness may vary depending on the BARE rating of beaches. Salazar et al. (2022) found that a remote beach contained less litter and was considered cleaner based on the CCI value than a touristic beach. On the other hand, beaches connected to surrounding villages were categorized as being extremely dirty. As remote beaches, Ngudel and Ungapan Beach were expected to have less trash than the other beaches in our study. However, the findings revealed that such beaches were considered extremely dirty. This is a result of the accumulated litter that needs to be cleaned periodically but is not, even though the beaches are still well-known among locals. Poor management of solid waste in the nearby villages could facilitate the accumulation of litter in various places in coastal areas (Salazar et al., 2022). The studied beaches are cleaned up, but each beach’s clean-up period might differ. Except for Balekambang Beach, which is very popular and which has an established beach management, the other beaches are managed only by local people or small communities. As a result, this affects the cleaning procedure. For instance, Balekambang Beach is cleaned daily, while the other beaches are not. Additionally, it is connected to the number of visitors. The beach might not be cleaned every day if there are few visitors. Moreover, the beach cleaners only use conventional tools, such as broomsticks, and the cleaning process sometimes cannot cover the entire beach.
The CCI can be used to selectively choose the type of litter that is considered to influence the cleanliness of a beach. Kondang Merak and Balekambang Beach displayed different CCI values depending on the type of litter used to calculate the CCI. For Kondang Merak Beach, the values were lower when we only considered macro-size plastic, while for Balekambang Beach, the values were lower when the calculation was made only for macro-sized litter of either all types of litter or only plastic. This study demonstrated the differences between visual inspection and the CCI in the degree of beach cleanliness. Normally, only larger-sized litter can be used to visually determine whether or not a beach is clean. However, the CCI can be used to detect the cleanliness of a beach from small-sized litter. According to Akarsu et al. (2022), there is a noticeable difference between indexes that merely take plastic into account and those that also find the dimensions of plastics. Additionally, Bat et al. (2022) discovered that beach cleanliness was the same whether the calculation was conducted using only plastic litter or other types of litter due to the significant concentration of plastic in the investigated beaches. As a result, the CCI can be applied to determine a clean beach index that complies with the research objectives.
Conclusion
The beach environment has been considered a sink of marine litter and studied intensively worldwide. This is because beaches represent the interface between land and sea and receive significant impact from human activities. This study is the first to report the litter distribution on different beaches along the Indian Ocean in the eastern part of Java Island, Indonesia. The findings of this study provide baseline information for mitigation strategies in combating marine litter pollution in the coastal environment. According to the litter types and sizes, we conclude that the litter is highly related to tourist activities and beach management regulating the waste. Poor waste management and lack of awareness from beach visitors regarding taking care of their rubbish has resulted in the beaches being considered dirty to extremely dirty based on the Clean Coast Index. Regular cleaning processes by beach managements are a crucial factor to reduce the presence of beach litter. These should include the strict surveillance and supervision of people who litter on the beach. Moreover, the littering culture is still high, especially for local people. Therefore, efforts are needed to raise awareness of litter.
Data availability statement
The original contributions presented in the study are included in the article/Supplementary Material. Further inquiries can be directed to the corresponding author.
Author contributions
DY was responsible for writing the manuscript and collecting and analyzing the data. PN and SP contributed in the field work. SS analyzed the data and conducted the project administration. RL and AA contributed to the writing of the manuscript. All authors contributed to the article and approved the submitted version.
Funding
This research was funded by a grant from Hibah Penelitian Unggulan (HPU) 2023 Lembaga Penelitian dan Pengabdian kepada Masyarakat (LPPM) Universitas Brawijaya No. 612.4/UN10.C20/2023.
Acknowledgments
We thank the members of the Microplastic Analytical Team of Brawijaya (MATB) for their help during the sampling process.
Conflict of interest
The authors declare that the research was conducted in the absence of any commercial or financial relationships that could be construed as a potential conflict of interest.
Publisher’s note
All claims expressed in this article are solely those of the authors and do not necessarily represent those of their affiliated organizations, or those of the publisher, the editors and the reviewers. Any product that may be evaluated in this article, or claim that may be made by its manufacturer, is not guaranteed or endorsed by the publisher.
Supplementary material
The Supplementary Material for this article can be found online at: https://www.frontiersin.org/articles/10.3389/fmars.2023.1220650/full#supplementary-material
References
Akarsu C., Sönmez V. Z., Altay M. C., Pehlivan T., Sivri N. (2022). The spatial and temporal changes of beach litter on Istanbul (Turkey) beaches as measured by the clean-coast index. Mar. pollut. Bull. 176, 113407. doi: 10.1016/j.marpolbul.2022.113407
Alkalay R., Pasternak G., Zask A. (2007). Clean Coast Index-A new approach for beach cleanliness assessment. Ocean Coast. Manage. 20, 352–362. doi: 10.1016/j.ocecoaman.2006.10.002
Alpizar F., Carlsson F., Lanza G., Carney B., Daniels R. C., Jaime M., et al. (2020). A framework for selecting and designing policies to reduce marine plastic pollution in developing countries. Environ. Sci. Policy 109, 25–35. doi: 10.1016/j.envsci.2020.04.007
Anastácio J., Candeias J. M., Cabral H., Domingos I. (2023). Relationships between marine litter and type of coastal area, in Northeast Atlantic sandy beaches. Mar. Environ. Res. 183, 105827. doi: 10.1016/j.marenvres.2022.105827
Araújo M. C. B., Costa M. F. (2008). Environmental quality indicators for recreational beaches classification. J. Coast. Res. 246, 1439–1449. doi: 10.2112/06-0901.1
Araújo M. C. B., Silva-Cavalcanti J. S., Costa M. F. (2018). Anthropogenic litter on beaches with different levels of development and use: A snapshot of a coast in pernambuco (Brazil). Front. Mar. Sci. 5. doi: 10.3389/fmars.2018.00233
Asensio-Montesinos F., Anfuso G., Williams A. T., Sanz-Lázaro C. (2021). Litter behaviour on Mediterranean cobble beaches, SE Spain. Mar. pollut. Bull. 173, 113106. doi: 10.1016/j.marpolbul.2021.113106
Asensio-Montesinos F., Pranzini E., Martínez-Martínez J., Cinelli I., Anfuso G., Corbí H. (2020). The origin of sand and its colour on the south-eastern coast of Spain: implications for erosion management. Water 12, 377. doi: 10.3390/w12020377
Bat L., Oztekin A., Ozturk D. K., Gurbuzer P., Ozsandikci U., Eyuboglu B., et al. (2022). Beach litter contamination of the Turkish middle Black Sea coast: Spatial and temoral variation, composition, and possible sources. Mar. pollut. Bull. 185, 114248. doi: 10.1016/j.marpolbul.2022.114248
Baxter L., Lucas Z., Walker T. R. (2022). Evaluating Canada`s single-use plastic mitigation policies via brand audit and beach cleanup data to reduce plastic pollution. Mar. pollut. Bull. 176, 113460. doi: 10.1016/j.marpolbul.2022.113460
Binetti U., Silburn B., Russell J., van Hoytema N., Meakins B., Kohler P., et al. (2020). First marine litter survey on beaches in Solomon Islands and Vanuatu, South Pacific: Using OSPAR protocol to inform the development of national action plans to tackle land-based solid waste pollution. Mar. pollut. Bull. 161, 111827. doi: 10.1016/j.marpolbul.2020.111827
Cheshire A., Adler E., Barbière J., Cohen Y., Evans S., Jayabhand S., et al. (2009). UNEP/IOC guidelines on survey and monitoring of marine litter, UNEP Regional Seas Reports and Studies (Nairobi: Paris).
Cincinelli A., Scopetani C., Chelazzi D., Lombardini E., Martellini T., Katsoyiannis A., et al. (2017). Microplastic in the surface waters of the Ross Sea (Antarctica): Occurrence, distribution and characterization by FTIR. Chemosphere 175, 391–400. doi: 10.1016/j.chemosphere.2017.02.024
Cordova M. R., Nurhati I. S. (2019). Major sources and monthly variations in the release of land-derived marine debris from the Greater Jakarta area, Indonesia. Sci. Rep. 9, 18730. doi: 10.1038/s41598-019-55065-2
Cordova M. R., Wahyudi A. J. (2016). Microplastic in the deep-sea sediment of Southwestern Sumatran Waters. Mar. Res. Indones. 41, 27. doi: 10.14203/mri.v41i1.99
Costa L. L., Fanini L., Ben-Haddad M., Pinna M., Zalmon I. R. (2022). Marine litter impact on sandy beach fauna: A review to obtain an indication of where research should contribute more. Microplastics 1, 554–571. doi: 10.3390/microplastics1030039
da Silva E. F., do Carmo D. F., Muniz M. C., dos Santos C. A., Cardozo B. B. I., Costa D. M. O., et al. (2022). Evaluation of microplastic and marine debris on the beaches of Niteroi Oceanic Region, Rio de Janeiro, Brazil. Mar. pollut. Bull. 175, 113161. doi: 10.1016/j.marpolbul.2021.113161
Dobler D., Maes C., Martinez E., Rahmania R., Gautama B. G., Farhan A. R., et al. (2022). On the fate of floating marine debris carried to the sea through the main rivers of Indonesia. J. Mar. Sci. Eng. 10, 1009. doi: 10.3390/jmse10081009
Erüz C., Terzi Y., Ismail N. P., Özşeker K., Başkan N., Karakoç F. T. (2023). From source to sink: A comparative study of streamside and beach litter in the Black Sea. Waste Manage. 161, 1–9. doi: 10.1016/j.wasman.2023.02.025
Faizal I., Anna Z., Utami S. T., Mulyani P. G., Purba N. P. (2022). Baseline data of marine debris in the Indonesia beaches. Data Brief 41, 107871. doi: 10.1016/j.dib.2022.107871
GESAMP. (2019). Guidelines or the monitoring and assessment of plastic litter and microplastics in the ocean. Eds. Kershaw P. J., Turra A., Galgani F. (IMO/FAO/UNESCO-IOC/UNIDO/WMO/IAEA/UN/UNEP/UNDP/ISA Joint Group of Experts on the Scientific Aspects of Marine Environmental Protection), 130. Rep. Stud. GESAMP No. 99.
Iñiguez M. E., Conesa J. A., Fullana A. (2016). Marine debris occurrence and treatment: A review. Renew. Sustain. Energy Rev. 64, 394–402. doi: 10.1016/j.rser.2016.06.031
Iñiguez M. E., Conesa J. A., Fullana A. (2018). Recyclability of four types of plastics exposed to UV irradiation in a marine environment. Waste Manage. 79, 339–345. doi: 10.1016/j.wasman.2018.08.006
Jonidi Jafari A., Latifi P., Kazemi Z., Kazemi Z., Morovati M., Farzadkia M., et al. (2021). Development a new index for littered waste assessment in different environments: A study on coastal and urban areas of northern Iran (Caspian Sea). Mar. pollut. Bull. 171, 112684. doi: 10.1016/j.marpolbul.2021.112684
Kanhai L. D. K., Gårdfeldt K., Lyashevska O., Hassellöv M., Thompson R. C., O’Connor I. (2018). Microplastics in sub-surface waters of the Arctic Central Basin. Mar. pollut. Bull. 130, 8–18. doi: 10.1016/j.marpolbul.2018.03.011
KLHK. (2020). Pedoman Pemantauan Sampah Laut: sampah pantai, sampah mengapung, dan sampah dasar laut (Jakarta: Direktorat Pengendalian Pencemaran dan Kerusakan Pesisisr dan Laut, Kementerian Lingkungan Hidup dan Kehutanan).
Kosore C., Ojwang L., Maghanga J., Kamau J., Kimeli A., Omukoto J., et al. (2018). Occurrence and ingestion of microplastics by zooplankton in Kenya’s marine environment: first documented evidence. Afr. J. Mar. Sci. 40, 225–234. doi: 10.2989/1814232X.2018.1492969
Lee J., Lee J. S., Jang Y. C., Hong S. Y., Shim W. J., Song Y. K., et al. (2015). Distribution and size relationships of plastic marine debris on beaches in South Korea. Arch. Environ. Contam. Toxicol. 69, 288–298. doi: 10.1007/s00244-015-0208-x
Lippiatt S., Opfer S., Arthur C. (2013). Marine debris monitoring and assessment (NOAA Technical Memorandum NOS-OR&R-46).
Maclean K., Weideman E. A., Perold V., Ryan P. G. (2021). Buoyancy affects stranding rate and dispersal distance of floating litter entering the sea from river mouths. Mar. pollut. Bull. 173, 113028. doi: 10.1016/j.marpolbul.2021.113028
Nelms S., Coombes C., Foster L., Galloway T., Godley B., Lindeque P., et al. (2017). Marine anthropogenic litter on British beaches: A 10-year nationwide assessment using citizen science data. Sci. Total Environ. 579, 1399–1409. doi: 10.1016/j.scitotenv.2016.11.137
Ondara K., Dhiauddin R. (2020). Indonesia marine debris: Banda Aceh coastal environment identification. J. Kelaut. Trop. 23, 117. doi: 10.14710/jkt.v23i1.6238
OSPAR. (2010). Guideline for monitoring marine litter on the beaches in the OSPAR maritime area. OSPAR Commission, London, UK. P.84.
Paler M., Malenab M., Maralit J. R., Nacorda H. M. (2019). Plastic waste occurrence on a beach off southwestern Luzon, Philippines. Mar. pollut. Bull. 141, 416–419. doi: 10.1016/j.marpolbul.2019.02.006
Pervez R., Lai Z. (2022). Spatio-temporal variations of litter on Qingdao tourist beaches in China. Environ. pollut. 303, 119060. doi: 10.1016/j.envpol.2022.119060
Purba N. P., Apriliani I. M., Dewanti L. P., Herawati H., Faizal I. (2018b). Distribution of macro debris at Pangandaran beach, Indonesia. World Sci. News 103, 144–156.
Purba N. P., Faizal I., Abimanyu A., Zenyda K. S., Jaelani A., Indriawan D., et al. (2020). Vulnerability of Java Sea marine protected areas affected by marine debris. IOP Conf. Ser. Earth Environ. Sci. 584, 12029. doi: 10.1088/1755-1315/584/1/012029
Purba N. P., Handyman D. I. W., Pribadi T. D., Syakti A. D., Pranowo W. S., Harvey A., et al. (2019). Marine debris in Indonesia: A review of research and status. Mar. pollut. Bull. 146, 134–144. doi: 10.1016/j.marpolbul.2019.05.057
Purba N. P., Ihsan Y. N., Faizal I., Handyman D. I. W., Widiastuti K. S., Mulyani P. G., et al. (2018a). Distribution of macro debris in savu sea marine national park (Kupang, rote, and ndana beaches), East Nusa Tenggara, Indonesia. World News Nat. Sci. 21, 64–76.
Rangel-Buitrago N., Vergara-Cortes H., Barria-Herrera J., Contreras-Lopez M., Agredano R. (2019). Marine debris occurence along Las Salinas beach, Vina Del Mar (Chile): magnitudes, impacts and management. Ocean Coast. Manage. 178, 104842. doi: 10.1016/j.ocecoaman.2019.104842
Rangel-Buitrago N., Williams A., Anfuso G., Arias M., Gracia C. A. (2017). Magnitudes, sources, and management of beach litter along the Atlantico department coastline, Caribbean coast of Colombia. Ocean Coast. Manage. 138, 142–157. doi: 10.1016/j.ocecoaman.2017.01.021
Rech S., Macaya-Caquilpan V., Pantoja J. F., Rivadeneira M. M., Madariaga D. J., Thiel M. (2014). Rivers as a source of marine litter-A study from the SE Pacific. Mar. pollut. Bull. 82, 66–75. doi: 10.1016/j.marpolbul.2014.03.019
Ribeiro V. V., Pinto M. A. S., Mesquita R. K. B., Moreira L. B., Costa M. F., Castro Í.B. (2021). Marine litter on a highly urbanized beach at Southeast Brazil: A contribution to the development of litter monitoring programs. Mar. pollut. Bull. 163, 111978. doi: 10.1016/j.marpolbul.2021.111978
Rizzo A., Rangel-Buitrago N., Impedovo A., Mastronuzzi G., Scardino G., Scicchitano G. (2021). A rapid assessment of litter magnitudes and impacts along the Torre Guaceto marine protected area (Brindisi, Italy). Mar. pollut. Bull. 173, 112987. doi: 10.1016/j.marpolbul.2021.112987
Sajorne R. E., Bacosa H. P., Cayabo G. D. B., Ardines L. B., Sumeldan J. D. C., Omar J. M., et al. (2021). Plastic litter pollution along sandy beaches in Puerto Princesa, Palawan Island, Philippines. Mar. pollut. Bull. 169, 112520. doi: 10.1016/j.marpolbul.2021.112520
Salazar J. A., González R., Navarrete A. L., Calle P., Alava J. J., Domínguez G. A. (2022). A temporal assessment of anthropogenic marine debris on sandy beaches from Ecuador’s southern coast. Front. Mar. Sci. 9. doi: 10.3389/fmars.2022.977650
Sathish M. N., Jeyasanta I., Patterson J. (2020). Occurrence of microplastics in epipelagic and mesopelagic fishes from Tuticorin, Southeast coast of India. Sci. Total Environ. 720, 137614. doi: 10.1016/j.scitotenv.2020.137614
Schernewski G., Balciunas A., Gräwe D., Gräwe U., Klesse K., Schulz M., et al. (2018). Beach macro-litter monitoring on southern Baltic beaches: results, experiences and recommendations. J. Coast. Conserv. 22, 5–25. doi: 10.1007/s11852-016-0489-x
Schnurr R. E. J., Alboiu V., Chaudhary M., Corbett R. A., Quanz M. E., Sankar K., et al. (2018). Reducing marine pollution from single-use plastics (SUPs): A review. Mar. pollut. Bull. 137, 157–171. doi: 10.1016/j.marpolbul.2018.10.001
Silva-Iñiguez L., Fischer D. W. (2003). Quantification and classification of marine litter on the municipal beach of Ensenada, Baja California, Mexico. Mar. pollut. Bull. 46, 132–138. doi: 10.1016/S0025-326X(02)00216-3
Smith L., Turrell W. R. (2021). Monitoring plastic beach litter by number or by weight: the implications of fragmentation. Front. Mar. Sci. 8. doi: 10.3389/fmars.2018.00035
Stapleton M. J., Ansari A. J., Ahmed A., Hai F. I. (2023). Change in the chemical, mechanical and physical properties of plastics due to UVA degradation in different water matrices: A study on the recyclability of littered plastics. Environ. pollut. 334, 122226. doi: 10.1016/j.envpol.2023.122226
Sur C., Abbott J. M., Ambo-Rappe R., Asriani N., Hameed S. O., Jellison B. M., et al. (2018). Marine debris on small islands: insights from an educational outreach program in the spermonde archipelago, Indonesia. Front. Mar. 5, 35. doi: 10.3389/fmars.2018.00035
Terzi Y., Erüz C., Özşeker K. (2020). Marine litter composition and sources on coasts of south-eastern Black Sea: A long-term case study. Waste Manage. 105, 139–147. doi: 10.1016/j.wasman.2020.01.032
Tudor D. T., Williams A. T. (2004). Development of a `Matrix Scoring Technique` to determine litter sources at a Bristol Channel beach. J. Coast. Conserv. 9, 119–127. doi: 10.1652/1400-0350(2004)010[0119:DOAMST]2.0.CO;2
Turrell W. R. (2020). Estimating a regional budget of marine plastic litter in order to advise on marine management measures. Mar. pollut. Bull. 150, 110725. doi: 10.1016/j.marpolbul.2019.110725
UNEP. (2005). Marine Litter, an analytical overview (Nairobe, Kenya: United Nations Environment Programme), 58.
Yona D., Di Prikah F. A., As’adi M. A. (2020). Identifikasi dan Perbandingan Kelimpahan Sampah Plastik Berdasarkan Ukuran pada Sedimen di Beberapa Pantai Kabupaten Pasuruan, Jawa Timur. J. Ilmu Lingkung. 18, 375–383. doi: 10.14710/jil.18.2.375-383
Yona D., Evitantri M. R., Wardana D. S., Pitaloka D. A., Ningrum D., Fuad M. A. Z., et al. (2022). Microplastics in organs of commercial marine fishes from five fishing ports in Java island, Indonesia. ILMU Kelaut. Indones. J. Mar. Sci. 27, 199–214. doi: 10.14710/ik.ijms.27.3.199-214
Yona D., Samantha C. D., Kasitowati R. D. (2021). Perbandingan kandungan mikroplastik pada kerang darah dan kerang tahu dari perairan Desa Banyuurip, Gresik. Saintek Perikan. Indones. J. Fish. Sci. Technol. 17, 108–114. doi: 10.14710/ijfst.17.2.108-114
Keywords: tourist activity, beach typology, beach management, litter-sizes, marine debris, Clean Coast Index, beach clean up
Citation: Yona D, Nooraini P, Putri SEN, Sari SHJ, Lestariadi RA and Amirudin A (2023) Spatial distribution and composition of marine litter on sandy beaches along the Indian Ocean coastline in the south Java region, Indonesia. Front. Mar. Sci. 10:1220650. doi: 10.3389/fmars.2023.1220650
Received: 11 May 2023; Accepted: 14 September 2023;
Published: 06 October 2023.
Edited by:
Muhammad Reza Cordova, The Indonesian National Research and Innovation Agency, IndonesiaReviewed by:
Ilana Rosental Zalmon, State University of Northern Rio de Janeiro, BrazilLevent Bat, Sinop University, Türkiye
Copyright © 2023 Yona, Nooraini, Putri, Sari, Lestariadi and Amirudin. This is an open-access article distributed under the terms of the Creative Commons Attribution License (CC BY). The use, distribution or reproduction in other forums is permitted, provided the original author(s) and the copyright owner(s) are credited and that the original publication in this journal is cited, in accordance with accepted academic practice. No use, distribution or reproduction is permitted which does not comply with these terms.
*Correspondence: Defri Yona, ZGVmcmkueW9uYUB1Yi5hYy5pZA==