 Yixuan Song
 Adrian B. Burd
 Matthew J. Rau
- 1Department of Mechanical Engineering, The Pennsylvania State University, University Park, PA, United States
- 2Department of Marine Sciences, University of Georgia, Athens, GA, United States
- 3Department of Mechanical and Aerospace Engineering, The George Washington University, Washington, DC, United States
Understanding the effect of hydrodynamics on aggregate size and structure is key to predicting mass transport in the aquatic environment. Aggregation theory of particles is well established but our knowledge of deformation processes, biological bonding forces, and their effects on fragmentation of aquatic aggregates is still limited. To better comprehend fragmentation processes and adhesion forces we implemented breakup experiments with diatom and microplastic aggregates made in the laboratory. We captured a substantial number of events showing deformation and subsequent fragmentation of these aggregates in an oscillatory shear flow. Polystyrene and polyethylene aggregates showed distinct fragmentation strengths and provided comparative upper and lower limits to the biological bonding strength of the diatom aggregates. Additionally, we employed a force balance model to evaluate attractive interactions within clusters of particles using the Lagrangian stress history and morphology. We found that the fractal structures of aggregates led to a power law of breakup strength with size and that time-integrated stress governed the overall fragmentation process. We also found that the weakening of the aggregates through deformation with shear exposure enabled their disaggregation at very low shear rates typical of the ocean environment.
1 Introduction
Aggregates, ubiquitous in the natural aquatic environment, are clusters of small particulates that stick together. Aggregate sizes are influenced by the fluid forces that also govern particle fate and transport. Aggregates and their transport play a vital role in many fields, including microplastic pollution in wastewater (Carr et al., 2016) and aquatic ecosystems (da Costa et al., 2016), the fate of oil in oil spills (Passow and Hetland, 2016; Passow and Ziervogel, 2016; Dissanayake et al., 2018; Burd et al., 2020) and oil-mitigation technologies (Lee et al., 2002), and the global carbon cycle (Alldredge et al., 1993). It is this last topic that has motivated the current work, in that the aggregation theory of the large organic flocs in the ocean (marine snow particles) is relatively well understood (Alldredge and Silver, 1988; Burd and Jackson, 2009), but fragmentation processes have seen little investigation despite their apparent importance in the oceanic carbon budget (Briggs et al., 2020). In particular, being able to predict and parameterize fragmentation processes will necessitate understanding the balance between external hydrodynamic and internal adhesion forces, the latter of which are particularly complex given that marine snow readily deforms when stressed and mostly contains a mixture of biological and abiotic particles (Alldredge and Silver, 1988), whose adhesive bonds are not well understood (Li et al., 2011; Mari et al., 2017).
Notably, many studies have found that transparent exopolymer particles (TEP), considered as a subgroup of extracellular polymeric substances (EPS) (Berman and Passow, 2007), play a substantial role in the formation of marine aggregates (Alldredge et al., 1993; Passow, 2002; Azetsu-Scott and Passow, 2004; Quigg et al., 2016; Mari et al., 2017). These organic, gel-like particles make it more difficult to quantify the adhesive force directly, because of the diversity and heterogeneity of their chemical compositions, environment-dependent phase transitions, and the range of relevant sizes (Passow, 2002; Xu et al., 2011; Santschi et al., 2020). Recent studies have attempted to quantify the stickiness of EPS or biofilm materials that governs the adhesion after the collisions of particles. Chen et al. (2021) used magnetic tweezers to assess the stickiness of EPS and found the stickiness increased with increasing protein-to-carbohydrate ratios. Yan et al. (2019) applied a capillary peeling method to measure the biofilm adhesion, and alternatively Gloag et al. (2018) determined the adhesive properties of biofilms using a shear rheometer. However, the interparticle bonding strength of marine snow with EPS is not yet understood.
Adhesion within colloidal aggregates can be explained using the extended Derjaguin–Landau–Verwey–Overbeek (DLVO) theory (Verwey and Overbeek, 1948; Derjaguin and Landau, 1993; van Oss, 2008) which is well established. This theory considers that the total adhesion energy is a result of van der Waals attractions (LW), electrostatic repulsions (DL) (Israelachvili, 2011), and Lewis acid-base forces (AB), known as polar interactions. All interactions described above (LW, AB, and DL) are size and distance dependent and the intermolecular forces predicted by the XDLVO theory have been validated in many studies of colloidal systems in the absence of biological interactions (Sonntag and Russel, 1986; Boström et al., 2006; Shams et al., 2020). However, adhesion in marine snow aggregates has to consider the biological content such as biophysical mechanisms including polymer bridging (van der Lee, 2000; Babakhani et al., 2022) and ligand-receptor binding (Bell, 1978; Pramanik, 2004), which are not well explained in the XDLVO framework.
Most of our understanding of disaggregation comes from studies of particle- or population-scale breakup processes in turbulent flows. Parker et al. (1972) derived a theoretical breakup relation for aggregates in both the inertial and dissipative subranges of turbulence, but their strength relationship simplified the particle morphology and assumed the aggregates were brittle materials and did not deform. Experimentally, Rau et al. (2018) exposed bentonite clay flocs to varying turbulence and used the change in particle size spectra to show that aggregate strength depended on shear exposure during formation. Saha et al. (2014; 2016) investigated the breakup of individual colloidal flocs in an extensional flow and isotropic turbulence. They found that accumulated drag stress, rather than conditions at the breakup instant, was the most likely mechanism explaining fragmentation. Like the other investigations discussed, the results were not extended to biological particles. In a pioneering investigation of marine snow disaggregation, Alldredge et al. (1990) disrupted marine aggregates sampled from the field in a laboratory turbulence-generating facility. They found that marine snow were strong relative to the turbulence expected below the surface ocean mixed layer, though their aggregates had to survive the sampling and transport procedure, which may have inadvertently excluded the weakest marine snow particles from the measurements. More recently, the present authors (Song and Rau, 2022) studied the breakup of marine diatom aggregates in a laminar shear flow. Individual breakup events and statistical analyses revealed the importance of morphological changes under stress, but more measurements were needed to explain how morphology, deformation, and biological content influenced the ultimate breakup strength.
Here, we implemented fragmentation experiments of four aggregate types using a facility that generated time-varying laminar oscillatory flow with shear rates relevant to the ocean (Song and Rau, 2022). The aggregates were formed from two diatom species, Odontella aurita (OA) and Skeletonema grethae (SG), and two synthetic polymers, sulfate polystyrene (PS) and polyethylene (PE) destabilized in salt solutions, for comparison. Primary plastic microspheres had similar sizes but different bonding mechanisms to the algae cells. We applied XDVLO theory to evaluate the strength of the plastic colloidal flocs, which provide bounded estimates for the adhesive strength within the diatom aggregates. We also developed a simple model based on a hydrodynamic force balance to calculate the critical breakup force necessary for each aggregate. We found that the size-strength relationship of the aggregates depended on the primary adhesion force and porous structures of aggregates and that aggregate weakening through deformation with shear exposure was necessary for fragmentation to occur. This study provides molecular-scale and particle-scale perspectives for aggregate fragmentation over an extensive range of particle types and stress magnitudes.
2 Materials and methods
2.1 Experimental facility
The aggregate fragmentation experiments were performed in the rotating and oscillating roller tank developed by the authors (Song and Rau, 2022), which was slightly modified here, as shown in Figure 1. The facility consisted of a double-sided cylindrical roller tank made of acrylic with each side having an inner diameter of 100 mm, a wall thickness of 5 mm, and a length of 100 mm. Only one half of the roller tank was used for the experiments presented. We decreased the length of the tank from 300 mm, as used in (Song and Rau, 2022) to 100 mm to reduce the visual obscuration caused by overlapping particle images, which increased our ability to continuously track aggregates and identify breakup events. We determined that shortening the tank would have a negligible effect on the two-dimensional flow motion along the measurement plane since the tank end-wall effects [estimated as the boundary layer thickness for flow over a rotating disk (Kármán, 1921)] were determined to be an order of magnitude smaller than the distance from the wall to the measurement plane. A customized timing pulley installed at the outside wall was located 70 mm from the end of the tank (Figure 1B). A timing belt connected the tank to another timing pulley attached to the motor with an adjustable gear ratio that could range from 0.21 to 0.76. We controlled the tank motion following the same procedure explained previously (Song and Rau, 2022). An LED light panel (StudioPRO S-1200D, Fovitec) illuminated the suspended particles by shining through the side of the tank through a 10 mm slit aperture, located 30 mm from the visualization-end of the tank (Figure 1A). A high-speed camera (FASTCAM Mini AX200, Photron) with a 105 mm macro lens (Sigma 105mm f/2.8 EX DG) captured the aggregate motion.
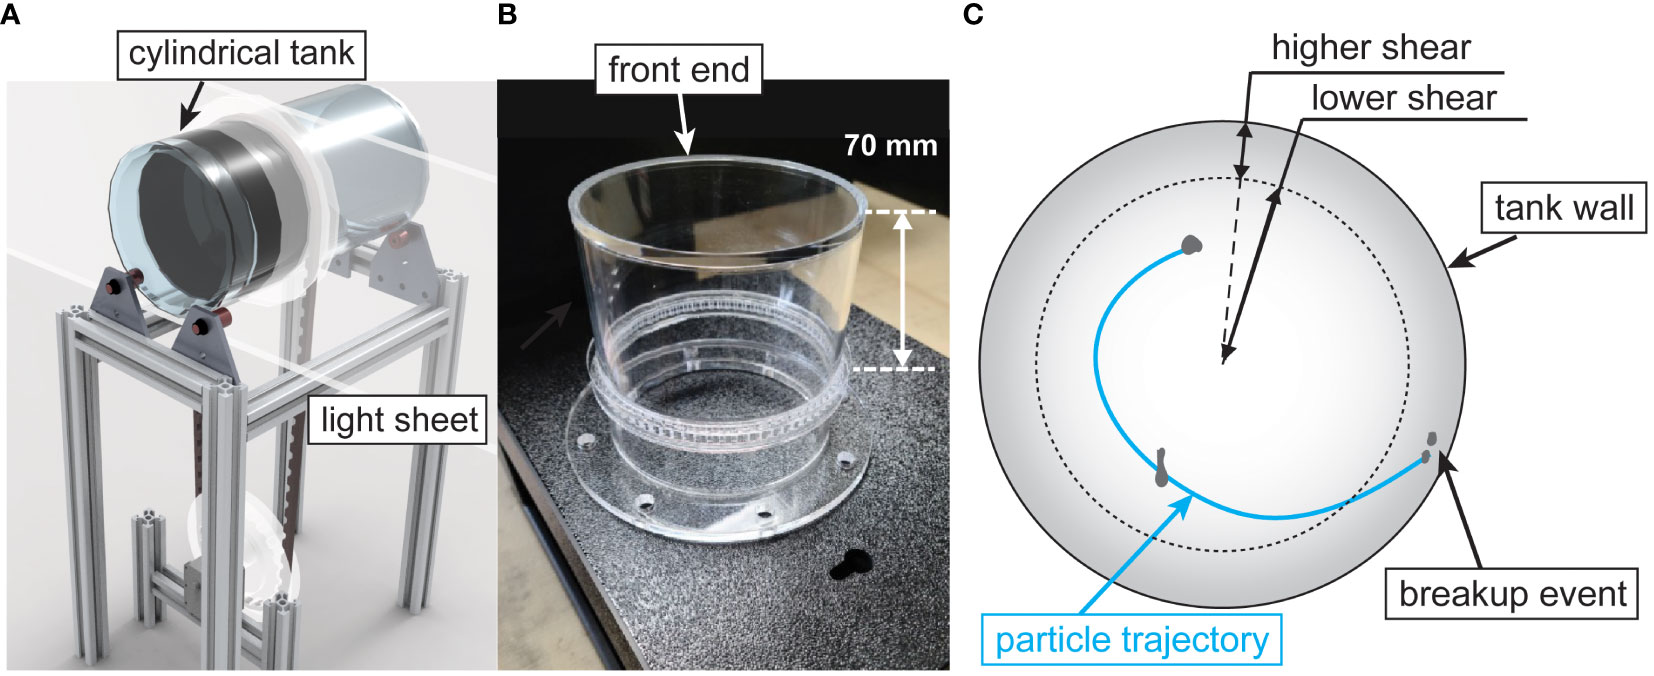
Figure 1 Experimental facility. (A) schematic diagram of the experimental facility, (B) a picture of the one-half of the two-sided roller tank, and (C) schematic diagram of an example recorded particle trajectory until a breakup event occurs within the tank.
We performed aggregation and fragmentation experiments following protocols developed by the authors (Song and Rau, 2022). Briefly, when in Aggregation Mode (AM), the roller tank rotated with a constant rotation rate, b. Once aggregates were formed, we superimposed a sinusoidal oscillation to the constant rotation to operate in Fragmentation Mode (FM). The new boundary condition at the tank wall in FM was uR(t) = a sin(ωt) + b, where a was the oscillation amplitude, ω the angular frequency, and t time. This condition created an oscillating boundary layer on the tank wall with shear rates of 102 s-1 or lower, which were determined through an analytical solution of the laminar fluid motion (Song and Rau, 2020b). Shear generated by the tank varies with radial position, as described by Song and Rau (2020b). Nominally, the boundary layer created a region of higher shear close to the wall and lower shear at the inner tank regions, as shown schematically in Figure 1C along with an example aggregate trajectory. The shear exposure of each aggregate, which depended on its trajectory in the tank, was assumed to be equal to the analytical value of fluid shear as calculated at the aggregate centroid. It should be noted that this method assumes that the hydrodynamic forces caused by changes to the flow due to the presence of the aggregate are minor compared to the imposed hydrodynamic shear of the tank. This is discussed further in Section 2.5.
2.2 Imaging methods
The camera focused on aggregates illuminated by the LED light panel. We utilized a 3D-printed circular calibration plate to measure the imaging magnification ratio at the mid-plane of the 10 mm slit aperture. Experiments with Odontella aurita (OA) had a 10.34 px/mm ± 0.06 px/mm magnification, while experiments with the other three aggregate types (SG, PS, and PE) had a magnification ratio of 10.93 px/mm ± 0.07 px/mm.
Each experiment recorded 21,841 image frames, acquired at a rate of 125 fps (frames per second) for OA, SG, and PE. Due to the fast deformation of PS aggregates, we used higher image frame rates of 250, 500, and 1000 fps during various experiments to capture their deformation behavior. The shutter speed was 1/1000 s for all aggregate types. We utilized the same method of background removal, particle identification, particle matching, and breakup detection described in detail by Song and Rau (Song and Rau, 2022) with a particle detection threshold of 4 pixels. We only analyzed aggregates that could be continuously tracked for at least 0.12 s for fragmenting aggregates and 1 s for non-fragmenting aggregates. The time history provided by these time limits were to ensure confidence in the detection, or lack thereof, of a breakup event (Song and Rau, 2022).
Song and Rau (2022) found that OA aggregates regularly elongated prior to breakup. To characterize this deformation further, we developed one additional image processing feature to detect the weakest point of a deformed aggregate. We considered two scenarios, either that an aggregate in projection had a “dumbbell” shape, indicating necking between two larger ends, or that the aggregate was shaped like an ellipse. We assumed the weakest point of the aggregate was located at the thinnest point of the neck. Figure 2A shows one example grayscale image of a deformed SG aggregate with a thin neck. For the ellipse-shaped aggregates, we instead took the minimum Feret diameter to represent the most fragile connection. For each sampled aggregate, we measured a ratio of the aggregate’s neck size Ln to its minimum Feret diameter dFmin, defined as β=Ln/dFmin. The minimum Feret diameter describes the smallest breadth along a specified direction in the particle’s projection (Merkus, 2009), but it fails to capture thin regions of concave shapes. A floc always has a β ratio of unity if it has a convex shape, as shown with β = 1 in Figure 2C. To identify the neck thickness, we analyzed binarized images of each aggregate and found their minimum thickness in the direction perpendicular to their major axes. It should be noted that one deformed aggregate could have more than one neck. In such cases, we used the smallest neck, where the neck size resolution was one pixel.
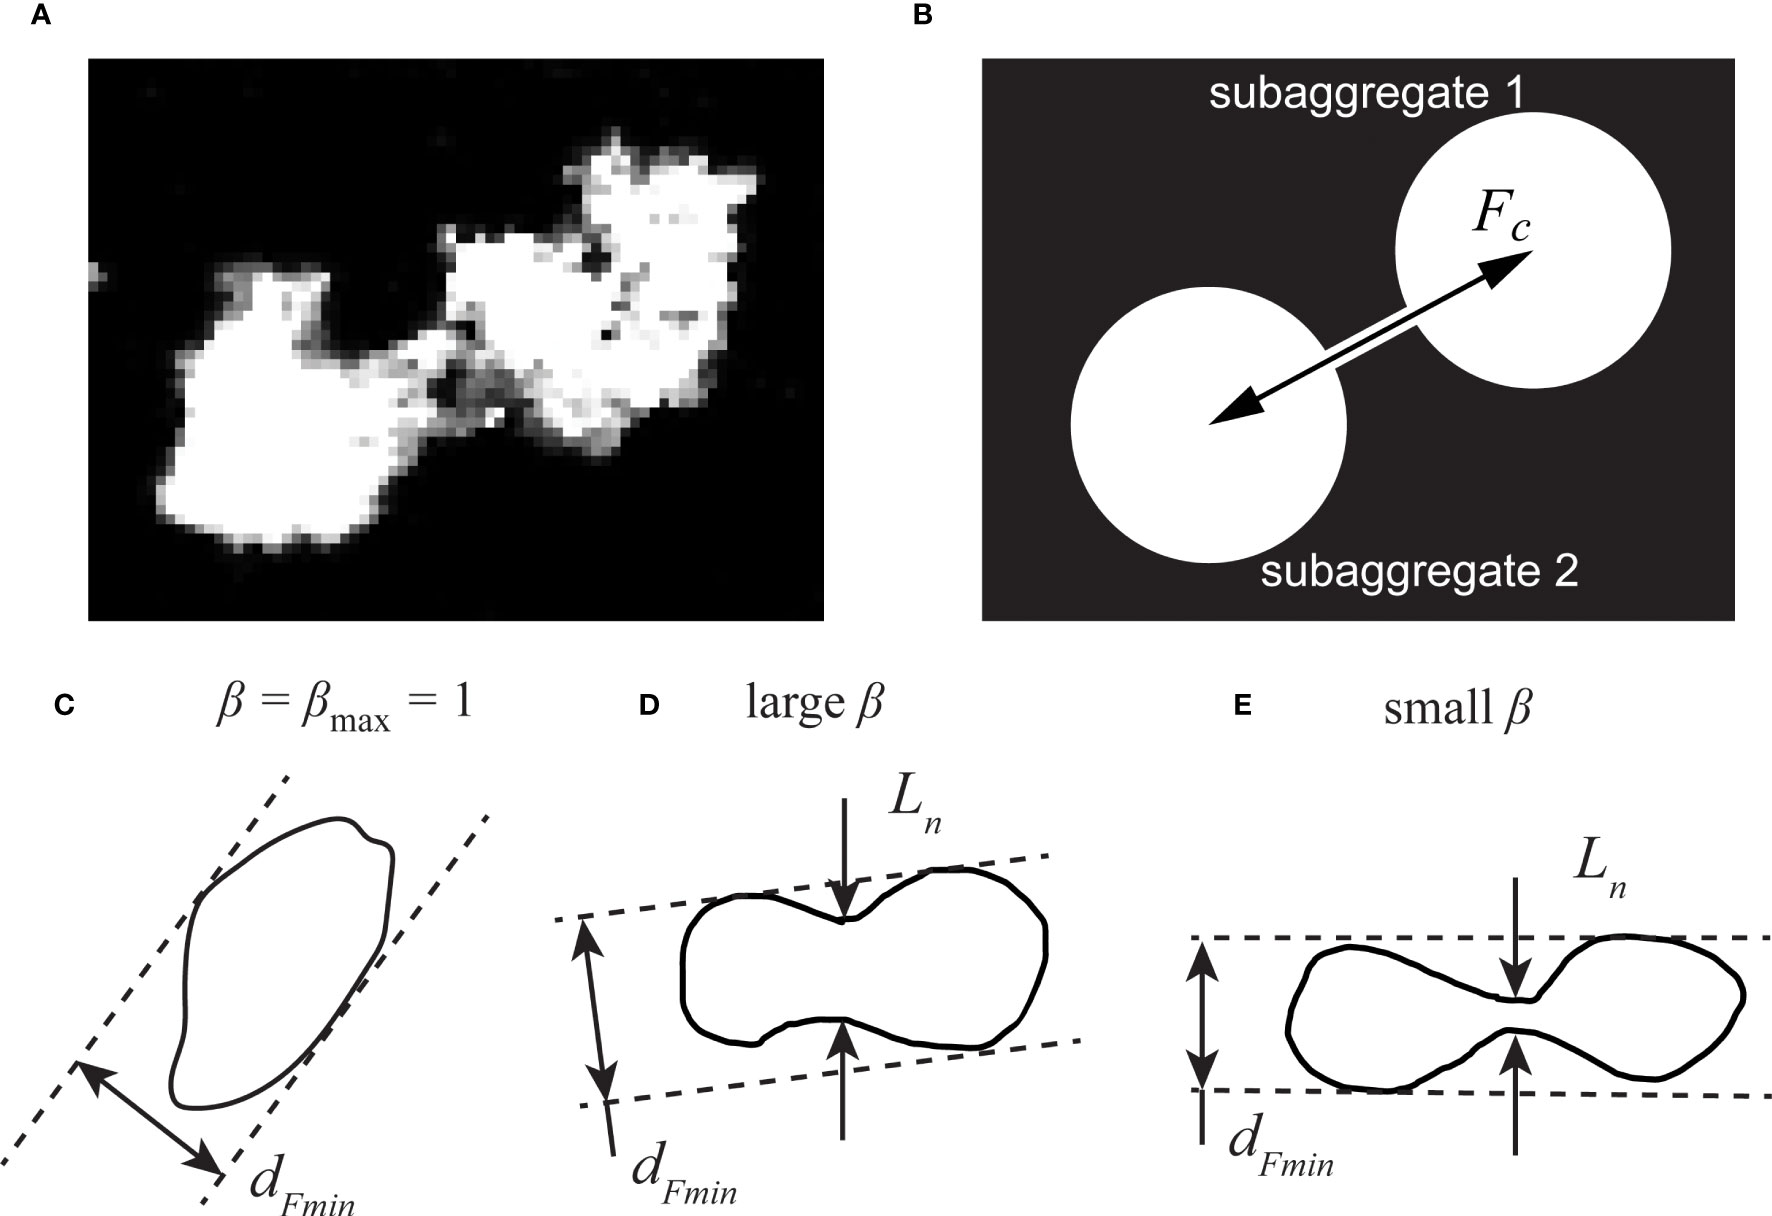
Figure 2 Schematic diagrams showing the neck of a deformed aggregate. (A) grayscale image of a deformed aggregate, and (B) schematic model of a “dumbbell” aggregate, where the coupling force Fc represents the inter-subaggregate force. Diagrams of different ratios of a deformed aggregate’s neck size to its minimum Feret diameter shown in (C–E), with (C) representing a typical polyethylene aggregate, (D) a typical polystyrene aggregate, and (E) a typical phytoplankton aggregate.
2.3 Preparation of aggregates
We used the same roller tank to form and fragment aggregates. Table 1 summarizes the types of aggregates with their sizes, cell counts, and salt solutions. Table 1 also lists the time required for aggregation and the tank rotation parameters used for aggregation and fragmentation. We varied the constant rotation speed, b, to accommodate the different excess densities of the various types of particles, with higher densities requiring faster rotation rates to minimize wall impacts. The oscillation magnitude for fragmentation experiments using OA, SG, and PE created a maximum laminar shear rate of 102 s-1 that is similar to the surf zone (George et al., 1994). The inner regions of the tank with a radial location from 3 to 4 cm provided fluid shear of from 10-2 s-1 to 100 s-1, more typical of the upper ~100-200 m of the ocean (Franks et al., 2022; Song and Rau, 2022). The more-central regions of the tank provided still lower shear rates. We used a smaller oscillation magnitude for the more fragile PS flocs, for which the flow had a maximum shear rate of only 16.5 s-1.
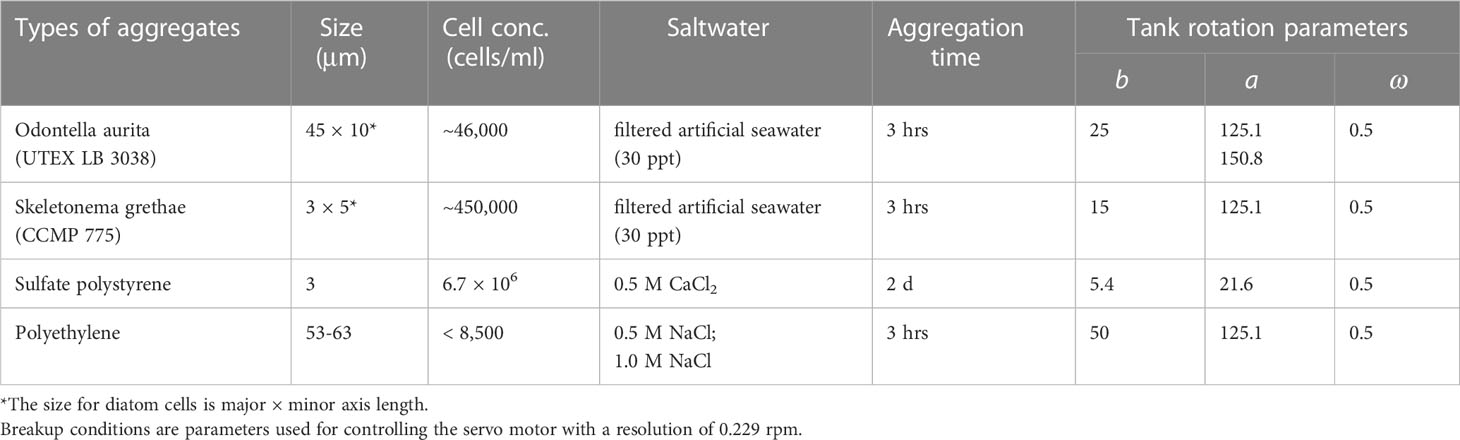
Table 1 Sizes, cell concentrations, and experimental conditions of four types of aggregates.
Figure 3 shows micrographs of cultured Odontella aurita v minima (UTEX LB 3038) and Skeletonema grethae (CCMP 775), which were cultured using f/2 medium for nutrients and laboratory-made artificial seawater (Kester et al., 1967) with a salinity of 30 ppt. We prepared the artificial seawater from deionized water by passing it through 5, 1, and 0.2 μm filters followed by an ultraviolet water purifier (HQUA-OWS-12). We used a light intensity of 30 μmol·m-2s-1 on a 12:12 hour light/dark cycle and cultured all samples at a room temperature of 20.9 °C (+2.3/-4.4 °C). We maintained their growth phase by splitting the mediums into Erlenmeyer flasks at a regular rate. Odontella aurita cells have an average length of 45 μm and a width of 10 μm. Skeletonema grethae cells are smaller and have a size of only 3 μm × 5 μm on average. We used a hemocytometer to estimate cell concentrations and maintained similar solid volume concentrations between experiments. We created the aggregation of algae aggregates by rolling them in artificial seawater AM for three hours. The formed aggregates had sizes of up to 4.6 mm in diameter with settling velocities that typically ranged from 0.18 cm/s (for a 1 mm aggregate) to approximately 0.5 cm/s for the largest aggregates. The settling velocities and sizes are comparable to those found in naturally occurring aggregates (Alldredge and McGillivary, 1991; Cael et al., 2021).
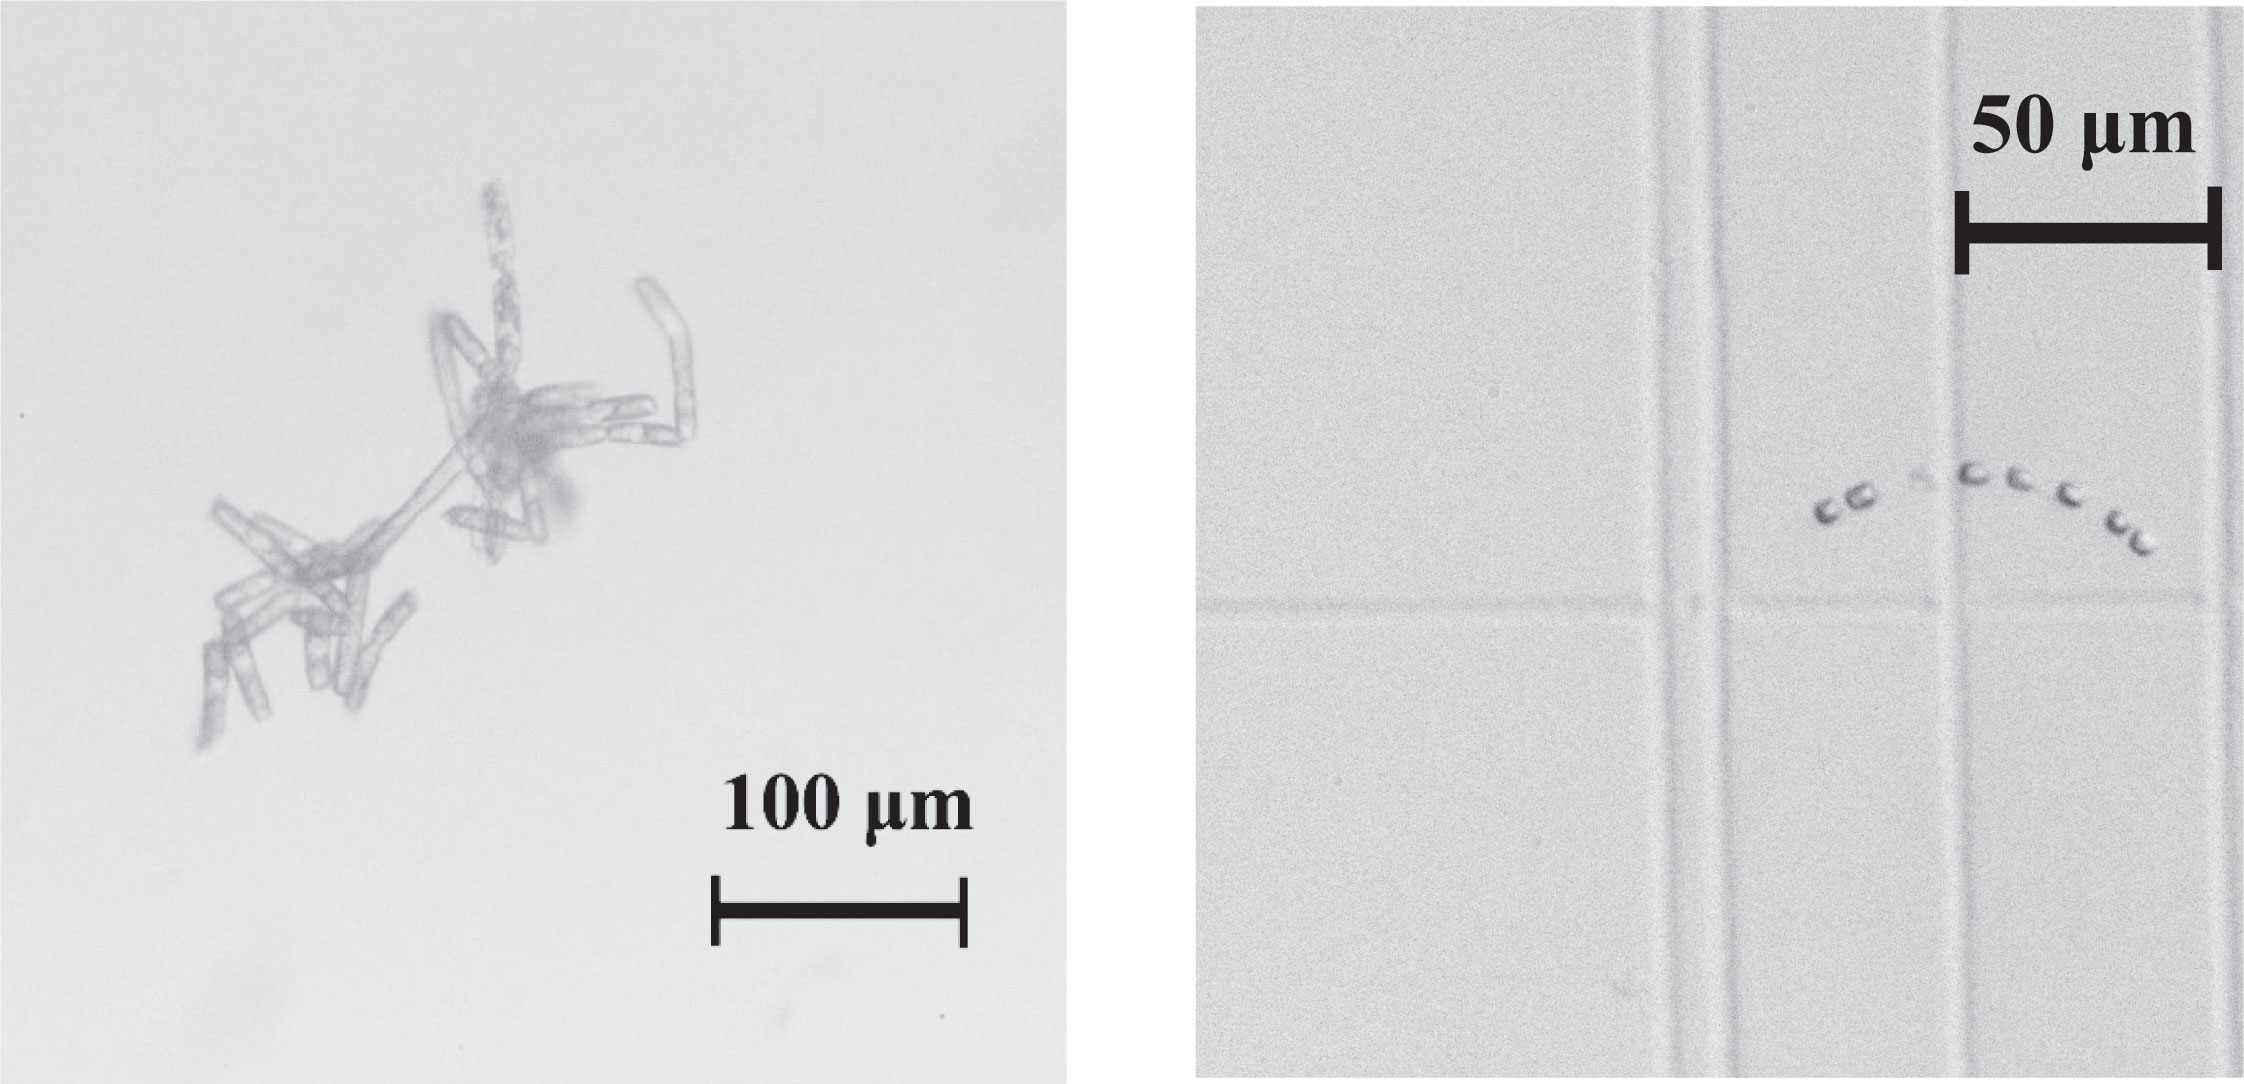
Figure 3 Microscopic images of cells of Odontella aurita (left) and Skeletonema grethae (right) used to make phytoplankton aggregates.
To provide comparable aggregates that had quantifiable interparticle forces, we used two types of colloidal microplastic particles destabilized in salt solutions to promote aggregation. We prepared polystyrene (PS) aggregates from surfactant-free monodisperse white sulfate latex beads (Interfacial Dynamics Corp., Catalog No. S37223, 8% weight by volume). The mean diameter was 3 μm. First, we diluted 1 mL of latex solution into 50 mL of deionized water. Then we transferred them into the disaggregation tank and fully destabilized them by adding calcium chloride at a concentration of 0.5 M. The resultant solution viscosity increased to 0.0111 cm2s-1 (Wahab and Mahiuddin, 2001; Abdulagatov and Azizov, 2006). The resulting concentration of PS microspheres in the disaggregation tank was 6.7 × 10⁶ cells/mL. Two days of rolling in AM formed PS flocs with sizes of up to two millimeters. The experiment required this long aggregation time due to the small excess density of PS (1055 kg·m-3) compared to the salt solution (1038 kg·m-3) (Wahab and Mahiuddin, 2001), combined with the small size of the PS microspheres.
We used dry powder of white polyethylene (PE) microspheres (Cospheric, WPMS-1.45) to form a second type of polymer flocs. The diameters ranged from 53 μm to 63 μm and their density was 1450 kg·m-3. Without surfactants, the hydrophobic polyethylene was difficult to disperse in water solutions despite its large excess density. To obtain suspended flocs, we used a magnetic stirrer to blend 1 g of PE powder in deionized water. Six hours of mixing dispersed most of the PE particles. Still, a small but non-negligible number of PE particles stayed on the water surface and could not be used in fragmentation experiments, which is why the particle concentration in Table 1 is listed as less than 8,500 cells/mL. We used high concentrations of NaCl to minimize the electrostatic repulsive forces to permit aggregation. The tank also operated with a high rate of constant rotation to account for the large particle density and avoid wall contact.
2.4 Extended Derjaguin–Landau–Verwey–Overbeek theory
We applied the XDLVO theory to estimate the interparticle forces holding the plastic aggregates together. The extended Derjaguin-Landau-Verwey-Overbeek (XDLVO) theory quantitively describes the influence of van der Waals forces FLW, electrostatic forces FEL, and Lewis acid-base forces FAB on the interaction among plastic microspheres (van Oss, 2008). XDLVO interaction forces decay with a separation distance l in the configuration of two spheres of equal radius Rs. The expression used to calculate the van der Waals force FLW (van Oss, 2008). is given as,
where A131 is the Hamaker constant for two surfaces of the same materials, denoted by 1 (in this case either PE or PS) interacting through a different medium, denoted by 3 (in this case water), and l0 = 0.157 nm is the minimum equilibrium distance. We used Hamaker constants of plastics A11 and water A33 to calculate A131 using the expression (van Oss, 2006). In our study, we employed A33 = 3.7 × 10⁻²⁰ J (Freitas, 1999), A11 = 7.6 × 10⁻²⁰ J for PE (Freitas, 1999; Shams et al., 2020), and A11 = 6.5 × 10⁻²⁰ J for PS (Israelachvili, 2011). We determined A131 as 6.9 × 10⁻²¹ J for PE dispersions and 3.9 × 10⁻²¹ J for PS.
The expression for the electrostatic force FEL as a function of the separation distance l is,
where ϵ and ϵ0 are the dielectric constant of water and the permittivity of free space, estimated to be 80 (at 20°C) and 8.854 × 10⁻¹² C·V-1m-1 (Elimelech et al., 1995), respectively. We can write the colloid surface potential φ0 in the following form,
where z is the distance between the particle surface and the slipping plane, which ranges from 0.3 to 0.5 nm, and ζ is the zeta potential. The symbol κ in Eqs. (2) and (3) is the inverse Debye length subjected to the aqueous solutions which we write as (Israelachvili, 2011),
where k is the Boltzmann’s constant, T represents absolute temperature, e is the electronic charge, vi is the valency of each ionic species, and ni is the number of ions of each ion species.
The classic DLVO theory did not consider hydrophobic attractions or hydrophilic repulsions (van Oss, 2008). Van Oss proposed a remedy to consider the polar interaction energies using the Lewis acid-base approach. It is a short-range force, and the working range usually is smaller than 8 nm (Brant, 2002; van Oss, 2008). We used the exponential decay model proposed by van Oss (2008),
where ΔGAB is the free polar potential energy for a geometric configuration of two parallel flat plates. The symbol λ is the decay length, where we chose λ = 0.6 nm for water (van Oss, 2008). We used ΔGAB = -102 mJ·m-2 for PE particles without surfactants (van Oss, 2008). The PS microspheres had sulfate modifications on their surface to become stabilized in water solutions, so we performed a detailed calculation of ΔGAB based on contact angle measurements for PS, the details of which are included in Supplemental Materials I. We found that the polar energy for sulfate PS was notably weaker than PE, in which the Lewis acid-base free energy for PS was -16.6 mJ·m-2 (-102 mJ·m-2 for PE). This value was consistent with our observations in the experiment, as PS particles formed a more stable suspension in deionized water, while PE particles showed strong hydrophobicity.
2.5 Necking stress model of deformed aggregates
Analysis of fragmentation required investigation of the forces that act on an aggregate in the laminar oscillatory flow of the facility. To develop a hydrodynamic force model, we assumed only a one-way coupling from the fluid to the aggregate (Raju and Meiburg, 1997). In other words, we assumed that the fluid flow was negligibly influenced by the aggregates. To show that an aggregate’s center of mass followed the fluid motion, we calculated a characteristic Stokes number St for our aggregates,
where the excess density ρp-ρf represented the density difference between the aggregates and solution, where μ was the fluid viscosity. It was challenging to measure the density of the diatom aggregates without knowing their porosity, so we estimated the excess density of diatom aggregates to be smaller than 3.25 × 10⁻³ g·cm-3 following the measurements conducted by Zetsche et al. (2020), who calculated the apparent excess density using the Stokes drag equation. We used the magnitude of tank oscillation (a) as the characteristic velocity scale U, and the characteristic boundary layer thickness (ν/ω)1/2 (Song and Rau, 2020b) as the length scale L, where ν was the kinematic viscosity of tank fluid. We estimated the mean size of the tracked aggregates from our experimental images to be on the order of 1 mm. With the parameters listed above, the Stokes numbers for all experiments was smaller than one, confirming that the analyzed aggregates approximately tracked the fluid motion in the tank and caused minimal flow disruptions. Thus, we could assume the velocity of a non-fragmenting particle using the fluid velocity calculated at its center of mass.
Next, we assumed that the deformed aggregates prone to fragmentation had a “dumbbell” shape with a thin neck between two larger clumps. For analysis, we assumed that breakup occurred when the tensile stress acting on the neck due to fluid forces exceeded a critical strength value shown as Fc in Figure 2B. To estimate fluid forces acting on the aggregate, we performed a Maxey-Riley force analysis (Maxey and Riley, 1983) on the two separate subaggregates of the “dumbbell”. The equations governing particle motions at a critical breakup condition are,
where subscripts 1 and 2 represent the two subaggregates in one “dumbbell”, V, d, and uf are volume, diameter, and corresponding fluid velocity of each, and up is aggregate velocity at its center of mass. The FB term represents the Basset force (Crowe et al., 2011), which accounts for the forcing history of the particle, and Fc is the coupling force that holds two subaggregates together. For a critical breakup condition, we assumed that there was no relative displacement of subaggregates to the parent aggregate, so the particle velocities of subaggregates up,1 and up,1 are the same as the parent aggregate up. The right-hand side of the equations represents the forces acting on the aggregate. The first term is the Stokes drag, where we approximated each subaggregate as an equivalent sphere to determine its fluid drag. We then neglected the second term, the buoyancy force, due to the small excess density of the aggregates. The next two terms represent a pressure gradient force that accounts for the acceleration of aggregates and the displaced fluid. The Basset force term describes unsteady effects and was neglected because we assumed no temporal delay in the development of the boundary layer around the aggregates (Parker et al., 1972; Raju and Meiburg, 1997). Therefore, we can simplify Eq. (7) and solve for the coupling force Fc at the instant of breakup as,
Based on the above equation, the forces that drive the particle motion and lead to fragmentation are the viscous Stokes drag and the pressure gradient effects.
To estimate the coupling stress within non-fragmenting aggregates for comparison, we made further simplifications to Eq. (8). These non-fragmenting aggregates either only deformed slightly into a dumbbell shape with a thick neck or remained ellipsoidal. We assumed that these aggregates were made up of two equal-sized subaggregates (d1 = d2 = d) held together with a larger contact area, and that the fluid velocity difference could be calculated from the local instantaneous shear rate G such that uf,1 - uf,2 = dG·sinϕ, where ϕ was the orientation angle between the particle’s major axis and the streamwise direction of fluid motion. These assumptions simplified the coupling force for an ellipsoidal aggregate in Eq. (8), which can be written as
We obtained the shear rate G using the analytical description of the laminar flow and the orientation angle ϕ using the image analysis methods developed by Song and Rau (2022).
We then determined the stress in the neck (σ) by dividing the coupling forces calculated from Eqs. (8) and (9) with the neck area obtained from the neck size measurements. These calculations were performed on each aggregate tracked and analyzed. We then assumed that these stress estimates were representative of the aggregate strengths.
Previous studies have attempted to relate aggregate strength to aggregate properties, in particular the aggregate size. Sonntag and Russel (1986); Zaccone et al. (2009), and Rau et al. (2018), showed a power law decay of breakup strength with floc size. If we assume that an aggregate’s strength (σ) is determined by the number of primary particle contacts at its fracture plane, the strength would be expected to decrease with increasing aggregate porosity (or decreasing fractal dimension). Various strength-size relationships for aggregates have been reported in the literature, generally using a negative exponent (x) to formulate the power law decay. Bremer et al. (1989) and Kranenburg (1994) reckoned that very few particles linked aggregates together. Their assumption of only one bonding unit led to a size exponent of x = -2, which gave,
However, their study did not account for any particle deformation or necking. Additionally, experimental work done by Saha et al. (2016) obtained a size exponent of x = -1.6 for microplastic aggregates over a wide size range (101 to 103 μm). To derive strength-size relationships for our data, we assumed that aggregates of the same type shared a similar fractal dimension Df (Jiang and Logan, 1991; Burd and Jackson, 2009), defined as,
where primary particles have identical diameters and masses of d1 and m1. The symbols d and m are the diameter and mass of the aggregate. Next, we calculated the solid volume fraction of an aggregate, written as,
where ψ represents the porosity of aggregates and mDf=3 is the mass of the aggregate if it were completely solid. If we assume aggregates have a uniform internal structure, the contact area at the neck of a deformed aggregate scales with the volume fraction of solids 1-ψ. Then, the critical necking stress σn, defined as the maximum stress an aggregate could tolerate before breakup, as a function of the neck size dn can be written as,
where σ1 represents the adhesive stress between two primary particles. This equation shows that the stress required to break apart a deformed aggregate is a function of its interparticle bond strength and its porosity, as the porosity measures the number of interparticle bonds within a homogenous aggregate. It is noted that Df = 1 represents the case of a linear aggregate with only one bond, which reduces to the exponent of x = -2 derived in previous studies (Bremer et al., 1989; Kranenburg, 1994). Eq. (13) also shows that the necking stress reduces to just the interparticle bond strength for a solid aggregate (Df = 3), which would be representative of the tensile fracture strength in a solid material.
3 Results
3.1 Shear rates of aggregated diatom and plastic microspheres at breakup
We performed breakup experiments for OA, SG, PS, and PE and observed fragmentation of OA, SG, and PS aggregates. PE aggregates did not break at the shear rates produced in our disaggregation tank. Our automated particle tracking algorithm identified and tracked 180,682 (OA), 114,549 (SG), 94,571 (PS), and 31,980 (PE) aggregates. OA, SG, and PE aggregates ranged from several hundred microns to up to five millimeters in equivalent diameter, while the largest size of PS flocs was approximately two millimeters. Our breakup detection algorithm obtained 79, 75, and 51 breakup events for OA, SG, and PS, which we manually confirmed in the images prior to analysis. It should be noted that the breakup events were conservatively identified. During experimentation, we visually observed more breakup events than are reported. These events were ultimately rejected due to inappropriate lighting or insufficient lifespan in the image timeseries. It should be emphasized that some breakup events using PS were also not counted due to the small particle size and our detection size limit of 4 pixels (~ 200 μm in diameter).
Figure 4 summarizes breakup results with various aggregated materials reported in this study and from the literature (Alldredge et al., 1990; Bache et al., 1997; Zaccone et al., 2009; Saha et al., 2014; Song and Rau, 2020a). Equivalent dissipation rates, calculated from , are also plotted, where ν is the kinematic viscosity. The disrupted algae aggregates from this study had equivalent diameters ranging from 1 mm to 5 mm, while the smallest fragmented PS aggregate detected had a diameter of 300 μm. The shear rates at breakup in this study showed a wide range, reaching as high as 10 s-1, similar to values observed in a surf zone (George et al., 1994), though breakup was also observed at shear values below 10-1 s-1 for both algae and PS aggregates, equivalent to shear caused by a turbulence dissipation rate of less than 10-8 W/kg. This value is representative of the median dissipation rate at ~20-30 m depths in the open ocean but has also been observed in short bursts at depths of 200 m (Franks et al., 2022). Given that our observed breakup events typically occurred from less than one second of shearing, even these short bursts are likely important to the disaggregation of sinking marine snow.
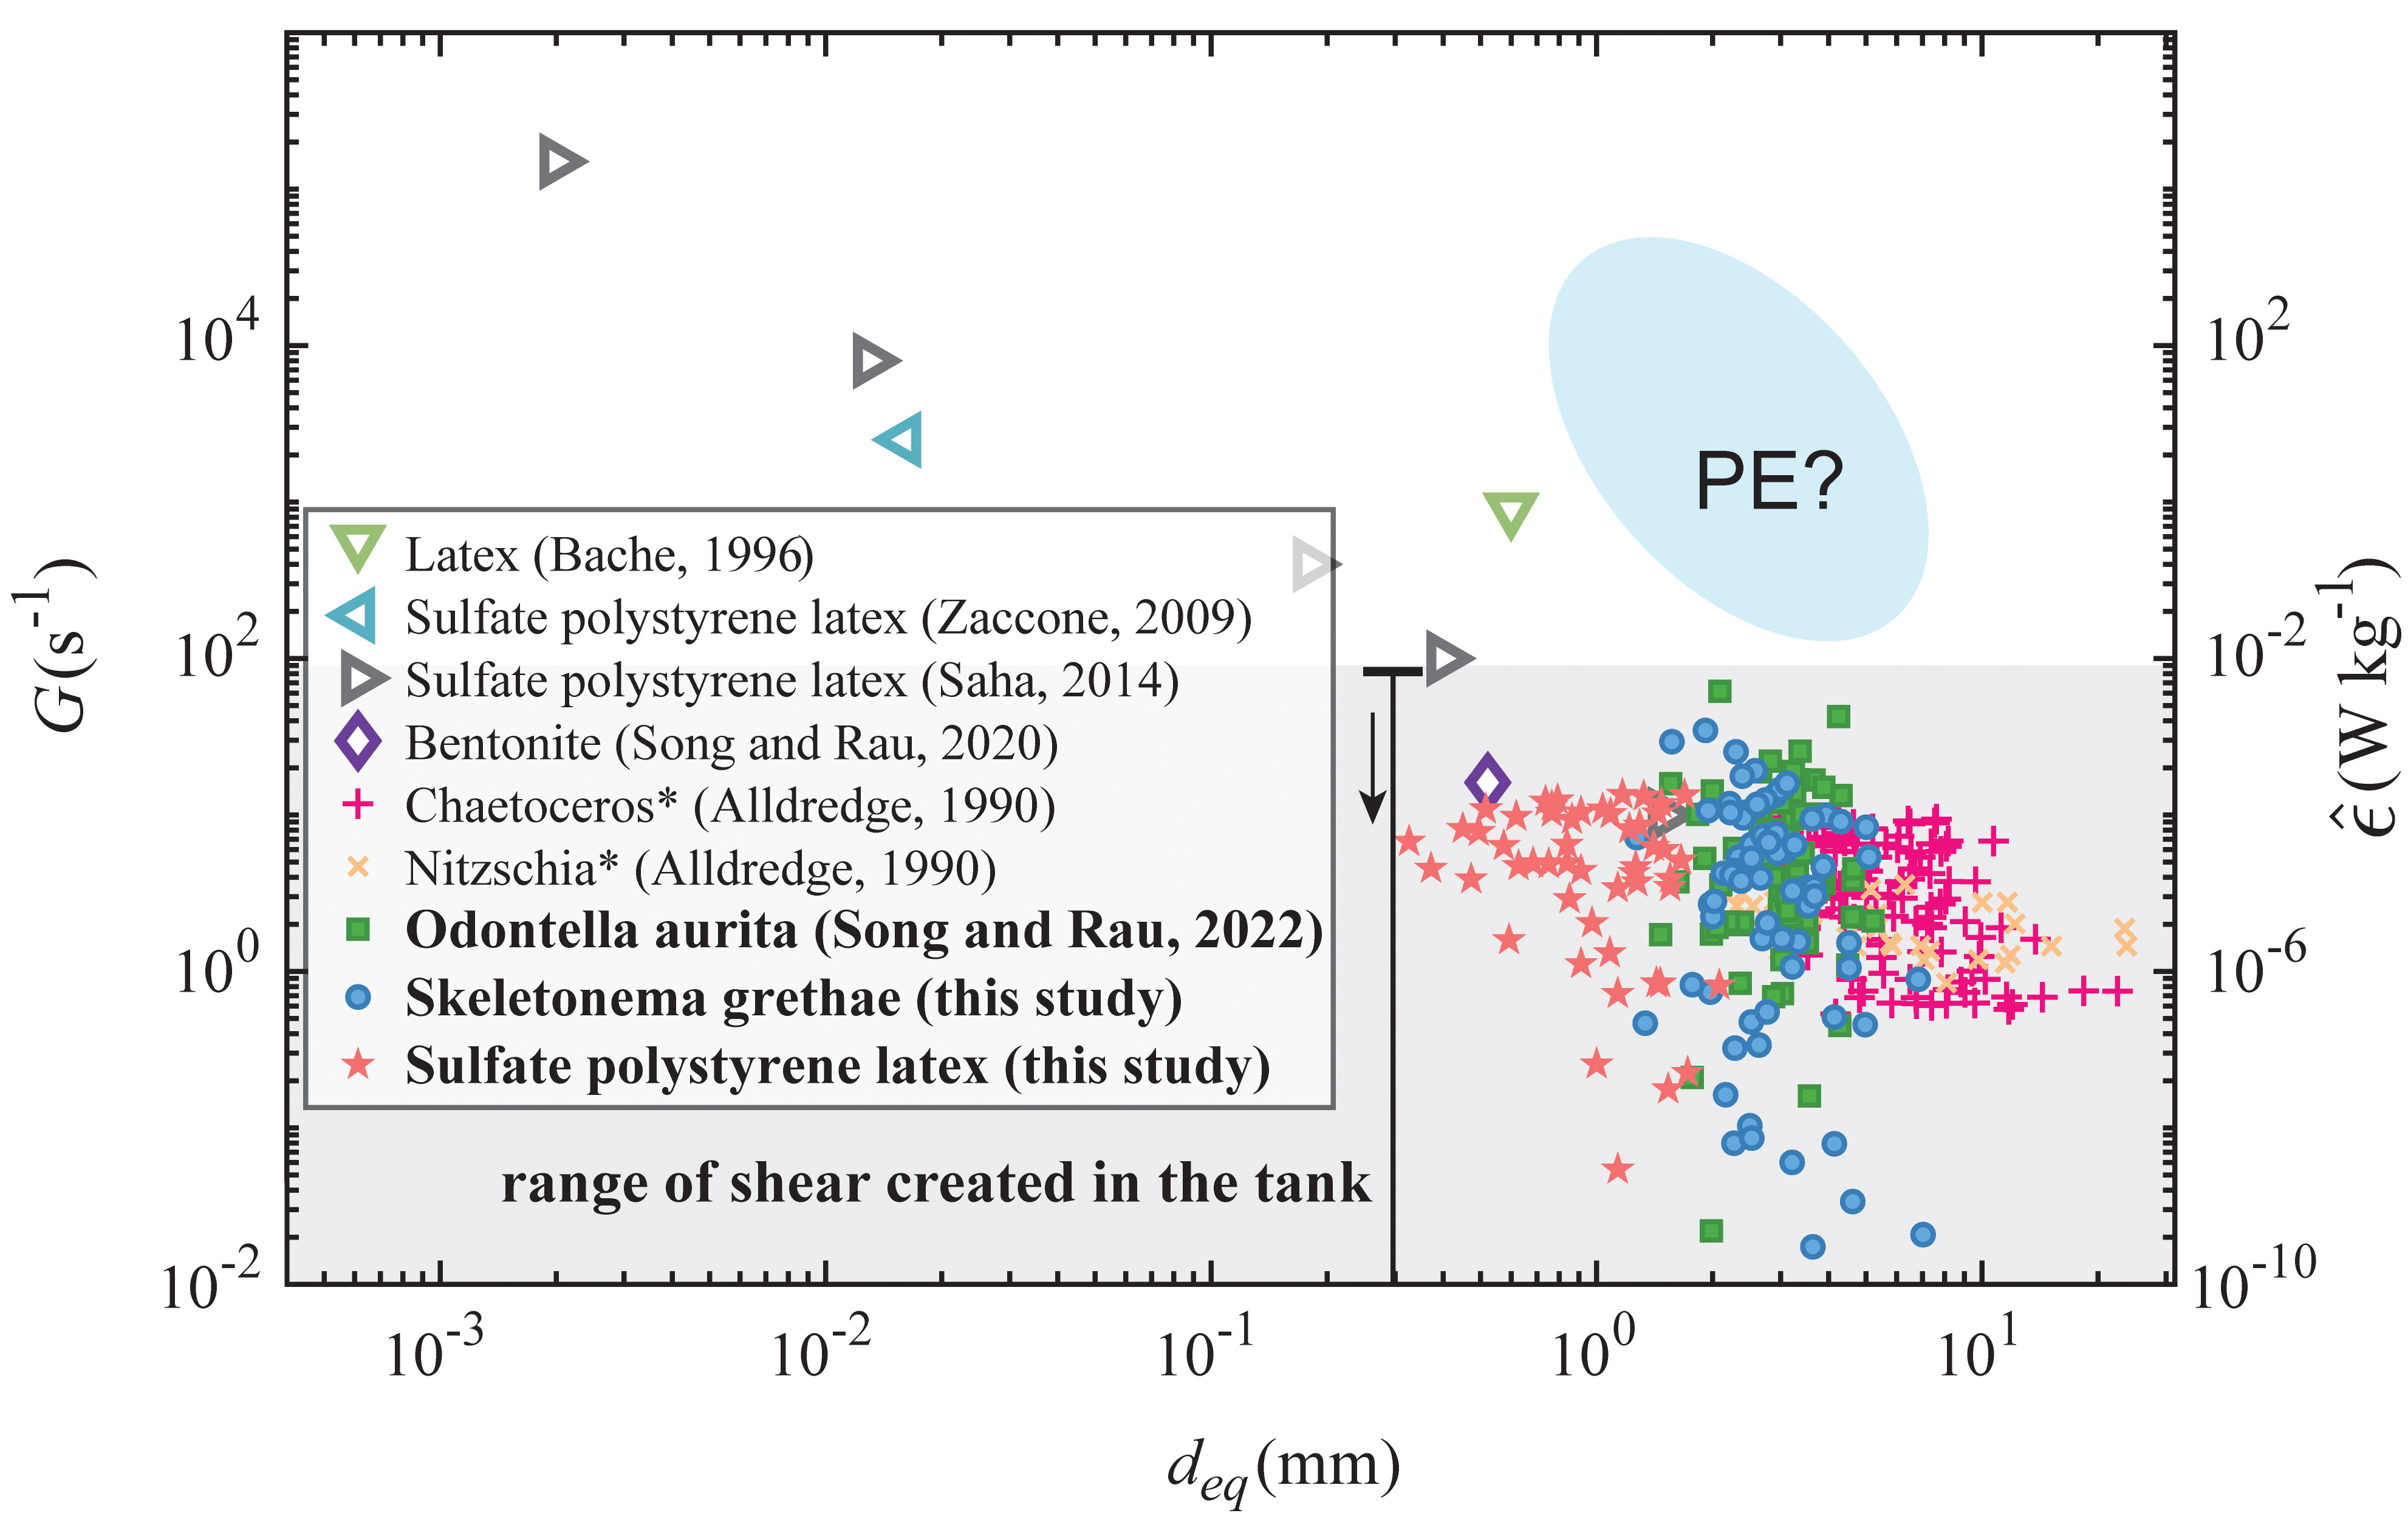
Figure 4 Shear rates at breakup as a function of aggregate size for various material types from other literature, originally shown in Song and Rau (2022) but updated to include the data from this study (the current experimental shear range plotted as the shaded area). Equivalent dissipation rates are also plotted. Fragmentation of PE flocs was not observed during the experiment, so shear rates for PE are estimated based on the size range detected in the experiment. Shear rates in studies marked with * are calculated from turbulence dissipation rates.
Comparing all of the breakup results in Figure 4 across material types and aggregate sizes, the shear rate at breakup seemed to follow a logarithmic decay as aggregate size increased. Sonntag and Russel (1986) and Higashitani et al. (2001) described a decline of breakup strength that followed a power law for microplastic flocs and simulated aggregated spheres, meaning that generally the disruption of smaller flocs required stronger fluid stress. In our study, both the OA and SG algae aggregates broke at similar sizes and shear rates despite having distinct primary cell sizes. PS aggregates broke at similar shear rates but also at smaller sizes, which indicated that their interparticle bonding was weaker than that of the OA and SG aggregates.
We did not observe fragmentation of PE aggregates even though they were similar in size to the OA, SG, and PS aggregates, which means that the bonding stress of PE used in this experiment was stronger than the other aggregate types. To calculate the primary bonding force within the PE and PS flocs, we applied the XDLVO theory. We used high salt concentrations that screened electrostatic repulsions for these aggregates, so the primary attractive forces were equal to the sum of van der Waals forces and Lewis acid-base forces. The attractive force for PE flocs was estimated to be two orders of magnitude stronger than PS flocs, assuming similar interparticle separation distances. This result was due to stronger hydrophobicity and a larger primary particle size of the PE particles. Assuming that the interparticle separation distances between the aggregates are ~10 nm for both the PE and PS (Tabor and Winterton, 1969; Israelachvili and Tabor, 1972; Gregory, 1981; Li et al., 2011), we estimate the interparticle force to be approximately 10-11 N for PS and 3×10⁻¹⁰ N for PE (see Figure S1). Given that PE and PS aggregates appear to be both stronger and weaker, respectively, than the algae aggregates shown in Figure 4, we expect that the interparticle bonding forces including the biological sticky content (TEP) holding the OA and SG aggregates together lie in between these two values.
Shear rates at breakup can represent characteristic flow conditions, but it should be emphasized that breakup strength also depends on the size and morphology of aggregates (Burd and Jackson, 2009), especially the elongation and necking behavior. The large range of shear at breakup in our results, shown in Figure 4, was likely due to variations in aggregate morphology. Another reason that could have caused the variability was that fluid stress likely exceeded the critical strength of aggregates in some cases. Additionally, biological factors such as varying concentrations of transparent exopolymer (Azetsu-Scott and Passow, 2004) could have affected the overall cohesiveness of the diatoms.
3.2 Morphology and fragmentation behaviors
Figure 5 illustrates the importance of the time-varying deformation of the aggregates prior to breakup. The figure shows three example breakup events of OA, SG, and PS aggregates with their sub-images obtained from particle tracking. We plot their shear exposure and morphological evolutions, including the major axis length Lma of an ellipse fit to the aggregate image, the orientation angle ϕ between the major axis and the streamwise direction of the fluid motion, and the neck size Ln, which was defined as the thickness of the neck that formed during aggregate elongation. The time is listed for reference, with t = 0 s equal to the first image after the tank started to create shear for fragmentation. The fragmented OA aggregate (Figures 5A-D) initially had a major axis length of 2.24 mm. This aggregate began to elongate due to shear exposure at t = 37.02 s, and we observed a notable necking behavior starting at t = 37.28 s. The major axis length increased, and the neck became thinner with the increase in shear rates (Figure 5D). At t = 38.04 s, this aggregate broke into two separate parts. The SG aggregate shown in Figures 5E-H underwent a re-orientation prior to breakup. Two connected parts started to fold as the major axis length decreased from 5.32 mm to 3.27 mm. We also observed a drastic change in its orientation angle, which was followed by stretching. Multiple necks occurred during the elongation, but only one developed into the fracture at t = 87.97 s. The PS aggregate experienced a decaying shear exposure before its breakup. At t = 25.08 s, a neck emerged, which thinned until fragmentation occurred at t = 25.61 s.
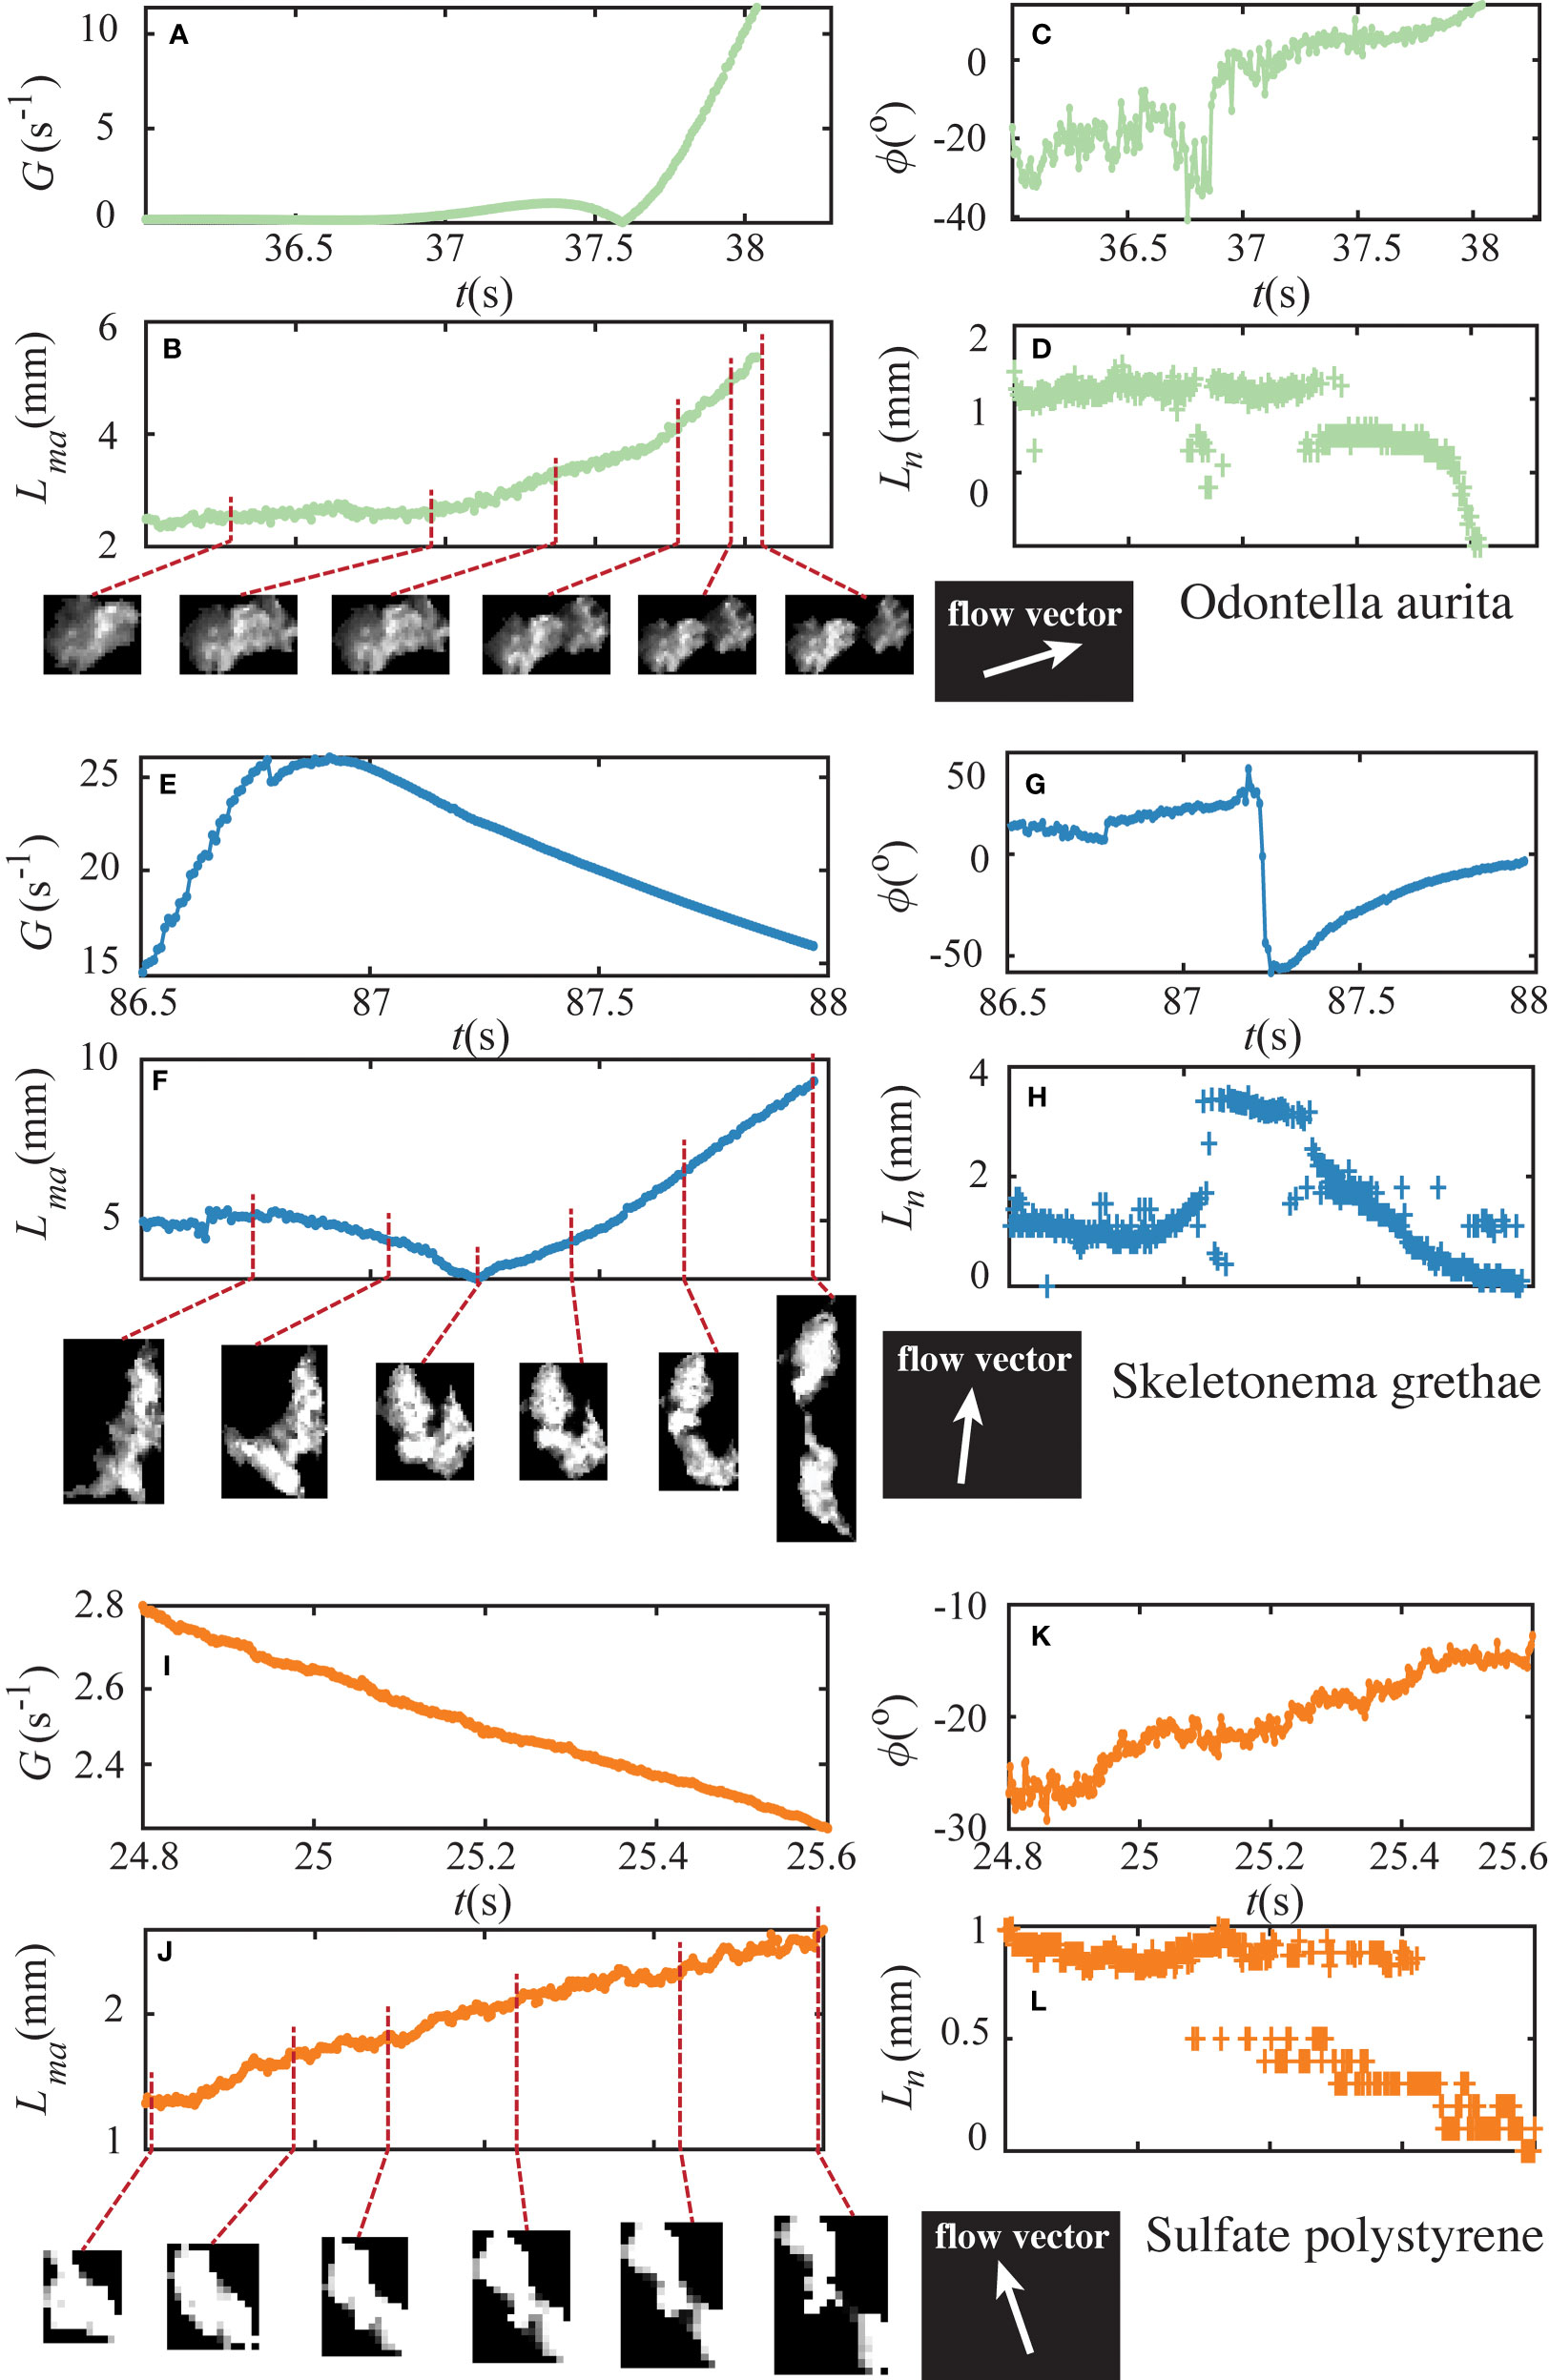
Figure 5 Lagrangian time series of example OA (top), SG (middle), and PS (bottom) aggregates. the time-resolved shear exposure (A, G, I), major axis length (B, F, J), orientation angle (C, G, K), and neck size (D, H, L) are shown respectively as a function of time. There is notably some error associated with the identification of neck size, particularly for the small polystyrene aggregate (L). Inset images show the aggregates at the respective times highlighted on the major axis length plot. Flow vectors shown indicate the flow direction at the aggregate centroid at the time of breakup. Supplementary Videos showing aggregates’ deformation and breakup are available online.
In total, we observed 205 breakup events, which allow us to provide a summary of some of their common characteristics. First, a monotonic increase in fluid shear was not necessary for fragmentation. Second, we found that all fragmentation events underwent substantial elongation in their major axis length, with over 95% of them accompanied by necking that continued until breakup. This characteristic deformation led to the assumption of our ‘dumbbell’ shape model for the force analysis described below. Moreover, the torque from the hydrodynamic forces tended to align the aggregates’ major axes with the streamlines of the flow. This can be seen in Figures 5C, G, K as the orientation angle of the aggregates reduced in magnitude as they elongated prior to breakup.
In addition to disrupted aggregates, we also sampled unbroken aggregates and compared their morphology under shear. We randomly selected 3,879 OA aggregates, 3,870 SG aggregates, and 2,300 PS aggregates that were tracked continuously for more than one second and did not fragment. We did not sample PE aggregates because we could not confirm if they reached a critical condition near breakup since we did not observe PE fragmentation. We calculated the time-varying β ratios of all of the sampled aggregates, which was the ratio of the aggregate’s neck size Ln to its minimum Feret diameter dFmin shown in Figure 2. Assuming that the minimum β value represented the point at which the aggregate was nearest breakup, we compiled the minimum β ratios for all aggregates of one particle type (PS, OA, or SG) and took the 1st percentile to be representative of the critical necking for the entire aggregate population, βcrit (i.e., the amount of necking possible for that aggregate type before it would fragment). This analysis revealed that OA and SG had similar critical necking ratios, βcrit = 0.138 and 0.134, respectively, while PS aggregates had a significantly higher value of βcrit = 0.237. The larger ratio of the PS flocs means that these aggregates required thicker necks with more interparticle bonds, relative to their size, to avoid fragmentation. Figure 2 schematically shows the difference in these critical shapes between PS flocs (Figure 2D) and the diatom aggregates (Figure 2E). Most PE flocs did not show necking behaviors at all and had a convex shape, shown in Figure 2C.
3.3 Fractal structures and decay of breakup strength with size
We used both the non-fragmenting aggregates, discussed in the section above, and disrupted aggregates to estimate the critical necking stress as a function of aggregate size. For the fragmenting particles, we assumed the necking stress just prior to breakup was the critical value. For all breakup events, we plot the pseudo necking stress calculated from the breakup force using Eq. (8) and their pseudo neck size calculated from the critical necking ratio βcrit; we could not define an actual neck size for disrupted aggregates as the neck size decreased to zero as breakup occurred. To estimate the strength of the deforming, but not fragmenting aggregates, we calculated the maximum necking stress experienced by the aggregates over the time they were tracked using the simplified force expression in Eq. (9) and their measured neck size at that instant. If a neck was not detected, we replaced the neck size with the minimum Feret diameter. We only analyzed deforming aggregates with aspect ratios of AR ≥ 2. Next, we grouped them into logarithmically spaced size bins commonly used in instruments for in-situ particle size measurements (e.g., LISST-HOLO2, Sequoia Scientific) and picked the top 10th percentile in necking stress for each size bin, which we assumed was approaching the critical necking stress required for breakup for each aggregate size class. Figure 6 plots the necking stress of these nearly broken particles with that of the disrupted aggregates, and the predicted necking stress versus the neck size predicted using Eq. (13) for four example fractal dimensions. We used the primary cohesive stress of σ1 = 1 Pa for PS aggregates, which was obtained from the XDLVO analysis assuming an interparticle force of 10-11 N and a particle size of 3 μm. We estimated the primary cohesive stress to be approximately σ1 = 10 Pa for the algae aggregates to plot Eq. (13) in Figures 6A, B. This value qualitatively makes sense relative to the predicted interparticle forces of the PS and PE particles if the algae contact areas were approximately 10-11 m2. Overall, the critical necking stress for the OA and SG aggregates showed a decaying trend with increasing aggregate size and fractal dimensions of 1.5~2.5. The strength-size relation of the PS aggregates was similar, but shifted to lower strengths given their weaker interparticle bonds.
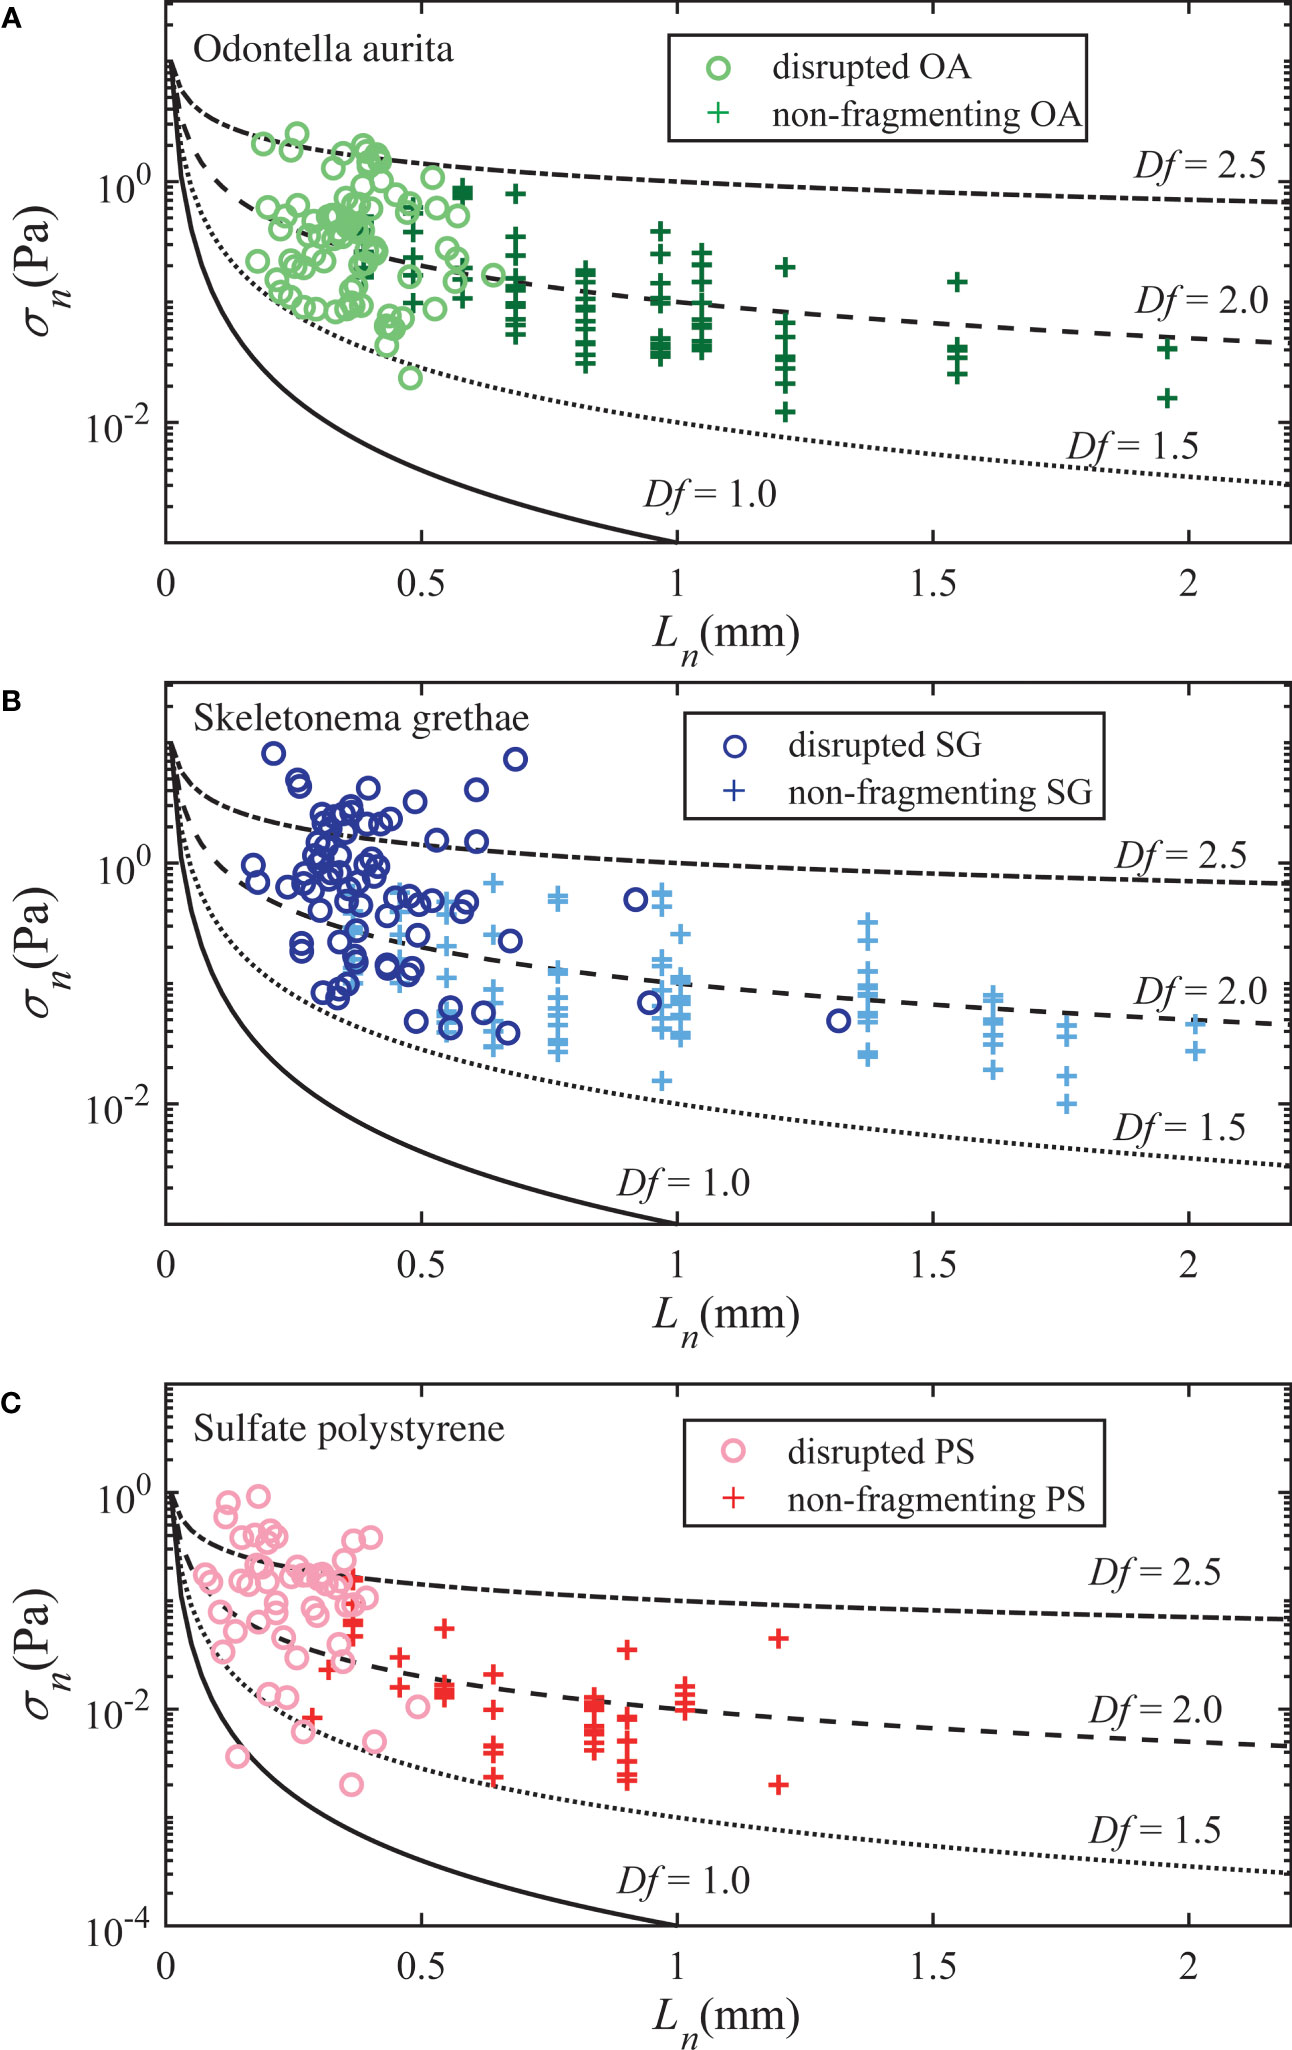
Figure 6 Necking stress as a function of the neck size for non-fragmenting (+) and fragmenting aggregates (○), shown for (A) Odontella aurita, (B) Skeletonema grethea, and (C) Polystyrene aggregates. The four black curves represent size dependent necking stress predicted by Eq. (13) for varying fractal dimensions.
3.4 Accumulated stress of aggregates and colloid flocs
This study uniquely resolved the details of dynamic aggregate fragmentation. It allowed us to couple the morphological evolutions to the time-varying fluid force and highlighted the importance of elongation and necking before breakup. To quantify the total deformation of an aggregate, we estimated the aggregate strain ϵ=(Lma–deq)/deq by assuming each aggregate was initially shaped like a perfect sphere. While a simplification, it is true that the aggregates in these experiments had more spherical shapes after purely AM tank operation, whereas the elongation primarily occurred during the fragmentation process. We also defined a particle Reynolds number Re = deq2G/ν, using equivalent circular diameter deq as the characteristic length scale. The velocity scale was the velocity difference across the particle and can be written as deqG. This Reynolds number definition roughly compares the relative importance of the inertial terms to the viscous drag terms acting on the aggregates in Eqs. (8) and (9). Figure 7 shows the aggregate strain as a function of the particle Reynolds number for the disrupted aggregates, where the symbol color denotes if the aggregate experienced either increasing or decreasing shear prior to breakup, defined as an increase or decrease of at least 10% over the previous second. Figure 7 shows that there is little difference in the deformation of aggregates at Reynolds numbers less than ~fifteen, where the viscous drag force governed the fragmentation. At higher Reynolds numbers, we observed differences as inertia played a more important role in the breakup mechanism. Diatom aggregates seemed to reach higher strain (i.e. they elongated more) when exposed to decreasing shear. We could not find PS aggregates at these higher Reynolds numbers for comparison due to their small sizes. As aggregates deform, the internal stress caused by fluid forces fractures internal bonds and causes restructuring. The aggregate strain, thus, is representative of an aggregate’s state of fragility. Deformation continues to occur if aggregates can still rearrange their internal bonds with continued forcing. Increasing shear exposure means that the aggregates experienced a growing hydrodynamic force as they elongated and weakened. This led to less overall deformation as the hydrodynamic forces quickly exceeded the strength of the weakening aggregate. Conversely, aggregates exposed to decreasing shear experienced a weakening hydrodynamic force as they elongated. This allowed these aggregates to restructure and elongate for longer before the decreasing hydrodynamic forces exceeded the aggregate strength. The hydrodynamic force calculation provided by Eqs. (8) and (9) does not fully explain this transient behavior since the model assumes a dynamic equilibrium at the point of breakup and ignores the temporal evolution leading up to that point. Moreover, models assuming rigid particles also cannot account for fragmentation under a decreasing shear condition. The time variation of aggregate strength likely provides a plausible explanation for breakup under these conditions and will be important for parameterization of disaggregation in unsteady (i.e. turbulent) flows.
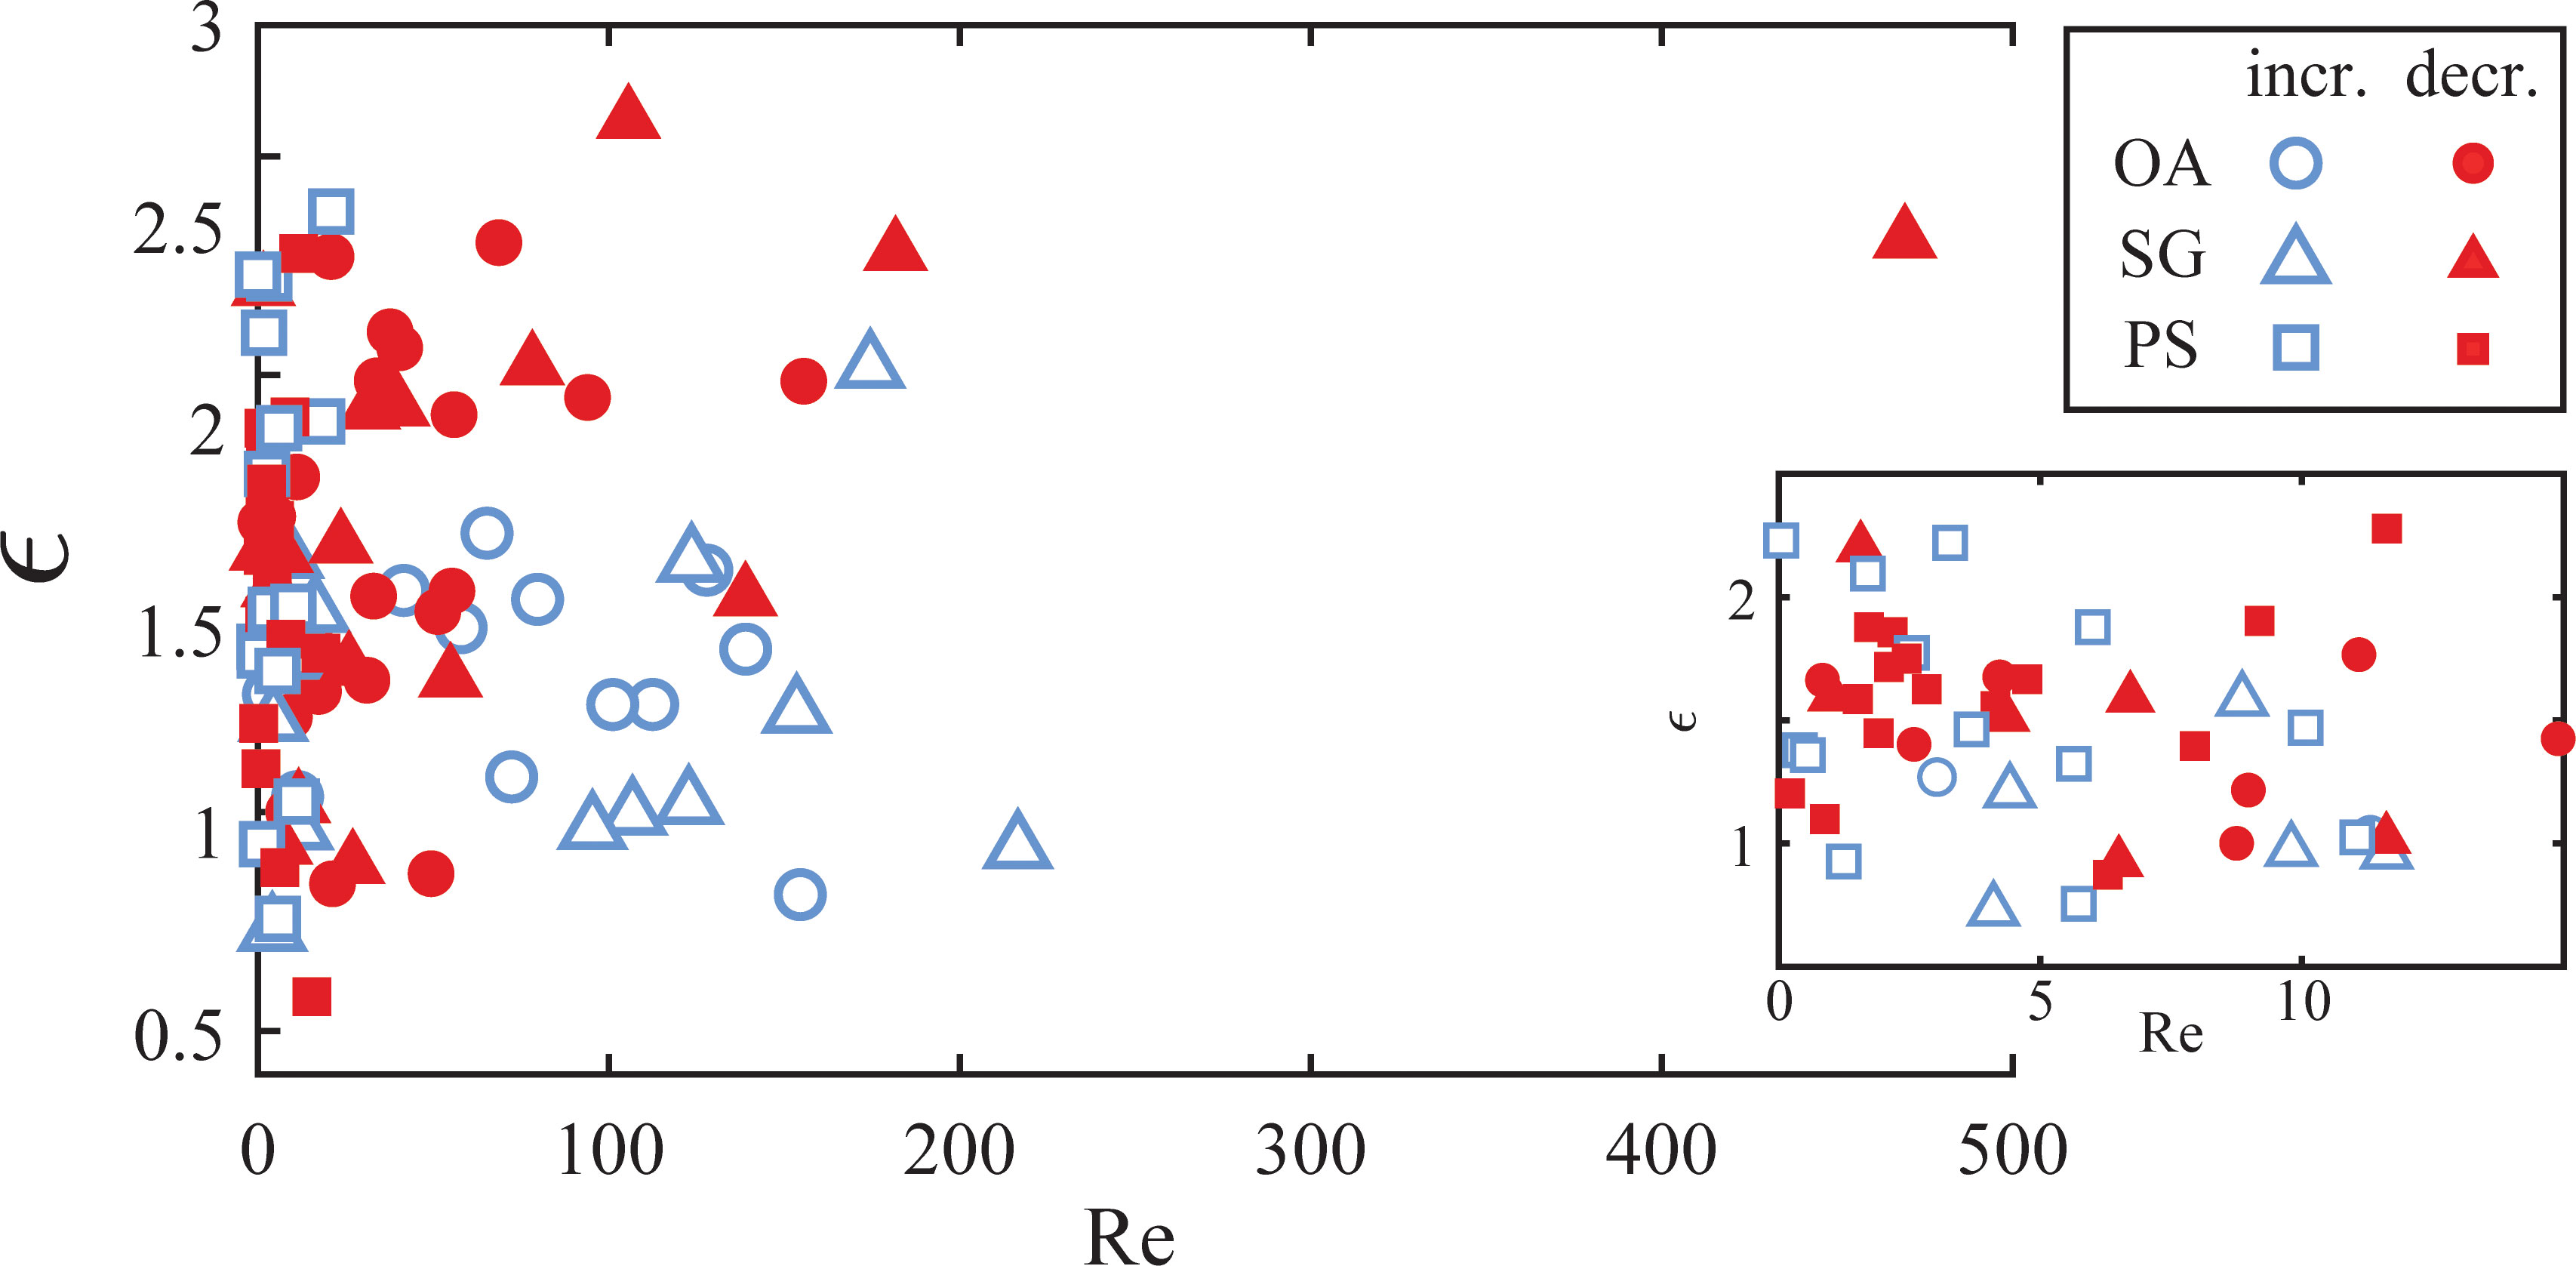
Figure 7 Aggregate strain as a function of particle Reynolds number for aggregates of OA (○●), SG (△▲), and PS (□■). Blue hollow symbols (○△□) represent disrupted aggregates with increasing shear exposure, and red solid symbols (●▲■) represent decreasing shear exposure.
As the above results showed, the breakup of aggregates required forcing over time and a weakening of their internal bonding network. To investigate this further, we plot the accumulated internal stress of each aggregate against its strain difference in Figure 8. Comparably, Saha et al. (2016) proposed a similar breakup mechanism due to drag stress accumulation. Since we could not track the entire forcing history of each aggregate from the point that the aggregates were exposed to shear to the point of breakup, we calculated the integrated stress and strain difference using only the measured lifespans of each aggregate. We defined the strain difference, Δϵ, as the difference between the smallest strain measured for each aggregate and its strain at breakup. To characterize the accumulated internal stress, we integrated the instantaneous necking stress, (defined as the instantaneous force expressed in Eq. (9) divided by the instantaneous neck area) from the time frame with the smallest strain to breakup. We observed that the cumulative internal stress was positively correlated with total deformation of disrupted aggregates. Similar accumulations of internal stress caused algae aggregates (Figures 8A, B) to deform less than PS flocs (Figure 8C). Yellow lines in Figure 8 represent a power fit from a linear regression of the scattered data. PS flocs in Figure 8C showed the strongest correlation (R2 = 0.71) on a logarithmic scale, but algae aggregates displayed a weaker trend (R2 = 0.23 for OA and 0.35 for SG). PS flocs had a better linear regression likely because of more homogeneous structures and more uniform interparticle forces compared to OA and SG. The possibility of more-varied cohesive content (e.g. transparent exopolymer particles) in the algae aggregates could also explain their variability.
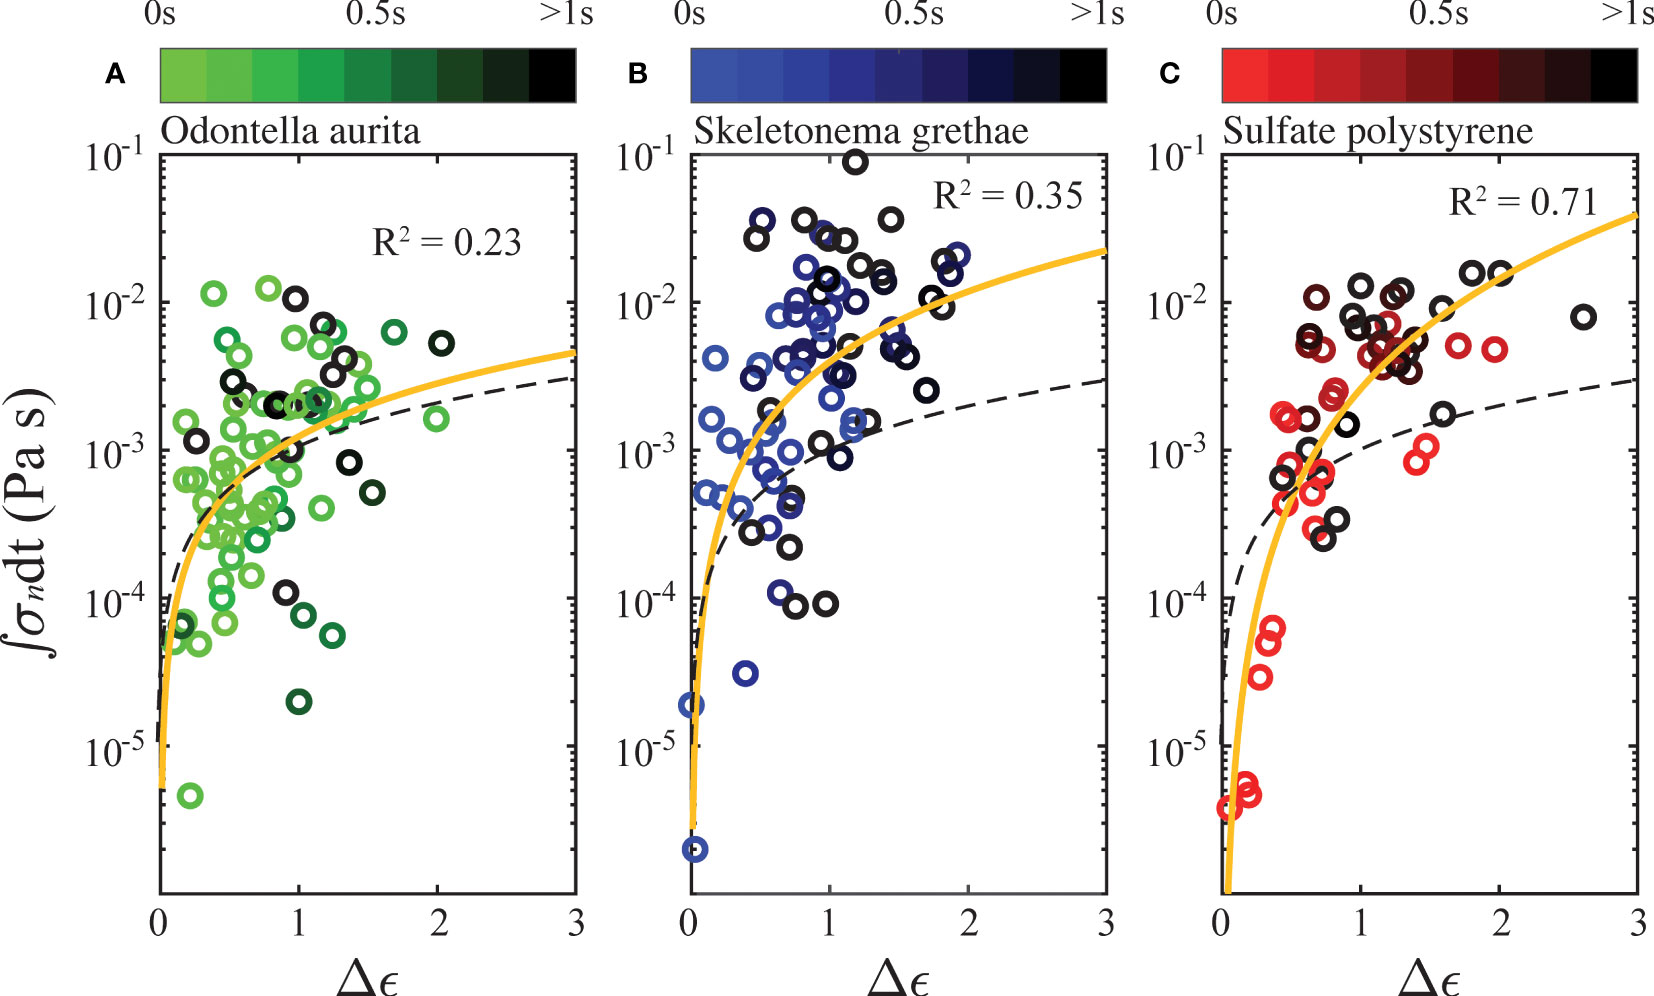
Figure 8 Accumulated internal stress as a function of strain difference at breakup, plotted in semilogarithmic scale, for (A) Odontella aurita, (B) Skeletonema grethae, and (C) Polystyrene. The color shading of every individual breakup event is scaled by total exposure time from a frame with the smallest strain to breakup. The yellow line indicates the best correlation, and the black dashes line represents the linear relation for water.
The time integration of the stress is representative of the total amount of fractured bonds in an aggregate. The strain difference quantifies the rearrangement of internal bonding networks, so we expect it to be positively correlated to the stress accumulation. We compared the aggregate deformation behaviors with that of a parcel of Newtonian fluid (water), shown as the black dashed line in Figure 8. In a Newtonian fluid, the viscous stress is a linear function of its strain rate. If we relate the integration of internal stress to the strain difference, , a Newtonian fluid has an exponent of n = 1. The exponent for the PS flocs was n = 2.47, and best correlations for OA and SG are 1.19 and 1.58. Comparisons between the yellow and black lines generally show that the aggregates deformed less than a parcel of Newtonian fluid would have under similar cumulative stresses. This is expected given that Newtonian fluids have free molecules and continuous structures, allowing easier and more homogeneous strain deformation. However, the exponent n > 1 for the PS aggregates with a relatively strong correlation indicates that the apparent viscosity of PS flocs increases as stress increases. This behavior is similar to a shear thickening fluid. The weak correlations for the algae aggregates show that more complex interactions are governing their deformation. Therefore, the effective properties of an algae aggregate could display characteristics of elasticity, plasticity, and viscosity, i.e., the internal stress could be a function of both strain and strain rate, .
The shade of each fragmentation event is also plotted based on the total strain time used in the integration. There was no evident relation in exposure time for PS flocs, which indicates that strong shear with short time exposure had a similar effect on the breakup of PS flocs to a case with small shear and a long time exposure. OA and SG aggregates behaved similarly, but we observed that longer shear exposure generally tended to cause more deformation.
4 Discussion
In this study, we performed fragmentation experiments on four different aggregate types: OA, SG, PS, and PE. We utilized a rotating and oscillating roller tank to expose aggregates to laminar oscillatory shear flow and captured the Lagrangian time series of individual aggregates. Similar fluid shear caused the breakup of OA, SG, and PS flocs but failed to disrupt PE flocs. The unique problem of interparticle adhesive strength between marine algae cells stemmed from the stickiness of EPS, in which we had to consider the biological sticky content more than the classic colloidal aggregation theory. The result uncovered the cohesive strength of OA and SG aggregates between PE microspheres that were much stronger than those and the PS particles. The XDLVO theory confirmed the relative strength of the plastic aggregates, which also bounded the interparticle adhesive forces of the OA and SG aggregates investigated. All types of disrupted aggregates had to experience large enough shear and undergo a substantial elongation with subsequent necking in order to fragment. In addition to analyzing fragmenting aggregates, we analyzed thousands of deformed, non-fragmenting aggregates and found that the ratio of their neck size to aggregate width was smallest for the PS aggregates. A simplified analysis of the hydrodynamic forces acting on the elongating aggregates allowed us to define the time-varying stresses leading to deformation and breakup. We found that this transient forcing played a crucial role in the fragmentation process. The aggregates showed a decay of breakup strength with neck size that was primarily a result of the porous structures of the aggregates. To describe this behavior, we derived an expression relating the bonding stress between primary particles to the breakup stress required to fragment an aggregate.
Our experimental methodology had some limitations in that we could only resolve a two-dimensional aggregate projection from the single camera system. Thus, we could not measure the aggregate thickness along the axial direction of the tank. Our camera resolution was also not capable of resolving the primary particle sizes for the SG and PS samples. Both effects, plus limited camera recording time, prevented us from obtaining the entire shear and morphological history of the aggregates. Additionally, our particle tracking method only allowed us to confirm a small number of breakup events with high confidence and we observed many more breakup events than were reported. A longer recording time is desirable for future implementations. Furthermore, it should be noted that an aggregate will influence the surrounding flow to some extent and that this influence will change as it deforms. For example, as an aggregate rotates within a shear flow, weak vortex rings can form Li et al. (2011), which may contribute to the hydrodynamic forcing as deformation occurs. Though we could not capture these local flow considerations in the present investigation, the imposed shear acting on an aggregate contributed much more significantly to the disaggregation forcing than these secondary flow structures (Dizaji et al., 2019). Our model estimates of the coupling forces from the primary shear rate in Eqs. (8) and (9) reflects this importance.
Despite these limitations, this study has demonstrated many important aspects of the transient deformation and fragmentation process. In particular, this study demonstrates the importance of exposure time. High enough shear can undoubtedly disrupt aggregates, but low-magnitude shearing can also cause fragmentation if the exposure time is sufficient to cause aggregate restructuring and deformation. Figure 4 shows that breakup events occurred at very low shear rates. In the context of the deformation results, it is likely that these events were preceded by deformation resulting in a fragile floc that could be fragmented by a very low shear rate. It is important to discuss this time exposure in the context of the duration of shear events in the ocean. It should be emphasized that the maximum experiment time was less than three minutes. Natural phytoplankton aggregates can easily be exposed to low values of shear for hours or even longer. For example, Franks et al. (2022) observed that the median dissipation rates were smaller than 10-8 W/kg in the upper 100 m, and that 99% of observations had dissipation rates less than 10-6 W/kg. Turbulence intensity decreased rapidly with depth and the most frequent turbulence levels were low enough in magnitude that breakup caused by high shear cannot be dominant. Low shear, but long time exposure, likely provides a feasible explanation for aggregate fragmentation in an environment of low turbulence dissipation energy. Further investigations should be implemented for evidence of fragmentation due to low shear in the upper 200 m or at deeper depths caused by internal waves or other transient events.
The deformation behavior observed in this study revealed that aggregates have some fluid-like behavior. However, their loose and porous structures of connected primary particles still move with limited freedom. Future investigations should expose individual aggregates to a more controlled hydrodynamic environment to further clarify these properties. The breakup strength expression (Eq. (13)) provides the possibility of obtaining a breakup stress for aggregates from a simple relationship relying on fractal dimension and primary particle bonding strength. Fractal dimensions are typically used to describe large populations of aggregates (Jiang and Logan, 1991; Johnson et al., 1996; Burd and Jackson, 2009), but the aggregate-to-aggregate variation will always cause outliers in statistical analyses. More investigations are desired in order to quantify the expected aggregate-to-aggregate variability within aggregates of varying particle types. In-particular, the deformation processes exhibited in this study should be further investigated in the field to determine their applicability to aggregates of different sizes and makeup. This can be accomplished with targeted field campaigns; however, the increasing deployments of in-situ imagers (e.g., underwater vision profilers) may enable a path to quantify aggregate elongation and necking in-situ and at depth at a variety of locations around the globe.
The findings of this study have important implications for modeling the ocean biological carbon pump. It has long been hypothesized that marine aggregate fragmentation can explain part of the observed carbon flux attenuation and recent evidence supports this conclusion (Briggs et al., 2020). However, mechanisms that would lead to the disaggregation of settling particulate matter have not yet been confirmed. The weakening of aggregates with exposure to low shear presented here is one such mechanism. These influences can be incorporated into biogeochemical models as extensions to typical aggregation considerations, where aggregation due to turbulent shear and/or differential settling is already considered to quantify changes in particulate settling velocity (Aumont et al., 2015; Maerz et al., 2020). The shear exposure of the modeled particulate matter can be tracked with time and Eq. (13), and other relationships to represent the aggregate microstructure and composition (e.g., (Maerz et al., 2020)) can be applied to estimate breakup rates in response to the predicted hydrodynamic shear stresses. We think this approach will be particularly valuable for models capable of resolving the effects of stratification on turbulence and particle settling, as pycnoclines can both reduce aggregate settling velocity (Prairie et al., 2015; Ahmerkamp et al., 2022) and enhance turbulence dissipation rates (Fernando, 1991). These effects could combine to enhance particle disaggregation at depth.
Data availability statement
The original contributions presented in the study are included in the article/Supplementary Material. Further inquiries can be directed to the corresponding author.
Author contributions
Conceptualization: YS, MR, AB. Methodology: YS, MR. Investigation: YS. Supervision: MR. Writing—original draft: YS. Writing—review & editing: YS, MR, AB.
Funding
National Science Foundation OCE-1948283 and CBET-2241045.
Acknowledgments
The authors gratefully acknowledge support for this research through NSF grants OCE-1948283 and CBET-2241045. We wish to thank Dr. Margaret Byron, Dr. Jennifer Prairie, and Dr. Heidi Fuchs for their helpful discussions and constructive recommendations.
Conflict of interest
The authors declare that the research was conducted in the absence of any commercial or financial relationships that could be construed as a potential conflict of interest.
Publisher’s note
All claims expressed in this article are solely those of the authors and do not necessarily represent those of their affiliated organizations, or those of the publisher, the editors and the reviewers. Any product that may be evaluated in this article, or claim that may be made by its manufacturer, is not guaranteed or endorsed by the publisher.
Supplementary material
The Supplementary Material for this article can be found online at: https://www.frontiersin.org/articles/10.3389/fmars.2023.1224518/full#supplementary-material
References
Abdulagatov I. M., Azizov N. D. (2006). Viscosity of aqueous calcium chloride solutions at high temperatures and high pressures. Fluid Phase Equilib. 240, 204–219. doi: 10.1016/j.fluid.2005.12.036
Ahmerkamp S., Liu B., Kindler K., Maerz J., Stocker R., Kuypers M. M. M., et al. (2022). Settling of highly porous and impermeable particles in linear stratification: implications for marine aggregates. J. Fluid Mech. 931, A9. doi: 10.1017/jfm.2021.913
Alldredge A. L., Granata T. C., Gotschalk C. C., Dickey T. D. (1990). The physical strength of marine snow and its implications for particle disaggregation in the ocean. Limnol. Oceanogr. 35, 1415–1428. doi: 10.4319/lo.1990.35.7.1415
Alldredge A. L., McGillivary P. (1991). The attachment probabilities of marine snow and their implications for particle coagulation in the ocean. Deep Sea Res. Part A. Oceanogr. Res. Papers 38, 431–443. doi: 10.1016/0198-0149(91)90045-H
Alldredge A. L., Passow U., Logan B. E. (1993). The abundance and significance of a class of large, transparent organic particles in the ocean. Deep Sea Res. Part I. 40, 1131–1140. doi: 10.1016/0967-0637(93)90129-Q
Alldredge A. L., Silver M. W. (1988). Characteristics, dynamics and significance of marine snow. Prog. Oceanogr. 20, 41–82. doi: 10.1016/0079-6611(88)90053-5
Aumont O., Ethé C., Tagliabue A., Bopp L., Gehlen M. (2015). PISCES-v2: an ocean biogeochemical model for carbon and ecosystem studies. Geosci. Model. Dev. 8, 2465–2513. doi: 10.5194/gmd-8-2465-2015
Azetsu-Scott K., Passow U. (2004). Ascending marine particles: significance of transparent exopolymer particles (TEP) in the upper ocean. Limnol. Oceanogr. 49, 741–748. doi: 10.4319/lo.2004.49.3.0741
Babakhani P., Phenrat T., Baalousha M., Soratana K., Peacock C. L., Twining B. S., et al. (2022). Potential use of engineered nanoparticles in ocean fertilization for large-scale atmospheric carbon dioxide removal. Nat. Nanotechnol. 17, 1342–1351. doi: 10.1038/s41565-022-01226-w
Bache D. H., Johnson C., McGilligan J. F., Rasool E. (1997). A conceptual view of floc structure in the sweep floc domain. Water Sci. Technol. 36, 49–56. doi: 10.1016/S0273-1223(97)00418-6
Bell G. I. (1978). Models for the specific adhesion of cells to cells. Sci. (1979) 200, 618–627. doi: 10.1126/science.347575
Berman T., Passow U. (2007). Transparent exopolymer particles (TEP): an overlooked factor in the process of biofilm formation in aquatic environments. Nat. Precedings. doi: 10.1038/npre.2007.1182.1
Boström M., Deniz V., Franks G. V., Ninham B. W. (2006). Extended DLVO theory: electrostatic and non-electrostatic forces in oxide suspensions. Adv. Colloid Interface Sci. 123–126, 5–15. doi: 10.1016/j.cis.2006.05.001
Brant J. (2002). Assessing short-range membrane–colloid interactions using surface energetics. J. Memb. Sci. 203, 257–273. doi: 10.1016/S0376-7388(02)00014-5
Bremer L. G. B., van Vliet T., Walstra P. (1989). Theoretical and experimental study of the fractal nature of the structure of casein gels. J. Chem. Society Faraday Trans. 1: Phys. Chem. Condensed Phases 85, 3359–3372. doi: 10.1039/f19898503359
Briggs N., Dall’Olmo G., Claustre H. (2020). Major role of particle fragmentation in regulating biological sequestration of CO2 by the oceans. Sci. (1979) 367, 791–793. doi: 10.1126/science.aay1790
Burd A. B., Chanton J. P., Daly K. L., Gilbert S., Passow U., Quigg A. (2020). The science behind marine-oil snow and MOSSFA: past, present, and future. Prog. Oceanogr. 187, 102398. doi: 10.1016/j.pocean.2020.102398
Burd A. B., Jackson G. A. (2009). Particle aggregation. Ann. Rev. Mar. Sci. 1, 65–90. doi: 10.1146/annurev.marine.010908.163904
Cael B. B., Cavan E. L., Britten G. L. (2021). Reconciling the size-dependence of marine particle sinking speed. Geophys. Res. Lett. 48, e2020GL091771. doi: 10.1029/2020GL091771
Carr S. A., Liu J., Tesoro A. G. (2016). Transport and fate of microplastic particles in wastewater treatment plants. Water Res. 91, 174–182. doi: 10.1016/j.watres.2016.01.002
Chen C.-S., Shiu R.-F., Hsieh Y.-Y., Xu C., Vazquez C. I., Cui Y., et al. (2021). Stickiness of extracellular polymeric substances on different surfaces via magnetic tweezers. Sci. Total Environ. 757, 143766. doi: 10.1016/j.scitotenv.2020.143766
Crowe C. T., Schwarzkopf J. D., Sommerfeld M., Tsuji Y. (2011). Multiphase flows with droplets and particles (Boca Raton: CRC Press). doi: 10.1201/b11103
da Costa J. P., Santos P. S. M., Duarte A. C., Rocha-Santos T. (2016). (Nano)plastics in the environment – sources, fates and effects. Sci. Total Environ. 566–567, 15–26. doi: 10.1016/j.scitotenv.2016.05.041
Derjaguin B., Landau L. (1993). Theory of the stability of strongly charged lyophobic sols and of the adhesion of strongly charged particles in solutions of electrolytes. Prog. Surf. Sci. 43, 30–59. doi: 10.1016/0079-6816(93)90013-L
Dissanayake A. L., Burd A. B., Daly K. L., Francis S., Passow U. (2018). Numerical modeling of the interactions of oil, marine snow, and riverine sediments in the ocean. J. Geophys. Res. Oceans 123, 5388–5405. doi: 10.1029/2018JC013790
Dizaji F. F., Marshall J. S., Grant J. R. (2019). Collision and breakup of fractal particle agglomerates in a shear flow. J. Fluid Mech. 862, 592–623. doi: 10.1017/jfm.2018.959
Elimelech M., Gregory J., Jia X., Williams R. A. (1995). Particle deposition & aggregation (Amsterdam: Elsevier). doi: 10.1016/B978-0-7506-7024-1.X5000-6
Fernando H. J. S. (1991). Turbulent mixing in stratified fluids. Annu. Rev. Fluid Mech. 23, 455–493. doi: 10.1146/annurev.fl.23.010191.002323
Franks P. J. S., Inman B. G., MacKinnon J. A., Alford M. H., Waterhouse A. F. (2022). Oceanic turbulence from a planktonic perspective. Limnol. Oceanogr. 67, 348–363. doi: 10.1002/lno.11996
Freitas R. A. (1999). Nanomedicine, volume I: basic capabilities (Georgetown, TX: Landes Bioscience).
George R., Flick R. E., Guza R. T. (1994). Observations of turbulence in the surf zone. J. Geophys. Res. 99, 801–810. doi: 10.1029/93JC02717
Gloag E. S., German G. K., Stoodley P., Wozniak D. (2018). Viscoelastic properties of pseudomonas aeruginosa variant biofilms. Sci. Rep. 8, 9691. doi: 10.1038/s41598-018-28009-5
Gregory J. (1981). Approximate expressions for retarded van der waals interaction. J. Colloid Interface Sci. 83, 138–145. doi: 10.1016/0021-9797(81)90018-7
Higashitani K., Iimura K., Sanda H. (2001). Simulation of deformation and breakup of large aggregates in flows of viscous fluids. Chem. Eng. Sci 56, 2927–2938. doi: 10.1016/S0009-2509(00)00477-2
Israelachvili J. N. (2011). Intermolecular and surface forces (Amsterdam: Elsevier). doi: 10.1016/C2011-0-05119-0
Israelachvili J. N., Tabor D. (1972). The measurement of van der Waals dispersion forces in the range 1.5 to 130 nm. Proc. R. Soc. London A. Math. Phys. Sci. 331, 19–38. doi: 10.1098/rspa.1972.0162
Jiang Q., Logan B. E. (1991). Fractal dimensions of aggregates determined from steady-state size distributions. Environ. Sci. Technol. 25, 2031–2038. doi: 10.1021/es00024a007
Johnson C. P., Li X., Logan B. E. (1996). Settling velocities of fractal aggregates. Environ. Sci. Technol. 30, 1911-1918. doi: 10.1021/es950604g
Kármán T. (1921). Über laminare und turbulente reibung. ZAMM J. Appl. Mathematics Mechanics / Z. für Angewandte Mathematik und Mechanik 1, 233–252. doi: 10.1002/zamm.19210010401
Kester D. R., Duedall I. W., Connros D. N., Pytkowicz R. M. (1967). Preparation of artificial seawater 1. Limnol. Oceanogr. 12, 176–179. doi: 10.4319/lo.1967.12.1.0176
Kranenburg C. (1994). The fractal structure of cohesive sediment aggregates. Estuar. Coast. Shelf Sci. 39, 451–460. doi: 10.1006/ecss.1994.1075
Lee K., Stoffyn-Egli P., Owens E. H. (2002). The OSSA II pipeline oil spill: natural mitigation of a riverine oil spill by oil–mineral aggregate formation. Spill Sci. Technol. Bull. 7, 149–154. doi: 10.1016/S1353-2561(02)00056-7
Li S., Marshall J. S., Liu G., Yao Q. (2011). Adhesive particulate flow: the discrete-element method and its application in energy and environmental engineering. Prog. Energy Combust Sci. 37, 633–668. doi: 10.1016/j.pecs.2011.02.001
Maerz J., Six K. D., Stemmler I., Ahmerkamp S., Ilyina T. (2020). Microstructure and composition of marine aggregates as co-determinants for vertical particulate organic carbon transfer in the global ocean. Biogeosciences 17, 1765–1803. doi: 10.5194/bg-17-1765-2020
Mari X., Passow U., Migon C., Burd A. B., Legendre L. (2017). Transparent exopolymer particles: effects on carbon cycling in the ocean. Prog. Oceanogr. 151, 13–37. doi: 10.1016/j.pocean.2016.11.002
Maxey M. R., Riley J. J. (1983). Equation of motion for a small rigid sphere in a nonuniform flow. Phys. Fluids 26, 883. doi: 10.1063/1.864230
Merkus H. G. (2009). Particle size measurements (Dordrecht: Springer Netherlands). doi: 10.1007/978-1-4020-9016-5
Parker D. S., Kaufman W. J., Jenkins D. (1972). Floc breakup in turbulent flocculation processes. ASCE J. Sanit. Eng. Div. 98, 79–99. doi: 10.1061/JSEDAI.0001389
Passow U. (2002). Transparent exopolymer particles (TEP) in aquatic environments. Prog. Oceanogr. 55, 287–333. doi: 10.1016/S0079-6611(02)00138-6
Passow U., Hetland R. (2016). What happened to all of the oil? Oceanography 29, 88–95. doi: 10.5670/oceanog.2016.73
Passow U., Ziervogel K. (2016). Marine snow sedimented oil released during the deepwater horizon spill. Oceanography 29, 118–125. doi: 10.5670/oceanog.2016.76
Prairie J. C., Ziervogel K., Camassa R., McLaughlin R. M., White B. L., Dewald C., et al. (2015). Delayed settling of marine snow: effects of density gradient and particle properties and implications for carbon cycling. Mar. Chem. 175, 28–38. doi: 10.1016/j.marchem.2015.04.006
Pramanik A. (2004). Ligand-receptor interactions in live cells by fluorescence correlation spectroscopy. Curr. Pharm. Biotechnol. 5, 205–212. doi: 10.2174/1389201043377002
Quigg A., Passow U., Chin W., Xu C., Doyle S., Bretherton L., et al. (2016). The role of microbial exopolymers in determining the fate of oil and chemical dispersants in the ocean. Limnol. Oceanogr. Lett. 1, 3–26. doi: 10.1002/lol2.10030
Raju N., Meiburg E. (1997). Dynamics of small, spherical particles in vortical and stagnation point flow fields. Phys. Fluids 9, 299–314. doi: 10.1063/1.869150
Rau M. J., Ackleson S. G., Smith G. B. (2018). Effects of turbulent aggregation on clay floc breakup and implications for the oceanic environment. PloS One 13, e0207809. doi: 10.1371/journal.pone.0207809
Saha D., Babler M. U., Holzner M., Soos M., Lüthi B., Liberzon A., et al. (2016). Breakup of finite-size colloidal aggregates in turbulent flow investigated by three-dimensional (3D) particle tracking velocimetry. Langmuir 32, 55–65. doi: 10.1021/acs.langmuir.5b03804
Saha D., Soos M., Lüthi B., Holzner M., Liberzon A., Babler M. U., et al. (2014). Experimental characterization of breakage rate of colloidal aggregates in axisymmetric extensional flow. Langmuir 30, 14385–14395. doi: 10.1021/la502686b
Santschi P. H., Xu C., Schwehr K. A., Lin P., Sun L., Chin W.-C., et al. (2020). Can the protein/carbohydrate (P/C) ratio of exopolymeric substances (EPS) be used as a proxy for their ‘stickiness’ and aggregation propensity? Mar. Chem. 218, 103734. doi: 10.1016/j.marchem.2019.103734
Shams M., Alam I., Chowdhury I. (2020). Aggregation and stability of nanoscale plastics in aquatic environment. Water Res. 171, 115401. doi: 10.1016/j.watres.2019.115401
Song Y., Rau M. J. (2020a). “Disruption behavior of aggregates in a Rotating/Oscillating cylindrical tank and implications for particle transport in the ocean,” in Proceedings of the ASME 2020 Fluids Engineering Division Summer Meetingcollocated with the ASME 2020 Heat Transfer Summer Conference and the ASME 2020 18th International Conference on Nanochannels, Microchannels, and Minichannels. Volume 2: Fluid Mechanics; Multiphase Flows. (American Society of Mechanical Engineers). doi: 10.1115/FEDSM2020-20237
Song Y., Rau M. J. (2020b). Viscous fluid flow inside an oscillating cylinder and its extension to stokes’ second problem. Phys. Fluids 32, 043601. doi: 10.1063/1.5144415
Song Y., Rau M. J. (2022). A novel method to study the fragmentation behavior of marine snow aggregates in controlled shear flow. Limnol. Oceanogr. Methods 20, 618–632. doi: 10.1002/lom3.10509
Sonntag R. C., Russel W. B. (1986). Structure and breakup of flocs subjected to fluid stresses. I. Shear experiments. J. Colloid Interface Sci. 113, 399–413. doi: 10.1016/0021-9797(86)90175-X
Tabor D., Winterton R. H. S. (1969). The direct measurement of normal and retarded van der Waals forces. Proc. R. Soc. London A. Math. Phys. Sci. 312, 435–450. doi: 10.1098/rspa.1969.0169
van der Lee W. T. B. (2000). Parameters affecting mud floc size on a seasonal time scale: the impact of a phytoplankton bloom in the Dollard estuary, the Netherlands. Proceedings in Marine Science 3, 403–421. doi: 10.1016/S1568-2692(00)80134-5
van Oss C. J. (2006). Interfacial forces in aqueous media (Boca Raton: CRC Press). doi: 10.1201/9781420015768
van Oss C. J. (2008). “The Extended DLVO Theory,” in, Interface Science and Technology, (Amsterdam: Elsevier). 31–48. doi: 10.1016/S1573-4285(08)00203-2
Verwey E. J., Overbeek J. T. H. G. (1948). Theory of the stability of lyophobic colloids (Amsterdam: Elsevier).
Wahab A., Mahiuddin S. (2001). Isentropic compressibility and viscosity of aqueous and methanolic calcium chloride solutions. J. Chem. Eng. Data 46, 1457–1463. doi: 10.1021/je010072l
Xu C., Zhang S., Chuang C., Miller E. J., Schwehr K. A., Santschi P. H. (2011). Chemical composition and relative hydrophobicity of microbial exopolymeric substances (EPS) isolated by anion exchange chromatography and their actinide-binding affinities. Mar. Chem. 126, 27–36. doi: 10.1016/j.marchem.2011.03.004
Yan J., Moreau A., Khodaparast S., Perazzo A., Feng J., Fei C., et al. (2019). Bacterial biofilm material properties enable removal and transfer by capillary peeling. Adv. Mater. 31, 1807586. doi: 10.1002/adma.201807586
Zaccone A., Soos M., Lattuada M., Wu H., Bäbler M. U., Morbidelli M. (2009). Breakup of dense colloidal aggregates under hydrodynamic stresses. Phys. Rev. E Stat. Nonlin. Soft Matter Phys. 79, 061401. doi: 10.1103/PhysRevE.79.061401
Keywords: marine snow, disaggregation, deformation, biological pump, biological bonding force, aggregation
Citation: Song Y, Burd AB and Rau MJ (2023) The deformation of marine snow enables its disaggregation in simulated oceanic shear. Front. Mar. Sci. 10:1224518. doi: 10.3389/fmars.2023.1224518
Received: 17 May 2023; Accepted: 29 June 2023;
Published: 20 July 2023.
Edited by:
Klaus Koren, Aarhus University, DenmarkCopyright © 2023 Song, Burd and Rau. This is an open-access article distributed under the terms of the Creative Commons Attribution License (CC BY). The use, distribution or reproduction in other forums is permitted, provided the original author(s) and the copyright owner(s) are credited and that the original publication in this journal is cited, in accordance with accepted academic practice. No use, distribution or reproduction is permitted which does not comply with these terms.
*Correspondence: Matthew J. Rau, bWF0dGhldy5yYXVAZ3d1LmVkdQ==