 Yosuke Ohno1
 Yu Umezawa1*
 Takeshi Okunishi2
 Ryuji Yukami3
 Yasuhiro Kamimura3
 Chikage Yoshimizu4
 Ichiro Tayasu4
- 1Department of Environmental Science on Biosphere, Tokyo University of Agriculture and Technology, Fuchu, Japan
- 2Fisheries Resources Institute, Japan Fisheries Research and Education Agency, Shiogama, Japan
- 3Fisheries Research Center, National Research Institute of Fisheries Science, Japan Fisheries Research and Education Agency, Yokohama, Japan
- 4Research Institute for Humanity and Nature, Kita-ku, Kyoto, Japan
Inter-annual variation in the feeding habits and food sources of Japanese sardine and mackerel at age-0 and age-1+ caught in the Kuroshio-Oyashio transition zone of the Western North Pacific were investigated based on analyses of bulk stable isotopes (δ13C, δ15N) and amino acid nitrogen isotopes (δ15NAA). Differences in δ13C and δ15N between Japanese sardine and mackerel were small for age-0, and inter-annual variation trends were similar, suggesting they depend on similar food sources in the same food web at this age. In contrast, inter-annual variation in δ13C and δ15N were significantly different between both species at age-1+, and both δ15N of phenylalanine (δ15NPhe: an indicator of nitrogen source) and trophic position estimated from δ15NAA (TPAA) were higher in mackerel, suggesting that the two species depend on distinct food webs as they age. Inter-annual variations in δ15NPhe were considered to have different causes for the two species; differences in food web structure due to the degree of southward intrusion of the Oyashio Current for Japanese sardine, compared to a shift in migration area and depth for mackerel. Furthermore, competition for food due to the recent increases in the population densities of both fishes appeared to be reflected in increased TPAA of mackerel. Although they are caught in the same region, the mechanism of variation in food sources differs because of differences in migration area, depth, and feeding habits. Differences in the feeding habits of Japanese sardine and mackerel may affect trophic status and spawning characteristics, potentially leading to different shifts in stock abundances.
1 Introduction
The western North Pacific is one of the largest fishing grounds in the world, with high productivity because of the mixing of the nutrient-rich cold Oyashio Current and warm Kuroshio Current (Longhurst, 2006; Yatsu, 2019; FAO, 2020). It is a major feeding ground for the important fishery resources such as Japanese sardine (Sardinops melanostictus) and mackerel (Chub mackerel: Scomber japonicus, Spotted mackerel: Scomber australasicus) (Yatsu et al., 2013). The spawning area of Japanese sardine and mackerel lies along the southern coast of the Japanese archipelago (Yatsu, 2019). Although the trophic level of mackerel is slightly higher than Japanese sardine based on the stomach contents analysis (i.e., copepods and diatoms for sardine, copepods, salps and anchovy for mackerel, Yatsu, 2019), both fishes are thought to migrate and grow in the same regions. Their abundance exhibits decadal-scale variability in response to climate change, known as “regime shifts” (Kawasaki, 1983; Mantua et al., 1997; Klyashtorin, 1998; Chavez et al., 2003). For juvenile Japanese sardine, the regime shift can be explained by increased survival rates of juvenile due to abundant plankton associated with higher nutrients supplied from bottom waters when the Aleutian Low develops in winter (Nishikawa and Yasuda, 2008). In the case of mackerel, it has also been suggested that a decrease in spawners due to large-scale fisheries also affects abundance fluctuations (Kawabata et al., 2012). However, the relationship between climate change and variability in abundance still needs to be clarified because both fish species, with similar spawning and feeding areas, show different fluctuations in abundance, and the survival mechanism of juveniles described above cannot fully explain the several-year scale abundance variability (Takasuka et al., 2007; Furuichi et al., 2022). Furthermore, recently the idea that the conditions of spawners (i.e., spawning experience, nutritional status, and experienced water temperature) have a significant effect on survival rates for the juveniles (i.e., maternal effect) has been proposed (Kurita, 2010; Yoneda et al., 2022). Since the nutritional status of fish depends on the amount of food resources, investigating the effects of changes in the marine environment (i.e., interaction between Oyashio and Kuroshio currents) and migration ecology on the feeding environment of adult Japanese sardine and mackerel is important for understanding the mechanisms behind the population dynamics of these fish species.
The cold Oyashio Current flows southward from the Kamchatka Peninsula along the Kuril Islands in subarctic region (Sakurai, 2007; Qiu, 2019) and its nutrient-rich water nourishes large diatoms (micro-autotrophs) and subsequently large zooplankton such as Neocalanus spp., which provides food resources for various marine organisms through the grazing food chain (Miyamoto et al., 2022). This area is an important feeding ground for sardine, mackerel, and squid in summer (Sakurai, 2007; Yatsu, 2019). On the other hand, the warm Kuroshio Current flows northward from the east of the Philippine Islands in subtropical region (Saito, 2019). Pico- to nano autotrophs, including nitrogen-fixing algae, are dominant due to low nutrient concentrations in the surface layer and are used by higher predators through various pathways, including the microbial food chain and the tunicate food chain (Kobari et al., 2019; Okazaki et al., 2019). Various fishes, such as chub mackerel and Japanese jack mackerel, use this current as a migration route and spawning ground (Sassa and Tsukamoto, 2010; Takahashi et al., 2019). These differences in nutrient dynamics and dominant organisms at lower trophic level in Oyashio and Kuroshio currents result in distinct differences in stable carbon and nitrogen isotopes values (δ13C and δ15N) for zooplankton and small fishes in each region (Ohshimo et al., 2019; Matsubayashi et al., 2020). In addition, water masses such as warm and cold anticyclonic eddies derived from the Kuroshio Extension and Oyashio form fronts between different water masses (Itoh and Yasuda, 2010) and produce dense schools of fish. Therefore, Japanese sardine and mackerel in the Kuroshio-Oyashio transition zone may be affected to different degrees by the dynamics of these cold and warm currents and show different inter-annual variations in their feeding habits.
δ13C and δ15N, mainly from whole tissue (bulk) samples of organisms, are widely used as a method to assess the diet of organisms (Sugisaki et al., 1991; Fry, 2006). Tissue δ13C is an indicator of the carbon source of a food web because of the small alteration in isotope value between prey and predator (DeNiro and Epstein, 1978; Rau et al., 1983). In contrast, tissue δ15N increases at a larger and more predictable rate, averaging around 3.4‰, compared to prey (DeNiro and Epstein, 1981; Minagawa and Wada, 1984; Post, 2002). This makes it suitable for estimating the trophic position (TP) of the organism based on the following equation, “TP = [(δ15Nconsumer − δ15Nproducer)/3.4] + 1”. Since δ13C and δ15N of phytoplankton are often characterized geographically by differences in biogeochemical processes such as nitrogen cycling and plankton productivity (Saino and Hattori, 1987; Minagawa et al., 2001; Houssard et al., 2017), these values in the muscle of pelagic fish have been successfully applied to trace migration routes and geographic distributions (Graham et al., 2010; Lorrain et al., 2015; Ohshimo et al., 2019). However, accurate estimation of TP by bulk isotope methods alone is difficult, because the δ15N of primary producers varies greatly in space and time depending on the nitrogen forms supplied to the base of the food web (ex., , N2 via nitrogen fixation) (Miyake and Wada, 1967) and the turnover time of phytoplankton is very short leading to large isotope variations (Yoshioka et al., 1994; Vander Zanden and Rasmussen, 2001; Jardine et al., 2006).
Recently, δ15N of amino acids (δ15NAA) has been used as a useful tool to estimate TP more accurately (McClelland and Montoya, 2002; Chikaraishi et al., 2009). This has the advantage over bulk isotopes in that the TP can be estimated solely on the basis of analyses of tissue amino acids (AAs) from the target organism by comparing “trophic AAs” (ex., Alanine, Glutamic acid), which exhibit high isotopic alteration between each trophic position, and “source AAs” (ex., Methionine. Phenylalanine), which exhibit low isotopic alteration through the food web (Popp et al., 2007; Houssard et al., 2017; Ishikawa et al., 2021). Furthermore, “source AAs” can be used as an indicator of the nitrogen source (e.g., δ15N in phytoplankton) at the base of the food web (Hannides et al., 2009; Matsubayashi et al., 2020). Therefore, combining δ15N of bulk and AAs is a useful method to elucidate the feeding and migratory ecology of marine organism (Hetherington et al., 2017; Xing et al., 2020; Kato et al., 2021).
In this study, we examined the differences in the food resources of Japanese sardine and mackerel species associated with growth stage and year and the factors that contribute to these differences, in the following procedure. First, inter-annual variation in the feeding habits of Japanese sardine and mackerel at age-0 and age-1+, which have the same spawning and migration area, was investigated based on bulk δ13C and δ15N analyses. Then, for fishes age-1+, δ15NAA was analyzed to reveal the causes of variation in bulk δ15N (i.e., variation in nitrogen source vs. predation on food at different trophic position). These analyses and observations indicated that the factors influencing the feeding habits of Japanese sardine and mackerel were changes in the contribution of the Kuroshio and Oyashio Currents to food resources in the transition zone and the recent increase in recruitment and abundance of plankton feeders such as Japanese sardine and mackerel.
2 Materials and methods
2.1 Sample collection
Japanese sardine and mackerel were collected in the western North Pacific using a trawl net in the surface layer (0 to 30 m) during Pacific sardine and mackerel stock assessment research from May to July of each year from 2013 to 2018 aboard the research vessels: R/T/V Hakuho-maru (Hokkaido Government Board of Education) and Soyo-maru (Japan Fisheries Research and Education Agency) (Figure 1 in the Supplementary Material, hereafter Supplementary Figure 1). Fishes were flash-frozen on board and brought back to the laboratory. In comparison between chub mackerel and spotted mackerel, there was a slight difference in δ15N only in age-1+ fish in some years (no significant difference in δ15N in age-0 fish, and in δ13C in both age-0 and age-1+ fishes, Table 1 in the Supplementary Material, hereafter Supplementary Table 1). However, the trends of annual variation in δ15N were consistent in this study (Supplementary Figure 2). Furthermore, there are no significant differences in stomach contents, swimming depth, and other parameters between both fish species, at least in the 2000s, when the biomass of mackerel was low (Nakatsuka et al., 2010). Therefore, we decided to discuss these two mackerel species together as mackerel in this study. The mean body length of Japanese sardine and mackerel for each age shows large inter-annual changes influenced mainly by recruitment (Watanabe and Yatsu, 2004). In this study, following Aizawa and Takiguchi (1999), the body length ranges of age-0 and age-1+ fish in each year were first roughly estimated by dividing the length of frequency distribution at 5 mm intervals into several normal distributions, representing the same age-group. The estimated ranges at each age were finalized based on the length-at-age for that year in the stock assessments by Japan Fisheries Agency and Japan Fisheries Research and Education Agency (Furuichi et al., 2022; Yukami et al., 2022) (Table 1). Although “age-1+” might include some age-0 and age-2 individuals, most of them were age-1, so they are referred to as age-1+ in the following. The body length distribution of age-1+ used in this study is shown in Supplementary Figure 3. The inter-annual variations in the mean body length for age-1+ fishes were more observed in mackerel than Japanese sardine. The median body length of age-0 and age-1+ Japanese sardine in each year between 2014 and 2017 ranged from 84 mm to 109 mm and from 159 mm to 184 mm, respectively, while from 130 mm to 167 mm and 217 mm to 286 mm for mackerel, respectively (Table 1).
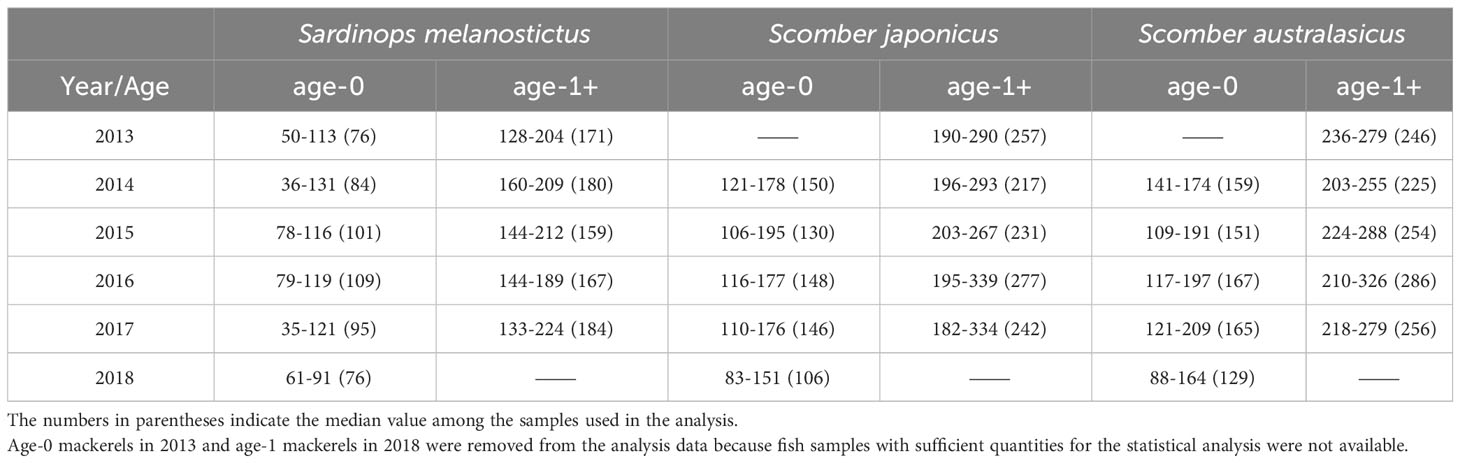
Table 1 Body length ranges of age-0 and age-1+ fish samples used in this study (mm).
2.2 Bulk stable isotope analysis
After the bones were carefully removed by hand, the dorsal muscle tissue from each fish sample was freeze-dried for 3 days and powdered with a pestle and mortar. For delipidification, about 100 mg of powdered sub-samples were transferred into the glass test tube with a 5 ml chloroform/methanol (2:1, v/v) and left 24 hours. After removing supernatant liquid by centrifugation and drying for 24 hours, 0.3-0.5 mg sub-samples were transferred to silver capsules (SÄNTIS Analytical). The sample was acidified for 1 hour with a drop of 1 N HCl to remove inorganic carbon (i.e., and CaCO3), which may be contaminated from the skin and stomach contents during the sample processes. The fish samples used in this study did not contain inorganic carbon (i.e., no visible bubbles), and as in previous reports (Bosley and Wainright, 1999; Jacob et al., 2005), there was no difference in δ13C and δ15N values of the test samples with or without acid use beyond the analytical precision. The samples in silver capsules stored in Teflon well-plates were placed on the hotplates (60°C, 4 h) to remove water and HCl. Bulk carbon and nitrogen stable isotope value (δ13C and δ15N: hereafter, unless otherwise noted, δ13C and δ15N denote bulk values) of fish samples were measured with an elemental analyzer and an isotope-ratio mass spectrometer (FLASH 2000-Conflo IV-Delta V Advantage; Thermo Fisher Scientific). The ratios of 13C:12C and 15N:14N were expressed relative to Vienna Pee-Dee Belemnite (VPDB) and atmospheric nitrogen, respectively, and were calculated as follows:
where R = 13C/12C or 15N/14N. L-alanine (δ13C = -19.6‰, δ15N = 8.7‰; Shoko Science) was measured every 5 samples as a calibration standard. Also, alanine (δ13C = -19.6‰, δ15N = 13.7‰: Shoko Science, Inc.) and glycine (δ13C = -32.3‰, δ15N = 1.12‰: Shoko Science, Inc.) with different isotopic ratios was measured several times to check the accuracy of the analysis. The instrumental precision was within 0.1‰ (standard deviation) for δ13C and δ15N.
2.3 δ15N of amino acids analysis
Analysis of nitrogen stable isotopes of amino acids (δ15NAA) was conducted on age-1+ fish to reveal the factors of variation in δ15N. Each year, 2 to 3 samples were analyzed for Japanese sardine (i.e., 12 samples in total) and 2 to 4 samples for mackerel (i.e., 15 samples in total) (see Supplementary Table 2). Among these samples, the samples with similar body lengths close to the mean value were selected for each year because differences in body length can cause differences in trophic position (TP). Although there were differences in the body length of the samples in different years, body length-size dependent changes in TP were not observed.
For δ15NAA analysis, powder samples of fishes (3~4 mg) were hydrolyzed in 12 N HCl at 112°C for 12~24 h. The hydrolysate was washed with n-hexane/dichloromethane (3:2, v/v) to remove hydrophobic constituents, such as lipids, and then dried under an N2 gas while adding 2-propanol as the solvent several times. After derivatization with thionyl chloride/2-propanol (1:4, v/v) at 112°C for 2 h and pivaloyl chloride/dichloromethane (1:4, v/v) at 112°C for 2 h, the Pv/iPr derivatives of amino acids were extracted with dichloromethane. Derivatization samples were stored under -30°C until measurement. The δ15NAA were measured using a gas chromatography/combustion/isotope ratio mass spectrometry system (GC/C/IRMS) consisting of an IRMS (Delta V advantage; Thermo Fisher Scientific) coupled to a GC (Trace GC Ultra; Thermo Fisher Scientific) via a modified GC-Isolink interface consisting of combustion and reduction furnaces. The programs on temperature, retention time, and carrier gas flow rate in each process followed the methods given in Ishikawa et al. (2014) (details are available in Supplementary Text 1). The CO2 generated in the combustion furnace was removed using a liquid N trap. Standard mixtures of eight AAs (alanine, glycine, leucine, norleucine, aspartic acid, methionine, glutamic acid, and phenylalanine) with known δ15N (range -25.9 to 45.6‰, Shoko Science, Inc.) was measured between every 2 to 3 samples to confirm the reproducibility of isotope value measurements. Standard deviations of the standards of glutamic acid and phenylalanine were better than 0.6 ‰ with a sample quantity of 60 ng N. TP of fishes based on the δ15N values of glutamic acid (δ15NGlu) and phenylalanine (δ15NPhe) in the targeted fish sample were calculated using the following equation following to Chikaraishi et al. (2009),
where 3.4 represents the mean difference between δ15NGlu and δ15NPhe in the primary producers (trophic level = 1.0), and 7.6 represents the mean difference of the trophic discrimination factors at each trophic level between glutamic acid and phenylalanine, respectively.
In addition, phenylalanine is one of the “source AAs” and has been used in several studies as an indicator of the nitrogen source at the base of the food web (Hannides et al., 2009; Matsubayashi et al., 2020). Here, δ15NPhe is taken to be an indicator of the inter-annual variation of nitrogen sources.
2.4 Statistical analysis
Since it is previously reported that the distribution of δ13C and δ15N in pelagic fishes having a wide migratory area vary according to their habitat (Miyachi et al., 2015; Ohshimo et al., 2019; Fuji et al., 2021), δ13C and δ15N in Japanese sardine and mackerel may potentially differ depending on the capture area. Therefore, considering the general migration route of these fish species, the fishes captured in the area bounded by N35-43°/E150-160° and N35-43°/E140-150° were analyzed for age-0 fishes and age-1+ fishes, respectively (Figure 1, age-0: n = 817, age-1+: n = 797). To examine the inter-annual variation of δ13C and δ15N, the following statistical analysis were performed. First, a Shapiro-Wilk test was performed to examine whether the δ13C and δ15N values for each year followed a normal distribution, and the Bartlett test was performed to check the equality of variances. In this study, there was no normality for any fishes or age (Shapiro-Wilk test, p<0.05). Therefore, the data was examined to determine whether δ13C and δ15N differed for each year by the Kruskal-Wallis test. If there were significant differences, multiple comparisons were performed by the Steel-Dwass test to determine which years had significant differences. In addition, t-tests were used to check for significant differences between Japanese sardine and mackerel in each analysis item (Supplementary Table 3). All statistical analysis was performed with R (version 4.2.0) at the significant level of α = 0.05 and visualized using ggplot2 in R (Wickham, 2016).
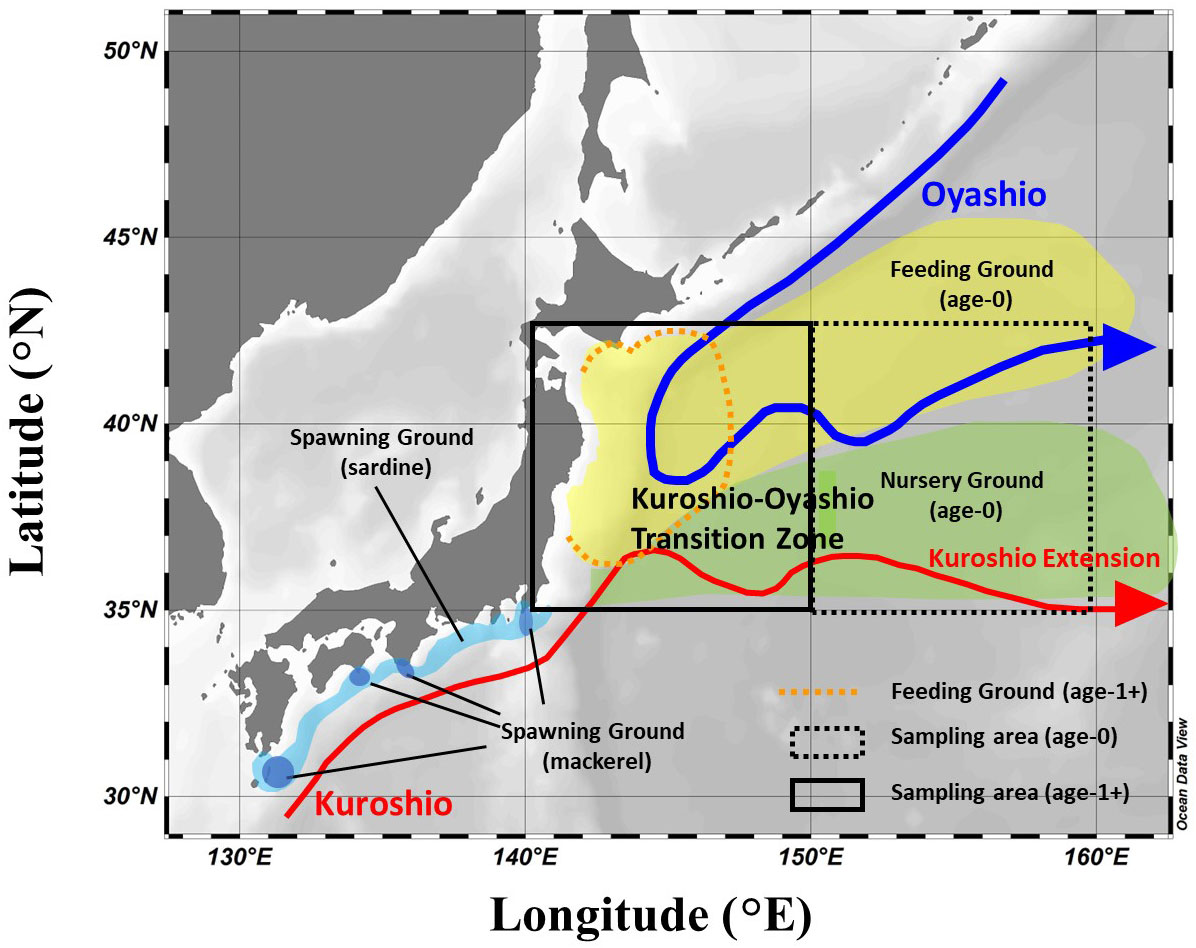
Figure 1 Schematic diagram of the ocean currents in the study area and the migration area along the life history of Japanese sardine and mackerel. The migration area of both fishes was referred to Furuichi et al. (2022) and Yukami et al. (2022). The squares indicate the main areas where fish samples were collected in this study.
2.5 The analyses of experienced temperature associated with fish migration
In the study area, the western North Pacific, both the cold Oyashio current and the warm Kuroshio current mix in the transitional zone and fluctuation in the strength of the two may cause changes in the feeding environment for fishes (Miyamoto et al., 2022), as noted in the Introduction section. The contribution of the currents (i.e., Oyashio vs. Kuroshio) to the water mass in the transitional zone can be estimated from water temperature as a proxy, so we hypothesized that analysis of the experienced water temperature for fish during the migration could explain the factors that cause fluctuations in fish isotope values. Therefore, FRA-ROMS reanalysis data, an ocean forecast system based on the Regional Ocean Modeling System (Kuroda et al., 2017), was used to examine inter-annual changes in mean water temperature from February to June prior to the collection of age-1+ fishes in each year from 2013 to 2017. Actual observed data, such as water temperature and salinity obtained from satellite and shipboard observations, are incorporated into FRA-ROMS for reanalysis. Thereby, FRA-ROMS could reproduce seasonal and interannual variations of mesoscale oceanic features over the Kuroshio-Oyashio region, such as the position of the Kuroshio path, variability of the Kuroshio Extension, and southward intrusions of the Oyashio (Kuroda et al., 2017). The stable isotope values of fish are the integral of the isotope values of the food during the period corresponding to the turnover time. The turnover time (3 months) was estimated for Japanese sardine and mackerel using the relationship equation between weight and isotopic half-life given in Vander Zanden et al. (2015) to set the period for the water temperature analysis. The area for analysis was set at N35-40° and E140-150°, the general migration area of age-1+ Japanese sardine and mackerel during February-June (Yatsu, 2019). The analysis was conducted at 3 water depths (i.e., 100 m, 50 m and 30 m). In the Kuroshio-Oyashio transition zone, the Oyashio is submerged under the Kuroshio (Itoh and Yasuda, 2010; Ishikawa et al., 2021), so the effect of the Oyashio is expected to be stronger at 100 m depth. Depths between 30 m and 50 m correspond to the representative migration depths of Japanese sardine and mackerel, respectively (Inagake and Hirano, 1983; Ozawa, 2010; Kamimura et al., 2021), indicating the suitable depths to check the effect of water temperature on these fish species. Surface sea temperature (SST) was not included in this analysis because it is strongly affected by solar radiation.
3 Results
3.1 Inter-annual variation in bulk δ13C and δ15N
In age-0 fish, the mean δ13C values for all samples of Japanese sardine and mackerel were -20.2 ± 1.0‰ and -20.1 ± 1.0‰, respectively, while δ15N values were 7.9 ± 1.6‰ and 7.8 ± 1.6‰, respectively, showing no differences between species (t-test, p=0.80, 0.44; Figures 2A, B; Supplementary Table 3). The annual mean δ13C value for Japanese sardine and mackerel ranged from -21.2‰ to -19.1‰ and -21.3‰ to -18.6‰, respectively, while the annual mean δ15N value ranged from 6.7‰ to 9.3‰ and 6.3‰ to 9.8‰, respectively (Table 2). Significant inter-annual variations in both δ13C and δ15N were observed for Japanese sardine and mackerel (Kruskal-Wallis test, p<0.05), with significant differences between years shown in Figure 2 (Steel-Dwass test, p<0.05). Comparing the mean values of Japanese sardine and mackerel by year, a significant difference was evident between Japanese sardine and mackerel for δ13C in 2014 (t-test, p<0.05, Supplementary Table 3), but the trend in inter-annual variation was consistent for both fishes (Figure 2A). Similarly, for δ15N, significant differences were found in most of year between Japanese sardine and mackerel (t-test, p<0.05, Supplementary Table 3), but the trend in inter-annual variation was consistent for both fishes, with a significant decrease in the value of both in 2017 (Figure 2B).
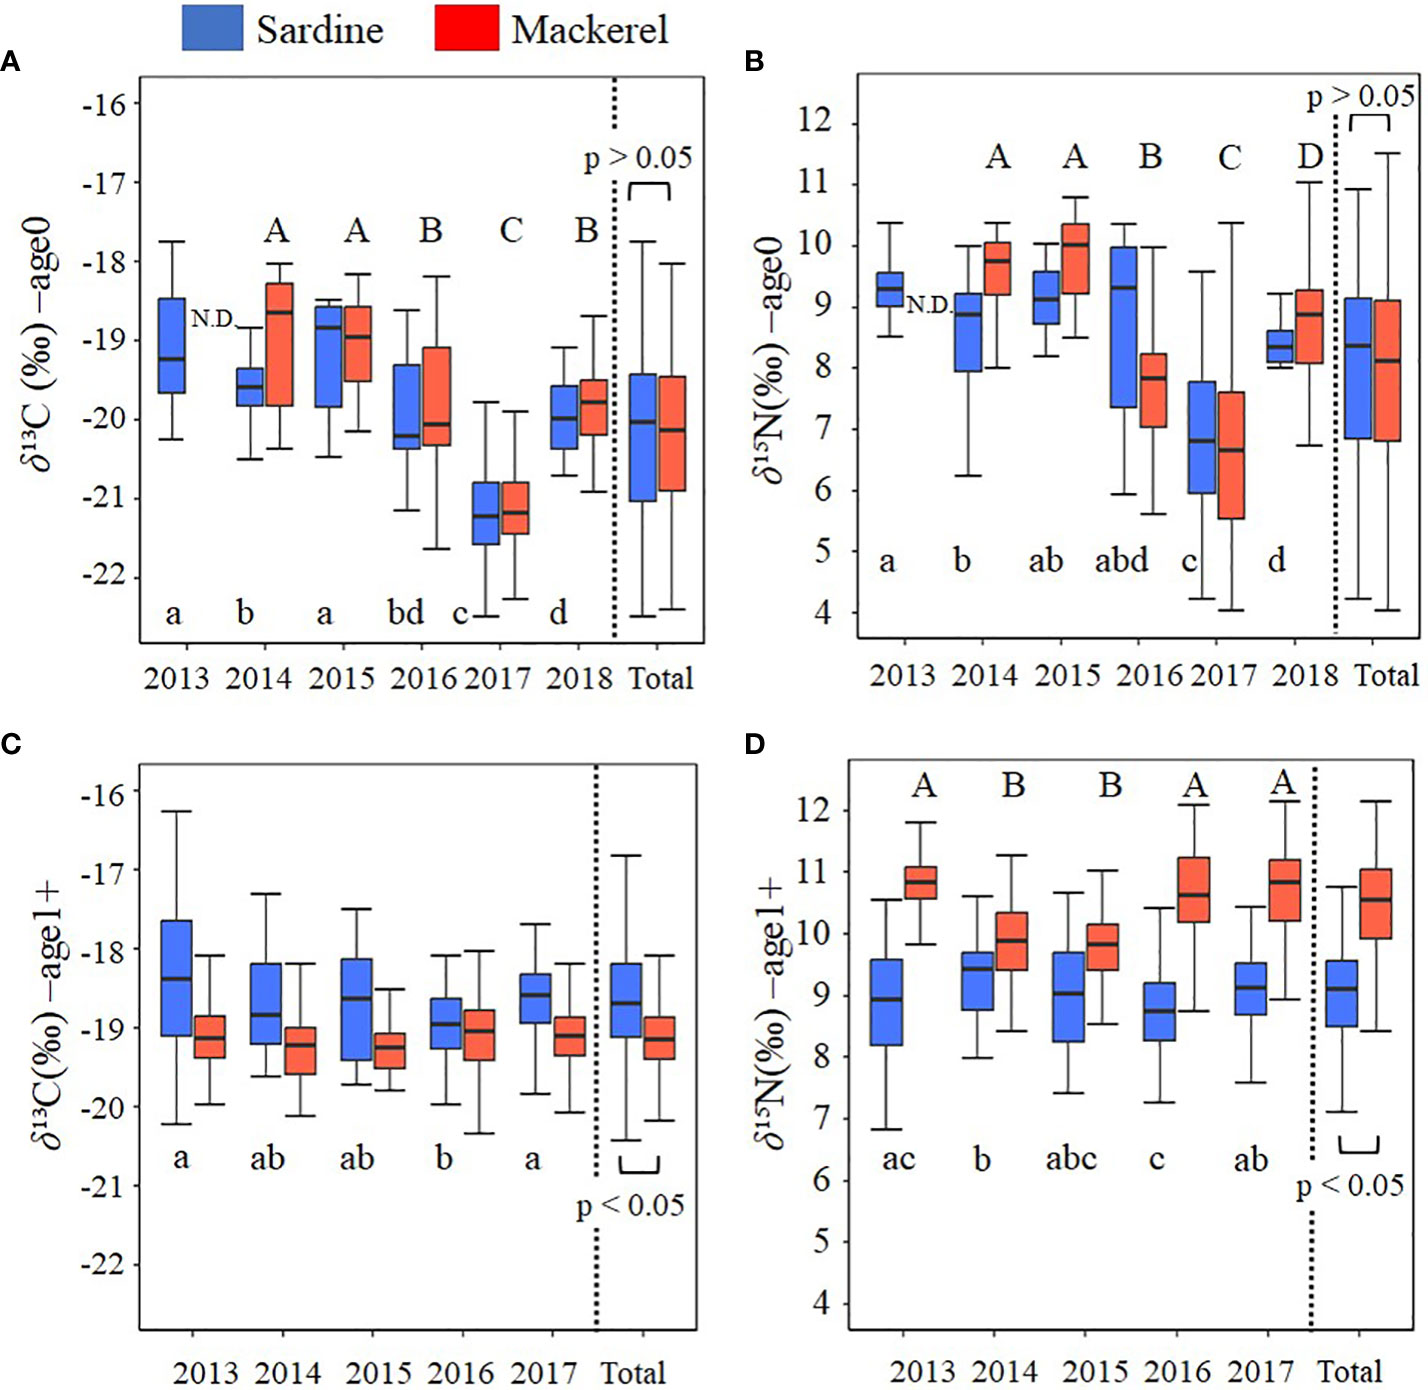
Figure 2 Inter-annual variation in (A) δ13C at age-0, (B) δ15N at age-0, (C) δ13C at age-1+, and (D) δ15N at age-1+ for Japanese sardine and mackerel. Boxplots show the median (middle line) and the interquartile range (box). The whiskers extend to the minimum and maximum observations. Different letters denote significant differences (p<0.05) among year (small letters: Japanese sardine, capital letters: mackerel). There was no significant difference in δ13C for mackerel. at age-1+. Total is the value calculated by combining all samples from all years. N.D. means no data.
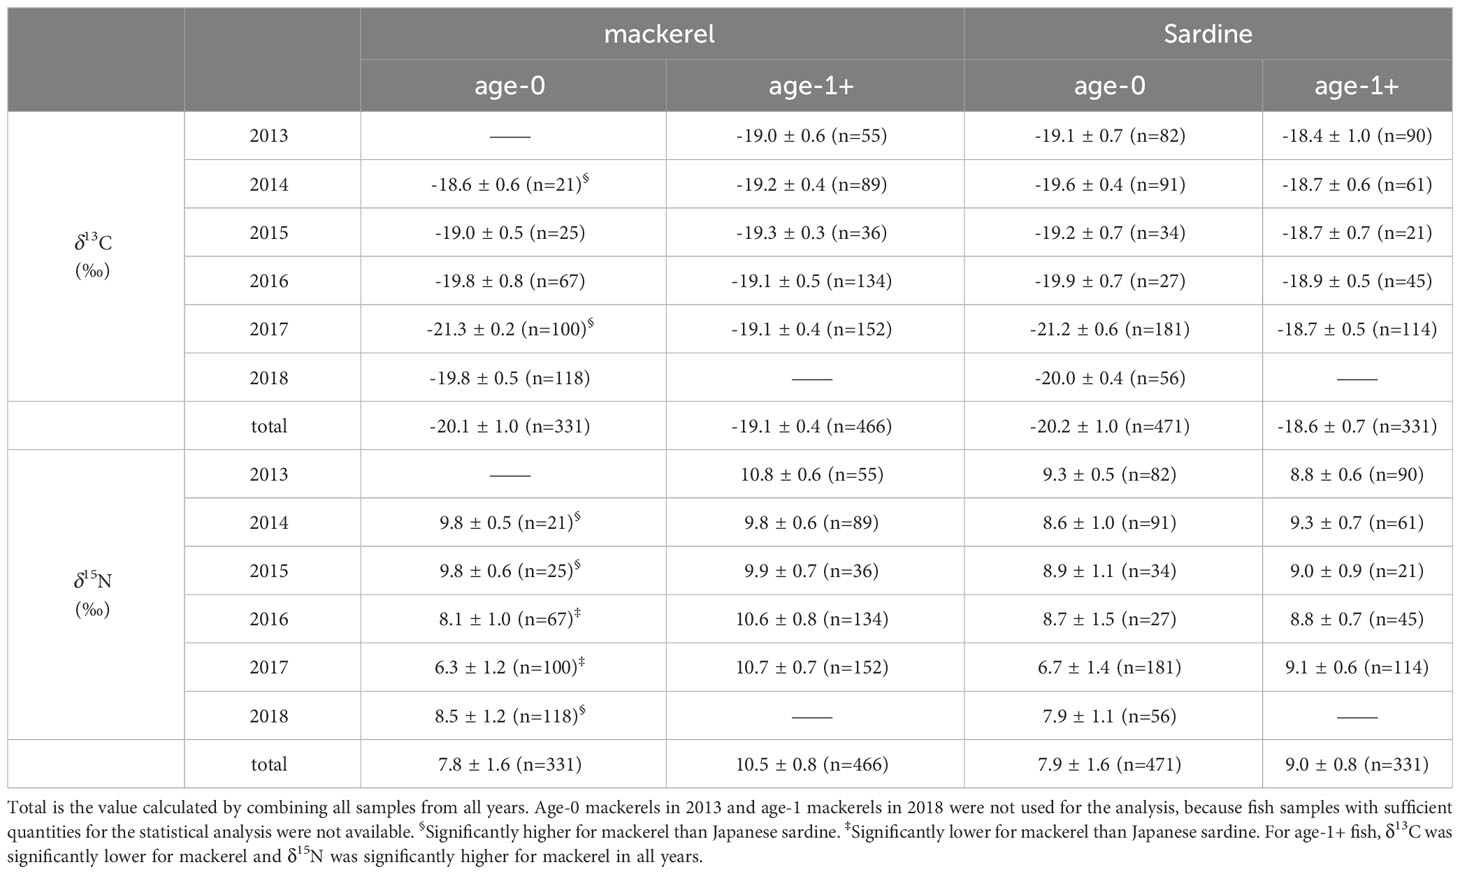
Table 2 Bulk δ13C and δ15N values for Japanese sardine and mackerel (mean ± SD).
In age-1+ fish, the mean δ13C values for all samples of Japanese sardine and mackerel were -18.6 ± 0.7‰ and -19.1± 0.4‰, respectively, and δ15N was 9.0 ± 0.8‰ and 10.5 ± 0.8‰, respectively (Table 2). A significant difference between species was confirmed (t-test, p<0.05; Figures 2C, D; Supplementary Table 3). The annual mean δ13C value for Japanese sardine and mackerel ranged from -18.9‰ to -18.4‰ and -19.3‰ to -19.0‰, respectively, and the annual mean δ15N value ranged from 8.8‰ to 9.3‰ and 9.8‰ to 10.8‰, respectively (Table 2). Significant inter-annual variation was observed, except for δ13C for mackerel (Figures 2C, D; Kruskal-Wallis test, p<0.05). Larger inter-annual variation in the δ15N was found for mackerel than Japanese sardine, with low δ15N in 2014 and 2015, and high δ15N in 2013, 2016, and 2017 (Steel-Dwass test, p<0.05). Comparing the mean values of Japanese sardine and mackerel by year, Japanese sardine had significantly higher δ13C and lower δ15N in all years (t-test, p<0.05; Figures 2C, D; Supplementary Table 3). As described above, at age-0, there was no significant difference in the mean δ13C and δ15N values of Japanese sardine and mackerel for the whole period of this study, and the trend of inter-annual variation was also consistent. In contrast at age-1+, the δ13C and δ15N values of these fish species were significantly different and the trend of inter-annual variation was inconsistent.
3.2 δ15N of amino acids (δ15NAA) variation for Japanese sardine and mackerel at age-1+
Analyses of δ15NAA were performed to examine the factors affecting inter-annual variation in bulk δ15N for age-1+. The δ15N of glutamic acid (δ15NGlu) was 18.0 ± 0.8‰ (16.6 to 19.1‰) and 21.6 ± 1.0‰ (20.2 to 23.7‰) in Japanese sardine and mackerel, respectively, and the δ15N of phenylalanine (δ15NPhe) were 1.8 ± 1.2‰ (-0.7 to 3.4‰) and 3.1 ± 0.8‰ (1.8 to 4.1‰), respectively (Figures 3A, B; Supplementary Tables 2, 4). The δ15NPhe, an indicator of nitrogen source, in mackerel showed higher values than Japanese sardine (t-test, p<0.05, Figure 3B), and trophic position estimated from δ15NGlu and δ15NPhe (TPAA) was 2.7 ± 0.1 (2.4 to 2.9) for Japanese sardine compared to 3.0 ± 0.1 (2.8 to 3.3) for mackerel (Supplementary Tables 2, 4). As with δ15NPhe, TPAA for mackerel was significantly higher than for Japanese sardine (t-test, p<0.05, Figure 3C), consistent with the results from bulk δ15N analysis (Figure 2D). Mean values of δ15NPhe for Japanese sardine were low in 2013 and high in 2015 and 2017 (Figure 3E; Supplementary Table 4). Correspondingly, TPAA was higher in 2013 and lower in 2015 and 2017 (Figure 3F; Supplementary Table 4). Therefore, a significant negative correlation was found between δ15NPhe and TPAA in Japanese sardine (R2 = 0.603, p< 0.05, Figure 4B). In addition, there was a positive correlation between bulk δ15N and δ15NPhe for Japanese sardine (R2 = 0.529, slope = 0.355, p< 0.05, Figure 4A). δ15NGlu in Japanese sardine did not exhibit any noticeable annual fluctuations. On the other hand, mean values of δ15NPhe for mackerel were higher in 2013, 2016 and 2017 (Figure 3E; Supplementary Table 4), which was consistent with years with higher bulk δ15N (Figure 2D). Therefore, a positive correlation was also observed between bulk δ15N and δ15NPhe for mackerel (R2 = 0.710, slope = 0.600, p< 0.05, Figure 4A). Although a slightly gradual increase in TPAA was observed from 2013 to 2017 for mackerel (Figure 3F), there was no evidence of the relationship between δ15NPhe and TPAA (Figure 4B) that was observed in Japanese sardine. δ15NGlu for mackerel showed a similar trend in inter-annual variation to δ15NPhe (Figures 3D, E).
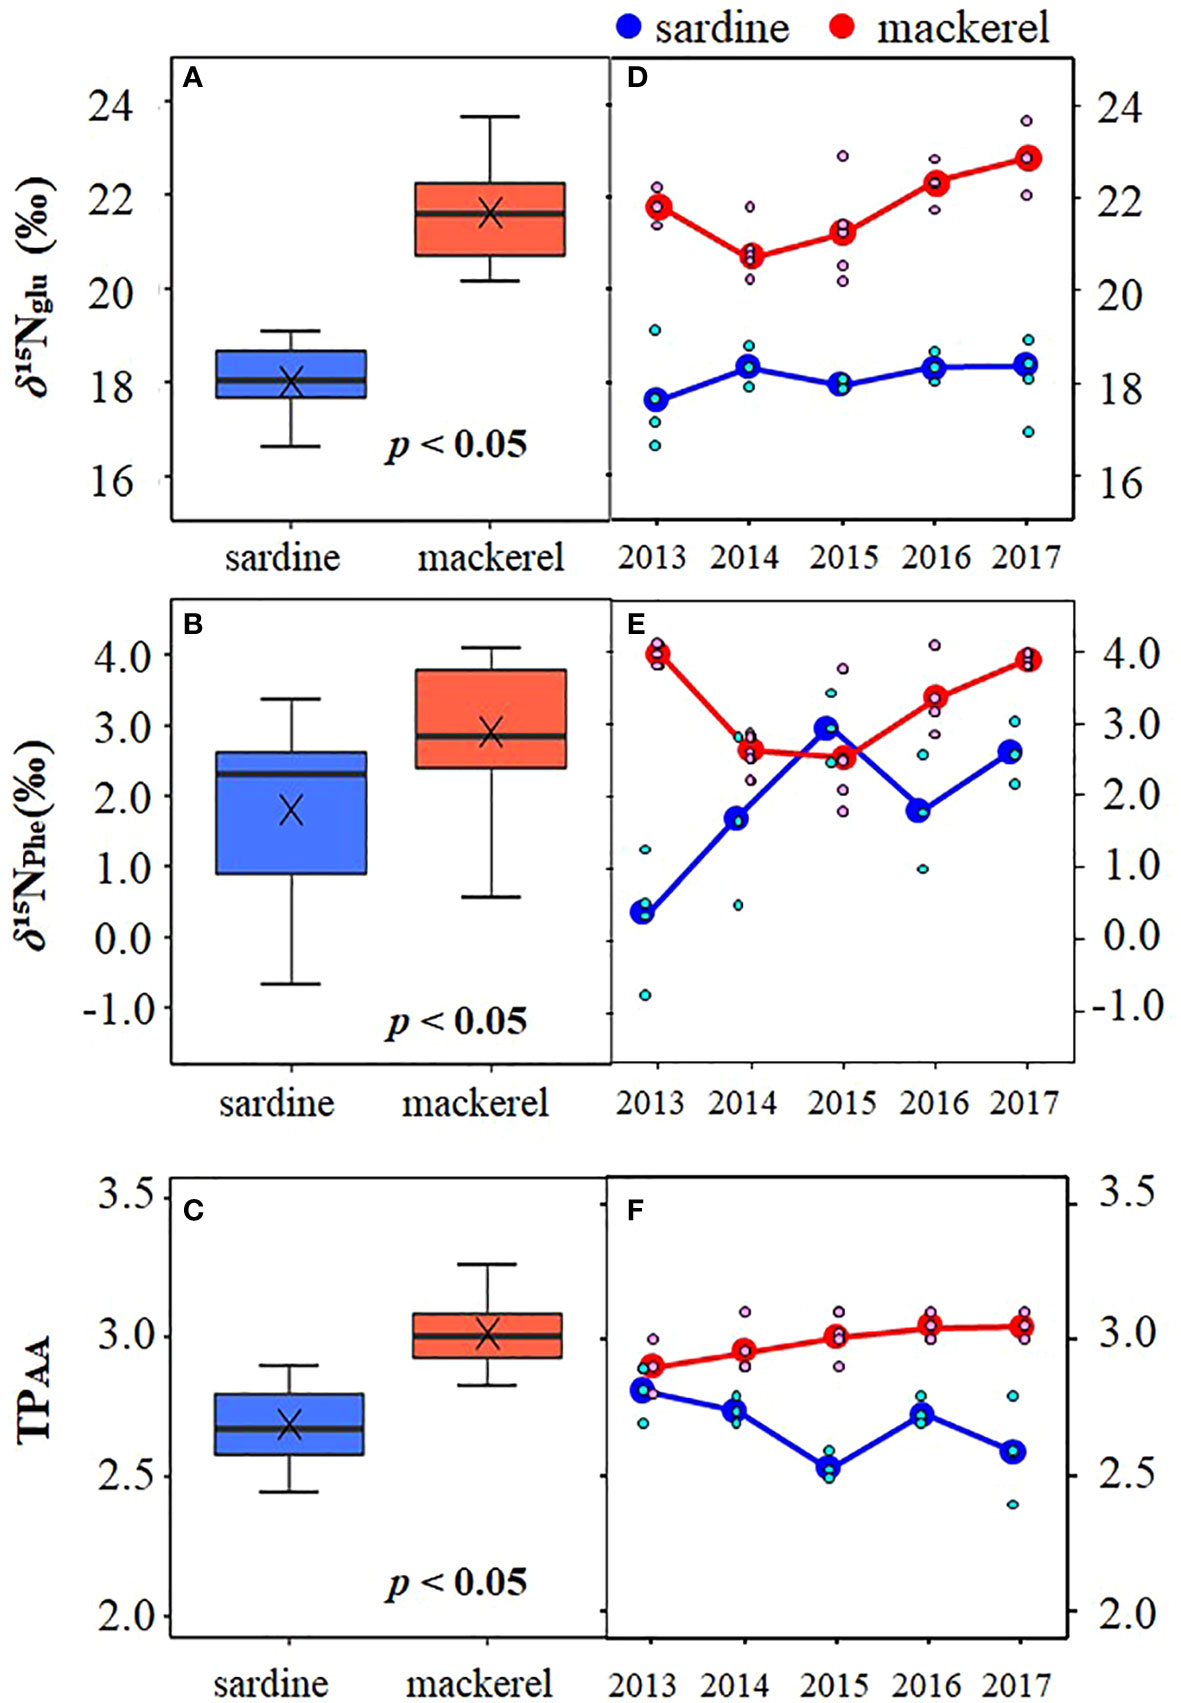
Figure 3 Comparison of (A) δ15NGlu, (B) δ15NPhe, and (C) TPAA among Japanese sardine and mackerel at age-1+, and inter-annual variation of mean of (D) δ15NGlu, (E) δ15NPhe, and (F) TPAA for these fishes. The symbol × in the panels (A–C) denotes mean value. The small symbols in the panels (D–F) indicate individual values.
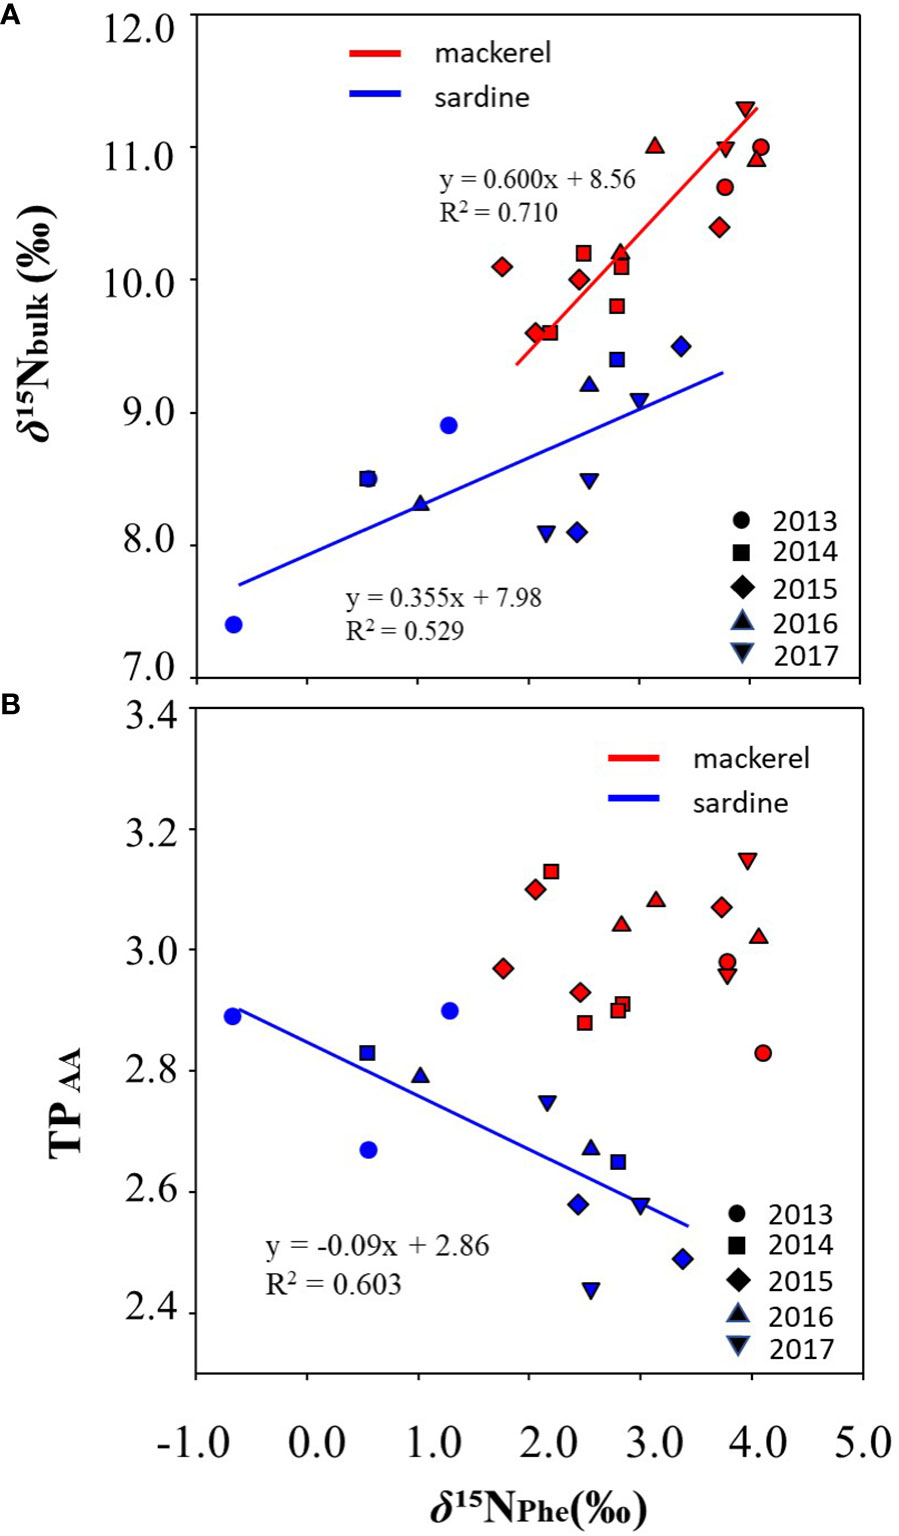
Figure 4 Correlations between (A) δ15Nbulk and δ15NPhe and (B) TPAA and δ15NPhe, for individual fish samples of Japanese sardine and mackerel at age-1+ for each year during the targeted period. The solid lines are the regression line. No correlation was found between TPAA and δ15NPhe in mackerel.
3.3 Annual variation of water temperature experienced by the fishes compared to δ15NPhe and TPAA in the fishes
Figure 5 shows the inter-annual variation of mean water temperature at N35-40°/E140-150° from February to June (Supplementary Table 5). The trend of inter-annual variation of water temperature at 100 m depth, which directly reflects the southward intrusion of the Oyashio Current into the study area, was also linked to those from 30 m to 50 m, which corresponds to the main migratory layer of Japanese sardine and mackerel. The water temperatures in 2015 and 2017 were lower than in other years (Figure 5). In order to investigate the effects of southward intrusion of the cold Oyashio at a depth of 100 m or deeper layer and the associated movement of the warm Kuroshio at the surface mixed layer on the feeding habits of both age-1+ fish species, the relationship between water temperature at 100m depth and δ15NPhe (reflecting δ15N of phytoplankton, the base of the food web) and TPAA of both fish species are plotted in Figures 6, 7, respectively. The mean water temperature at 100 m depth was negatively correlated with mean δ15NPhe for age-1+ Japanese sardine in each year (R2 = 0.866, Figure 6A), but not with mean δ15NPhe for age-1+ mackerel (Figure 6B). On the other hand, the mean water temperature at 100 m depth was positively and negatively correlated with TPAA for age-1+ Japanese anchovy (R2 = 0.888, Figure 7A) and age-1+ mackerel (R2 = 0.640, Figure 7B), respectively.
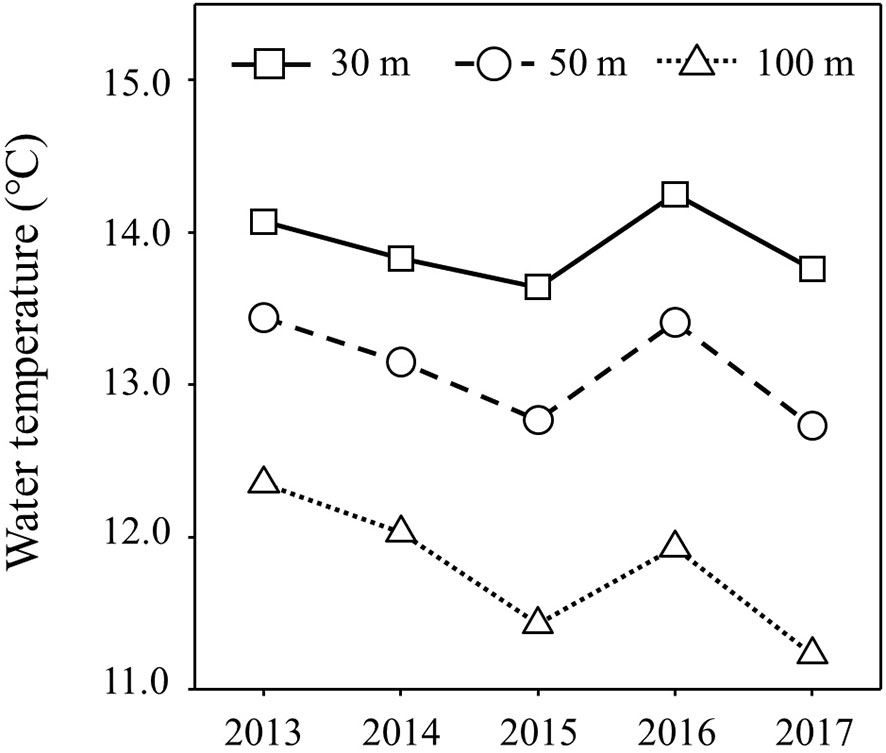
Figure 5 Inter-annual variation of water temperatures for each depth of 30 m, 50 m and 100 m at 35-40°N/140-150°E during February-June. Plots are the average of the mean values for each month during the targeted period.
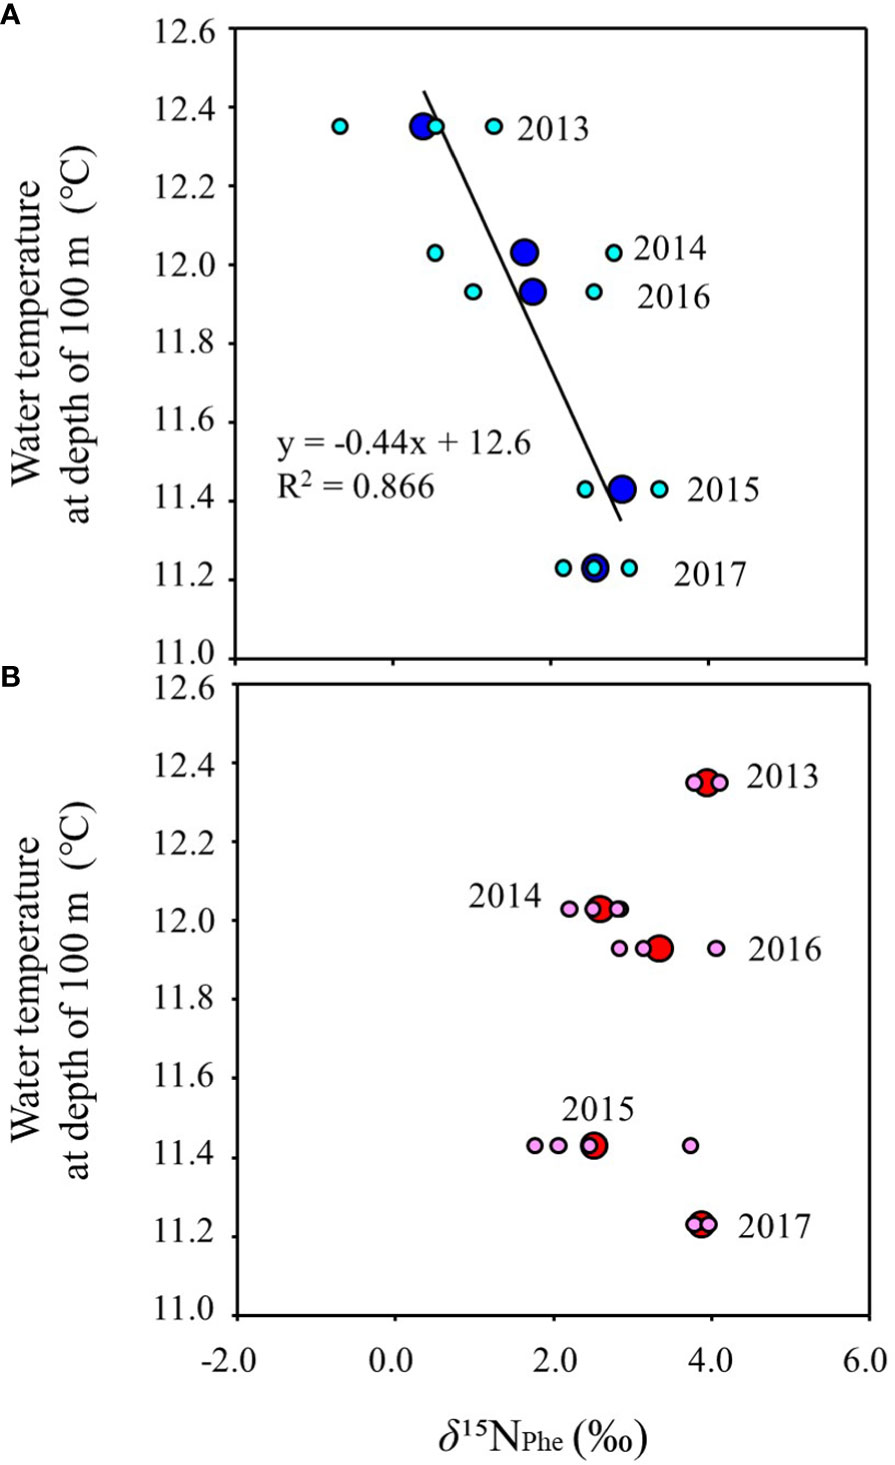
Figure 6 Relationships between the mean of δ15NPhe at age-1+ fishes and mean water temperature from February to June at a depth of 100 m in each year, for (A) Japanese sardine, and (B) mackerels. The large and small symbols indicate mean and individual values, respectively. The line in the figure is the regression line. The number in each plot indicates the year when the fish samples were collected (n=2 or 4 for each year).
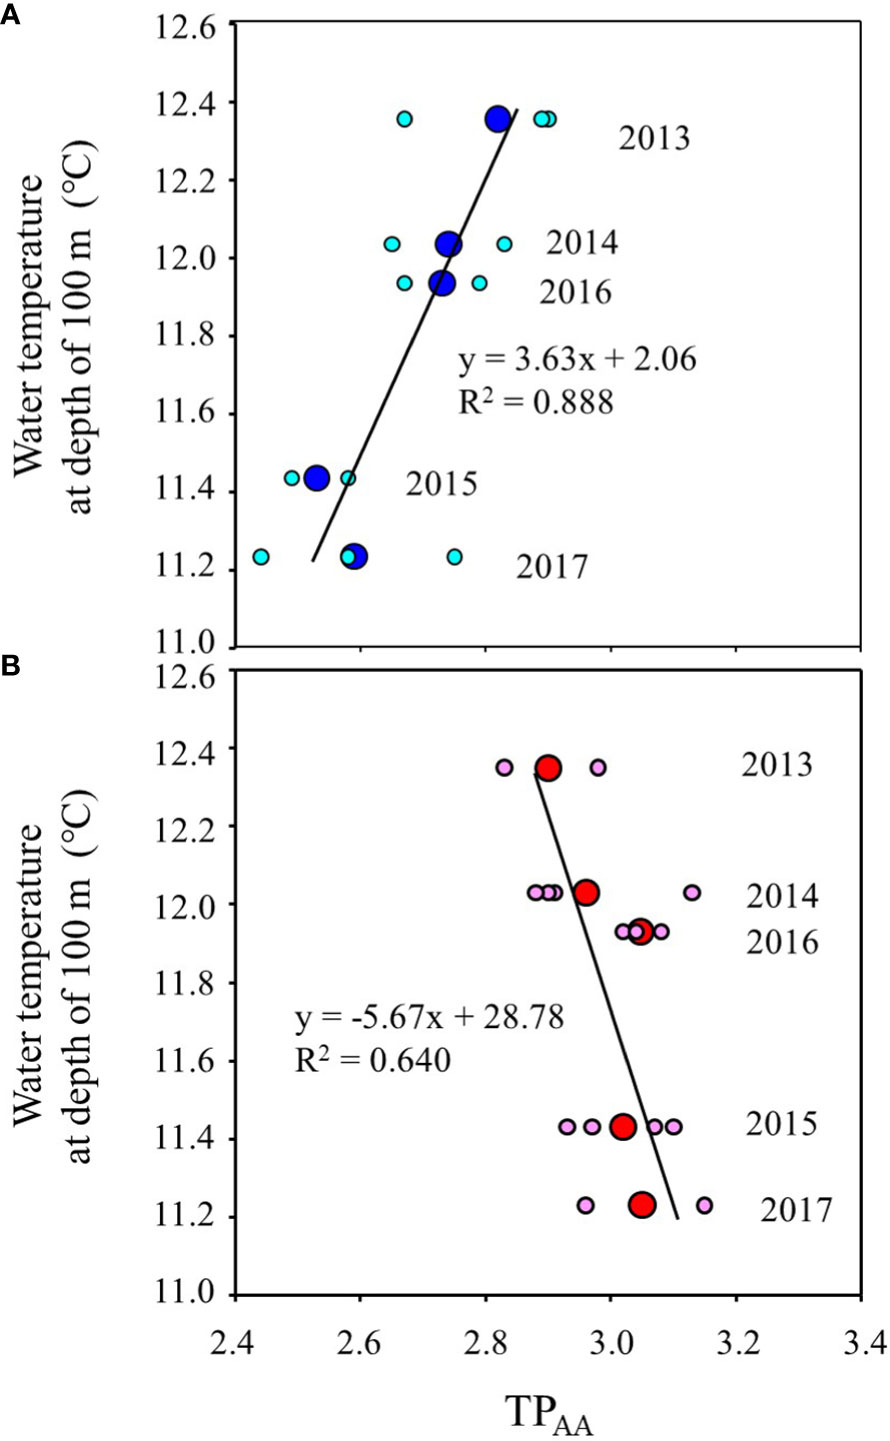
Figure 7 Relationships between the mean of TPAA at age-1+ fishes and mean water temperature from February to June at a depth of 100 m in each year, for (A) Japanese sardine and (B) mackerels. The large and small symbols indicate mean and individual values. The line in each panel is the regression line. The number in each plot indicates the year when the fish samples were collected (n=2 or 4 for each year).
4 Discussion
4.1 Differences in feeding habits of Japanese sardine and mackerel according to growth stage
Both Japanese sardine and mackerel spawn along the central and southern coast of the Japanese archipelago from winter to spring (Kanamori et al., 2019; Yatsu, 2019). The juveniles are transported eastward by the Kuroshio Current, then northward from around June, and migrate in almost the same area every year (Figure 1, Sakamoto et al., 2018; Yatsu, 2019). Here, slight differences in δ13C and δ15N were observed at age-0 between Japanese sardine and mackerel in each year, but no significant differences were observed in the mean values for entire period of the study (Figures 2A, B). Therefore, although the trophic position (TP) of the fishes’ diet may differ slightly, the finding is consistent with a previous study that suggested these species prey primarily on zooplankton (Yatsu, 2019). In addition, similar trends in inter-annual variation of δ13C and δ15N indicate that the two species may depend on the same food web. This is because even if δ15N values differ between fishes due to differences in TP, when the dependent food web is the same, the δ15N of the fishes shows the same inter-annual variation linked to the δ15N of the basal nitrogen source (Bode et al., 2007; Hannides et al., 2009). By contrast, significant differences in δ13C and δ15N emerged at age-1+ between Japanese sardine and mackerel. This was particularly evident in δ15N values, often indicative of trophic position, where mackerel consistently higher values compared to Japanese sardine (Figure 2D). Indeed, mackerel are known to feed on small fishes in addition to zooplankton as they grow (Yatsu, 2019). Furthermore, the inconsistent trend of inter-annual variation in δ15N between Japanese sardine and mackerel (Figure 2D) suggests that even in the same migration area, there may be differences in TP and/or the food web on which they depend.
In general, there are two possible reasons for variation in fish δ15N values: changes in (1) TP and/or (2) the nitrogen sources supporting the food web. However, it was challenging to identify the reasons for δ15N variation based only on bulk isotopes. So, δ15N of amino acids (δ15NAA) were measured to help clarify the reasons for variation in δ15N for Japanese sardine and mackerel, and to obtain detailed insights into their feeding habits and food webs. The mean TP based on δ15NAA (TPAA) of age-1+ was 3.0 (2.8 to 3.3) for mackerel and 2.7 (2.4 to 2.9) for Japanese sardine, with mackerel being significantly higher (Figure 3C). Therefore, part of the difference in δ15N between both fish species can be explained by TPAA (Supplementary Figure 4). This result for mackerel is consistent with the stomach content analysis, which has shown that zooplankton is the primary food resource (Yatsu, 2019). In contrast, for Japanese sardine, diatoms have frequently been found during stomach content analysis and are considered as a major food resource of the species (Kawasaki and Kumagai, 1984). However, δ15NAA analyses in this study suggest that zooplankton is more easily digested and contributes more to the diet of Japanese sardine than diatoms because TPAA (2.7 ± 0.1) was close to the typical value of the first level carnivores (i.e., 3.0, Chikaraishi et al., 2014). Also, mackerel had significantly higher δ15N of phenylalanine (δ15NPhe) than Japanese sardine (Figure 3B), which reflects the δ15N of nitrogen sources (e.g., primary producers), and the trends of inter-annual variation of δ15NPhe were different between Japanese sardine and mackerel (Figure 3E). Consequently, similarly to the results of the bulk method, δ15NAA analyses suggest that the food resources utilized by these fishes are different. It is assumed that differences in migration depth are related to changes in the food sources at age-1+. Generally, both Japanese sardine and mackerel at age-0 migrate shallower than 30 m, but as they grow, mackerel have been reported to migrate to depths of 50-80 m as a school of fish and up to 150 m as individuals in deeper water (Ozawa, 2010; Kamimura et al., 2021; Yasuda et al., 2023). In the Kuroshio-Oyashio transition zone, the Oyashio Current intrudes from a deeper layer below the Kuroshio Current (Itoh and Yasuda, 2010; Ishikawa et al., 2021), suggesting that mackerel are strongly influenced by the food supplied by the Oyashio Current. In fact, Matsubayashi et al. (2020) reported in their isoscape that the δ15N of zooplankton (i.e., 6.7 ± 2.1‰ on average) found in the northern region of the Kuroshio-Oyashio transition zone, which is influenced by the Oyashio Current, was greater than that of zooplankton (i.e., 4.6 ± 2.2‰ on average) in the southern region of the zone. Furthermore, Miyamoto et al. (2022) reported that larger sized subarctic copepods (e.g., Neocalanus spp. And Eucalanus bungii) appear more frequently in the Kuroshio-Oyashio transition zone with southward intrusion of the Oyashio Current. In this way, the difference in food source associated with the migration depth may cause different inter-annual variations of δ13C and δ15N for Japanese sardine and mackerel at age-1+. In the following, the factors leading to variation in δ15N in Japanese sardine and mackerel, respectively, are discussed in turn based on the results of δ15NAA.
4.2 δ15N and TPAA variation of Japanese sardine at age-1+
There was a positive correlation between bulk δ15N and δ15NPhe for Japanese sardine (Figure 4A). δ15NPhe is an indicator of the nitrogen source (e.g., δ15N of phytoplankton) due to limited isotopic alterations between trophic positions (Hannides et al., 2009; Matsubayashi et al., 2020). Therefore, one of the reasons contributing to the variability of δ15N in Japanese sardine (Figure 3E) may be the influence of differences in the δ15N of phytoplankton, which is the basis of the food web. δ15N of phytoplankton is known to fluctuate significantly with changes in nutrient supplies, and there are two possible mechanisms for lowering δ15N values. First, in nutrient (nitrate)-rich waters, δ15N of phytoplankton is decreased because of the substantial fractionation associated with nitrate utilization by phytoplankton (Yoshikawa et al., 2005; Yoshikawa et al., 2018). Second, in oligotrophic waters, δ15N is decreased because of the increased contribution of N2 fixation as a nitrogen source. Atmospheric N2 by definition has a δ15N of 0 ‰, which is lower than nitrate, so N2-fixing algae have lower δ15N than phytoplankton that use nitrate as a nitrogen source (Minagawa and Wada, 1984; Horii et al., 2018).
In the Oyashio-Kuroshio transition zone, the Oyashio Current, with low temperature and abundant nutrients, extends southward at depth deeper than 100 m with seasonal and inter-annual variations, potentially supplying nutrients from the bottom to the surface where nutrients are depleted in spring and summer (Komatsu and Hiroe, 2019; Nishikawa et al., 2020). A negative correlation was observed between the mean temperature at 100 m depth and δ15NPhe of Japanese sardine (i.e., δ15N of phytoplankton, the base of the food web) in each year (Figure 6A). Therefore, lower δ15N of phytoplankton during the year with relatively high-water temperature suggests that the degree of the southward flow of the Oyashio Current and associated variation of warm Kuroshio water contribution could be related to the variation in δ15N of Japanese sardine. Thus, of the two mechanisms described above, the dominant N2-fixing algae with low δ15N in the transition zone (Shiozaki et al., 2015) during relatively oligotrophic and high temperatures surface water masses due to the increased contribution of the Kuroshio Current could cause low δ15N in the Japanese sardine from year to year.
In addition, a significant negative correlation was found between δ15NPhe and TPAA in Japanese sardine (Figure 4B), indicating that the species of phytoplankton at the base of the food web may be related to TPAA for Japanese sardine. In oligotrophic regions, smaller phytoplankton tend to dominate, and food chain lengths are longer (Kobari et al., 2019). In fact, nanoplankton such as haptophytes are dominant in the Kuroshio Current (Endo and Suzuki, 2019; Kobari et al., 2019), and the energy of pico- and nanoplankton is transferred to fish through several sizes of tiny zooplankton (Hunt et al., 2015; Okazaki et al., 2019). Therefore, feeding in the warmer and relatively oligotrophic Kuroshio surface waters are expected to result in longer food chain length and higher TPAA for Japanese sardine. In fact, the positive correlation between water temperature and TPAA of Japanese sardine in each year during the observation period may support this idea (Figure 7A). Thus, in the transition zone, the variation in the contribution of N2-fixing algae and the change in the food web structure, depending on the degree of southward flow of the Oyashio Current (and associated change in the contribution of Kuroshio Current), are suggested to have a significant effect on the feeding characteristics and δ15N of Japanese sardine. This can be because filter-feeding adult Japanese sardines have lower food selectivity (Nakai, 1962), and isotopic ratios of the fishes are likely to closely reflect changes in plankton species associated with changes in water masses.
4.3 δ15N and TPAA variation of mackerel at age-1+
Predation on prey from different TPs within the same ecosystem is one of the main factors causing variation in the δ15N of organisms (Lindsay et al., 1998; MacKenzie et al., 2012). In the case of mackerel, which can prey on food across different TPs, the change in TP is often considered the main reason for δ15N variation. However, no significant positive correlation was found between δ15N and TPAA in mackerel (Supplementary Figure 4), suggesting that there must be another factor explaining the variation in δ15N for mackerel.
Like Japanese sardine, a positive correlation was observed between bulk δ15N and δ15NPhe for mackerel (Figure 4A). Hannides et al. (2009) also showed a positive correlation between δ15N and δ15NPhe for marine organisms in the subtropical North Pacific, similar to the results of this study: the difference in δ15N between yellowfin tuna (Thunnus albacares) individuals was explained by the difference in δ15NPhe, not TPAA, although they utilize diet across different TPs as do mackerel species. This indicated that the variations of bulk δ15N in the mackerel reflected variations in δ15N in primary producers at the origin of the food web, rather than foraging the prey at different trophic levels. On the other hand, no correlation was found between δ15NPhe and TPAA or δ15NPhe and water temperature in mackerel (Figures 4B, 6B), whereas negative correlations were found between these parameters in Japanese sardine (Figures 4B, 6A). Unlike Japanese sardine, which is a filter-feeder (Nakai, 1962; Checkley et al., 2017), mackerel is a predatory feeder (Nakatsuka et al., 2010; Robert et al., 2017) that is highly selective in their prey. Mackerel can consume a variety of trophic levels of food that may be less directly affected by water mass shifts than phytoplankton. Therefore, the effect of water mass shifts might not be easily reflected in the isotope value of mackerel. The body lengths of mackerel are larger than Japanese sardines and should have a longer turnover time (i.e., the time it takes for the isotopic components of the body to be replaced by the most recently consumed food) than Japanese sardines. This fact may be the other potential reason why the variation of δ15NPhe in response to annual changes in water temperature was different from that of Japanese sardines. In addition, the next paragraphs will discuss the possibility that the depths and areas where mackerel species temporarily migrate may be different from those of Japanese sardine, leading to different variation in the δ15NPhe of the two fish species.
The inter-annual variation of bulk δ15N and δ15NPhe of age-1+ mackerel (Figures 2D, 3E) showed a similar trend to the mean body length for each year in the samples used in this study (Supplementary Figure 3B). That is, in years when mean body length was smaller (larger), the values of δ15N and δ15NPhe seemed to be lower (higher). In a cluster analysis of the same samples used in this study, Nakamura (2022) showed that the cluster with large body length and good nutritional status was distributed at a relatively high latitude in the Kuroshio-Oyashio transition zone. The proportion of the mackerel categorized in this cluster was higher in 2013 and 2016 when the mackerels had relatively larger body lengths and higher δ15Nphe values than in other years (Nakamura, 2022). Since the δ15N of zooplankton is higher in the northern region of the transition zone, where the influence of the Oyashio is stronger (see section 4.1, Matsubayashi et al., 2020), the relative northward migration of the individuals to higher latitudes during the growing period may have contributed to the increase in δ15N (Figure 8). Alternatively, mackerel may feed on prey resources derived from the Oyashio water mass by migrating deeper than Japanese sardine at the same latitude, since mackerel are known to occasionally migrate to depths of 100-150 m, which matches the intrusion depth of the Oyashio Current (Ozawa, 2010; Kamimura et al., 2021; Yasuda et al., 2023). The relatively high TPAA of mackerel in this study in years when fishes experienced low water temperatures probably due to the Oyashio intrusion (Figure 7B) is consistent with a previous report that the TP of zooplankton is higher in the Oyashio region, where large zooplankton such as Neocalanus spp. are abundant, than in the transition zone (Ishikawa et al., 2023). Furthermore, the significantly lower bulk δ13C values in age-1+ mackerel compared to Japanese sardine (Figure 2C) are consistent with the fact that mackerel is partially dependent on the food web of the Oyashio system, because δ13C values of particulate organic matter (POM) and fishes in the cold Oyashio region are significantly lower compared with warm Kuroshio region (Ohshimo et al., 2019; Sakamoto et al., 2023). Although detailed data on migration history is not available for the samples in this study, the results indicate that changes in migration area or depth with growth may lead to inter-annual changes in food resources.
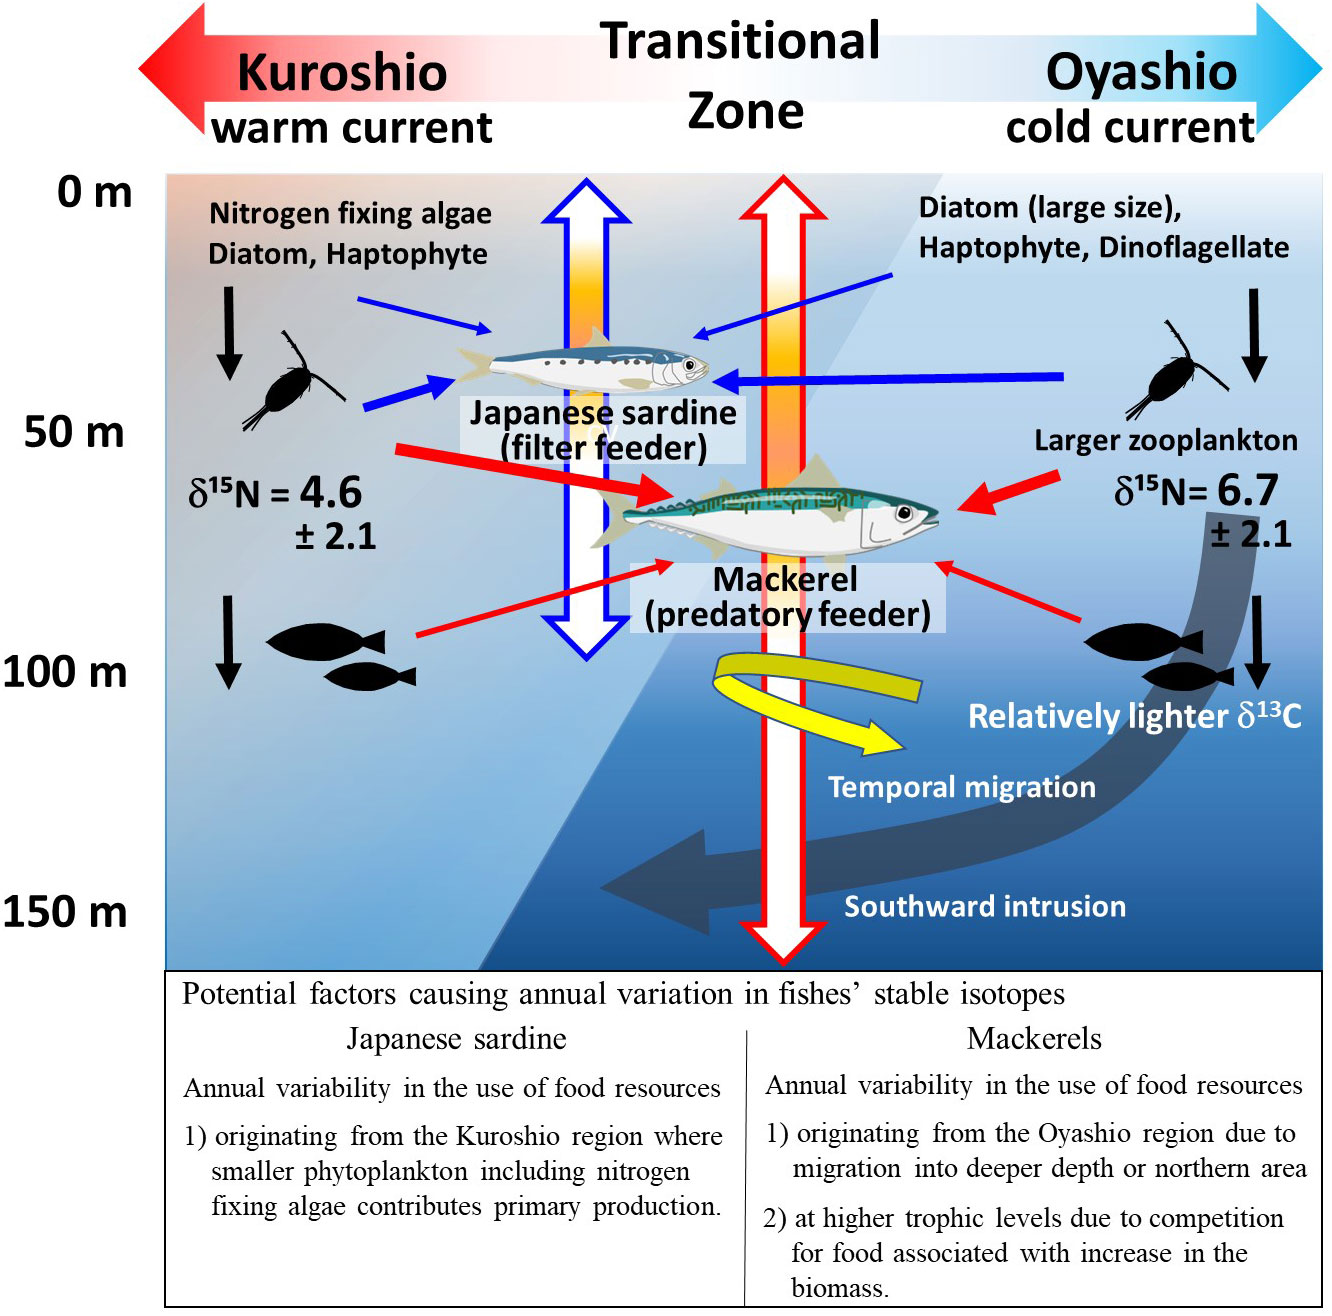
Figure 8 Schematic diagram showing factors causing interannual variation in stable isotope ratios of Japanese sardines and mackerels. The blue and red arrows indicate the vertical migrating depths and predatory paths of Japanese sardine and mackerels, respectively. The colored portions of the vertical arrows indicate the depth of the center of the fish school (see discussion). Representative δ15N values (mean ± S.D.) of zooplankton for the northern and southern parts of the Kuroshio-Oyashio Transitional Zone are those of the zooplankton in specific areas (i.e., 39-45°N, 143-155°E for the northern area: n=52, 35-38°N, 143-165°E for the southern area: n=9) reported in Supplementary Table 1 of Matsubayashi et al. (2020). The δ15N of zooplankton species that are not representative of each region but commonly occur in both areas are as follows: 8.3 ± 2.2 (n=6) & 5.4 ± 1.9 (n=4) for Paracalanus parvus, and 6.5 ± 1.1 (n=6) & 4.2 ± 1.2 (n=3) for Oncaea venusta, in northern and southern areas, respectively.
The mean TPAA of mackerel slightly increased from 2013 to 2017 (Figure 3F), independent of δ15NPhe variations (Figure 4B), while inter-annual variation in TPAA of Japanese sardine was linked to δ15NPhe and surface water temperature variations (Figures 4B, 6A). One factor in the annual increase in TPAA may be the competition for food due to increased abundances of zooplankton feeders. Chub mackerel had an outstandingly high recruitment in 2013, and biomass continued to increase from 2012 (1.67 million tons) to 2018 (5.67 million tons) (Yukami et al., 2022). In addition, the biomass of Japanese sardine, which are competitors for the zooplankton feeder (Kishida and Matsuda, 1993; Yatsu et al., 2005), also increased significantly in recent years, rising from 0.51 million tons in 2012 to 2.86 million tons in 2018 (Furuichi et al., 2022). This increase has resulted in food competition among mackerel populations (Kamimura et al., 2021). Therefore, the increase in the TPAA of mackerel from 2013 to 2017 could be attributed to the relatively increased contribution of higher trophic position prey as a result of food competition due to increased population densities. As shown above, the variation in bulk δ15N for mackerel was inferred to be caused by changes in δ15NPhe associated with changes in migration area and depth as individuals grow, and in some cases by an increase in TPAA due to increased population densities.
5 Conclusion
In this study, the feeding habits of Japanese sardine and mackerel, which have the same spawning and migration area, and the factors contributing to inter-annual variations were investigated based on the analyses of bulk stable isotopes (δ13C and δ15N), amino acid nitrogen isotopes (δ15NGlu, δ15NPhe, TPAA), and mean water temperature (MWT) in the migration area. These fish species showed apparent differences in TPAA and annual variation of stable isotopes at the age-1+ stage, indicating that they utilize different prey items partly supplied through different food webs, while they seemed to feed on a common plankton resource in the same food web at the age-0 stage. This suggests that the food source changed as a result of differences in feeding habits and migration depth with growth (Figure 8). For Japanese sardine at age-1+, negative correlations of δ15NPhe with TPAA and MWT supported the idea that inter-annual variations in δ15N and TPAA were determined by the relative influence of warm water masses where small-size plankton including N2-fixing algae dominate and food chain length is longer. In contrast, for mackerel at age-1+, there were no correlations of δ15NPhe with TPAA and MWT, respectively, and relatively lower bulk δ13C values than Japanese sardine and higher TP in the year when the lower water temperature was observed. These characteristics and an increase in δ15N for mackerel seemed to be affected by some individuals that were highly dependent on the food web of the Oyashio water mass as a result of them migrating to relatively high latitudes or deeper areas in the transition zone compared to Japanese sardine. In addition, competition for food due to the recent increases in the population density of both fish species seemed to be reflected in the δ15N of mackerel. Therefore, it is quite possible that differences in the factors causing fluctuations in food resources, which are reflected in δ13C and δ15N variations, could alter the nutritional status of parent fish from year to year. Japanese sardine and mackerel show different recruitment in a single year, as well as decadal-scale variability, and understanding the mechanisms for these fluctuations on abundance is a significant issue that could not be fully explained in this study. However, since it has been reported that the nutritional status of parent fish is related to fluctuations in abundance, more detailed information on feeding habits, nutritional status, and spawning will contribute to better elucidation of the mechanisms of abundance variability. Furthermore, the findings on the factors affecting the variation of isotope values for Japanese sardine and mackerel will greatly contribute to future interpretations of spatio-temporal variations in tissue isotopes for pelagic fishes.
Data availability statement
The raw data supporting the conclusions of this article will be made available by the authors, without undue reservation.
Ethics statement
The animal study was approved by Animal Experiment Regulations, Fisheries Research Education Agency Japan. The study was conducted in accordance with the local legislation and institutional requirements.
Author contributions
YU, TO, and YO contributed to conception and design of the study. RY and YK conducted field sampling. YU, YO, CY, and IT conducted chemical analyses. TO conducted water temperature analysis. YO wrote the first draft of the manuscript and performed the statistical analysis. YU, TO, and YK wrote sections of the manuscript. All authors contributed to the article and approved the submitted version.
Funding
The author(s) declare financial support was received for the research, authorship, and/or publication of this article. This research was partly supported by NIHU Research Projects “Object-based research of nature-human interactions up to the Anthropocene”, and sample analyses were conducted by the support of Joint Research Grant for the Environmental Isotope Study of Research Institute for Humanity and Nature (RIHN). A part of sample analyses was also supported by the Cooperative Program (JURCAOSKAV20-09) of Atmosphere and Ocean Research Institute, the University of Tokyo. This study was also supported by Grant-in-Aid for Scientific Research (A) (KAKENHI No. 21H04737) and MacroCoast (Macro coastal oceanography: integrated simulation for the material dynamics from the land through the open ocean, KAKENHI No. 22A402) from the Japan Society for the Promotion of Science (JSPS). The entire study was conducted within the framework of the Study of Kuroshio Ecosystem Dynamics for Sustainable Fisheries (SKED) funded to FRA from the Ministry of Education, Culture, Sports, Science and Technology, Japan [grant number: JPMXD0511102330].
Acknowledgments
We thank the captains, officers and crews of R/T/V Hokuo-maru and Soyo-maru cruise for sample collection. We also thank T. Terado (Shimane Prefectural Fisheries Technology Center), R. Hashimoto and X. Wan (Nagasaki University), T. Nakamura (The University of Tokyo), and Y. Matsui (JAMSTEC) for sample analysis. We are grateful to Dr. A. Kawabata, Dr. C. Watanabe, Dr. S. Furuichi and Dr. H. Miyamoto (Fisheries Research and Education Agency) for valuable advices about the behavior of Japanese sardine, mackerel and zooplankton. We acknowledge Dr. H. Saito (The University of Tokyo) and Dr. M. Takahashi (Fisheries Research and Education Agency) who were the chief researchers of the project.
Conflict of interest
The authors declare that the research was conducted in the absence of any commercial or financial relationships that could be construed as a potential conflict of interest.
Publisher’s note
All claims expressed in this article are solely those of the authors and do not necessarily represent those of their affiliated organizations, or those of the publisher, the editors and the reviewers. Any product that may be evaluated in this article, or claim that may be made by its manufacturer, is not guaranteed or endorsed by the publisher.
Supplementary material
The Supplementary Material for this article can be found online at: https://www.frontiersin.org/articles/10.3389/fmars.2023.1225923/full#supplementary-material
References
Aizawa Y., Takiguchi N. (1999). Consideration of the methods for estimation the Age-composition from the length frequency data with MS-Excel. Bull. Jpn. Soc Fish. Oceanogr. 63, 205–214. (in Japanese).
Bode A., Alvarez-Ossorio M. T., Cunha M. E., Garrido S., Peleteiro J. B., Porteiro C., et al. (2007). Stable nitrogen isotope studies of the pelagic food web on the Atlantic shelf of the Iberian Peninsula. Prog. Oceanogr. 74, 115–131. doi: 10.1016/j.pocean.2007.04.005
Bosley K. L., Wainright S. C. (1999). Effects of preservatives and acidification on the stable isotope ratios (15N:14N, 13C:12C) of two species of marine animals. Can. J. Fish Aquat. Sci. 56, 2181–2185. doi: 10.1139/f99-153
Chavez F. P., Ryan J., Lluch-Cota S. E., Niquen C. M. (2003). From anchovies to sardines and back multidecadal change in the Pacific Ocean. Science 299, 217–221. doi: 10.1126/science.1075880
Checkley D. M. Jr, Asch R. G., Rykaczewski R. R. (2017). Climate, anchovy, and sardine. Annu. Rev. Mar. Sci. 9, 469–493. doi: 10.1146/annurev-marine-122414-033819
Chikaraishi Y., Ogawa N. O., Kashiyama Y., Takano Y., Suga H., Tomitani A., et al. (2009). Determination of aquatic food-web structure based on compound-specific nitrogen isotopic composition of amino acids. Limnol. Oceanogr-Meth 7, 740–750. doi: 10.4319/lom.2009.7.740
Chikaraishi Y., Steffan S. A., Ogawa N. O., Ishikawa N. F., Sasaki Y., Tsuchiya M., et al. (2014). High-resolution food webs based on nitrogen isotopic composition of amino acids. Ecol. Evol. 4, 2423–2449. doi: 10.1002/ece3.1103
DeNiro M. J., Epstein S. (1978). Influence of diet on the distribution on carbon isotopes in animals. Geochim. Cosmochim. Acta 42, 493–506. doi: 10.1016/0016-7037(78)90199-0
DeNiro M. J., Epstein S. (1981). Influence of diet on the distribution on nitrogen isotopes in animals. Geochim. Cosmochim. Acta 45, 341–351. doi: 10.1016/0016-7037(81)90244-1
Endo H., Suzuki K. (2019). “Spatial variations in community structure of haptophytes across the Kuroshio front in the Tokara Strait,” in Kuroshio Current: Physical, Biogeochemical, and Ecosystem Dynamics. Eds. Nagai T., Saito H., Suzuki K., Takahashi M., (Geophys. Monogr.), Washington D.C-Hoboken NJ, AGU-Wiley. 207–221. doi: 10.1002/9781119428428.ch13
FAO (2020). The State of World Fisheries and Aquaculture 2020. Sustainability in action (Rome: FAO). Available at: https://www.fao.org/documents/card/en?details=ca9229en/.
Fuji T., Nakagami M., Suyama S., Miyamoto H., Kidokoro H. (2021). Geographical differences in the stable isotope ratios of Pacific saury in the North Pacifc Ocean. Fish Sci. 87, 529–540. doi: 10.1007/s12562-021-01528-3
Furuichi S., Yugami R., Kamimura Y., Nishijima S., Isu S., Watanabe. R. (2022). Stock assessment and evaluation for the Pacific stock of sardine (fiscal year 2021). Marine fisheries stock assessment for Japanese waters (Tokyo: Japan Fisheries Agency and Japan Fisheries Research and Education Agency). (in Japanese).
Graham B. S., Koch P. L., Newsome S. D., McMahon K. W., Aurioles D. (2010). “Using isoscapes to trace the movements and foraging behavior of top predators in oceanic ecosystems,” in Isoscapes (Dordrecht: Springer), 299–318. doi: 10.1007/978-90-481-3354-3_14
Hannides C. C. S., Popp B. N., Landry M. R., Graham B. S. (2009). Quantification of zooplankton trophic position in the North Pacific Subtropical Gyre using stable nitrogen isotopes. Limnol. Oceanogr. 54, 50–61. doi: 10.4319/lo.2009.54.1.0050
Hetherington E. D., Olson R. J., Drazen J. C., Lennert-Cody C. E., Ballance L. T., Kaufmann R. S., et al. (2017). Spatial food-web structure in the eastern tropical Pacific Ocean based on compound-specific nitrogen isotope analysis of amino acids. Limnol. Oceanogr. 62, 541–560. doi: 10.1002/lno.10443
Horii S., Takahashi K., Shiozaki T., Hashihama F., Furuya K. (2018). Stable isotopic evidence for the differential contribution of diazotrophs to the epipelagic grazing food chain in the mid-Pacific Ocean. Global Ecol. Biogeogr. 27, 1467–1480. doi: 10.1111/geb.12823
Houssard P., Lorrain A., Tremblay-Boyer L., Allain V., Graham B. S., Menkes C. E., et al. (2017). Trophic position increase with thermocline depth in yellowfin and bigeye tuna across the Western and Central Ocean. Prog. Oceanogr. 154, 49–63. doi: 10.1016/j.pocean.2017.04.008
Hunt B. P. V., Allain V., Menkes C. E., Lorrain A., Graham B., Rodier M., et al. (2015). A coupled stable isotope-size spectrum approach to understanding pelagic food-web dynamics: a case study from the southwest sub-tropical Pacific. Deep-Sea Res. PT II. 113, 208–224. doi: 10.1016/j.dsr2.2014.10.023
Inagake D., Hirano T. (1983). Vertical distribution of the Japanese sardine in relation to temperature and thermocline at the purse seine fishing ground east of Japan. Bull. Japan. Soc. Sci. fisheries. 49, 1533–1539. doi: 10.2331/suisan.49.1533
Ishikawa N. F., Kato Y., Togashi H., Yoshimura M., Yoshimizu C., Okuda N., et al. (2014). Stable nitrogen isotopic composition of amino acids reveals food web structure in stream ecosystems. Oecologia 175, 911–922. doi: 10.1007/s00442-014-2936-4
Ishikawa N. F., Ogawa N. O., Chikaraishi Y., Yamaguchi M., Fujikura K., Miyairi Y., et al. (2021). Influences of ocean currents on the diets of demersal fish communities in the Western North Pacific revealed by their muscle carbon and nitrogen isotopic compositions. Front. Mar. Sci. 8. doi: 10.3389/fmars.2021.641282
Ishikawa N. F., Tadokoro K., Matsubayashi J., Ohkouchi N. (2023). Biomass pyramids of marine mesozooplankton communities as inferred from their integrated trophic positions. Ecosystems 26, 217–231. doi: 10.1007/s10021-022-00753-w
Itoh S., Yasuda I. (2010). Water mass structure of warm and cold anticyclonic eddies in the western boundary region of the subarctic North Pacific. J. Phys. Oceanogr. 40, 2624–2642. doi: 10.1175/2010JPO4475.1
Jacob U., Mintenbeck K., Brey T., Knust R., Beyer K. (2005). Stable isotope food web studies: a case for standardized sample treatment. Mar. Ecol. Prog. Ser. 287, 251–253. doi: 10.3354/meps287251
Jardine T. D., Kidd K. A., Fisk A. T. (2006). Applications, considerations, and sources of uncertainty when using stable isotope analysis in ecotoxicology. Environ. Sci. Technol. 40, 7501–7511. doi: 10.1021/es061263h
Kamimura Y., Taga M., Yukami R., Watanabe C., Furuichi S. (2021). Intra- and inter specific density dependence of body condition, growth and habitat temperature in chub mackerel (Scomber japonicus). ICES J. Mar.Sci. 78, 3254–3264. doi: 10.1101/2021.03.25.436928
Kanamori Y., Takasuka A., Nishijima S., Okamura H. (2019). Climate change shifts the spawning ground northward and extends the spawning period of chub mackerel in the western North Pacific. Mar. Ecol. Prog. Ser. 624, 155–166. doi: 10.3354/meps13037
Kato Y., Togashi H., Kurita Y., Osada Y., Amano Y., Yoshimizu C., et al. (2021). Segmental isotope analysis of the vertebral centrum reveals the spatiotemporal population structure of adult Japanese flounder Paralichthys olivaceus in Sendai Bay, Japan. Mar. Biol. 168, 57. doi: 10.1007/s00227-021-03868-1
Kawabata A., Watanabe C., Takahashi M. (2012). Population dynamics of chub mackerel in the Pacific waters around Japan in 1970-2010. Fish. Biol. oceanogr. Kuroshio. 13, 33–36. (in Japanese).
Kawasaki T. (1983). “Why do some pelagic fishes have wide fluctuations in their numbers? Biological basis of fluctuation from the viewpoint of evolutionary ecology,” in Proceedings of the Expert Consultation to Examine Changes in Abundance and Species Composition of Neritic Fish Resources, vol. 291 . Eds. Sharp G. D., Csirke J., FAO Fisheries Report, Rome, FAO, 1065–1080. Available at: https://www.fao.org/3/x6851b/x6851b.pdf.
Kawasaki T., Kumagai A. (1984). Food habits of the Far Eastern sardine and their implication in the fluctuation pattern of the sardine stocks. Bull. Japan. Soc. Sci. Fish. 50 (10), 1657–1663.
Kishida T., Matsuda H. (1993). Statistical analyses of intra and interspecific density effects on recruitment of chub mackerel and sardine in Japan. Fish. Oceanogr. 2, 278–287. doi: 10.1111/j.1365-2419.1993.tb00142.x
Klyashtorin L. B. (1998). Long-term climate change and main commercial fish production in the Atlantic and. Pacific. Fish. Res. 37, 115–125. doi: 10.1016/S0165-7836(98)00131-3
Kobari T., Kobari Y., Miyamoto H., Okazaki Y., Kume G., Kondo R., et al. (2019). “Variability in taxonomic composition, standing stock, and productivity of the plankton community in the Kuroshio and its neighboring waters.,” in Kuroshio Current: Physical, Biogeochemical, and Ecosystem Dynamics. Eds. Nagai T., Saito H., Suzuki K., Takahashi M. (Geophys. Monogr.), Washington D.C-Hoboken NJ, AGU-Wiley. 223–243. doi: 10.1002/9781119428428.ch14
Komatsu K., Hiroe Y. (2019). “Structure and impact of the Kuroshio nutrient stream.,” in Kuroshio Current: Physical, Biogeochemical, and Ecosystem Dynamics. Eds. Nagai T., Saito H., Suzuki K., Takahashi M. (Geophys. Monogr), Washington D.C-Hoboken NJ, AGU-Wiley. 83–104. doi: 10.1002/9781119428428.ch5
Kurita Y. (2010). Influence of spatio-temporal changes in stock reproductive potential on the recruitment level of fish. Bull. Jpn. Soc Fish. Oceanogr. 74, 4–18. (in Japanese with English abstract).
Kuroda H., Setou T., Kakehi S., Ito S., Taneda T., Azumaya T., et al. (2017). Recent advances in Japanese fisheries science in the Kuroshio-Oyashio region through development of the FRA-ROMS ocean forecast system. Overview of the reproducibility of reanalysis products. Open J. Mar. Sci. 7, 62–90. doi: 10.4236/ojms.2017.71006
Lindsay D. J., Minagawa M., Mitani I., Kawaguchi K. (1998). Trophic shift in the Japanese anchovy Engraulis japonicus in its early life history stages as detected by stable isotope ratios in Sagami Bay, Central Japan. Fish. Sci. 34, 403–410. doi: 10.2331/fishsci.64.403
Lorrain A., Graham B. S., Popp B. N., Allain V., Olson R. J., Hunt B. P. V., et al. (2015). Nitrogen isotopic baselines and implications for estimating foraging habitat and trophic position of yellowfin tuna in the Indian and Pacific Oceans. Deep-Sea Res. PT II. 113, 188–198. doi: 10.1016/j.dsr2.2014.02.003
MacKenzie K. M., Trueman C. N., Palmer M. R., Moore A., Ibbotson A. T., Beaumont W. R., et al. (2012). Stable isotopes reveal age-dependent trophic level and spatial segregation during adult marine feeding in populations of salmon. ICES J. Mar. Sci. 69, 1637–1645. doi: 10.1093/icesjms/fss074
Mantua N. J., Hare S. R., Zhang Y., Wallance J. M., Francis R. C. (1997). A Pacific interdecadal climate oscillation with impact on salmon production. B. Am. Meteorol. Soc 78, 1069–1079. doi: 10.1175/1520-0477(1997)078%3C1069:APICOW%3E2.0.CO;2
Matsubayashi J., Osada Y., Tadokoro K., Abe Y., Yamaguchi A., Shirai K., et al. (2020). Tracking long-distance migration of marine fishes using compound-specific stable isotope analysis of amino acids. Ecol. Lett. 23, 881–890. doi: 10.1111/ele.13496
McClelland J. W., Montoya J. P. (2002). Trophic relationships and the nitrogen isotopic composition of amino acids in plankton. Ecology 83, 2173–2180. doi: 10.1890/0012-9658(2002)083[2173:TRATNI]2.0.CO;2
Minagawa M., Ohashi M., Kuramoto T., Noda N. (2001). δ15N of PON and nitrate as a clue to the origin and transformation of nitrogen in the subarctic North Pacific and its marginal sea. J. Oceanogr. 57, 285–300. doi: 10.1023/A:1012430512137
Minagawa M., Wada E. (1984). Stepwise enrichment of 15N along food chains: Further evidence and the relation between δ15N and animal age. Geochim. Cosmochim. Acta 48, 1135–1140. doi: 10.1016/0016-7037(84)90204-7
Miyachi S., Mayahara T., Tsushima K., Sasada K., Kohno E., Ogawa N., et al. (2015). Approach to determine individual trophic level and the difference in food source of Japanese anchovy Engraulis japonicus in Sagami Bay, based on compound-specific nitrogen stable isotope analysis of amino acids. Fish. Sci. 81, 1053–1062. doi: 10.1007/s12562-015-0923-2
Miyake Y., Wada. E. (1967). The abundance ratio of 15N/14N in marine environments. Rec. Oceanogr. Works Japan 9, 37–53.
Miyamoto H., Takahashi K., Kuroda H., Watanabe T., Taniuchi Y., Kuwata A., et al. (2022). Copepod community structure in the transition region of the North Pacific Ocean: Water mixing as a key driver of secondary production enhancement in subarctic and subtropical waters. Prog. Oceanogr. 207, 102865. doi: 10.1016/j.pocean.2022.102865
Nakai Z. (1962). Studies relevant to mechanisms underlying the fluctuation in the catch of the Japanese sardine, Sardinops melanosticta (Temminck & Schlegel). Japan. J. Ichthyol. 9, 1–115.
Nakamura T. (2022). “Comparative study of interannual variation of δ13C and δ15N in Japanese sardine and mackerels,” in Master thesis at Graduate School of Frontier Sciences (The University of Tokyo, Chiba). 91pp. (in Japanese).
Nakatsuka S., Kawabata A., Takasuka A., Kubota H., Okamura H. (2010). Estimating gastric evacuation rate and daily ration of chub mackerel and spotted mackerel in the Kuroshio-Oyashio transition and Oyashio regions. Bull. Japan. Soc. Fish. Oceanogr. 74, 105–117. (in Japanese with English abstract).
Nishikawa H., Nishikawa S., Ishizaki H., Wakamatsu T., Ishikawa Y. (2020). Detection of the Oyashio and Kuroshio fronts under the projected climate change in the 21st century. Prog. Earth Planet. Sci. 7, 1–12. doi: 10.1186/s40645-020-00342-2
Nishikawa H., Yasuda I. (2008). Japanese sardine (Sardinops melanostictus) Mortality in relation to the winter mixed layer depth in the Kuroshio Extension region. Fish. Oceanogr. 17, 411–420. doi: 10.1111/j.1365-2419.2008.00487.x
Ohshimo S., Madigan D. J., Komada T., Tanaka H., Komoto K., Suyama S., et al. (2019). Isoscapes reveal patterns of δ13C and δ15N of pelagic forage fish and squid in the Northwest Pacific Ocean. Prog. Oceanogr. 175, 124–138. doi: 10.1016/j.pocean.2019.04.003
Okazaki Y., Miyamoto H., Suzuki K., Saito H., Hidaka K., Ichikawa T. (2019). ““Diverse trophic pathways from zooplankton to larval and juvenile fishes in the Kuroshio ecosystem.”,” in Kuroshio Current: Physical, Biogeochemical, and Ecosystem Dynamics, vol. 243 . Eds. Nagai T., Saito H., Suzuki K., Takahashi M., (Geophys. Monogr.), Washington D.C-Hoboken NJ, AGU-Wiley. 245–256. doi: 10.1002/9781119428428.ch15
Ozawa R. (2010). Surveys of pelagic fish with a quantitative echo sounder in the sea off Joban ~ Boso. Bull. Ibaraki Prefect. Fish. Experiment Station 41, 35–49. (in Japanese with English abstract).
Popp B. N., Graham B. S., Olson R. J., Hannides C. C., Lott M. J., López-Ibarra G. A., et al. (2007). Insight into the trophic ecology of yellowfin tuna, Thunnus albacares, from compound-specific nitrogen isotope analysis of proteinaceous amino acids. Terr. Ecol. 1, 173–190. doi: 10.1016/S1936-7961(07)01012-3
Post D. M. (2002). Using stable isotopes to estimate trophic position. models, methods, and assumptions. Ecology 83, 703. doi: 10.1890/0012-9658(2002)083[0703:USITET]2.0.CO;2
Qiu B. (2019). Kuroshio and Oyashio currents. Encycl. Ocean Sci. 3, 384–394. doi: 10.1016/B978-0-12-409548-9.11295-3
Rau G. H., Mearns A. J., Young D. R., Olson R. J., Schafer H. A., Kaplan I. R. (1983). Animal 13C/12C correlates with trophic level in pelagic food webs. Ecology 64, 1314–1318. doi: 10.2307/1937843
Robert D., Takasuka A., Nakatsuka S., Kubota H., Ozeki Y., Nishida H., et al. (2017). Predation dynamics of mackerel on larval and juvenile anchovy: is capture success linked to prey condition? Fish. Sci. 76, 183–188. doi: 10.1007/s12562-009-0205-y
Saino T., Hattori A. (1987). Geographical variation of the water column distribution of suspended particulate organic nitrogen and its 15N natural abundance in the Pacific and its marginal seas. Deep Sea Res. 34, 807–827. doi: 10.1016/0198-0149(87)90038-0
Saito H. (2019). “The Kuroshio. its recognition, scientific activities and emerging issues,” in Kuroshio current. Physical, biogeochemical, and ecosystem dynamics, 1–11. doi: 10.1002/9781119428428.ch1
Sakamoto T., Horii S., Kodama T., Takahashi K., Tawa A., Tanaka Y., et al. (2023). Stable isotopes in eye lenses reveal migration and mixing patterns of diamond squid in the western North Pacific and its marginal seas. ICES J. Mar. Sci., fsad145. doi: 10.1093/icesjms/fsad145
Sakamoto T., Komatsu K., Shirai K., Higuchi T., Ishimura T., Setou T., et al. (2018). Combining microvolume isotope analysis and numerical simulation to reproduce fish migration history. Methods Ecol. Evol. 10, 59–69. doi: 10.1111/2041-210X.13098
Sakurai Y. (2007). An overview of the Oyashio ecosystem. Deep Sea Res. II 54, 2526–2542. doi: 10.1016/j.dsr2.2007.02.007
Sassa C., Tsukamoto Y. (2010). Distribution and growth of Scomber japonicus and S. australasicus larvae in the southern East China Sea in response to oceanographic conditions. Mar. Ecol. Prog. Ser. 419, 185–199. doi: 10.3354/meps08832
Shiozaki T., Nagata T., Ijichi M., Furuya K. (2015). Nitrogen fixation and the diazotroph community in the temperate coastal region of the northwestern North Pacific. Biogeosciences 12, 4751–4764. doi: 10.1029/2020JC017071
Sugisaki H., Terazaki M., Wada E., Nemoto T. (1991). Feeding habits of a pelagic amphipod, Themisto japonica. Mar. Biol. 109, 241–244. doi: 10.1007/BF01319392
Takahashi M., Sassa C., Nishiuchi K., Tsukamoto Y. (2019). ““Variability in growth rates of Japanese jack mackerel Trachurus japonicus larvae and juveniles in the East China Sea–effects of temperature and prey abundance”,” in Kuroshio Current: Physical, Biogeochemical, and Ecosystem Dynamics. Eds. Nagai T., Saito H., Suzuki K., Takahashi M., (Geophys. Monogr.), Washington D.C-Hoboken NJ, AGU-Wiley. 295–308. doi: 10.1002/9781119428428.ch18
Takasuka A., Oozeki Y., Aoki I. (2007). Optimal growth temperature hypothesis. Why do anchovy flourish and sardine collapse or vice versa under the same ocean regime? Can. J. Fish. Aquat Sci. 64, 768–776. doi: 10.1139/F07-052
Vander Zanden M. J., Clayton M. K., Moody E. K., Solomon C. T., Weidel B. C. (2015). Stable isotope turnover and half-life in animal tissues. A literature synthesis. PloS One 10, e0116182. doi: 10.1371/journal.pone.0116182
Vander Zanden M. J., Rasmussen J. B. (2001). Variation in δ15N and δ13C trophic fractionation. implications for aquatic food web studies. Limnol. Oceanogr. 46, 2061–2066. doi: 10.4319/lo.2001.46.8.2061
Watanabe C., Yatsu A. (2004). Effects of density-dependence and sea surface temperature on inter-annual variation in length-at-age of chub mackerel (Scomber japonicus) in the Kuroshio-Oyashio area during 1970–1997. Fish. Bull. 102, 196–206.
Wickham H. (2016). ggplot2, Elegant Graphics for Data Analysis (Cham: Springer), 203–220. doi: 10.1007/978-3-319-24277-4_10
Xing D., Choi B., Takizawa Y., Fan R., Sugaya S., Tsuchiya M., et al. (2020). Trophic hierarchy of coastal marine fish communities viewed via compound-specific isotope analysis of amino acids. Mar. Ecol. Prog. Ser. 652, 137–144. doi: 10.3354/meps13475
Yasuda T., Kinoshita J., Niino Y., Okuyama J. (2023). Vertical migration patterns linked to body and environmental temperatures in chub mackerel. Prog. Oceanogr. 213, 10317. doi: 10.1016/j.pocean.2023.103017
Yatsu A. (2019). Review of population dynamics and management of small pelagic fishes around the Japanese Archipelago. Fish. Sci. 85, 611–639. doi: 10.1007/s12562-019-01305-3
Yatsu A., Chiba S., Yamanaka Y., Ito S. I., Shimizu Y., Kaeriyama M., et al. (2013). Climate forcing and the Kuroshio/Oyashio ecosystem. ICES J. Mar. Sci. 70, 922–933. doi: 10.1093/icesjms/fst084
Yatsu A., Watanabe T., Ishida M., Sugisaki H., Jacobson L. D. (2005). Environmental effects on recruitment and productivity of the Japanese sardine, Sardinops melanostictus, and chub mackerel, Scomber japonicus, with recommendations for management. Fish Oceanogr. 14, 263–278. doi: 10.1111/j.1365-2419.2005.00335.x
Yoneda M., Kitano H., Nyuji M., Nakamura M., Takahashi M., Kawabata A., et al. (2022). Maternal spawning experience and thermal effects on offspring viability of chub mackerel and their influence on reproductive success. Front. Mar. Sci. 9. doi: 10.3389/fmars.2022.1063468
Yoshikawa C., Makabe A., Matsui Y., Nunoura T., Ohkouchi N. (2018). Nitrate isotope distribution in the subarctic and subtropical North Pacific. Geochem. Geophys. 19, 2212–2224. doi: 10.1029/2018GC007528
Yoshikawa C., Yamanaka Y., Nakatsuka T. (2005). An ecosystem model including nitrogen isotopes: perspectives on a study of the marine nitrogen cycle. J. Oceanogr. 61, 921–942. doi: 10.1007/s10872-006-0010-5
Yoshioka T., Wada E., Hayashi H. (1994). A stable isotope study on seasonal food web dynamics in a lake. Ecology 75, 835–846. doi: 10.2307/1941739
Yukami R., Nishijima S., Kamimura Y., Furuichi S., Isu S., Watanabe R. (2022). “Stock assessment and evaluation for Pacific stock of chub mackerel (fiscal year 2021),” in Marine fisheries stock assessment for Japanese waters (Tokyo: Japan Fisheries Agency and Japan Fisheries Research and Education Agency). (in Japanese).
Keywords: Kuroshio-Oyashio transition, amino acids, stable isotope, trophic position Japanese sardine, mackerels, feeding habit, inter-annual variation
Citation: Ohno Y, Umezawa Y, Okunishi T, Yukami R, Kamimura Y, Yoshimizu C and Tayasu I (2023) Investigation of inter-annual variation in the feeding habits of Japanese sardine (Sardinops melanostictus) and mackerels (Scomber spp.) in the Western North Pacific based on bulk and amino acid stable isotopes. Front. Mar. Sci. 10:1225923. doi: 10.3389/fmars.2023.1225923
Received: 20 May 2023; Accepted: 26 October 2023;
Published: 21 November 2023.
Edited by:
Ming-Tsung Chung, National Taiwan University, TaiwanReviewed by:
Joo Myun Park, Korea Institute of Ocean Science and Technology (KIOST), Republic of KoreaChing-Tsun Chang, Council of Agriculture, Taiwan
Yiming Wang, Max Planck Institute for the Science of Human History (MPI-SHH), Germany
Copyright © 2023 Ohno, Umezawa, Okunishi, Yukami, Kamimura, Yoshimizu and Tayasu. This is an open-access article distributed under the terms of the Creative Commons Attribution License (CC BY). The use, distribution or reproduction in other forums is permitted, provided the original author(s) and the copyright owner(s) are credited and that the original publication in this journal is cited, in accordance with accepted academic practice. No use, distribution or reproduction is permitted which does not comply with these terms.
*Correspondence: Yu Umezawa, dW1lemF3YUBtZS50dWF0LmFjLmpw