 Anna Koester1,2*
 Cesc Gordó−Vilaseca1,3Nancy Bunbury2,4
 Sebastian C. A. Ferse1,5
 Amanda Ford6
 Philip Haupt2,7Luke A’Bear2Maria Bielsa2
 April Jasmine Burt2Jake Letori2Emma Mederic2Ella Nancy2Cheryl Sanchez2,8Matt Waller2,9,10
 Christian Wild1
- 1Marine Ecology Department, Faculty of Biology & Chemistry, University of Bremen, Bremen, Germany
- 2Seychelles Islands Foundation (SIF), Victoria, Seychelles
- 3Faculty of Biosciences and Aquaculture, Nord University, Bodø, Norway
- 4Centre for Ecology and Conservation, University of Exeter, Penryn, United Kingdom
- 5Leibniz Centre for Tropical Marine Research (ZMT), Bremen, Germany
- 6Discipline of Marine Studies, School of Agriculture, Geography, Environment, Ocean and Natural Sciences, The University of the South Pacific, Suva, Fiji
- 7Kent and Essex Inshore Fisheries Conservation Authority, Ramsgate, United Kingdom
- 8Department of Biology, University of Pisa, Pisa, Italy
- 9Marine Biological Association, The Laboratory, Plymouth, United Kingdom
- 10Ocean and Earth Science, National Oceanography Centre Southampton, University of Southampton, Southampton, United Kingdom
Introduction: Coral bleaching immediately impacts the reef benthos, but effects on fish communities are less well understood because they are often delayed and confounded by anthropogenic interactions.
Methods: We assessed changes in fish abundance, biomass and community composition before and after the 2015/16 coral bleaching event at Aldabra Atoll, Seychelles, where local human impacts are minimal, but reefs suffered 50% bleaching-induced coral mortality. We monitored 12 shallow (2–5 m water depth) and nine deep (15 m water depth) permanent survey sites using two survey methods: indicator surveys recording 84 taxa over six years (pre-: 2014; post-bleaching: 2016–2019, 2021), sizing fish based on six size-class categories, and extended fish surveys recording 198 taxa over two years (pre-: 2015; post-bleaching: 2020) with size estimates to the nearest cm (excluding fish < 8 cm).
Results: During indicator surveys, mean fish abundance did not change on deep reefs. However, abundance increased by 77% on shallow reefs between 2014 and 2016, which was mainly driven by increases in herbivores and omnivores, likely as a response to elevated turf algae cover following coral mortality. Overall (and functional group-specific) indicator fish biomass did not differ between 2014 and 2016 and remained at or above pre-bleaching levels throughout 2016–2021. In contrast, extended fish surveys in 2015 and 2020 showed a 55–60% reduction in overall abundance on shallow and deep reefs, and a 69% reduction in biomass on shallow reefs, with decreases in biomass occurring in all functional groups. Biomass on deep reefs did not differ between 2015 and 2020. Multivariate analysis of both data sets revealed immediate and long-lasting differences between pre- and post-bleaching fish community compositions, driven largely by herbivorous, omnivorous and piscivorous taxa.
Discussion: Results from the indicator surveys suggest that the bleaching event had limited impact on fish abundance and biomass, while the extended surveys recorded changes in abundance and biomass which would otherwise have gone undetected. Our findings improve understanding of the shift a broad community of fish undergoes following a mass coral bleaching event and highlights the value of survey methods that include the full suite of species to detect ecological responses to environmental drivers.
1 Introduction
Coastal communities worldwide rely on reef fish for nutrition and income via fisheries and tourism but reef fish are subject to a range of local and global pressures of natural and anthropogenic origins (Pratchett et al., 2014; Hughes et al., 2017; Cinner et al., 2020). Reef fish assemblages are especially vulnerable to changes in coral reef habitat, e.g. via climate change-induced coral bleaching and coral mortality (Wilson et al., 2006; Pratchett et al., 2008; Pratchett et al., 2014). The loss of live coral and the subsequent erosion of the physical reef structure can cause declines in fish abundance and diversity (Anderson et al., 2012). Fish species specialised on live corals for food and habitat are usually affected immediately or in the short-term (i.e., within ca. 3 years post-disturbance; Wilson et al., 2006), while recruitment failure due to loss of reef structure can impact fish assemblages and biomass in the longer term (Graham et al., 2007). In contrast, the abundance of herbivorous and detritivorous fish may increase as declines in coral cover are often linked to increases in algae cover and associated detritus (Lindahl, 2001; Sheppard et al., 2002). Herbivorous fish are therefore one of the most important functional groups of coral reef fishes. By regulating the abundance of algae on coral reefs, and thus facilitating the availability of suitable substrate for recruitment of reef-forming corals, they promote coral reef resilience and post-disturbance reef recovery (Bellwood et al., 2004).
Habitat degradation usually co-occurs with localised fishing pressure, which can lead to substantial declines of fish abundance and biomass, especially in heavily populated regions (Wilson et al., 2006). Several studies have documented rapid depletion of fish biomass even at relatively low fishing pressure (Dulvy et al., 2004; Wilson et al., 2010), with large, slow-growing, late-maturing fish species being particularly vulnerable as these are the first to be targeted (Jennings and Polunin, 1996). Consequently, heavily fished communities are often dominated by small-bodied individuals and species of lower and mid-level trophic groups (Dulvy et al., 2004; Graham et al., 2005; McClanahan, 2008; Graham et al., 2017). To counteract declines and restore fish assemblages, marine protected areas (MPAs) — ranging from no-take to multi-use managed areas — have become a standard conservation and management tool (Halpern, 2003).
Indeed, research from well-enforced no-take MPAs shows that abundance, biomass and, sometimes, diversity of reef fish communities can be enhanced compared to adjacent areas open to fishing (McClanahan et al., 2007b; Stockwell et al., 2009; Edgar et al., 2014). Nevertheless, recent work suggests that the benefits of relatively small (<15 km2) MPAs are declining and/or shifting in the face of climate change, benefitting altered fish assemblages dominated by lower trophic levels (Graham et al., 2020). It is therefore useful to understand how reef fish communities respond to the effects of climate change at remote and large MPAs where direct anthropogenic impacts are minimal.
Aldabra Atoll in the Republic of Seychelles is one such area. Aldabra is located 407 km north and 700 km east of the nearest inhabited land (Madagascar and Tanzania, respectively), and more than 1000 km from the Seychelles Inner Islands, where most of the country’s population resides. It was designated as a Special Reserve in 1981 (i.e., the highest level of national protection under Seychelles’ legislation) and inscribed as a UNESCO World Heritage Site in 1982, with its protective boundaries encompassing 2559 km2 since 2018 (439 km2 prior to that). Aldabra’s marine ecosystem has therefore been protected from commercial fishing pressure for almost 40 years, and comparative surveys identified Aldabra’s reef fish biomass of 4.8 kg/ha to be amongst the highest within Seychelles (Friedlander et al., 2015). In addition, as Aldabra’s reefs are an important source for coral larvae in the region (Burt, 2022), it is likely that it also acts as valuable source for fish larvae spill-over, thereby contribution to regional fisheries, nutrition and tourism.
The Seychelles Islands Foundation (SIF), the public trust tasked with the management and protection of Aldabra, uses annual marine monitoring as a standard tool to track changes and inform management. This monitoring has revealed high coral mortality at Aldabra after the 2015/16 bleaching event (34–62% coral loss at 2–15 m water depth; Cerutti et al., 2020; Koester et al., 2020), followed by substantial recovery during 2016–2019 with reefs ≤ 5 m water depth reaching 54–93% of their pre-bleaching hard coral cover by 2019 (Koester et al., 2020). Here, we utilise reef fish monitoring data collected during two survey periods before, and six survey periods following, the coral bleaching event to assess the effect of bleaching-induced benthic changes on Aldabra’s reef fish communities. Data has been collected meeting resource constraints, with the annual monitoring surveying a set list of indicator taxa, allowing inexperienced surveyors to partake after basic training, and extended surveys every five years. We specifically explore: (1) How did the 2016 coral bleaching event affect fish abundance and biomass at Aldabra? (2) How did this change in the six years following the bleaching? (3) How did fish assemblage structure change during the study period? And (4), to what extent are the two survey methods appropriate to inform management?
Remote and strictly protected areas like Aldabra serve as valuable reference sites for comparisons with other locations where local and substantial human impacts confound our understanding of the role of environmental drivers, like mass bleaching events. Ecological and environmental research and monitoring at locations like Aldabra is therefore crucial to enhance our understanding of the effects of climate change on coral reef ecosystems, and paramount for their continued protection.
2 Materials and methods
2.1 Study site
The Republic of Seychelles is situated in the Western Indian Ocean (WIO) between 4° and 10° south of the equator. The Seychelles consist of more than 150 islands and atolls that are scattered across its 1,400,000 km2 exclusive economic zone (Kawaley, 1998). More than 99% of the country’s population reside on the granitic (‘Inner’) islands in the north of the archipelago (Seychelles National Bureau of Statistics, 2021), whilst the coralline islands and atolls in the south and south-west (‘Outer islands’) are not, or only sparsely populated.
Aldabra (46°20’E, 9°24’S), in the far southwest of the Seychelles, is an elevated coral atoll with a large lagoon (196 km2) encircled by four main islands, spanning 34 × 14.5 km (Figure 1). SIF maintains a small research station (10–20 staff) to facilitate research and monitoring of Aldabra’s terrestrial and marine habitats, and protection of the atoll. A small and strictly regulated staff-run subsistence fishery is permitted, whereby handline bottom fishing of reef fish is only allowed within dedicated fishing zones in maximum 50 m water depth (Figure 1).

Figure 1 Location of Aldabra Atoll in the Indian Ocean and within Seychelles, with its four main islands and 12 marine survey sites. Sites 1–8 and 12 are outside the lagoon on the seaward reefs, with permanently marked transects at both 5 and 15 m water depth, while sites 9–11 are inside the lagoon, with permanently marked transects at 2–3 m water depth. Grey polygons on the seaward reefs demark zones within which SIF permits handline bottom fishing of its subsistence fishery (trolling of pelagic fish is allowed outside these zones but not inside the lagoon). Figure modified after Koester et al., (2021) and included under a CC BY license, with permission from the Seychelles Islands Foundation (copyright 2021).
Between December 2015 and June 2016, reefs at Aldabra experienced continued bleaching risk, with Degree Heating Week values peaking at 6.0°C-weeks (temperature measured by satellite ca. 5 km north of Aldabra: 9°19’30.0”S 46°19’30.0”E; NOAA Coral Reef Watch, 2023). Between December 2015 and December 2016, live hard coral cover decreased by 51–62% on the seaward reefs and by 34% in the lagoon (Cerutti et al., 2020; Koester et al., 2020).
2.2 Data collection
Twelve survey sites are located around Aldabra (Figure 1): nine sites are on the seaward reef with permanently marked 50-m transects at both 5 m and 15 m water depth (i.e., surveys are done at two depths at each of these sites), while three sites are inside the lagoon with permanently marked 50-m transects at 2–3 m water depth (Figure 1, Table S1). Fish surveys were conducted along between one and three 50 × 4 m belt transects (i.e., one transect = 200 m2; 10 m gap between replicate transects) marked by surveyors with tape measures. The first transect was always the permanently marked transect; subsequent replicate transects were surveyed along the same compass bearing and following the same depth contour as the permanent transect. All transects of the same depth at each site were surveyed during the same dive. Surveys were done during November 2014–January 2015 (hereafter, ‘2014’), December 2015 (immediately before the bleaching event), December 2016 (6 months following the end of the bleaching event), December 2018–January 2019 (hereafter, ‘2018’), November 2019–January 2020 (hereafter, ‘2019’), November 2020–January 2021 (hereafter, ‘2020’) and November–December 2021 (hereafter, ‘2021’).
Due to differing resource availability, the number of survey sites visited and number of transects completed varied during 2014–2021 (Table S1). In addition, due to varying institutional capacity, two survey methods were employed (Table S2). In 2014, 2016–2019 and 2021 all fishes of a pre-defined list of 84 taxa (63 of which were identified to species-, six to genus- and 14 to family/sub-family level; Table S3) were counted and classified into one of five size classes based on total length (i.e., < 10 cm, 10–19 cm, 20–29 cm, 30–39 cm, > 39 cm). Selection of taxa for these surveys (hereafter, ‘indicator’ surveys) followed Obura and Grimsditch (2009) and included taxa that represent major functional groups, and are sensitive to either anthropogenic pressures, e.g. fishing, or to environmental change, e.g. coral bleaching. In 2015 and 2020, all diurnally active, reef-associated fishes were identified to species level whenever possible (Table S4; 198 taxa in total, 182 of which were identified to species-, six to genus- and 10 to family-level), counted and estimated to the nearest cm when ≥ 8 cm (hereafter, ‘extended’ surveys). Fish < 8 cm where not recorded to reduce bias arising from differing surveyor experience, which may lead to surveyors being overwhelmed by large numbers of small fish (Willis, 2001; Williams et al., 2006). With both survey methods, large, more mobile fish were surveyed on the first pass of the transect, while smaller more site-attached fish were surveyed on the return pass. Each year, surveys were done by different surveyors; however, all surveyors underwent basic (indicator surveys) or extensive training (extended surveys; whereby the 2015 surveyor had substantial prior survey experience). Training for both methods included desk-based fish identification training, a written fish identification exam (which all surveyors passed with ≥ 97% correct fish ID), and in-water practical survey training of fish identification, size estimation and surveying, which is done more frequently and intensively for the extended surveys.
2.3 Data processing
Fish taxa were assigned to one of six functional groups based on broad feeding habits (piscivores, omnivores, invertivores, corallivores, planktivores, herbivores) following Samoilys et al. (2018) and Froese and Pauly (2022). The number of families surveyed within each functional group are the same for both survey methods, apart from omnivores (indicator data set: six families surveyed; extended data set: 14 families surveyed) and piscivores (indicator data set: five families surveyed; extended data set: six families surveyed; Tables S3, S4).
Fish biomass was estimated using the length-weight equation W = a × Lb (Le Cren, 1951), where W is weight, L is length and a and b are published species-specific constants (Froese and Pauly, 2022). For data obtained through the indicator surveys, the midpoint of each size class was used as length estimation. To approximate the length of fishes within the largest size class (i.e., > 39 cm), the median size within that size class was calculated from the size estimates of the extended surveys. To obtain the species-specific constants (a and b) for fish that could not be identified to species level but only to genus or family, constants from all species of that genus or family present at Aldabra (based on Friedlander et al., 2015) were averaged.
2.4 Statistical analysis
Data obtained through the indicator and extended surveys were analysed separately. This was done because standardising these two datasets requires the removal of 32% of data obtained from the extended surveys (by removing fish species not on the indicator survey list) and 26% of the data obtained from the indicator surveys (by removing fish < 8 cm total length, as these were not counted during extended surveys). Preliminary analysis of the community composition of this standardised dataset showed that differences between the two pre-bleaching datasets of 2014 (indicator surveys) and 2015 (extended surveys) were largely driven by ten taxa (Acanthuridae, other parrotfish, Lutjanus bohar, Balistidae, Variola louti, other grouper, Ctenochaetus spp., Naso spp., Pomacanthidae, Plectorhinchus albovittatus, Cephalopholis nigripinnis, Mullidae; Tables S5, S6). In addition, communities recorded in 2015 and 2020 (extended surveys) cluster together and away from the communities of the remaining years (indicator surveys), showing that these two datasets are not directly comparable, even after standardisation (Figure S1; see also work by Cheal and Emslie [2020] on the introduction of different biases when changing from surveying a subset of fish to the full suite and the influence on comparability of counts from different methods).
Although benthic communities differ across locations (i.e., lagoon, western outer reefs and eastern outer reefs; Koester et al., 2020), fish abundance and biomass were only assessed across water depths due to the varying number of replicates conducted at each location across years. In addition, due to the lower number of transects surveyed in the lagoon (in some years only three transects; Table S1), data from the lagoonal sites were pooled with the 5 m survey sites of the seaward reefs (i.e., shallow water depth).
Throughout the manuscript, all reported descriptive summary statistics were calculated on the level of transects (e.g., to obtain overall means per depth, transect values were not first averaged by site).
2.4.1 Differences in fish abundance and biomass
Generalised Linear Mixed Models (GLMM; R version 4.1.2, R Core Team, 2021; glmmTMB package, Brooks et al., 2017), developed to account for unbalanced study designs, were used to test for differences in fish abundance overall and biomass (overall and for each functional group) across years (indicator surveys: 2014, 2016–2019, 2021; extended surveys: 2015, 2020) and water depths (shallow: 2–5 m depth; and deep: 15 m depth). Fixed factors of all initial models included ‘year’, ‘depth’ and their interaction, but where initial models had poor fit (identified through model validation, see below), data of shallow and deep sites were modelled separately and only ‘year’ was set as fixed factor (Tables S7, S8). In all models, ‘site’ was set as a random factor to account for possible autocorrelation between transects across years. Initially, abundance data were modelled with negative binomial error distributions and biomass data were modelled with Gamma error distributions with logarithmic link function. As zero-inflation is a typical feature of count data, fitted models were tested for zero inflation (including those modelling fish biomass as it is a direct derivation from fish counts) with the DHARMa package (Hartig, 2022). Where zero inflation was detected, final abundance models were specified for zero-inflation with negative binomial distribution and final biomass models were specified as two-component models (hurdle models), whereby the zero- and non-zero values were modelled separately using Gamma error distributions with a logarithmic link function for the non-zero model component (Tables S7, S8). Validation of model residuals were also done with the DHARMa package, which includes additional test functions to identify common model specification issues and creates standardised residuals for generalised linear (mixed) models using a simulation-based methodology (Hartig, 2022). Pairwise differences in significant models were identified using a post-hoc analysis based on least square means with Bonferroni adjustment (lsmean package, Lenth, 2016).
As changes in the coral reef habitat can induce altered variability in fish communities (Plass-Johnson et al., 2016), which can be another measure of identifying coral bleaching impact, we tested for differences in homogeneity of variances of fish abundance and biomass across years. We used ANOVA on sample residuals (obtained by subtracting the median abundance/biomass per year and depth from the total abundance/biomass per transect) as response variable and the interaction between ‘year’ and ‘depth’ as fixed factors. To identify pairwise differences in significant models, a Tukey post-hoc analysis was run (stats package; R Core Team, 2021; Table S9). This approach is equivalent to the Levene’s test, but allows for inclusion of interactive factors (in our case ‘year’ and ‘depth’).
2.4.2 Change in fish size distribution
To assess whether reef degradation influenced the size distribution of fish communities, we conducted (1) size spectra analysis across years and (2) size-class specific analysis of fish abundance across years and depths. For both analyses, the same size class categories were used for the extended dataset as for the indicator data set, except for the smallest size class category as extended surveys only surveyed fish ≥ 8 cm.
For the size spectra analysis, we measured the size distribution as the slope and midpoint of a linear regression fitted to the size frequency distribution of the fish community. Prior to analysis, size frequency data was log10(x + 1)-transformed to establish a linear relationship. To remove the correlation between midpoint and slope, the midpoints of size classes were rescaled to the size range and kept at zero (Rochet and Trenkel, 2003; Graham et al., 2005). When evaluating size spectra results, a steepening of the slope (i.e., becoming more negative) indicates an increase in small fish, a decrease in large fish, or both. The midpoint height serves as proxy of primary production and overall community biomass, with higher values indicating greater community biomass (Graham et al., 2005). Change in the slope and midpoint height of the size spectra across years were analysed with Kruskal-Wallis Rank Sum Tests as slope and midpoint data was not normally distributed (tested with Shapiro-Wilk normality test). Where differences among years were significant, pairwise Wilcoxon Rank Sum Tests with Bonferroni adjustment were performed to identify different groups (all analyses done with the stats package; R Core Team, 2021).
Size-class specific analysis of fish abundance of the indicator fish data followed the same GLMM procedures as described above, i.e., abundance within individual size classes were set as response variables and ‘year’, ‘depth’ and their interaction were set as fixed factors and ‘site’ was set as random factor (error distribution: negative binomial). Where model fit was poor, abundances of shallow and deep reefs were tested separately and only ‘year’ was set as a fixed factor, with ‘site’ set as random factor (Table S10). As the extended dataset had fewer years, enabling more complex models to be fitted, abundances of deep and shallow reefs were set as response variables, with ‘year’, ‘size class’ and their interaction set as fixed factors and ‘site’ as random factor (error distribution: negative binomial with zero inflation specification; Table S11).
2.4.3 Change in community composition
To test for differences in fish community composition and dispersion among years and to assess which taxa contribute to differences, Analysis of Similarity (ANOSIM), Permutational Analysis of Multivariate Dispersions (PERMDISP) and Similarity Percentages (SIMPER) analysis (using PRIMER 6 Version 1.1.16 with the PERMANOVA add-on; Clarke and Gorley, 2006; Anderson et al., 2008) were performed on a) the Bray–Curtis dissimilarity matrix of the fish community (square root transformed site-level average fish biomass per depth) for ANOSIM and PERMDISP and b) the fish community (square root transformed site-level average fish biomass per depth) for SIMPER.
To visualise differences in community compositions across years, non-metric multidimensional scaling was run on the same Bray–Curtis dissimilarity matrix as described above (nMDS; vegan package, Oksanen et al., 2022). To validate the nMDS ordination fit, the method of permutation-based ecological null models (Dexter et al., 2018) was followed (Figure S2), using the R code provided by Dexter et al. (2018) for the oecosimu function of the vegan package.
3 Results
3.1 Spatio-temporal changes in fish abundance and biomass
3.1.1 Indicator surveys
Whilst overall fish biomass and its variance did not change during the study period (Figure 2B; Tables S7, S9), overall fish abundance differed across years, with patterns varying across depths (Figure 2A). Fish abundance on shallow reefs increased by 77% between 2014 (5954 ± 1083 ind/ha, mean ± SE) and 2016 (10557 ± 1304 ind/ha, driven mainly by increases in abundance of herbivorous and omnivorous fish: Figures S3, S4), with abundance in 2016 being the highest recorded within the study period. By 2017, fish abundance had returned to pre-bleaching levels and was similar in 2018 and 2021. In 2019, abundance dropped to the lowest recorded in the study period (3677 ± 349 ind/ha), which differed significantly from fish abundance in 2014, 2016 and 2018. On deep reefs, pre-bleaching fish abundance (2014: 5144 ± 872 ind/ha) did not differ from any of the post-bleaching years. Fish abundance in 2018 (18524 ± 5752 ind/ha) was 147%, 240% and 127% higher than in 2017, 2019 and 2021, respectively (largely driven by omnivores and piscivores [Figure S3], although changes in their absolute abundance were not significant, or could not be modelled; Figure S4, Table S7). Variances in fish abundance did not differ among years at shallow reefs, but on deep reefs variance in 2018 was higher than in all other years, except 2016 (Table S9).
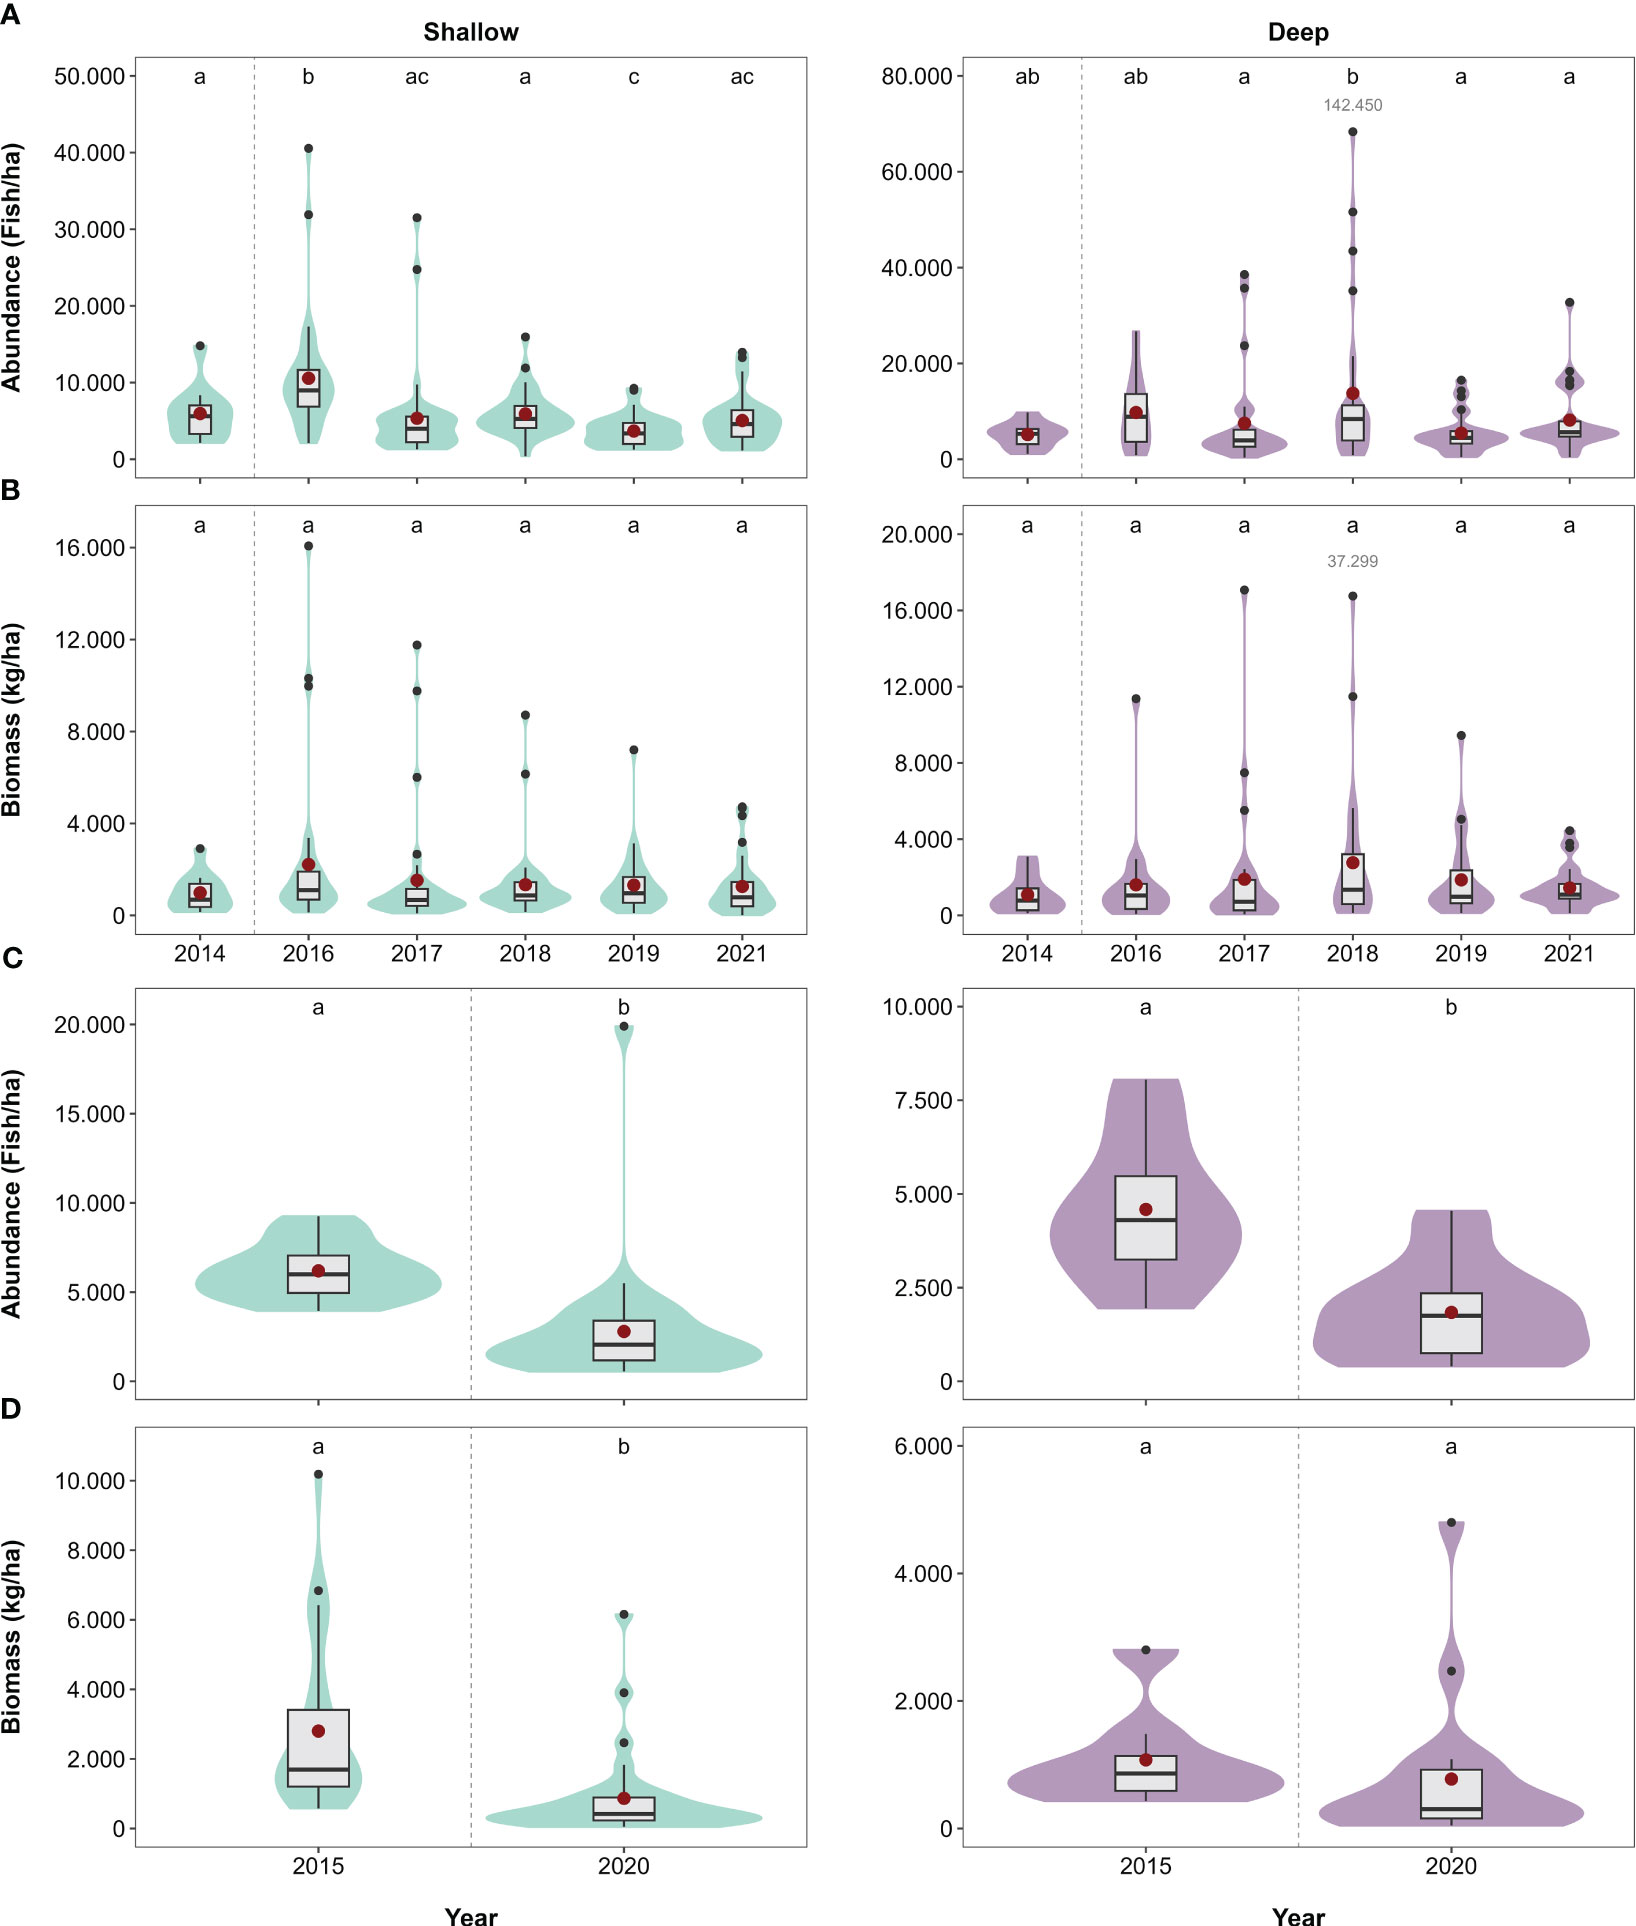
Figure 2 Overall fish abundance and biomass in kg per hectare obtained from (A, B) indicator and (C, D) extended surveys displayed as median and interquartile range (outliers: small black dots; means: larger red dots) at shallow (2–5 m depth) and deep (15 m depth) water depths at Aldabra. Shaded areas (violin plots) show kernel density estimation and represent data distribution. Letters above boxplots indicate significant differences (p < 0.05) between years (Tables S7, S8). For improved readability, very large outliers were not plotted and are shown in grey font for the respective year. Dashed line indicates the bleaching event.
Although fish biomass of functional groups fluctuated during the study period, records of the post-bleaching years (2016–2021) did not significantly differ from pre-bleaching values (2014) for any of the functional groups at any depth (Figure S5). Fluctuations were limited to the post-bleaching period, with the majority of differences being restricted to individual years without clear trends over multiple years. For example, at shallow reefs, corallivore biomass in 2016 (5 ± 1.2 kg/ha) was lower than in 2018 (11.3 ± 1.4 kg/ha), while at both depths, herbivore biomass in 2016 (534–1226 kg/ha) was higher than in 2019 (304–540 kg/ha; Figure S4). Similar differences among individual years were recorded for all other groups, except for omnivores on deep reefs, which did not change throughout the study period (Figure S5). Variances in fish biomass remained similar for all functional groups across all years at both depths (i.e., no significant Year × Depth interactions; Table S9).
3.1.2 Extended surveys
Overall fish abundance was 55% and 60% lower in 2020 than 2015 on shallow and deep reefs, respectively (shallow 2015: 6190 ± 296 ind/ha; shallow 2020: 2793 ± 618 ind/ha; deep 2015: 4587 ± 698: deep 2020: 1838 ± 299 ind/ha; Figure 2C, Table S8), with reductions being driven mainly by herbivores, planktivores, omnivores and invertivores (Figures S3, S6). Biomass differed between years at the shallow reefs (Figure 2D), where it was 69% lower in 2020 (865 ± 228 kg/ha) than 2015 (2800 ± 456 kg/ha). On deep reefs, fish biomass did not differ between 2015 (1076 ± 273 kg/ha) and 2020 (776 ± 275 kg/ha; Figure 2D, Table S8).
Fish biomass of all functional groups was higher in 2015 than 2020, except for invertivore and piscivore biomass at deep sites, which did not differ between 2015 and 2020 (Figure S7). There were no differences in variance of overall fish abundance and biomass and for all functional groups across all years at both depths (i.e., no significant Year × Depth interactions; Table S9).
3.2 Change in fish community size structure
3.2.1 Indicator surveys
The size structure of fish communities, measured as the slope and midpoint from size-spectra analysis, varied across years (Kruskal-Wallis test — slope: χ2 = 36.3, dF = 5, p < 0.001; midpoint: χ2 = 43.7, dF = 5, p < 0.001), with the slope being steeper and midpoints larger in 2016 and 2018 compared to all other years (except from the 2021 slope, which had a value that did not differ from that in 2018; Figure 3A). These differences reflect the higher abundance of smaller and medium-sized fish in 2016 and 2018 and a larger community biomass, with mainly < 10 cm and 10–19 cm sized herbivores and omnivores in 2016 (shallow) and 10–19 cm sized omnivores in 2018 (deep; Figures 4A, B). The abundance of 20–29 cm sized fish was also elevated between 2016 and 2018 on shallow reefs (mainly due to herbivores and omnivores), whilst their abundance on deep reefs only differed between 2017 and 2021 due to high abundance of omnivores in 2017 (Figure 4C). Fish abundance in the 30–39 cm size class fluctuated more on the deep reefs than the shallow reefs (Figure 4D), but differences could not be assessed statistically due to poor model fit (Table S10). Abundance of fish > 39 cm did not change on shallow reefs, but on deep reefs, abundance in 2019 was more than twice as high as in 2016 and 2017 (largely due to piscivores and omnivores; Figure 4E; Table S10).
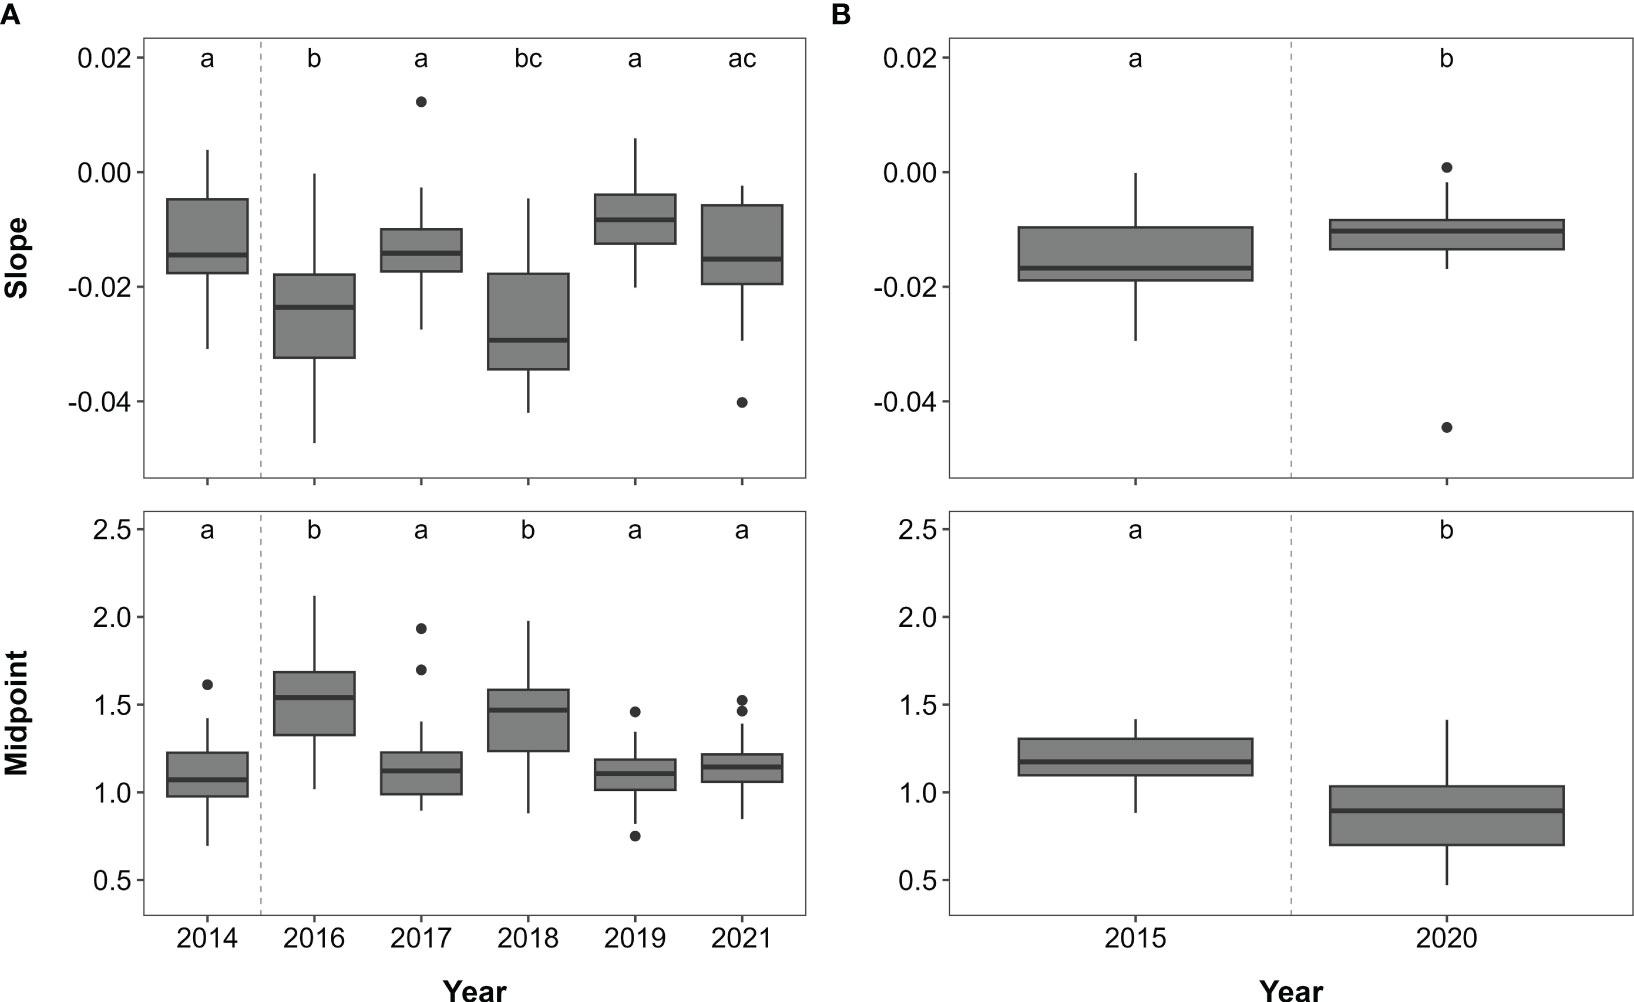
Figure 3 Slope and midpoint of size spectra of the fish assemblages per year obtained from (A) indicator and (B) extended surveys displayed as median and interquartile range (outliers: small black dots). Letters indicate significant differences (p < 0.05) between years.
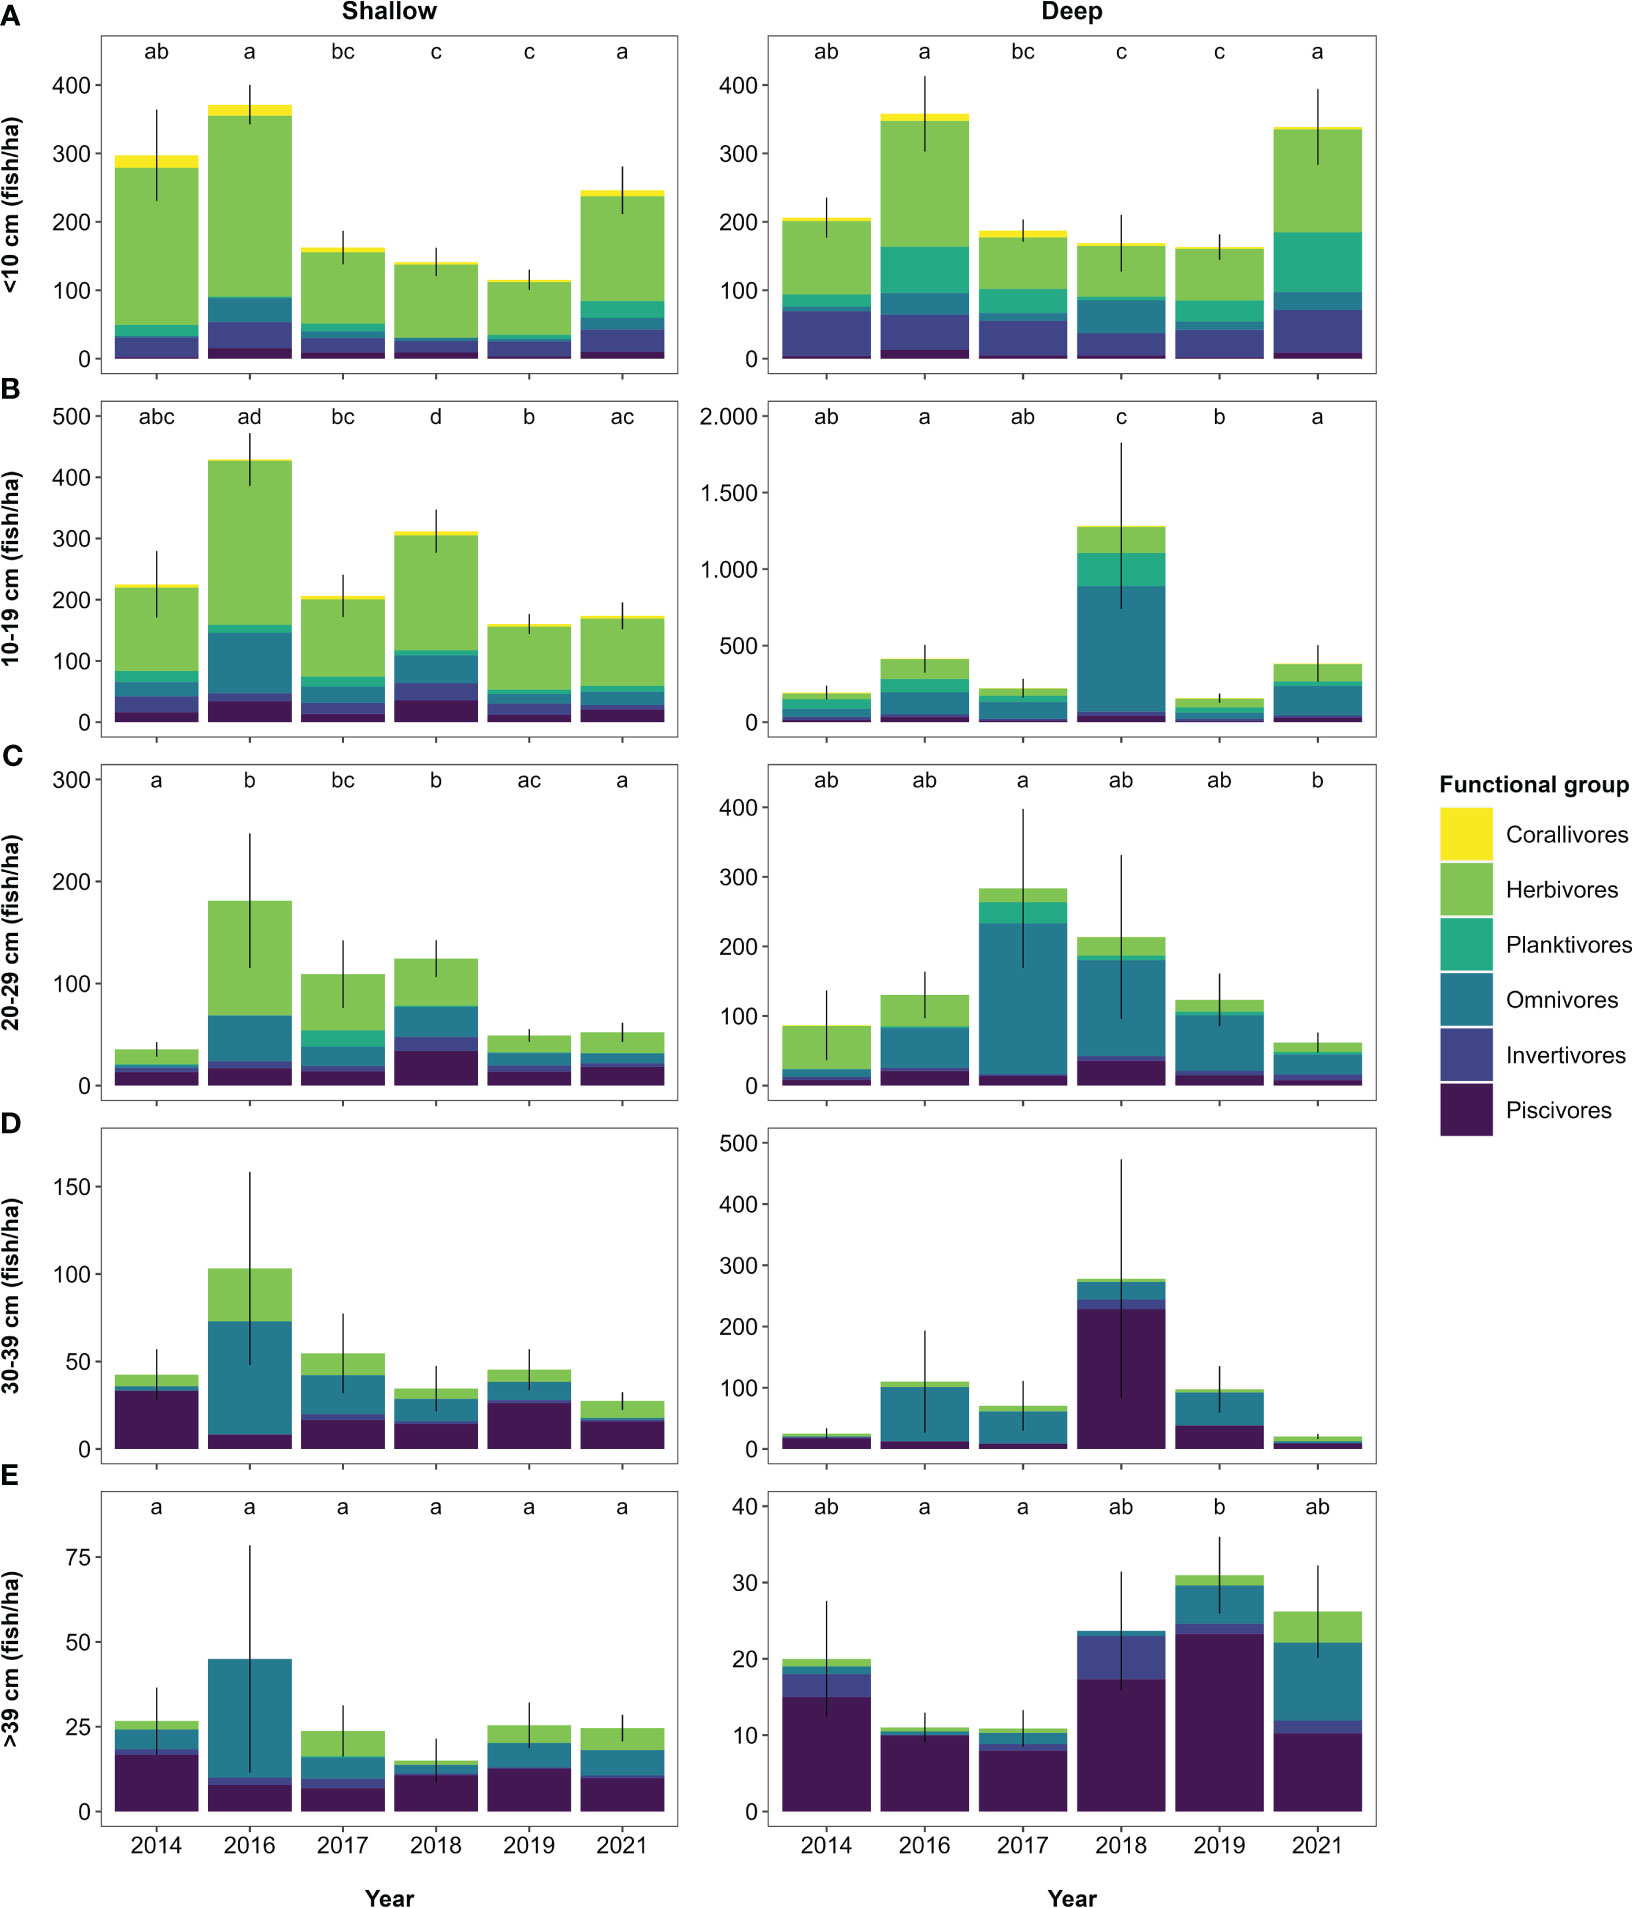
Figure 4 Fish abundance per size class (A-E) per year obtained from indicator surveys. Values represent mean abundance for each size class with error bars indicating standard error. The proportional contribution of functional groups to each size class per year is shown in coloured shades. Note the different y-axis scaling. Letters indicate significant differences (p < 0.05) between years for overall abundance per size class (Table S10).
3.2.2 Extended surveys
Slopes and midpoints of the size spectra differed, with the slope being steeper and the midpoint higher in 2015 than in 2020 (Kruskal-Wallis test — slope: χ2 = 4.9, dF = 1, p < 0.05; midpoint: χ2 = 15.7, dF = 1, p < 0.001; Figure 3B). This is reflective of higher fish biomass in 2015, largely due to higher abundance of 8–19 cm and 20–29 cm sized herbivores, omnivores and invertivores in 2015 than 2020 (Figures 5A, B). In contrast, the abundance of 30–39 cm sized fish did not differ across years at either depth (Figure 5C, Table S11). Fish > 39 cm were equally abundant on deep reefs in both years, whilst having a lower abundance on shallow reefs in 2020 (Figure 5D).
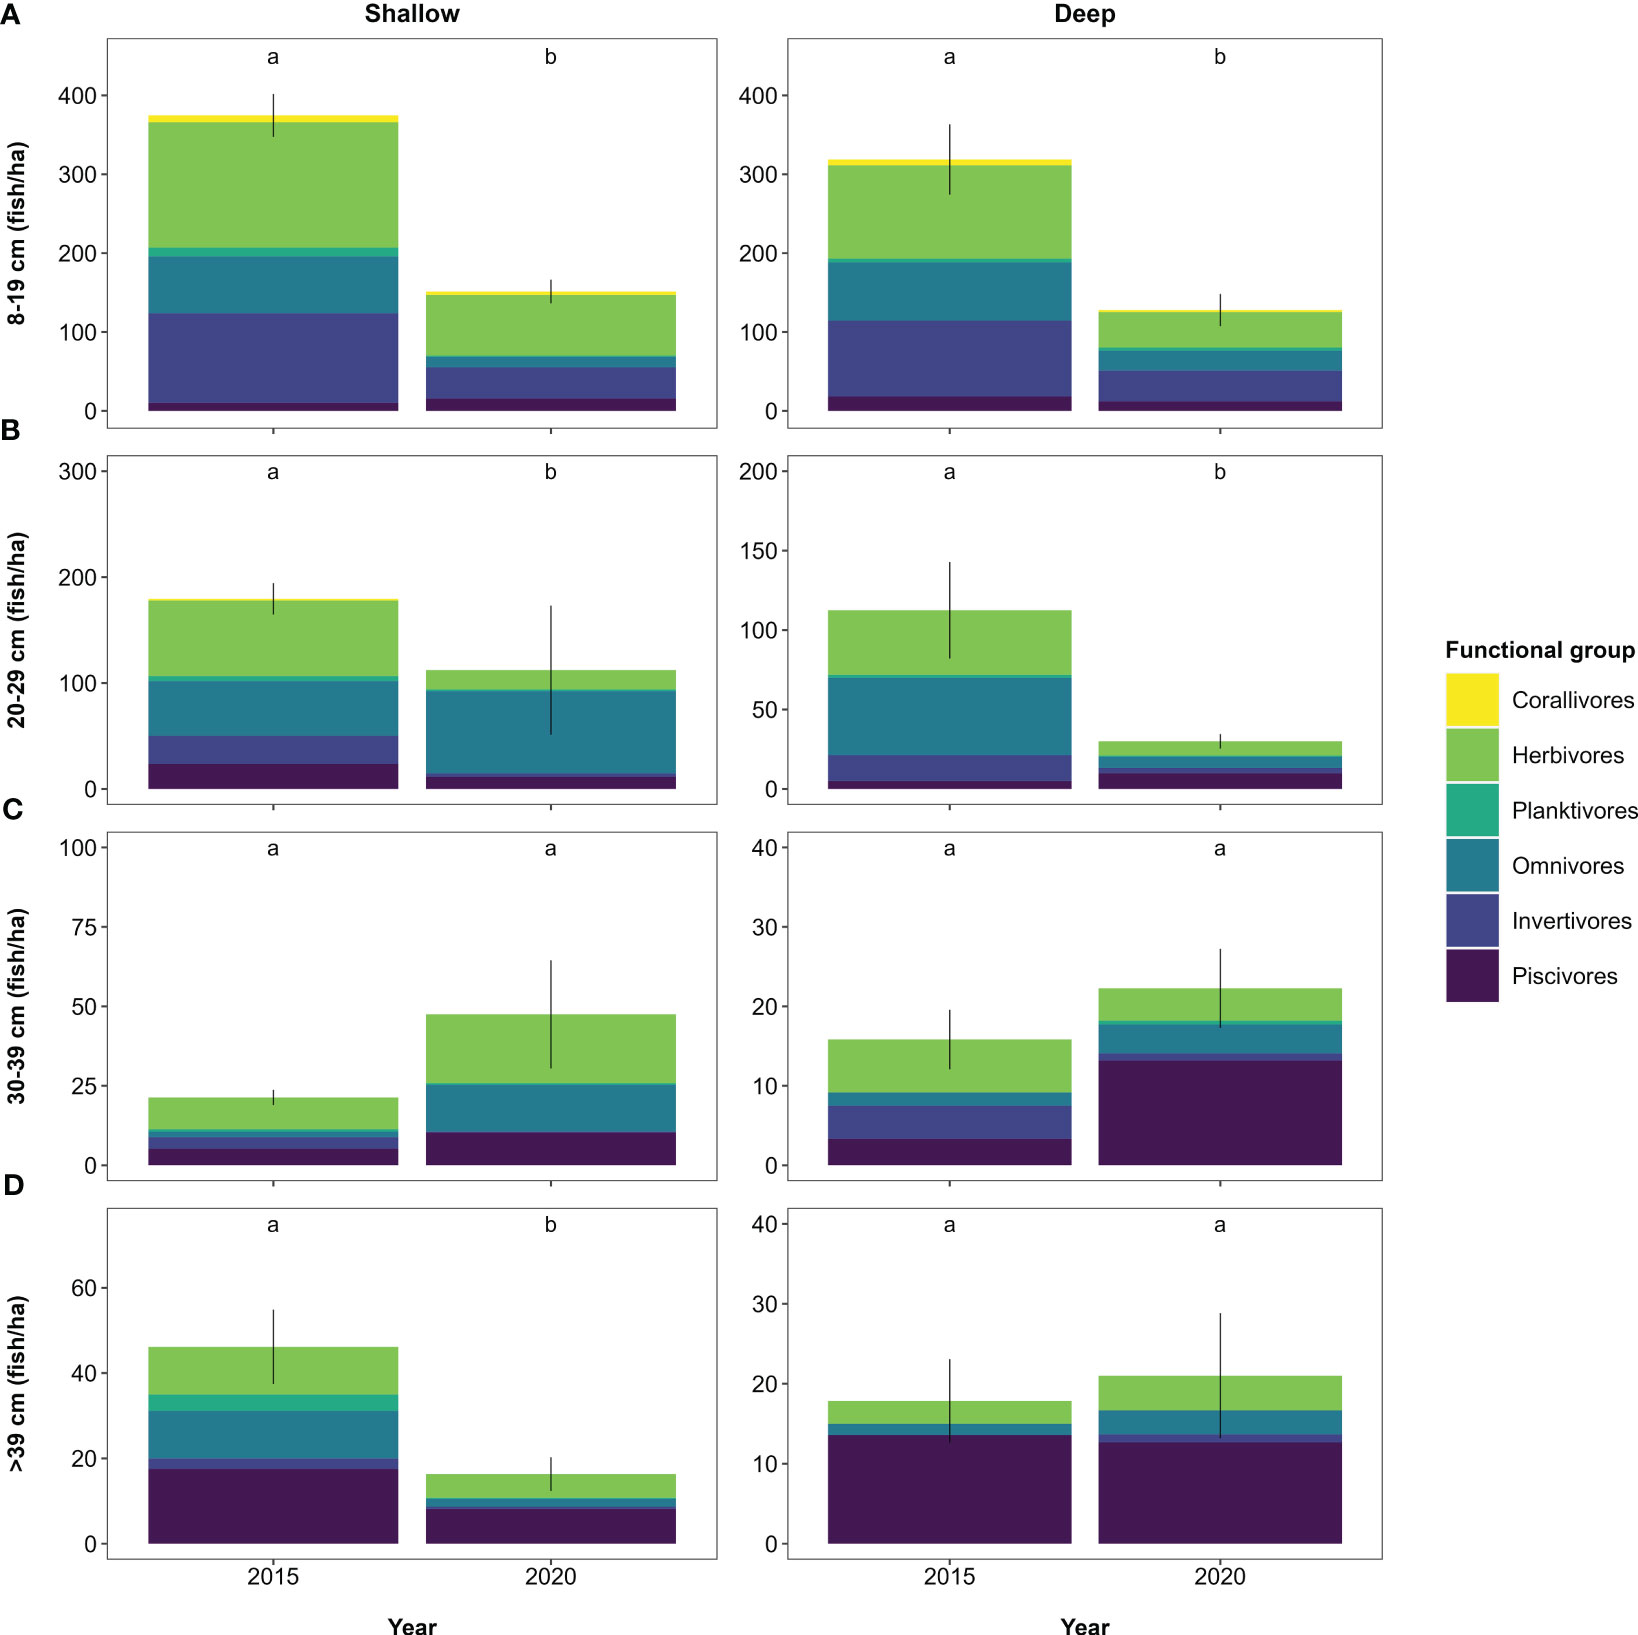
Figure 5 Fish abundance per size class (A-D) per year obtained from extended surveys. Values represent mean abundance for each size class with error bars indicating standard error. The proportional contribution of functional groups to each size class per year is shown in coloured shades. Note the different y-axis scaling. Letters indicate significant differences (p < 0.05) between years for overall abundance per size class (Table S11).
3.3 Change in community composition
3.3.1 Indicator surveys
Community composition differed among years (ANOSIM: p = 0.001), but with low overall dissimilarity (global R = 0.16; Table S12). The community in 2014 differed from all other years (p = 0.001 for all combinations; Figure 6A), with largest dissimilarity between 2014 and 2018 (R = 0.38) and lowest dissimilarity between 2014 and 2021 (R = 0.19). Differences were largely driven by 16–20, mainly piscivorous, omnivorous and herbivorous taxa, which combined contributed ca. 60% to overall dissimilarity (SIMPER; Table S13). Ten taxa (Acanthurus sp., Ctenochaetus sp., Lutjanus bohar, other grouper, other parrotfish, other snapper, other soldierfish, other triggerfish, Plectorhinchus albovittatus and Variola louti) consistently contributed to the differences between 2014 and all other years (Table S13).
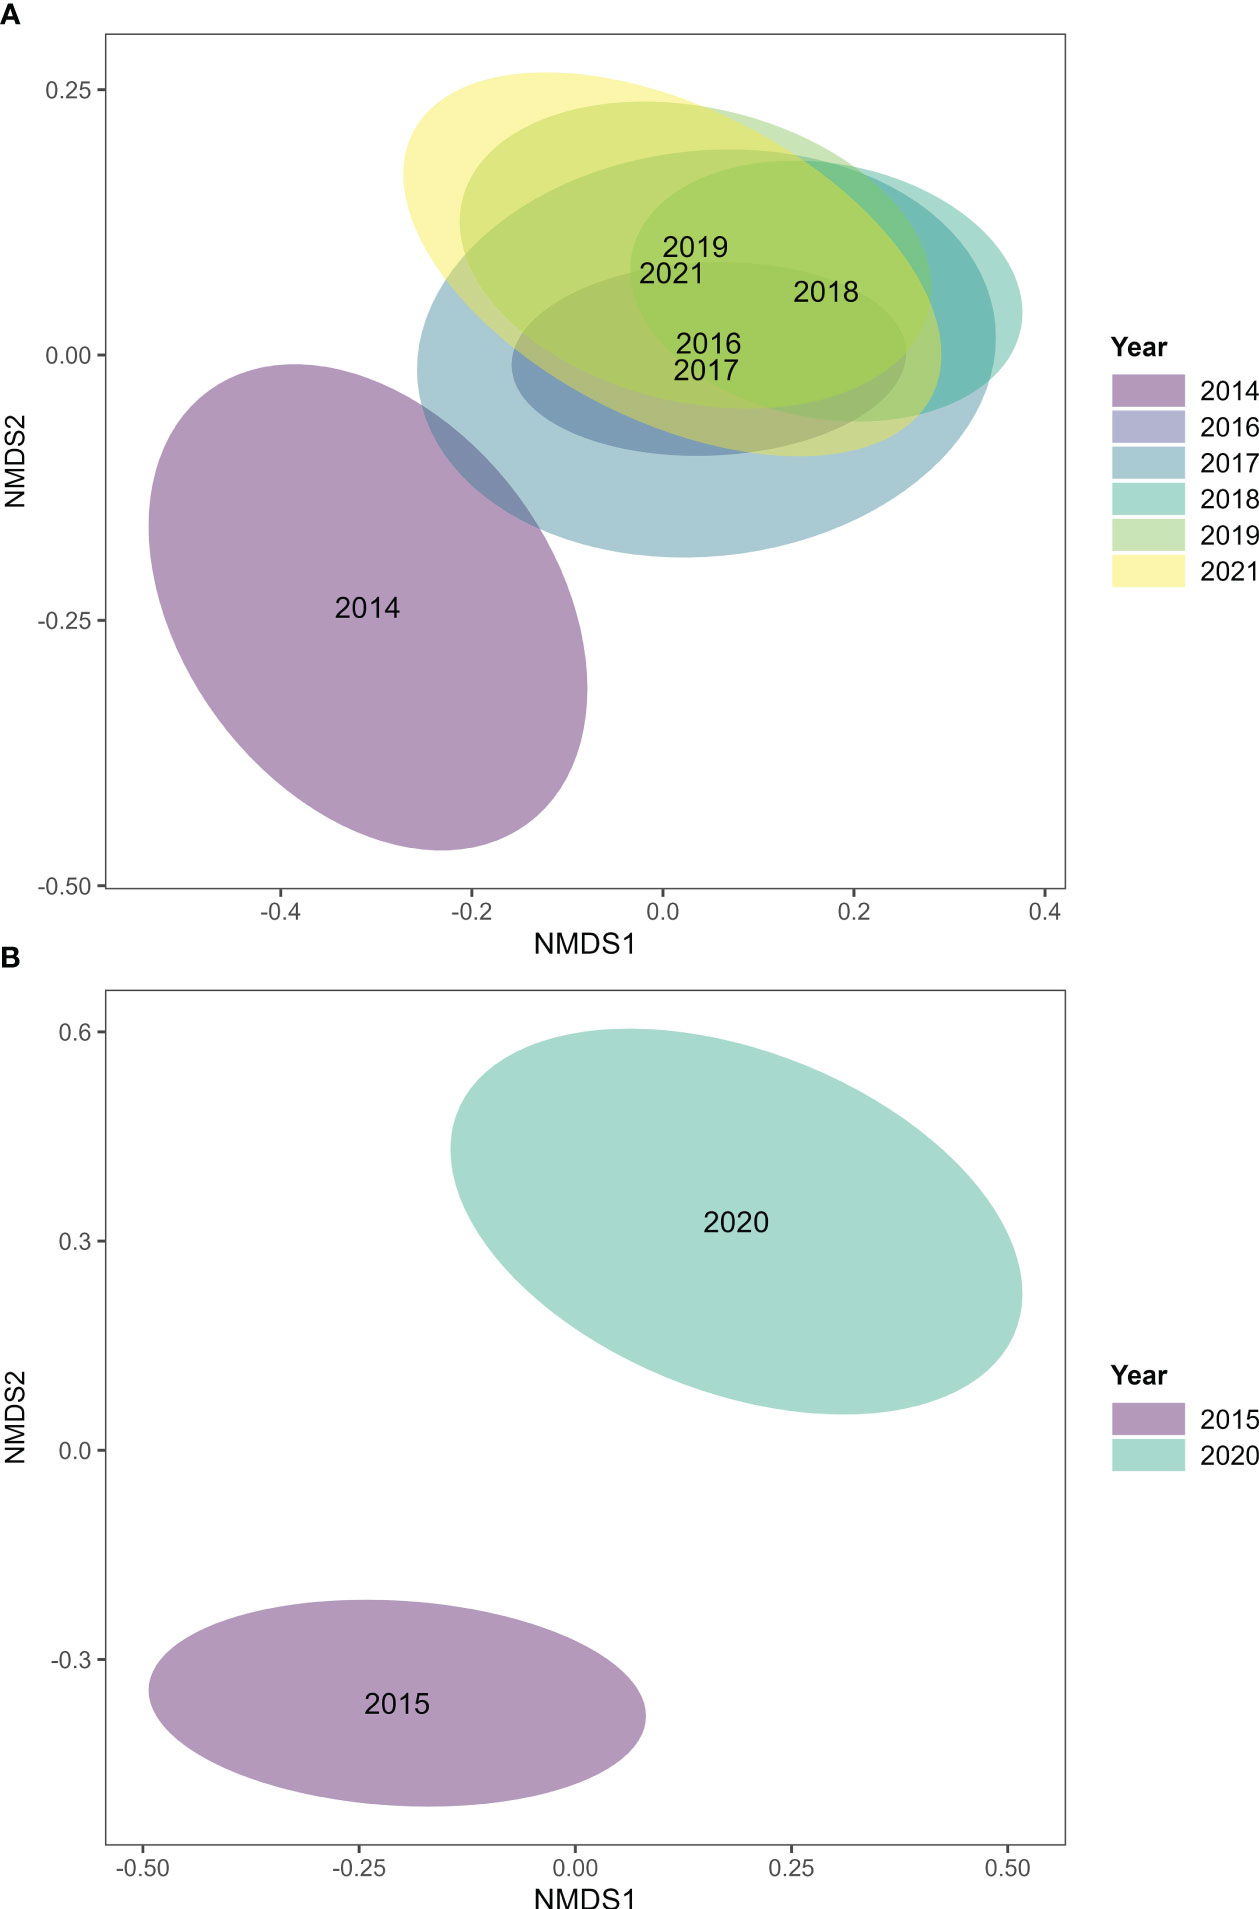
Figure 6 Non-metric multidimensional scaling (nMDS) of (A) fish communities in 2014, 2016–2019 and 2021 (indicator data set) and in (B) 2015 and 2020 (extended data set). Labels of years in the plots indicate annual centroids, shaded areas indicate 95% confidence regions. To improve readability, overlapping labels (2016, 2017) in (A) where manually moved apart. Permutation-based ecological null models were used to validate the nMDS ordination fit (see Methods and Figure S2).
The variability of fish assemblages across sites was similar in each year, i.e., there were no differences in multivariate dispersion across years (PERMDISP: p = 0.2, F = 1.7).
3.3.2 Extended surveys
Fish community composition in 2020 differed from 2015 (ANOSIM: global R = 0.29, p = 0.001; Figure 6B). This was largely driven by 45 taxa (mainly herbivores, omnivores and piscivores) that combined contributed 60% to the overall dissimilarity between 2015 and 2020 (SIMPER, Table S14). In addition, the variability in fish assemblages across sites was larger in 2020 than in 2015 (PERMDISP: p = 0.01, F = 6.6; mean distance to centroid ± SE: 2020 = 57.6 ± 2.3; 2015 = 50.9 ± 1.4; Figure 6B).
4 Discussion
4.1 Immediate effects of bleaching
Prolonged periods of elevated water temperatures during 2014–2017 caused unprecedented thermal stress to reefs worldwide (Lough et al., 2018), resulting in widespread and severe coral bleaching and mortality (Eakin et al., 2019), and, at Aldabra, a 50% reduction of overall hard coral cover (Cerutti et al., 2020; Koester et al., 2020). The six-year indicator fish data set we present here shows that whilst absolute fish biomass did not differ between 2014 and 2016, absolute fish abundance increased by 77% on shallow reefs, fuelled largely by increases of small (< 20 cm) and medium (20–29 cm) sized herbivorous and omnivorous fish. This has been reported elsewhere (Lindahl, 2001; Sheppard et al., 2002; Robinson et al., 2019), and is likely due to the elevated turf algae cover at Aldabra’s reefs following the bleaching event (Koester et al., 2020; Figure S8) and the associated increases in habitat homogeneity, which may benefit generalist species (Wilson et al., 2008; Pratchett et al., 2012). In contrast, other functional groups, most notably corallivores, which utilise live corals for food, were not immediately affected in terms of absolute biomass or proportional abundance. Typically, corallivores are heavily affected by the loss of live corals (Wilson et al., 2006; Graham et al., 2007), but magnitude and duration of responses can vary substantially within and among species and locations, indicating that the abundance of corallivores is not always determined by live coral cover (Wilson et al., 2006).
Despite a similar loss of hard coral cover on the deeper reefs, neither fish abundance nor biomass differed between 2014 and 2016. This could suggest that, despite high loss of live coral, the remaining coral coverage and structure may still have been able to support the resident fish community, or that the fish communities at deeper reefs were more resistant to the immediate impacts of bleaching, for example by migrating to less affected areas (e.g., to water depths beyond our surveys).
4.2 Longer-term trends
Looking beyond the immediate effects of the 2015/16 bleaching event, the indicator fish data set shows constant overall fish biomass throughout 2014–2021, while overall fish abundance and biomass of functional groups fluctuated. Notably, biomass of all functional groups remained at or exceeded pre-bleaching levels in all post-bleaching years, with major variations only seen for herbivores (predominantly < 29 cm body size), whose abundance increased immediately following the bleaching event and rapidly returned to pre-bleaching levels by 2017. Herbivorous fish play an important role in reef recovery (Graham et al., 2015), and herbivore biomass is known to be a good proxy for the process of herbivory on reefs and potential for post-bleaching reef recovery (Lokrantz et al., 2008; Graham et al., 2015). A minimum threshold of 177 kg/ha herbivore biomass reduced the risk of reefs in the Inner Seychelles transitioning to fleshy algae-dominated states following the 1998 bleaching event (Graham et al., 2015), a value two to five times below Aldabra’s during 2014–2021 (means in kg/ha – 2014: 401; 2016: 970, 2017: 596, 2018: 508, 2019: 437, 2021: 597).
Previous work on Aldabra’s reefs postulated herbivory was an important driver of the rapid coral recovery during 2016–2019, when shallow reefs recovered up to 93% of their pre-bleaching coral cover (Koester et al., 2020) and coral juvenile densities at all water depths doubled or tripled (Koester et al., 2021, see also Gilmour et al., 2013). The indicator data set supports this as abundance of herbivorous fish (Figures S3, S4) and turf algae cover (Figure S8) both increased in 2016 and had returned to pre-bleaching levels by 2017. Such a rapid increase and reduction of herbivores is more likely to be caused by fish migrating to areas of increased food availability, than actual population growth and decline (Welsh and Bellwood, 2015).
In contrast, the extended data set detected marked reductions (55–69%) in overall fish abundance and biomass and functional group-specific biomass between pre-bleaching data from 2015 and post-bleaching data from 2020, accompanied by changes in the abundances of herbivores, omnivores and planktivores. A wealth of literature is available on the effects of mass coral bleaching on fish communities (e.g., Lindahl, 2001; Wilson et al., 2006; Graham et al., 2008; Pratchett et al., 2008; Robinson et al., 2019), and the results of both our indicator fish and extended datasets have similarities to these studies. As mentioned, several studies found increases in herbivores shortly following (i.e., < 3 years) coral bleaching (Shibuno et al., 1999; Lindahl, 2001; Pratchett et al., 2008), matching the trends seen in our indicator fish data. Other research showed that following an initial increase in herbivores a few months post-1998 bleaching, abundances declined several years later (Garpe et al., 2006). The majority of studies that compare data collected pre- with that collected several years ( > 3 years) post-bleaching (equivalent to our extended data set) report overall functional group and/or size-specific changes in fish abundance or biomass, i.e. declines of corallivores, fish < 30 cm size and herbivorous fish < 20 cm (Graham et al., 2007; Graham et al., 2008), increases of fish > 30 cm size (Graham et al., 2008), or increasing dominance of herbivorous fish (Robinson et al., 2019).
For both, the indicator and extended surveys, one pre-bleaching data set was available, which we took as our pre-bleaching baselines. It is therefore not possible to consider natural annual variation in fish abundance and biomass prior to the bleaching event. Spatial and temporal variations in estimates of reef fish abundance and biomass are ubiquitous and arise on scales of minutes to years, with effects varying across taxa (McClanahan et al., 2007a; Thompson and Mapstone, 2002). Potential natural sources of variation include temporal migration and actual changes of population size and structure. Several studies indicate that population size and structure of adult fish communities are largely determined by the initial community of juvenile fish that successfully recruited to a reef (Adjeroud et al., 2002; Armsworth, 2002; Shima et al., 2018). Fish recruitment, in turn, undergoes large spatio-temporal variation (Sale, 2004; Wetmore et al., 2020), governed by multiple mechanisms (e.g., environmental conditions, seasonal cycles, reef connectivity, habitat and food availability, predator abundance; (Sale, 2004; McLeod et al., 2015; Shima et al., 2018). Although surveys for this study were conducted during the same season each year (north-west monsoon), natural causes for annual fluctuations in the post-bleaching-data presented in this study cannot be excluded entirely, which represents an analytical difficulty typically faced by studies of this kind (McClanahan et al., 2007a).
In addition, sampling error (McClanahan et al., 2007a; Thompson and Mapstone, 2002) and differences in surveyor experience, the latter of which can substantially influence species richness and abundance estimates (Thompson and Mapstone, 1997; Williams et al., 2006) cause variations in estimates of reef fish abundance and biomass. Although some bias is inevitable (e.g. due to varying sea conditions), efforts to reduce sampling error generally include the standardised training of observers (which cannot entirely address differences in surveyor experience; Thompson and Mapstone, 1997; Williams et al., 2006) and conducting surveys at similar tidal states and time of day (Thompson and Mapstone, 2002; Bach and Smith, 2021). For our study, training of surveyors was standardised and surveys were only done during the daytime, well after dawn and before dusk. However, standardisation across tidal states was not always possible, and surveyor experience differed, particularly for the extended surveys, which likely also contributed to temporal variation in this data set.
Nevertheless, our findings from both datasets sit well within the context of the available literature, but they tell two very different stories when considered separately. Publishing only one of these two datasets would have told either the story of a resilient fish community, or that of substantial degradation. Instead, our study revealed that extended surveys showed changes to a well-protected and remote reef fish community that are not apparent from indicator surveys. However, in both cases, community composition was observed to have shifted, and these shifts persisted throughout the post-bleaching years which suggests that the effects of bleaching overshadowed those of natural fluctuations. It also suggests that any changes in the standard measures of abundance and biomass, which are presumably masked or not detected by the indicator dataset, are still reflected in pre- to post-bleaching community compositional shifts found by both methods. Strong and persistent shifts in fish community composition post-bleaching are widely reported (e.g. Bellwood et al., 2006; Garpe et al., 2006; Robinson et al., 2019). In particular, Bellwood et al.’s (2006) study highlighted that conventional measures (in their case, fish abundance, richness and diversity) may show limited responses to the effects of coral bleaching, despite substantial changes in community composition.
4.3 Considerations on survey methods
Restricting reef fish monitoring to indicator species, i.e., those that represent certain functions and are particularly sensitive to localised pressures or environmental changes, is practical, common practice (e.g., Reef Check: Freiwald et al., 2021, Atlantic Gulf Rapid Reef Assessments: AGGRA, 2023, programmes in the Pacific and Indian Ocean: Obura et al., 2017; Moritz et al., 2018), and may in some cases be the only option to enable surveys to be conducted at all. Despite considerable research on various aspects on fish visual census methodologies (e.g., Thompson and Mapstone, 1997; Willis, 2001; Thompson and Mapstone, 2002; Coker et al., 2017; Cheal and Emslie, 2020; Bach and Smith, 2021), no studies investigate the influence of number of target species on interpretation of results, in terms of ecosystem ecology. Since we have not done a direct comparison of methods (i.e., utilising both survey methods simultaneously in the same year), and since the extended data set only spans two years, our study cannot determine which of these methods more accurately reflects the impacts of the 2015/16 bleaching event on Aldabra’s fish communities. It is thus recommended that future studies at Aldabra assess fish communities to higher taxonomic resolution (i.e., equivalent to the extended surveys), allowing not only longer-term changes to be identified, but also spatial differences and subtler variations in taxonomic and functional composition (Cheal and Emslie, 2020). To minimise observer bias and counteract issues related to varying surveyor experience (Thompson and Mapstone, 1997; Williams et al., 2006), switching to diver-operated stereo-video surveys should be considered (Goetze et al., 2019).
5 Conclusion
In this study, we show: (1) only subtle responses of fish abundance and biomass to the 2015/16 bleaching event at Aldabra from a six-year indicator fish data set; (2) marked differences in pre- and post-bleaching fish abundance and biomass from an extended fish data set across two years; and (3) long-lasting differences in pre- and post-bleaching fish community compositions from multivariate analyses of both data sets.
Our findings pose considerable questions for SIF as the management authority of Aldabra, but are also relevant to MPA managers elsewhere. Agencies responsible for monitoring and protecting coral reefs are often resource-limited, not only with regards to funding, but also personnel, capacity and time. Ecological survey procedures thus need to be cost-effective and robust to be conducted regularly whilst yielding the data quality and resolution necessary to serve their purpose and inform management. Indicator fish surveys are commonly used to survey fish community status and changes over time, have relatively low resource demand and are easy to implement, particularly where experienced surveyors are not readily available. Nevertheless, where more extensive survey training or switching to diver-operated stereo-video surveys is possible, the additional time and effort spend on more extensive surveys or post-survey data analysis may provide managers with critical information on the wider ecological status of their coral reef systems, even if surveys can only be conducted less frequently.
Data availability statement
The datasets presented in this study can be found in online repositories. The names of the repository/repositories and accession number(s) can be found below: Figshare (DOI: https://doi.org/10.6084/m9.figshare.22792580.v1).
Author contributions
AK, NB, PH, and CW contributed to conception and design of the study. AK, NB, PH, AB, CS, LA provided project administration. PH, AB, CS, AK, LA, EN, JL, EM, MB, MW and CG-V collected and/or curated data. AK and CG-V performed statistical analysis; AK and JL created figures and tables, with significant input from SF and AF. AK, CG-V, SF, AF, PH and CW validated the analysis and results. AK wrote the first draft of the manuscript and prepared the Supplementary material. All authors contributed to the article and approved the submitted version.
Funding
The development and set-up of the Aldabra Reef Monitoring (ARM) programme was funded by the Global Environmental Facility (GEF Project ID 3925). The annual ARM surveys were funded by the Seychelles Islands Foundation. The Seychelles Islands Foundation and the University of Bremen co-funded the data analysis and write-up of this manuscript. Open Access publishing of this article was funded by the University of Bremen.
Acknowledgments
We thank the Seychelles Islands Foundation and their current and former staff members for their work and support. Specifically, we thank Jude Brice, Heather Richards, Karen Chong-Seng, Tom Mannering, Samuel Basset, Rebecca Filippin, Joel Bonne, Marvin Roseline, Leeroy Estrale, Ronny Marie, Lorraine Cook, Selwyn Laurence, Albert Belmont, Jeremy Raguain, Janske van de Crommenacker, Germano Soru, Sophie Adams, Julio Agricole, Mikael Esparon, Guilly Mellie, Jilani Suleman, Martin van Rooyen, Bruno Mels, Edward Constance, Jessica Constance, Alex Rose, Rickpert Woodcock, Frances Benstrong and Veronique Banane for support in the field. We further thank the Global Environment Facility for funding diving and research equipment and the development of the Aldabra Reef Monitoring programme. We also thank Anthony Bernard and Nick Riddin from the South African Institute for Aquatic Biodiversity and SIF staff for assistance in establishing the permanent benthic transects; and Rebecca Klaus for advice on benthic transect set-up.
Conflict of interest
The authors declare that the research was conducted in the absence of any commercial or financial relationships that could be construed as a potential conflict of interest.
Publisher’s note
All claims expressed in this article are solely those of the authors and do not necessarily represent those of their affiliated organizations, or those of the publisher, the editors and the reviewers. Any product that may be evaluated in this article, or claim that may be made by its manufacturer, is not guaranteed or endorsed by the publisher.
Supplementary material
The Supplementary Material for this article can be found online at: https://www.frontiersin.org/articles/10.3389/fmars.2023.1230717/full#supplementary-material
References
Adjeroud M., Augustin D., Galzin R., Salvat B. (2002). Natural disturbances and interannual variability of coral reef communities on the outer slope of Tiahura (Moorea, French Polynesia): 1991 to 1997. Mar. Ecol. Prog. Ser. 237, 121–131. doi: 10.3354/meps237121
AGGRA (2023) AGRRA fish survey overview. Available at: https://www.agrra.org/coral-reef-monitoring/fish-indicator/ (Accessed March 16, 2023).
Anderson M. J., Gorley R. N., Clarke K. R. (2008). PERMANOVA+ for PRIMER: guide to software and statistical methods (Plymouth, UK: PRIMER-E).
Anderson K., Pratchett M., Baird A. (2012). “Summer growth rates of corals at Lord Howe Island, Australia,” in Proceedings of the 12th International Coral Reef Symposium (James Cook University, Cairns Australia).
Armsworth P. R. (2002). Recruitment limitation, population regulation, and larval connectivity in reef fish metapopulations. Ecology 83, 1092–1104. doi: 10.1890/0012-9658(2002)083[1092:RLPRAL]2.0.CO;2
Bach L. L., Smith B. (2021). Within and between day variability in coral reef fish assemblages: Implications for fish community surveys. J. Appl. Ichthyol 37, 847–856. doi: 10.1111/jai.14267
Bellwood D. R., Hoey A. S., Ackerman J. L., Depczynski M. (2006). Coral bleaching, reef fish community phase shifts and the resilience of coral reefs. Global Change Biol. 12, 1587–1594. doi: 10.1111/j.1365-2486.2006.01204.x
Bellwood D. R., Hughes T. P., Folke C., Nyström M. (2004). Confronting the coral reef crisis. Nature 429, 827–833. doi: 10.1038/nature02691
Brooks M. ,. E., Kristensen K., Benthem K. ,. J., Magnusson A., Berg C. ,. W., Nielsen A., et al. (2017). glmmTMB balances speed and flexibility among packages for zero-inflated generalized linear mixed modeling. R J. 9, 378. doi: 10.32614/RJ-2017-066
Burt A. J. (2022). Connectivity of island ecosystems from a management and ecological perspective (Oxford, UK: University of Oxford).
Cerutti J. M. B., Burt A. J., Haupt P., Bunbury N., Mumby P. J., Schaepman-Strub G. (2020). Impacts of the 2014–2017 global bleaching event on a protected remote atoll in the Western Indian Ocean. Coral Reefs 39, 15–26. doi: 10.1007/s00338-019-01853-1
Cheal A. J., Emslie M. J. (2020). Counts of coral reef fishes by an experienced observer are not biased by the number of target species. J. Fish Biol. 97, 1063–1071. doi: 10.1111/jfb.14466
Cinner J. E., Zamborain-Mason J., Gurney G. G., Graham N. A. J., MacNeil M. A., Hoey A. S., et al. (2020). Meeting fisheries, ecosystem function, and biodiversity goals in a human-dominated world. Science 368, 307–311. doi: 10.1126/science.aax9412
Coker D. J., Nowicki J. P., Graham N. A. J. (2017). Influence of coral cover and structural complexity on the accuracy of visual surveys of coral-reef fish communities: accuracy of visual surveys. J. Fish Biol. 90, 2425–2433. doi: 10.1111/jfb.13298
Dexter E., Rollwagen-Bollens G., Bollens S. M. (2018). The trouble with stress: A flexible method for the evaluation of nonmetric multidimensional scaling. Limnol. Oceanogr. Methods 16, 434–443. doi: 10.1002/lom3.10257
Dulvy N. K., Polunin N. V., Mill A. C., Graham N. A. (2004). Size structural change in lightly exploited coral reef fish communities: evidence for weak indirect effects. Can. J. Fish. Aquat. Sci. 61, 466–475. doi: 10.1139/f03-169
Eakin C. M., Sweatman H. P. A., Brainard R. E. (2019). The 2014–2017 global-scale coral bleaching event: insights and impacts. Coral Reefs 38, 539–545. doi: 10.1007/s00338-019-01844-2
Edgar G. J., Stuart-Smith R. D., Willis T. J., Kininmonth S., Baker S. C., Banks S., et al. (2014). Global conservation outcomes depend on marine protected areas with five key features. Nature 506, 216–220. doi: 10.1038/nature13022
Freiwald J., McMillan S. M., Abbott D. (2021). Reef check california instruction manual: A guide to monitoring california’s kelp forests. 10th Edition (Marina del Rey, CA, USA: Reef Check Foundation).
Friedlander A. M., Ballesteros E., Beets J., Brown E. K., Fay J., Haupt P., et al. (2015) Biodiversity and ecosystem health of the Aldabra Group, southern Seychelles: Scientific report to the government of Seychelles. National Geographic Pristine Seas. Available at: https://media.nationalgeographic.org/assets/file/PristineSeasSeychellesScientificReport.pdf.
Froese R., Pauly D. (2022) FishBase. World Wide Web electronic publication. Available at: www.fishbase.org.
Garpe K., Yahya S., Lindahl U., Öhman M. (2006). Long-term effects of the 1998 coral bleaching event on reef fish assemblages. Mar. Ecol. Prog. Ser. 315, 237–247. doi: 10.3354/meps315237
Gilmour J. P., Smith L. D., Heyward A. J., Baird A. H., Pratchett M. S. (2013). Recovery of an isolated coral reef system following severe disturbance. Science 340, 69–71. doi: 10.1126/science.1232310
Goetze J. S., Bond T., McLean D. L., Saunders B. J., Langlois T. J., Lindfield S., et al. (2019). A field and video analysis guide for diver operated stereo-video. Methods Ecol. Evol. 10, 1083–1090. doi: 10.1111/2041-210X.13189
Graham N., Dulvy N., Jennings S., Polunin N. (2005). Size-spectra as indicators of the effects of fishing on coral reef fish assemblages. Coral Reefs 24, 118–124. doi: 10.1007/s00338-004-0466-y
Graham N. A. J., Jennings S., MacNeil M. A., Mouillot D., Wilson S. K. (2015). Predicting climate-driven regime shifts versus rebound potential in coral reefs. Nature 518, 94–97. doi: 10.1038/nature14140
Graham N. A. J., McClanahan T. R., MacNeil M. A., Wilson S. K., Cinner J. E., Huchery C., et al. (2017). Human disruption of coral reef trophic structure. Curr. Biol. 27, 231–236. doi: 10.1016/j.cub.2016.10.062
Graham N. A. J., McClanahan T. R., MacNeil M. A., Wilson S. K., Polunin N. V. C., Jennings S., et al. (2008). Climate warming, marine protected areas and the ocean-scale integrity of coral reef ecosystems. PloS One 3, e3039. doi: 10.1371/journal.pone.0003039
Graham N. A. J., Robinson J. P. W., Smith S. E., Govinden R., Gendron G., Wilson S. K. (2020). Changing role of coral reef marine reserves in a warming climate. Nat. Commun. 11, 2000. doi: 10.1038/s41467-020-15863-z
Graham N. A. J., Wilson S. K., Jennings S., Polunin N. V. C., Robinson J., Bijoux J. P., et al. (2007). Lag effects in the impacts of mass coral bleaching on coral reef fish, fisheries, and ecosystems. Conserv. Biol. 21, 1291–1300. doi: 10.1111/j.1523-1739.2007.00754.x
Halpern B. S. (2003). The impact of marine reserves: Do reserves work and does reserve size matter? Ecol. Appl. 13, 117–137. doi: 10.1890/1051-0761(2003)013[0117:TIOMRD]2.0.CO;2
Hartig F. (2022). Residual Diagnostics for Hierarchical (Multi-Level/Mixed) Regression Models. R package version 0.4.5. University of Regensburg, Regensburg, Germany.
Hughes T. P., Barnes M. L., Bellwood D. R., Cinner J. E., Cumming G. S., Jackson J. B. C., et al. (2017). Coral reefs in the anthropocene. Nature 546, 82–90. doi: 10.1038/nature22901
Jennings S., Polunin N. V. C. (1996). Effects of fishing effort and catch rate upon the structure and biomass of Fijian reef fish communities. J. Appl. Ecol. 33, 400. doi: 10.2307/2404761
Kawaley I. (1998). Implications of the exclusive economic zone and EEZ management for Seychelles, a small midocean island Commonwealth territory. Ocean Dev. Int. Law 29, 225–264. doi: 10.1080/00908329809546125
Koester A., Ford A. K., Ferse S. C. A., Migani V., Bunbury N., Sanchez C., et al. (2021). First insights into coral recruit and juvenile abundances at remote Aldabra Atoll, Seychelles. PloS One 16, e0260516. doi: 10.1371/journal.pone.0260516
Koester A., Migani V., Bunbury N., Ford A., Sanchez C., Wild C. (2020). Early trajectories of benthic coral reef communities following the 2015/16 coral bleaching event at remote Aldabra Atoll, Seychelles. Sci. Rep. 10, 17034. doi: 10.1038/s41598-020-74077-x
Le Cren E. D. (1951). The length-weight relationship and seasonal cycle in gonad weight and condition in the perch (Perca fluviatilis). J. Anim. Ecol. 20, 201. doi: 10.2307/1540
Lenth R. V. (2016). Least-squares means: the R package lsmeans. J. Stat. Soft. 69, 1–33. doi: 10.18637/jss.v069.i01
Lindahl U. (2001). The 1997/1998 mass mortality of corals: Effects on fish communities on a Tanzanian coral reef. Mar. pollut. Bull. 42, 127–131. doi: 10.1016/S0025-326X(00)00167-3
Lokrantz J., Nyström M., Thyresson M., Johansson C. (2008). The non-linear relationship between body size and function in parrotfishes. Coral Reefs 27, 967–974. doi: 10.1007/s00338-008-0394-3
Lough J. M., Anderson K. D., Hughes T. P. (2018). Increasing thermal stress for tropical coral reefs: 1871–2017. Sci. Rep. 8, 6079. doi: 10.1038/s41598-018-24530-9
McClanahan T. R. (2008). Response of the coral reef benthos and herbivory to fishery closure management and the 1998 ENSO disturbance. Oecologia 155, 169–177. doi: 10.1007/s00442-007-0890-0
McClanahan T. R., Graham N. A. J., Calnan J. M., MacNeil M. A. (2007b). Toward pristine biomass: Reef fish recovery in coral reef marine protected areas in Kenya. Ecol. Appl. 17, 1055–1067. doi: 10.1890/06-1450
McClanahan T., Graham N., Maina J., Chabanet P., Bruggemann J., Polunin N. (2007a). Influence of instantaneous variation on estimates of coral reef fish populations and communities. Mar. Ecol. Prog. Ser. 340, 221–234. doi: 10.3354/meps340221
McLeod I. M., Jones R. E., Jones G. P., Takahashi M., McCormick M. I. (2015). Interannual variation in the larval development of a coral reef fish in response to temperature and associated environmental factors. Mar. Biol. 162, 2379–2389. doi: 10.1007/s00227-015-2765-y
Moritz C., Vii J., Lee Long W., Tamelander J., Thomassin A., Planes S. (2018). Status and trends of coral reefs of the Pacific (Global Coral Reef Monitoring Network).
NOAA Coral Reef Watch (2023) NOAA Coral Reef Watch Version 3.1 Daily 5 km Satellite Time Series Data for Aldabra Atoll, Jan. 1, 2014–Dec. 31 (College Park, Maryland, USA: NOAA Coral Reef Watch). Available at: https://pae-paha.pacioos.hawaii.edu/erddap/griddap/dhw_5km_lon360.html (Accessed April 5, 2023).
Obura D., Grimsditch G. (2009). Resilience assessment of coral reefs: assessment protocol for coral reefs, focusing on coral bleaching and thermal stress (Gland, Switzerland: IUCN). Available at: http://cmsdata.iucn.org/downloads/resilience_assessment_final.pdf.
Obura D., Gudka M., Rabi F. A., Gian S. B., Bijoux J., Freed S., et al. (2017). Coral reef status report for the Western Indian Ocean, (2017) (Global Coral Reef Monitoring Network (GCRMN)/International Coral Reef Initiative (ICRI). doi: 10.13140/RG.2.2.20642.07366
Oksanen J., Blanchet F. G., Friendly M., Kindt R., Legendre P., McGlinn D., et al. (2022). Package vegan: Community ecology package 2.6-4.
Plass-Johnson J. G., Taylor M. H., Husain A. A. A., Teichberg M. C., ferse S. C. A. (2016). Non-random variability in functional composition of coral reef fish communities along an environmental gradient.PloS One 11, e0154014. doi: 10.1371/journal.pone.0154014
Pratchett M. S., Coker D. J., Jones G. P., Munday P. L. (2012). Specialization in habitat use by coral reef damselfishes and their susceptibility to habitat loss. Ecol. Evol. 2, 2168–2180. doi: 10.1002/ece3.321
Pratchett M. S., Hoey A. S., Wilson S. K. (2014). Reef degradation and the loss of critical ecosystem goods and services provided by coral reef fishes. Curr. Opin. Environ. Sustainab. 7, 37–43. doi: 10.1016/j.cosust.2013.11.022
Pratchett M., Munday P., Wilson S., Graham N., Cinner J., Bellwood D., et al. (2008). “Effects of climate-induced coral bleaching on coral-reef fishes - ecological and economic consequences,” in Oceanography and marine biology - an annual review. Eds. Gibson R., Atkinson R., Gordon J. (Boca Raton, USA; CRC Press), 251–296. doi: 10.1201/9781420065756.ch6
Robinson J. P. W., Wilson S. K., Jennings S., Graham N. A. J. (2019). Thermal stress induces persistently altered coral reef fish assemblages. Glob Change Biol. 25, 2739–2750. doi: 10.1111/gcb.14704
Rochet M.-J., Trenkel V. M. (2003). Which community indicators can measure the impact of fishing? A review and proposals. Can. J. Fisheries Aquat. Sci. 60, 86–99. doi: 10.1139/f02-164
Sale P. F. (2004). Connectivity, recruitment variation, and the structure of reef fish communities. Integr. Comp. Biol. 44, 390–399. doi: 10.1093/icb/44.5.390
Samoilys M., Roche R., Koldewey H., Turner J. (2018). Patterns in reef fish assemblages: Insights from the Chagos Archipelago. PloS One 13, e0191448. doi: 10.1371/journal.pone.0191448
Seychelles National Bureau of Statistics (2021) Statistical bulletin. Available at: https://www.nbs.gov.sc/downloads/mid-2021-population-estimates/viewdocument (Accessed February 14, 2023).
Sheppard C. R. C., Spalding M., Bradshaw C., Wilson S. (2002). Erosion vs. recovery of coral reefs after 1998 El Niño: Chagos Reefs, Indian Ocean. AMBIO: A J. Hum. Environ. 31, 40–48. doi: 10.1579/0044-7447-31.1.40
Shibuno T., Hashimoto K., Abe O., Takada Y. (1999). Short-term changes in the structure of a fish community following coral bleaching at Ishigaki Island, Japan. J. Japanese Coral Reef Soc. 1999, 51–58. doi: 10.3755/jcrs.1999.51
Shima J. S., Noonburg E. G., Swearer S. E., Alonzo S. H., Osenberg C. W. (2018). Born at the right time? A conceptual framework linking reproduction, development, and settlement in reef fish. Ecology 99, 116–126. doi: 10.1002/ecy.2048
Stockwell B., Jadloc C., Abesamis R., Alcala A., Russ G. (2009). Trophic and benthic responses to no-take marine reserve protection in the Philippines. Mar. Ecol. Prog. Ser. 389, 1–15. doi: 10.3354/meps08150
Thompson A., Mapstone B. (1997). Observer effects and training in underwater visual surveys of reef fishes. Mar. Ecol. Prog. Ser. 154, 53–63. doi: 10.3354/meps154053
Thompson A., Mapstone B. (2002). Intra- versus inter-annual variation in counts of reef fishes and interpretations of long-term monitoring studies. Mar. Ecol. Prog. Ser. 232, 247–257. doi: 10.3354/meps232247
Welsh J. Q., Bellwood D. R. (2015). Simulated macro-algal outbreak triggers a large-scale response on coral reefs. PloS One 10, e0132895. doi: 10.1371/journal.pone.0132895
Wetmore L. S., Dance M. A., Hill R. L., Rooker J. R. (2020). Community dynamics of fish assemblages on mid-shelf and outer-shelf coral reefs in the northwestern gulf of Mexico. Front. Mar. Sci. 7. doi: 10.3389/fmars.2020.00152
Williams I., Walsh W., Tissot B., Hallacher L. (2006). Impact of observers experience level on counts of fishes in underwater visual surveys. Mar. Ecol. Prog. Ser. 310, 185–191. doi: 10.3354/meps310185
Willis T. J. (2001). Visual census methods underestimate density and diversity of cryptic reef fishes. J. Fish Biol. 59, 1408–1411. doi: 10.1111/j.1095-8649.2001.tb00202.x
Wilson S. K., Burgess S. C., Cheal A. J., Emslie M., Fisher R., Miller I., et al. (2008). Habitat utilization by coral reef fish: implications for specialists vs. generalists in a changing environment. J. Anim. Ecol. 77, 220–228. doi: 10.1111/j.1365-2656.2007.01341.x
Wilson S. K., Fisher R., Pratchett M. S., Graham N. A. J., Dulvy N. K., Turner R. A., et al. (2010). Habitat degradation and fishing effects on the size structure of coral reef fish communities. Ecol. Appl. 20, 442–451. doi: 10.1890/08-2205.1
Keywords: fish visual census, fish community, climate change, MPA management, indicator species, biodiversity, ecosystem functions, UNESCO Marine World Heritage Site
Citation: Koester A, Gordó−Vilaseca C, Bunbury N, Ferse SCA, Ford A, Haupt P, A’Bear L, Bielsa M, Burt AJ, Letori J, Mederic E, Nancy E, Sanchez C, Waller M and Wild C (2023) Impacts of coral bleaching on reef fish abundance, biomass and assemblage structure at remote Aldabra Atoll, Seychelles: insights from two survey methods. Front. Mar. Sci. 10:1230717. doi: 10.3389/fmars.2023.1230717
Received: 29 May 2023; Accepted: 05 September 2023;
Published: 25 September 2023.
Edited by:
Bernardo Antonio Perez Da Gama, Fluminense Federal University, BrazilReviewed by:
Edson A. Vieira, Federal University of Rio Grande do Norte, BrazilAtsuko Fukunaga, University of Hawai’i at Mānoa, United States
Thierry Work, United States Department of the Interior, United States
Copyright © 2023 Koester, Gordó−Vilaseca, Bunbury, Ferse, Ford, Haupt, A’Bear, Bielsa, Burt, Letori, Mederic, Nancy, Sanchez, Waller and Wild. This is an open-access article distributed under the terms of the Creative Commons Attribution License (CC BY). The use, distribution or reproduction in other forums is permitted, provided the original author(s) and the copyright owner(s) are credited and that the original publication in this journal is cited, in accordance with accepted academic practice. No use, distribution or reproduction is permitted which does not comply with these terms.
*Correspondence: Anna Koester, YW5uYS5rb2VzdGVyQHVuaS1icmVtZW4uZGU=