 Virginia A. Gilliland1Avery E. Fessler2
 Avery B. Paxton3*†Erik F. Ebert3,4Ryan M. Tharp5†
 Brendan J. Runde6†
 Nathan M. Bacheler7†Jeffrey A. Buckel5
 J. Christopher Taylor3
- 1Biology Department, Davidson College, Davidson, NC, United States
- 2College of Food, Agricultural, and Natural Resource Sciences, University of Minnesota - Twin Cities, St. Paul, MN, United States
- 3National Centers for Coastal Ocean Science, National Ocean Service, National Oceanic and Atmospheric Administration, Beaufort, NC, United States
- 4CSS-Inc., Fairfax, VA, United States
- 5Department of Applied Ecology, Center for Marine Sciences and Technology, North Carolina State University, Morehead City, NC, United States
- 6The Nature Conservancy, Charlottesville, VA, United States
- 7Southeast Fisheries Science Center, National Marine Fisheries Service, Beaufort, NC, United States
Installations of artificial structures in coastal oceans create de facto habitat for marine life. These structures encompass wide varieties of physical characteristics, reflecting their multiple, diverse purposes and creating a need to understand which characteristics maximize fish habitat. Here, we test how physical characteristics – horizontal area, vertical relief, and spatial isolation – relate to fish density from echosounder surveys over artificial structures like concrete pipes, train boxcars, and ships purposely sunk to function as reefs. Echosounder mapping of 31 artificial reef structures and associated fish across a 200 km linear length of the continental shelf of North Carolina, USA, revealed that structures with greater horizontal area and vertical relief host higher fish densities than smaller, shorter structures. Artificial structure spatial arrangement also relates to fish density, as isolated structures are generally associated with greater localized fish densities than structures closer to one another. Patterns in the relationships between fish density and reef characteristics differed for schooling fish, as there was some evidence that reefs of intermediate area exhibited higher schooling fish density. These results suggest that intentional design and spatial arrangement of marine built structures like artificial reefs relates to and can be deliberately incorporated into siting and deployment decisions to enhance their role as fish habitat.
Introduction
Numbers of artificial structures in coastal oceans are increasing worldwide (Firth et al., 2016). In 2018, artificial structures occupied over 32,000 km2 on the global ocean floor and their extent is projected to increase to ~39,400 km2 by 2028 (Bugnot et al., 2021). These structures are installed for myriad purposes, including energy extraction (Miller et al., 2013), coastal protection (O’Shaughnessy et al., 2019), food production (Froehlich et al., 2017), and habitat enhancement (Lemoine et al., 2019). Given their diverse purposes, artificial structures come in a diversity of physical designs and spatial arrangements. Some structures, such as wind turbine foundations and oil and gas infrastructure, reach from the seafloor to above the surface (Macreadie et al., 2011; Claisse et al., 2014), whereas others, such as subsea cables, are low-profile features that run across swaths of the seafloor (Nicholls-Lee et al., 2022). Other coastal infrastructure, including seawalls, bulkheads, and piers, can extend linearly either along or orthogonal to shore and also vertically throughout the water column (Morris et al., 2018), whereas marinas mainly hug shorelines and come in a variety of sizes and configurations (Dafforn et al., 2015). When introduced to the coastal ocean, these structures form de facto habitat for marine life.
Physical characteristics of submerged structures relate to their ability – either intended or coincidental – to function as habitat for marine life (Pondella et al., 2022). For example, structures occupying greater seafloor area tend to host higher fish density compared to structures of smaller area, but only up to the point where food limitation constrains density (Bohnsack et al., 1994; Champion et al., 2015). Those structures rising tall off the seafloor tend to have higher densities of large predatory fish (Paxton et al., 2020) and invertebrates including starfish and crabs (Degraer et al., 2017). Structures with higher complexity exhibit higher fish species richness and abundance (Gratwicke and Speight, 2005), as well as increased rates of benthic productivity (Rouse et al., 2020) compared to less complex structures. Nuances exist, however, as in some settings, structures with less surface area and smaller volumes yield higher abundances of fish than those with more surface area, which may be due to the presence of smaller shelters within the structure (Paxton et al., 2017; Hylkema et al., 2020). Spatial arrangement of structures can also influence marine life. For example, isolated artificial structures tend to host fish communities characterized by higher abundance and richness (Jordan et al., 2005; Paxton et al., 2021). These characteristics can also affect population level values, such as mortality rates, which were found to be density-dependent around isolated structures, but higher and density independent on structures with less separation from one another (Overholtzer-McLeod, 2004). Relationships between fish communities and artificial structures, however, can differ based on life history traits and habitat use patterns, such as those for resident versus transient fish (Paxton et al., 2020). Given the substantial variety of built structures in the ocean, continuing to tease apart which physical characteristics maximize ecological value (e.g., as habitat) can help inform structure design and spatial planning.
Intentionally sunk structures called artificial reefs, which are deployed worldwide to enhance, mitigate, or restore habitat, embody an array of designs and spatial arrangements and thus provide an appropriate study system to test relationships between structure characteristics and habitat metrics (see recent review (Pondella et al., 2022)). Artificial reefs range from concrete modules and bridge pieces to decommissioned vessels, trains, and aircraft – each with different horizontal area, vertical extent, and spatial arrangement. Decommissioned, intentionally sunk vessels typically rise high off the seafloor but are each a single island-like structure. Concrete modules are typically low relief, and hundreds of modules can be clustered across a vast seafloor area. Some reefed objects are positioned close to existing habitats like rocky or coral reefs or other artificial structures, whereas others are placed on soft sediments devoid of other structured features. In the southeast US, artificial reefs are estimated to occupy<0.01% of the continental shelf seafloor (Steward et al., 2022).
Here, we use artificial reefs and the fish that inhabit them as a study system to test how physical characteristics of artificial structures relate to fish habitat value, measured through acoustic fish density. We ask: 1) How do horizontal area and vertical relief (height) of artificial reefs relate to fish density? 2) Does spatial isolation of artificial reefs relate to fish density? We examine these questions for all fish and for the subset of fish aggregated in schools by mapping artificial reefs and the associated fish distributions using echosounders.
Methods
We surveyed artificial structures off the coast of North Carolina (NC), USA, that were deployed as part of a state-managed artificial reef program. Under the state reef program, areas of the coastal ocean are permitted as reef zones where human-made structures can be deployed to enhance fish habitat and provide fishing and diving opportunities (North Carolina Division of Marine Fisheries, 1988). Our surveys focused on eight of these permitted artificial reef zones and the reefed structures within (Figure 1). The eight reef zones were selected because they span an approximately 200 km linear length of the NC continental shelf including three coastal ocean embayments: Raleigh Bay, Onslow Bay, and Long Bay. The reefed structures within each reef zone vary in physical characteristics, including material, horizontal area, vertical extent, and spatial arrangement. The artificial structures are primarily composed of metal (e.g., vessels, train boxcars, manhole covers) and concrete (e.g., pipes, designed modules, bridge pieces).
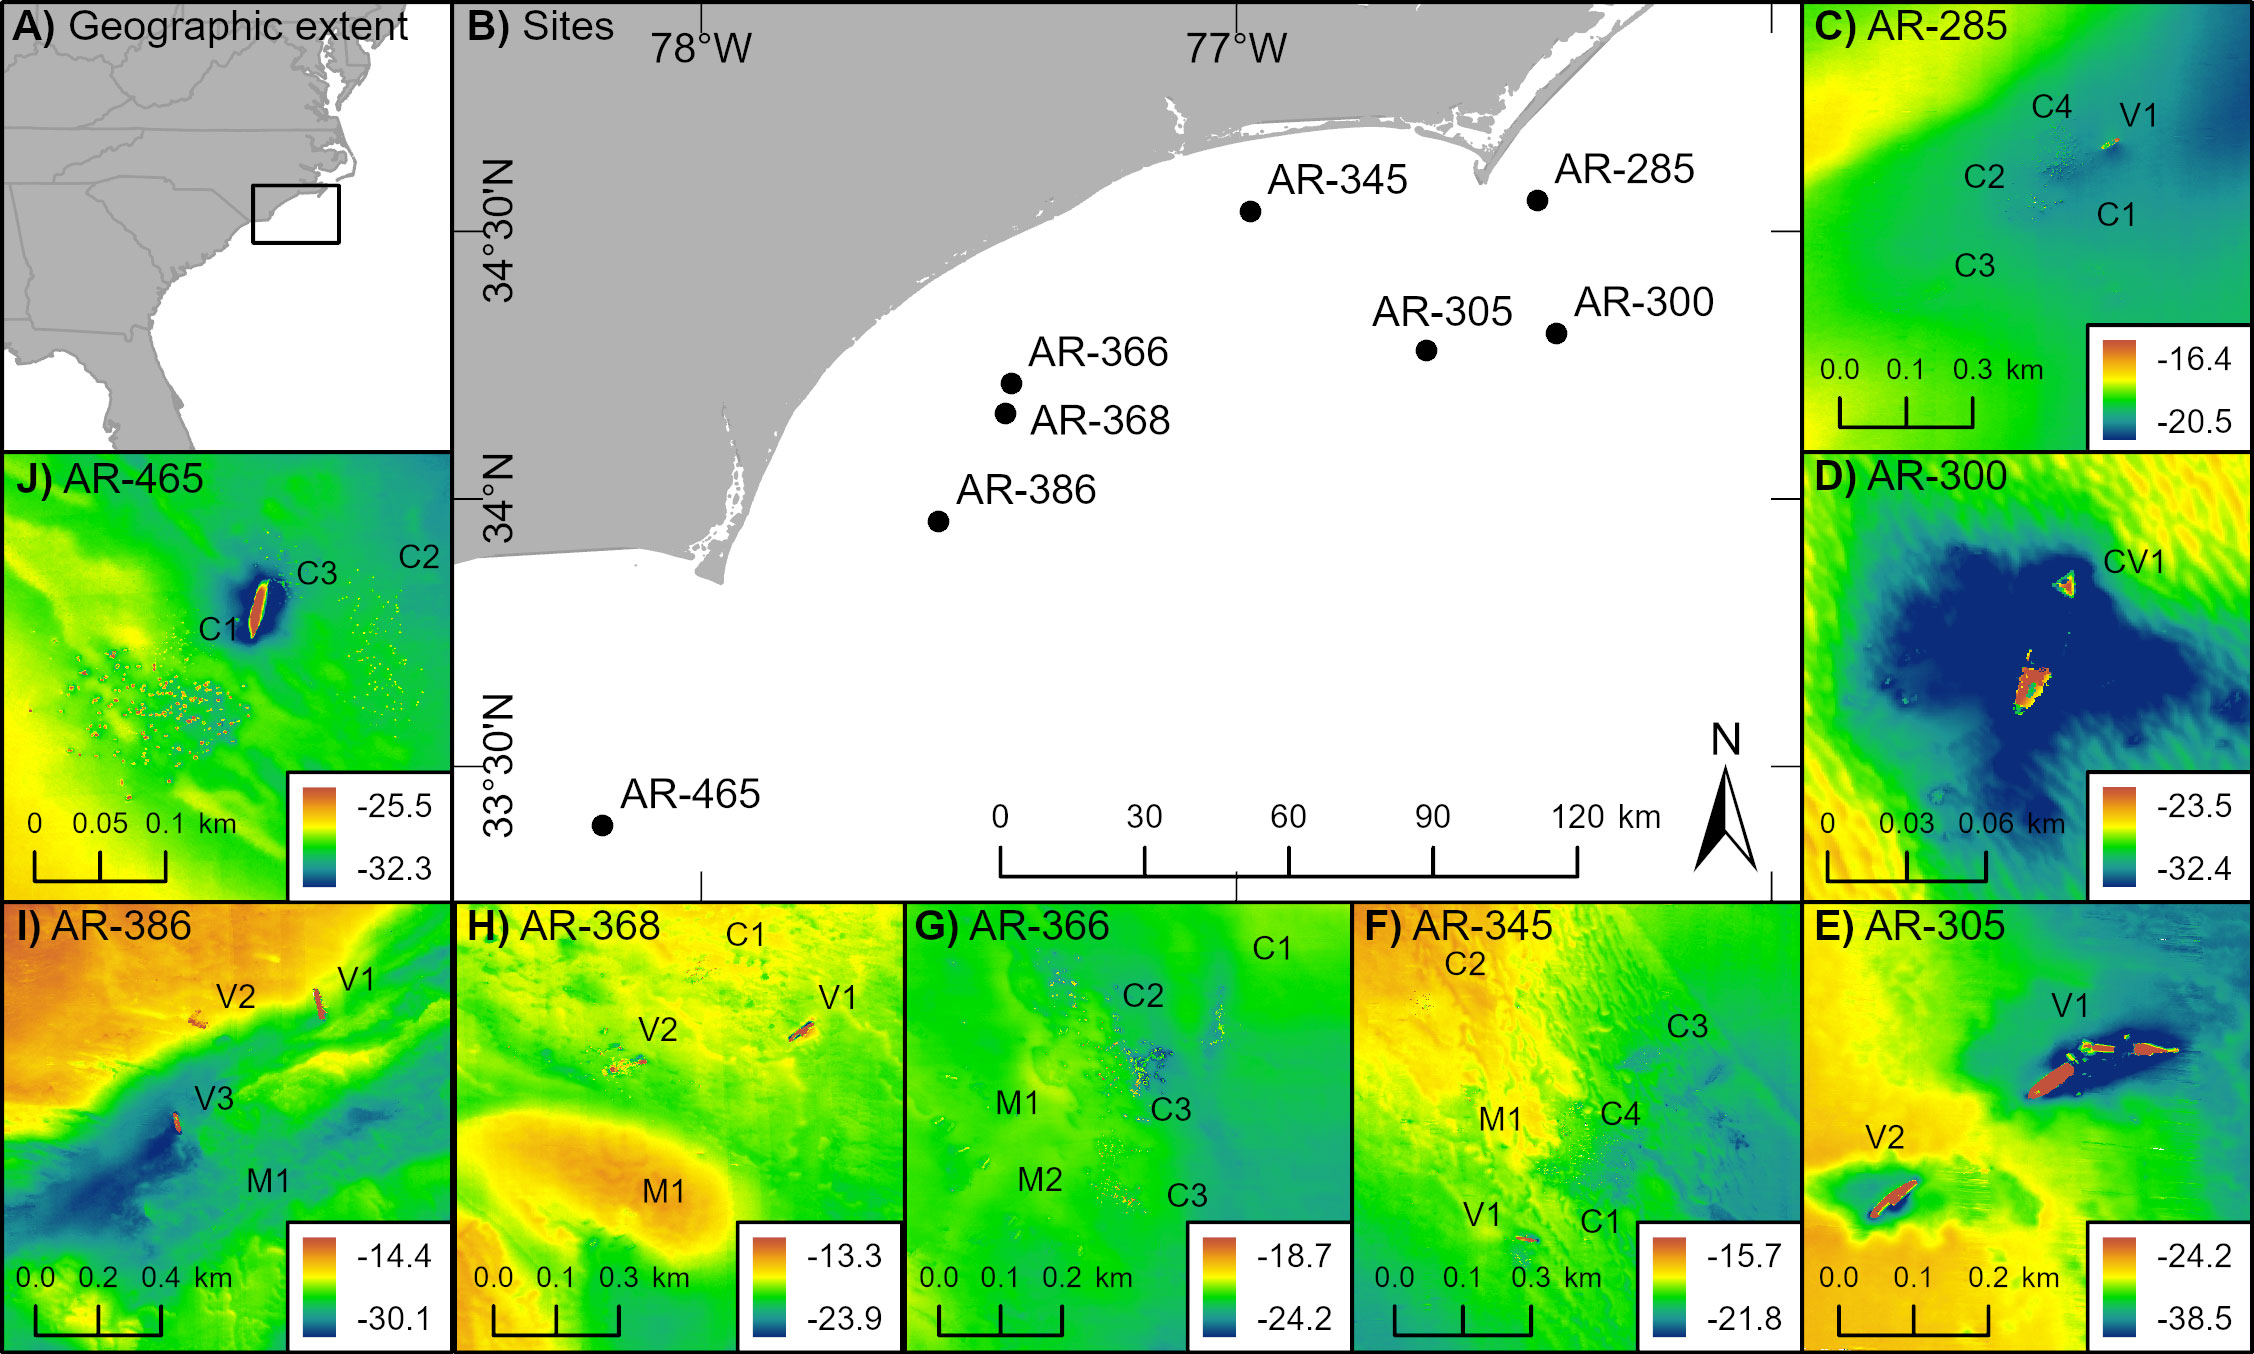
Figure 1 Locations of eight surveyed artificial reefs sites and the associated 31 reefed structures off North Carolina, USA. (A) Geographic context of study, where black square represents study scope North Carolina. (B) Artificial reef sites (e.g., AR-285) whose reefed structures were surveyed with echosounders. (C-J) Reefed structures located within artificial reef sites (e.g., C1 and C2 within AR-285). Reefed structures are named such that C = concrete, M = metal, and V = vessel; details of reefed structures are in Data S1. Labels are offset slightly so as not to obscure the structures themselves. Multibeam bathymetry is displayed in each inset, where depth is in meters.
The eight reef zones and associated reef structures were surveyed during a mission of the NOAA Ship Nancy Foster from 29 August - 3 September 2020, 18 - 26 June 2021, and 8 - 18 June 2022 using hull-mounted multibeam and splitbeam echosounders. The survey vessel speed during surveys was approximately 7 knots, and position was logged using differential GPS and an Applanix POS M/V motion sensor. All data were spatially referenced to North American Datum 1983 Universal Transverse Mercator Zone 18 North. Here, we provide survey design and data processing details for mapping reefs with multibeam echosounders and quantifying fish density with splitbeam echosounders.
Mapping artificial reefs (multibeam)
We mapped 1.5 km x 1.5 km boxes around the centroid of the permitted artificial reef zones using a multibeam echosounder. A hydrographic multibeam echosounder (Kongsberg EM2040 or Kongsberg EM710) collected multibeam bathymetry and acoustic backscatter intensity of reef zones at fine resolution (< 1 m x 1 m cell size). Exact mapping resolution was chosen to provide optimal coverage based on acoustic sounding densities and depth of the reef zone. Data were processed using hydrographic standards and corrected for changes in the speed of sound throughout the water, water level, vessel motion, and sensor location offsets.
The resulting bathymetry and backscatter were used to produce maps (e.g., raster depictions of depth and reflectance) of artificial reef structures and the surrounding soft sediments. To quantify physical characteristics of reef structures, we delineated them from the surrounding soft sediments using a segmentation and supervised classification algorithm (Costa and Battista, 2013). From the bathymetry rasters, we derived seafloor complexity rasters, including mean and standard deviation of elevation, slope, slope of slope, curvature, and rugosity. Each complexity surface metric was calculated using a 3x3 cell neighborhood retaining the same resolution as the original bathymetry raster. Selections of these rasters, and in some cases, backscatter data, were then used as inputs for principal components analysis (PCA). The PCA reduced the dimensionality of the collection of derivatives. The top three components from the PCA were assembled into a 3-band false color raster.
Using the 3-band raster, we then conducted semi-supervised object-based image classification to delineate seabed features corresponding to the artificial reef structures, differentiated from the surrounding soft sediment. For the classification, we first clipped each group of structures (e.g., solitary vessel or cluster of concrete pipes) into a smaller raster image for targeted classification and to exclude some depth artifacts due to ship motion that were evident in the flat surrounding unconsolidated sediments. We then used the ArcGIS Pro (version 2.9) “Image Classification Wizard” to create polygons corresponding to the different reef structures. Parameters for image segmentation were as follows: spectral detail (15.50), spatial detail (15), and minimum segment size (5 pixels). Training parameters were set as follows: classifier (ISO cluster) and maximum number of classes (12 - 15). Different classes were then assigned to denote artificial reef structures versus the seafloor (soft sediment). In cases when more than one type of reef structure were present, multiple image classes were assigned (e.g., metal, concrete) based on locations of known reef structure deployments. The classified reef structures were then converted from raster to polygon, and polygons were manually edited to ensure that seafloor was not accidentally included in the reef polygon and to remove data gaps (e.g., data gap from poor sea conditions).
From the delineated reef structure polygons, we calculated their physical characteristics. First, we categorically designated spatial arrangement as either solitary (e.g., one ship) or clustered (e.g., 100 tons of concrete pipe sometimes with sand in between). These clustered structures were scattered with a relatively large proportion of sand between them. For example, a cluster may include 100 tons of concrete pipe that were deployed off a barge by the state-run reef program such that structures are separated by sand; in rare instances structures may have been deployed so that they are touching each other without sand in between. We then calculated the horizontal area (in m2) and vertical extent or relief (difference between minimum and maximum elevation in m) of each solitary structure. In cases with clustered structures like fields of concrete modules, we calculated the total area and maximum vertical extent of aggregate polygons within the structure grouping. The deepest point and shallowest point for reef structures were those inside of the solitary or clustered polygons. We also calculated the degree of isolation between reef polygons as the distance (m) to the next nearest solitary or clustered grouping of reef structures.
Quantifying fish density (splitbeam)
Bathymetry of each artificial reef zone was used onboard the survey vessel to select three to four artificial reef structures – either solitary or clustered – in each reef zone for targeted splitbeam echosounder transects to quantify fish density from dawn to dusk. A single transect circa 1000 m long was followed along the major axis of each selected reef structure using splitbeam echosounders (Kongsberg Simrad EK60 with EK80 software; 7-degree beam angle). The echosounders operate at three frequencies and corresponding pulse lengths (38 kHz – 0.256 μs, 120 kHz – 0.128 μs, 200 kHz – 0.128 μs). Because multibeam echosounder data were also logged opportunistically during splitbeam surveys, we set splitbeam ping emissions to trigger from multibeam transmission to reduce interference among echosounders. Splitbeam transducers were calibrated for backscatter response using standard methods (Demer et al., 2015).
We processed the 120 kHz frequency of splitbeam transect data using Echoview version 12.1 (Echoview Software Pty Ltd, 2020) to quantify relative fish density around artificial reef structures. Since transect lengths varied (~1000 m) and we wanted to quantify fish density close to the artificial reef structures, we standardized and subset transects to 200 m in length (100 m on either side of reef structure midpoint within the echogram). More specifically, subsetting transects along the survey vessel track to include 100 m on either side of the reef structure midpoint helped ensure that fish on transects were located within 100 m of reef structures. We selected 100 m on both sides of the structure midpoint based on previous observations from artificial reefs in the same geographic area that fish use an area ~90 m from reef structures (Rosemond et al., 2018). Given that the transects were 200 m long and that the splitbeam transducer beam angle was 7 degrees, transect widths ranged from ~4 m wide (on shallow sites, 18 m) to ~ 8 m wide (on deep sites, 35 m). Therefore, transect areas ranged from 800 m2 to 1600 m2. Reef structure area, on the other hand, ranged from 215 m2 to 7,394 m2 so in some instances may have occupied small proportions of the transect. The exact amount of reef structure within the transect (e.g., within the beam footprint) was not quantified because of uncertainty in the beam offset (e.g., the exact location above the seafloor that the beam ensonifies).
For each subsetted 200 m transect (hereafter “transect”), we first applied bottom and surface exclusion algorithms to define the water column area where we would calculate relative fish density. The bottom detection algorithm delineated the seafloor and artificial reef structures. This algorithm, however, does not perform well around complex seafloor features like artificial structures, so we manually corrected the bottom line delineation referencing the multibeam bathymetry. The surface detection algorithm (typically 5 m below water surface) and manual corrections identified noise from bubbles created by poor sea surface conditions so that these noise artifacts could be removed from further analyses. We then used a fish tracking algorithm to classify sequential acoustic targets as discrete fish (Echoview Alpha-Beta fish tracking algorithm) and a school detection algorithm to delineate fish schools (Barange, 1994). Data for detected individual fish and fish schools were exported from Echoview in cells measuring 100 m (horizontal) x water column (vertical, depth) and a threshold of -60 dB.
Exported data were processed in R version 4.0 (R Core Team, 2020) to calculate relative fish density over each transect. Specifically, we used nautical area scattering coefficient (NASC) as a surrogate for relative fish density (Simmonds and MacLennan, 2005). NASC is a measure of backscatter, scales positively with fish abundance, and has units of m2 nmi-2 (Maclennan et al., 2002; Simmonds and MacLennan, 2005). We calculated NASC for all fish in each transect; we refer to this metric as overall fish density. We also averaged NASC for each discrete school identified in a transect; we refer to this metric as fish school density. Both overall fish density and fish school density are measures of relative density. Our decision to differentiate between all fish and schooling fish was based on inherent challenges of identifying fish to species level in echosounder data. Namely, the fish community on reefs in this geographic region is characterized by high diversity, and without visual observations, we are unable to provide reliable identification of fish to low taxonomic levels (Paxton et al., 2019).
Data analyses
We evaluated relationships between reef physical characteristics and overall and schooling fish density using generalized additive models (GAMs). We used GAMs because this type of regression model can fit non-linear relationships between predictor and response variables using local smoothers (Wood, 2017). We built models with response variables for overall fish density (NASC on 200 m transects) and schooling fish density (NASC from fish schools with midpoint within 200 m transects; removed transects without schools). For the schooling fish density model, we removed transects without schools; we wished to examine which characteristics of reefs resulted in greater densities of schooling fish given that schooling fish were present at all. We log transformed the response variables for all relative fish density (log(NASC all fish)) and schooling relative fish density (log(NASC schooling fish)) so that these variables approximated normal distributions; we used a Gaussian error distribution for modeling because this error distribution fit best using the ‘gam.check’ function model diagnostics. In five instances, we sampled a transect multiple (2-3) times in a given year (i.e., the same mission); in these instances, we averaged the overall fish density and schooling fish density values across the replicate transects and used these average values for analysis.
Predictor variables included three continuous variables: reef vertical relief (m), reef horizontal area (m2), and degree of reef isolation (m to nearest reef). To account for temporal variation in fish density, we included the year during which the reefs were sampled (2020, 2021, 2022) as a categorical function. We fit candidate models using the ‘mgcv’ package (Wood, 2011) in R. During model building, we also considered inclusion of several other variables in the models. We tested the inclusion of reef material (concrete or metal) but removed this categorical variable since it is confounded with both vertical relief and area, as metal reefs typically have higher vertical relief and cover a smaller area than concrete reefs (Figure S1). By excluding material from the model, this allowed us to focus on the underlying mechanisms of interest, such as relief, area, and isolation. We also tested a model including depth as a continuous predictor variable, but given the narrow depth range (18.0 – 34.7 m) and lack of apparent pattern between depth and fish density, we also excluded depth from the models. We considered including reef zone (e.g., AR-345, AR-366) in candidate models as either a fixed or random effect; however, given that relief and reef zone were confounded and that relief was a primary variable of interest, we excluded reef zone from consideration. We also considered modeling year as a random effect instead of a factor, but when we ran an ad hoc model with year as a random effect, the results were functionally identical to the model in which it was a factor.
Our full GAM for all fish was:
Our full GAM for schooling fish was:
Transects without discrete fish schools were removed from the analysis. For all fish and schooling fish, we compared full models to reduced models that contained fewer predictor variables (e.g., full model without area, full model without isolation and area, etc.). Model selection from the full model and more parsimonious reduced models was conducted using Akaike information criterion (AIC) values based on minimum AIC (Burnham and Anderson, 2004). If two models had close AIC values (e.g., within two units of each other), they were generally considered indistinguishable; in these cases, chose to retain variables of ecological interest rather than exclude them. We obtained model predictions of mean relative fish densities and associated 95% confidence bounds for combinations separately for predictor variables using the ‘predict’ function. When a predictor variable was not of interest but still necessary for the model predictions (i.e., a covariate), it was predicted using its mean value from the dataset. We evaluated the relative influence of predictor variables on relative fish density by quantifying the deviance explained by reduced GAMs with just the predictor variable of interest. We also ran intercept only models to compare against our full models using AIC.
Results
Acoustic mapping of 31 artificial reef structures and associated fish across a linear 200 km region off the coast of North Carolina, USA (depth range 18.0 – 34.7 m) revealed that both reef extent – vertical relief and horizontal area – and spatial arrangement relate to fish density. Reef structures with greater vertical relief and horizontal area tended to host higher fish densities than shorter, smaller structures (Figures 2A, B). Relationships between spatial arrangement, as measured by degree of isolation, and fish density exhibited nuances (Figure 2C). In general, more isolated structures tended to exhibit higher relative densities of fish than structures nearer to one another. These relationships were based upon data collected over 61 sampling transects spanning eight artificial reef zones (e.g., AR-285) and 31 reef structures (e.g., concrete pipes at AR-285) for which the range of relative fish density (NASC) was 150.03 m2 nmi-2 to 214,900.80 m2 nmi-2. Reef relief ranged from 0.38 m to 15.03 m, and area from 216.00 m2 to 7,393.85 m2. The most isolated reef was 266.08 m from the nearest artificial structure.
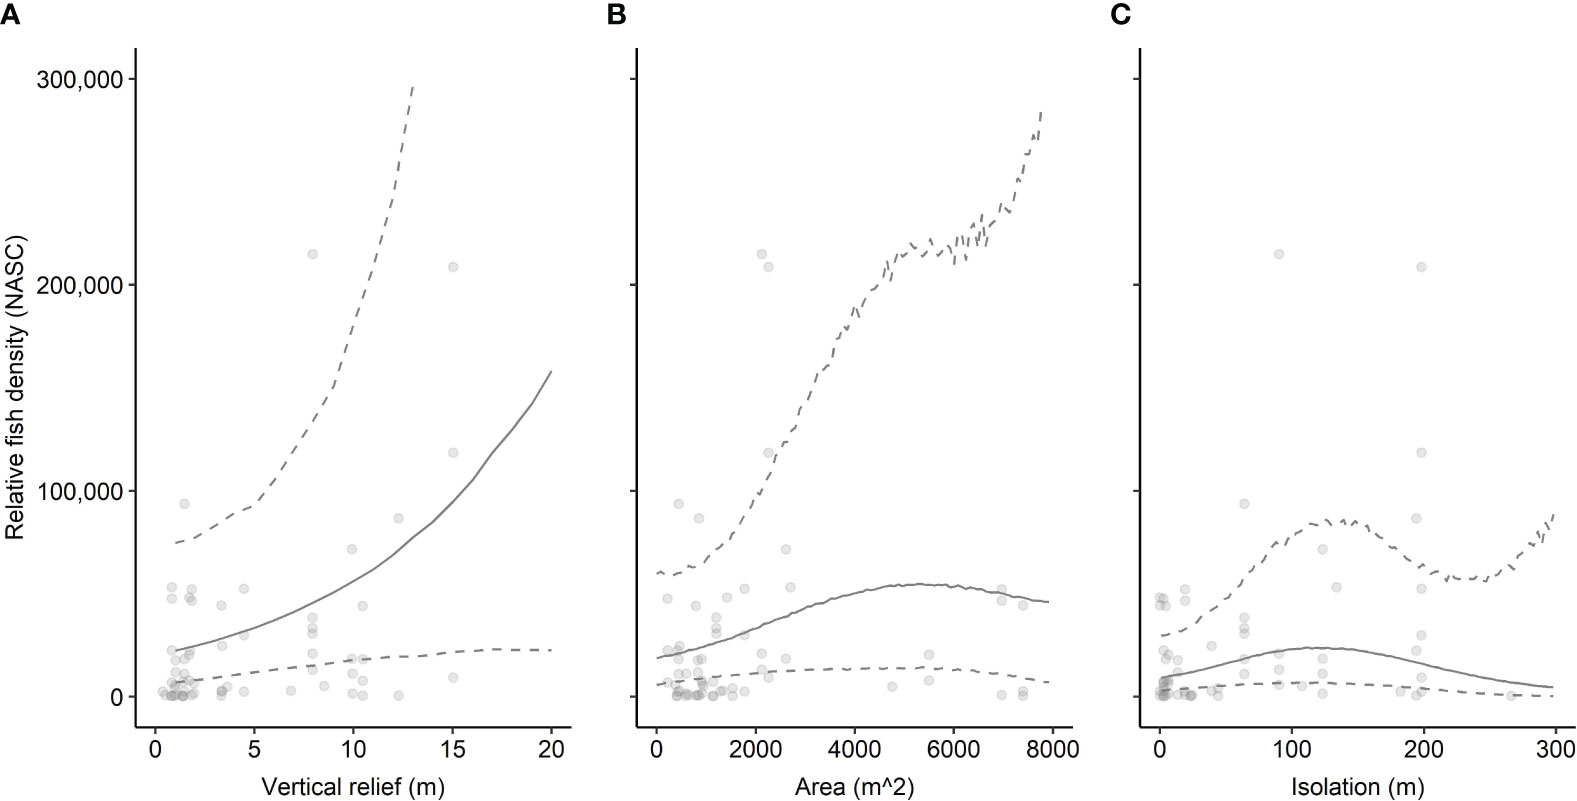
Figure 2 Relationship between relative fish density (NASC [m2 nmi-2]) and reef characteristics for all fish and (A) vertical relief (m), (B) horizontal area (m2), and (C) degree of isolation (m to nearest reef). Points represent observed data. Solid lines indicate model-predicted mean fit. Dashed lines represent upper and lower 95% confidence intervals. Mean fit and confidence intervals were predicted from the GAM that included relief, area, isolation, and year sampled as predictor variables and log-transformed NASC as the response variable for all fish. Predicted values have been exponentiated in the figure so they can be displayed on the same scale as observed NASC.
The full model of the relationship between relative fish density and reef predictor variables – vertical relief, horizontal area, spatial isolation, and sampling year (2020, 2021, 2022) – explained 28.0% of the deviance in fish density (Table 1A). Examinations of individual predictor variables indicated that isolation explained the highest portion of deviance (20.9%), followed by area (16.2%), vertical relief (10%), and sampling year (7.5%) (Table 2). A reduced model without isolation had a slightly lower AIC value than the full model. Indeed, several of the models we examined had ΔAIC values indicating they are functionally equivalent (Table 1A). Ad hoc examinations of these model outputs showed nearly identical predicted trends, so we present the full model including all three response variables, which were of ecological interest (Table 1A). An intercept only model was not competitive in terms of AIC (ΔAIC > 7.2 units from full model).
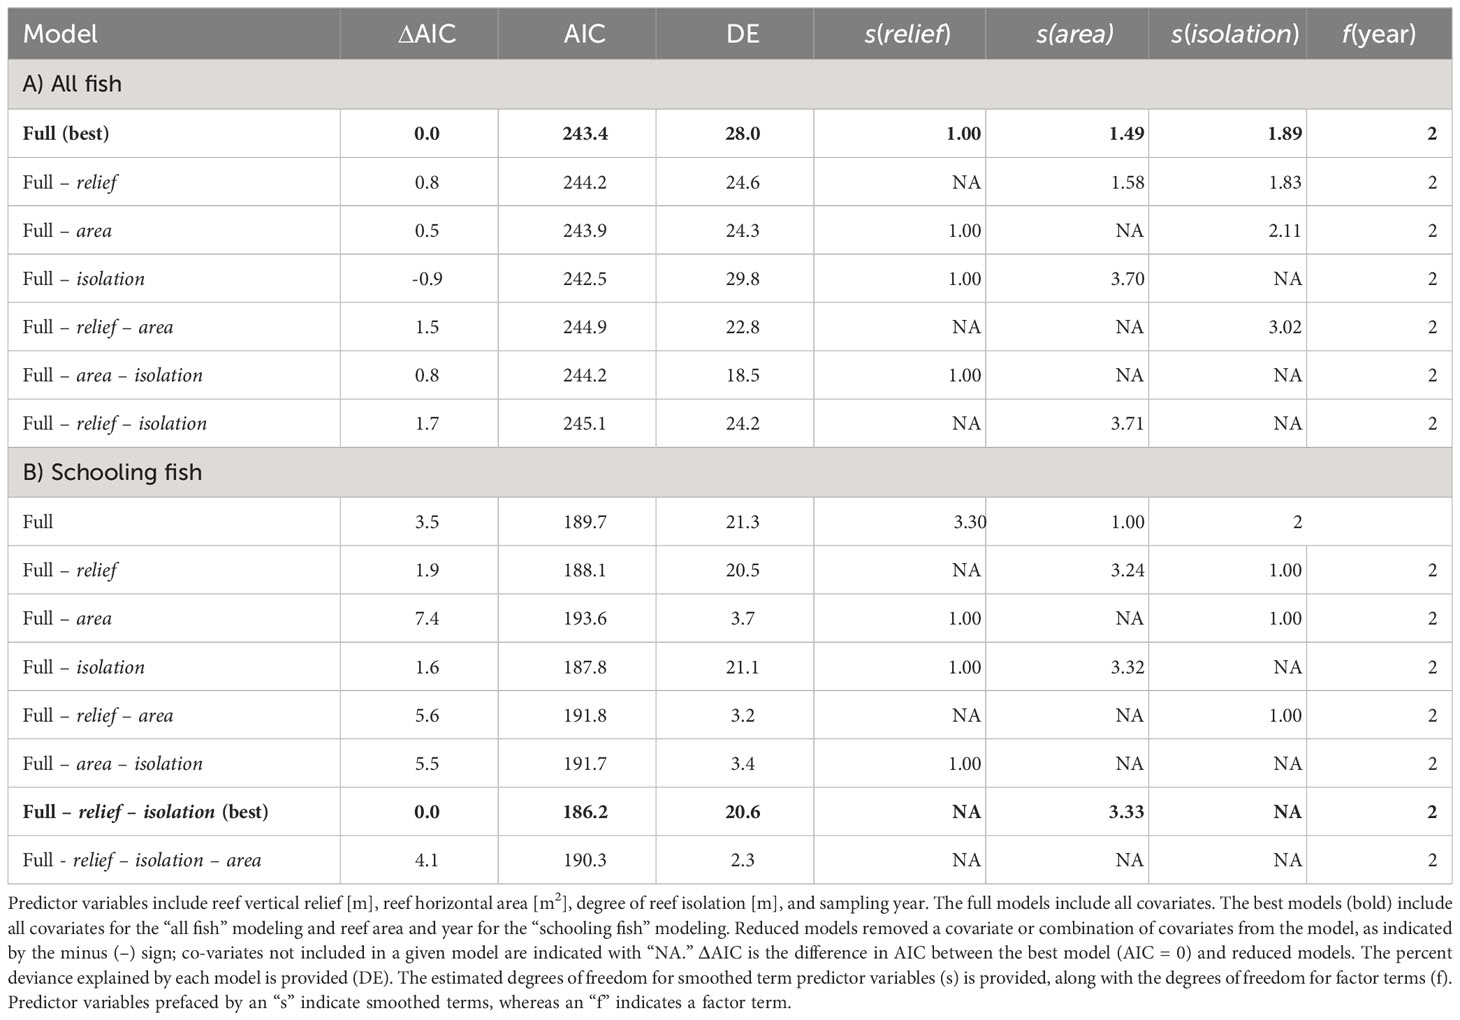
Table 1 Model selection for generalized additive model predictor variable relationships with log-transformed fish density (NASC) for (A) all fish and (B) schooling fish.
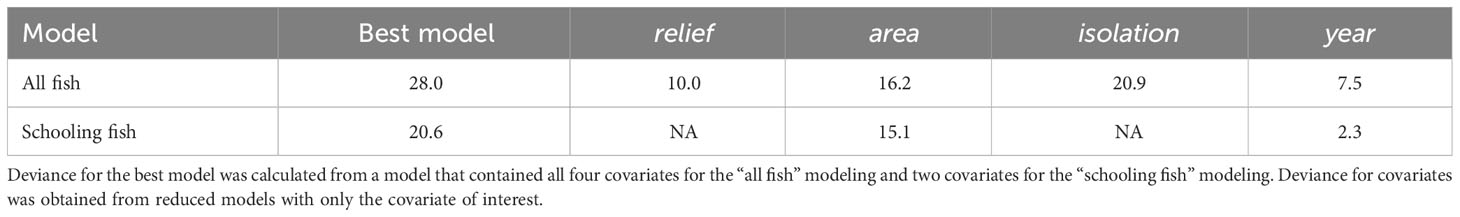
Table 2 Percent deviance explained by generalized additive model covariates.
The patterns exhibited by overall relative fish density were different than the relative density of schooling fish (Figure 3). Schooling fish density ranged from 100.74 m2 nmi-2 to 50,656.45 m2 nmi-2. These models were based on data from 52 sampling transects conducted over seven artificial reef zones (e.g., AR-285) and 29 reef structures (e.g., concrete pipes at AR-285). Several transects that included fish did not include schools of fish so were removed from this analysis. The GAM results indicated that reef structures of intermediate horizontal area hosted the highest schooling fish density, and density decreased at low and high spatial area (Figure 3). However, the uncertainty surrounding model estimates at these intermediate values was also the highest and was driven by a relative paucity of reef sites with spatial area between 2,500 m2 and 6,500 m2. Vertical relief and isolation did not relate to schooling fish density based on AIC, so they were excluded from the model (Table 1B). The best model of the relationship between relative schooling fish density and reef predictor variables – horizontal area and sampling year – explained 20.6% of the deviance in schooling fish density (Table 1B). Examinations of individual predictor variables indicated that horizontal area explained the highest portion of deviance (15.1%), followed by sampling year (2.3%) (Table 2). An intercept only model was also run and was similar in terms of AIC (ΔAIC >1.3 units from best model).
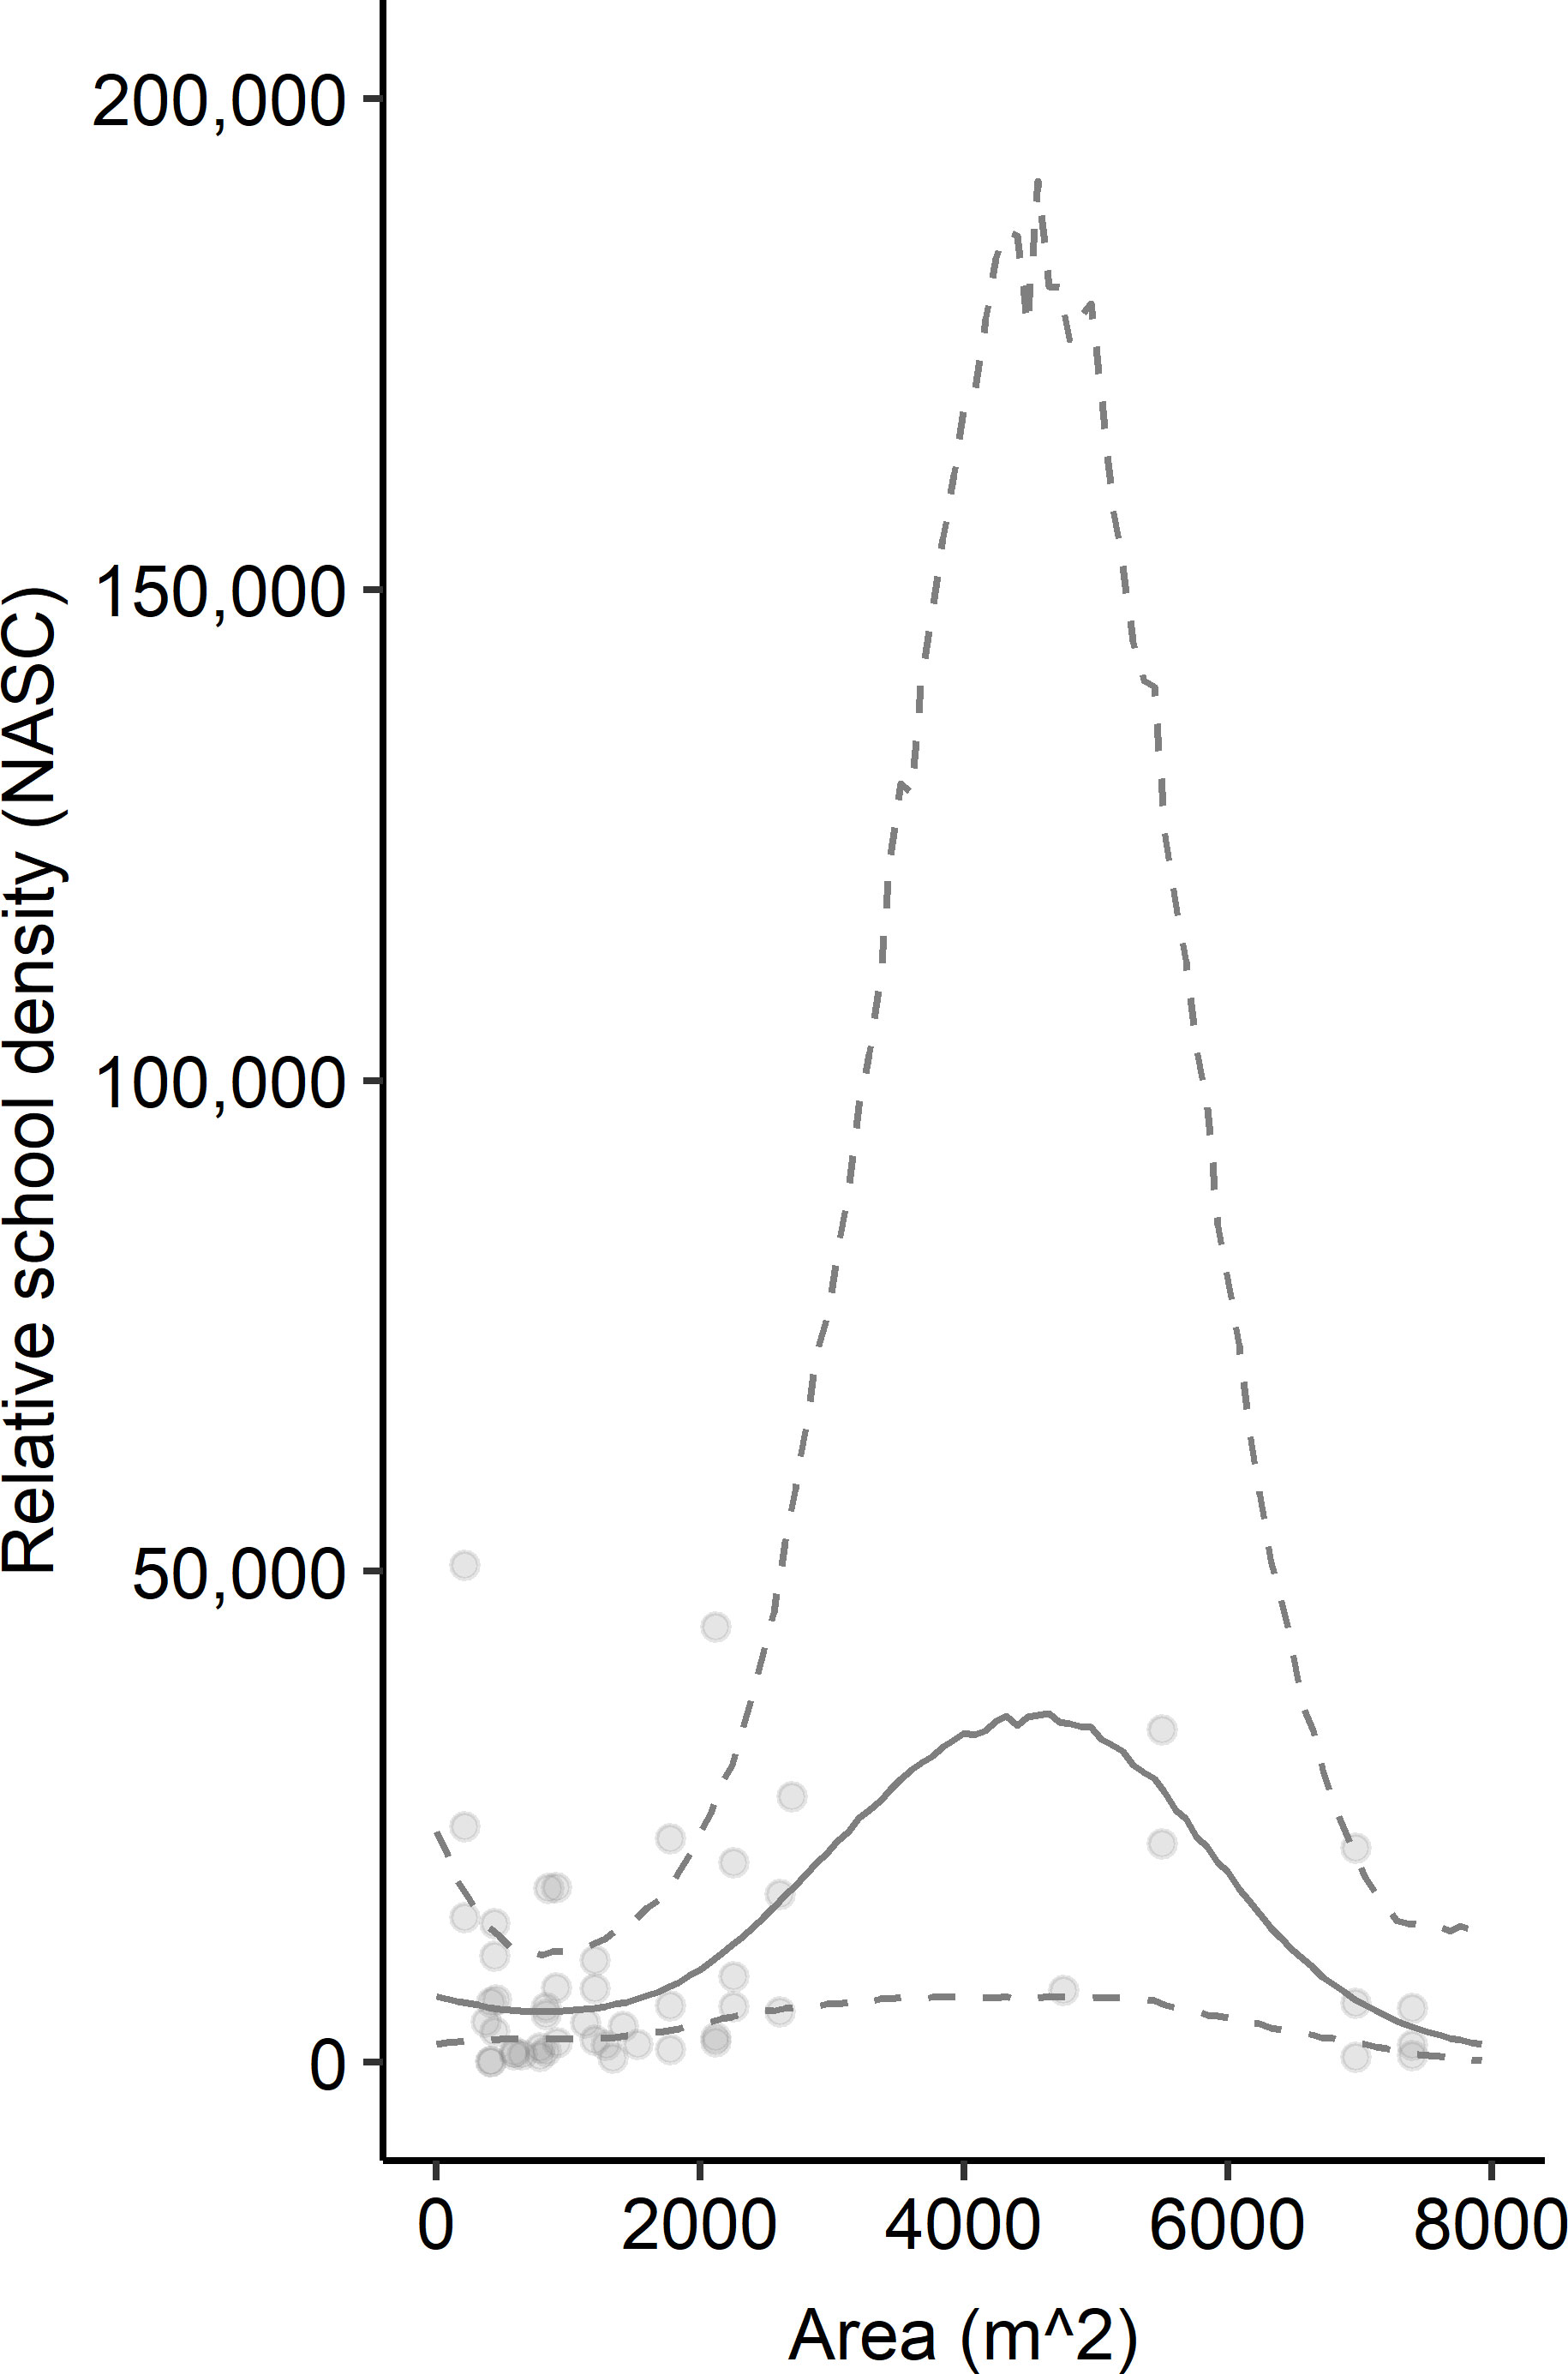
Figure 3 Relationship between relative schooling fish density (NASC [m2 nmi-2]) and horizontal area (m2). Points represent observed data. Solid lines indicate model-predicted mean fit. Dashed lines represent upper and lower 95% confidence intervals. Mean fit and confidence intervals were predicted from the GAM that included area and year sampled as predictor variables and log-transformed NASC as the response variable for schooling fish. Predicted values have been exponentiated in the figure so they can be displayed on the same scale as observed NASC.
Discussion
Our findings that relative fish density on artificial reefs relates to the vertical relief, horizontal area, and spatial isolation of reef structures highlight that strategic design and siting decisions can help enhance services provided by artificial structures. The overall relative density of fish on artificial reefs related to three key factors – vertical relief, horizontal area, and isolation – that characterize reefed structures. Our model results suggest that relative fish density is more strongly related to reef vertical relief than reef horizontal area. In addition, we found that reef spatial isolation may also relate to fish density. In general, our results concur with findings for other artificial structures – reefs of higher relief, broader area, and that are more isolated may be capable of hosting the most fish. For example, a study in the same geographic area found that visually sampled predatory fish abundance around artificial reefs and historic shipwrecks correlated with vertical relief (Paxton et al., 2020), and a study in the Mediterranean Sea that found a positive relationship between fish recruitment and vertical relief of experimental reef modules (Rilov and Benayahu, 2002).
Artificial reef area has also been demonstrated to positively relate to fish density, although the response can differ based on fish size class (Bohnsack et al., 1994). Spatially isolated oil platforms in the Gulf of Mexico tend to host higher acoustic fish biomass than less spatially isolated platforms (Egerton et al., 2021), and experimental artificial patch reefs observed with diver visual surveys had higher fish abundance than less isolated reef modules (Jordan et al., 2005). These relationships likely hinge upon the reef structure’s carrying capacity (Bohnsack, 1989). Our model results hint that such a threshold may exist for isolation and fish density; yet, this relationship may have been obscured, as several data points on highly isolated structures containing high fish density drove the tail of our fitted predictions upward. It may be possible that more isolated structures host less fishing pressure than less isolated structures and that this may relate to observed fish densities. Similarly, reefs closer to ports may experience more fishing pressure, which could also contribute. Regardless, the general patterns embodied by our results are typical of those observed in other artificial structures; however, additional variables should be explored in future studies since the best model still only explained 28.0% of patterns in fish density.
Relationships between reef characteristics and schooling fish density were more nuanced than those for all fish. Reef vertical relief did not relate to schooling fish density, and reef horizontal area exhibited a different relationship with schooling fish density than it did for all fish. For schooling fish, density generally increased on reefs with areas up to 5,000 m2 before declining, which suggests a relationship threshold. Yet, we collected relatively few samples on reefs with such large areas. Few studies have examined these types of relationships, but those that have found that schools tend to spatially aggregate on artificial structures towards the prevailing current (Becker et al., 2019), exhibit diel patterns (Holland et al., 2021), and that the distance of the schools from the structure relates to the current magnitude and direction (Paxton et al., 2019). Our findings help improve our understanding of how fish schools relate to artificial structure characteristics but cannot fully explain underlying mechanisms. One potential underlying mechanism that could be investigated in the future is reef spatial isolation. We found that isolation did not relate to schooling fish density but it was difficult to interpret general patterns in this relationship. Additional research could prioritize understanding reef isolation not only in a univariate framework but instead multivariate to create a variable that describes the “weight” of nearby habitats rather than just the distance to the closest habitat, similar to Egerton et al. (2021). Since our model explained 20.6% of the pattern in fish school density, future research should also explore additional factors, such as reef seascape setting, other reef physical characteristics, and fishing pressure.
We did not include artificial reef material (e.g., concrete, metal) in our model because the material typically correlates with the vertical relief and horizontal area of the structure. For example, most metal artificial reefs are ships, and these ships typically represent high relief but small area structures (Paxton et al., 2017; Lemoine et al., 2019). Concrete pipes, on the other hand, are typically low in relief but can be spread across a broader seafloor area (Paxton et al., 2017; Lemoine et al., 2019). There are caveats regarding this relationship as some concrete pipes are stacked on top of one another, essentially forming high relief piles, and some metal structures like ships and train cars can be low in relief. Our decision to exclude material type from our analyses allowed us to focus on disentangling the relationship between the characteristics of the structures – vertical relief and horizontal area. The relationship between reef relief and area is challenging to model. This is because in some instances, reefs of high vertical relief occupy small footprints and vice versa. As such, there may be an interaction between these two factors that was obscured by our modeling framework, despite the benefit that GAMs afforded in being able to model non-linear relationships. Model results suggest that the strength of the relationship between density of all fish and relief was stronger than for that of all fish and area. In contrast, schooling fish density lacked an apparent relationship with vertical relief yet there was some evidence that intermediate areas hosted the most fish. Interestingly, there are datapoints characterized by low NASC that occur across the range of covariates, including the upper edges of covariate values. It is possible that differential fishing pressure, especially at medium and high covariate values, may help explain this phenomenon. Future research on schooling fish and reefs could seek to experimentally parse apart the oftentimes confounding relationships between reef material, reef relief, reef area, and fish metrics.
We documented high variability in fish density on artificial reefs. Future studies could explore whether variation in fish density over diel periods may explain some of the variability. Previous research in the southeast US on natural reefs documented that patterns in the distribution of predator and prey species markedly changed throughout the day (Campanella et al., 2019). Surveys were conducted from dawn or dusk, so it is plausible that diel patterns in fish distributions may have contributed to high variability. Annual differences in fish communities could also contribute to the patterns we observed, as variation among years is typically high in the southeast US (Gabriel et al., 2020). Additionally, variability in fish density may be related to the types of fish species detected, their life history traits, and their habitat use patterns. We examined overall fish density and schooling fish density. The overall fish density would likely represent resident and transient species. Schooling fish density likely represents transient predators, as well as small fish. Reefs in our study area are typically characterized by high species richness and diversity, which precludes our ability to identify fish to low taxonomic levels from echosounder data. We would conjecture based on prior studies and our team’s prior observations from artificial and natural reefs in this location that the schooling fish likely include those in the Carangidae, Scombridae, and Sphyraenidae families (Stephan and Lindquist, 1989; Paxton et al., 2020). Resident species likely include fish from the Serranidae, Lutjanidae, Balistidae, and Haemulidae families, as well as other demersal species often represented in the snapper-grouper management complex (Paxton et al., 2020). Previous research demonstrates that these resident and transient fish can use artificial reefs differently, especially compared to natural reefs (Paxton et al., 2020). Specifically, transient predators exhibit higher abundances on artificial than natural reefs, whereas resident predators exhibit similar abundances by reef type. Therefore, it is possible that differences in life history traits and habitat use patterns could have added variability.
The interplay among reef physical characteristics, reef spatial arrangement, and fish density is complex. Our study provides a perspective on these relationships assessed using fishery echosounders over relatively broad spatial scales (200 m transects over a 200 km linear length of the continental shelf). Investigating these relationships across a range of spatial scales may help disentangle the prominent factors and their effects even further. Our study also paints a compelling picture of the need to disentangle these predictors and responses as the number of artificial structures in the seascape is projected to increase globally. Overall, our findings suggest that despite nuances in relationships, there are several key factors like relief, area, and isolation that can be measured and tested to further increase the ability of marine artificial structures to provide ecosystem services like fish habitat provisioning in a changing seascape.
Data availability statement
The original contributions presented in the study are included in the article/Supplementary Material. Further inquiries can be directed to the corresponding author.
Author contributions
AP, JT, and JB conceptualized this research, acquired funding, and designed the surveys. VG, AF, and EE processed splitbeam echosounder data. EE processed multibeam echosounder data, and VG calculated physical reef characteristics from the multibeam data. VG and AF conducted preliminary data analysis with guidance from AP and JT. AP, BR, and NB conducted final data analyses and generated final figures and tables. VG and AP drafted the manuscript introduction. VG, AF, AP, and JT drafted the manuscript methods. AP, BR, and NB drafted the manuscript results. AP drafted the manuscript discussion. All authors contributed to the article and approved the submitted version.
Acknowledgments
We thank the officers and crew of the NOAA Ship Nancy Foster for supporting missions to collect data. We thank C. Ames for his guidance in developing an approach to delineate artificial reef structures from multibeam data. We thank M. Kendall, J. Kraus, and T. Barnes for thoughtful reviews of the manuscript. This study was funded by a North Carolina Coastal Recreational Fishing License Grant. AP was supported by CSS under NOAA/NCCOS Contract #EA113C17BA0062 during part of the study. EE was supported by CSS under a NOAA/NCCOS Contract during the study. VG and AF thank the NOAA Ernest F. Hollings Undergraduate Scholarship program for supporting their summer 2021 research fellowship with ABP and JCT. We thank K. Smith and M. Barsoum from Davidson College and J. Perry from University of Minnesota for their thoughtful ideas and guidance as mentors for VG and AF, respectively, during their undergraduate research.
Conflict of interest
Author EE was employed by the company CSS-Inc.
The remaining authors declare that the research was conducted in the absence of any commercial or financial relationships that could be construed as a potential conflict of interest.
Publisher’s note
All claims expressed in this article are solely those of the authors and do not necessarily represent those of their affiliated organizations, or those of the publisher, the editors and the reviewers. Any product that may be evaluated in this article, or claim that may be made by its manufacturer, is not guaranteed or endorsed by the publisher.
Author disclaimer
The views and conclusions contained in this document are those of the authors and should not be interpreted as representing the opinions or policies of the US Government, nor does mention of trade names or commercial products constitute endorsement or recommendation for use.
Supplementary material
The Supplementary Material for this article can be found online at: https://www.frontiersin.org/articles/10.3389/fmars.2023.1240344/full#supplementary-material
Supplementary Figure 1 | Relationship between artificial reef structures and relative fish density (NASC [m2 nmi-2]) for (A) all fish and (B) fish schools and standard error. Top facet of each plot is concrete and bottom facet is metal. Number alongside error bar is the sample size.
Supplementary Data Sheet 1 | Data on reef characteristics and relative acoustic fish density. [.csv]
References
Barange M. (1994). Acoustic identification, classification and structure of biological patchiness on the edge of the Agulhas Bank and its relation to frontal features. South Afr. J. Mar. Sci. 14, 333–347. doi: 10.2989/025776194784286969
Becker A., Smith J. A., Taylor M. D., McLeod J., Lowry M. B. (2019). Distribution of pelagic and epi-benthic fish around a multi-module artificial reef-field: Close module spacing supports a connected assemblage. Fisheries Res. 209, 75–85. doi: 10.1016/j.fishres.2018.09.020
Bohnsack J. A. (1989). Are high densities of fishes at artificial reefs the result of habitat limitation or behavioral preference? Bull. Mar. Sci. 44, 631–645.
Bohnsack J. A., Harper D. E., Mcclellan D. B., Hulsbeck M. (1994). Effects of reef size on colonization and assemblage structure of fishes at artificial reefs off southeastern Florida, U.S.A. Bull. Mar. Sci. 55, 796–823.
Bugnot A. B., Mayer-Pinto M., Airoldi L., Heery E. C., Johnston E. L., Critchley L. P., et al. (2021). Current and projected global extent of marine built structures. Nat. Sustainability 4, 33–41. doi: 10.1038/s41893-020-00595-1
Burnham K. P., Anderson D. R. (2004). Multimodel inference: understanding AIC and BIC model selection. Sociological Methods Res. 33, 261–304. doi: 10.1177/0049124104268644
Campanella F., Auster P. J., Taylor J. C., Munoz R. C. (2019). Dynamics of predator-prey habitat use and behavioral interactions over diel periods at sub-tropical reefs. PloS One 14, e0211886. doi: 10.1371/journal.pone.0211886
Champion C., Suthers I. M., Smith J. A. (2015). Zooplanktivory is a key process for fish production on a coastal artificial reef. Mar. Ecol. Prog. Ser. 541, 1–14. doi: 10.3354/meps11529
Claisse J. T., Pondella D. J., Love M., Zahn L. a., Williams C. M., Williams J. P., et al. (2014). Oil platforms off California are among the most productive marine fish habitats globally. Proc. Natl. Acad. Sci. 111, 15462–15467. doi: 10.1073/pnas.1411477111
Costa B. M., Battista T. A. (2013). The semi-automated classification of acoustic imagery for characterizing coral reef ecosystems. Int. J. Remote Sens. 34, 6389–6422. doi: 10.1080/01431161.2013.800661
Dafforn K. A., Mayer-Pinto M., Morris R. L., Waltham N. J. (2015). Application of management tools to integrate ecological principles with the design of marine infrastructure. J. Environ. Manage 158, 61–73. doi: 10.1016/j.jenvman.2015.05.001
Degraer S., Brabant R., Rumes B., Vigin L. (eds) (2017). “Environmental impacts of offshore wind farms in the Belgian part of the North Sea: A continued move towards integration and quantification,” (Brussels: Royal Belgian Institute of Natural Sciences, OD Natural Environment, Marine Ecology and Management Section).
Demer D. A., Berger L., Bernasconi M., Bethke E., Boswell K., Chu D., Domokos R., et al. (2015). Calibration of acoustic instruments. ICES Cooperative Research Report No. 326. 133 pp.
Egerton J. P., Bolser D. G., Grüss A., Erisman B. E. (2021). Understanding patterns of fish backscatter, size and density around petroleum platforms of the U.S. Gulf of Mexico using hydroacoustic data. Fisheries Res. 233, 105752. doi: 10.1038/s41598-019-55425-y
Firth L. B., Knights A. M., Bridger D., Evans A. J., Mieszkowska N., Moore P., et al. (2016). Ocean sprawl: challenges and opportunities for biodiversity management in a changing world. Oceanography Mar. Biology: Annu. Rev. 54, 189–262.
Froehlich H. E., Smith A., Gentry R. R., Halpern B. S. (2017). Offshore aquaculture: I know it when I see it. Front. Mar. Sci. 4, 154. doi: 10.3389/fmars.2017.00154
Gabriel S., Auster P. J., Kracker L. (2020). “Assessing patterns of prey fish abundance and patchiness at live-bottom reefs using hydroacoustics,” in Review of Scientific Research in and around the Designated Research Area of Gray's Reef National Marine Sanctuary (NW Atlantic). Eds. Roberson K. W., AUster P. J., Fangman S., Harvey M. (Silver Spring, MD: National Marine Sanctuaries Conservation Series ONMS-20-08. NOAA Office of National Marine Sanctuaries), 185.
Gratwicke B., Speight M. (2005). The relationship between fish species richness, abundance and habitat complexity in a range of shallow tropical marine habitats. J. Fish Biol. 66, 650–667. doi: 10.1111/j.0022-1112.2005.00629.x
Holland M. M., Becker A., Smith J. A., Everett J. D., Suthers I. M. (2021). Fine-scale spatial and diel dynamics of zooplanktivorous fish on temperate rocky and artificial reefs. Mar. Ecol. Prog. Ser. 674, 221–239. doi: 10.3354/meps13831
Hylkema A., Debrot A. O., Osinga R., Bron P. S., Heesink D. B., Izioka A. K., et al. (2020). Fish assemblages of three common artificial reef designs during early colonization. Ecol. Eng. 157, 106882. doi: 10.1016/j.ecoleng.2020.105994
Jordan L. K. B., Gilliam D. S., Spieler R. E. (2005). Reef fish assemblage structure affected by small-scale spacing and size variations of artificial patch reefs. J. Exp. Mar. Biol. Ecol. 326, 170–186. doi: 10.1016/j.jembe.2005.05.023
Lemoine H. R., Paxton A. B., Anisfeld S. C., Rosemond R. C., Peterson C. H. (2019). Selecting the optimal artificial reefs to achieve fish habitat enhancement goals. Biol. Conserv. 238, 108200. doi: 10.1016/j.biocon.2019.108200
Maclennan D. N., Fernandes P. G., Dalen J. (2002). A consistent approach to definitions and symbols in fisheries acoustics. ICES J. Mar. Sci. 59, 365–369. doi: 10.1006/jmsc.2001.1158
Macreadie P. I., Fowler A. M., Booth D. J. (2011). Rigs-to-reefs: will the deep sea benefit from artificial habitat? Front. Ecol. Environ. 9, 455–461. doi: 10.1890/100112
Miller R. G., Hutchison Z. L., Macleod A. K., Burrows M. T., Cook E. J., Last K. S., et al. (2013). Marine renewable energy development: assessing the Benthic Footprint at multiple scales. Front. Ecol. Environ. 11, 433–440. doi: 10.1890/120089
Morris R. L., Porter A. G., Figueira W. F., Coleman R. A., Fobert E. K., Ferrari R. (2018). Fish-smart seawalls: a decision tool for adaptive management of marine infrastructure. Front. Ecol. Environment. 16 (5), 278–287 doi: 10.1002/fee.1809
Nicholls-Lee R., Thies P. R., Dulieu-Barton J. M., Ólafsson G., Hughes R., Hernandez Arroyo A., et al. (2022). Non-destructive examination (NDE) methods for dynamic subsea cables for offshore renewable energy. Prog. Energy 4, 042011. doi: 10.1088/2516-1083/ac8ccb
North Carolina Division of Marine Fisheries (1988). North Carolina Artificial Reef Master Plan. 1–96.
O’Shaughnessy K. A., Hawkins S. J., Evans A. J., Hanley M. E., Lunt P., Thompson R. C., et al. (2019). Design catalogue for eco-engineering of coastal artificial structures: a multifunctional approach for stakeholders and end-users. Urban Ecosyst. 23, 431–443. doi: 10.1007/s11252-019-00924-z
Overholtzer-McLeod K. L. (2004). Variance in reef spatial structure masks density dependence in Coral-Reef fish populations on natural versus artificial reefs. Mar. Ecol. Prog. Ser. 276, 269–280. doi: 10.3354/meps276269
Paxton A. B., Harter S. L., Ross S. W., Schobernd C. M., Runde B. J., Rudershausen P. J., et al. (2021). Four decades of reef observations illuminate deep-water grouper hotspots. Fish Fisheries 22, 749–761. doi: 10.1111/faf.12548
Paxton A. B., Newton E. A., Adler A. M., Van Hoeck R. V., Iversen E. S. Jr., Taylor J. C., et al. (2020). Artificial habitats host elevated densities of large reef-associated predators. PloS One 15, e0237374. doi: 10.1371/journal.pone.0237374
Paxton A. B., Pickering E. A., Adler A. M., Taylor J. C., Peterson C. H. (2017). Flat and complex temperate reefs provide similar support for fish: Evidence for a unimodal species-habitat relationship. PloS One 12, e0183906. doi: 10.1371/journal.pone.0183906
Paxton A. B., Taylor J. C., Peterson C. H., Fegley S. R., Rosman J. H. (2019). Consistent spatial patterns in multiple trophic levels occur around artificial habitats. Mar. Ecol. Prog. Ser. 611, 189–202. doi: 10.3354/meps12865
Pondella D. J., Claisse J. T., Williams C. M. (2022). Theory, practice, and design criteria for utilizing artificial reefs to increase production of marine fishes. Front. Mar. Sci. 9. doi: 10.3389/fmars.2022.983253
R Core Team (2020). R: A language and environment for statistical computing (Vienna, Austria: R Foundation for Statistical Computing).
Rilov G., Benayahu Y. (2002). Rehabilitation of coral reef-fish communities: the importance of artificial-reef relief to recruitment rates. Bull. Mar. Sci. 70, 185–197.
Rosemond R. C., Paxton A. B., Lemoine H. R., Fegley S. R., Peterson C. H. (2018). Fish use of reef structures and adjacent sand flats: implications for selecting minimum buffer zones between artificial reefs and existing reefs. Mar. Ecol. Prog. Ser. 587, 187–199. doi: 10.3354/meps12428
Rouse S., Porter J. S., Wilding T. A. (2020). Artificial reef design affects benthic secondary productivity and provision of functional habitat. Ecol. Evol. 10, 2122–2130. doi: 10.1002/ece3.6047
Simmonds J., MacLennan D. N. (2005). Fisheries Acoustics: Theory and Practice, (Oxford, UK: Blackwell Science) Vol. 437.
Stephan C. D., Lindquist D. G. (1989). A comparative analysis of the fish assemblages associated with old and new shipwrecks and fish aggregating devices in Onslow Bay, North Carolina. Bull. Mar. Sci. 44, 698–717.
Steward D., Paxton A. B., Bacheler N. M., Schobernd C. M., Mille K., Renchen J., et al. (2022). Quantifying spatial extents of artificial versus natural reefs in the seascape. Front. Mar. Sci. 9. doi: 10.3389/fmars.2022.980384
Wood S. N. (2011). Fast stable restricted maximum likelihood and marginal likelihood estimation of semiparametric generalized linear models. J. R. Stat. Soc. (B) 73, 3–36. doi: 10.1111/j.1467-9868.2010.00749.x
Keywords: artificial reef, built habitats, fish distribution, human-made reefs, reef morphology, spatial ecology
Citation: Gilliland VA, Fessler AE, Paxton AB, Ebert EF, Tharp RM, Runde BJ, Bacheler NM, Buckel JA and Taylor JC (2023) Spatial extent and isolation of marine artificial structures mediate fish density. Front. Mar. Sci. 10:1240344. doi: 10.3389/fmars.2023.1240344
Received: 14 June 2023; Accepted: 07 August 2023;
Published: 11 September 2023.
Edited by:
Iñigo Muxika, Technological Center Expert in Marine and Food Innovation (AZTI), SpainReviewed by:
Peter J. Auster, Mystic Aquarium, United StatesJeremy T. Claisse, California State Polytechnic University, Pomona, United States
Copyright © 2023 Gilliland, Fessler, Paxton, Ebert, Tharp, Runde, Bacheler, Buckel and Taylor. This is an open-access article distributed under the terms of the Creative Commons Attribution License (CC BY). The use, distribution or reproduction in other forums is permitted, provided the original author(s) and the copyright owner(s) are credited and that the original publication in this journal is cited, in accordance with accepted academic practice. No use, distribution or reproduction is permitted which does not comply with these terms.
*Correspondence: Avery B. Paxton, YXZlcnkucGF4dG9uQG5vYWEuZ292
†ORCID: Avery Paxton, orcid.org/0000-0002-4871-9167
Ryan Tharp, orcid.org/0000-0003-1977-5650
Brendan Runde, orcid.org/0000-0002-2125-4486
Nathan Bachele, orcid.org/0000-0003-1955-6044