 Hanzheng Wang
 Haiyan Zhang
 Hao Wei
 Han Zuo
- Tianjin Key Laboratory for Marine Environmental Research and Service, School of Marine Science and Technology, Tianjin University, Tianjin, China
The Bohai Sea (BS) has been experiencing prominent deoxygenation in recent years that forms a typically coastal oxygen depleted region in summer. A three-dimensional coupled physical-biogeochemical model was used in this study to investigate temporal variations of the two separately-developing oxygen depleted zones in the BS. Comparison with observations shows a good model performance for multi-year’s oxygen depletion simulation. Two separately-developing oxygen depleted cores are always identified in these years with a threshold of oxygen concentration less than 3 mg/L. The oxygen depletion in the northern core is generally more severe with larger areas and lower oxygen minima. During the evolution of oxygen depletion, the bottom oxygen concentration decreases more smoothly in the northern core, while fluctuates frequently in the southern core. Nonetheless, the oxygen depletion in both cores fades away almost simultaneously, with a sudden oxygen increase in late summer or early autumn. Oxygen budget estimation indicates that the biological oxygen consumption in the southern core is greater than that in the northern core, but compensated by the oxygen replenishment of oxygen-rich water from the Bohai Strait and vertical diffusion of the water column, which is less in the northern core, so that the oxygen depletion in the northern core is more severe. During oxygen depletion development in June and July, bottom oxygen in the southern core is more susceptible to strong winds than the northern core attributed to differences in topography, with a shallower and smoother bathymetry leading to weaker water column stability in summer. Recognition of characteristics of the two separate oxygen depleted cores would advance understanding spatial pattern of oxygen dynamics and provide a basis for statistical seasonal prediction of coastal oxygen depletion with consideration of spatial heterogeneity.
1 Introduction
Dissolved oxygen (DO) is essential to sustain the survival of marine organisms and biogeochemical processes in the ocean (Diaz, 2001; Breitburg et al., 2018). Hypoxia (defined here as DO< 2.0 mg/L or approximately 30% saturation) adversely affects the growth of benthos and even leads to death, reduces benthic biodiversity, and changes the structure and function of biological communities (Levin et al., 2009). Persistent decreasing of DO will enhance the emissions of CH4 and N2O from the ocean to the atmosphere, affecting the global elemental biogeochemical cycle (Zhang et al., 2010; Breitburg et al., 2018). Stressed by both global climate change and human activities, DO concentrations in both the open ocean and coastal waters have been declining since at least the middle of the 20th century (Breitburg et al., 2018). In the 21st century, coastal hypoxia has become a global marine environmental problem with increasing incidence and areal extent (Rabalais et al., 2010; Laffoley and Baxter, 2019). In China’s coastal seas, hypoxia in the Yangtze River Estuary and the Pearl River Estuary has received considerable attention for decades (Li et al., 2002; Zhang and Li, 2010; Zhou et al., 2017; Li et al., 2021a). Moreover, the BS has experienced a prominent deoxygenation and is suffering severe oxygen depletion in recent years (Zhai et al., 2012; Wei et al., 2019).
Located in the northwest of the Pacific Ocean, the BS is a semi-closed shallow sea with an area of 7 × 10⁴ km2 and a mean depth of 18 m (Figure 1), connected to the North Yellow Sea through the Bohai Strait (Feng et al., 1999). In past decades, excessive nitrogen discharge into the BS due to increased human populations and agricultural production, causes frequent phytoplankton blooms in spring and summer (Zu et al., 2005; Mei et al., 2011). The oxygen depletion in the BS, since first reported by Zhai et al. (2012), was repeatedly observed in summer and even subjected to hypoxic conditions (Zhang et al., 2016; Zhao et al., 2017; Zhai et al., 2019). The lowest DO concentration reported was 67 μmol/L in 2015 (Zhai et al., 2019), and the minimum saturation was 28.5% in 2017 (Zhao et al., 2020), indicating that the BS is under severe oxygen depletion. Field observations show that the bottom oxygen depletion in the BS in summer has a spatial feature of two separate oxygen depleted zones, with the northern and southern zones located offshore of Qinhuangdao City and the Yellow River estuary, respectively (Zhang et al., 2016; Zhao et al., 2017; Zhang et al., 2022). During the development of oxygen depletion, DO is vertically uniform in May, begins to be unsaturated in June and reaches the minimum in August in the bottom layer, showing a nearly linear decrease from June to August (Song et al., 2020; Zhao et al., 2020).
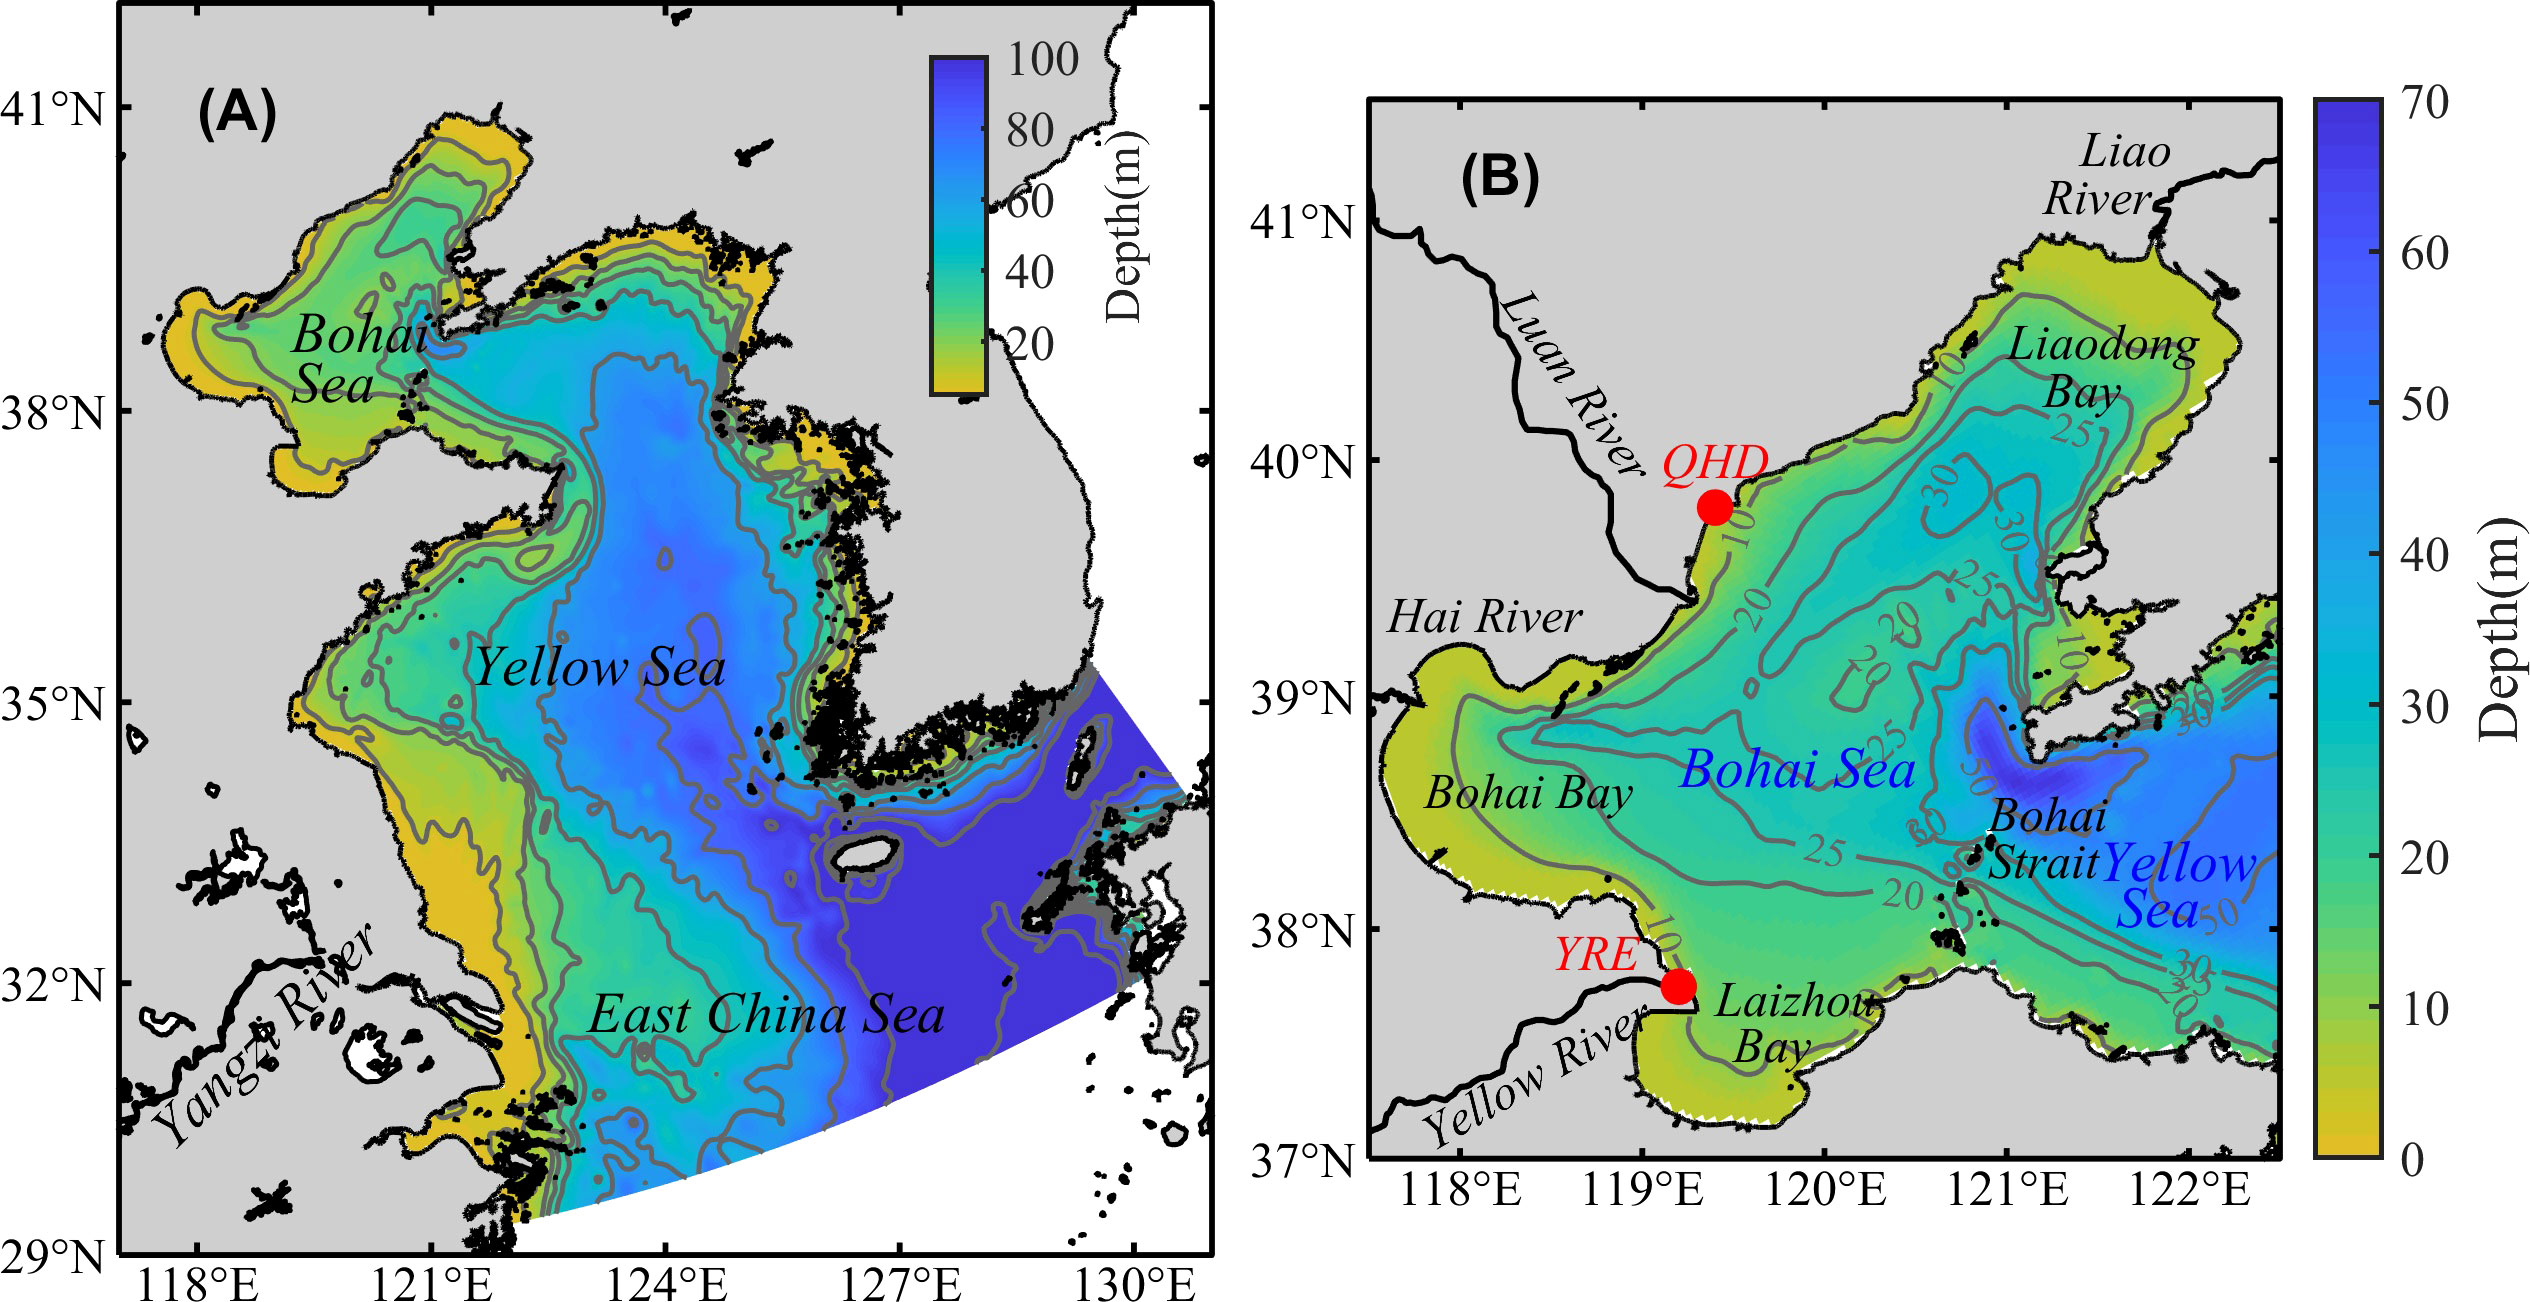
Figure 1 Model domain (A) and topography of the BS (B). The two red dots represent the locations of the City of Qinhuangdao (QHD) and the Yellow River Estuary (YRE).
The evolution of oxygen depletion is primarily controlled by stratification and biological oxygen consumption (Rabalais et al., 2010; Fennel and Testa, 2019). In the BS, the thermocline-dominated stratification forms in the deep water around the central bank in spring and summer. The seasonal thermocline can hinder the vertical transport of DO from the upper layer to the lower layer, which is a prerequisite for bottom oxygen depletion in summer (Zhao et al., 2017; Wei et al., 2019; Zhang et al., 2022). And longer stratification durations also lead a more severe oxygen depletion (Li et al, 2021b). DO consumption is closely linked to biological processes. In general, phytoplankton in the BS starts to flourish in spring and forms algal blooms with the ample sunshine and increasing temperature, and then chlorophyll-a concentrations reach the highest levels in summer (Sun et al., 2012). Afterwards, phytoplankton blooms will enhance the sedimentation and oxygen-related decomposition of organic matter in the bottom water, which is the basis for the formation of hypoxia (Wei et al., 2019). Some studies argued that pelagic respiration associated with the degradation of fresh organic matter contributes mainly to oxygen depletion in the bottom water (Song et al., 2020; Chen et al., 2022b). In addition, lateral transport can also affect the severity of the oxygen depletion. Zhang et al. (2022) found that the lateral transport driven by the anticyclone circulation in the BS favors an expansion of low-oxygen water off Qinhuangdao to the northeast.
Previous studies provide a well understanding of the spatiotemporal characteristics and main controlling mechanisms of bottom oxygen depletion in the BS, while it is unclear about the similarities and differences between two separate oxygen depleted zones and their influencing factors. Combining with field observations, this paper used a three-dimensional coupled physical-biogeochemical model to redefine the southern and northern cores of oxygen depletion, analyzed the temporal variations and explored their main influencing factors, which would provide insight into spatial heterogeneity of oxygen dynamics.
2 Materials and methods
2.1 Observation
Large-area field observations in the summers of 2015, 2016, 2018, and 2019 in the BS were used in this paper (Table 1). Observations in 2015 and 2016 were conducted aboard R/V Dongfanghong 2, with 35 and 18 sampling stations respectively. A detailed description can be found in Zhai et al. (2019). Observations in 2018 and 2019 were obtained from the shared voyages of the Bohai Sea and the Yellow Sea of the National Natural Science Foundation of China (NFSC), with a total of 46 and 41 sampling stations. Temperature and salinity were measured onboard using an SBE-911-plus CTD. DO concentrations measured by CTD were calibrated by a chemical titration method. All data were obtained with a vertical interval of 1 m after filtering, correcting, and averaging.
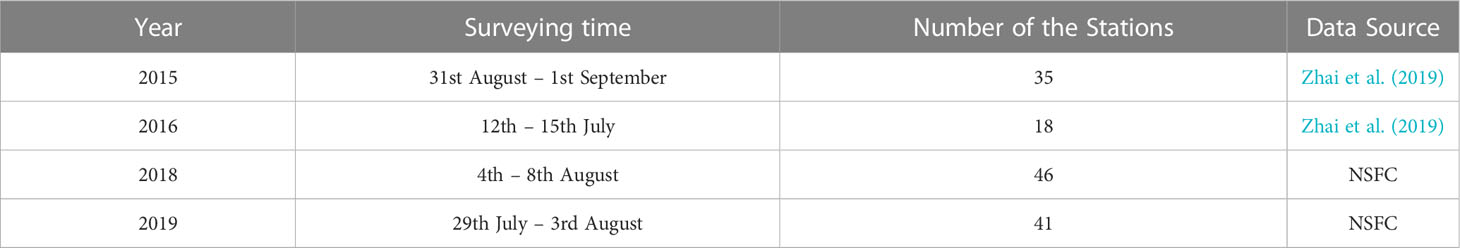
Table 1 Cruise information.
2.2 Model description
A three-dimensional coupled physical-biogeochemical model was utilized in this paper. The physical model is configured with the Regional Ocean Modeling System (ROMS, Shchepetkin and McWilliams, 2005), derived from a three-dimensional nonlinear baroclinic primitive equation. Based on the vertical static pressure approximation and the Boussinesq approximation, ROMS solves the Navier-Stokes equation for the Reynolds average with the finite difference scheme. The model domain covers the entire BS, the Yellow Sea, and part of the East China Sea (Figure 1), with a horizontal resolution of 2.2~4 km and a minimum depth of 5 m. The model adopts σ coordinates and has 30 vertical layers, with enhanced resolution for the surface and bottom layers. The initial temperature and salinity conditions are obtained from the WOA13 (World Ocean Atlas 2013). The open boundary conditions for the temperature, salinity, horizontal velocities, and sea surface elevation are obtained from the HYCOM (Hybrid Coordinate Ocean Model) global analysis. Eight tidal constituents, including M2, S2, N2, K2, K1, O1, P1, and Q1, are extracted from OTPS (OSU Tidal Prediction Software). The model is forced by wind stress, solar radiation, and heat and freshwater fluxes that are derived from the ECMWF (European Centre for Medium-Range Weather Forecasts) ERA-Interim dataset. Nine rivers entering the BS, the Yellow Sea, and the East China Sea are included, including the Liao River, Luan River, Hai River, Yellow River, Yalu River, Han River, Huai River, Yangtze River, and Qiantang River. Their freshwater discharges are obtained from the China River and Sediment Bulletin (http://www.mwr.gov.cn/sj/tjgb/zghlnsgb/).
The biogeochemical model uses a carbon, silicate, and nitrogen ecosystem (CoSiNE, Chai et al., 2002; Xiu and Chai, 2014). The state variables include two forms of dissolved inorganic nitrogen (DIN), nitrate (NO3), and ammonium (NH4); phosphate (DIP); silicate; two phytoplankton functional groups, picophytoplankton (S1), and diatoms (S2); two classes of zooplankton, microzooplankton (Z1), and mesozooplankton (Z2); two classes of detritus, nitrogenous detritus and fast-sinking large detritus; and oxygen. In addition to physical advection and diffusion, the oxygen-related biological processes involve the net oxygen production from phytoplankton photosynthesis, respiration by zooplankton, mineralization of detritus, and nitrification. The oxygen conservation equation is given as
where t represents time; x and y represent the two horizontal directions, and z represents the vertical direction; u, v, and w represent the velocities in the x, y, and z directions, respectively; and Kh and Kv are the horizontal and vertical diffusivities, respectively. The first and second terms on the right-hand side of (Eq. 1) denote the oxygen changes that are due to advection and diffusion, respectively. The term PP is the net oxygen production due to photosynthesis. The term BOC is the biological oxygen consumption, which is the sum of the zooplankton respiration, detritus mineralization and nitrification. The term FDO represents the boundary oxygen fluxes at the air-sea interface.
The initial conditions of nitrate, phosphate, silicate, and DO are derived from the WOA13 climate state data in January, and the other ecological variables are set to small positive values. The open boundaries of the biogeochemical variables are prescribed from the biogeochemical hindcast for the global ocean provided by the CMEMS (Copernicus Marine Environment Monitoring Service) (https://marine.copernicus.eu/).The parameter settings in the model are detailed in Zhang et al. (2022). The simulation is initialized on 1st January 2006. After spinning up of 8 years, the model results between 2014 and 2019 were used for analysis in this study.
2.3 Calculations of CF and PEA
2.3.1 Cost function
Cost function (CF) is a statistic metric that represents the difference between the simulation and observation compared to the fluctuation of the observation. Mn is the simulated results; Dn is the observed data. N is the sum of stations contained in the observed data, and n is the number of the station. CF is followed as
CF< 1 indicates very good simulation, 1< CF ≤ 2 indicates good simulation, 2< CF ≤ 5 indicates average simulation, and CF > 5 indicates poor simulation.
2.3.2 Potential energy anomaly
Potential energy anomaly (PEA), first proposed by Simpson in 1981 (Simpson, 1981), refers to the mechanical energy required to completely destroy stratified water bodies. It is used in this study as a quantitative index to represent water column stability and stratification intensity. The PEA (J/m3) is given as
where g is the gravity acceleration (m/s2); H is the water depth (m); ρ is the density at depth z and is the mean density of the water column (kg/m3).
3 Results
3.1 Model validation
To validate the model results in the BS, simulated temperature, salinity, and DO are compared with the observations in 2015, 2016, 2018, and 2019. It is noted that comprehensive validation in 2014 has been made in Zhang et al. (2022). Statistic metrics of the correlation coefficient r, root mean square error RMSE, and CF are used here to evaluate the model performance.
3.1.1 Bottom temperature
The simulation shows high temperatures at the bottom near the coast and the central bank and relatively low temperatures in the deep depressions in those years, indicating offshore temperature fronts associated with tidal mixing. The model reproduces the cold waters in the depressions around the central bank (Figures 2A-D). It is noted that the temperature is much lower near the Bohai Strait which is affected by the intrusion of the Yellow Sea Cold Water Mass. Taylor plots (Figure 2E) and linear fitting (Figure 2F) show the measurement of observed and simulated data, with a standard deviation of approximately 1 and an overall correlation of 0.91. The model simulates the bottom temperature well in summer with an overall RMSE of 1.96 °C and CF of 0.35.
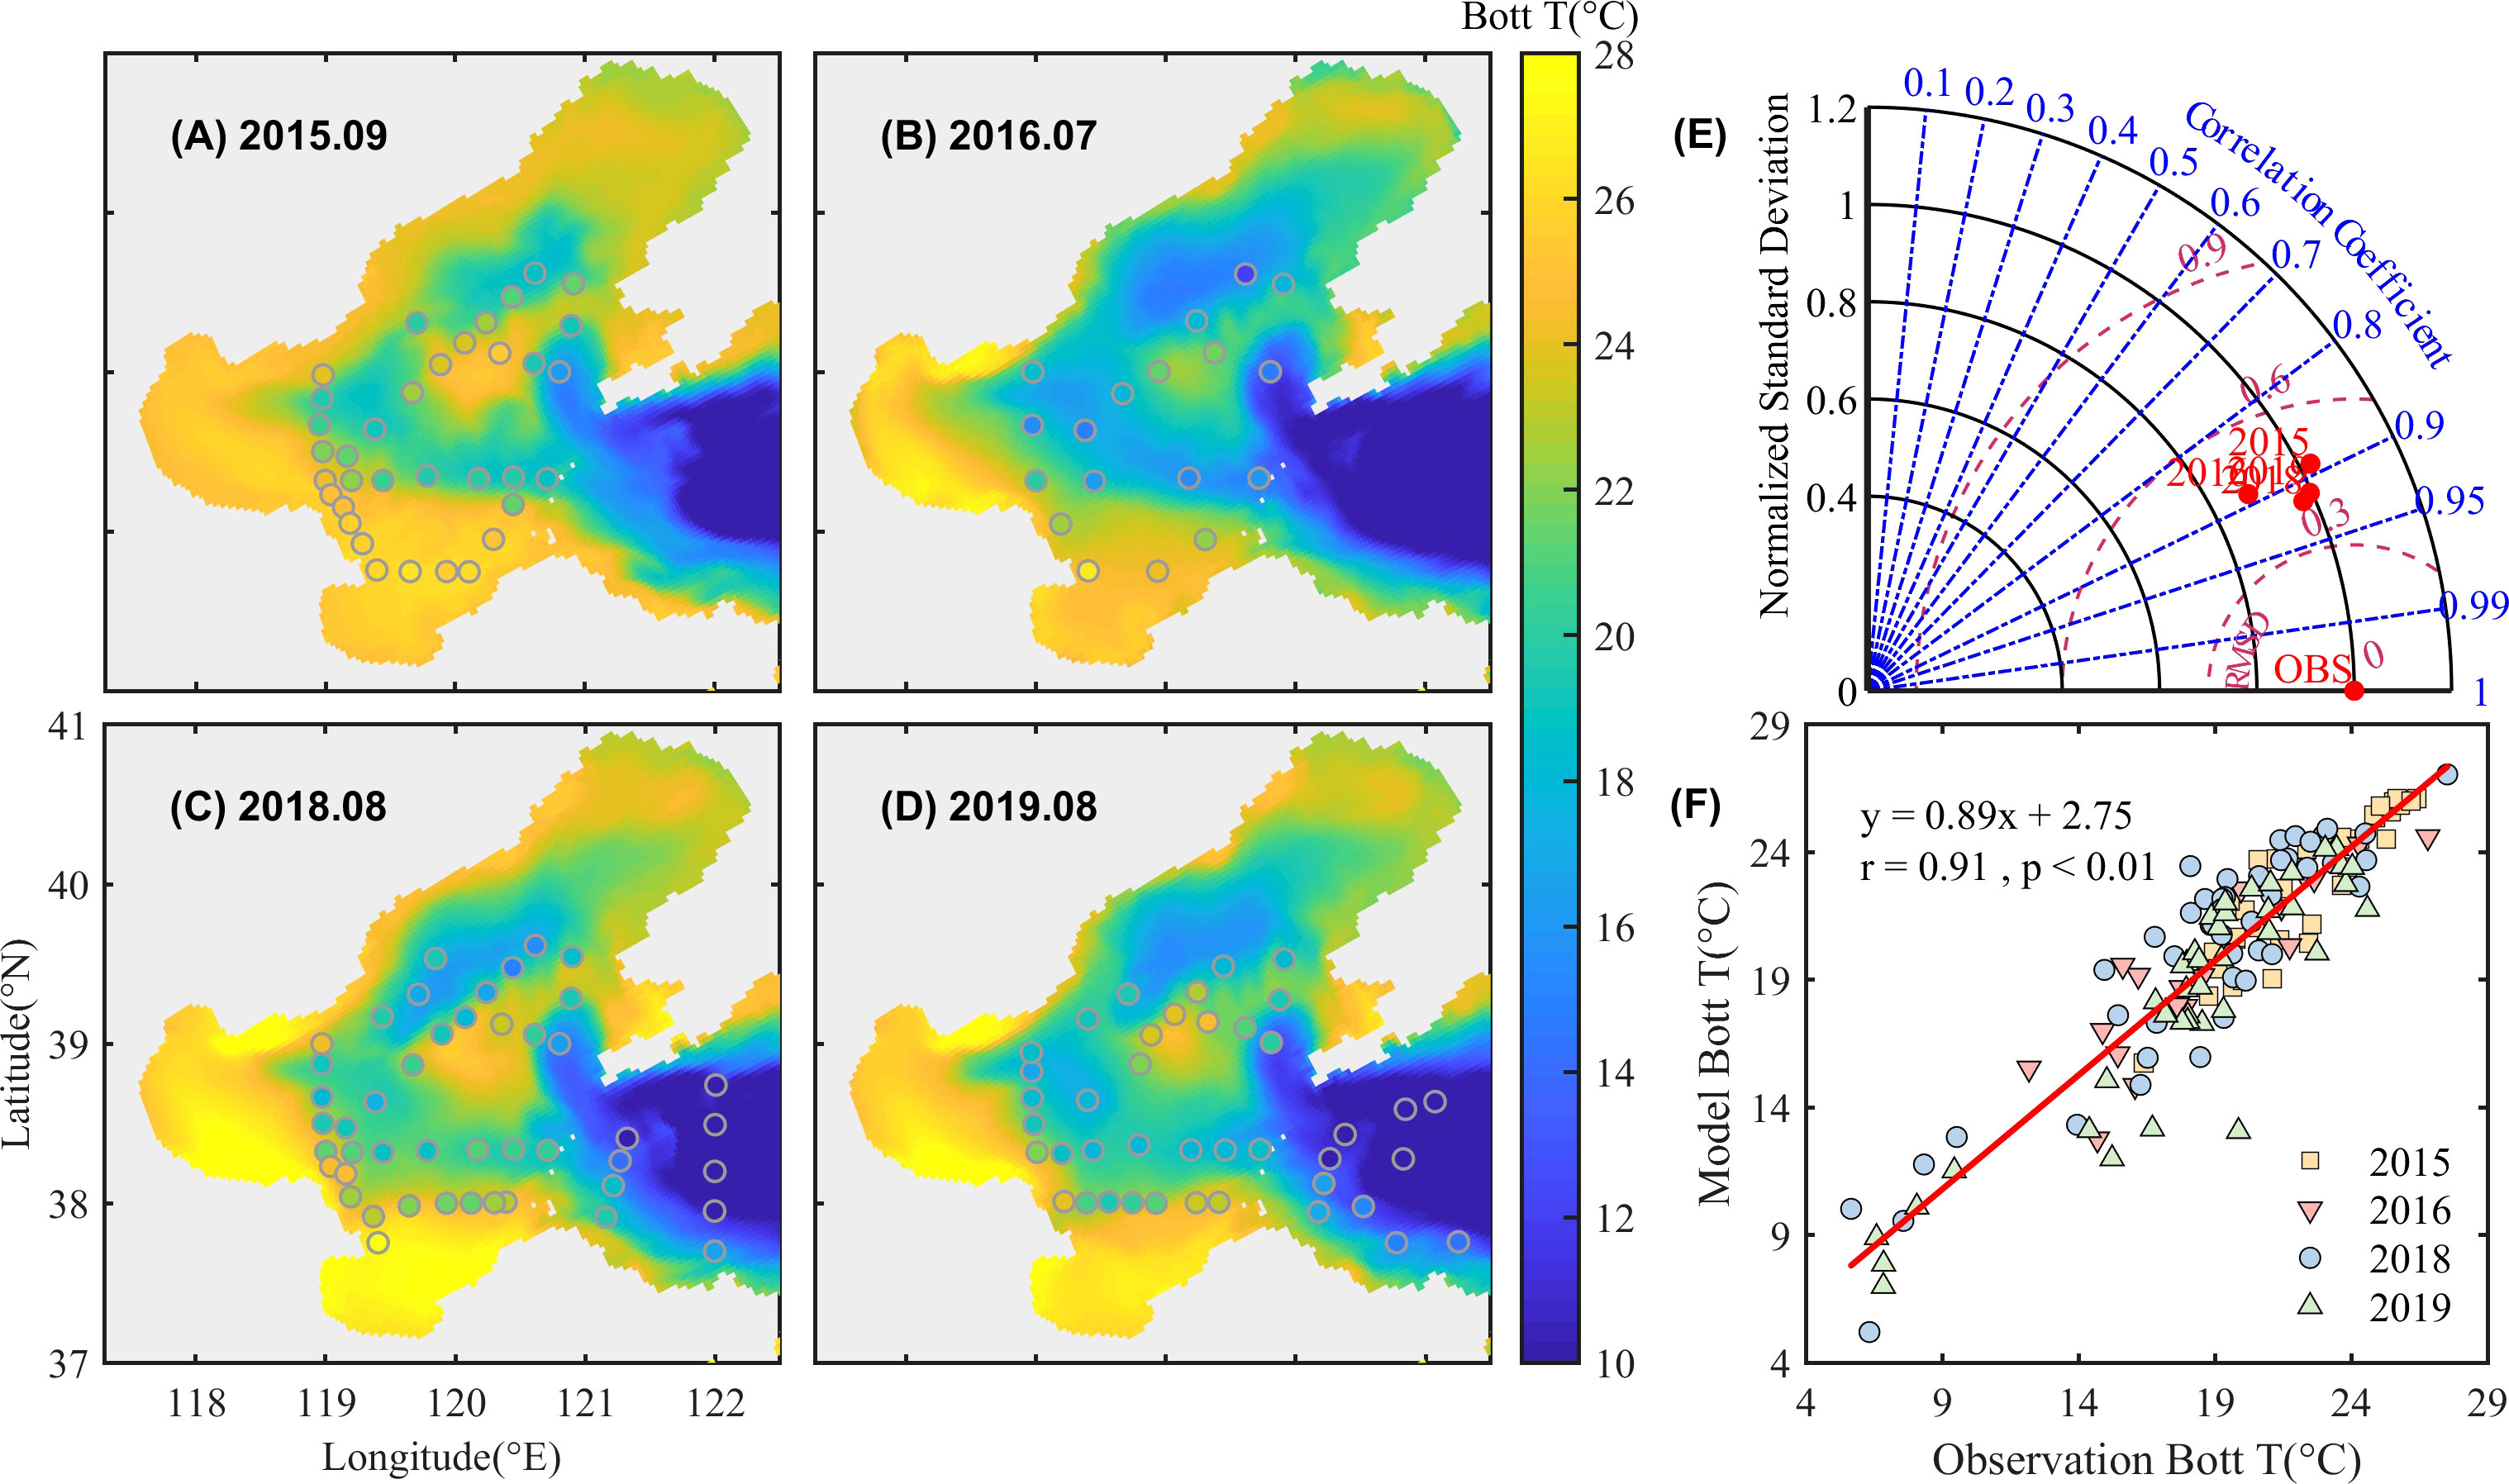
Figure 2 Simulated and observed bottom temperature in September 2015 (A), July 2016 (B), August 2018 (C), and August 2019 (D). The background color is the simulated data, and the solid points denote observations. Taylor plots (E) and linear fitting (F) of simulated and observed data are also given.
3.1.2 Surface salinity
The model reproduces the low salinity in the coastal and estuarine areas, and the high salinity in the central BS (Figures 3A–D). Due to the enhanced runoff of the Yellow River in 2018 and 2019 (1.27 and 1.18 × 10⁴ m3/s in 2018 and 2019, 5.25 and 3.14 × 10³ m3/s in 2015 and 2016, S1), the low salinity water spreads more eastward and northward to the Laizhou Bay estuary and the middle BS. The standard deviation is around 2 in 2015, 2016, and 2018, and less than 1 in 2019 (Figure 3E). Overall, the simulated and observed surface salinity agrees well with a total correlation of 0.76, RMSE of 0.87, and CF of 0.58 (Figure 3F).
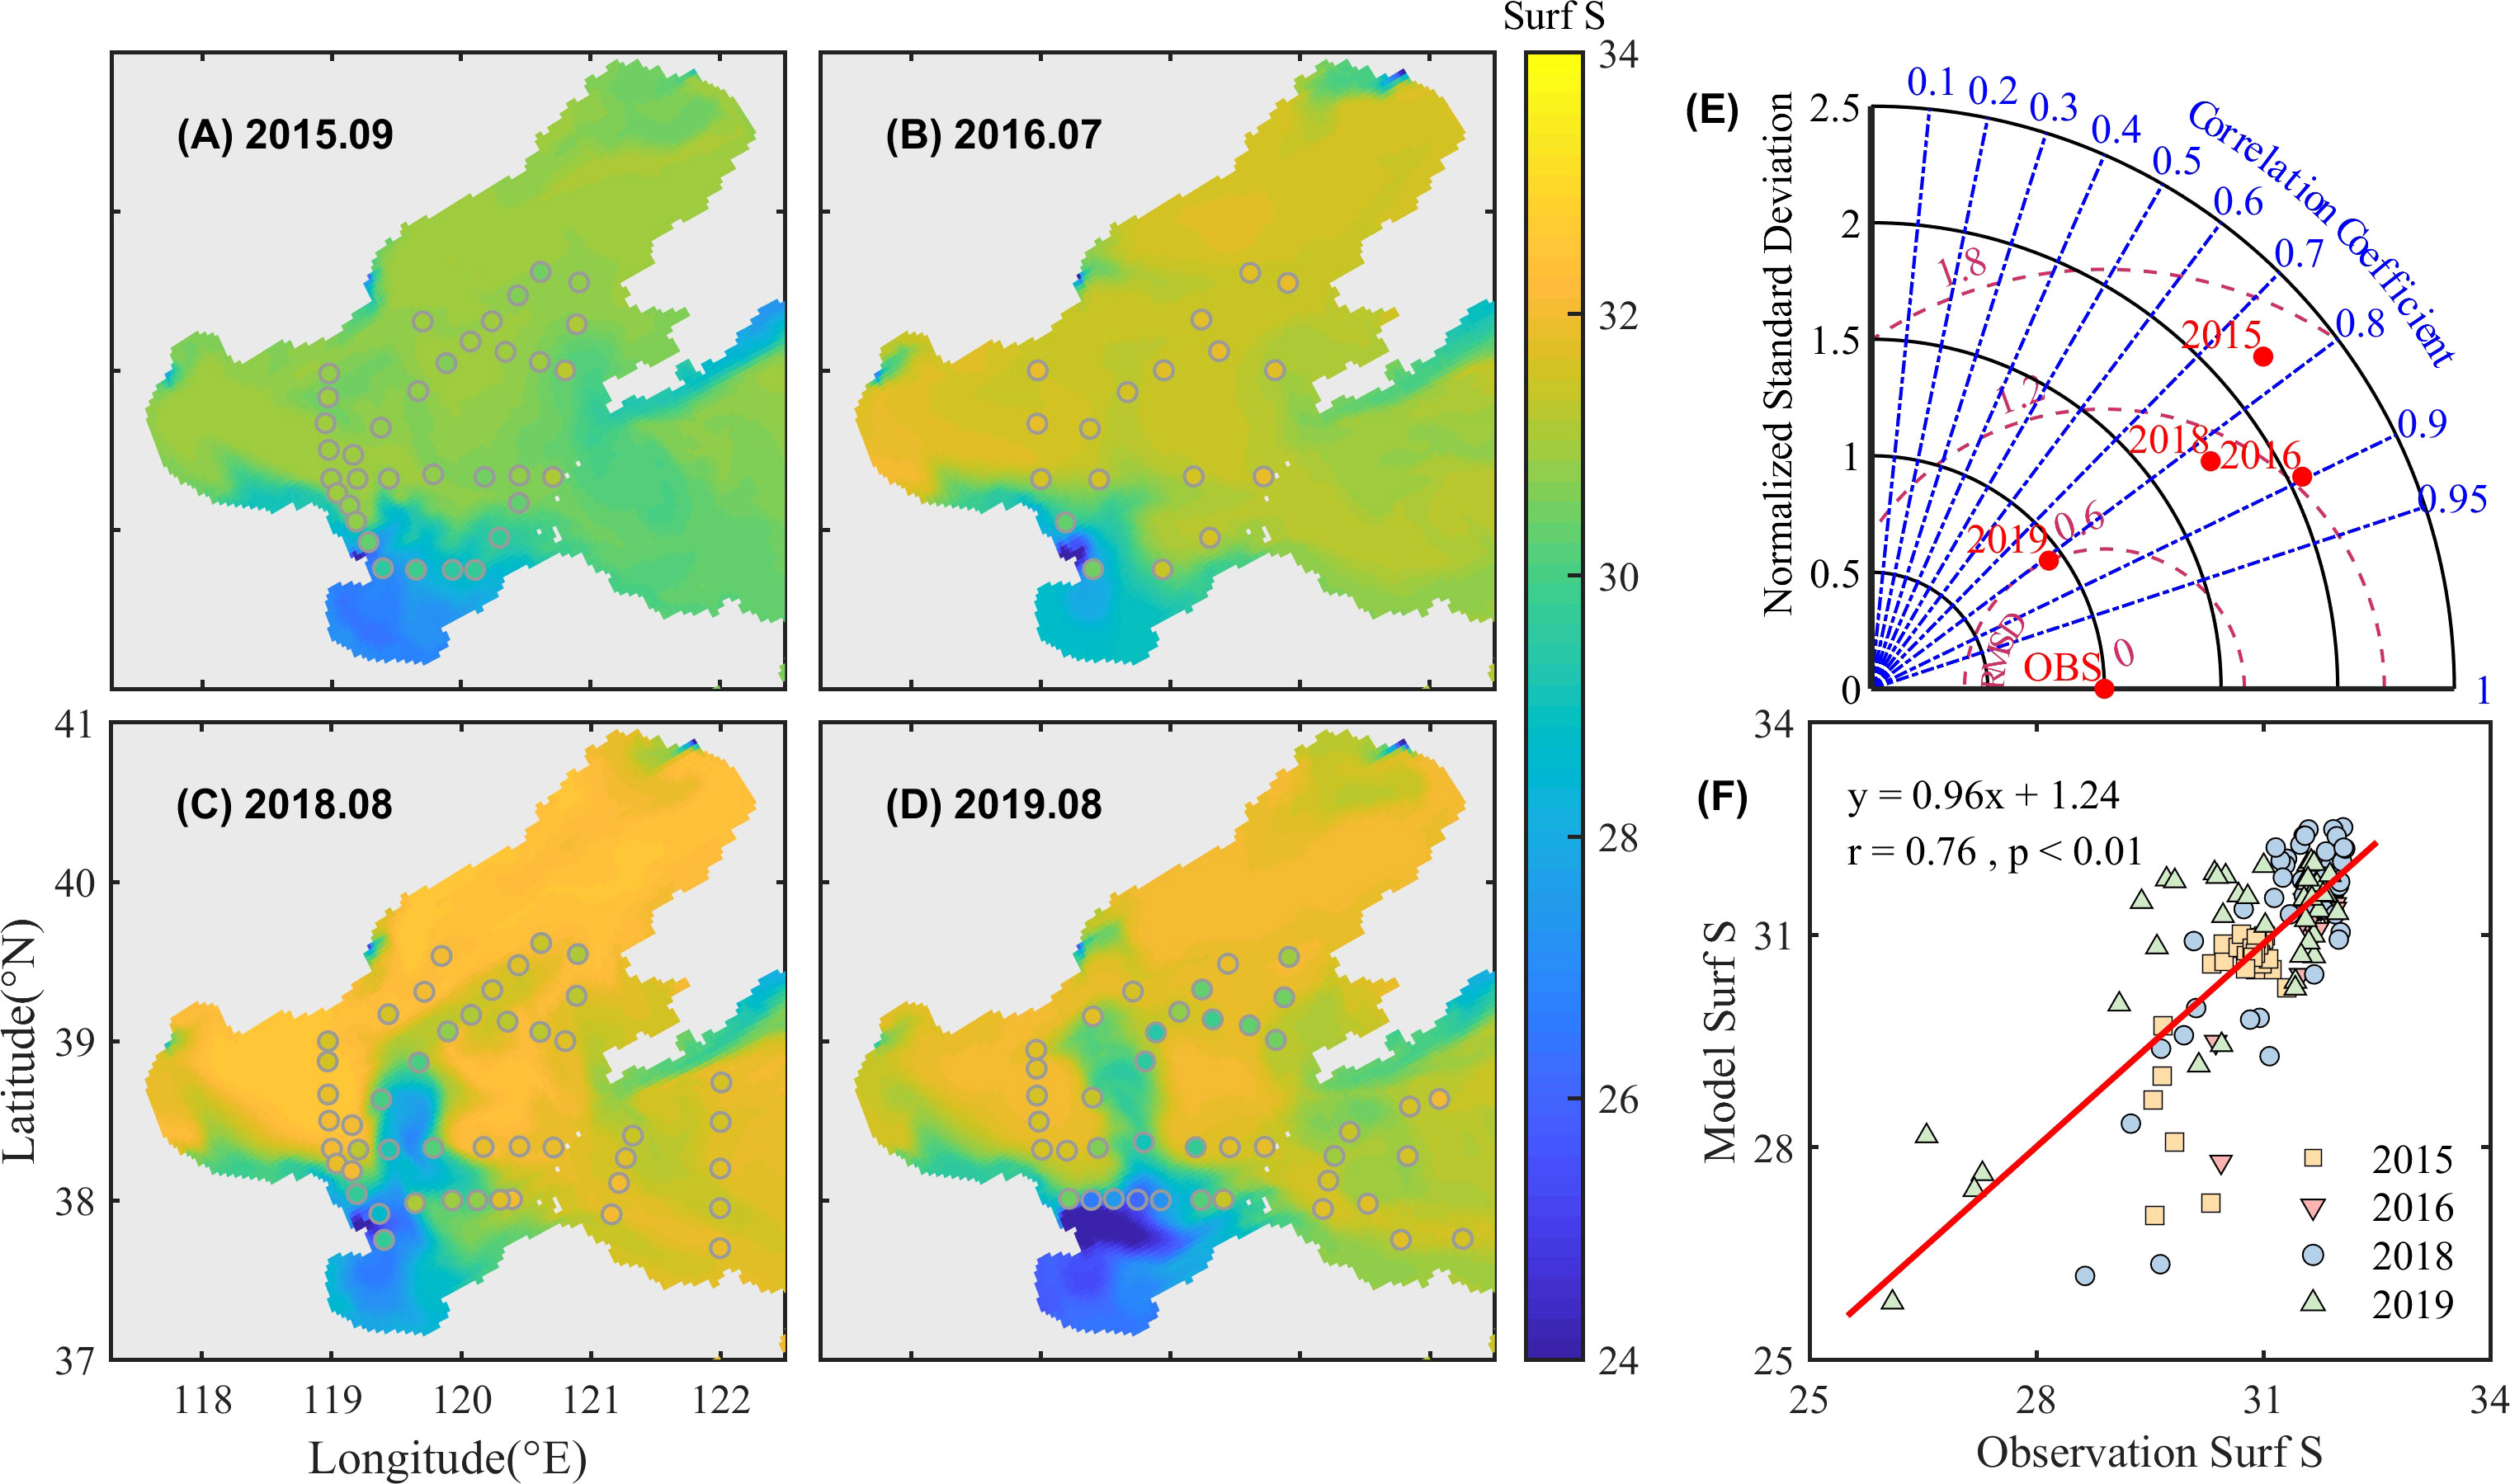
Figure 3 Simulated and observed surface salinity in September 2015 (A), July 2016 (B), August 2018 (C), and August 2019 (D). The background color is the simulated data, and the solid points denote observations. Taylor plots (E) and linear fitting (F) of simulated and observed data are also given.
3.1.3 Bottom dissolved oxygen
Figure 4 shows the comparison of simulated and observed DO concentrations in the bottom water in summer. The model reproduces the spatial distribution of oxygen depletion which generally corresponds to the cold waters, mainly in the northern, western, and southern depressions to the central bank. Both model and observations indicate that DO concentration near the river estuary in 2018 and 2019 with higher Yellow River runoff, is relatively lower than other years (including 2014 through 2017). Though overestimation in 2016, the model essentially captures the spatial and interannual variation patterns of the observed DO with an overall correlation of 0.69, RMSE of 36.62 μmol/L, and a CF of 0.61.
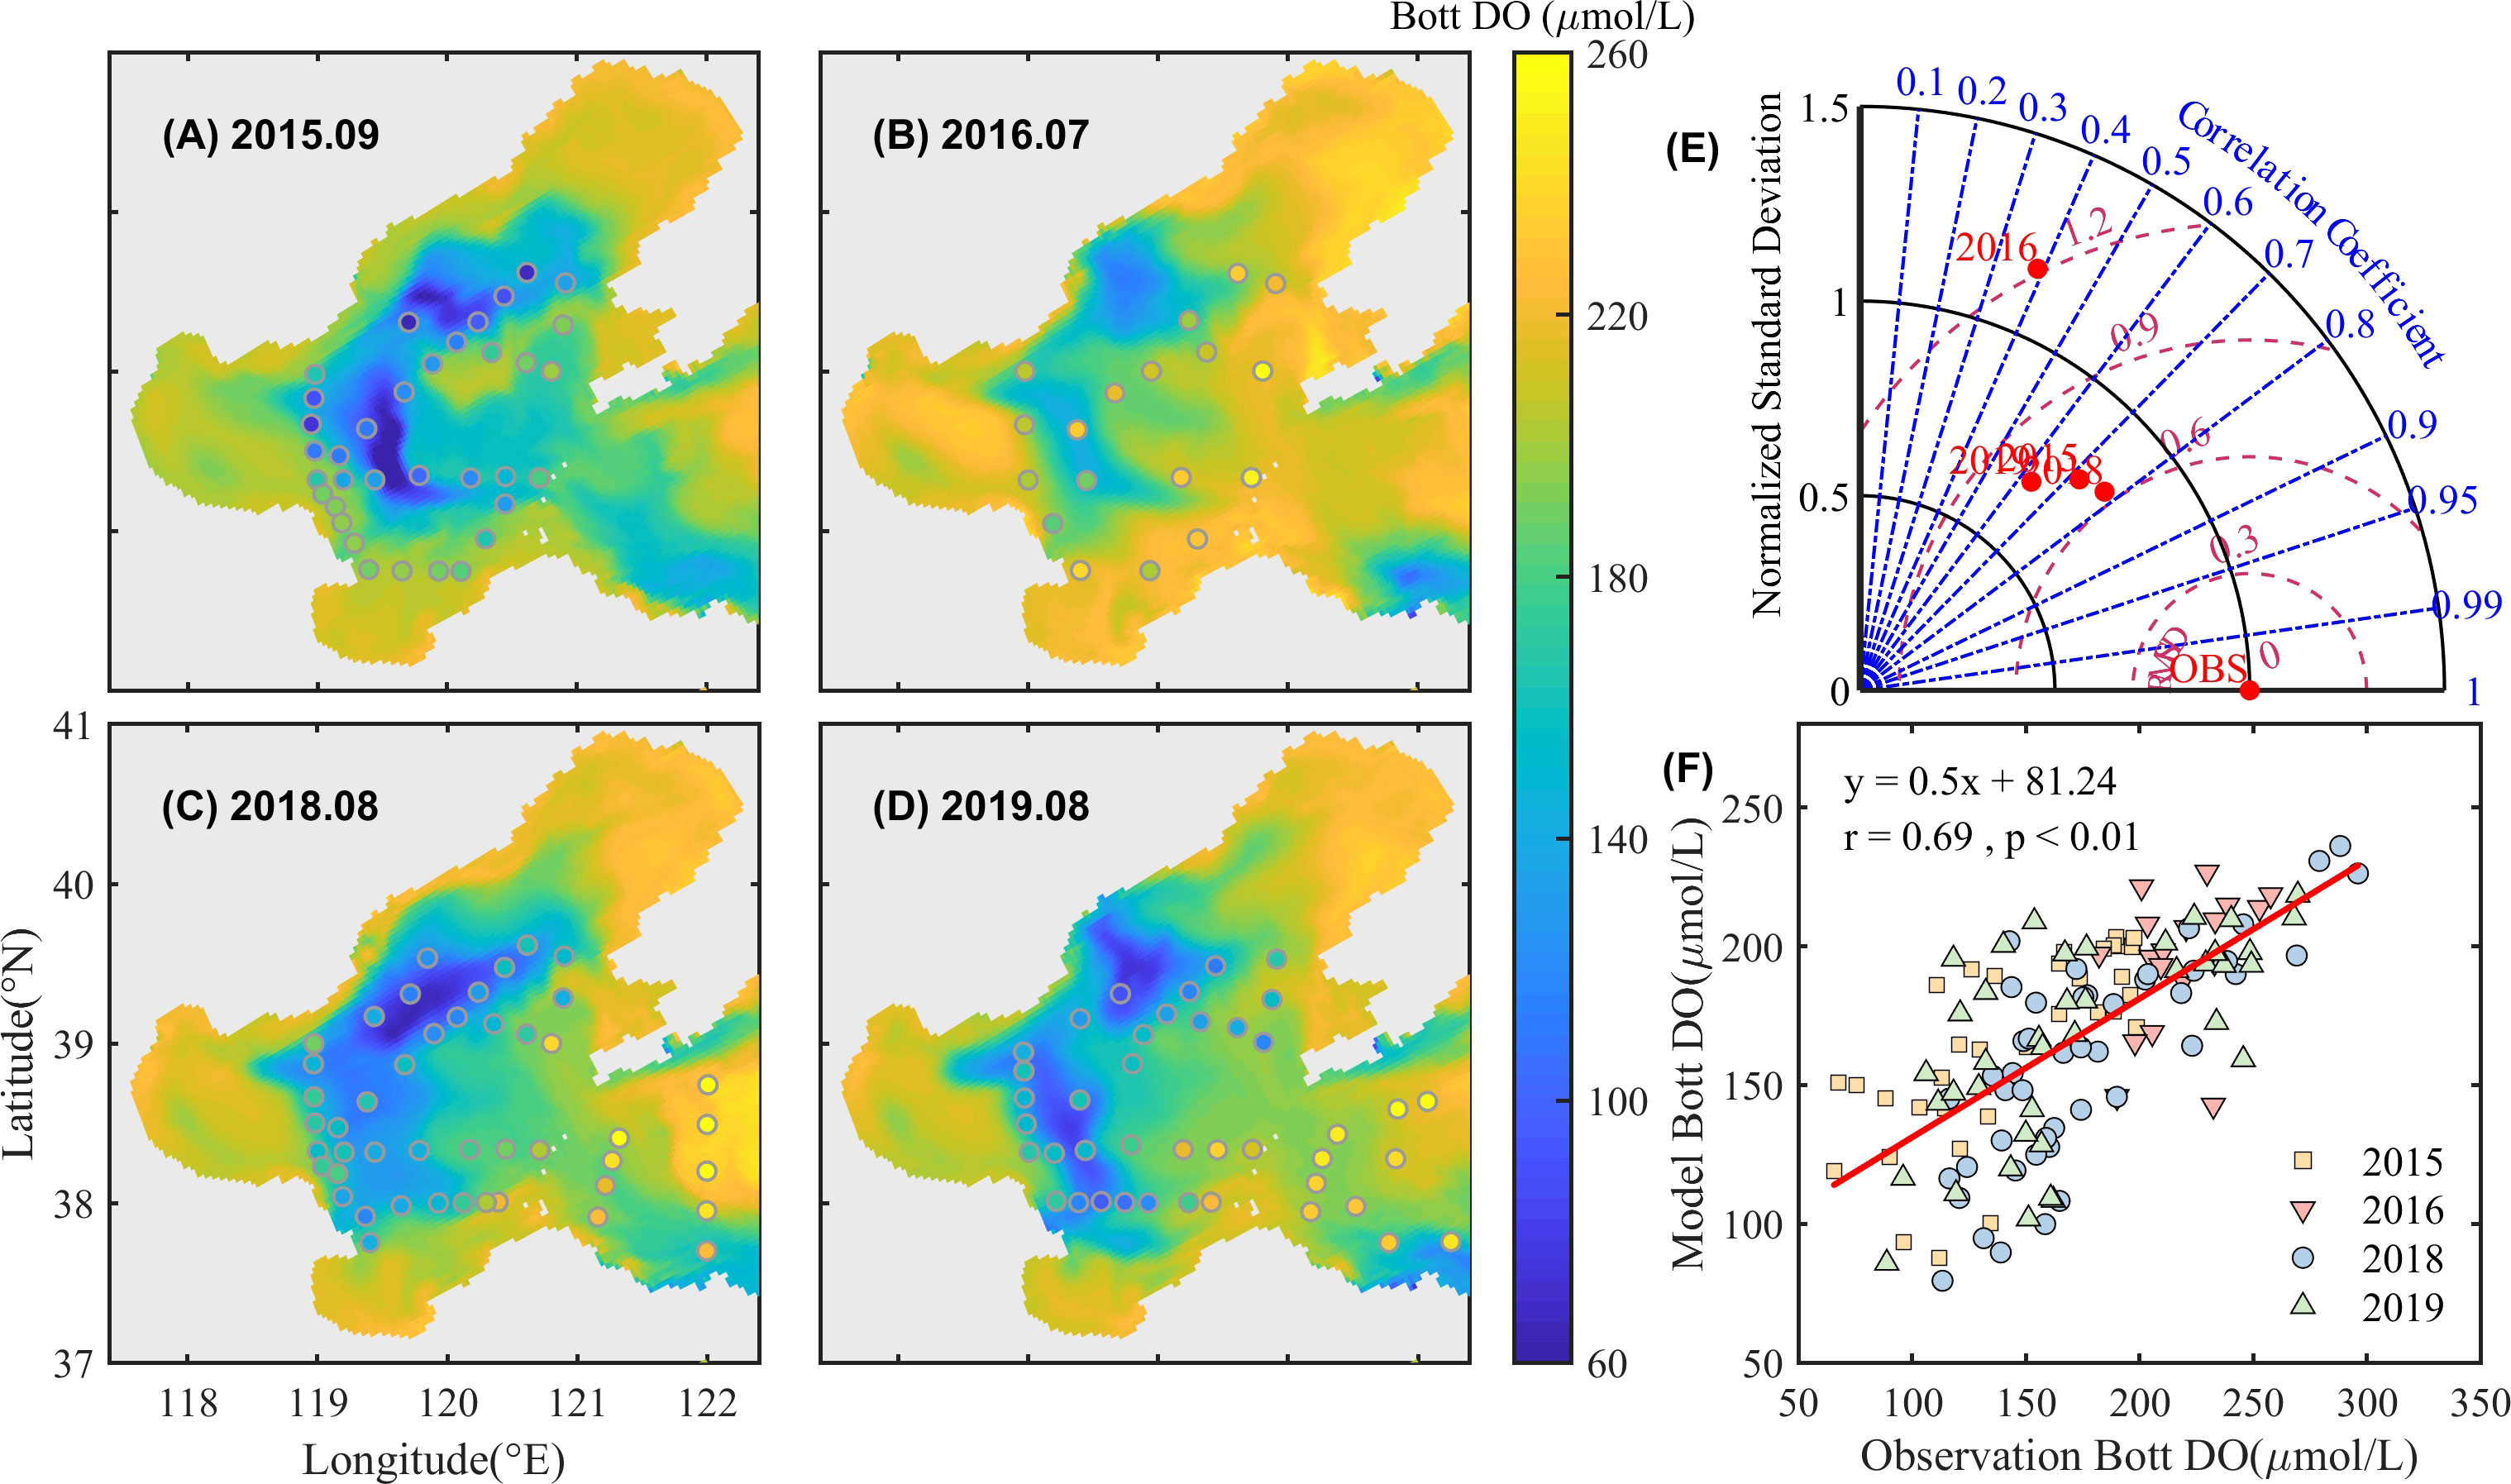
Figure 4 Simulated and observed bottom DO concentration in September 2015 (A), July 2016 (B), August 2018 (C), and August 2019 (D). The background color is the simulated data, and the solid points denote observations. Taylor plots (E) and linear fitting (F) of simulated and observed data are also given.
Comparisons show that the model performs well to reproduce the spatial and interannual variations of important variables and is used for further analyses on oxygen depletion.
3.2 Oxygen depletion hotspots: the southern and northern oxygen depleted cores
Figures 5A–F show the annual minimum DO concentrations from 2014 to 2019 (August 31, 2014 and 2015, August 15, 2016 and 2017, and August 10, 2018 and 2019) to reflect the most severe oxygen depleted conditions in the bottom water. In summer, oxygen depletion mainly occurs in the depressions around the central bank, especially in offshore areas off Qinhuangdao and the Yellow River estuary, indicating the two oxygen depleted zones. The distribution of the southern and northern zones, also called as “dual-core”, has been frequently described in previous studies (Zhao et al., 2017; Zhang et al., 2022). In this study, a threshold of DO< 3mg/L is used to define as oxygen depleted cores, to quantitatively analyze the similarities and differences in DO concentration variations between the southern and northern zones. Two separated cores of the oxygen depletion are identified all through 2014 to 2019, though the location and area of the cores varying among these years. As a whole, the northern core (NC) is located off Qinhuangdao, and the southern core (SC) is located on the southwest side of the central bank.
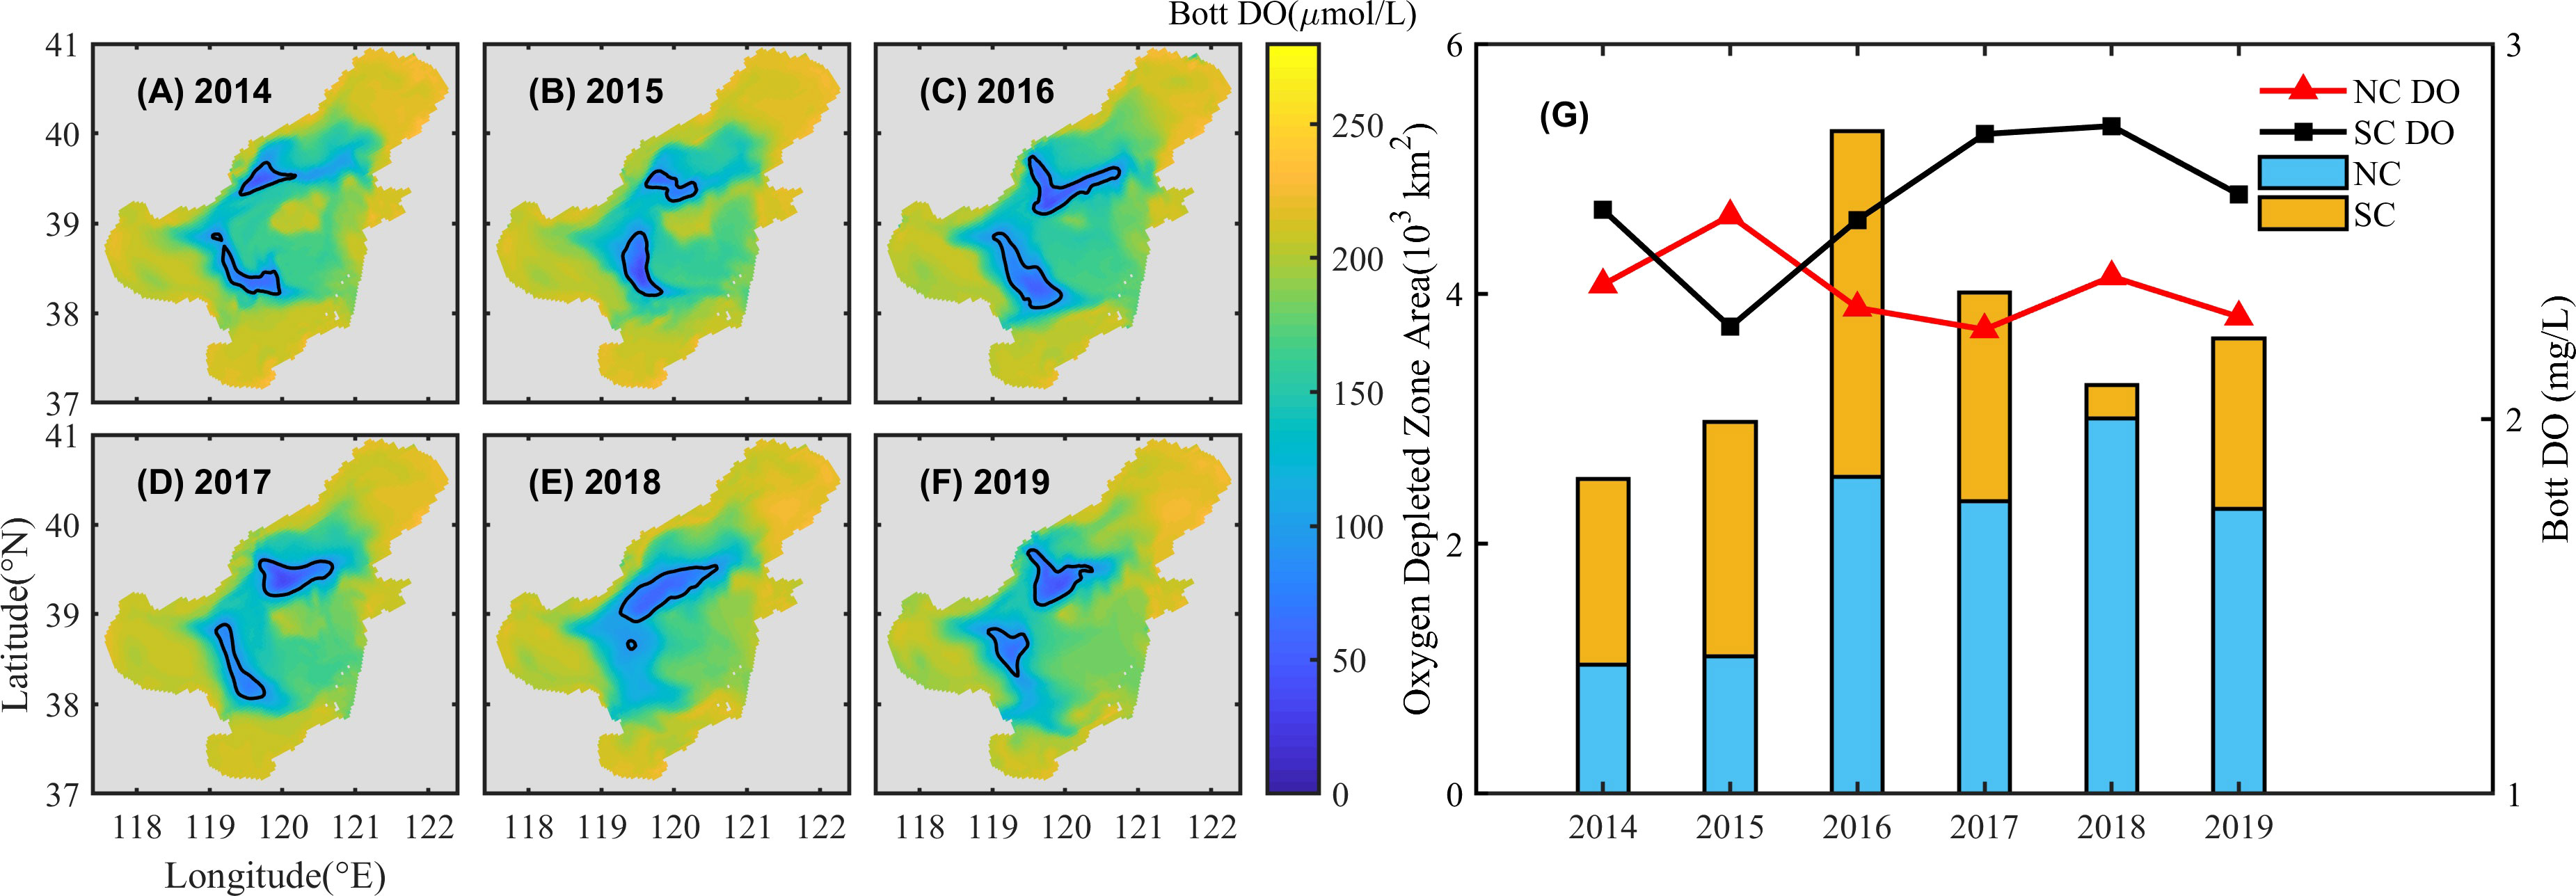
Figure 5 The minimum DO concentration of the bottom water and distribution of the NC and SC (A–F) and annually averaged minimum DO concentration (mg/L) and averaged area (×103 km2) of the NC and SC (G) from 2014 to 2019. The solid black line in A~F indicates the extent of the two cores. The orange and blue bar in G are the averaged area of the SC and NC, respectively. The solid red triangle and black square are the averaged minimum DO concentration of the NC and SC, respectively.
The total area of oxygen depletion with DO< 3mg/L ranges from 2.5 to 5.3 × 10³ km2, with notable interannual variations. In 2014, the total area is the smallest and gradually increases to the maximum in 2016, and the total area is between 3.3 to 4.0 × 10³ km2 from 2017 to 2019. The bottom averaged minimum DO concentration is overall greater than 2mg/L, and tends to be lower in the NC than that in the SC (except for 2015, Figure 5G), moreover, the averaged area of the NC from 2014 to 2019 (2 × 10³ km2) is larger than that of the SC (1.6 × 10³ km2), indicating that the oxygen depletion in the NC is more severe than that in the SC.
3.3 DO concentration variations in the NC and SC
The time series of bottom averaged DO concentrations from June to September and the oxygen depletion duration (with DO< 4mg/L) are shown in Figure 6. Among these years, the oxygen depletion in the NC and SC shows a similar development and disappearance, with DO concentration decreasing significantly in June and July, and almost simultaneously reaching the minimum in August or early September, then increasing. Although the trend of DO concentration variations is similar, the timing of oxygen depletion recession exists interannual differences. For example, in 2014 and 2015, oxygen depletion disappears at the end of August, while advancing to early August in the 2018 and 2019. When the DO concentration increases, it shows a sharp increase first and then a slow increase in 2019, while a steady increase in other years.
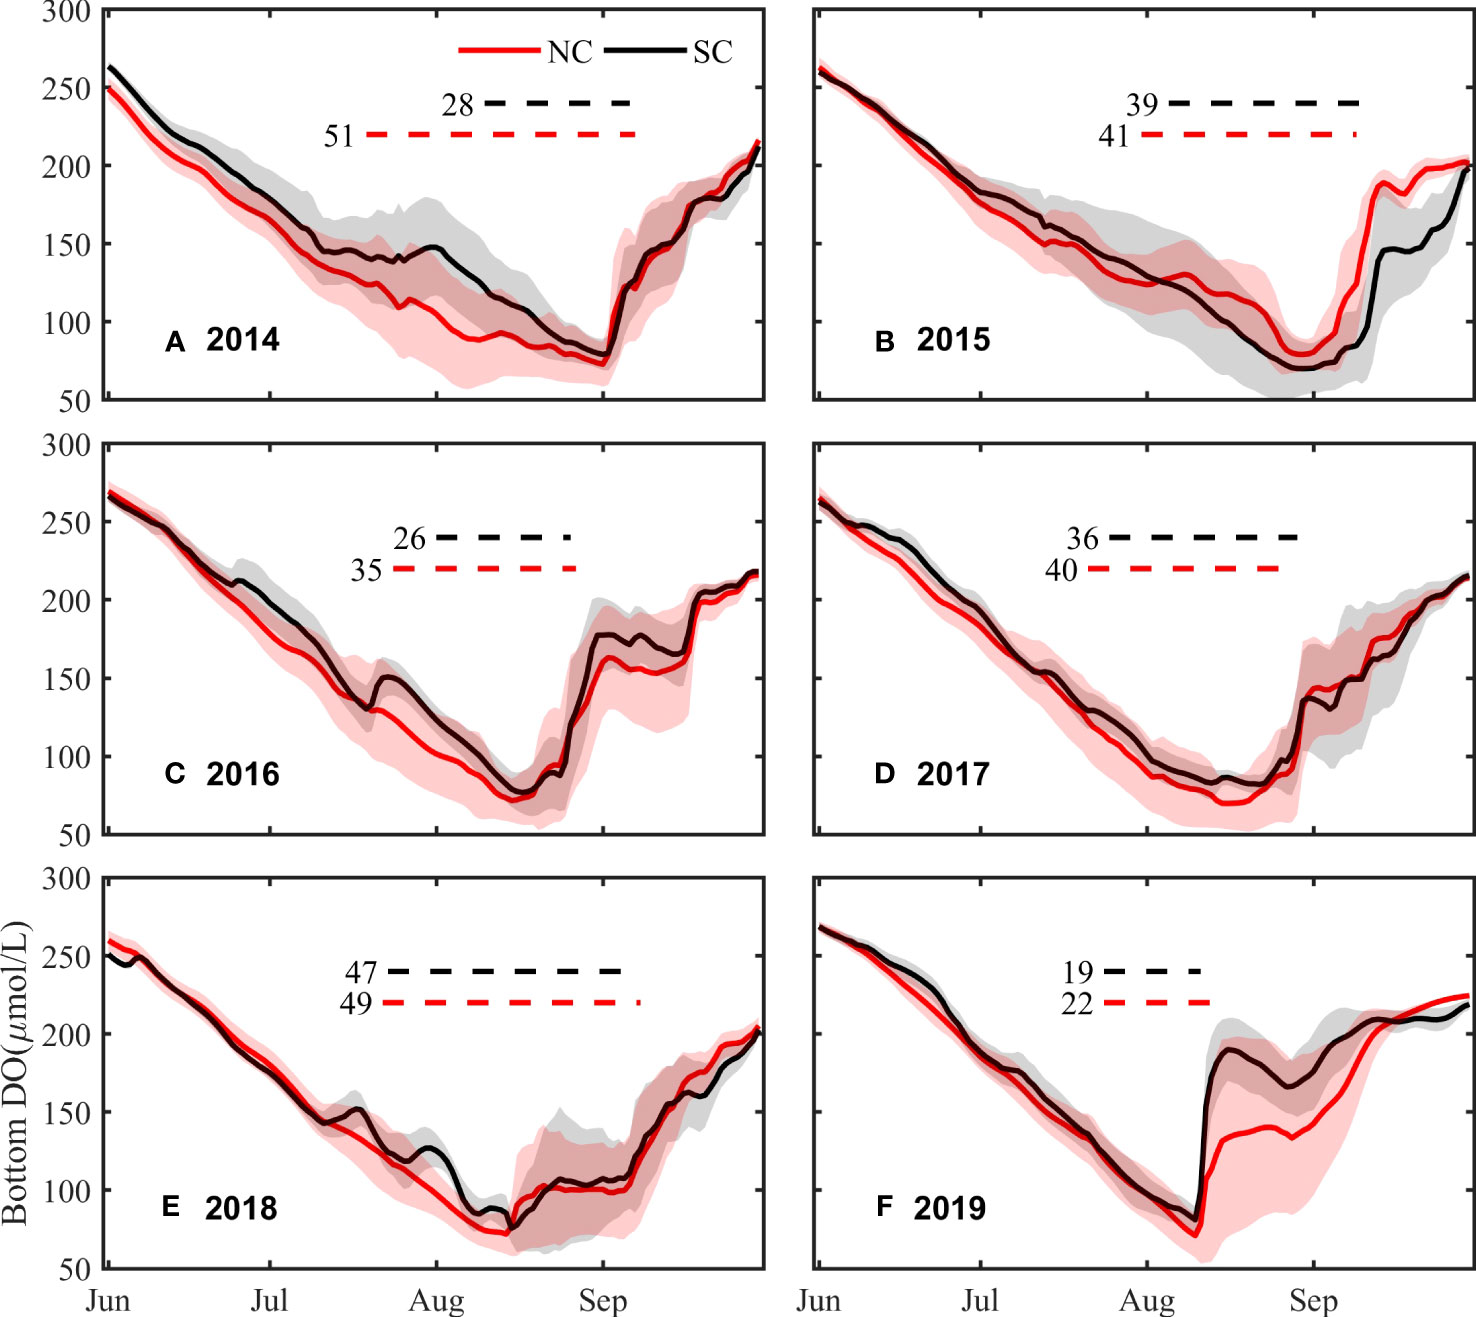
Figure 6 Time series of DO concentration variations (solid line) from Jun to September in the NC and SC from 2014 to 2019 (A–F) and duration of DO < 4 mg/L (dotted line). Red: in the NC. Black: in the SC. Numbers: the days of DO < 4 mg/L.
During the development of oxygen depletion, the DO concentration in the NC slowly decreases at a relatively constant rate, while the DO concentration in the SC experiences sudden fluctuations, such as the sudden increase in the DO concentration in the SC in July of 2014, 2016 and 2018 (Figure 6). In addition, the DO concentration in the core zones decreases below 4 mg/L around mid-July, with the SC slightly later than the NC, except for 2014, when the DO concentration in the SC decreases below 4 mg/L until early August 2014, nearly 20 days later than that in the NC. As a whole, DO concentrations during July to August shows significant difference between the SC and the NC by statistical analysis (p=0.05). The duration of DO< 4 mg/L also has interannual differences, with a minimum of only about 20 days in 2019 and a maximum of 50 days in 2014 and 2018. Meanwhile, the duration in the NC is longer than that in the SC, with an average of 39.7 days and 32.5 days, respectively.
4 Discussion
4.1 Oxygen budget processes in the NC and SC
Local organic material decomposition and vertical stratification of the water column are the main reasons for oxygen depletion in the BS (Chen et al., 2022a). Meanwhile, lateral transport in the ocean also affects the development and distribution of oxygen depletion (Zhang et al., 2022). To compare the contribution of the physical and biogeochemical processes to the DO concentration variations in the NC and SC, oxygen budget of the bottom water (i.e. the lower layer) in these two cores are estimated (Figure 7). Considering that the water column is characterized by two vertical layers in summer. The lower layer is defined here as the water column that is located between the sea floor and the lower boundary of the pycnocline (N2 > 10−3 s−2) in stratified areas or the depth of vertical maximum N2 in non-stratified areas. The time series of oxygen budget items in the two cores has similar trends. The biological oxygen consumption in autumn and winter is small, but increases in spring and exceeds 4 μmol·L-1·d-1 in summer. The increase in sea surface wind speed in September enhances water ventilation, thus the vertical diffusion term dominates the oxygen budget. In addition, lateral transport accounts for a small proportion of the oxygen budget, with an increase from June to September and negligible in other months.
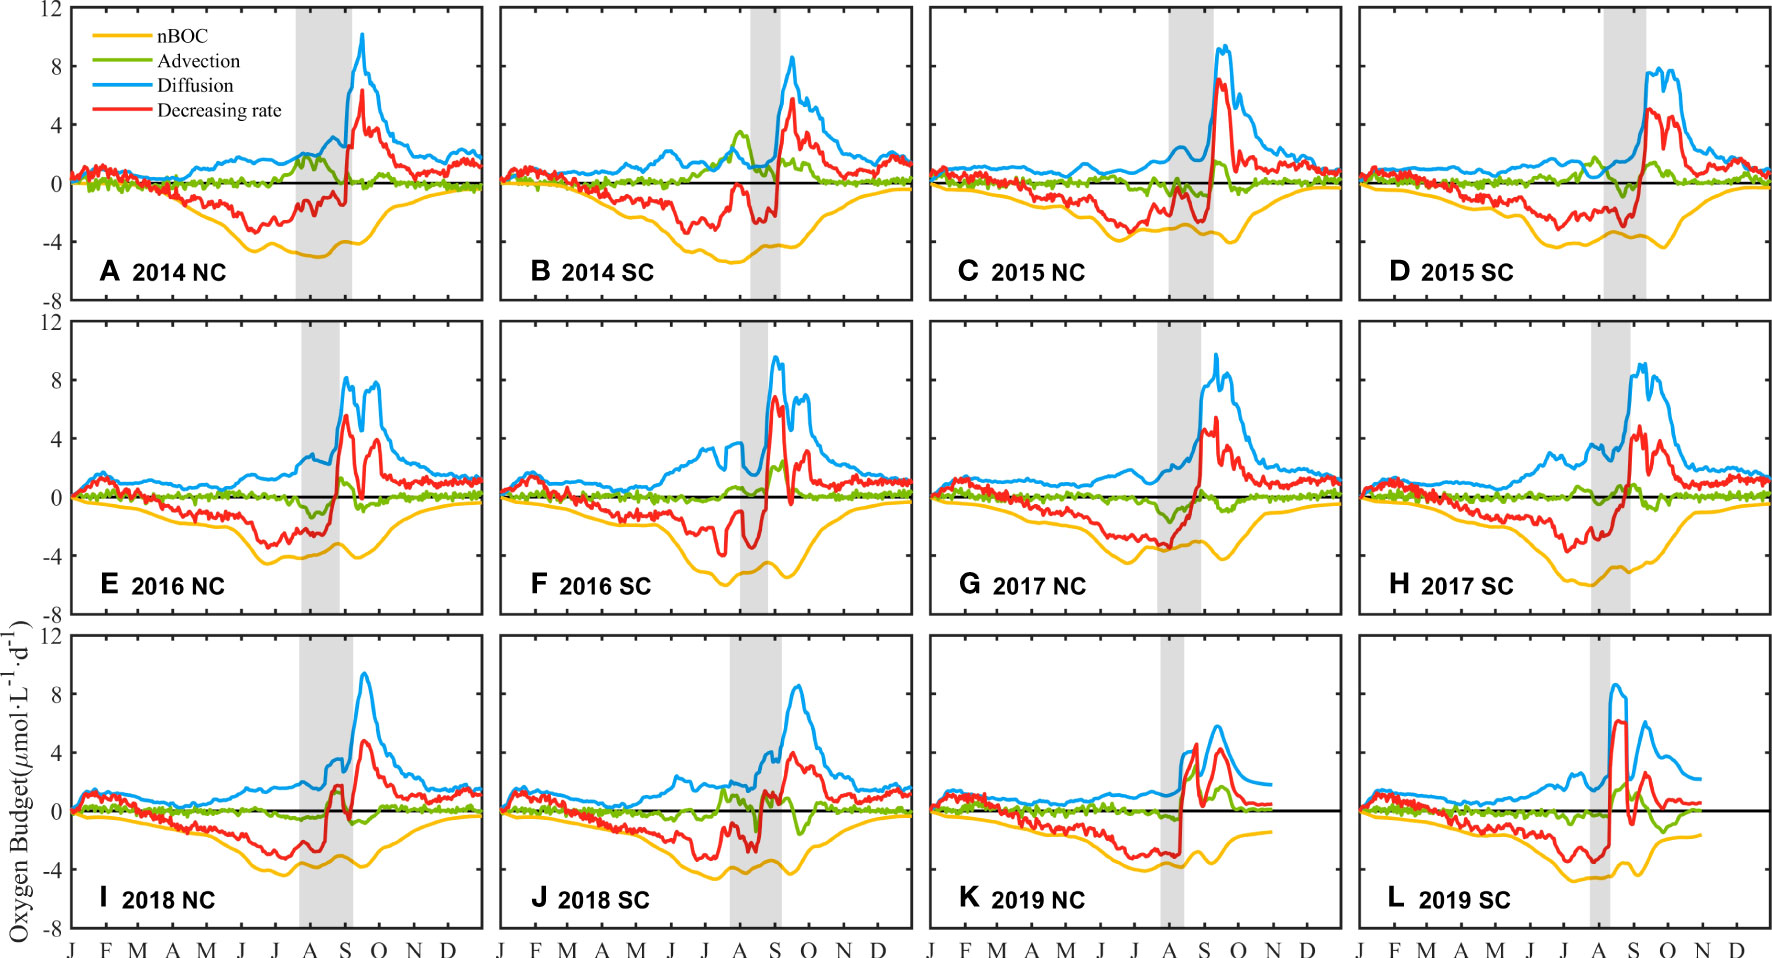
Figure 7 Time series of oxygen budget from 2014 to 2019 in the NC (A, C, E, G, I, K) and SC (B, D, F, H, J, L). Blue line: vertical diffusion. Green line: advection transport. Red line: the decreasing rate of DO concentration. Yellow line: the net biological oxygen consumption. The gray shade expresses the duration of DO < 4mg/L. The data is filtered with a window length of 15 days.
According to the evolution of oxygen depletion, the average values of oxygen budget terms from June to August in the NC and SC each year are calculated (Table 2). The result that the biological oxygen consumption in the SC is higher than that in the NC from June to August each year, indicates that the decreasing of DO concentration caused by biological metabolism is faster in the SC. The value of the vertical diffusion term shows significant interannual differences, with lower diffusion in the SC than that in the NC in 2014 and 2015 but higher during 2016 to 2019. Starting from June, the impact of lateral transport on DO concentration variations gradually increases and shows opposite effects in the NC and SC. The value of the lateral transport term in the SC is positive, while in the NC it is negative or smaller than that in the SC (except for 2019). Positive values denote that the current transports with relatively higher DO concentration, which leads to a decrease in the oxygen depletion rate, and negative values have the opposite meaning. Figure 8 shows the circulation of the BS in spring (April) and summer (July). In the SC, the current always flows westward from the Bohai Strait, which represents the replenishment of DO from the Bohai Strait and will alleviate the severity of oxygen depletion. In the NC, DO is supplemented by the northward flow from the Bohai Strait in spring, while the direction of the circulation changes in summer and shows a divergent pattern, without relatively high-oxygen water transported into this area. Besides, the circulation will transport DO out of the NC, accelerating the decrease of DO concentration.
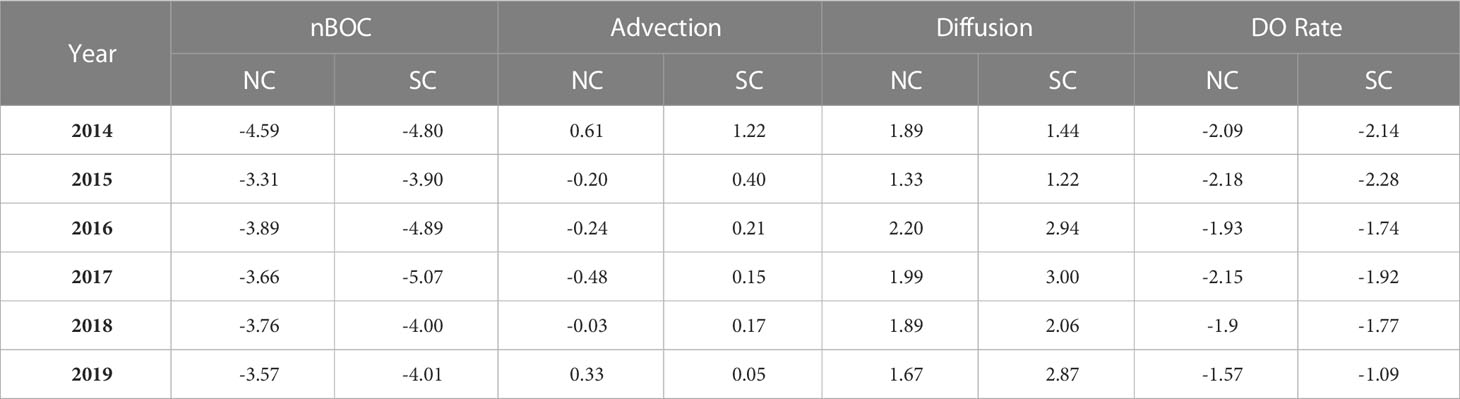
Table 2 The Averaged values of oxygen budget terms from June to August from 2014 to 2019, μmol·L-1·d-1.
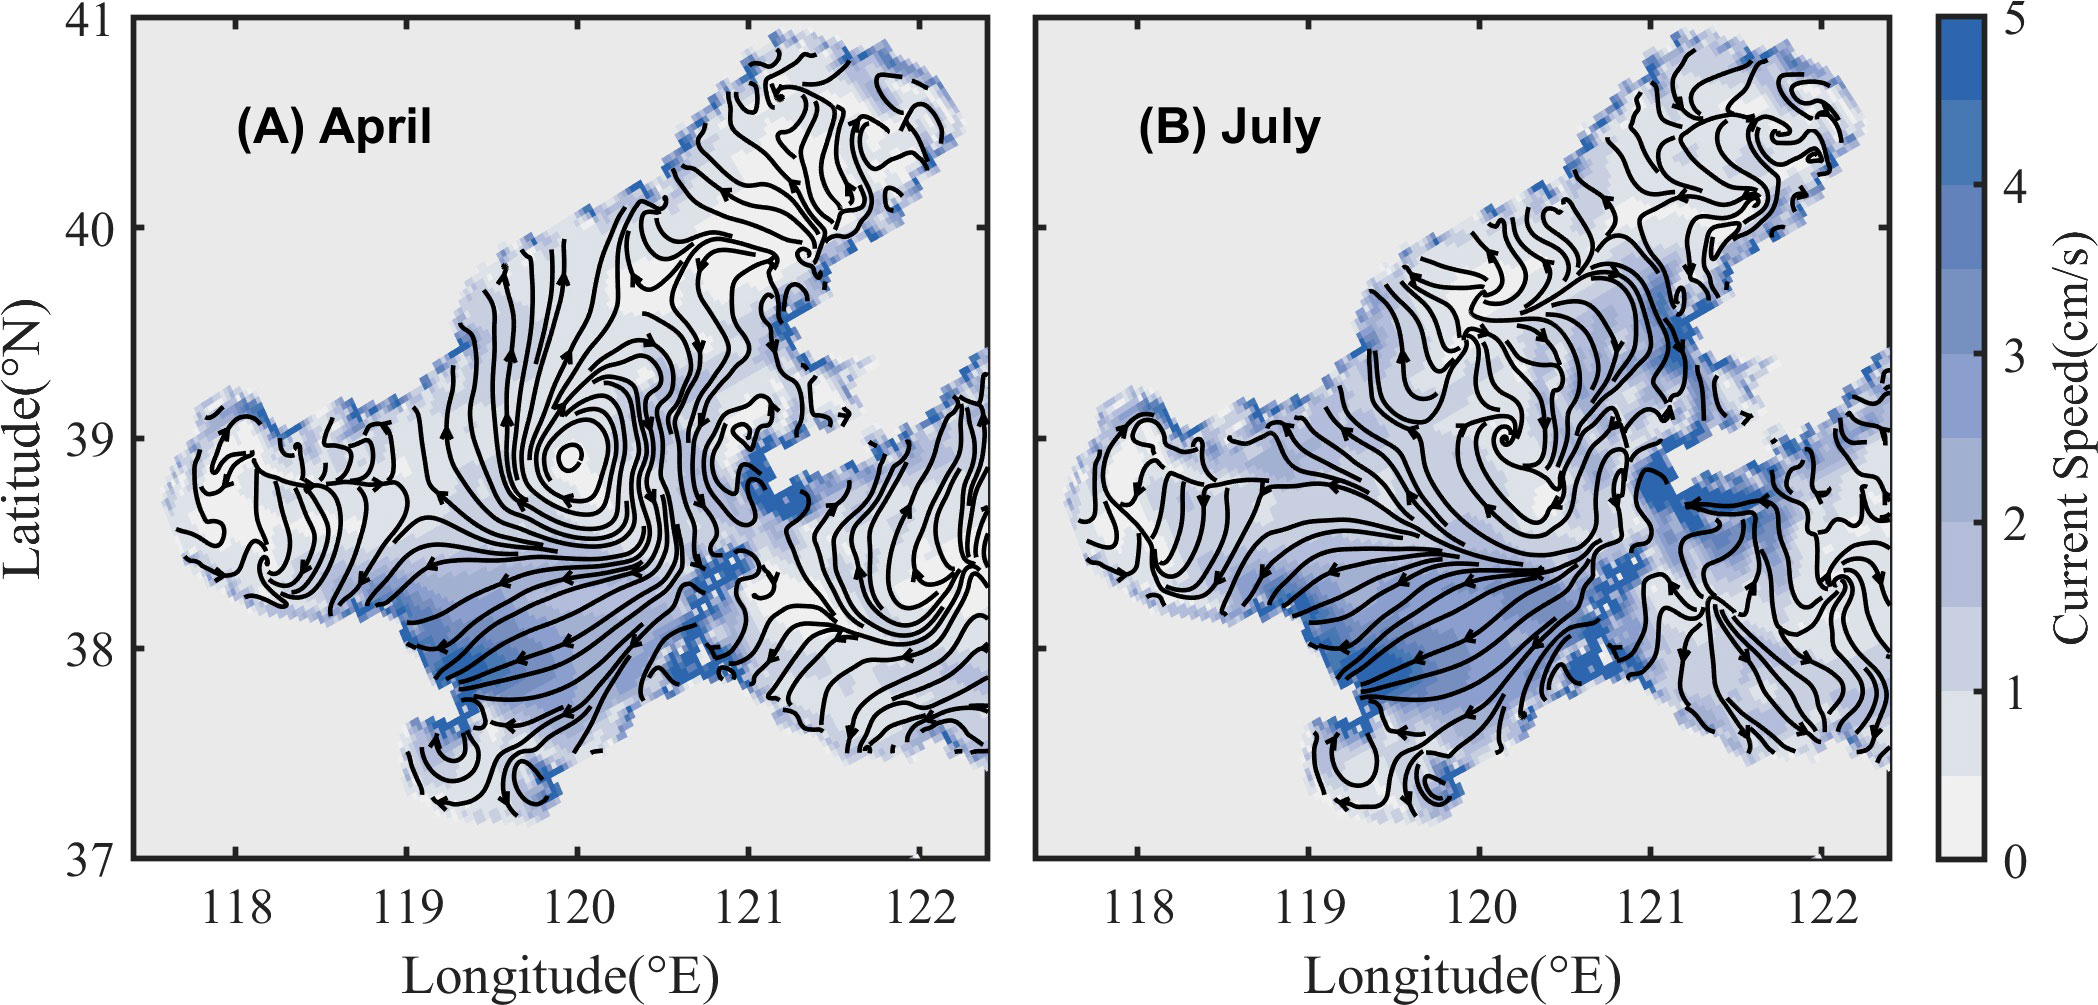
Figure 8 Bottom circulation in spring (April, (A)) and summer (July, (B)) in the BS. The solid black line indicates the direction of the circulation. Color represents the current speed.
The impact of lateral transport on oxygen depletion has been discussed in many hypoxia zones. The data obtained from a fixed mooring located on the Namibian shelf shows that anoxia is initially triggered by remote equatorial hypoxic waters after which it can be sustained by a local biogeochemical flux of exported production (Monteiro et al., 2006). In the coastal areas of China, the northward expansion of the warm and saline Taiwan Warm Current in winter and spring transports low-oxygen water to the Yangtze River estuary, which is a preliminary condition for the formation of summer hypoxia. Additionally, the intensity of the northward expansion of the Taiwan Warm Current directly determines the location and area of the anoxic zone (Wei et al., 2015). Zhang et al. (2022) also reveals that lateral transport influenced by anticyclonic circulations favors an expansion of oxygen depletion off QHD to the northeast.
It’s worth noting that the vertical diffusion in the SC in 2014 and 2015 is smaller than that in the NC, resulting in a greater rate of DO decreasing in the SC, so that the oxygen depletion in the SC is more severe in 2015 (Figure 5G). In 2014, due to the lower initial DO concentrations in June in the NC, the DO concentration minimum is still smaller in August in the NC even though the rate of DO decreasing is larger in the SC (Figure 6A). Overall, although the biological oxygen consumption in the SC is higher than that in the NC, there is also greater replenishment of DO by advective transport and vertical diffusion in the SC, so that the decrease rate of DO concentration in the SC is less than that in the NC in most years (from 2016 to 2019), resulting in the more severe oxygen depletion in the NC.
4.2 Different responses of the NC and SC to strong wind events
As a key physical factor, a strong wind can destroy the stratification, promote the ventilation of the water column, and thus alleviate the oxygen depletion of bottom water (Goodrich et al., 1987; Ni et al., 2016; Li et al., 2021a). Under the influence of the East Asian Monsoon, northwest winds are prevailing in winter in the BS with strong wind speed, while southeast winds are prevalent in summer with relatively small wind speeds, and strong wind events often occur (Ren et al., 2017). In late summer and early autumn, the increase in sea surface wind speed will destroy the stratification (Figure 9), and the ventilation of the water column will be enhanced to promote oxygen replenishment to the bottom water. As the bottom DO concentration begins to rise, the oxygen depletion in the NC and SC almost terminates simultaneously (Figure 6).
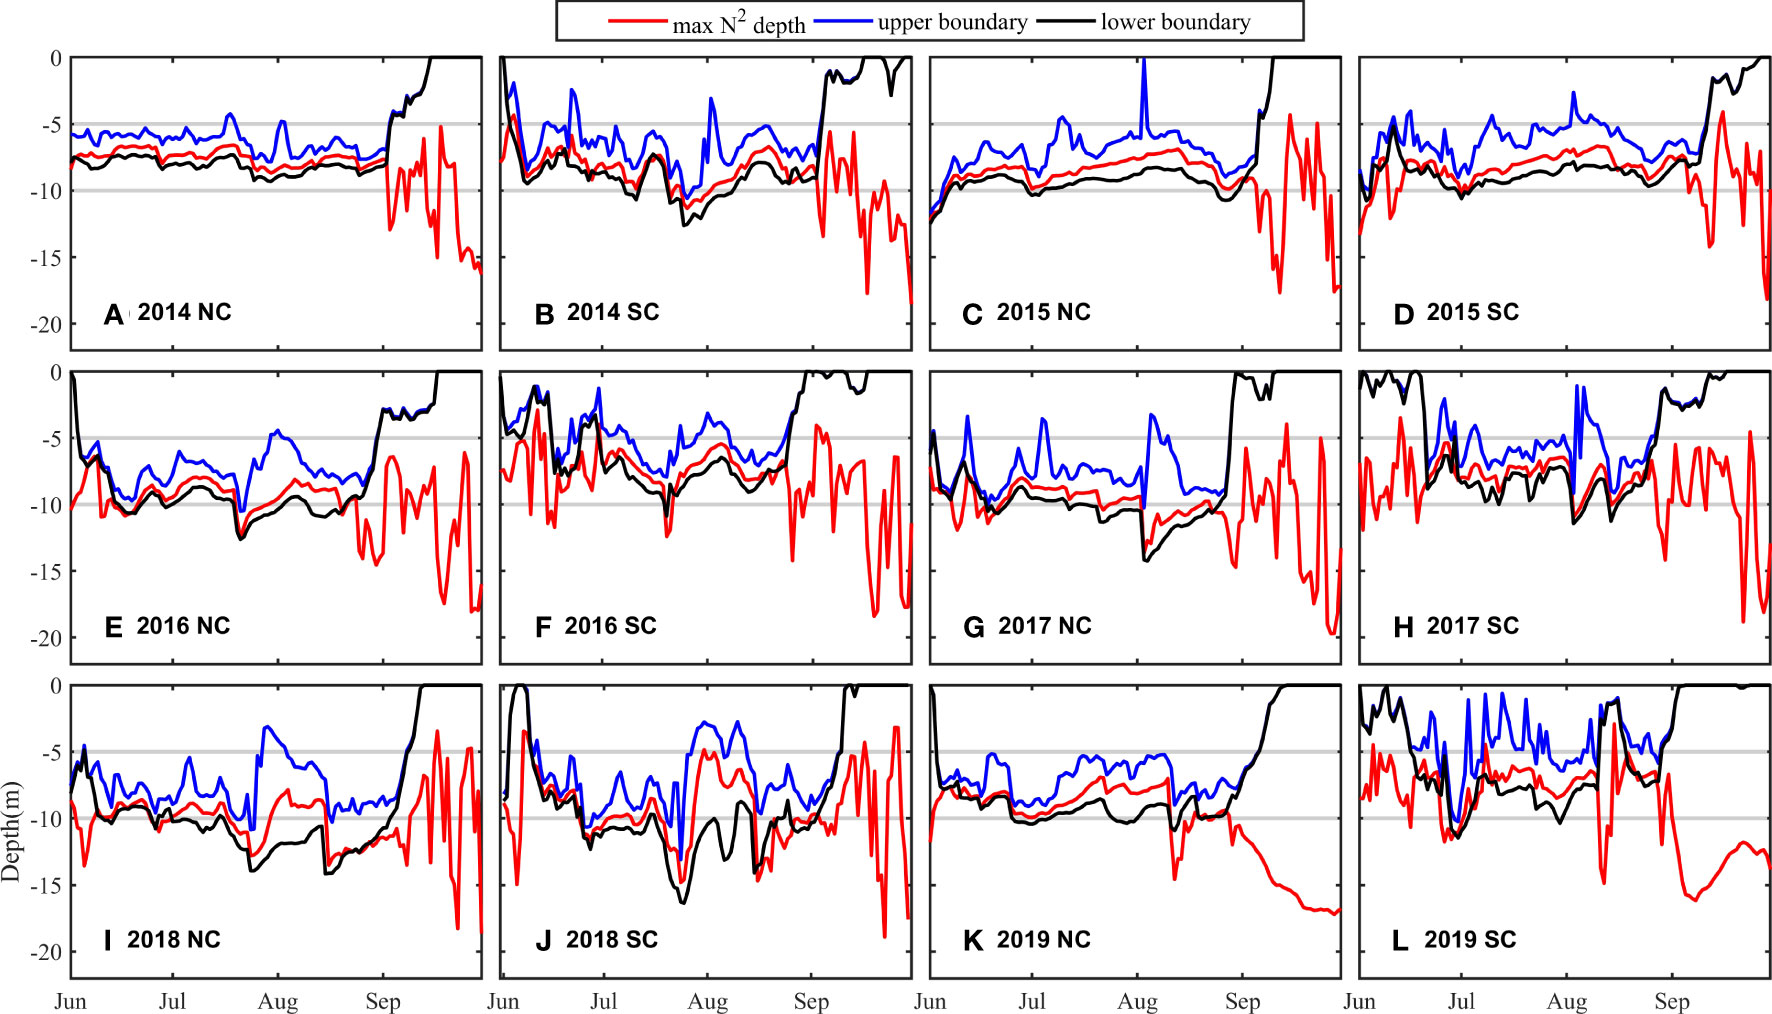
Figure 9 Depth of the stratification from June to September through 2014 to 2019 in the NC (A, C, E, G, I, K) and SC (B, D, F, H, J, L). Blue line: the depth of the upper boundary of the stratification. Red line: the depth of max N2. Black line: the depth of the lower boundary of the stratification. Gray line: the depths of 5m and 10m.
During the evolution of oxygen depletion in June and July, the DO concentration in the SC fluctuates, while the evolution in the NC is relatively stable with a smooth decrease in DO concentration. The time series of the wind speed in 2016 (S2) indicates that the sudden increase in DO concentration is attributed to the strong wind. On July 20, 2016, the wind speed increases from 8.7 m/s to 11.0 m/s in the SC and from 7.1 m/s to 11.6 m/s in the NC. The sudden increase in wind speed can temporarily interrupt the stratification, leading to the shoaling of the stratification (Figure 9) and the weakening of the strength of the stratification (Figure 10) in the SC, then promote the supplement of DO to the lower water column, and finally alleviate the oxygen depletion. Nevertheless, after strong winds, DO continues decreasing at a faster rate, promoting the formation of oxygen depletion. However, there is no similar or noticeable DO concentration fluctuation in the NC though with the similar change in wind speed. Likewise, after “Super Typhoon Lekima” passes through on August 10 2019, the wind speed in the BS increases to 15.4 m/s, and the increase in DO concentration in the NC is also smaller than that in the SC (Figure 6). The complex variation of DO concentration implies that the SC is more sensitive to wind than the NC. We will discuss the reasons for the difference between the NC and SC in the next section.
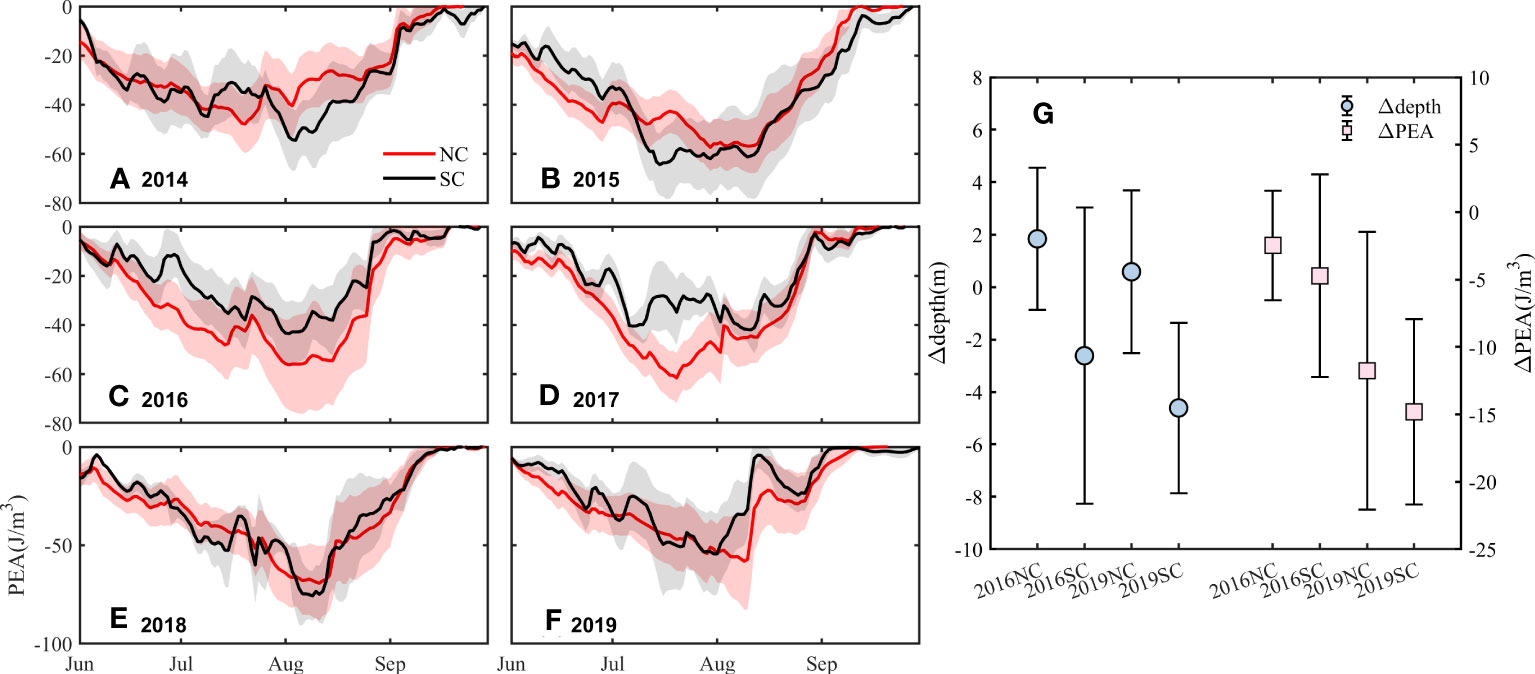
Figure 10 Time series of PEA (J/m3) from June to September in the NC and SC from 2014 to 2019 (A–F) and changes in the depth of the upper boundary of stratification and PEA in the NC and SC after strong wind events in 2016 and 2019 (G). Δ is the difference between the day before and the day after the strong wind. Red line: time series of PEA in the NC. Black line: time series of PEA in the SC. Solid blue circle: the change of depth. Solid pink square: the change of PEA.
4.3 The difference of water column stability associated with topography in the NC and SC
The different responses of the NC and SC to wind indicate the differences in the water column stability and the resistance to mechanical mixing. Here, the differences in the depth and intensity of stratification between two cores are first analyzed. The averaged depths of the upper and lower boundaries of stratification from June to August in the SC and NC are 5.44 m and 7.84 m, 7.04 m and 9.43 m, with averaged thicknesses of the stratification are 2.40 m and 2.39 m, respectively (S3), which suggests that the stratification in the SC is prominently shallower than that in the NC. The maximum depths in the SC and NC are 25.82 m and 27.56 m respectively (S4). The stratification is deep and thin in the deep area and shallow and thick in the shallow area, which is in good agreement with previous studies (Zhao, 1989; Zou et al., 2001). Deeper stratification, namely, thicker upper mixed layer, is supposed to need higher wind speed to ventilate. Therefore, from the perspective of the depth of the stratification, the shallower stratification in the SC is more susceptible to strong wind events, resulting in greater fluctuations in DO concentration at the bottom water.
The time series of PEA in the NC and SC from 2014 to 2019 (Figures 10A–F) shows that the absolute PEA reaches the maximum in July and August, corresponding to the strongest stratification, and gradually decreases to zero with the increase of sea surface wind speed and the disappearance of the stratification in September. When there are strong wind events, such as the passage of “Super Typhoon Lekima” on August 10 2019, the PEA suddenly decreases as the stratification is destroyed, and then increases again as the stratification recovers. The six-year averaged PEA in the NC and SC is -36.67 J/m3 and -32.13 J/m3 respectively (S4), indicating that the intensity of stratification in the NC is generally greater than that in the SC, though the interannual difference in PEA between the two cores shows no specific pattern. Therefore, from the perspective of the stratification intensity, the same strong wind has a stronger disturbance and then ventilation in the SC. Whether it is a strong wind event or a typhoon, changes in the depth and intensity of stratification in the NC are smaller than those in the SC after an increase in sea surface wind speed (Figure 10G), and the fluctuation on DO concentration in the NC caused by the disturbance of the stratification is also smaller than that in the SC. The difference in the intensity of stratification contributes to the different sensitivity of the NC and SC to the wind.
The differences in the depth and intensity of the stratification in the two cores of the BS essentially reflect the differences in the topography. Zhang et al. (2020) studied the thermal structure of the Tarago Reservoir using the Schmidt stability index (SSI) which is used to indicate the stability of the water column and describe the intensity of thermal stratification in waterbodies. They found that the bathymetry influences the lake stratification and stability with a larger SSI value in the deep water. Zhao et al. (2001) and Huang et al. (1999) used the Simpson-Hunter parameter (SH) to determine the location of tidal fronts, which is derived from the current velocity and depth. The distribution of SH shows a maximum exceeding 2.8 off Qinhuangdao, and less than 1.8 at the mouth of the bays due to the shallow water depth and relatively strong tidal currents. Accordingly, the stratification is shallow and weak in the SC with shallow water depth, while deeper and stronger in the NC with deep water. In addition to water depth, it is noted that the larger gradient of the topography in the NC (0.53, 0.23 in the SC, S4) might also contribute to the stronger water column stability. In summary, the difference in topography between the NC and SC mainly accounts for the different DO concentration variations responding to the wind.
5 Conclusion
A three-dimensional coupled physical-biogeochemical model ROMS-CoSiNE was implemented in this study to analyze temporal variations of oxygen depleted zones and the main controlling factors in the BS. Based on simulations from 2014 to 2019, comparisons with observations show that the model well reproduces multi-year’s spatial distribution and interannual variations of oxygen depletion. Two separated oxygen depleted cores are identified in all these years, with a threshold of DO< 3mg/L. The averaged minimum DO concentration is generally lower and the averaged area is larger in the NC than that in the SC, indicating more severe oxygen depletion in the NC. The DO in the two cores has similar seasonal variations in that the concentration decreases to the minimum in August and early September and then oxygen depletion fades away simultaneously. During oxygen depletion development from June to August, the biological oxygen consumption in the SC is greater than that in the NC, but partly compensated by the advective transports of DO-rich water from the Bohai Strait and vertical diffusion, resulting in a slightly lower oxygen depletion rate. Oxygen depletion in the SC is more susceptible to strong winds, with more frequent and intense DO concentration fluctuations, which is attributed to the shallower and gentler topography and then weaker water column stability in summer. The variation characteristics of the two oxygen depleted zones addressed in this study would advance understanding spatial pattern of oxygen dynamics and provide a basis for statistical seasonal prediction of oxygen depletion with considering spatial heterogeneity in coastal deoxygenated regions.
Data availability statement
The raw data supporting the conclusions of this article will be made available by the authors, without undue reservation.
Author contributions
HZW: Conceptualization, Data analysis, Writing – original manuscript. HYZ: Conceptualization, Methodology, Writing– review and editing. HW: Conceptualization, Methodology, Writing – review. HZ: Data analysis, Writing – original manuscript. All authors contributed to the article and approved the submitted version.
Funding
This work was financially supported by Laoshan Laboratory (LSKJ202202104), the National Natural Science Foundation of China (42141020, 41806018), and the Natural Science Foundation of Tianjin City (21JCQNJC00590). Data and samples in 2018 and 2019 were collected onboard of R/V Dongfanghong 2 implementing the open research cruise NORC2018-01 and onboard of R/V Beidou implementing the open research cruise NORC2019-01 respectively supported by NSFC Shiptime Sharing Project.
Conflict of interest
The authors declare that the research was conducted in the absence of any commercial or financial relationships that could be construed as a potential conflict of interest.
Publisher’s note
All claims expressed in this article are solely those of the authors and do not necessarily represent those of their affiliated organizations, or those of the publisher, the editors and the reviewers. Any product that may be evaluated in this article, or claim that may be made by its manufacturer, is not guaranteed or endorsed by the publisher.
Supplementary material
The Supplementary Material for this article can be found online at: https://www.frontiersin.org/articles/10.3389/fmars.2023.1247579/full#supplementary-material
References
Breitburg D., Levin L. A., Oschlies A., Grégoire M., Chavez F. P., Conley D. J., et al. (2018). Declining oxygen in the global ocean and coastal waters. Science 359 (6371), eaam7240. doi: 10.1126/science.aam7240
Chai F., Dugdale R. C., Peng T. H., Wilkerson F. P., Barber R. T. (2002). One-dimensional ecosystem model of the equatorial Pacific upwelling system. Part I: Model development and silicon and nitrogen cycle. Deep-Sea Res. Part II: Topical Stud. Oceanogr. 49 (13-14), 2713–2745. doi: 10.1016/S0967-0645(02)00055-3
Chen Y., Zhai F., Gu Y., Cao J., Liu C., Liu X., et al. (2022a). Seasonal variability in dissolved oxygen in the Bohai Sea, China. J. Oceanol. Limnol. 40, 78–92. doi: 10.1007/s00343-021-0235-6
Chen Z. Y., Zhai W. D., Yang S., Zhang Y., Liu P. F. (2022b). Exploring origin of oxygen-consuming organic matter in a newly developed quasi-hypoxic coastal ocean, the Bohai Sea (China): A stable carbon isotope perspective. Sci. Total Environ. 837, 155847. doi: 10.1016/j.scitotenv.2022.155847
Diaz R. J. (2001). Overview of hypoxia around the world. J. Environ. Qual. 30 (2), 275–281. doi: 10.2134/jeq2001.302275x
Feng S. Z., Ling F. Q., Ling S. Q., Li S. Q. (1999). An introduction of marine science (Beijing: Higher Education Press).
Fennel K., Testa J. M. (2019). Biogeochemical controls on coastal hypoxia. Annu. Rev. Mar. Sci. 11, 105–130. doi: 10.1146/annurev-marine-010318-095138
Goodrich D. M., Boicourt W. C., Hamilton P., Pritchard D. W. (1987). Wind-induced destratification in chesapeake bay. J. Phys. Oceanogr. 17 (12), 2232–2240. doi: 10.1175/1520-0485(1987)017<2232:widicb>2.0.co;2
Huang D. J., Su J. L., Backhaus J. O. (1999). Modelling the seasonal thermal stratification and baroclinic circulation in the Bohai Sea. Continental Shelf Res. 19 (11), 1485–1505. doi: 10.1016/S0278-4343(99)00026-6
Laffoley D., Baxter J. M. (2019). Ocean deoxygenation: Everyone's problem. Causes, impacts, consequences and solutions (Gland, Switzerland: IUCN, International Union for Conservation of Nature). doi: 10.2305/iucn.ch.2019.13.en
Levin L. A., Ekau W., Gooday A. J., Jorissen F., Middelburg J. J., Naqvi S. W. A., et al. (2009). Effects of natural and human-induced hypoxia on coastal benthos. Biogeosciences 6 (10), 2063–2098. doi: 10.5194/bg-6-2063-2009
Li D., Gan J., Hui C., Yu L., Liu Z., Lu Z., et al. (2021a). Spatiotemporal development and dissipation of hypoxia induced by variable wind-driven shelf circulation off the pearl river estuary: observational and modeling studies. J. Geophys. Res.: Oceans 126 (2), e2020JC016700. doi: 10.1029/2020JC016700
Li Z. C., Wei H., Zhang H. Y., Zhao H. D., Zheng N., Song G. S. (2021b). The interannual difference in summer bottom oxygen deficiency in Bohai Sea. Oceanologia Limnologia Sin. 52 (03), 601–613. doi: 10.11693/hyhz20200800227
Li D., Zhang J., Huang D., Wu Y., Liang J. (2002). Oxygen depletion off the Changjiang (Yangtze River) Estuary. Sci. China Ser. D: Earth Sci. 45, 1137–1146. doi: 10.1360/02yd9110
Mei L. S., Wei L. L., Zhang Z. (2011). Inventory of nutrients in the Bohai. Continental Shelf Res. 31 (16), 1790–1797. doi: 10.1016/j.csr.2011.08.004
Monteiro P. M. S., van der Plas A., Mohrholz V., Mabille E., Pascall A., Joubert W. (2006). Variability of natural hypoxia and methane in a coastal upwelling system: Oceanic physics or shelf biology? Geophys. Res. Lett. 33, L16614. doi: 10.1029/2006GL026234
Ni X., Huang D., Zeng D., Zhang T., Li H., Chen J. (2016). The impact of wind mixing on the variation of bottom dissolved oxygen off the Changjiang Estuary during summer. J. Mar. Syst. 154, Part A, 122–130. doi: 10.1016/j.jmarsys.2014.11.010
Rabalais N. N., Díaz R. J., Levin L. A., Turner R. E., Gilbert D., Zhang J. (2010). Dynamics and distribution of natural and human-caused hypoxia. Biogeosciences 7 (2), 585–619. doi: 10.5194/bg-7-585-2010
Ren H. R., Li G. S., Guo T. J., Zhang Y., Ouyang N. L. (2017). Multi-scale variability of surface wind direction and speed on the Bohai Sea in 1950-2011. Scientia Geographica Sin. 37 (09), 1430–1438. doi: 10.13249/j.cnki.sgs.2017.09.016
Shchepetkin A. F., McWilliams J. C. (2005). The regional oceanic modeling system (ROMS): A split-explicit, free-surface, topography-following-coordinate oceanic model. Ocean Model. 9 (4), 347–404. doi: 10.1016/j.ocemod.2004.08.002
Simpson J. H. (1981). The shelf-sea fronts: implications of their existence and behaviour. Philos. Trans. R. Soc. London Ser. A Math. Phys. Sci. 302 (1472), 531–546. doi: 10.1098/rsta.1981.0181
Song G. S., Zhao L., Chai F., Liu F. F., Li M. T., Xie H. X. (2020). Summertime oxygen depletion and acidification in Bohai Sea, China. Front. Mar. Sci. 7. doi: 10.3389/fmars.2020.00252
Sun S., Li C. L., Ning X. R. (2012). Regional oceanography of China seas - biological oceanography (Beijing: Ocean Press).
Wei Q. S., Wang B. D., Chen J. F. (2015). Recognition on the forming-vanishing process and underlying mechanisms of the hypoxia off the Yangtze River estuary. Sci. China Earth Sci. 58, 628–648. doi: 10.1007/s11430-014-5007-0
Wei Q., Wang B., Yao Q., Xue L., Sun J., Xin M., et al. (2019). Spatiotemporal variations in the summer hypoxia in the Bohai Sea (China) and controlling mechanisms. Mar. Pollut. Bull. 138, 125–134. doi: 10.1016/j.marpolbul.2018.11.041
Xiu P., Chai F. (2014). Connections between physical, optical and biogeochemical processes in the Pacific Ocean. Prog. Oceanogr. 122, 30–53. doi: 10.1016/j.pocean.2013.11.008
Zhai W. D., Zhao H. D., Zheng N., Xu Y. (2012). Coastal acidification in summer bottom oxygen-depleted waters in northwestern-northern Bohai Sea from June to August in 2011. Chinese Science Bulletin 57 (9), 1062–1068. doi: 10.1007/s11434-011-4949-2
Zhai W. D., Zhao H. D., Su J. L., Liu P. F., Li Y. W., Zheng N. (2019). Emergence of summertime hypoxia and concurrent carbonate mineral suppression in the central Bohai Sea, China. J. Geophys. Res.: Biogeosci. 124 (9), 2768–2785. doi: 10.1029/2019JG005120
Zhang J., Gilbert D., Gooday A. J., Levin L., Naqvi S. W. A., Middelburg J. J., et al. (2010). Natural and human-induced hypoxia and consequences for coastal areas: Synthesis and future development. Biogeosciences 7 (5), 1443–1467. doi: 10.5194/bg-7-1443-2010
Zhang H., Li S. (2010). Effects of physical and biochemical processes on the dissolved oxygen budget for the Pearl River Estuary during summer. J. Mar. Syst. 79 (1-2), 65–88. doi: 10.1016/j.jmarsys.2009.07.002
Zhang H., Li Y. F., Tang C., Zou T., Yu J., Guo K. (2016). Spatial characteristics and formation mechanisms of bottom hypoxia zone in the Bohai Sea during summer. China Sci. Bull. 61 (14), 1612–1620. doi: 10.1360/N972015-00915
Zhang H. Y., Wei H., Zhao L., Zhao H. D., Guo S., Zheng N. (2022). Seasonal evolution and controlling factors of bottom oxygen depletion in the Bohai Sea. Mar. pollut. Bull. 174, 113199. doi: 10.1016/j.marpolbul.2021.113199
Zhang F. X., Zhang H., Bertone E., Stewart R., Lemckert C., Cinque K. (2020). Numerical study of the thermal structure of a stratified temperate monomictic drinking water reservoir. J. Hydrol.: Regional Stud. 30, 100699. doi: 10.1016/j.ejrh.2020.100699
Zhao B. R. (1989). Basic features and formation mechanism of strong thermocline in the Bohai Sea, Yellow Sea, and northern East China Sea. Haiyang Xuebao 04, 401–410.
Zhao B. R., Cao D. M., Li H. F., Wang Q. M. (2001). Tidal mixing characters and tidal fronts phenomenons in the Bohai Sea. Haiyang Xuebao 04, 113–119.
Zhao H. D., Kao S. J., Zhai W. D., Zang K. P., Zheng N., Xu X. M., et al. (2017). Effects of stratification, organic matter remineralization and bathymetry on summertime oxygen distribution in the Bohai Sea, China. Continental Shelf Res. 134, 15–25. doi: 10.1016/j.csr.2016.12.004
Zhao Z. H., Song G. S., Zhao L. (2020). Characteristics of dissolved oxygen and pH variations in summer off the Qinhuangdao. Haiyang Xuebao 42 (10), 144–154. doi: 10.3969/j.issn.0253-4193.2020.10.014
Zhou F., Chai F., Huang D., Xue H., Chen J., Xiu P., et al. (2017). Investigation of hypoxia off the Changjiang Estuary using a coupled model of ROMS-CoSiNE. Prog. Oceanogr. 159, 237–254. doi: 10.1016/j.pocean.2017.10.008
Zou E. M., Xiong X. J., Guo B. H., Lin K. (2001). Characteristics and seasonal variations of the thermocline and halocline in the Huanghai Sea and the East China Sea. Adv. Mar. Sci. 03, 8–18.
Keywords: oxygen depleted zones, temporal variations, biological processes, lateral transport, strong wind, Bohai Sea, topography
Citation: Wang H, Zhang H, Wei H and Zuo H (2023) Temporal variations of the two oxygen depleted zones in the Bohai Sea. Front. Mar. Sci. 10:1247579. doi: 10.3389/fmars.2023.1247579
Received: 26 June 2023; Accepted: 02 August 2023;
Published: 23 August 2023.
Edited by:
Xiangbin Ran, Ministry of Natural Resources, ChinaReviewed by:
Qinsheng Wei, Ministry of Natural Resources, ChinaBin Zhao, Ministry of Natural Resources, China
Bin Yang, Jiangsu Ocean Universiity, China
Copyright © 2023 Wang, Zhang, Wei and Zuo. This is an open-access article distributed under the terms of the Creative Commons Attribution License (CC BY). The use, distribution or reproduction in other forums is permitted, provided the original author(s) and the copyright owner(s) are credited and that the original publication in this journal is cited, in accordance with accepted academic practice. No use, distribution or reproduction is permitted which does not comply with these terms.
*Correspondence: Haiyan Zhang, aGFpeWFuX3poYW5nQHRqdS5lZHUuY24=