 Steven F. DiMarco1,2*
 Zhankun Wang3
 Piers Chapman1,2
 Lubna al-Kharusi4
 Leila Belabbassi1Hilal al-Shaqsi4Marion Stoessel1Stephanie Ingle5Ann E. Jochens1†Matthew K. Howard1†
- 1Department of Oceanography, Texas A&M University, College Station, TX, United States
- 2Geochemical and Environmental Research Group, Texas A&M University, College Station, TX, United States
- 3National Centers for Environmental Information, National Oceanic and Atmospheric Administration (NOAA), Silver Spring, MD, United States
- 4Marine Science and Fisheries Centre, Ministry of Agriculture and Fisheries Wealth, Muscat, Oman
- 5Fugro, Houston, TX, United States
Dissolved oxygen and current observations from a cabled ocean observatory in the Sea of Oman show that the annual recurrence of coastal hypoxia, defined as dissolved oxygen concentrations ≤63 μM, is associated with the seasonal cycle of local monsoon winds. The observations represent the first long-term (5+ years) continuous moored observations off the northern Omani coast. During the summer/fall southwest (SW) monsoon season (Jun-Nov), winds in the Sea of Oman generate ocean currents that result in coastal upwelling of subsurface waters with low dissolved oxygen concentrations. The source of the poorly oxygenated water is the oxygen minimum zone (OMZ) in the Arabian Sea, a layer approximately 1000-m thick within the 100 to 1200 m depth range, where dissolved oxygen values approach anoxia. During the winter monsoon season (Dec-Feb), the Sea of Oman winds are from the northwest, forcing strong and persistent southeast currents. These winds generate oceanic downwelling conditions along the coastal ocean that ventilate waters at depth. Possible impacts of the monsoon-driven seasonal hypoxia on local fisheries and implications due to climate change are also discussed in this study.
1 Introduction
Hypoxic zones have now been reported in more than 700 systems globally and their number is thought to have doubled each decade since the 1960s (Diaz and Rosenberg, 2008; Breitburg et al., 2018; Laffoley and Baxter, 2019). Upwelling of low oxygen water from oxygen minimum zones (OMZ), where oxygen concentrations are naturally low, to coastal regions has been reported along many of the world’s coasts, especially in eastern boundary currents, e.g., the northeast Pacific Ocean (Grantham et al., 2004; Chan et al., 2008), Chile (Sobarzo et al., 2007), western and southwest India (Banse, 1968; Naqvi et al., 2000), and the Benguela System (Chapman and Shannon, 1985). The Arabian Sea OMZ (including the Sea of Oman as this region is just a western extension of the Arabian Sea) is the second-most intense OMZ in the world tropical oceans (Kamykowski and Zentara, 1990), occupying a large volume between approximately 100- and 1200-m water depths (Herring et al., 1998). The Arabian Sea OMZ results from the balance between an oxygen sink due to remineralization of the high surface productivity of the Arabian Sea and subsurface oxygen supply due primarily to northward spreading of oxygenated water from the Southern Hemisphere. There is also a small contribution of oxygen from Persian/Arabian Gulf water in the northern Arabian Sea (McCreary et al., 2013; Wang et al., 2013a). It is thought that OMZs globally have the potential to expand into coastal waters (Helly and Levin, 2004); previous work has shown that the western shelves of India may already be experiencing OMZ expansion (Naqvi et al., 2000) and this has also been shown for the Oregon and Washington shelf along the U.S. west coast (Kämpf and Chapman, 2016).
Massive fish kills in the Sea of Oman have been reported for more than two decades (Thangaraja et al., 2007; Al-Gheilani et al., 2011). Initial investigations suggested that the possible cause is associated with large phytoplankton blooms and toxic effects of harmful algal blooms (HABs) (Al-Gheilani et al., 2011; Gomes et al., 2014), although the depletion of dissolved oxygen levels by organic decomposition is also suspected (Claereboudt et al., 2001; Piontkovski et al., 2012). There has, however, been little direct evidence to conclusively attribute fish mortality to this mechanism due to the lack of continuous long-term systematic observations.
In this manuscript, we will first report observations of seasonally recurrent hypoxic/anoxic conditions found in the Sea of Oman over the region of the northern continental shelf and slope of Oman using five continuous years of hourly current velocity and dissolved oxygen measurements from a cabled observing system (DiMarco et al., 2012; Ingle et al., 2012). We then examine the causes of the seasonal hypoxia in relation to monsoonal driven seasonal upwelling/downwelling and the seasonal extension of the OMZ into the coastal regions. We also investigate the seasonal patterns of the fish kill events and discuss whether a possible relationship exists between them. There is strong evidence that the deoxygenation of upwelling zones (Smith and Bottero, 1977; Lee et al., 2000; Shi et al., 2000; Kämpf and Chapman, 2016) along coastal margins is increasing with the prediction that global fisheries are at risk (Falkowski et al., 2011). Long-term moored oceanographic time-series are rare in the world’s oceans; this manuscript reports the first such time-series of oceanic dissolved oxygen concentration in the northwest Indian Ocean.
Atmospheric conditions over the Arabian Sea and the Sea of Oman (Figure 1A) are dominated by the monsoonal wind systems that reverse direction semiannually (Reynolds, 1993; Shi et al., 2000). The boreal summer monsoon, commonly referred to as the southwest (SW) monsoon, has a dominant southwesterly component (over the Arabian Sea) and energetic winds that occur generally from June to November. The intensity and duration of the SW monsoon, however, are not uniform from year to year (Morrison et al., 1998). In contrast, the boreal winter monsoon, known as the northeast (NE) monsoon, has a dominant northeasterly component (over the Arabian Sea) and relatively weaker winds that occur from December to February (Weller et al., 1998). Inter-monsoon periods with greatly reduced wind stress occur during March-May and October-November (depending on how long the SW monsoon lasts). In the Sea of Oman, because of the prevailing topography of the northern Omani coast (Figure 1), the winds are actually northwesterly during the summer monsoon and southeasterly during the winter monsoon.
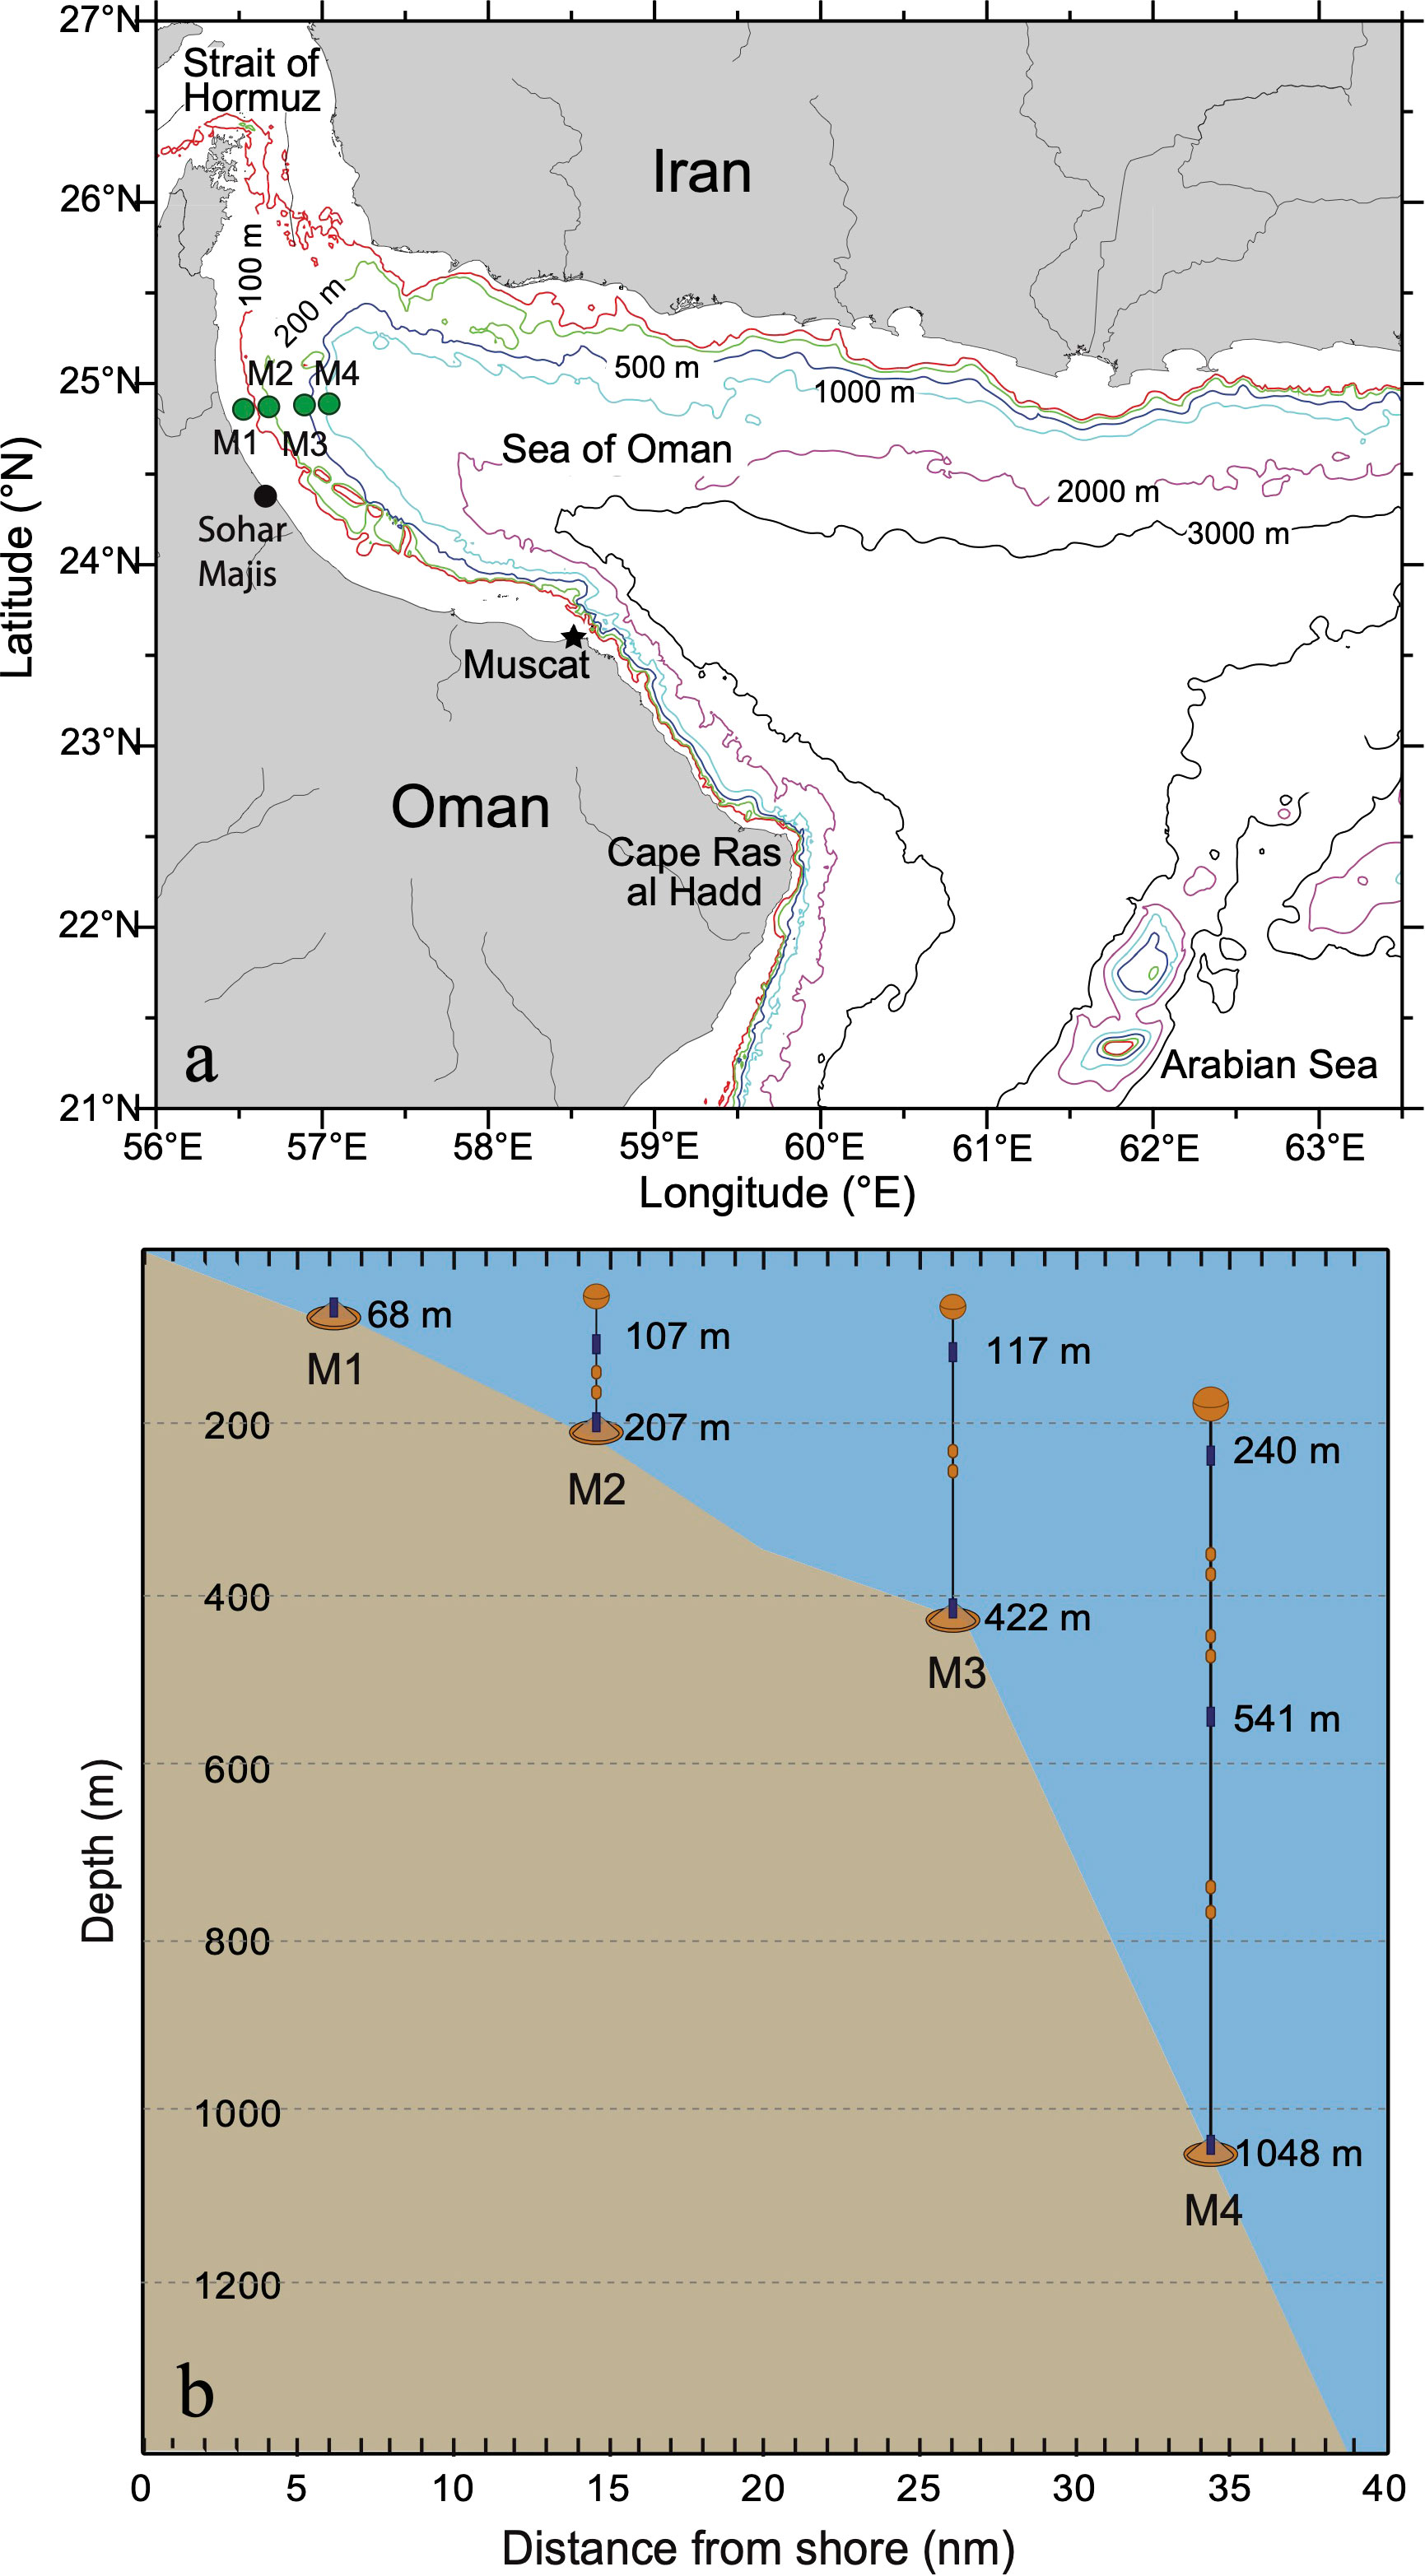
Figure 1 (A) Locations of stations and geographic features in the Sea of Oman. Approximate contours of the 100-, 200-, 500-, 1000-, 2000-, and 3000-m isobaths, based on a 1-minute resolution, global topography v9.1 from https://topex.ucsd.edu, are given. (B) Mooring schematic for the LORI I cabled array. Shown are instrument depths (m), names and approximate distance (nm) from shore.
The regional oceanography of the northwestern Arabian Sea and the Sea of Oman consists of a complex system of currents and mesoscale eddies with significant seasonal variability (Savidge et al., 1990; Smith et al., 1991; Esenkov et al., 2003; Pous et al., 2004b; Richardson et al., 2006; Wang et al., 2013a). Along the southern coast of Oman, south of Ras al Hadd, intense coastal upwelling is driven by the steady and energetic winds of the SW monsoon (Lee et al., 2000), while the upwelling is more intense when the strength of the SW monsoonal wind is at its peak in July (Rao et al., 2005). The winds force surface waters to move offshore by Ekman transport, and because of the proximity to the coast, cooler, less saline and nutrient-rich deep water is upwelled to the surface to replace the offshore-moving waters at the surface (Smith and Bottero, 1977); these Ekman-driven upwellings along the Omani coasts have been confirmed by various investigators (Schott, 1983; Quraishee, 1984; Kindle and Arnone, 2001; Prasad et al., 2005; Wang et al., 2013a).
The areal extent of the upwelling is about 400-km wide and runs 1000 km along the southern Omani coast from Ras Fartak in the west to Ras al Hadd at the entrance of the Sea of Oman in the east (Böhm et al., 1999; Morrison et al., 1999; Thoppil and Hogan, 2009). Although the regional circulation in the Sea of Oman is not well understood, it is believed that frequent mesoscale (~50 km scale) eddy features occupy the Sea of Oman and are connected with the broader scale circulation from the Persian Gulf, through the Strait of Hormuz (Pous et al., 2004a), and into the Arabian Sea (Owens et al., 1993; Pous et al., 2004b; Wang et al., 2013a). Currents tend to flow cyclonically (counterclockwise) around the basin. Wang et al. (2013a) showed periodic southerly spreading of high salinity water from the Persian Gulf along the northern coast of Oman in a two-year period following the passage of Cyclone Gonu in June 2007 (Wang et al., 2012). However, the presence of eddies and the complex transfer of water in and out of the region adds significantly to the complexity of the circulation pattern (Pous et al., 2004b). Even less is known about the temporal variability of the ocean dynamics of the northern Oman coast (Johns et al., 2000); the results presented below are the first description of the seasonal variability of direct observations of moored currents in that region.
The seasonal variability of circulation and related oxygen dynamics have important implications for phytoplankton blooms (Gomes et al., 2014) and local fisheries (McIlwain et al., 2011; Piontkovski and Al-Oufi, 2014; Wang et al., 2014; Piontkovski and Al-Oufi, 2015). The intense SW monsoon-driven upwelling along the Omani coast of the Arabian Sea results in rich regional biological production (Morrison and Olson, 1992; Madhupratap et al., 1996; Codispoti et al., 2001; Levin, 2003; Smith and Madhupratap, 2005; Gomes et al., 2014). In addition, short period (3-5 days) upwelling has also been observed in the region following the passage of intense tropical storms (Wang et al., 2012). Monsoon-driven upwellings are capable of exporting cool water, rich in nutrients, hundreds of kilometers (km) offshore (Morrison, 1997; Brink et al., 1998). Coastal surface water is replaced by water that wells up from below, which originates from the well-developed OMZ with dissolved oxygen concentrations less than 22 μM (1 μM = 10-6 mol per liter; Wyrtki, 1971; Sarmiento et al., 1988; Morrison and Olson, 1992; Olson et al., 1993; Morrison et al., 1998). The OMZ is a permanent feature in the Arabian Sea and has been found to have substantial impacts on abundance and distribution of pelagic organisms and fishes (Wang et al., 2014; Rixen et al., 2020). It extends into the Sea of Oman and is found near the continental slope (Olson et al., 1993; Morrison et al., 1998) and impinges on the shelf (Herring et al., 1998). The presence of this water at the shelf break predisposes the waters over the continental shelf to develop hypoxic conditions (Gomes et al., 2014; Queste et al., 2018), typically defined as dissolved oxygen concentrations less than 63 μM (equivalent to 2.0 mg/L or 1.4 mL/L; see Zhang et al., 2010 and references therein), especially when oxygen-depleted water from the OMZ migrates into the shallow depths during the late monsoon. Piontkovski and Queste (2016) have suggested that the OMZ in this region has shoaled into the upper mixed layer (above 30 m depth) during the past 30 years, although Queste et al. (2018) suspect that observed changes are actually caused by seasonal variability.
2 Methods
Deployed in summer 2005 in the Sea of Oman off the northern coast of Abu Bakara, Sultanate of Oman between the 65- and 1050-m isobaths (Figure 1A), the Lighthouse Ocean Research Initiative (LORI) system, designed and operated by Lighthouse R&D Enterprises, Inc (DiMarco et al., 2012; Ingle et al., 2012; Wang et al., 2013b), provided real-time measurements of currents, temperature, salinity, pressure, dissolved oxygen, and turbidity. The LORI system was the first cabled seabed observatory in the study region. The goal of the project was to prove the capability of an in situ, cabled ocean observatory to provide high-quality scientific data on a real-time basis over an extended period. The Sea of Oman was selected as an ideal test location due to the dynamic nature of the waters in the region and their relatively uncharacterized nature. In Oman, the project was coordinated alongside the Ministry of Agriculture and Fisheries Wealth through the Marine Science and Fisheries Centre. Planned to be a sustained observing system, it was designed to provide real-time monitoring of water-column properties to allow shareholders and users to make informed decisions, as well as to study a range of oceanic phenomena, including potential impacts of climate change, characterization of the general dynamical patterns of the region, and quantification of seasonal variability of water-column properties (DiMarco et al., 2012; Wang et al., 2012; Wang et al., 2013a; Wang et al., 2014). One key objective was to support the Omani Ministry in its efforts to develop and manage the Sultanate’s important fisheries resources within the country’s EEZ (exclusive economic zone). The Oman cabled ocean observatory project ended in early 2014; however only data from 2005 to 2010 are described in this study.
The cabled array consisted of four stations (Figure 1B) connected via a 65-km fiber optic trunk line to a shore station that provided continuous power and two-way open communication for data retrieval and system monitoring (Figure 1B). The stations were named M1-M4, with the station number (1 - 4) increasing from onshore to offshore. The instruments on each mooring were named M##, with the first number indicating station number and the second number showing the location from bottom to top. For example, M21 is the bottom-most instrument on M2 station. Each station had an Aanderaa Recording Doppler Current Profiler 600kHz (RDCP600) instrument contained in a sensor array base assembly at the seafloor that connected the station to the cable system. A trawl-resistant cage to protect the sensors from fishing damage surrounded the base of each station. The three deep stations had additional RDCP600s tethered to the base assembly with flotation, mooring lines, and hardware (locations and depths are shown in Figure 1B). Data from this real-time system were received hourly at the Lighthouse office in Houston, Texas, USA, via satellite telecommunication during the project.
The RDCP600 is a medium range (35 to 50 m) Doppler current profiler with the acoustic center frequency of 606 kHz. It measures speed within the range of 0 to 500 cm s-1, with a horizontal accuracy of 0.5 cm s-1. It uses the Doppler shift of acoustic signal returns to measure currents in selected bin intervals up to 50 m above the instrument. The bin interval is 2-m with bins overlapping by 1 m, i.e., a 50% overlap. The data were collected hourly for both current sensor and additional water property sensors.
2.1 Current meter data processing
Low-pass filtering was performed with a Lanczos cosine filter (Emery and Thomson, 2001) with quarter-power (-6dB) cutoff at five days (120 hours) to remove tidal and inertial period variability (DiMarco and Reid, 1998). Unfiltered (i.e., raw) and low-pass filtered versions of the current velocity data were analyzed. Velocity data were initially oriented to geographic coordinates, i.e., north-south and east-west. For analyses presented in Section 3.1, current velocity data were transformed to an across-shelf and along-shelf coordinate system by rotating them 45 degree clockwise to be consistent with shelf and monsoon winds direction. Although vertical velocities were measured by RDCPs, no reliable upwelling/downwelling signals could be derived from the current measurements due to the large variability in the vertical velocity data and contamination by vertical migration of organisms (Wang et al., 2014).
The RDCPs were configured with additional sensors for temperature, conductivity (salinity), pressure, dissolved oxygen, and/or turbidity. Unlike the current sensor, all additional sensors provided single-point measurements at the depths of the instruments as shown by numbers in Figure 1B. Table 1 gives specifications for the additional sensors deployed on RDCP600s, including model number, sensor type, measurement range, sensor resolution, response time and accuracy. The instruments were calibrated by the manufacturer before deployment; calibration coefficients were used to convert sensor voltages and counts to engineering units prior to analysis. The temperature sensors were configured for the expected temperature range for the instrument deployment depth based on historical data (Wyrtki, 1971). Dissolved oxygen concentration was measured with Aanderaa Optode optical sensors. The Optodes were set for an expected range of 0-500 μM (micromolar), with a resolution of < 1 µM and an accuracy of better than 8 μM or 5%, whichever is greater. All moored data went through extensive quality control protocols (DiMarco et al., 2001; Bender and DiMarco, 2010) to identify outliers and other quality related issues prior to analysis. The percentages of “good” data passed all the quality control steps were > 89.7% for all the parameters except for the salinity data, which was > 84.1%.
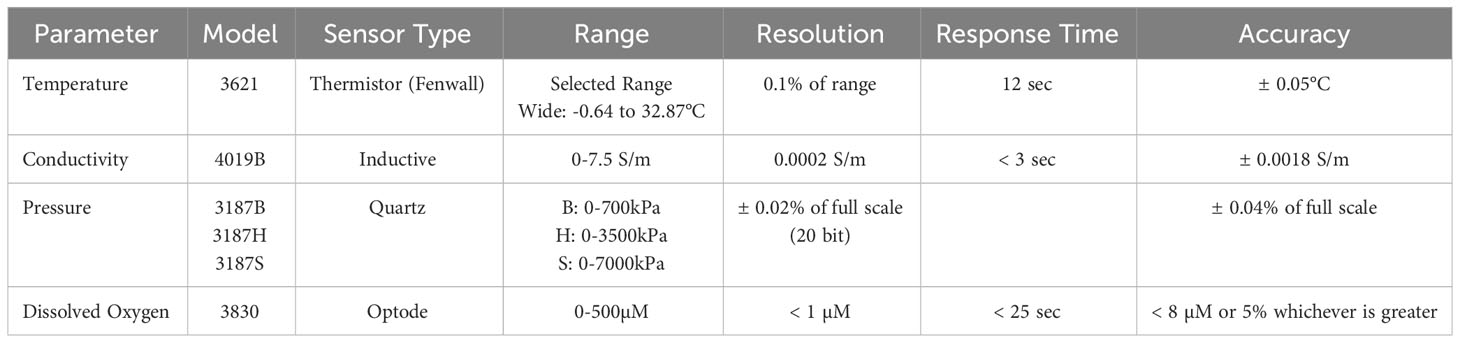
Table 1 Specifications for Sensors on the RDCP600s.
Several maintenance services were performed on the array following its initial installation in August 2005. The LORI system was serviced by remotely operated underwater vehicles (ROV) in June 2006 and January 2009. The M2 array node was replaced in June 2006 and the entire mooring system was refurbished and replaced with new instrumentation on 27 January 2007 and 22 September 2010. During the first two years of operations, moored data were compared against CTD casts during the mooring maintenance and servicing cruises and were found to be within acceptable tolerances for both temperature and salinity. The temperature differences were found to be always less than 0.5°C for all moored instruments and salinity differences were all less than 0.3.
2.2 Dissolved oxygen and salinity data processing
No significant sensor drift was noticed in the dissolved oxygen data during the five years deployment (linear drift of less than 3 μM/year and not statistically significant). Part of the reason is due to the prominent seasonal cycle in dissolved oxygen, which makes the relatively small sensor shift negligible in our analysis.
A salinity (conductivity) drift (< 0.51/year) was seen by comparing the data before and after replacing the conductivity sensor. A linear fit was applied to remove the small salinity trend that was present. Salinity estimates were derived from conductivity observations using the Practical Salinity Scale (Millero et al., 2008); following the convention of McDougall and Barker (2011). Salinity estimates were represented as unitless in figures.
2.3 Wind data processing
Hourly wind speed and direction observations were collected at the Port of Sohar wind station (24.4°N, 56.63°E), at Sohar Majis, Oman (Figure 1A), for the time period 1989 – 2010. Raw wind data were quality controlled prior to analysis. Wind data were range checked against historical and climatological limits; statistical outliers were removed from the database prior to analysis. When appropriate, the winds were rotated 45° clockwise to form the cross-shelf and along-shelf velocity components. Low-pass filtering of wind data was accomplished using cosine-Lanczos filter weights with cut-off at five days (Emery and Thomson, 2001).
3 Results and discussion
3.1 Meteorological and physical oceanographic conditions
The 5-year time series (July 2005-July 2010) of low-pass filtered along-shelf winds at Sohar Majis, Oman, show a pronounced annual signal, with winds from the northwest during the NE monsoon and from the southeast during the SW monsoon (Figure 2, blue line). Inter-monsoonal winds at Sohar have decreased speed, consistent with known seasonal monsoonal variability in the region (Reynolds, 1993; Morrison et al., 1998). Along the northern coast of Oman between 22.5°N and 25.5°N, northwest winds (i.e., winds from the northwest) are downwelling favorable as the integrated surface Ekman transport is directed shoreward; southeast winds are upwelling favorable. Note the wind directions are different from the traditional monsoon wind directions (SW/NE), since in the Sea of Oman they are almost parallel to the Omani coastline.
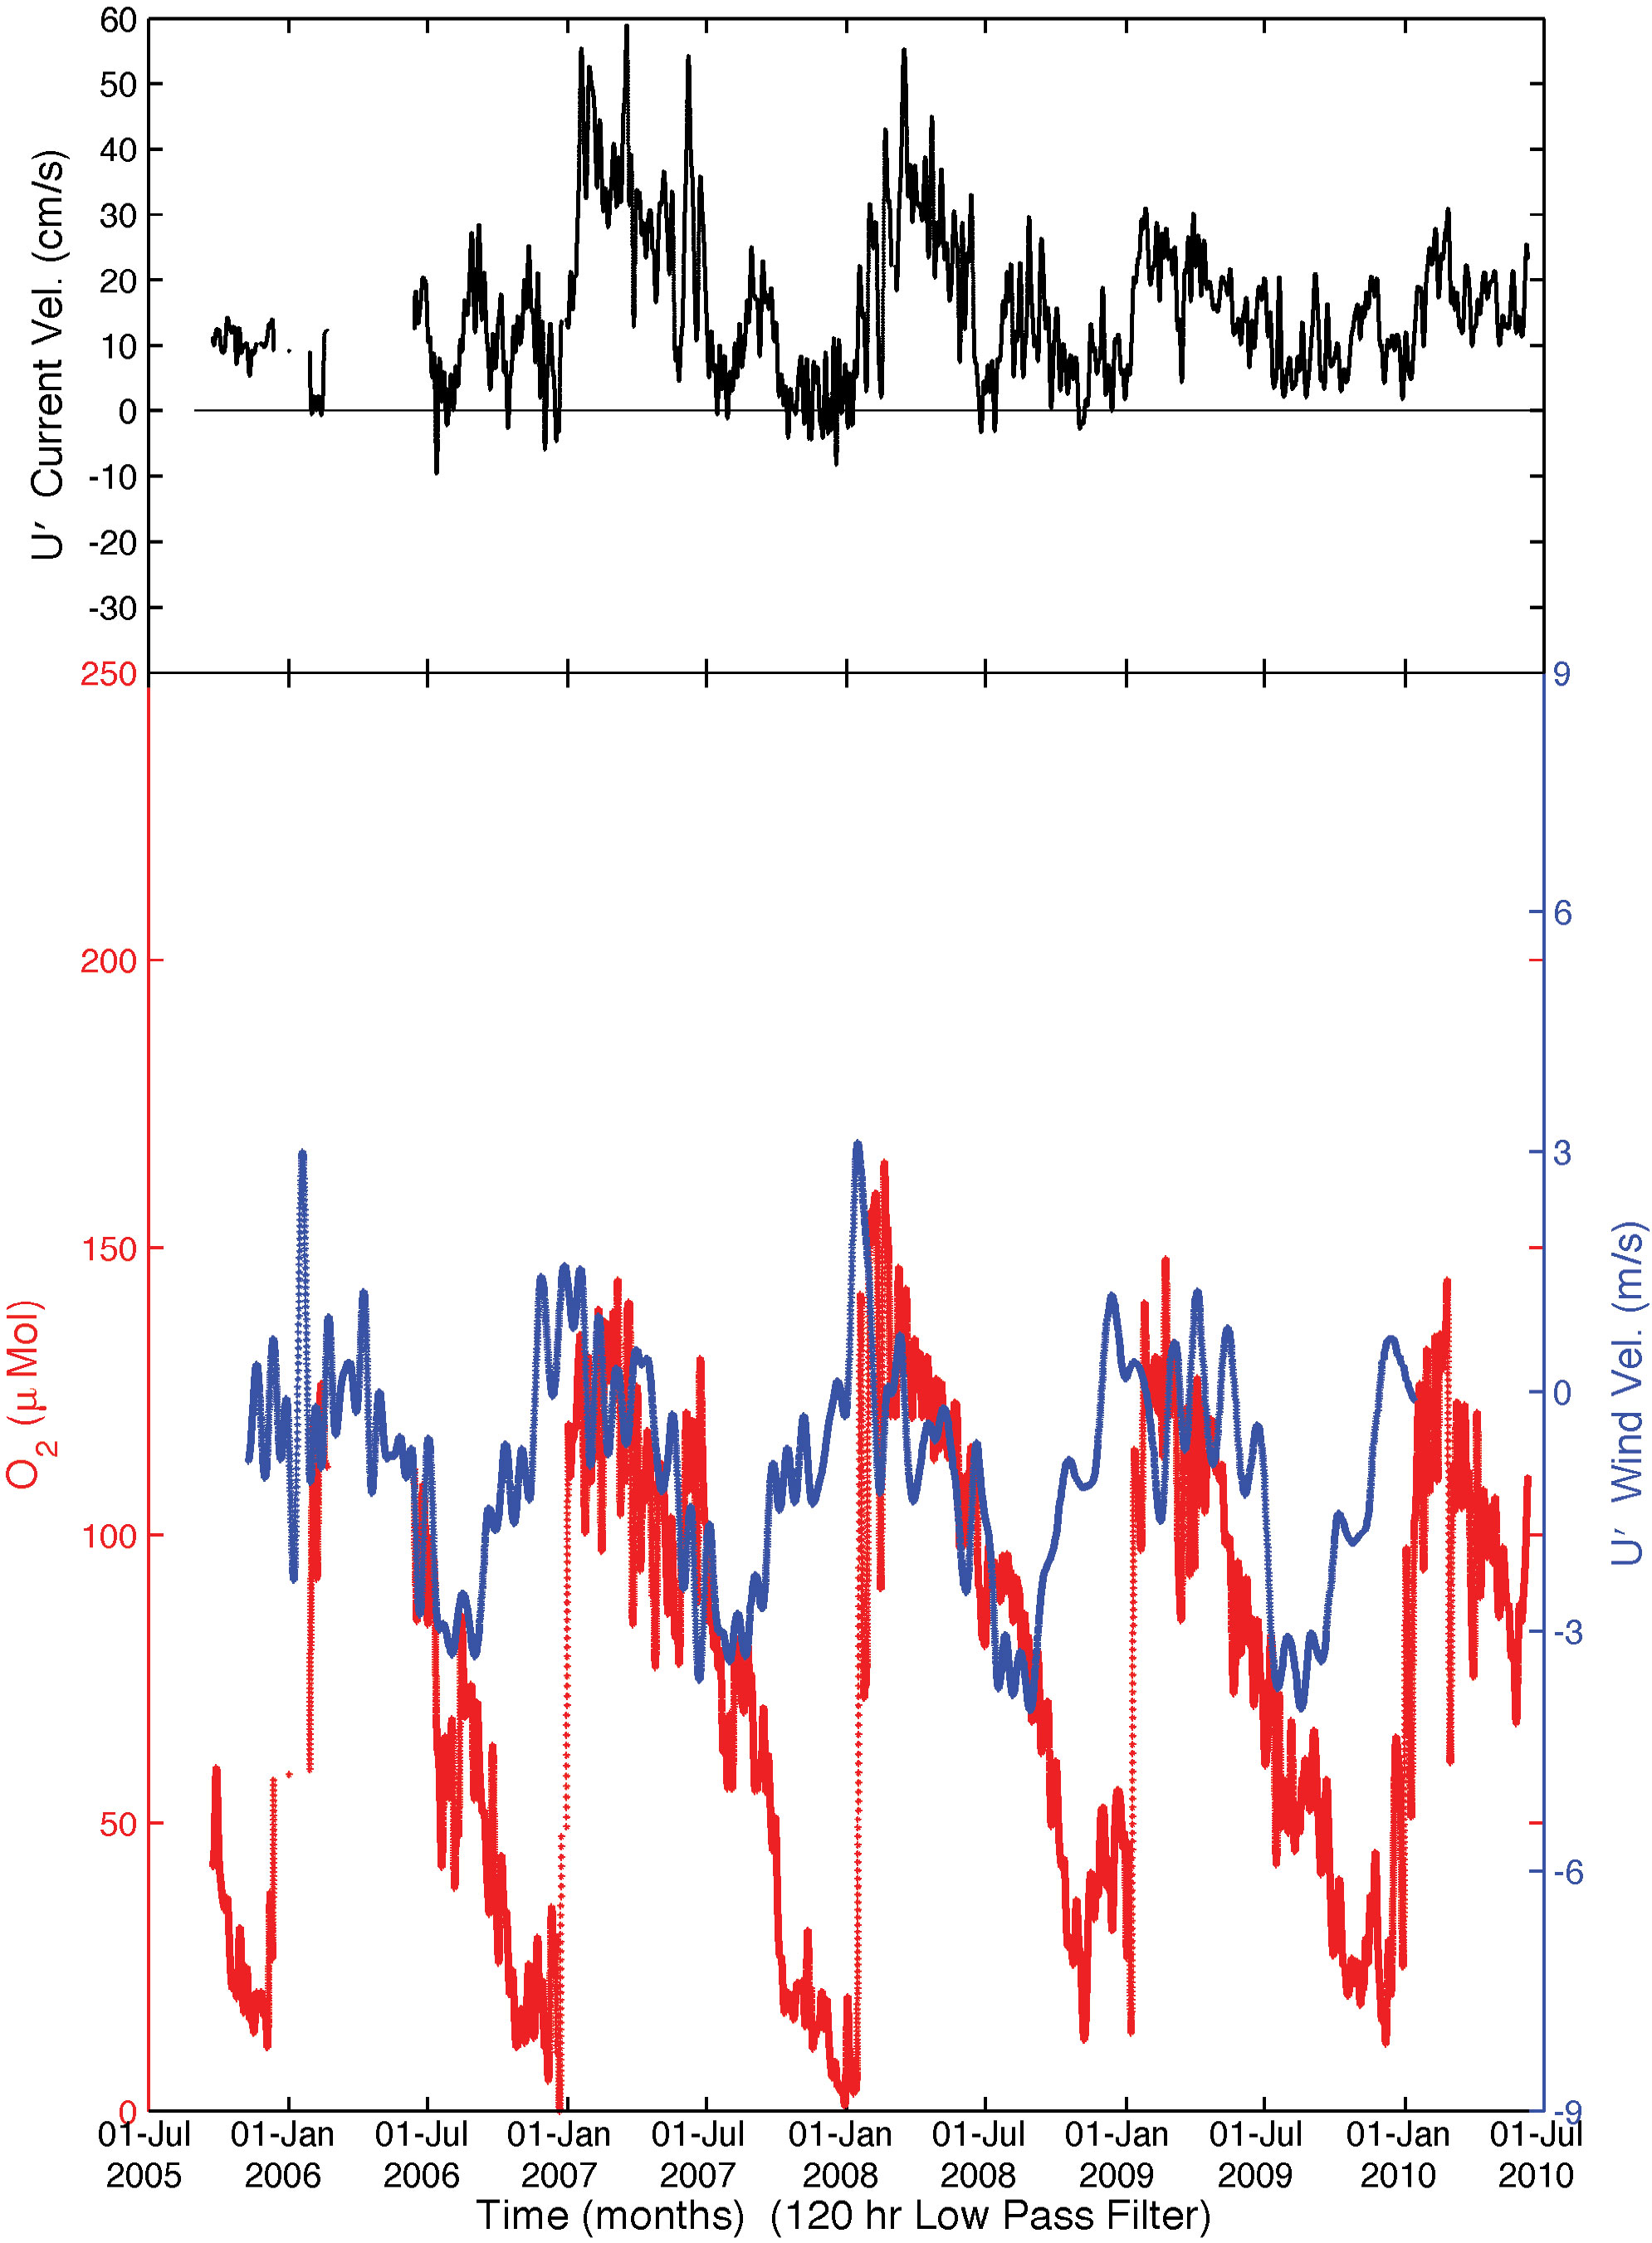
Figure 2 Low-pass filtered (120-h) along-shelf winds at Sohar Majis (blue) and unfiltered along-shelf currents (U’, black; positive to southeast) and dissolved oxygen (red) at the bottom instrument on node M2 (M21). Both winds and currents have been transformed to an along-shelf and cross-shelf coordinate system by rotating them 45 degree clockwise.
The seasonal pattern of the northern Oman coastal currents and monsoonal wind variability correlate well with a lag of about one to two months (Figure 2). In late boreal winter and spring, i.e., the transition to the NE monsoon and downwelling favorable winds, the along-shelf currents at the bottom instrument (207-m depth) at the M2 location approach 60 cm s-1 and are directed to the southeast (Figure 2, top panel). During upwelling favorable conditions of fall and early winter, current velocities are smallest (<10 cm s-1). Superimposed on the general annual pattern of currents are variations with periods of 5-10 days. The cross-shelf currents were small throughout the year, typically less than 10 cm s-1 (not shown).
3.2 Seasonal cycle of dissolved oxygen concentrations
The strongest seasonal variability in any record at the LORI cabled observatory is that seen in the dissolved oxygen data. The seasonal pattern is characterized by an abrupt transition from hypoxic (concentrations less than 60 μM; here generally <10 μM) to more saturated values, i.e., greater than 100 μM (Figure 2, red line, 120h low-pass filtered). The transition occurs in early to mid-winter (Figure 3) and coincides with the transition to downwelling favorable winds and the southeast currents (Figure 2). Following the steep increase in oxygen, there is a gradual and steady decreasing trend until the fall (Figure 3). At the M4 location, the dissolved oxygen concentrations at the two deepest instruments (541- and 1046-m below surface) were consistently anoxic. At the shallowest M4 instrument (235 m below surface), the temporal pattern of dissolved oxygen is similar to that found at the shallow inshore locations, but the maximum concentration was considerably less than that found at M1 and M2 (Figure 3). The instruments at M43 are positioned close to the OMZ boundary and the low oxygen extends thru December and into January as a result.
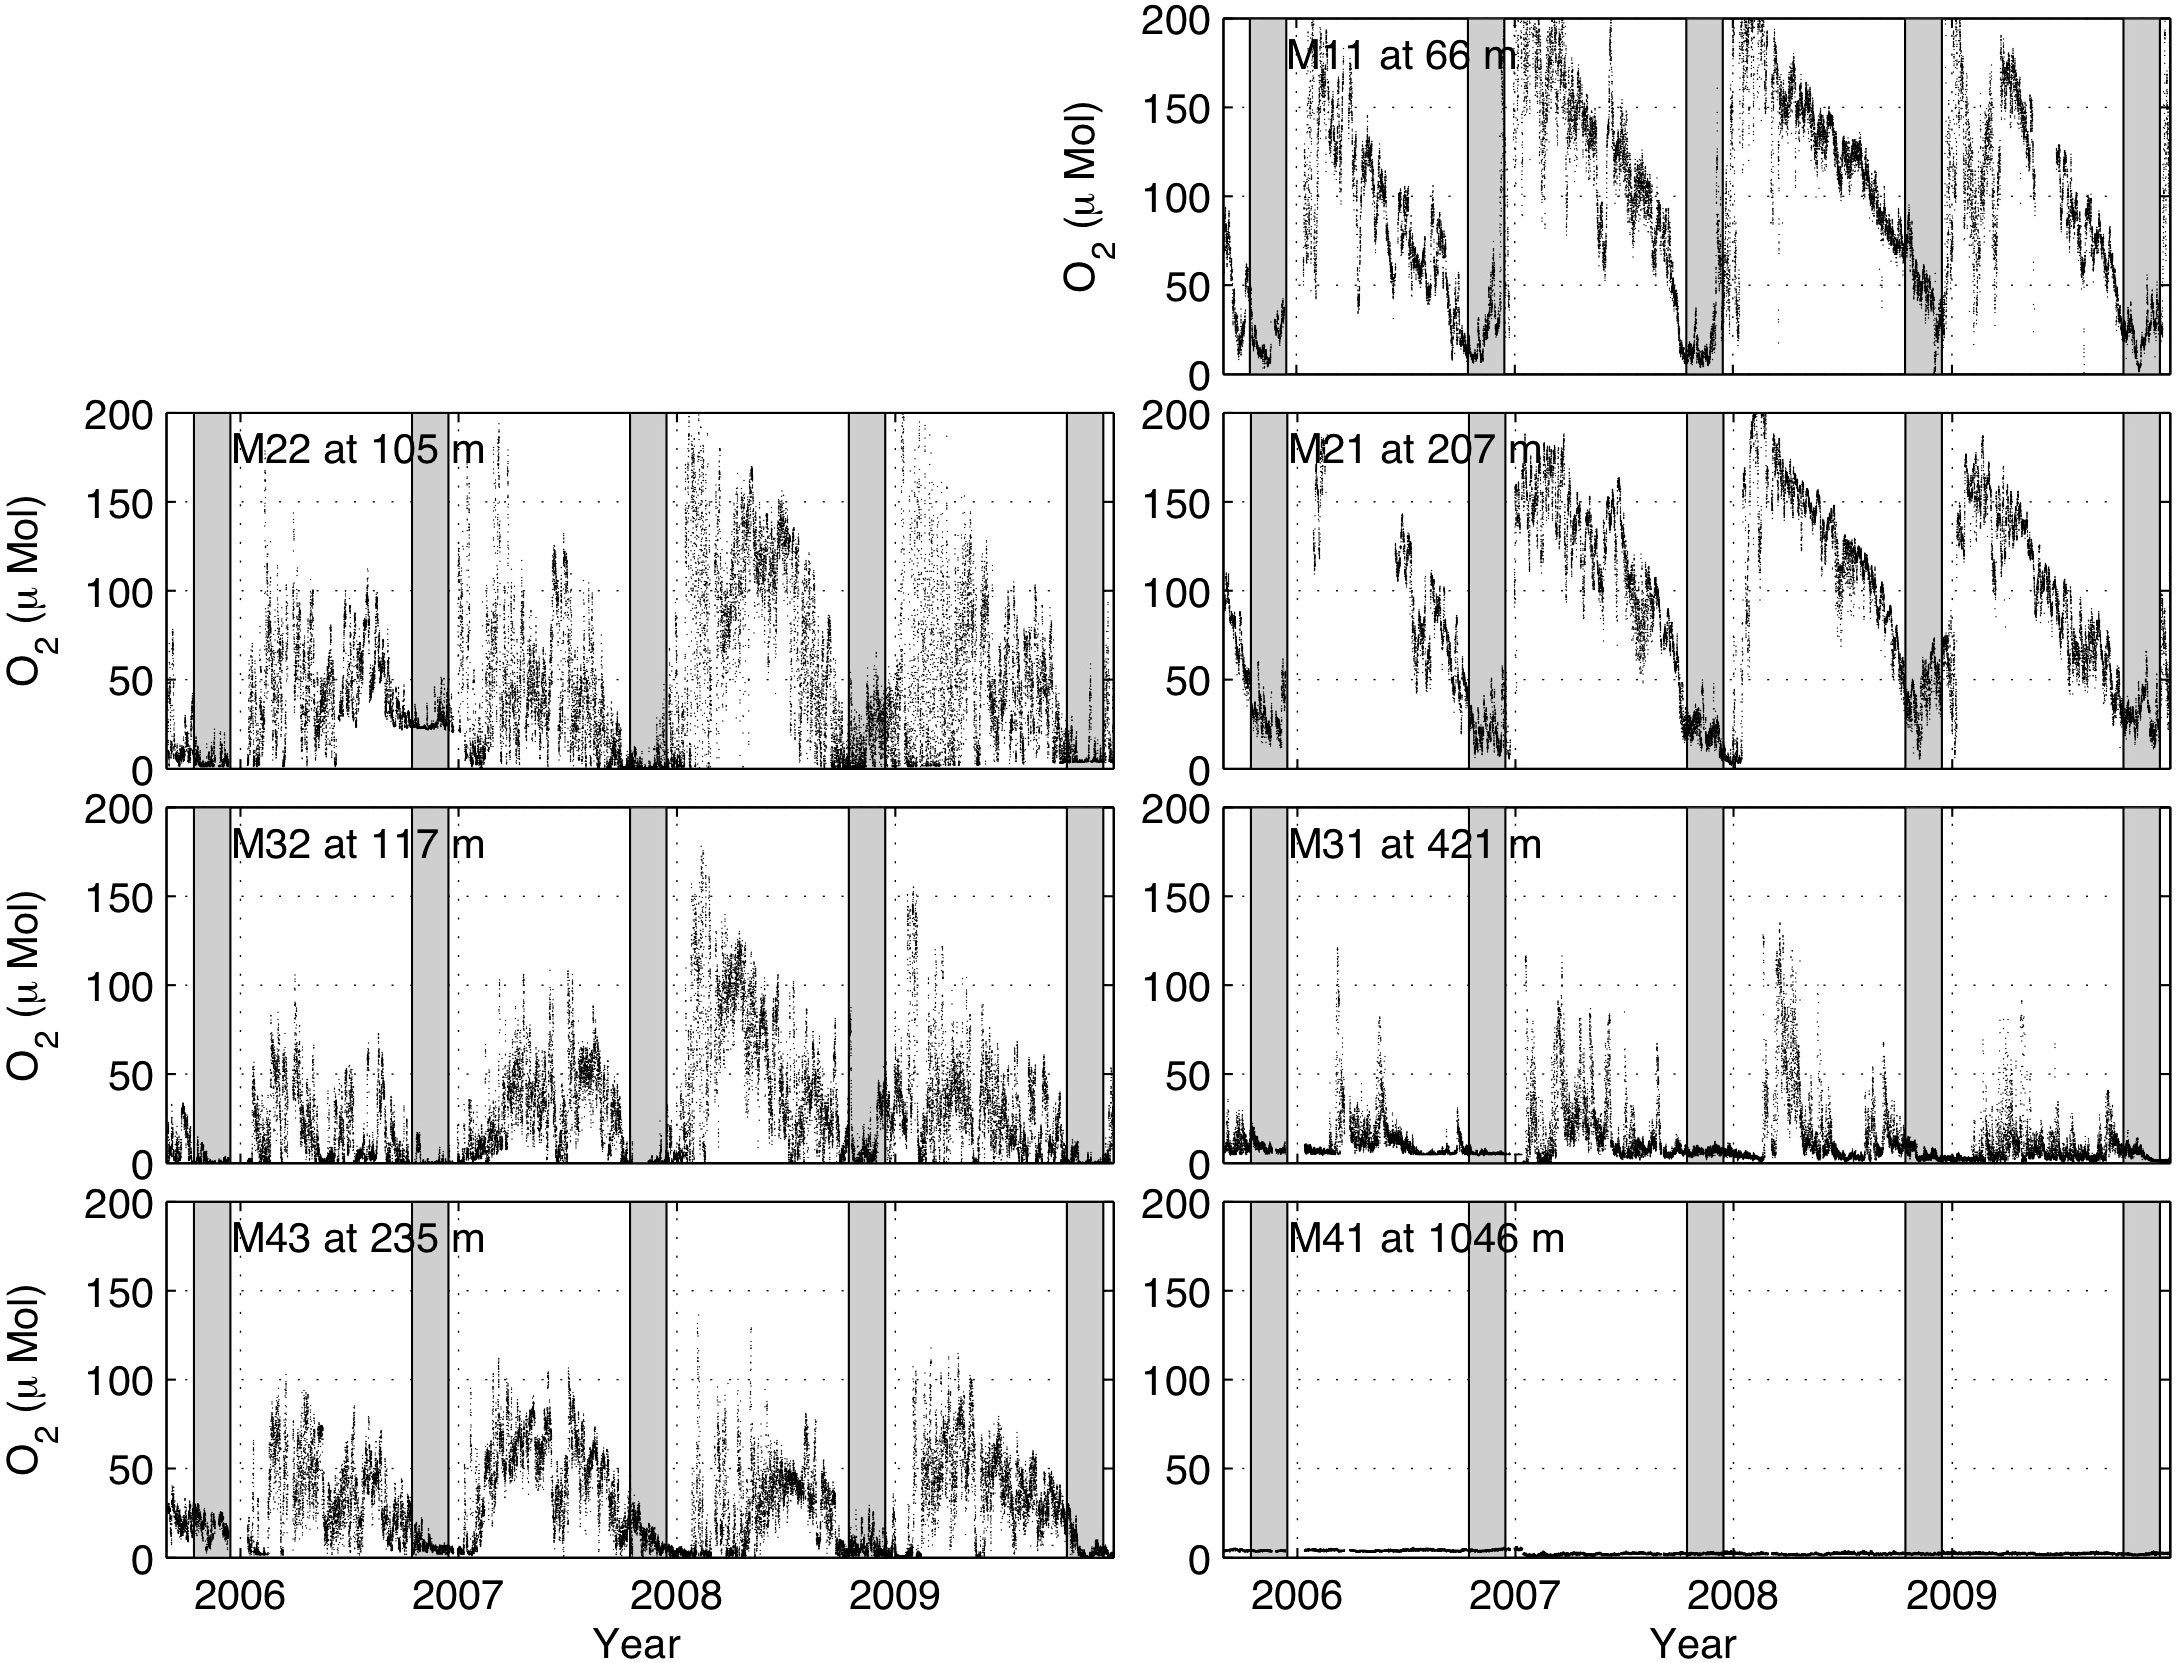
Figure 3 Unfiltered (raw) dissolved oxygen (μ Mol) measurements by the LORI mooring system between 2005 and 2010. The station name and sensor depth (Figure 1B) are shown at the top-left corner of each panel. The left three panels show oxygen from the top sensors of M2-M4 nodes; while the right panels are measurements from bottom sensors of M1-M4 nodes. Gray vertical bars indicate the time period of 15 October - 15 December.
There is short-term variability (days to weeks) superimposed over this seasonal cycle at the deepwater (>400m) locations (M31, M32 and M43) that indicates that hypoxic and anoxic conditions can occur near the shelf edge at any time of the year (Figure 3). However, the persistence, that is the prolonged duration of the low-oxygen conditions, is longer (order of 2-4 weeks) in late summer and fall, while non-fall hypoxic events tend to be shorter (order of 1-8 days).
The rate of oxygen decline for the period defined by the abrupt winter transition (peak oxygen values) and the fall hypoxic period was estimated for the years 2005-2009 using a least-squares linear regression of the raw (unfiltered) oxygen time-series for Stations M11 and M21 (Figure 4). Generally, the oxygen decline rate is nearly constant for each location and water depth between February and September (e.g. M11 and M21, Figure 4) and the magnitude of the decline rate increases between September to mid-November. At M11, the average oxygen decline rate of years 2006-2009 is approximately -11 μM/month between February and September; the rate becomes approximately -28 μM/month between September and November in most years 2005-2009 except for 2008 (Figure 4A). At M21, the average rate of years 2006-2009 is approximately -13 μM/month between February and September and increases to about -25 μM/month between September and mid-November (Figure 4B). The 2005 records only cover the September-November time period, when the rate appears to be somewhat higher (~25 µM/month).
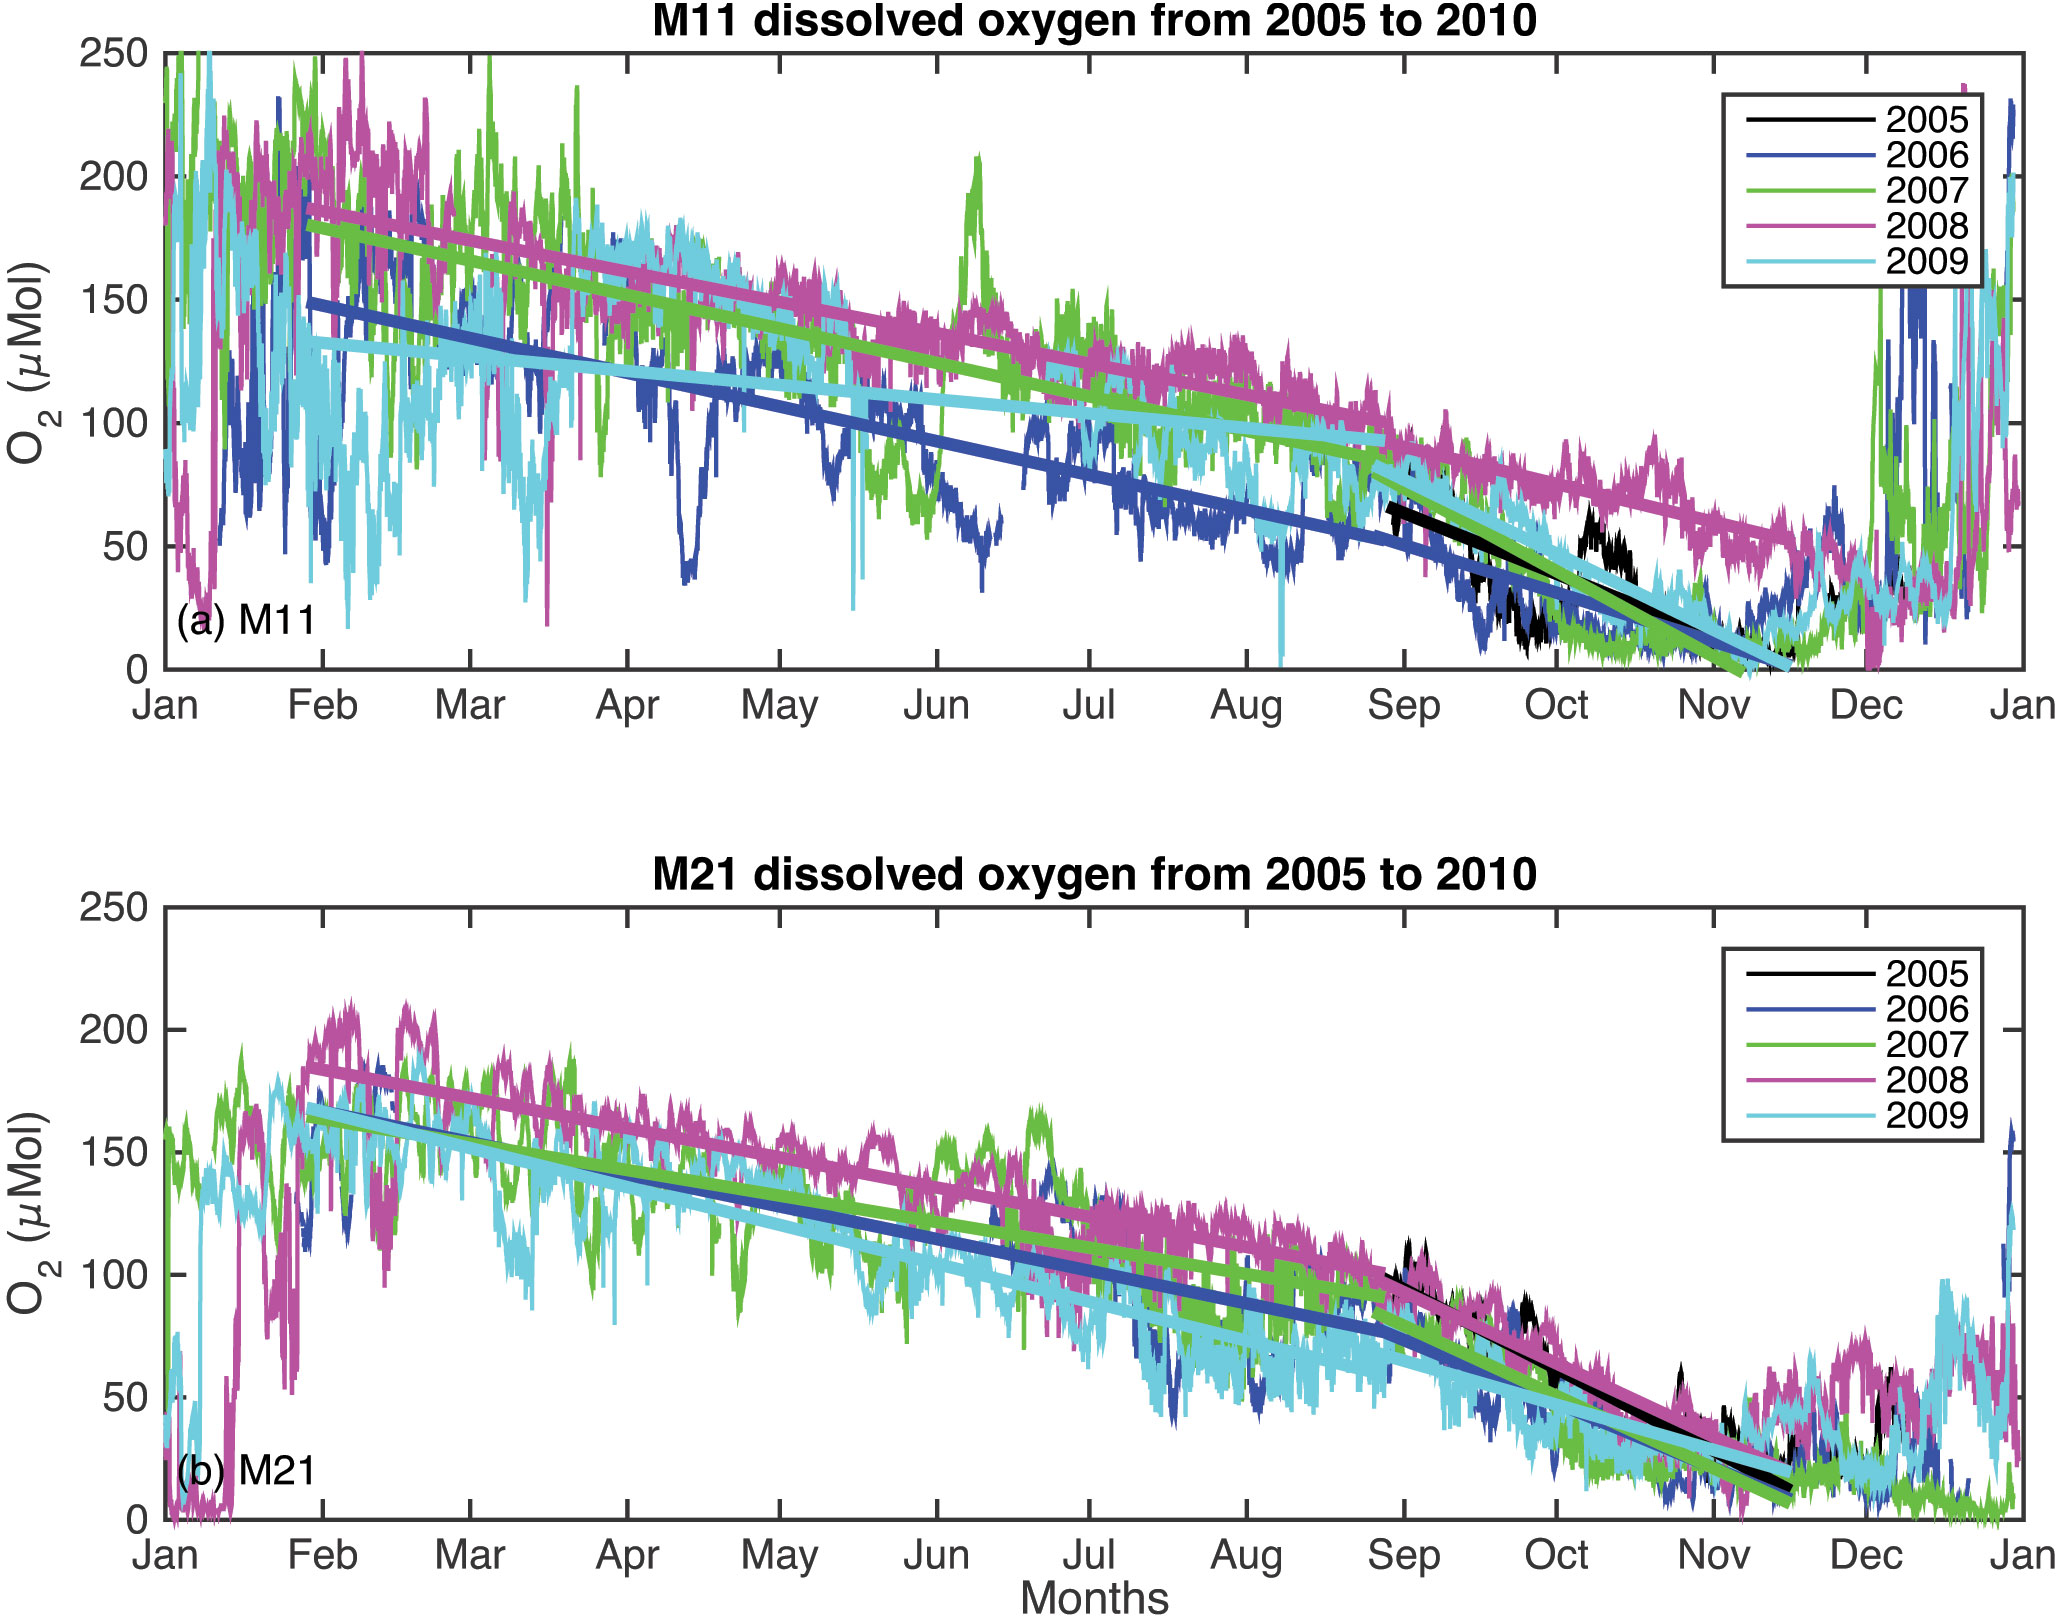
Figure 4 The rate of oxygen decline for the time periods defined by the abrupt winter transition (peak oxygen values, approximately February), the September breakpoint and the fall hypoxic period for the years 2005-2009 using a least-squares linear regression of the unfiltered oxygen time-series for Stations (A) M11 and (B) M21.
The other locations do not show a consistent gradual oxygen decline during the year. We note that M11 and M21 (see Figure 1B for locations) are the bottom instruments and are positioned above the permanent oxycline that marks the oxygen minimum zone in the Indian Ocean. The bottom instrument at M31 is near the top of the OMZ and M41 is well within the OMZ. The instruments at M22, M32, and M43 are in the interior of the water-column (Figure 1B). The reason why the oxygen decline rates speed up between September and November is unclear and needs more investigation. It might be associated with the decomposition of algal blooms that occurred in the summer (Harrison et al., 2017). It is tempting to conclude that the relatively constant rate of oxygen decline during the year (Figure 4) suggests steady rates of Ekman pumping that continuously bring low oxygen water towards the surface. However, other processes, such as local respiration and episodic wind events (i.e., weather) are also most certainly involved. The observed variability around the annual rate of decline in all years, and short-term increases in oxygen concentration are evidence of additional unresolved processes in play. Further work is needed to quantify the relative importance of physical and biological processes and their effects.
The five-year long temperature records show prominent temperature increases starting in November until February at M1, M2 and the top sensor of M3 stations (Figure 5, vertical gray bars indicate the time period of 15 October - 15 December), which is the same period of the winter monsoon. The temperature increase is likely caused by the downwelling generated by NE monsoon winds. The downwelling drives the upper warm water deeper and causes the temperature increase at the depth of the mooring sensors in the winter. At the same time, atmospheric-derived dissolved oxygen from the surface is mixed into the deep water and elevates the oxygen content from hypoxic levels to more saturated values. The highest value of dissolved oxygen occurs about a month after the temperature increase suggesting that it takes about a month for the high oxygen water near the sea surface to reach the sensor depth by downwelling. The calculated dissolved oxygen saturations (not shown) suggest the water is under saturated throughout the year at all depths and locations, except in February at M11 when the oxygen concentration is the highest (~200 µM). M11 is the shallowest station and the oxygen-saturated water measured at 66 m in February is likely brought down from the surface by the NE monsoon driven downwelling. Periodic temperature decreases are found in the 5-year temperature data during the summer monsoon at the three onshore moorings. For example, in July 2007, there are persistent temperature decreases at all top sensors (Figure 5). During the same period, low oxygen water is seen at all top sensors (Figure 3). This is a good indicator of the upwelling caused by the persistent summer monsoon.
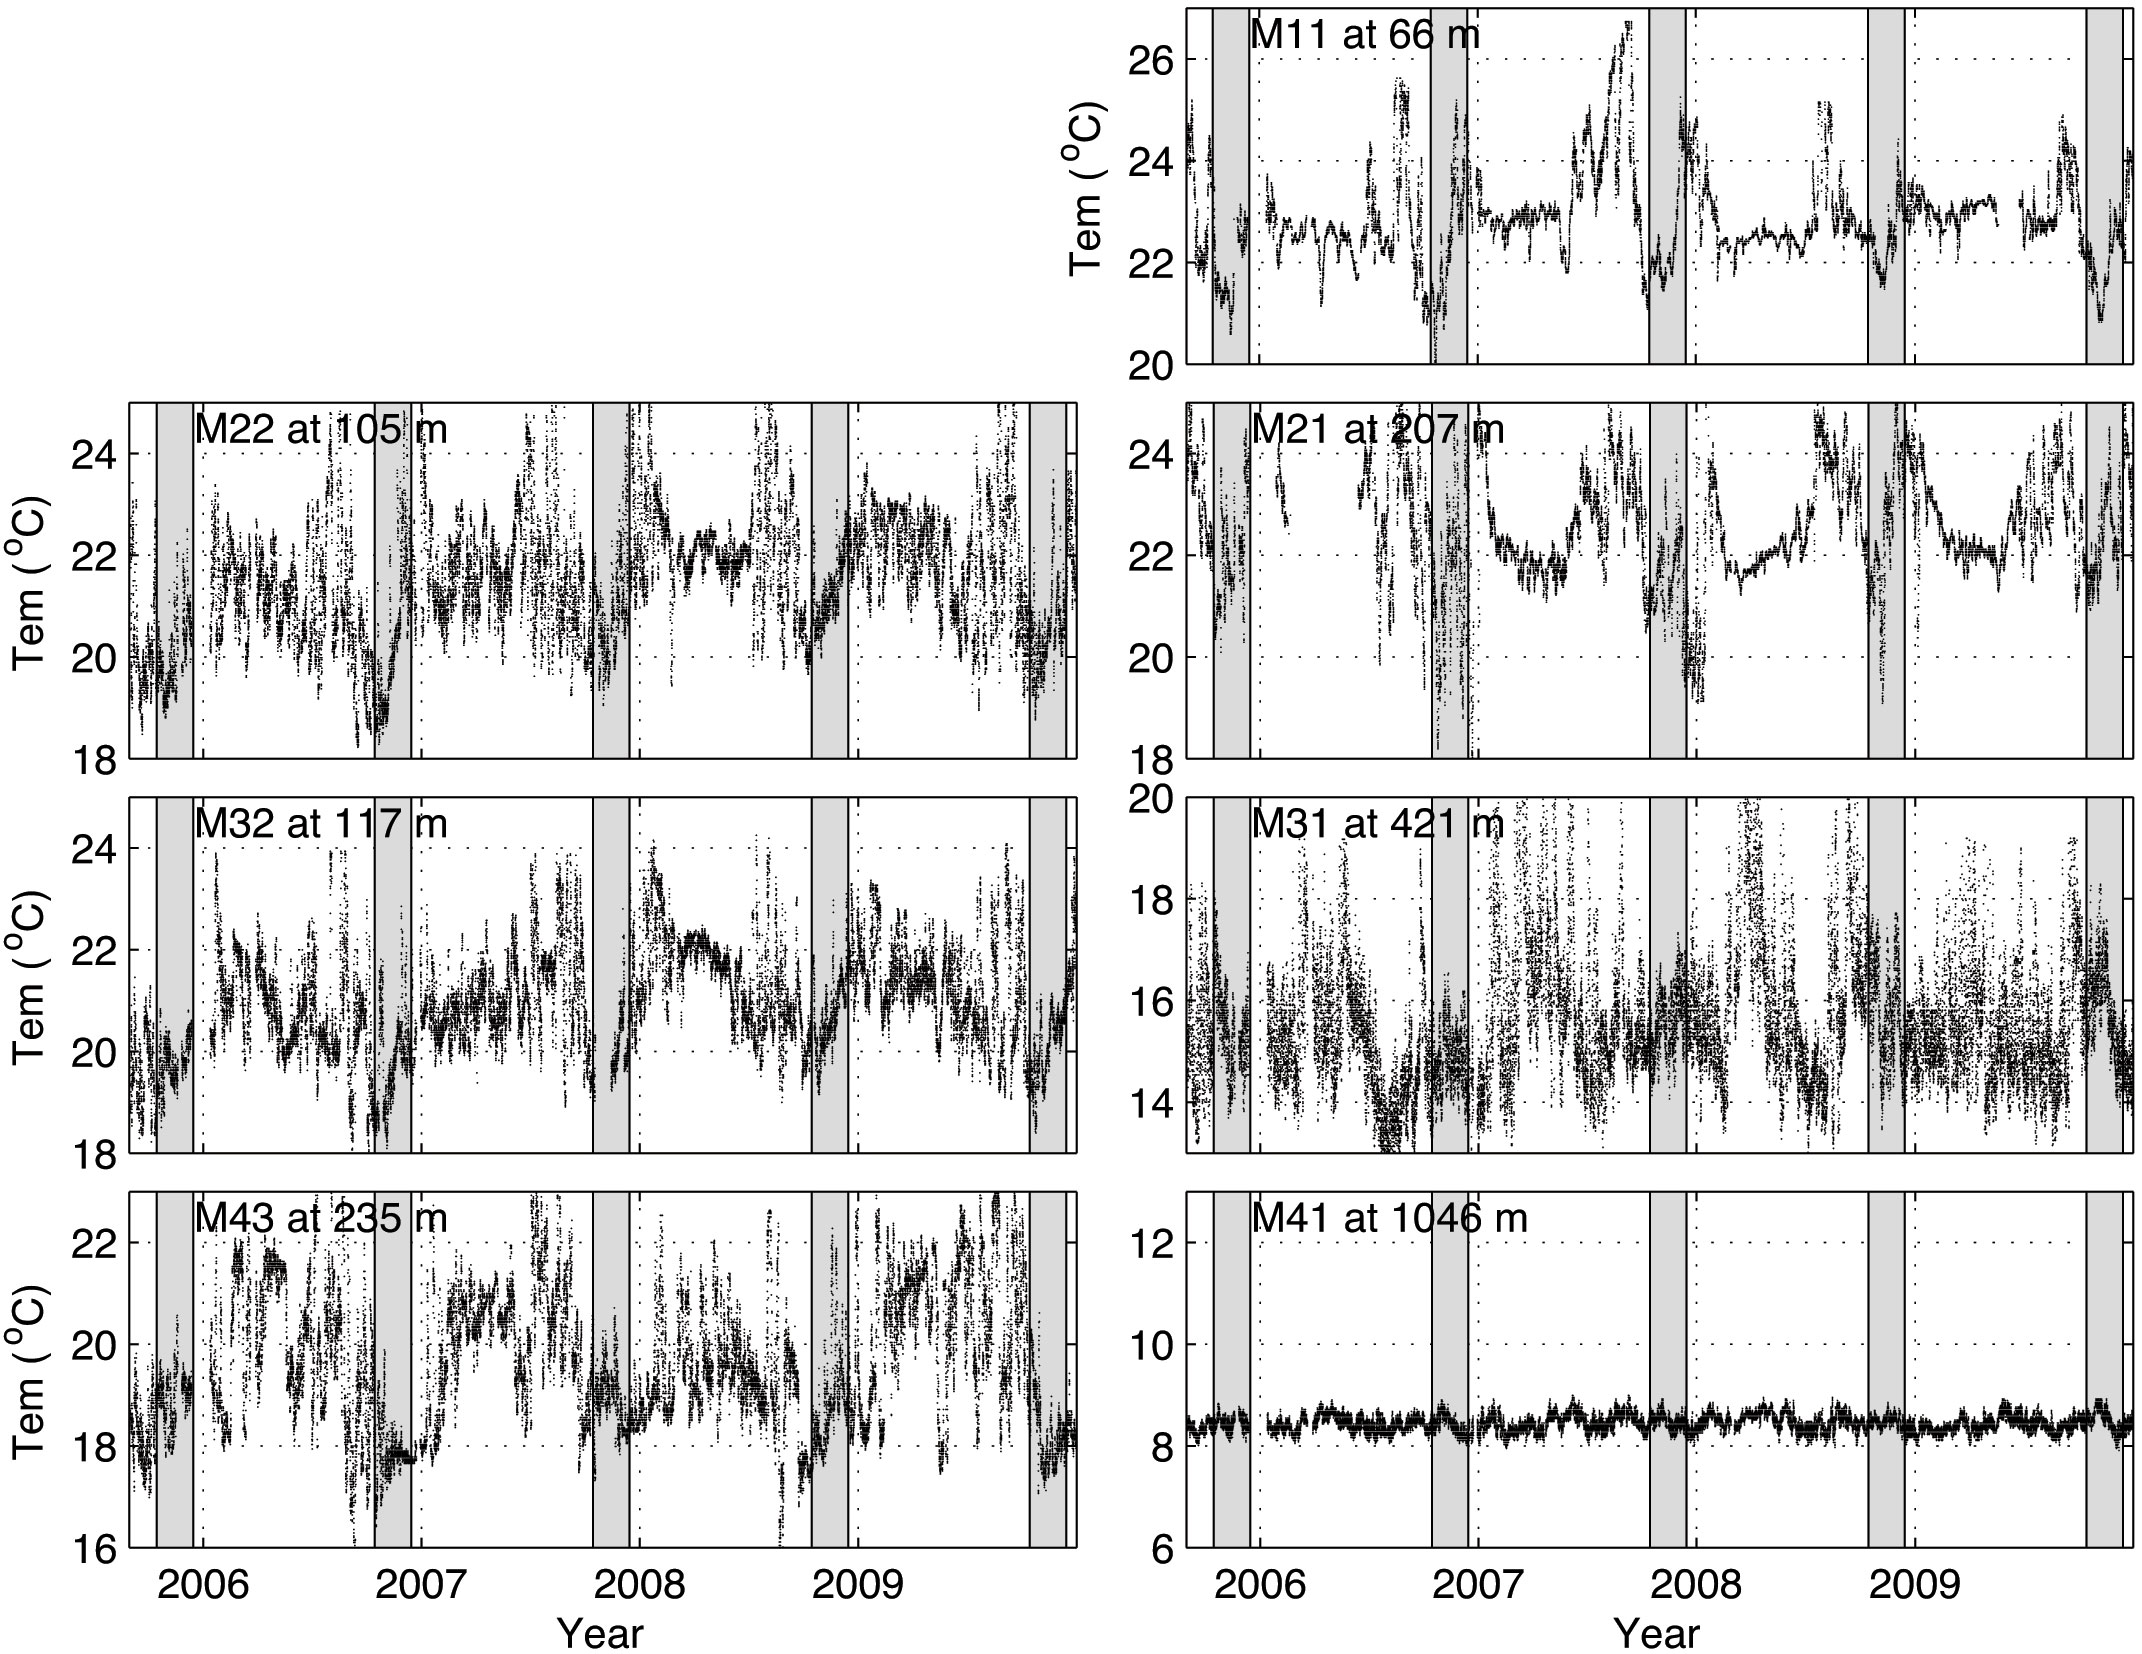
Figure 5 Time-series of unfiltered temperature (°C) observations by the LORI mooring system between 2005 and 2010. Similar notation is used as in Figure 3. Gray vertical bars indicate the time period of 15 October - 15 December, i.e., the period of sustained low oxygen concentration observations.
A scatterplot of current velocity (Figure 6A) shows that the strong southeast current flow is associated with high oxygen concentrations at M21. Currents are largely quiescent (<10 cm/s) the rest of the year, with the low current velocities generally being associated with low dissolved oxygen concentrations (highlighted in red in Figure 6A). The correlation coefficient between the along-shelf current velocity and oxygen records at M21 (shown in Figure 2) is r = 0.71 (p-value < 0.01).
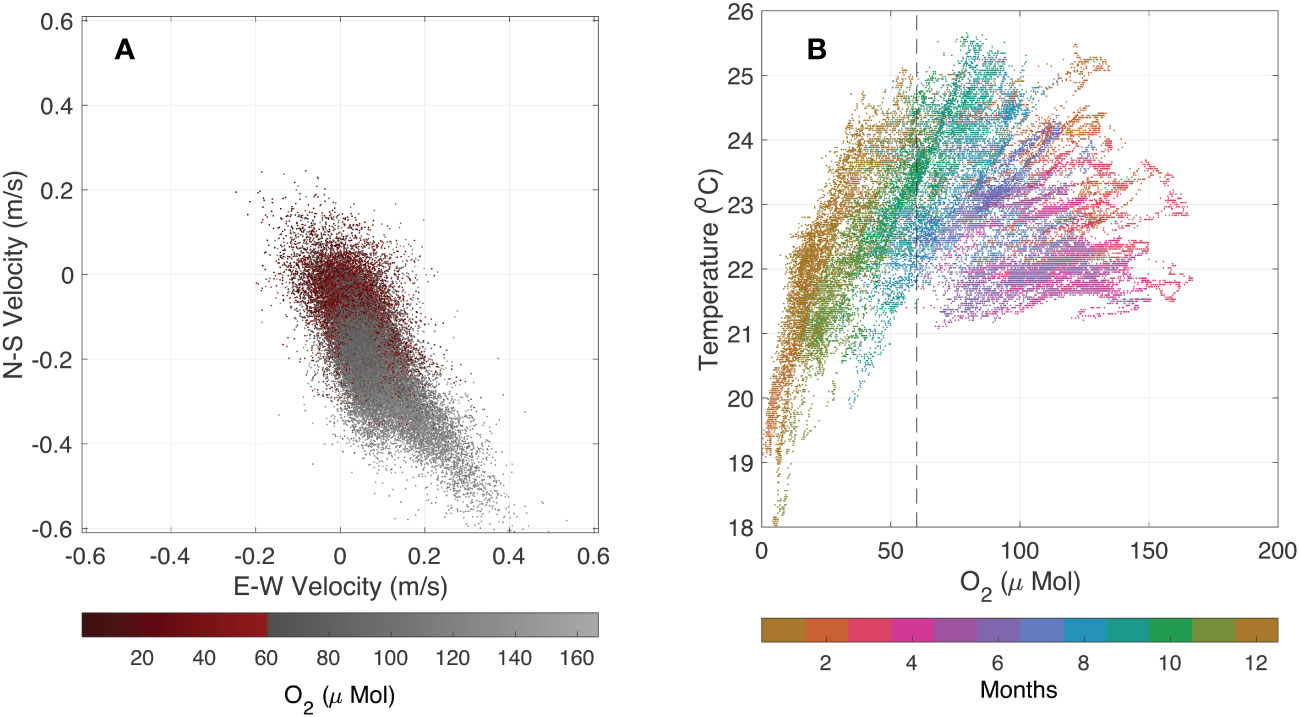
Figure 6 Data from bottom sensors at the M2 location showing (A) currents with hypoxia highlighted (dissolved oxygen < 60 μ Mol) and (B) temperature versus dissolved oxygen with color-coded months. Currents in (A) are in a geographic frame (x-axis: east-west/y-axis: north-south component).
Examination of the temperature records at M21 indicates that the low-oxygen water is associated with a drop in ocean temperature (Figure 6B). As previous work has shown (Olson et al., 1993), this indicates that upwelling processes that uplift waters already low in dissolved oxygen content are more likely responsible for the variability than in situ respiration (water column or benthic). The occurrence of relatively warm temperatures is coincident with waters relatively high in dissolved oxygen content (Figure 6B). This occurs during the NE monsoon, when the southeast currents associated with the downwelling are generated.
The Persian Gulf outflow is also associated with high dissolved oxygen (e.g., Wang et al., 2012; Wang et al., 2013a), which might contribute to the short-period (2-10 days) variations in the dissolved oxygen time series in the study region. Given the high salinity and density of the Persian Gulf outflow, and the fact that it sinks to a depth of 150-350 m as it enters the Sea of Oman and flows south along the shelf edge, ventilating the layer between σ0 26.0-26.8 kg m-3 (Olson et al., 1993; Wang et al., 2013a; Al-Yamani and Naqvi, 2019; Lachkar et al., 2019), it might be thought that this could adversely affect the oxygen content. However, this water is essentially saturated with oxygen as the Persian Gulf is very shallow, and will contain more dissolved oxygen during winter, when the outflow is stronger and denser than in summer (Bower et al., 2000; Swift and Bower, 2003). There is also considerable oxygenation of the dense outflow through tidal mixing within the Strait of Hormuz (Bower et al., 2000). According to Banse (1997), the incoming Persian Gulf water can add about 5 µM of oxygen to the water in the Sea of Oman, and also reduces denitrification. The incoming water stays close to the shelf edge in winter, but spreads across the Sea of Oman in summer, which can result in changes in the depth of the oxycline and affect fisheries (Queste et al., 2018). A good example of this was seen in the WOCE line (I-07) in July-August 2005 between 23° and 24°N, which showed an intrusion of relatively high oxygen water (20-50 µM) within the OMZ at depths between 80 and 300 m associated with a bolus of high salinity water (36.6-37.3) from the Persian Gulf at stations 843-848 (Talley, 2014).
Our interpretation of the moored data is that the downwelling conditions prevalent during winter abruptly move the OMZ front seaward while ventilating the inshore and shallow waters of the shelf. In the late summer and fall, upwelling conditions persist and allow the OMZ to gradually push shoreward. Thus, the seasonal wind pattern sets up an oscillation of the OMZ front along the north Omani coast, which regularly ventilates the shelf. Peak ventilation occurs in February/March and peak hypoxic conditions occur in November and December (Figures 3, 4). This is borne out also by the climatology of the offshore region in the Sea of Oman (see Figure 7), which shows oxygen data, taken from the World Ocean Atlas (Garcia et al., 2019), from degree squares centered at 24.5°N, 57.5°E and 25.5°N, 57.5°E. At both latitudes, maximum ventilation to below 300m depth is apparent in the March-May period, while hypoxic conditions are at their most severe and reach closest to the surface (~50 m) during October-December.
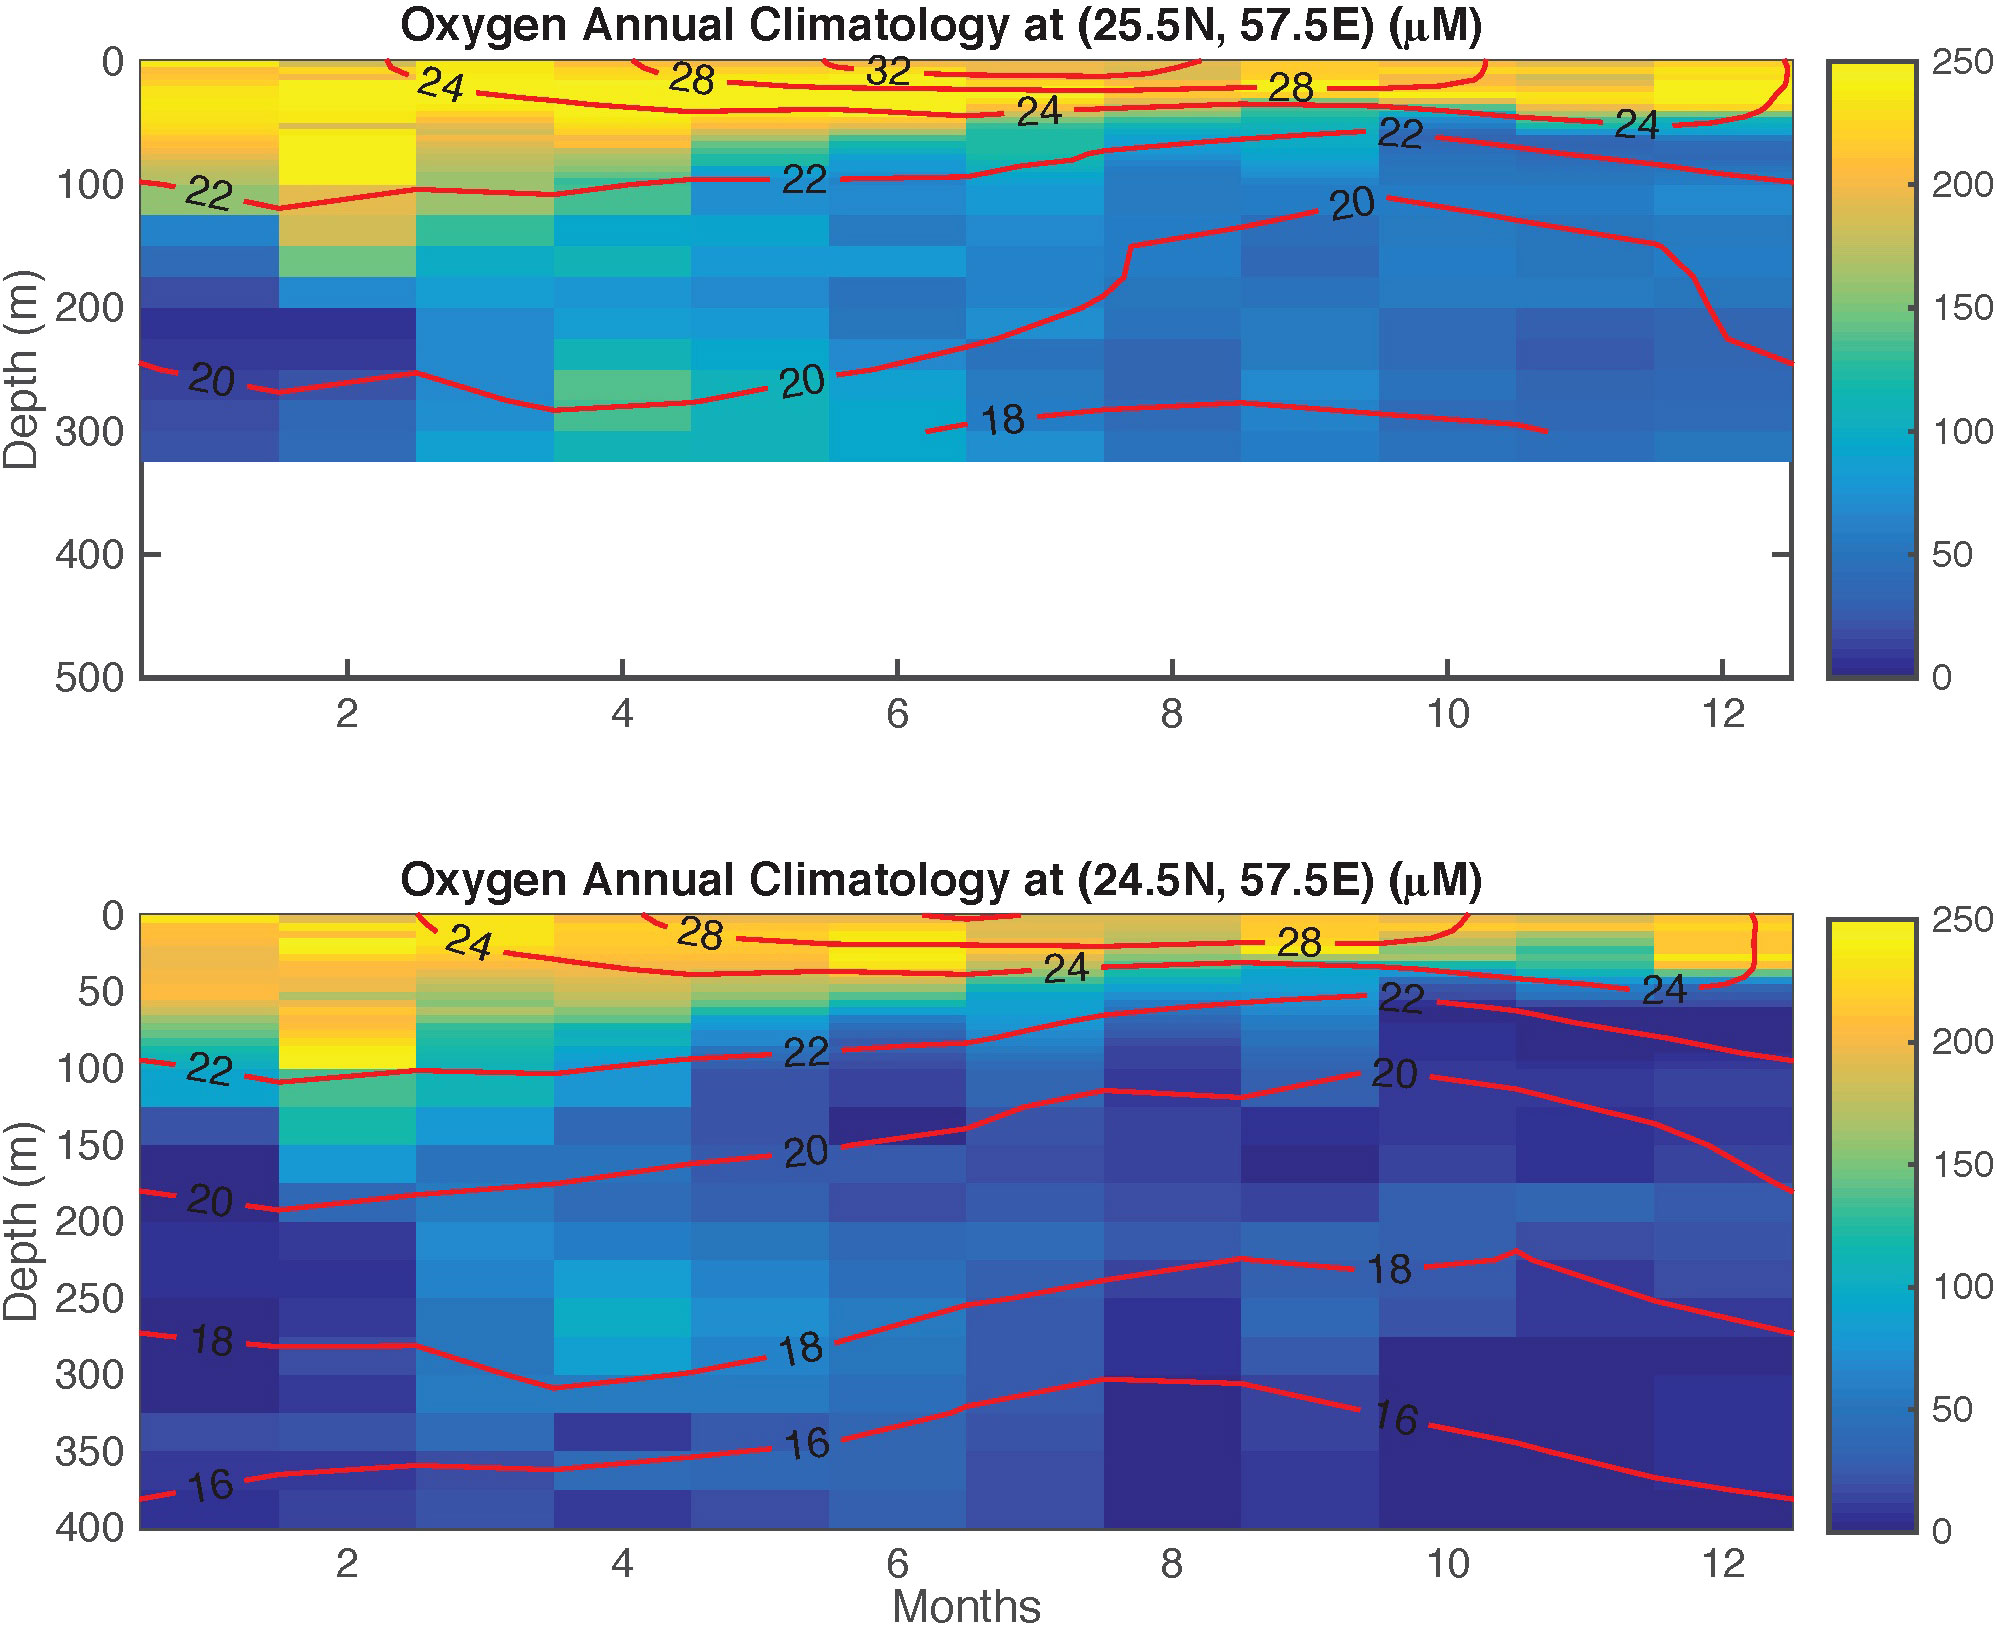
Figure 7 Oxygen climatology from degree squares centered at 24.5°N, 57.5°E and 25.5°N, 57.5°E (data from World Ocean Atlas, Garcia et al., 2019).
3.3 Impacts on fisheries
Claereboudt et al. (2001) and Thangaraja et al. (2007) have shown the presence of fish mortality along the northern Oman coast. There is suspicion and some circumstantial evidence that low dissolved oxygen concentration is a possible cause of at least some of the fish mortality in the northern Arabian Sea (Claereboudt et al., 2001; Piontkovski et al., 2012; Harrison et al., 2017). A bimodal pattern of fish kill events is seen; with fish kills being prevalent during winter/early spring (February-April) and late summer/fall (August-November) and with no fish kill events observed in May through July (Table 2). Unfortunately, there are few direct observations of oxygen concentration that demonstrate conclusively that low oxygen levels are responsible for the fish kill events, and there is also no obvious relationship between the available fish kill survey data and the moored observations (Table 2). However, based on the limited data, a larger numbers of fish kills occur in late summer and fall when the dissolved oxygen concentrations are lowest and dissolved oxygen less than 60 μM frequently reaches depths as shallow as 66 m (Table 2; see also Figure 7). The likelihood of a fish kill event occurring in any month is greatest (46–75%) in this period, correlates with the period during which the OMZ impinges on the shelf and slope during the SW Monsoon (Figures 2-4). Although the summer/fall fish kill and low oxygen are coincident in time, this does not constitute a direct causal relationship. However, this can direct future investigation and we recommend a more targeted observational study to more fully determine whether a direct mechanism exists.
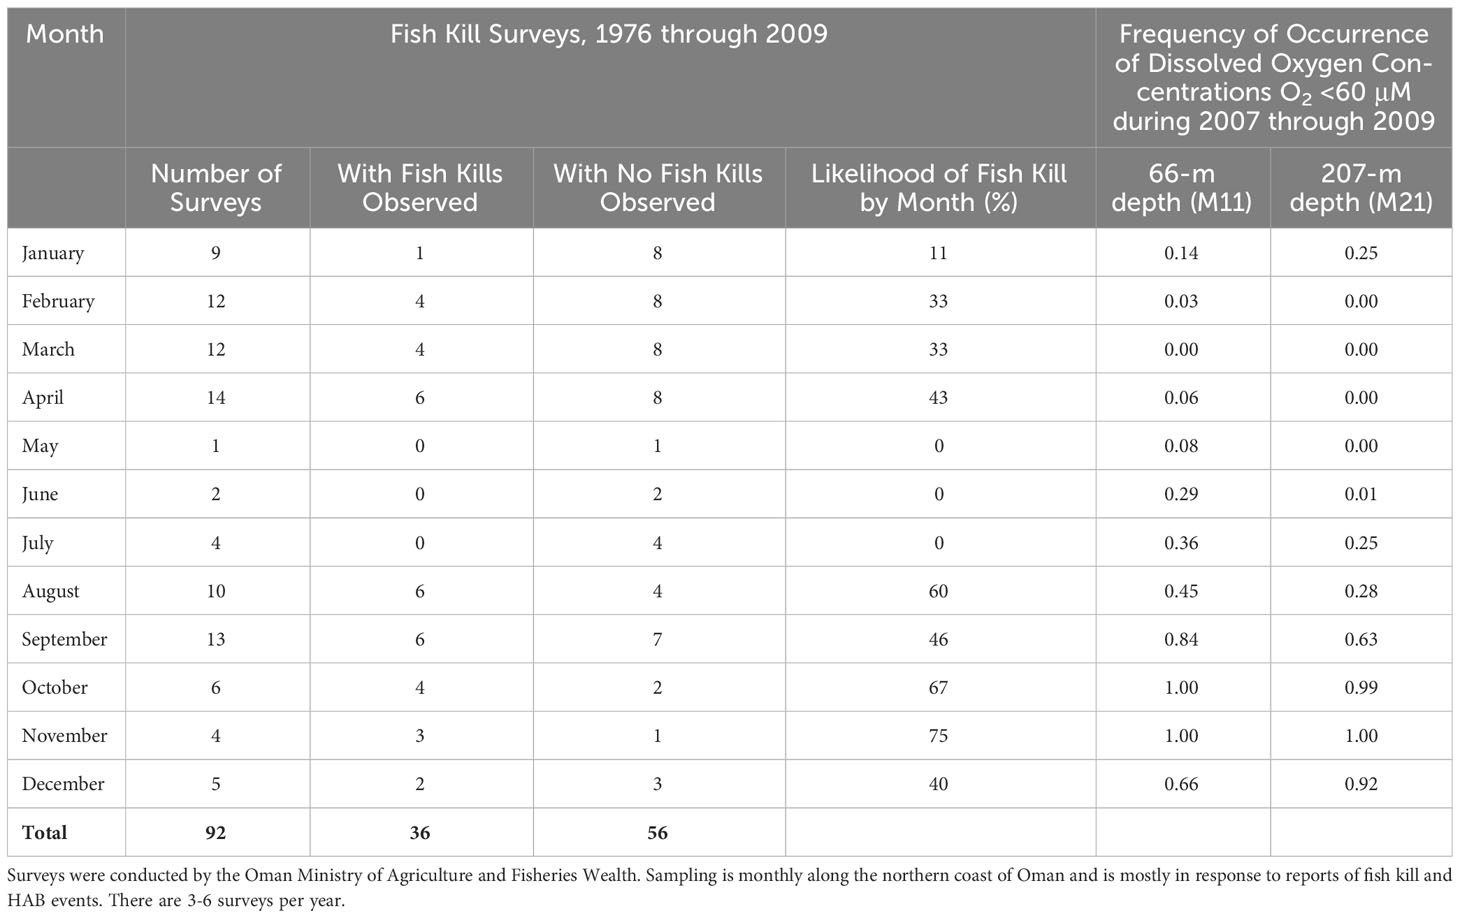
Table 2 Statistical evaluation of fish kills off the northern coast of Oman from 1976 through 2009.
In spring, however, fish kills are only moderately likely (11–40%) and appear unrelated to changes in the depth of the <60 μM oxygen surface. At this time, fish kills occur when oxygen values are high due to the SE currents that ventilate the lower waters and are thus not attributable to low oxygen. We therefore speculate that they may be associated with Harmful Algae Bloom (HAB, Harrison et al., 2017) or other phytoplankton bloom events (Claereboudt et al., 2001; Al-Gheilani et al., 2011; and Gomes et al., 2014).
Increases in chlorophyll a concentrations in the Sea of Oman are found in August-September and January-February at the end of the monsoon periods (Al-Azri et al., 2010). While these authors state, based on fortnightly sampling from two coastal locations, that concentrations at the end of the SW monsoon are generally higher, peak concentrations can occur at almost any time. More widespread studies of Moderate Resolution Imaging Spectroradiometer (MODIS) data by Abuelgasim and Alhosani (2014); Bakhtiar et al. (2020), and Piontkovski and Al-Oufi (2014) that cover the whole Sea of Oman showed highest concentrations in February-March, which Abuelgasim and Alhosani (2014) attributed to the outflow of nutrient-rich water from the Persian Gulf. Such increased nutrient inputs could support more frequent HAB outbreaks. Again, more targeted studies are required to confirm or disprove this speculation.
Recent fish assemblage surveys using video techniques to characterize the habitat and fish abundance and diversity along the continental shelf margin (77~164 m) near Muscat, Oman (within 180 km from the cabled array) found species diversity increased by 96% in March 2006 compared to November 2005, a pattern consistent at all three types of habitats: sand, reef and megabenthos (McIlwain et al., 2011). McIlwain et al. (2011) also found all observed fish prefer demersal habitats along the Omani continental shelf. They suspect that the seasonal changes in fish assemblage are likely caused by the monsoon-generated upwelling events (Smith and Bottero, 1977; Lee et al., 2000; Shi et al., 2000), yet no hydrographic data were measured during their surveys to examine this. The seasonal hypoxia shown in this study provides strong evidence to support their hypothesis. As shown in Figures 3, 4, the lowest oxygen level is measured in November, while oxygen is typically not hypoxic in March on the Oman continental shelf. Because most fish prefer demersal habitats, the deoxygenation of the near-bottom water will displace the fish community along the coast when hypoxia is formed and cause the reduction of both abundance and diversity of coastal fish as shown in McIlwain et al. (2011).
3.4 Implications of future climate change
Although the interannual variability of the date of onset of monsoons, ventilation of the deep shelf, or the rate of decline of oxygen during 2005-2010 are limited, ongoing and future climate change could lead to changes in the timing and rates that are observed. For example, the relationship between dissolved oxygen concentration and fisheries underscores the impact that large-scale atmospheric patterns can have on coastal ecosystems (IPCC, 2021). Changes to atmospheric forcing of the northern Indian Ocean may alter monsoonal wind patterns and could lead to changes in duration of the upwelling/downwelling seasons of the Sea of Oman (Goes et al., 2005). The systematic decrease in spring snow and its persistence over large parts of southwest Asia and the Himalayan-Tibetan Plateau region in recent years has enhanced the land-sea pressure gradient, which in turn has strengthened southwest monsoonal winds resulting in intensified wind-driven coastal upwelling in the Sea of Oman during summer and fall (Goes et al., 2005). This could potentially lead to a longer hypoxic season, which may further threaten fisheries of the region.
Increased global warming is likely to increase the buoyancy of the incoming Persian Gulf water, thus reducing the ventilation and oxygen concentration within the northern Sea of Oman (Queste et al., 2018; Lachkar et al., 2019; Naqvi, 2021), although the former is counteracted to some extent by increasing salinity in the outflow as freshwater flow into the Persian Gulf is reduced (Al-Yamani and Naqvi, 2019). Decreasing ventilation will lead to increased denitrification in the Sea of Oman, thus reducing its oxygen concentration. Thus, the Omani coast may be doubly susceptible to large-scale atmospheric and oceanographic change. Indeed, the development of hypoxia along the Oregon coast (Grantham et al., 2004; Adams et al., 2016) may already be the evidence of similar change on the US west coast. Sustained ocean-monitoring systems such as the one described here are necessary to fully characterize the long-term response of oceanographic systems to climate variability (IOC/UNESCO, 2009; Falkowski et al., 2011).
4 Conclusions
The variability of dissolved oxygen concentrations in the Sea of Oman is seasonal and correlated with monsoonal winds. Highest concentrations >150 μM occur in late winter (Figures 2; 3). Concentrations then decrease steadily to minimum values of <60 μM in fall. The waters are then ventilated abruptly with the onset of the NE Monsoon.
The seasonal variability of dissolved oxygen is probably related to the encroachment of the OMZ in the Sea of Oman onto the shelf and slope off the coast of northern Oman. The proposed explanation is shown schematically in Figure 8. During winter and spring, the NE Monsoon sets up a relatively energetic southeast-flowing current system (Figure 2), which indicates the coastal ocean response to downwelling-favorable winds. The temperature time-series observed at M1 and M2 shows a noteworthy temperature increase in December and January, which we attribute to the downwelling conditions. The NE-Monsoon-generated downwelling then moves the OMZ front seaward (Figure 8, left) and brings high-oxygen water into the study region. In contrast, the pattern in late summer and fall is of slower currents during upwelling favorable conditions that allow the low-oxygen waters to penetrate shoreward onto the shelf and the upper waters over the slope (Figure 8, right). Thus, the seasonal dissolved oxygen cycle is phased with the arrival of the NE Monsoon that is downwelling favorable and the summer-fall season that is upwelling favorable.
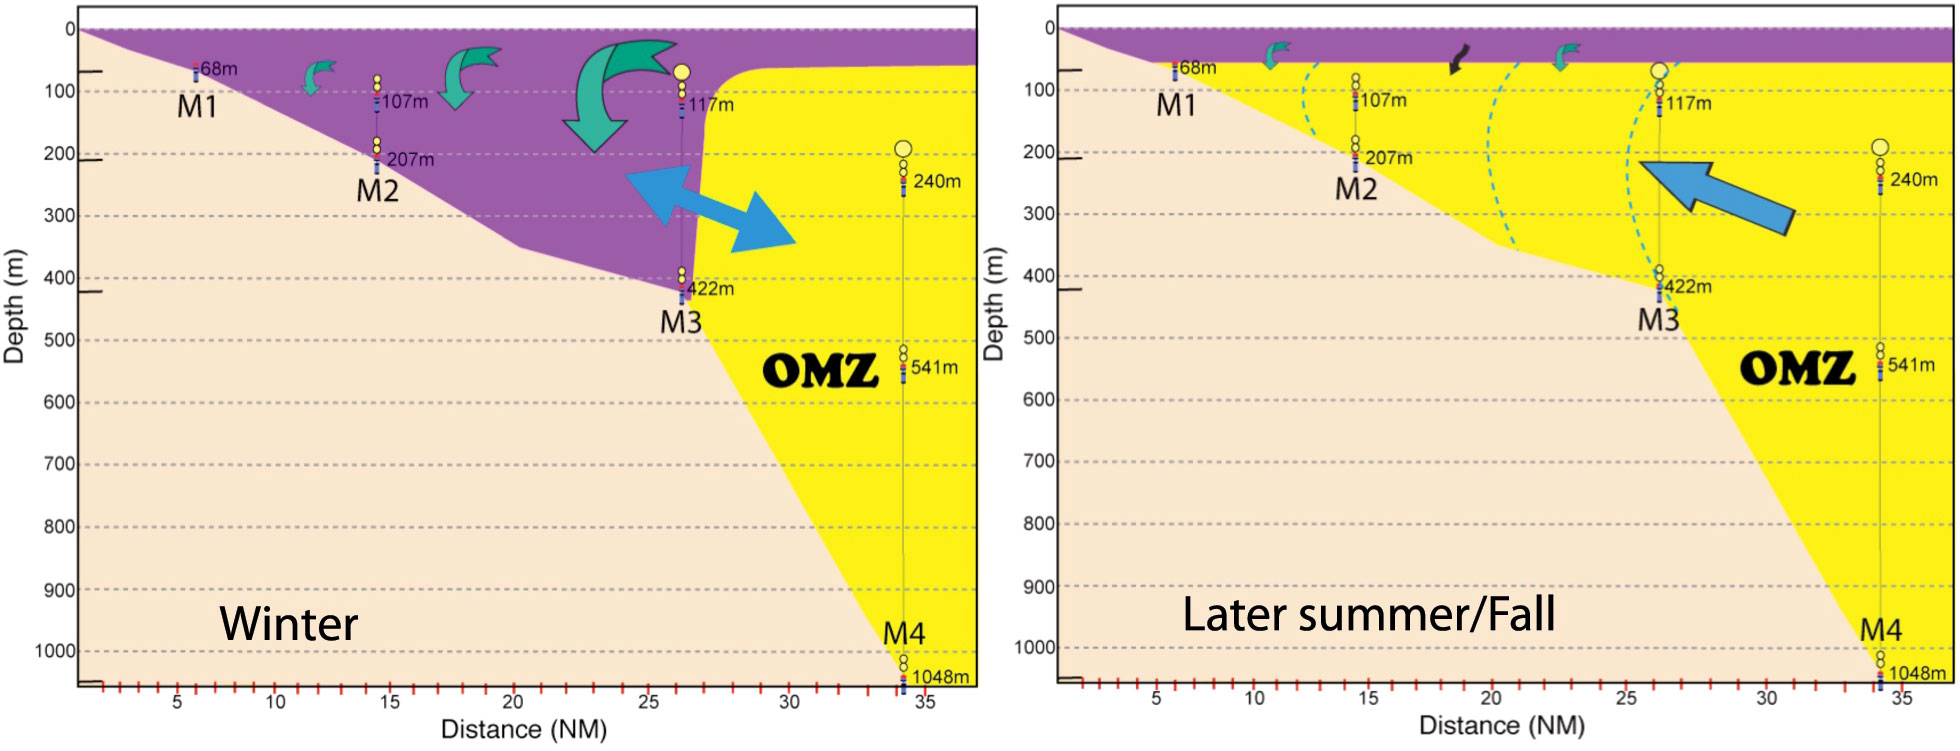
Figure 8 Schematic of seasonal pattern of dissolved oxygen concentrations along the northern Oman coastline. Left: Downwelling winter pattern. Right: Upwelling late-summer/fall pattern. Purple color indicates high dissolved oxygen concentrations; yellow color indicates low oxygen associated with oxygen minimum zone (OMZ). Blue arrow indicates movement of the OMZ front. Teal arrows indicate vertical movement and exchange of surface waters.
In conclusion, using observations from a unique, cabled ocean observatory, we find recurrent hypoxia in the Sea of Oman over the northern shelf and slope of Oman that appears to be driven by the seasonal monsoon winds. Future work in the region should involve a strategy to test the hypothesis that fish kill during the fall season is causally related to carbon cycling and the dissolved oxygen variability of the coastal ocean. Because of the marked seasonal variability, we further recommend that future studies involve subseasonal investigations to quantify the frequency, duration, and persistence of intraseasonal and episodic events (atmospheric and oceanographic) on coastal hydrography and their impacts on fisheries resources.
Data availability statement
The raw data supporting the conclusions of this article will be made available by the authors, without undue reservation.
Author contributions
SD: performed original analysis, compiled the manuscript. ZW: performed original analysis, edited manuscript. PC: performed original analysis, added manuscript text, edited manuscript. LA-K: contributed interpretation to results and regional historical context. LB, HA-S: provided quality control of observatory data and added interpretation to text. MS: provided quality control and initial analysis of observatory data. AJ, MH, and SI: provided quality control and initial interpretation of observatory data. All authors contributed to the article and approved the submitted version.
Funding
We thank Lighthouse for financial support of this project. This research was supported through a contract between Texas A&M University and Lighthouse R&D Enterprises Inc
Acknowledgments
The Lighthouse Ocean Research Initiative project in Oman and the Arabian Sea was developed and constructed by Lighthouse R & D Enterprises Inc. In Oman, the project was coordinated with the Oman Ministry of Agriculture and Fisheries Wealth through the Marine Science and Fisheries Centre. We thank the Oman Ministry of Fisheries Wealth and Lighthouse for providing access to the data . Color bars used in Figure 6 (and elsewhere) use the cmocean color scheme for oceanographic data representation (Thyng et al., 2016). We thank contributions of three reviewers whose thoughtful and insightful comments helped to clarify and focus the principal findings of the research.
Conflict of interest
The authors declare that the research was conducted in the absence of any commercial or financial relationships that could be construed as a potential conflict of interest.
Publisher’s note
All claims expressed in this article are solely those of the authors and do not necessarily represent those of their affiliated organizations, or those of the publisher, the editors and the reviewers. Any product that may be evaluated in this article, or claim that may be made by its manufacturer, is not guaranteed or endorsed by the publisher.
References
κämpf J., Chapman P. (2016). Upwelling Systems of the World (Switzerland: Springer International Publishing), 433.
Abuelgasim A., Alhosani N. (2014). Mapping the seasonal variations of chlorophyll concentrations in the Arabian Gulf and the Gulf of Oman using MODIS satellite data. Arab World Geographer. 17, 82–90. doi: 10.5555/arwg.17.1.n4q1wkt654720589
Adams K. A., Barth J. A., Shearman R. K. (2016). Intraseasonal cross-shelf variability of hypoxia along the Newport, Oregon, hydrographic line. J. Phys. Oceanogr. 46 (7), 2219–2238. doi: 10.1175/JPO-D-15-0119.1
Al-Azri A. R., Piontkovski S. A., Al-Hashmi K. A., Goes J. I., do Gomes H. R. (2010). Chlorophyll a as a measure of seasonal coupling between phytoplankton and the monsoon periods in the Gulf of Oman. Aquat. Ecol. 44, 449–461. doi: 10.1007/s10452-009-9303-2
Al-Gheilani H. M., Matsuoka K., Al-Kindi A. Y., Amer S., Waring C. (2011). Fish kill incidents and harmful algal blooms in Omani waters. Journal-Agricultural Mar. Sci. 16, 23–33. doi: 10.24200/jams.vol16iss0pp23-33
Al-Yamani F., Naqvi S. W. A. (2019). Chemical oceanography of the Arabian gulf. Deep-Sea Res. II 161, 72–80. doi: 10.1016/j.dsr2.2018.10.003
Bakhtiar M., Mazyak A. R., Khosravi M. (2020). Ocean circulation to blame for red tide outbreak in the Persian Gulf and the Sea of Oman. Int. J. maritime Technol. 13, 31–39. http://dorl.net/dor/20.1001.1.23456000.2020.13.0.1.3.
Banse K. (1968). Hydrography of the Arabian Sea shelf of India and Pakistan and effects on demersal fishes. Deep Sea Res. 15 (1), 45–79. doi: 10.1016/0011-7471(68)90028-4
Banse K. (1997). Irregular flow of Persian (Arabian) Gulf water to the Arabian Sea. J. Mar. Res. 55, 1049–1067. doi: 10.1357/0022240973224120
Bender L. C., DiMarco S. F. (2010). Quality control and analysis of acoustic Doppler current profiler data collected on offshore platforms of the Gulf of Mexico. OCS Study MMS 2009-010 (New Orleans, LA: U.S. Dept. of the Interior, Minerals Mgmt. Service, Gulf of Mexico OCS Region). 63pp.
Böhm E., Morrison J. M., Manghnani V., Kim H.-S., Flagg C. N. (1999). The Ras al Hadd Jet: Remotely sensed and acoustic Doppler current profiler observations in 1994–1995. Deep-Sea Res. Part II 46, 1531–1549. doi: 10.1016/S0967-0645(99)00034-X
Bower A. S., Hunt H. D., Price J. F. (2000). Character and dynamics of the Red Sea and Persian Gulf outflows. J. Geophys. Res. 105 (C3), 6387–6414. doi: 10.1029/1999JC900297
Breitburg D., Levin L. A., Oschlies A., Grégoire M., Chavez F. P., Conley D., et al. (2018). Declining oxygen in the global ocean and coastal waters. Science 359 (6371), eaam7240. doi: 10.1126/science.aam7240
Brink K., Arnone R., Coble P., Flagg C., Jones B., Kindle J. C., et al. (1998). Monsoons boots biological productivity in Arabian Sea. Eos Trans. Am. Geophys. Union 27 (13), 165–169. doi: 10.1029/98EO00120
Chan F., Barth J. A., Lubchenco J., Kirincich A., Weeks H., Peterson W. T., et al. (2008). Emergence of anoxia in the California Current large marine ecosystem. Science 319, 920. doi: 10.1126/science.1149016
Chapman P., Shannon L. V. (1985). The Benguela Ecosystem. Part II Chemistry and related processes. Oceanogr. Mar. Biol. Annu. Rev. 23, 183–251.
Claereboudt M., Hermosa G., McLean E. (2001). Plausible cause of massive fish kills in the Gulf of Oman, paper presented at Proceedings of the 1st International Conference on Fisheries, Aquaculture and Environment in the Northwest Indian Ocean, 10 January 2001, edited by Claeroboudt M., Al-Oufi H., Mcllwain E., Sultan Qaboos University, Muscat, Sultanate of Oman.
Codispoti L. A., Brandes J. A., Christensen J. P., Devol A. H., Naqvi S. W. A., Paerl H. W., et al. (2001). The oceanic fixed nitrogen and nitrous oxide budgets: Moving targets as we enter the anthropocene? Scientia Marina 65(Suppl. 2), 85–105. doi: 10.3989/scimar.2001.65s285
Diaz R. J., Rosenberg R. (2008). Spreading dead zones and consequences for marine ecosystems. Science 321, 926–929. doi: 10.1126/science.1156401
DiMarco S. F., Howard M. K., Jochens A. E. (2001). Deepwater Gulf of Mexico Historical Physical Oceanography Data Report: Quality Assurance and Quality Control Procedures and Data Inventory (Texas, United Sates: TAMU Department of Oceanography), 196.
DiMarco S. F., Reid R. O. (1998). Characterization of the principal tidal current constituents on the Texas-Louisiana Shelf. J. Geophys. Res. 103 (2), 3093–3110. doi: 10.1029/97JC03289
DiMarco S. F., Wang Z., Jochens A., Stoessel M., Howard M. K., Belabbassi L., et al. (2012). Cabled ocean observatories in the Sea of Oman and Arabian Sea. Eos Trans. AGU 93 (31), 301. doi: 10.1029/2012EO310002
Emery W. J., Thomson R. E. (2001). Data Analysis Methods in Physical Oceanography (second edition revised) (Amsterdam: Elsevier Science).
Esenkov O. E., Donald D. B., Rainer B. (2003). A study of the circulation and salinity budget of the Arabian Sea with an isopycnic coordinate ocean model. Deep-Sea Res. Part II: Topical Stud. Oceanogr. 50 (12–13), 2091–2110. doi: 10.1016/S0967-0645(03)00047-X
Falkowski P. G., Algeo T., Codispoti L., Deutsch C., Emerson S., Hales B., et al. (2011). Ocean deoxygenation: Past, present, and future. Eos Transactions Am. Geophys. Union 92 (46), 409–410. doi: 10.1029/2011EO460001
Garcia H. E., Weathers K. W., Paver C. R., Smolyar I., Boyer T. P., Locarnini R. A., et al. (2019). “World Ocean Atlas 2018, Volume 3: Dissolved Oxygen, Apparent Oxygen Utilization, and Dissolved Oxygen Saturation,” in NOAA Atlas NESDIS, vol. 83. Ed. Mishonov A., (Maryland, United States: NOAA Atlas NESDIS). 38. Available at: https://www.nodc.noaa.gov/OC5/woa18/pubwoa18.html.
Goes J. I., Thoppil P. G., d. R. Gomes H., Fasullo J. T. (2005). Warming of the Eurasian landmass is making the Arabian Sea more productive. Science 308 (5721), 545–547. doi: 10.1126/science.1106610
Gomes H., d. R., Goes J. I., Matondkar S. G. P., Buskey E. J., Basu S., et al. (2014). Massive outbreaks of Noctiluca scintillans blooms in the Arabian Sea due to spread of hypoxia. Nat. Commun. 5, 4862. doi: 10.1038/ncomms5862
Grantham B. A., Chan F., Nielsen K. J., Fox D. S., Barth J. A., Huyer A., et al. (2004). Upwelling-driven nearshore hypoxia signals ecosystem and oceanographic changes in the northeast Pacific. Nature 429 (6993), 749–754. doi: 10.1038/nature02605
Harrison P. J., Piontkovski S., Al-Hashmi K. (2017). Understanding how physical-biological coupling influences harmful algal blooms, low oxygen and fish kills in the Sea of Oman and the Western Arabian Sea. Mar. pollut. Bull. 114 (1), 25–34. doi: 10.1016/j.marpolbul.2016.11.008
Helly J. J., Levin L. A. (2004). Global distribution of naturally occurring marine hypoxia on continental margins. Deep-Sea Res. Part I. 51, 1159–1168. doi: 10.1016/j.dsr.2004.03.009
Herring P., Fasham M., Weeks A., Hemmings J., Roe H., Pugh P., et al. (1998). Across-slope relations between the biological populations, the euphotic zone and the oxygen minimum layer off the coast of Oman during the southwest monsoon (August 1994). Prog. Oceanogr. 41, 69–109. doi: 10.1016/S0079-6611(98)00019-6
Ingle S., Belabbassi L., Vall K., Potter D., DiMarco S. F., Wang Z. (2012). A 4000-meter-rated deepwater cabled ocean observing system: Lessons learned from two years of operation. IEEE Oceans 2012, 1–5. doi: 10.1109/OCEANS.2012.6404959
IOC/UNESCO (2009). The Global Ocean Observing System—A Summary for Policy Makers. Intergovernmental Oceanographic Commission, (Paris, France: UNESCO). 15.
IPCC (2021). Climate Change 2021: The Physical Science Basis. Contribution of Working Group I to the Sixth Assessment Report of the Intergovernmental Panel on Climate Change. Eds. Masson-Delmotte V., Zhai P., Pirani A., Connors S. L., Péan C., Berger S., Caud N., Chen Y., Goldfarb L., Gomis M. I., Huang M., Leitzell K., Lonnoy E., Matthews J. B. R., Maycock T. K., Waterfield T., Yelekçi O., Yu R., Zhou B. (New York: Cambridge University Press).
Johns W. E., Jacobs G. A., Kindle J. C., Murray S. P., Carron M. (2000). Arabian Marginal Seas and Gulfs: Report of a Workshop Held at Stennis Space Center, Mississippi, 11–13 May 1999, Technical Report 2000-01 (Florida, United States: University of Miami RSMAS).
Kamykowski D., Zentara S. J. (1990). Hypoxia in the world ocean as recorded in the historical data set. Deep Sea Res. Part A. Oceanographic Res. Pap. 37 (12), 1861–1874. doi: 10.1016/0198-0149(90)90082-7
Kindle J. C., Arnone R. (2001). “A review of surface circulation of Northern Arabian Sea,” in Proceedings of International Conference on Fisheries, Aquaculture and Environment in the NW Indian Ocean. 113–122 (Muscat, Sultanate of Oman: Sultan Qaboos University).
Lachkar Z., Levy M., Smith K. S. (2019). Strong intensification of the arabian sea oxygen minimum zone in response to Arabian gulf warming. Geophys. Res. Lett. 46, 5420–5429. doi: 10.1029/2018GL081631
Laffoley D., Baxter J. M. (Eds.) (2019). Ocean deoxygenation: Everyone’s problem - Causes, impacts, consequences and solutions (Gland, Switzerland: IUCN), 580.
Lee C. M., Jones B. H., Brink K. H., Fischer A. S. (2000). The upper-ocean response to monsoonal forcing in the Arabian Sea: Seasonal and spatial variability. Deep-Sea Res. Part II 47 (7/8), 1177–1226. doi: 10.1016/S0967-0645(99)00141-1
Levin L. A. (2003). Oxygen minimum zone benthos: Adaptation and community response to hypoxia. Oceanogr. Mar. Biol.: Ann. Rev. 41, 1–45.
Madhupratap M., Prasanna Kumar S., Bhattathiri P. M. A., Dileep Kumar M., Raghukumar S., Nair K. K. C., et al. (1996). Mechanism of the biological response to winter cooling in the northeastern Arabian Sea. Nature 384, 549–552. doi: 10.1038/384549a0
McCreary J. P., Yu Z., Hood R. R., Vinaychandran P. N., Furue R., Ishida A., et al. (2013). Dynamics of the Indian-Ocean oxygen minimum zones. Prog. Oceanogr. 112, 15–37. doi: 10.1016/j.pocean.2013.03.002
McDougall T. J., Barker P. M. (2011). Getting started with TEOS-10 and the Gibbs Seawater (GSW) Oceanographic Toolbox. SCOR/IAPSO WG127, (Sydney, Australia: University of New South Wales). 28.
McIlwain J. L., Harvey E. S., Grove S., Shiell G., Al Oufi H., Al Jardani N. (2011). Seasonal changes in a deep-water fish assemblage in response to monsoon-generated upwelling events. Fisheries Oceanogr. 20 (6), 497–516. doi: 10.1111/j.1365-2419.2011.00598.x
Millero F. J., Feistel R., Wright D. G., McDougall T. J. (2008). The composition of Standard Seawater and the definition of the Reference-Composition Salinity Scale. Deep-Sea Res. I 55, 50–72. doi: 10.1016/j.dsr.2007.10.001
Morrison J. M. (1997). Inter-monsoonal changes in the TS properties of the near-surface waters of the northern Arabian Sea. Geophys. Res. Lett. 24, 2553–2556. doi: 10.1029/97GL01876
Morrison J. M., Codispoti L. A., Gaurin S., Jones B., Manghnani V., Zheng Z. (1998). Seasonal variation of hydrographic and nutrient fields during the US JGOFS Arabian Sea Process Study. Deep-Sea Res. Part II 45, 2053–2101. doi: 10.1016/S0967-0645(98)00063-0
Morrison J. M., Codispoti L. A., Smith S. L., Wishner K., Flagg C., Gardner W. D., et al. (1999). The oxygen minimum zone in the Arabian Sea during 1995. Deep-Sea Res. II 46 (8/9), 1903–1931. doi: 10.1016/S0967-0645(99)00048-X
Morrison J. M., Olson D. B. (1992). “Seasonal basinwide extremes in the T-S characteristics in the near surface waters of the Arabian Sea and Somali Basin,” in Oceanography of the Indian Ocean. Ed. Desai B. N. (New Delhi: Oxford & IBH Publishing Co), 605–616.
Naqvi S. W. A. (2021). Deoxygenation in marginal seas of the Indian Ocean. Front. Mar. Sci. 8. doi: 10.3389/fmars.2021.624322
Naqvi S. W. A., Jayakumar D. A., Narvekar P. V., Naik H., Sarma V. V. S. S., D’souza W, et al. (2000). Increased marine production of N2O due to intensifying anoxia on the Indian continental shelf. Nature 408, 346–349. doi: 10.1038/35042551
Olson D. B., Hitchcock G. L., Fine R. A., Warren B. A. (1993). Maintenance of the low-oxygen layer in the Central Arabian Sea. Deep-Sea Res. II 40 (3), 673–685. doi: 10.1016/0967-0645(93)90051-N
Owens N. J. P., Burkill P. H., Mantoura R. F. C., Woodward E. M. S., Bellan I. E., Aiken J., et al. (1993). Size-fractionated primary production and nitrogen assimilation in the northwestern Indian Ocean. Deep-Sea Res. Part I 40, 697–709. doi: 10.1016/0967-0645(93)90053-P
Piontkovski S. A., Al-Gheilani H. M. H., Jupp B., Sarma Y. V. B., Al-Azri A. R. (2012). The relationship between algal blooms, fish kill incidents, and oxygen depletions along the Omani coast. Int. J. Oceans Oceanogr. 6, 145–177.
Piontkovski S. A., Al-Oufi H. S. (2014). Oxygen minimum zone and fish landings along the Omani shelf. J. Fisheries Aquat. Sci. 9 (5), 294. doi: 10.3923/jfas.2014.294.310
Piontkovski S. A., Al-Oufi H. S. (2015). The Omani shelf hypoxia and the warming Arabian Sea. Int. J. Environ. Stud. 72 (2), 256–264. doi: 10.1080/00207233.2015.1012361
Piontkovski S. A., Queste B. Y. (2016). Decadal changes of the western Arabian Sea ecosystem. Int. Aquat. Res. 8 (1), 49–64. doi: 10.1007/s40071-016-0124-3
Pous S. P., Carton X., Lazure. P. (2004a). Hydrology and circulation in the strait of hormuz and the Oman sea —Results from the GOGP99 experiment: 1. Strait of hormuz. J. Geophys. Res. 109, 12037. doi: 10.1029/2003JC002145
Pous S. P., Carton X., Lazure P. (2004b). Hydrology and circulation in the strait of hormuz and the Oman sea—Results from the GOGP99 experiment: 2. Oman sea. J. Geophys. Res. 109, 12038. doi: 10.1029/2003JC002146
Prasad T. G., Ikeda M., McClean J. L. (2005). Structure and mechanisms of the Arabian Sea variability during the winter monsoon. Deep-Sea Res. Part I-Oceanogr. Res. Pap. 52 (7), 1155–1177. doi: 10.1016/j.dsr.2005.02.006
Queste B. Y., Vic C., Heywood K. J., Piontkovski S. A. (2018). Physical controls on oxygen distribution and denitrification potential in the north west Arabian Sea. Geophys. Res. Lett. 45, 4143–4152. doi: 10.1029/2017GL076666
Quraishee G. S. (1984). Circulation in the north Arabian Sea at Murray Ridge during South West monsoon. Deep Sea Res. Part A. Oceanogr. Res. Pap. 31 (6–8), 651–654. doi: 10.1016/0198-0149(84)90033-5
Rao A. D., Joshi M., Babu S. V. (2005). A three-dimensional numerical model of coastal upwelling along the west coast of India. Math. Comput. Model. 41 (2–3), 177–195. doi: 10.1016/j.mcm.2004.08.004
Reynolds R. M. (1993). Physical oceanography of the gulf, strait of hormuz, and the sea of Oman—Results from the mt mitchell expedition. Mar. pollut. Bull. 27, 35–59. doi: 10.1016/0025-326X(93)90007-7
Richardson T. L., Jackson G. A., Ducklow H. W., Roman M. R. (2006). Spatial and seasonal patterns of carbon cycling through planktonic food webs of the Arabian Sea determined by inverse analysis. Deep Sea Res. Part II: Topical Stud. Oceanogr. 53 (5–7), 555–575. doi: 10.1016/j.dsr2.2006.01.015
Rixen T., Cowie G., Gaye B., Goes J., do Rosário Gomes H., Hood R. R., et al. (2020). Reviews and syntheses: Present, past, and future of the oxygen minimum zone in the northern Indian Ocean. Biogeosciences 17, 6051–6080. doi: 10.5194/bg-17-6051-2020
Sarmiento J. L., Herbert T. D., Toggweiler J. R. (1988). Causes of anoxia in the world ocean. Global Biogeochem. Cycles 2 (2), 115–128. doi: 10.1029/GB002i002p00115
Savidge G., Lennon J., Matthews A. J. (1990). A shore-based survey of upwelling along the coast of Dhofar region, southern Oman. Continental Shelf Res. 10 (3), 259–275. doi: 10.1016/0278-4343(90)90022-E
Schott F. (1983). Monsoon response of the Somali Current and associated upwelling. Prog. Oceanogr. 12 (3), 357–381. doi: 10.1016/0079-6611(83)90014-9
Shi W., Morrison J. M., Bohm E., Manghnani V. (2000). The Oman upwelling zone during 1993, 1994, and 1995. Deep-Sea Res. Part II 47 (7–8), 1227–1247. doi: 10.1016/S0967-0645(99)00142-3
Smith S. L., Banse K., Cochran J. K., Codispoti L. A., Ducklow H. W., Luther M. E., et al. (1991). U.S. JGOFS: Arabian Sea Process Study, U.S. JGOFS Planning Report No. 13 (Woods Hole: Woods Hole Oceanographic Institution).
Smith R. L., Bottero J. S. (1977). “On the upwelling in the Arabian sea,” in A Voyage of Discovery. Ed. Angel M. (Oxford: Pergamon Press), 291–304.
Smith S. L., Madhupratap M. (2005). Mesozooplankton of the Arabian Sea: Patterns influenced by seasons, upwelling, and oxygen concentrations. Prog. Oceanogr. 65, 214–239. doi: 10.1016/j.pocean.2005.03.007
Sobarzo M., Bravo L., Donoso D., Garces-Wargas J., Schneider W. (2007). Coastal Upwelling and seasonal cycles that influence the water column over the continental shelf off central Chile. Prog. Oceanogr. 75, 363–382. doi: 10.1016/j.pocean.2007.08.022
Swift S. A., Bower A. S. (2003). Formation and circulation of dense water in the Persian/Arabian Gulf. J. Geophys. Res. 108 (C1), 3004. doi: 10.1029/2002JC001360
Talley L. D. (2014). Hydrographic Atlas of the World Ocean Circulation Experiment (WOCE): Volume 4: Indian Ocean. Eds. Sparrow M., Chapman P., Gould J. (Southampton, U.K: International WOCE Office).
Thangaraja M., Al-Aisry A., Al-Kharusi L. (2007). Harmful algal blooms and their impacts in the middle and outer ROPME sea area. Int. J. Oceans Oceanogr. 2 (1), 85–98.
Thoppil P. G., Hogan P. J. (2009). On the mechanisms of episodic salinity outflow events in the Strait of Hormuz. J. Phys. Oceangr. 39 (6), 1340–1360. doi: 10.1175/2008JPO3941.1
Thyng K., M. C., Hetland R. D., Zimmerle H. M., DiMarco S. F. (2016). True colors of oceanography guidelines for effective and accurate colormap selection. Oceanography 29 (3), 9–13. doi: 10.5670/oceanog.2016.66
Wang Z., DiMarco S. F., Ingle S., Belabbassi L. (2013b). A cabled oceanographic monitoring network in the northern Arabian Sea: success, challenges and opportunities. Adv. Earth Sci. 28 (5), 529–536. doi: 10.11867/j.issn.1001-8166.2013.05.0529
Wang Z., DiMarco S. F., Ingle S., Belabbassi L., Al-Kharusi L. H. (2014). Seasonal and annual variability of vertically migrating scattering layers in the northern Arabian Sea. Deep Sea Res. Part I: Oceanographic Res. Pap. 90, 152–165. doi: 10.1016/j.dsr.2014.05.008
Wang Z., DiMarco S. F., Jochens A. E., Ingle S. (2013a). High salinity events in the northern Arabian Sea and Sea of Oman. Deep Sea Res. Part I: Oceanographic Res. Pap. 74, 14–24. doi: 10.1016/j.dsr.2012.12.004
Wang Z., DiMarco S. F., Stössel M. M., Zhang X., Howard M. K., du Vall K. (2012). Oscillation responses to tropical Cyclone Gonu in northern Arabian Sea from a moored observing system. Deep Sea Res. Part I: Oceanographic Res. Pap. 64, 129–145. doi: 10.1016/j.dsr.2012.02.005
Weller R. A., Baumgartner M. F., Josey S. A., Fischer A. S., Kindle J. C. (1998). Atmospheric forcing in the Arabian Seas during 1994–1995: Observations and comparisons with climatology and models. Deep-Sea Res. Part II 45 (10/11), 1961–1999. doi: 10.1016/S0967-0645(98)00060-5
Wyrtki K. (1971). Oceanographic Atlas of the International Indian Ocean Expedition (Washington, DC: National Science Foundation). 531pp.
Keywords: hypoxia, dissolved oxygen, monsoonal winds, upwelling and downwelling, Sea of Oman, cabled mooring array
Citation: DiMarco SF, Wang Z, Chapman P, al-Kharusi L, Belabbassi L, al-Shaqsi H, Stoessel M, Ingle S, Jochens AE and Howard MK (2023) Monsoon-driven seasonal hypoxia along the northern coast of Oman. Front. Mar. Sci. 10:1248005. doi: 10.3389/fmars.2023.1248005
Received: 26 June 2023; Accepted: 01 September 2023;
Published: 19 September 2023.
Edited by:
Sabrina Speich, École Normale Supérieure, FranceReviewed by:
Feng Zhou, Ministry of Natural Resources, ChinaSanjeevan V N, Kerala University of Fisheries and Ocean Studies, India
Gil Jacinto, University of the Philippines Diliman, Philippines
Copyright © 2023 DiMarco, Wang, Chapman, al-Kharusi, Belabbassi, al-Shaqsi, Stoessel, Ingle, Jochens and Howard. This is an open-access article distributed under the terms of the Creative Commons Attribution License (CC BY). The use, distribution or reproduction in other forums is permitted, provided the original author(s) and the copyright owner(s) are credited and that the original publication in this journal is cited, in accordance with accepted academic practice. No use, distribution or reproduction is permitted which does not comply with these terms.
*Correspondence: Steven F. DiMarco, c2RpbWFyY29AdGFtdS5lZHU=
†Deceased