 Gyundo Pak
 Kyung-Jae Lee
 Seung-Woo Lee
 Hyunkeun Jin
 Jae-Hyoung Park
- 1Ocean Circulation & Climate Research Department, Korea Institute of Ocean Science and Technology, Busan, Republic of Korea
- 2Coastal Disaster & Safety Research Department, Korea Institute of Ocean Science and Technology, Busan, Republic of Korea
- 3Division of Earth and Environmental System Sciences, Pukyong National University, Busan, Republic of Korea
In this study, we investigate the record-breaking intensification and abrupt weakening of the East Korea Warm Current (EKWC) in the summer of 2021. We analyzed the ocean data assimilation products resolving this event to examine the association between the abrupt changes in the EKWC and various oceanic/atmospheric factors. The results indicate that during the summer of 2021, the EKWC extended northward beyond its climatology, reaching up to 40°N with the maximum speed of 1.16 m s-1 on August 1. In mid-August, the EKWC underwent a rapid weakening, returning to its climatological level. We could attribute the temporal variability in the anomalous EKWC in 2021 to the distinct temporal variability in the dynamic height anomalies between coastal and offshore regions. The offshore variability in the dynamic height anomaly, which is related to warm eddy variability, led to an anomalously increased EKWC velocity (up to 0.59 m s-1) during the EKWC peak velocity period in 2021. However, anomalous coastal downwelling induced by a weak northerly wind anomaly decelerated the EKWC by -0.06 m s-1 in the same period. In mid-August, a typhoon-related northerly wind induced a sudden rise in the coastal dynamic height anomaly, resulting in a rapid weakening of the EKWC. Our findings suggest that changes in geostrophic current related to warm eddies and typhoons have substantially contributed to the temporal variability in the EKWC, improving our understanding of the temporal variability in the western boundary currents.
1 Introduction
With the continuous rise in the concentrations of greenhouse gas, both the frequency and intensity of extreme ocean events are anticipated to globally increase across temporal and spatial scales (Elsner et al., 2008; Hamlington et al., 2014; Hobday et al., 2018). The dynamical responses as extreme ocean events, especially in the vicinity of coastal or oceanic boundary regions, can inflict significant economic and societal damage to human life (Sale et al., 2014). These dynamical responses in boundary regions correspond to variations in the boundary currents that govern the transport of heat and materials and, eventually, influence local weather patterns and marine productivity (Coleman et al., 2011; Kohyama et al., 2021). Consequently, extensive research has been dedicated to investigating boundary currents and their dynamics. Factors that influence the ocean circulation in boundary regions can be categorized into coastal processes and offshore forcing. Coastal processes emerge from local forcing near coastal regions, including wind-driven coastal upwelling, freshwater discharge from rivers, and coastal trapped waves (Brink, 1991; Lentz, 2008; Bograd et al., 2023). In contrast, offshore forcing originates from oceanic processes occurring farther offshore, such as meandering offshore boundary currents (Palma et al., 2008; Park and Nam, 2018), large-scale sea level fluctuations, and the propagation of linear or non-linear Rossby waves (i.e., mesoscale eddies; Zhang and Gawarkiewicz, 2015). In this study, we focused on an intensified western boundary current in the East/Japan Sea as an exemplary case study to quantify the influence of coastal and offshore processes on the boundary current.
The East/Japan Sea, a semi-closed marginal sea located in the mid-latitude region of the Northwest Pacific, serves as a natural laboratory because it mirrors characteristic processes occurring in the open ocean. Notable phenomena in this marginal sea include a meridional overturning circulation (Kim et al., 2004; Chang et al., 2016; Han et al., 2020), ventilation of subsurface cold water (Yun et al., 2004; Kim et al., 2009; Park and Lim, 2018), the western boundary current named as East Korea Warm Current (EKWC; Kim et al., 2018), the subpolar front (Park et al., 2004), eddies (Lee and Niiler, 2010a; Lee et al., 2019), and various coastal processes, such as coastal upwelling by monsoonal southerly winds (Park and Nam, 2018; Kim et al., 2023) and coastal trapped waves (Cho et al., 2014; Lee et al., 2022).
The EKWC (Figure 1A) plays a crucial role in modulating the oceanic environment in the East/Japan Sea and its adjacent countries. This current is responsible for the transport of warm water over cold subsurface water, which extends from the coastal region off the east coast of Korea to the southern half of the East/Japan Sea (Kim et al., 2009). As the northward-flowing EKWC encounters the cold currents from the north and forms a subpolar front across the East/Japan Sea, tracing the path of the EKWC is essential for understanding the oceanic environment. The EKWC path can be classified into three patterns (Lee and Niiler, 2010b), among which the inertial boundary current (IBC) pattern, a strong current penetrating to the northwestern part of the East/Japan Sea along the coast, poses the most significant impact on coastal regions in terms of both intensity and meridional extent. Furthermore, a long-term northward trend in the separation latitude of the EKWC from the coast of South Korea has been reported (Pak et al., 2019). Concurrently, in the vicinity of the EKWC, a warm eddy, known as the Ulleung Warm Eddy (Chang et al., 2004; Mitchell et al., 2005), is generated intermittently from the meandering of the EKWC by the baroclinic instability and interacts with the EKWC. The Ulleung Warm Eddy, unlikely to westward propagating eddies found in the open ocean, is characterized by a quasi-stationary eddy because the location is confined in a certain area by the bottom topography with a mean life time of 95 days (Lee et al., 2019). The Ulleung Warm Eddy is considered to be responsible for alterations in the path of the EKWC (Jacobs et al., 1999; Lee and Niiler, 2010a) as an offshore forcing.
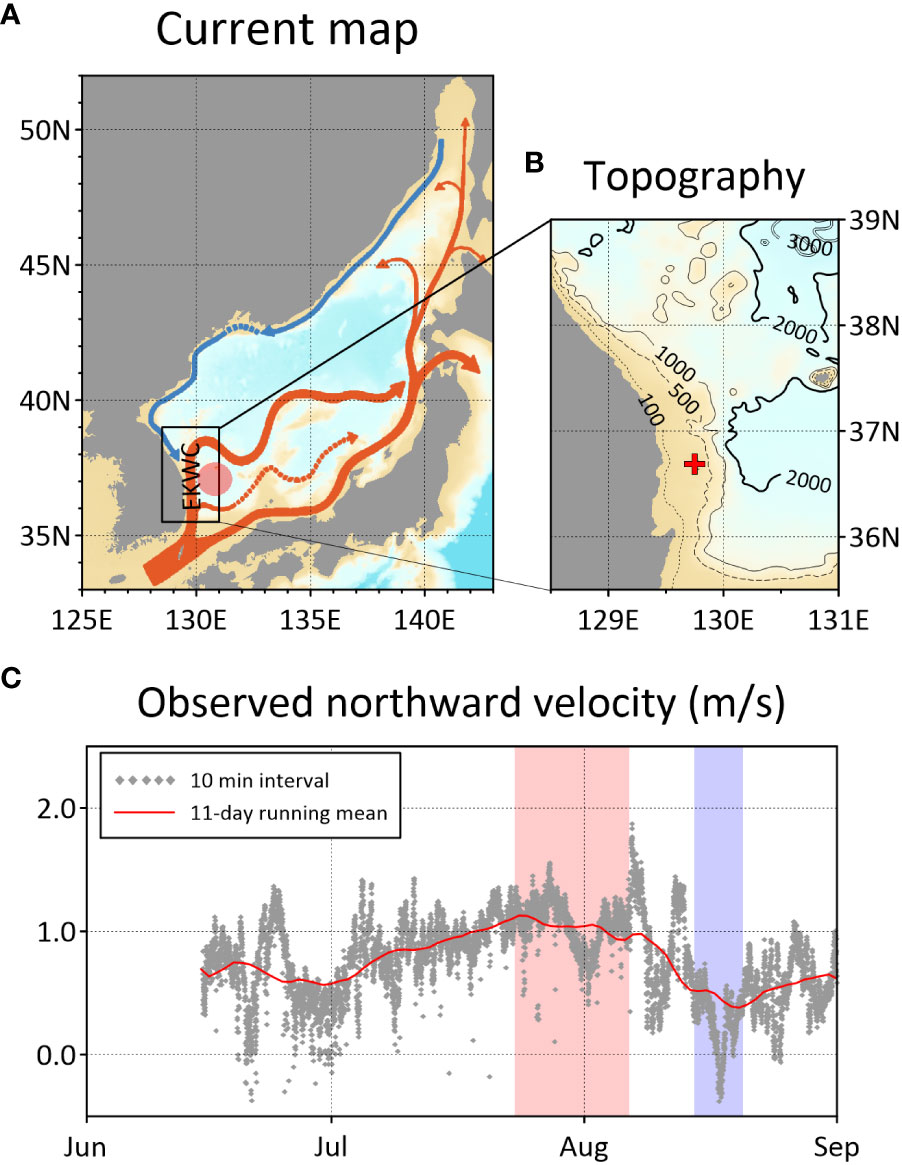
Figure 1 (A) Schematics of the surface currents in the East/Japan Sea according to Park et al. (2013) with the Ulleung Warm Eddy’s typical location highlighted in red shading. (B) Topography of the regions near the EKWC; the location of the long-term mooring observation is marked with a red cross. (C) Observed time series of the northward velocity at 5 m in the period from June to August 2021. The gray points indicate 10-min observation intervals, and the 11-day boxcar smoothed time series is marked with red line. Each x-axis label denotes the first day of the corresponding month.
During the summer of 2021, an exceptional case of an abnormally strong EKWC was observed in conjunction with a month-persisting marine heatwave event in the Northwest Pacific, East/Japan Sea, and part of the Sea of Okhotsk (Kuroda and Setou, 2021; Pak et al., 2022; Li et al., 2023). Recently, a time series of ocean current velocity profiles along the east coast of Korea (Figure 1B) was observed using bottom-mounted moorings at a depth of approximately 20 m with Nortek Acoustic Wave and Current profiler since June 2021 (Lee et al., manuscript in preparation). According to the mooring observation (Figure 1C), the EKWC traveled at an extremely high robust surface current speed with a mean velocity of 0.98 m s−1 and a maximum instantaneous speed of 1.89 m s−1 during the marine heatwave event from July to early August in 2021. This event was highly unusual, considering that the average speed of the EKWC during summer is approximately 0.5 m s−1 (Chang et al., 2004). After that, the EKWC velocity sharply decreased in mid-August. Our forthcoming paired study (Lee et al., manuscript in preparation)1 will report on the intensified EKWC and its related ocean environments based on observations in detail. In the current study, we quantified this unusual intensification and rapid weakening of the EKWC in the summer of 2021 in terms of coastal and offshore forcing factors. Despite the significant expansion of in situ observation datasets in recent years, there remains a lack of 3D ocean observation data to adequately investigate the thermodynamic or dynamic mechanisms underlying boundary current fluctuations. Thus, we used a 3D daily high-resolution (1/12°) ocean data assimilation product that effectively captured the exceptionally strong EKWC event.
We aimed to reveal the dynamics of an extremely intensified western boundary current, i.e., the EKWC. Based on an analysis of coastal processes and offshore forcing, we characterized the possible dynamics prevailing during this event. The data utilized in this study are elucidated using the analysis methodology in Section 2. Thereafter, the intensified EKWC and its related conditions are described in Section 3. In Section 4, the related atmospheric and oceanic processes to the EKWC intensification and its rapid weakening are discussed. Finally, a summary and concluding remarks are entailed in Section 5.
2 Data and method
To examine the physical ocean variables, including ocean temperature, salinity, currents, and sea surface height (SSH), during the summer of 2021, we used the global 3D 1/12° daily ocean analysis (https://doi.org/10.48670/moi-00016) published by the Copernicus Marine Environment Monitoring Service (CMEMS). As a baseline comparison for highlighting the anomaly observed in 2021, we obtained the climatology for 2001–2020 using long-term reanalysis data, commonly referred to as CMEMS GLORYS12V1 (https://doi.org/10.48670/moi-00021). The climatology was obtained from an 11-day boxcar smoothing time series. Note that the 2021 anomaly for every variable considered in this study refers to a deviation from the climatology. As both products employed in this study are data assimilation products with a common grid system, we expected minimal inconsistencies between them.
The warm eddy structure produced in the ocean data assimilation products was validated using bimonthly in situ observation data compiled by the South Korean National Institute of Fisheries Science (NIFS; https://www.nifs.go.kr/kodc/index.kodc). Ocean temperature profiles were obtained along the zonal section of line 104 (red squares in Figure 2) within 250 km of the coast every August from 2001 to 2021. The data for 2021 were collected around August 8.
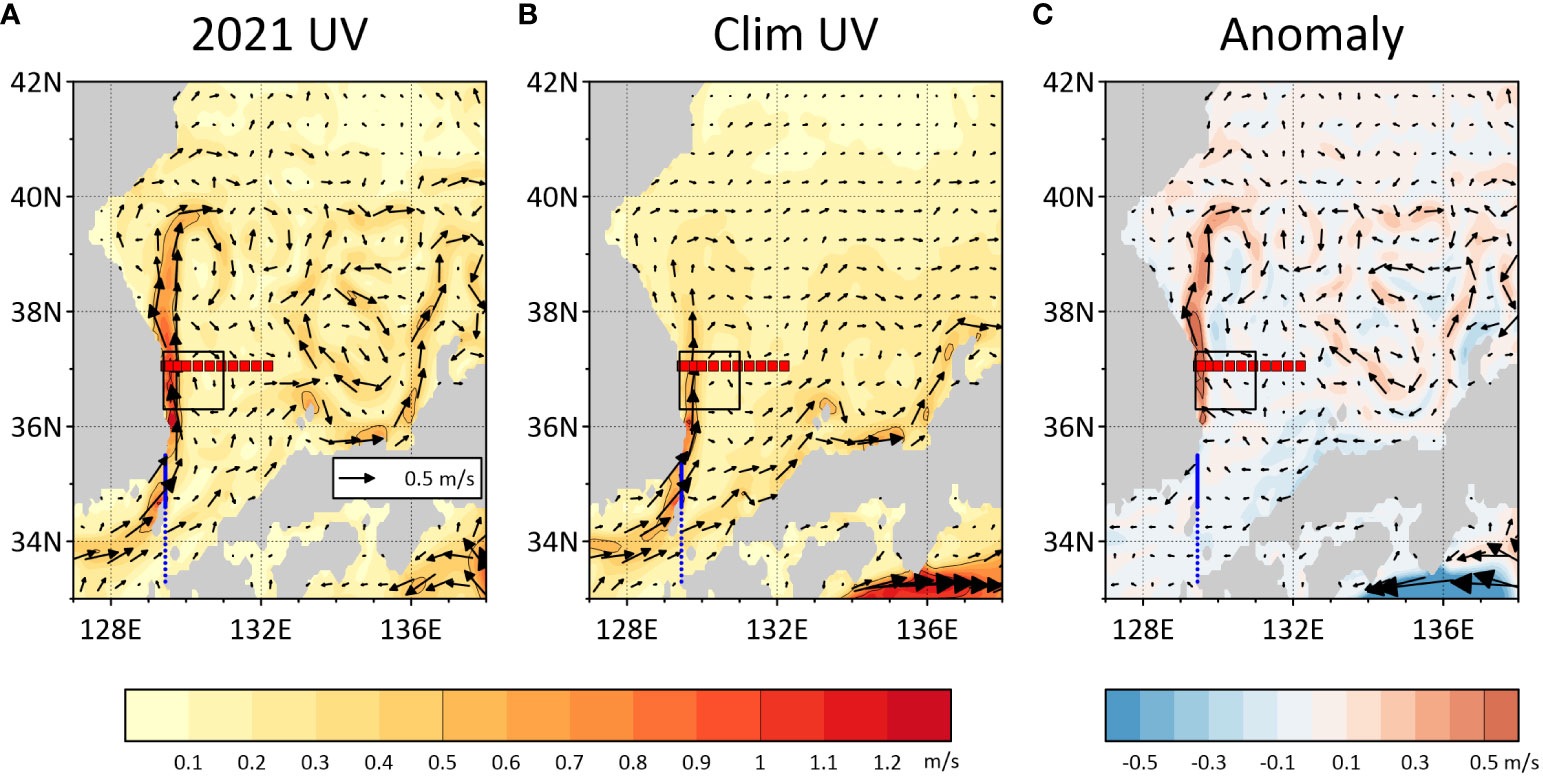
Figure 2 (A, B) Mean sea surface current vectors (arrow) and speed (shading) from July 20 to August 9 in (A) 2021 and (B) climatology (2001–2020). (C) Anomalous sea surface current vectors and speed in 2021 relative to the climatology during the same period. The blue solid and dotted lines indicate the section lines of the western and eastern channels of the Korea Strait for inflow volume transport measurement. The red squares indicate the location of the NIFS in situ observation stations along line 104. The black square indicates the main study area.
The northward stress exerted on the sea surface was estimated using the hourly meridional 10-m wind speed from the ERA5 reanalysis (Hersbach et al., 2020) provided by the European Centre for Medium-Range Weather Forecast. The constant drag coefficient (0.0013) and air density (1.2 kg m−3) were assumed to estimate the wind stress. To align with the time intervals of the ocean variables, the hourly wind stress was averaged over daily intervals. To track the typhoon activity in the study region, we used the daily geopotential height at 1,000 hPa from ERA5, together with the best tracks of typhoons from the Joint Typhoon Warning Center (https://www.metoc.navy.mil/jtwc/jtwc.html).
The EKWC velocity was defined as the mean northward velocity at 36.3°N to 37.3°N and 129.6°E, where the maximum meridional velocity occurred. For quantification of the extremely intensified EKWC in the summer of 2021, we derived the dynamic height anomaly (h′) as follows:
where g denotes the gravitational acceleration (9.8 m s−2) and pref indicates the reference level (1,000 dbar). The specific volume anomaly (α′) can be defined as
where ρ denotes non-linear function for seawater density, whereas S, T, and P denote the salinity, in situ temperature, and pressure of the seawater, respectively. To separately estimate the quantitative contribution of T and S to h′, the specific volume anomaly for the separated effects of T (αT′) and S (αS′), respectively, was estimated, as follows:
The meridional component of the surface geostrophic current based on h′ (vg) was estimated as follows:
where f denotes the Coriolis parameter at 36.5°N (8.65 × 10⁻⁵ s−1). In the subsequent analysis, the deviation of h′ in 2021 relative to the climatology is referred to as h′ anomaly.
Warm eddies were detected and tracked with the revised SSH-based eddy identification procedure (Chelton et al., 2011; Lee et al., 2019). The centers of the warm eddies were determined as the local maxima of the model SSH. The eddy boundaries were identified as the SSH contour that had the maximum average geostrophic current velocity around the selected eddy centers and was smaller than the local Rhines scale. The detected eddies were tracked considering the maximum moving distance (43 km day-1) due to the effect of the mean current speed (~0.5 m s-1) in the East/Japan Sea (Lee et al., 2019). The amplitude of the identified warm eddies was calculated as the SSH difference between the eddy center and boundary.
3 Intensification of the East Korea Warm Current in the summer of 2021
3.1 Anomalous northward boundary current in the summer of 2021
Between late July and early August 2021, the EKWC extended to approximately 40°N along the meridian near 130°E (Figure 2A). This circulation pattern closely resembled that observed when the separation latitude of the EKWC was located further north (Pak et al., 2019) as well as the IBC pattern described by Lee and Niiler (2010b). In addition, an exceptionally strong EKWC, exceeding a velocity of 1.0 m s-1, was observed along the east coast of South Korea. It is noteworthy that the highest summer velocity of the EKWC in the period from 2001 to 2021 was recorded in 2021 (Figure 3A). In contrast, the climatological velocity of the EKWC was approximately 0.5 m s-1 (Figure 2B). The northern extension of the EKWC beyond 38°N was not clearly developed in the climatology. The EKWC exhibited a significant intensification that began in mid-July and in which its velocity exceeded 1.0 m s-1 in the period between July 24 and August 7, with a peak velocity of 1.16 m s-1 on August 1, 2021. Subsequently, the EKWC weakened abruptly, and the velocity fell below the climatological level in the period between August 15 and 20 (Figure 3A). We refer to these periods as the peak period and the deceleration period, respectively. It is noteworthy that the temporal variability of the modeled EKWC velocity in the summer of 2021 was quite similar to that of the mooring observation (Figure 1C).
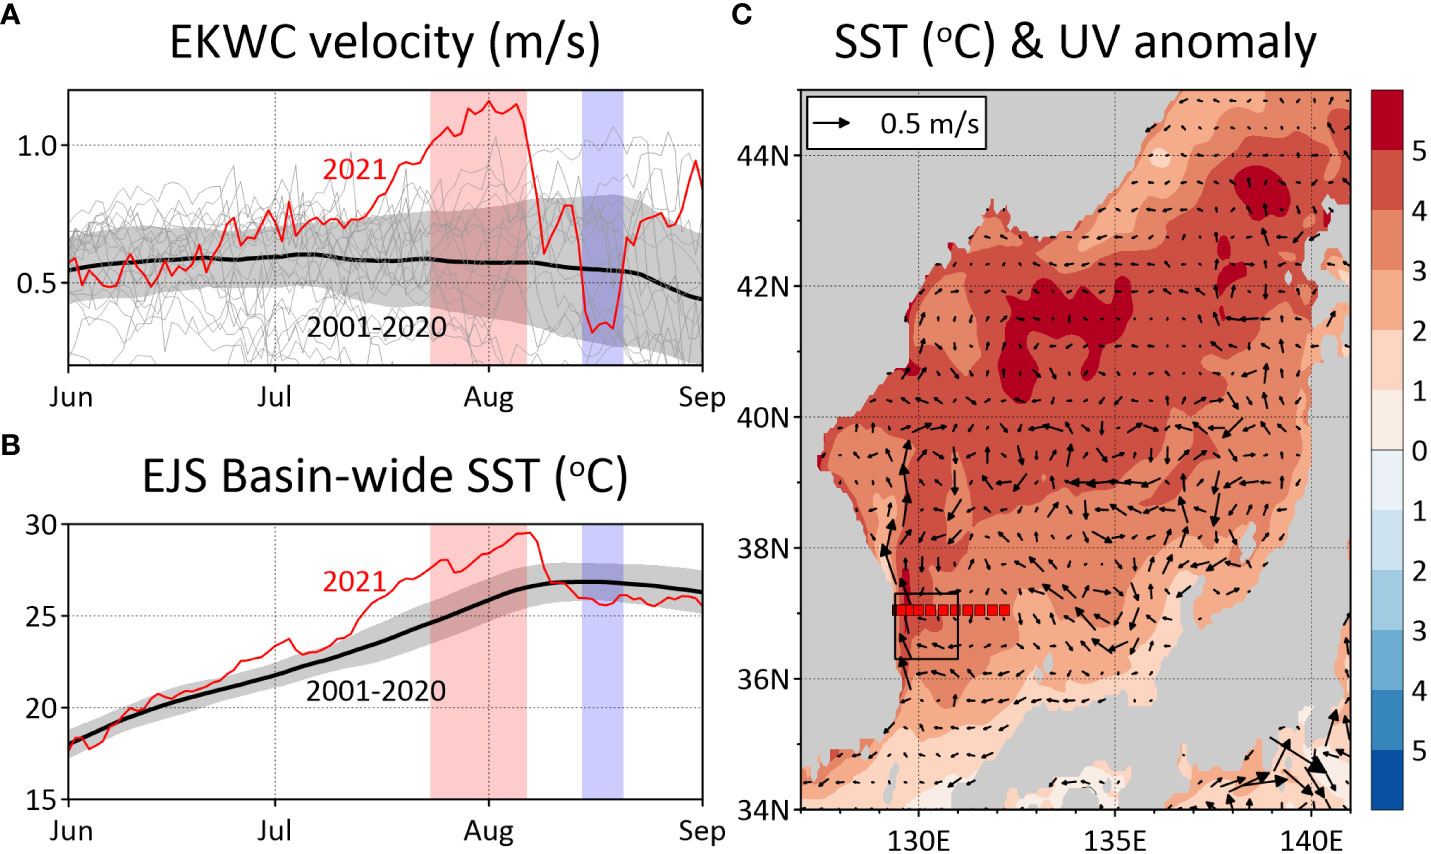
Figure 3 (A, B) Time series of (A) East Korea Warm Current (EKWC) velocity and (B) basin-wide sea surface temperature for 2021 (red) and climatology for 2001–2020 (black) overlain with its typical interannual variability estimated using one standard deviation (gray shading). The gray lines in (A) denote the EKWC velocity in each year from 2001 to 2020. Red and blue shadings indicate the periods in which the EKWC velocity exceeded 1.0 m s−1 and decreased below the climatology, respectively. Each x-axis label denotes the first day of the corresponding month. (C) Mean sea surface temperature anomaly from July 20 to August 9 in 2021 relative to the climatology overlain with the sea surface current anomaly.
The East/Japan Sea experienced a record-breaking marine heatwave event during the summer of 2021 (Kuroda and Setou, 2021; Pak et al., 2022; Li et al., 2023). A basin-wide (128°–140°E, 35°–45°N) sea surface temperature (SST) anomaly over the East/Japan Sea started to develop from early July (Figure 3B). This warm SST anomaly mainly developed in the northern and southwestern parts of the East/Japan Sea (Figure 3C) and persisted for approximately 1 month before dissipating in mid-August. Previous studies have shown that the SST anomaly in the East/Japan Sea during the summer of 2021 exhibits a consistent temporal variability across the entire basin, mainly attributed to the increased solar radiation which resulted from the high-pressure atmospheric circulation (Kuroda and Setou, 2021; Pak et al., 2022). The prevailing influence of atmospheric forcing on the summer SST in 2021 is consistent with previous studies (Park et al., 2004; Park et al., 2007) indicating a limited impact of summer SST advection on the EKWC, primarily due to the relatively weak summer meridional SST gradient over the entire basin of the East/Japan Sea. Interestingly, the temporal variability in this marine heatwave event coincided with that of the EKWC in the summer of 2021. The similar temporal variabilities in anomalous SST and EKWC velocity suggest that an intensified EKWC can relate to variations in the oceanic heat content.
Considering that the EKWC is an inflow branch into the East/Japan Sea, the intensification of the EKWC during the summer of 2021 may have been linked to variations in the volume transport through the Korea Strait (blue lines in Figure 2). Note that although the reason remains unknown, CMEMS data tend to overestimate the inflow volume transport by 15–25% compared to ferryboat observations (Fukudome et al., 2010) and satellite-based estimates (Shin et al., 2022). The time series of the inflow transport through the Korea Strait indicates a significant increase in the volume transport entering the East/Japan Sea through its western channel from June to July 2021 (Figures 4A, B). This anomalous volume transport may have strengthened the EKWC. Nonetheless, the increased volume transport through the Korea Strait is expected to pose a limited impact to the intensification of the EKWC. First, the EKWC intensified by more than double its typical velocity during the peak period from July 24 to August 7 (Figures 4C, D), while the volume transport through the Korea Strait increased by approximately 10–20% compared to the climatology. The time series of the inflow transport and EKWC velocity (Figure 4A) exhibited a negligible correlation with each other, except in mid-August. The temporary reductions of the inflow volume transport and EKWC velocity occurring almost simultaneously in mid-August 2021 will be discussed in Section 4. In addition, the anomalously strong current in the summer of 2021 was limited to the north of 36°N (Figure 2C). We thus conclude that the impacts of an increased volume transport on the EKWC were limited and that other causes were more important to the extremely intensified EKWC in the summer of 2021. Therefore, the variations in geostrophic current, which should be strongly dependent on the variations in ocean heat content, around the EKWC is investigated in detail in the subsequent section.
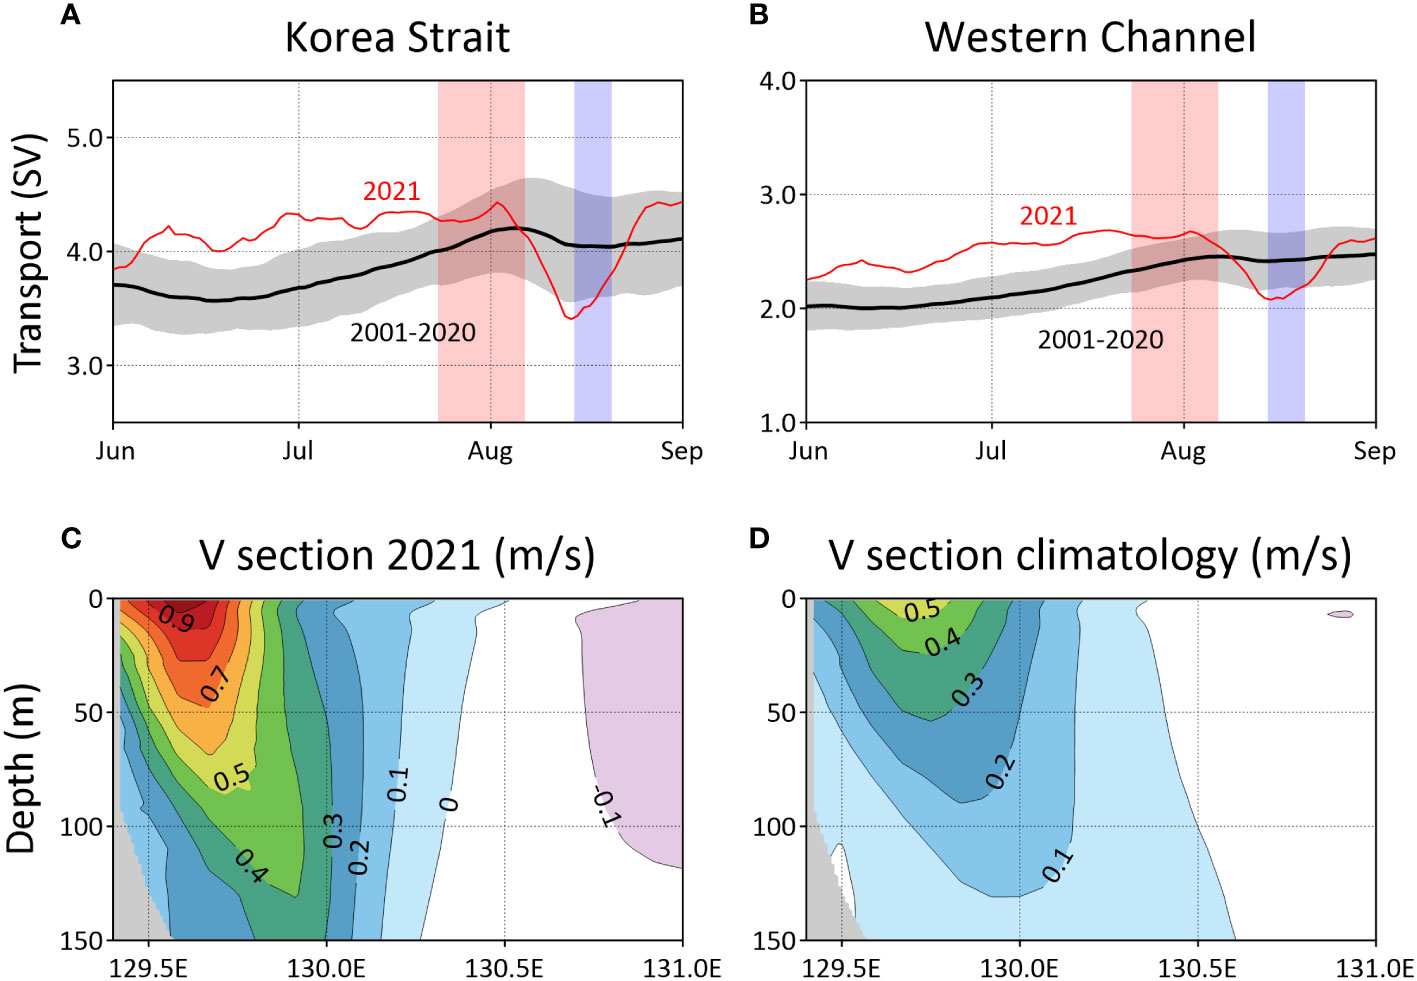
Figure 4 (A, B) Time series of the 11-day boxcar smoothed volume transport of the inflow through (A) the Korea Strait and (B) its western channel for 2021 (red) and climatology for 2001–2020 (black), overlain with its typical interannual variability estimated using one standard deviation (gray shading). Red and blue shadings indicate the periods in which the EKWC velocity exceeded 1.0 m s−1 and decreased below the climatology, respectively. Each x-axis label denotes the first day of the corresponding month. (C, D) Time-mean vertical section of meridional (36.3°–37.3°N) mean northward ocean current velocity from July 24 to August 7 in (C) 2021 and (D) climatology (2001–2020).
3.2 h′ anomaly in the summer of 2021
From June to mid-August 2021, the meridional mean h′ anomaly increased substantially, followed by a slight decrease in mid-August, in the offshore region between 130°E and 131°E (Figure 5A). Conversely, the coastal h′ anomaly around 129.5°E remained relatively constant until early August, after which it temporarily increased in mid-August. The time series of the area-averaged h′ anomaly in the coastal (129.4°E, 36.3°–37.3°N) and offshore (130°–131°E, 36.3°–37.3°N) regions more clearly showed contrasting variabilities (Figure 6A). The latitude bands (36.3°–37.3°N) within these regions coincide with the latitudes of maximum intensity for the EKWC. The distinct temporal variability in coastal and offshore regions contributed to the development of a pronounced zonal gradient in the h′ anomaly near the coast, which consequently generated an anomalously strong northward surface geostrophic current (Figure 5B). The spatiotemporal variability in the geostrophic current anomaly was consistent with that of the surface current anomaly (Figure 5C), suggesting that the intensification of the EKWC was largely attributable to variations in the geostrophic current.
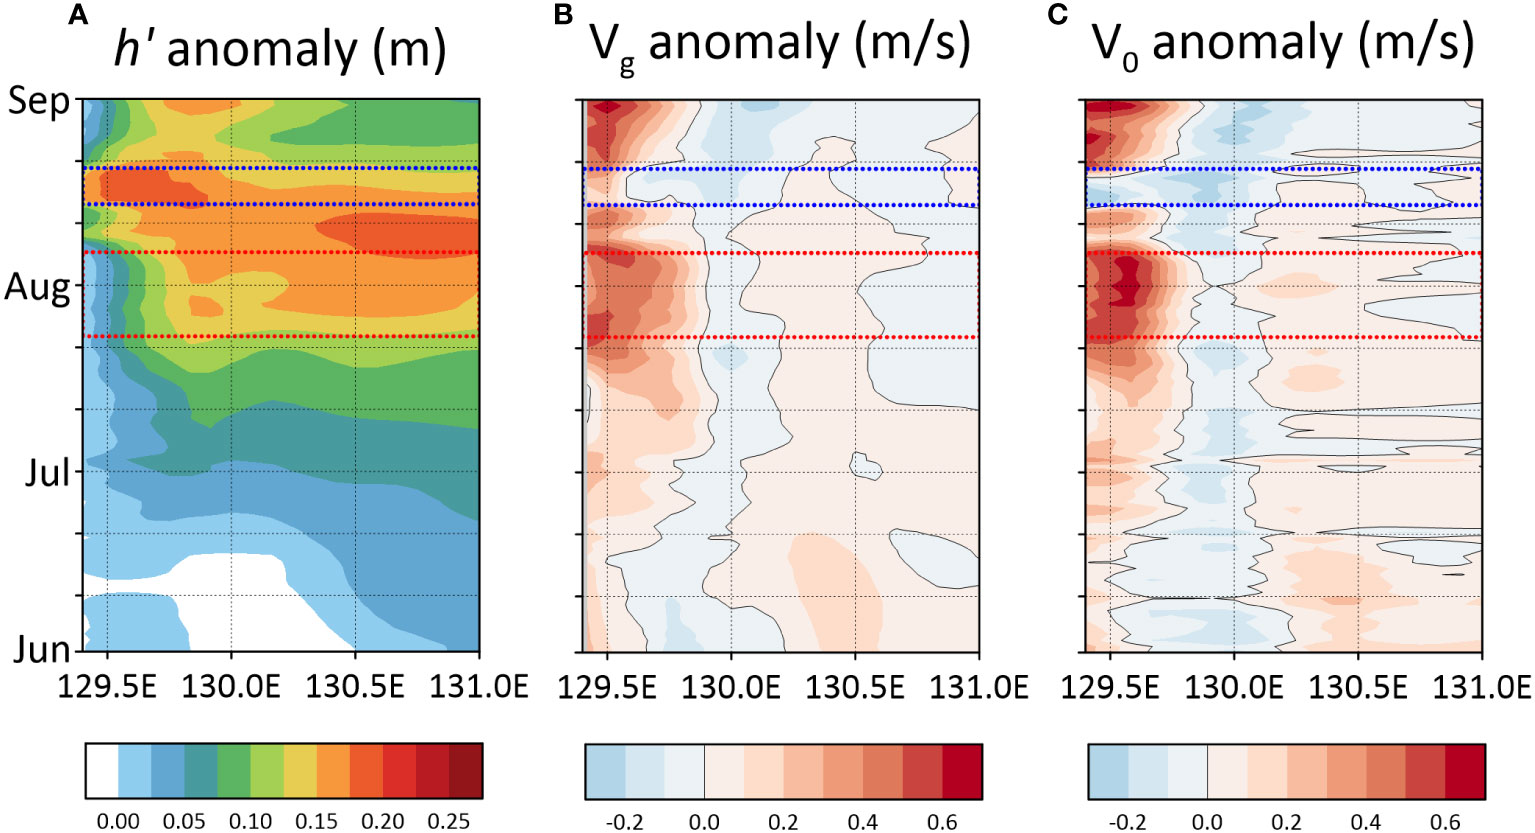
Figure 5 Hovmöller diagrams of the meridional (36.3°–37.3°N) mean: (A) h′ anomaly, (B) northward surface geostrophic current velocity anomaly, and (C) northward surface current velocity anomaly in 2021 relative to the climatology (2001–2020). The dotted red and blue lines indicate the periods in which the EKWC velocity exceeded 1.0 m s−1 and decreased below the climatology, respectively. Each y-axis label denotes the first day of the corresponding month.
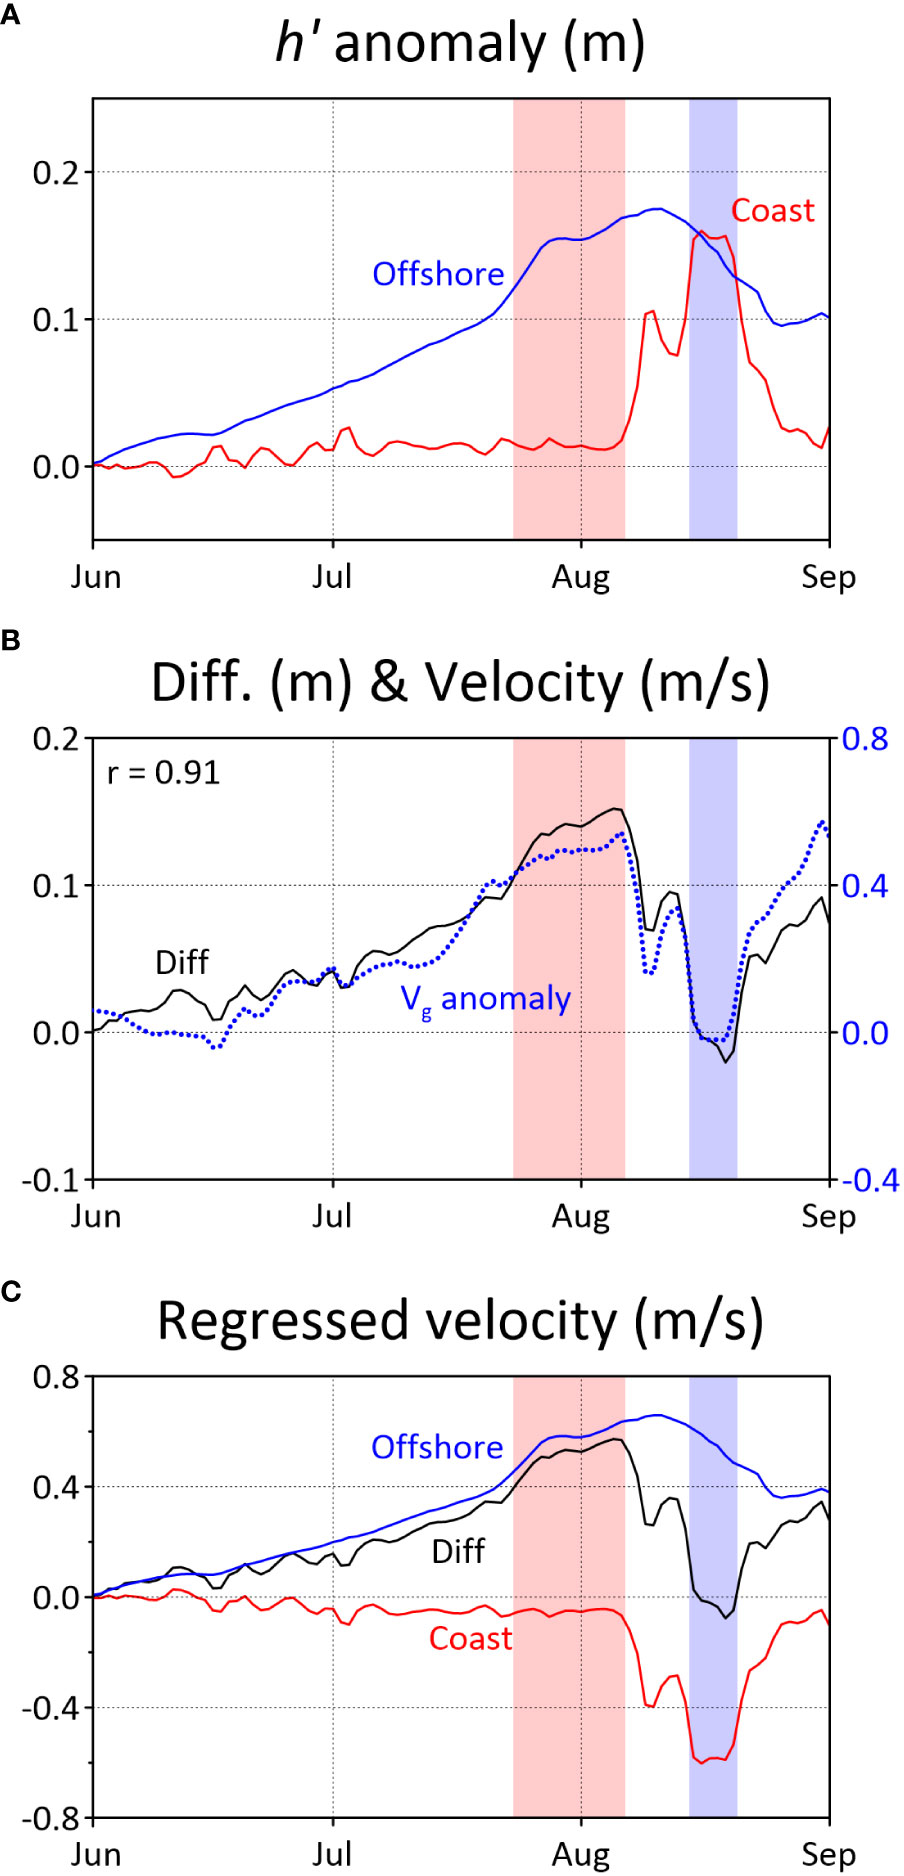
Figure 6 (A) Time series of the h′ anomaly in 2021 in coastal (129.4°E, 36.3°–37.3°N) and offshore (130°–131°E, 36.3°–37.3°N) regions marked with red and blue lines, respectively. (B) Time series of their difference (black) and geostrophic velocity anomaly in 2021 (blue dotted). (C) Time series of the regressed geostrophic velocity anomaly on the difference of offshore and coastal h′ anomalies (black), and geostrophic velocity anomalies due to the offshore (blue) and sign-reversed coastal (red) h′ anomalies estimated by applying the regression coefficient between the geostrophic velocity anomaly and the difference of offshore and coastal h′ anomalies. Red shading indicates the period in which the EKWC velocity exceeded 1.0 m s−1 and decreased below the climatology, respectively. Each x-axis label denotes the first day of the corresponding month.
The difference between the offshore and coastal h′ anomaly was in excellent agreement with the geostrophic current anomaly at 129.6°E and 36.3°–37.3°N, as indicated by a correlation coefficient of 0.91 (Figure 6B). This justifies that our definition of the coastal and offshore regions is suitable for describing the temporal variability of the EKWC in the summer of 2021. The linear regression coefficient (= 3.77 s-1) of the geostrophic current anomaly on the difference time series was derived (Figure 6C). We subsequently applied this regression coefficient to the offshore and coastal h′ anomalies obtaining the geostrophic current velocity anomalies for their respective time series. These time series indicate that the positive anomaly in the EKWC velocity during the summer of 2021 was driven by offshore h′ anomaly, while the coastal h′ anomaly contributed to the deceleration of the EKWC during the same period. During the peak period (July 24 – August 7), the mean geostrophic current anomaly regressed on the difference of the h′ anomaly was +0.53 m s-1. The time-averaged geostrophic current anomaly due to the offshore h′ anomaly was +0.59 m s-1, while that from the coastal h′ anomaly was -0.06 m s-1. During the deceleration period (August 15 – 20), the mean geostrophic current anomaly regressed on the offshore h′ anomaly was +0.54 m s-1, and that from the coastal h′ anomaly was -0.55 m s-1. Both effects almost canceled each other out, resulting in a geostrophic current anomaly of -0.01 m s-1.
The dynamic height was derived from the seawater density profile, which is dependent on both temperature and salinity. We separately estimated the h′ anomalies attributed to temperature and salinity. The analysis revealed that temperature variations significantly influenced the h′ anomaly during the summer of 2021 (Figure 7A), whereas the impact of salinity was insignificant (Figure 7B). The agreement between the h′ anomaly (Figure 5A) and the sum of temperature and salinity effects (Figure 7C) verified the accurate decomposition of these effects. In summary, the anomalous ocean temperature was responsible for the intensification of the EKWC during the summer of 2021.
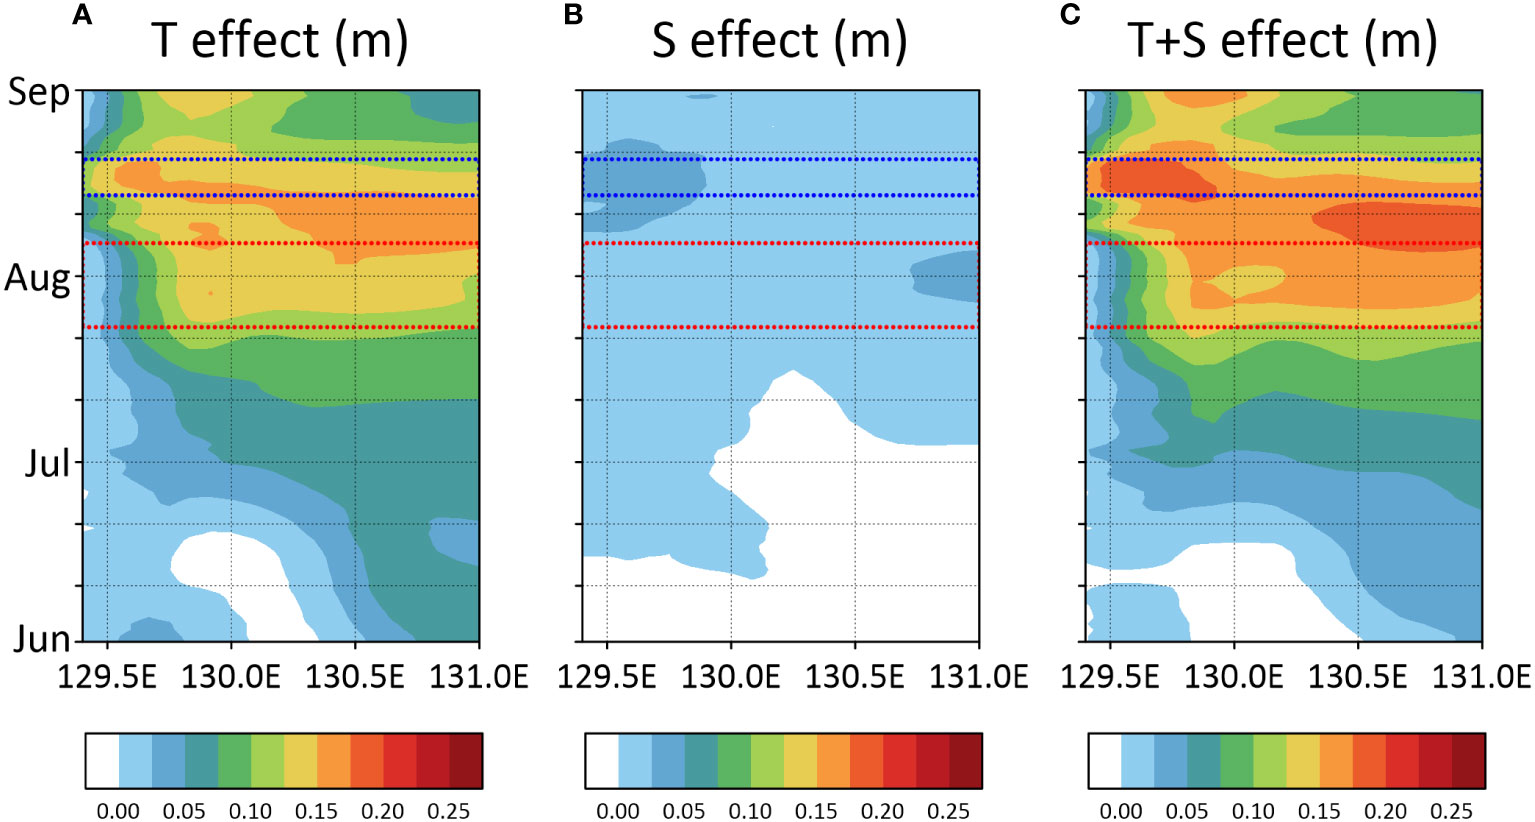
Figure 7 Hovmöller diagrams of the meridional (36.3°–37.3°N) mean h′ anomaly caused by (A) temperature variations under constant salinity (S = 35), (B) salinity variations under constant temperature (T = 0°C), and (C) their sum. The dotted red and blue lines indicate the periods in which the EKWC velocity exceeded 1.0 m s−1 and decreased below the climatology, respectively. Each y-axis label denotes the first day of the corresponding month.
4 Oceanic and atmospheric processes related to the offshore and coastal variabilities
We analyzed the heat content of the top 1,000 m for the offshore region (130–131°E, 36.3°–37.3°N) to reveal the underlying mechanism of the offshore variability in the h′ anomaly in the summer of 2021. The heat content gradually increased until early August 2021, followed by a subsequent decrease (Figure 8A). This heat content variability was much stronger than that indicated by the climatology (Figure 8B). The subsurface layer between 200 and 300 m contributed the most to the variations in the overall heat content (Figure 8A), owing to the most pronounced temperature increase observed within this depth range in July 2021 (Figures 8C, D). The offshore region in this study was close to the typical location of the Ulleung Warm Eddy (Figure 1A) (Chang et al., 2004; Mitchell et al., 2005). The Ulleung Warm Eddy is an intrathermocline eddy featured by a water mass of lens-like feature in the depth of 100–300 m. This water mass is known to be formed in wintertime vertical mixing and, by the characteristics of mesoscale eddy, is being isolated during the lifetime of the eddy. It has also been reported that the EKWC and the volume transport through the Korea Strait mainly affect the upper layer rather than the subsurface layer of the intrathermocline Ulleung Warm Eddy (Gordon et al., 2002; Shin et al., 2005). Given that the depth of Korea Strait is about 150 m, it would be difficult for inflows from outside the East/Japan Sea to directly impact the evolution of the warm temperature anomaly deeper than 200 m in the offshore region. Consequently, the gradual increase in the subsurface (200–300 m) temperature in the summer of 2021 can be reasonably attributed to the inherent natural variability of the Ulleung Warm Eddy. Here we assumed that the offshore variability in the h′ anomaly was related to the variability in this eddy. A long-lived strong warm eddy was successfully detected in the offshore region in May 23 to August 23, 2021 (Figures 8A, 9). The eddy amplitude started to increase from early July and reached its maximum around early August before experiencing a sharp decline and ultimately dissipating in mid-August (Figure 8A). The spatial distribution series of the subsurface temperature anomaly and SSH (Figures 9A–E), temperature (Figures 9F–J), and northward velocity (Figures 9K–O) also indicated that the warm eddy was well developed until early August but declined in mid-August 2021. It is noteworthy that the warm eddy-like feature was observed in the north of the Ulleung Warm Eddy (Figures 9A–E). It seems that the warm subsurface temperature in the offshore region possibly propagates from the warm eddy-like feature in the northern area during the development phase of the Ulleung Warm Eddy (Figures 9A–C), suggesting a potential interaction between these two eddies. However, the detailed process of warm eddy development remains a topic for future research as it is beyond the scope of this study. In situ observations from the NIFS supported the anomalous development of a warm eddy during the summer of 2021 compared to climatological years (Figure 10).
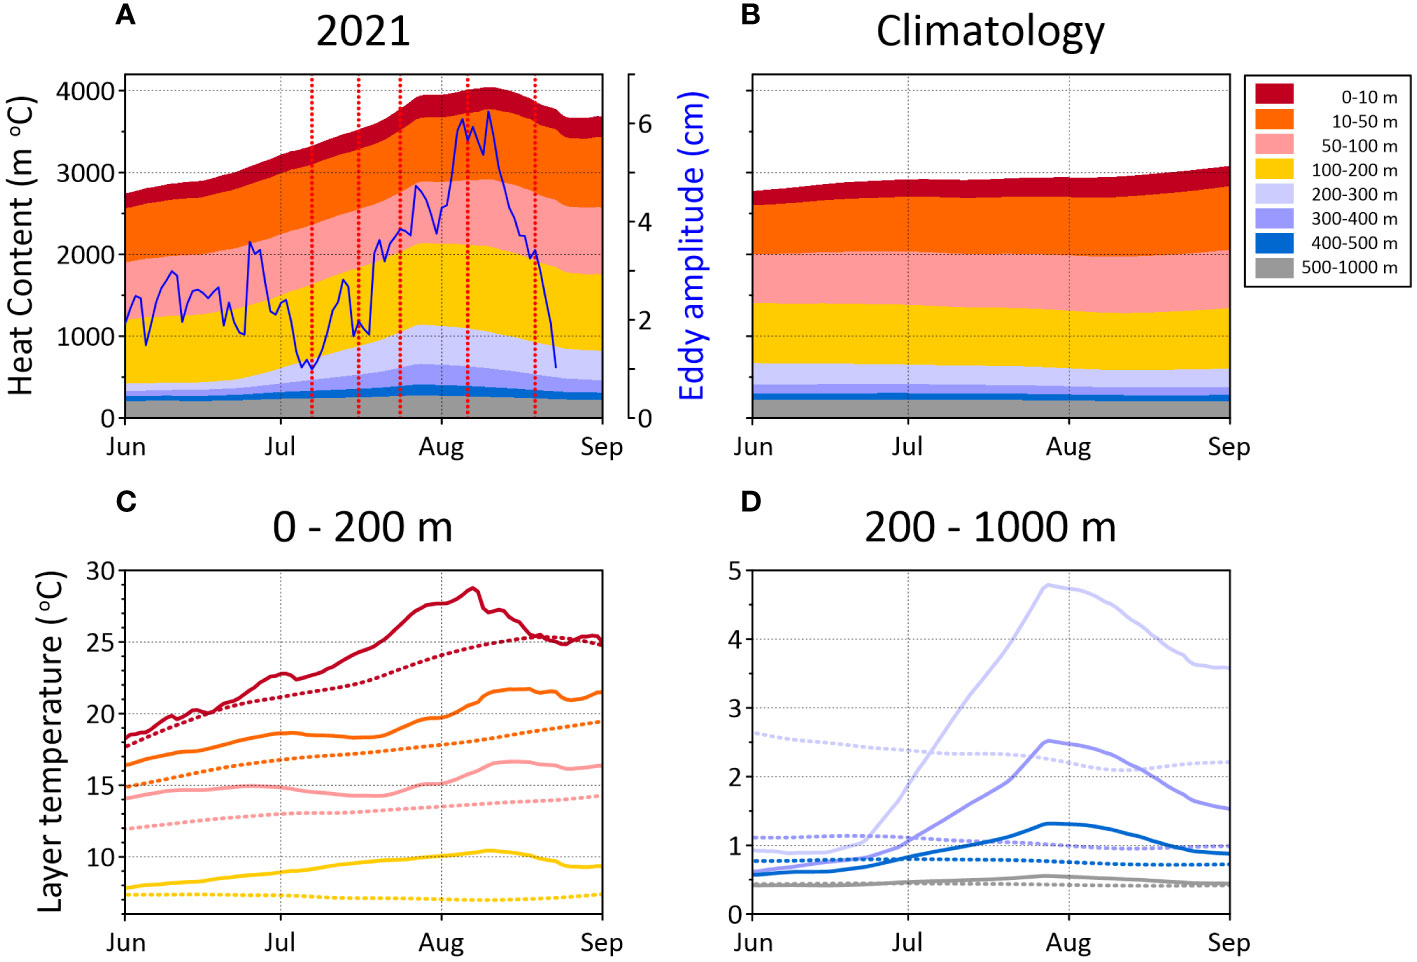
Figure 8 (A, B) Time series of the heat content for each depth range within the offshore region (130°–131°E, 36.3°–37.3°N) in (A) 2021 and (B) the climatology. The blue solid line in (A) indicates the amplitude of the nearby detected warm eddy, while the red dotted lines indicate the dates corresponding to the warm eddy distribution shown in Figure 9. (C, D) Time series of averaged temperature for each depth range within the offshore region in 2021 (solid lines) and climatology (dotted lines) for (C) the upper 200 m and (D) below 200 m. Each x-axis label denotes the first day of the corresponding month.
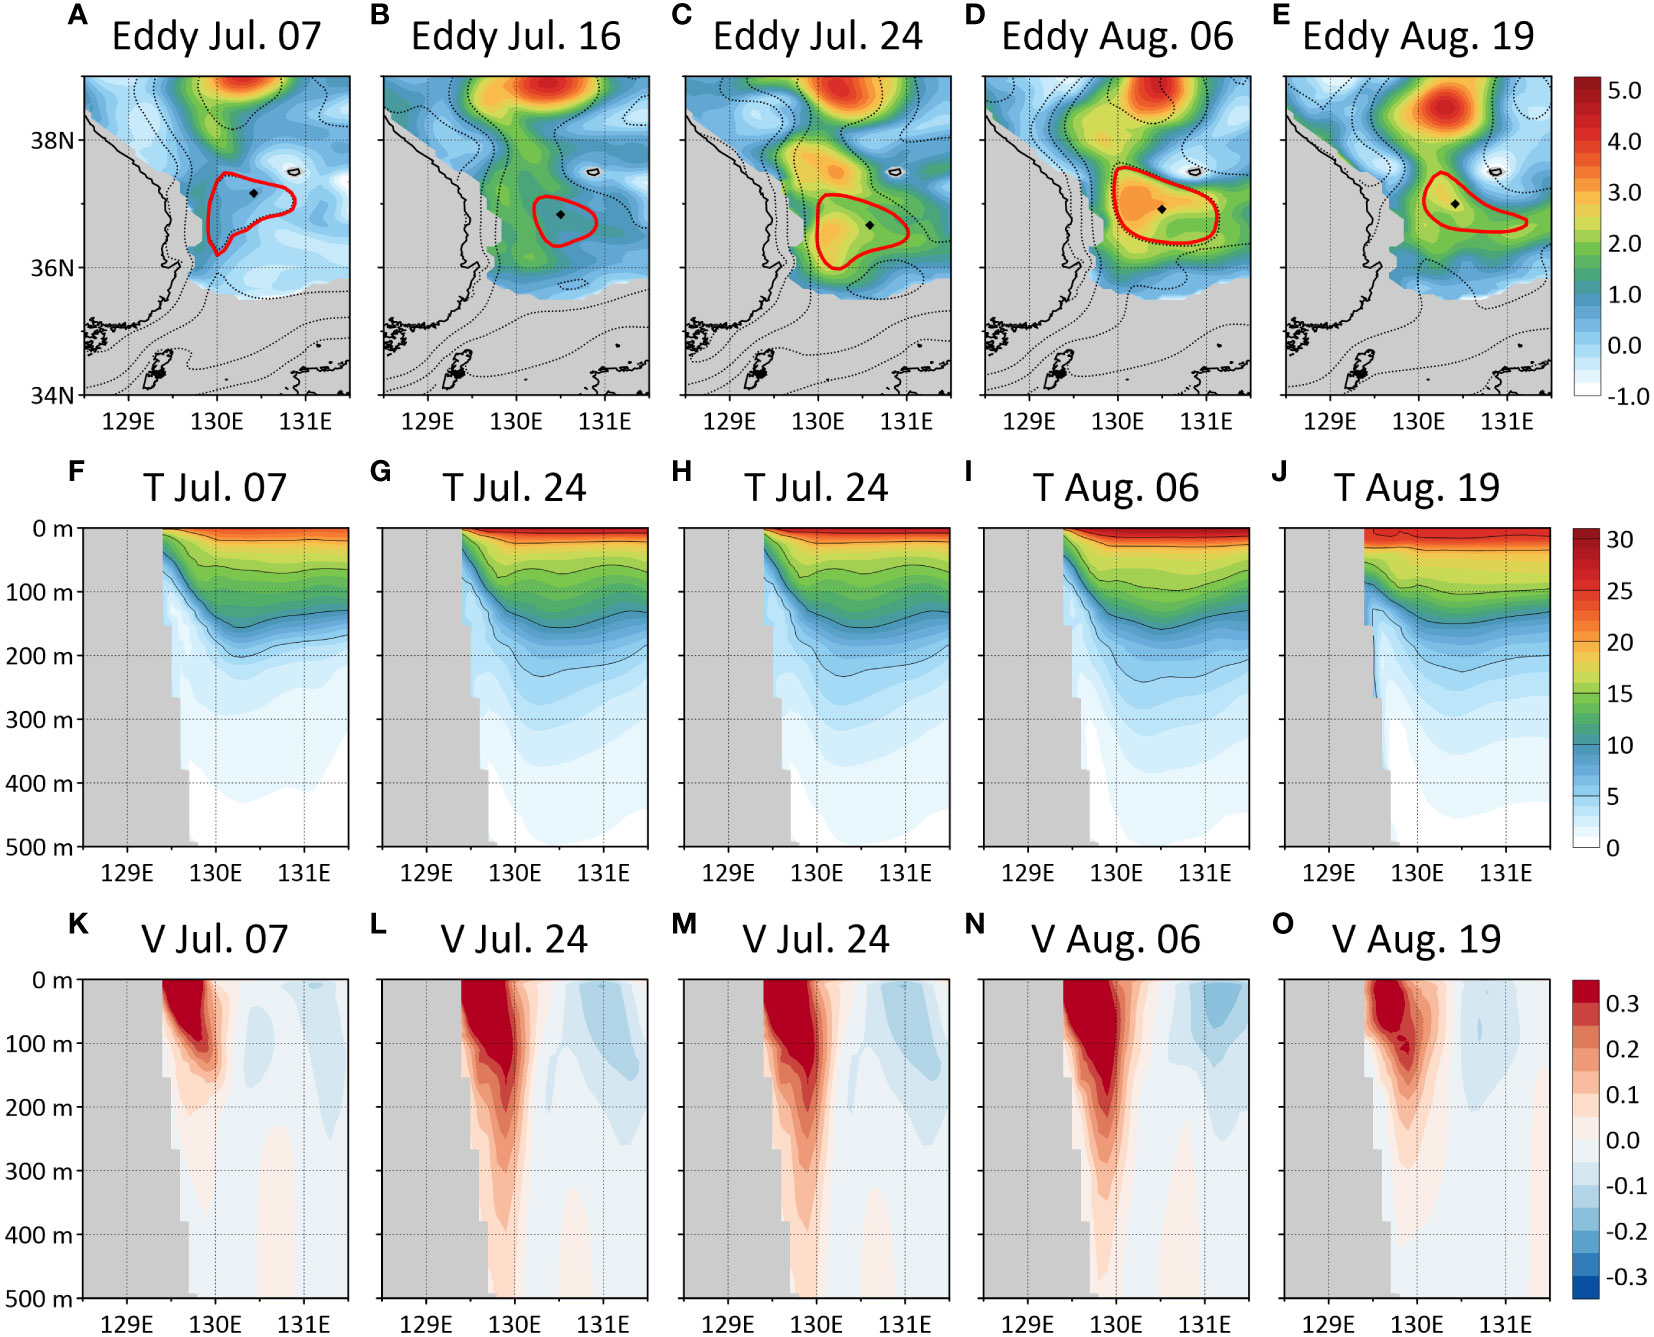
Figure 9 (A–E) Horizontal distribution of the SSH (m, black dotted contours), 200–300 m averaged temperature anomaly (°C, color shadings), and the eddy boundary (red contours) and (F–O) vertical section of the meridional (36.3°–37.3°N) mean (F–J) ocean temperature (°C) and (K–O) northward velocity (m s-1) on (A, F, K) July 7, (B, G, L) July 16, (C, H, M) July 24, (D, I, N) August 6, and (E, J, O) August 19, 2021.
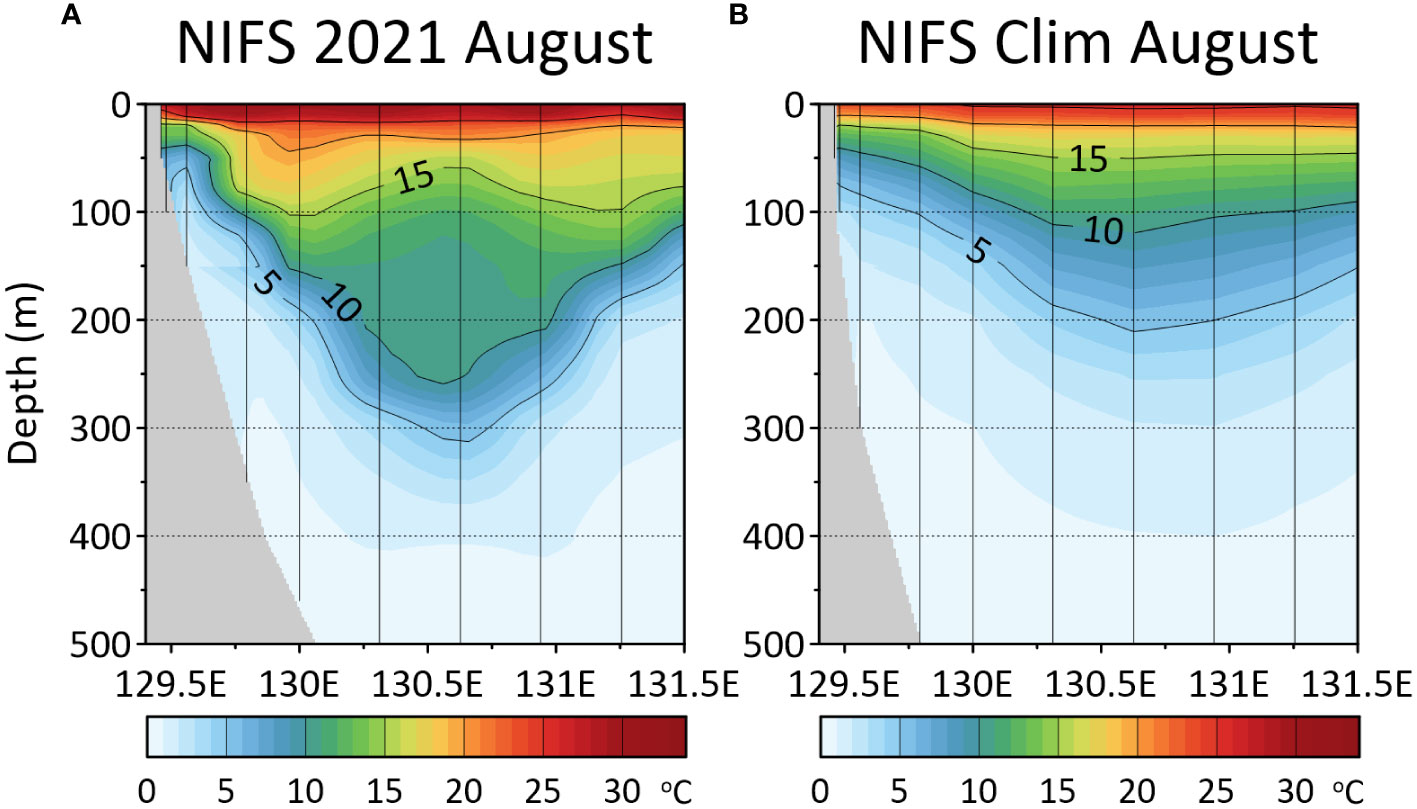
Figure 10 Vertical sections of the in situ ocean temperature from NIFS observations in early August in (A) 2021 and (B) the climatology.
During summer, wind-driven upwelling due to monsoonal southerly winds occurs at the east coast of Korea (Park and Kim, 2010; Jung and Cho, 2020; Kim et al., 2023). We thus expect climatological northward wind stress in that area (Figure 11A). From mid-June to late July 2021, northward wind stress occurred, but with a weaker intensity than indicated by the climatology, resulting in a southward wind stress anomaly (Figure 11B). The averaged southward wind stress anomaly in this period aligned with the almost constant but slowly increasing trend in the coastal h′ anomaly until early August. Subsequently, a very strong southward wind stress anomaly affected the east coast of Korea until mid-August. This was possibly related to the effect of Typhoon Lupit that passed through the East/Japan Sea (Figure 12). The passing of this typhoon resulted in a strong southward wind stress at the east coast of Korea (Figure 12C), which could have caused the sudden rise in the coastal h′ anomaly (Figure 6A). The correlation between the wind stress anomaly and the time derivative of the coastal h′ anomaly was -0.73, suggesting that the alongshore wind stress played a significant role in influencing the coastal h′ anomaly through upwelling and downwelling processes.
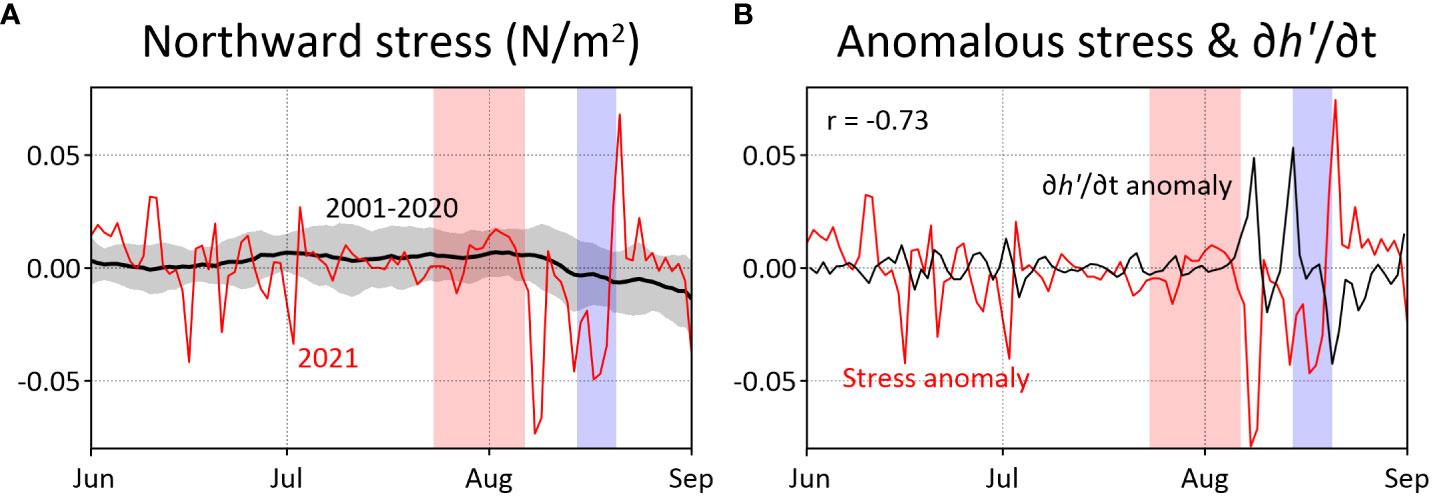
Figure 11 (A) Time series of the northward wind stress in the coastal region (129.4°E, 36.3°–37.3°N) for 2021 (red) and the climatology for 2001–2020 (black) overlain with its typical interannual variability estimated using one standard deviation (gray shading). (B) Time series of the daily change rate in the h′ anomaly (black, m day−1) and northward coastal wind stress anomaly in 2021 (red, N m-2). Red and blue shadings indicate the periods in which the EKWC velocity exceeded 1.0 m s−1 and decreased below the climatology, respectively. Each x-axis label denotes the first day of the corresponding month.
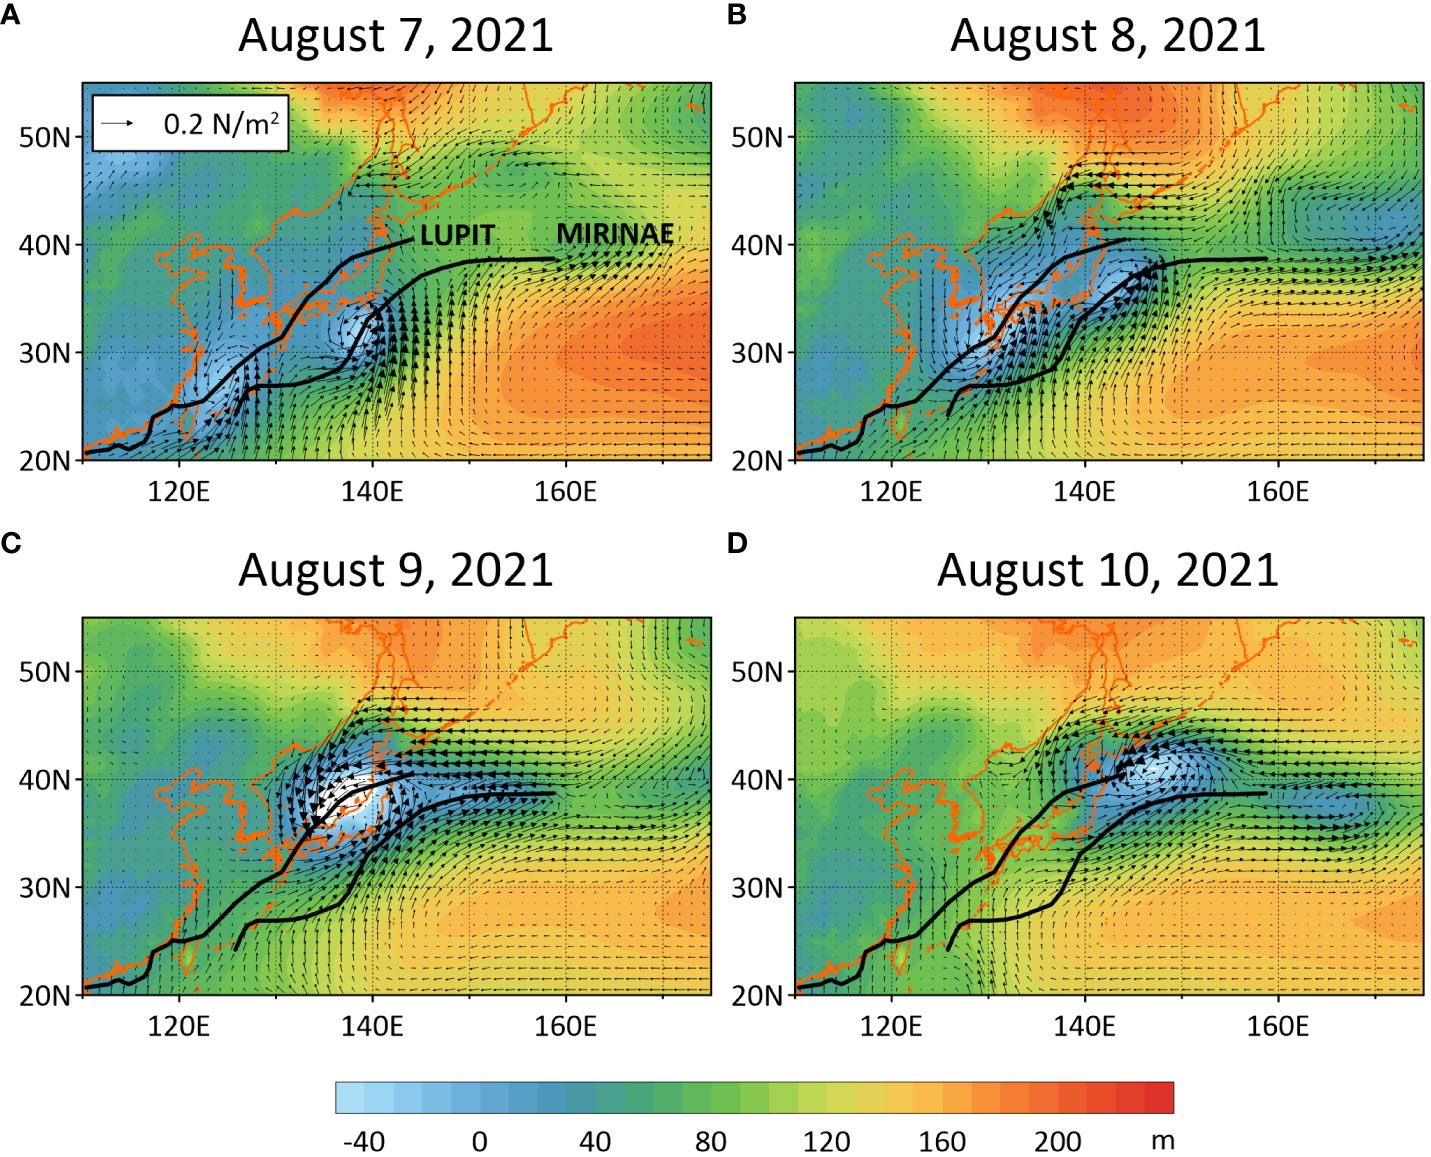
Figure 12 Spatial distribution of daily averaged geopotential height at 1,000 hPa (shading) and surface wind stress (vectors) on (A) August 7, (B) August 8, (C) August 9, and (D) August 10, 2021. The best tracks of Typhoon Lupit and Typhoon Mirinae are indicated with thick solid lines.
As described above, the warm eddy rapidly weakened when Typhoon Lupit passed over it. Indeed cases of weakened mesoscale warm eddies due to typhoons have been reported in other regions (Liu et al., 2017; Ma et al., 2021; Zhang et al., 2023). The offshore heat content slightly decreased as the warm eddy decayed (Figure 8A). However, the heat content was still high at the end of August and remained at the mid-to-late July level. The offshore h′ anomaly also remained high at the same period. After Typhoon Lupit completely passed through the East/Japan Sea, the coastal h′ anomaly nearly decreased to the climatological level; thus, the zonal gradient in the h′ anomaly increased, which probably resulted in the concurrent rebound of the anomalous EKWC velocity (Figure 3A). A substantial decrease in the inflow through the Korea Strait in mid-August (Figures 4A, B) can also be attributed to the typhoon event. According to a model experiment, strong southwestward wind can weaken the volume transport through the Korea Strait via adjusting the geostrophic balance (Moon et al., 2009). Typhoon Lupit induced a huge southwestward wind stress on August 8, 2021 (Figure 12B), which perhaps contributed to the temporary reduction in the inflow volume transport in mid-August (Figures 4A, B).
5 Summary and concluding remarks
In this study, we adopted ocean data assimilation products to analyze the anomalously strong velocity of the EKWC (western boundary current in the East/Japan Sea) that formed an IBC-like pattern in the summer of 2021 (Figure 2). This study first reports the record-breaking summer EKWC velocity in 2021. The EKWC gradually intensified in July 2021, reached its peak in early August, with a maximum velocity of 1.16 m s-1, and rapidly weakened back to the climatological level in mid-August. This temporal variability in the EKWC coincided to the extensive marine heatwave event in the East/Japan Sea in the summer of 2021 (Figure 3). We attributed the temporal variability in the EKWC to variations in the local geostrophic balance (Figure 5) rather than to variations in inflow transport through the Korea Strait (Figure 4). Regression of the geostrophic current anomaly (Figure 6C) on the difference between the offshore and coastal h′ anomalies suggests that the offshore h′ anomaly mainly induced intensification of the EKWC velocity anomaly in its peak period (July 24–August 7) by +0.59 m s-1, while the coastal h′ anomaly contributed to the reduction of the EKWC by -0.06 m s-1. In mid-August 2021, the contribution of the coastal h′ anomaly (-0.55 m s-1) significantly canceled that of the offshore h′ anomaly (+0.54 m s-1). The offshore h′ anomaly was related to the variability in the Ulleung Warm Eddy, which developed gradually until early August and then declined in mid-August 2021 (Figures 8, 9, 10). In contrast, the coastal h′ anomaly could be attributed to coastal upwelling and downwelling induced by alongshore winds (Figure 11). A weak southward wind stress anomaly in mid-June to July contributed to an almost constant but slowly increasing coastal h′ anomaly until early August. Typhoon-related anomalous northerly winds (Figure 12) induced strong coastal downwelling in mid-August 2021.
The effect of the surface temperature increase on the offshore heat content was very limited during the summer of 2021 (Figure 8A). The development of the Ulleung Warm Eddy, located just east of the EKWC, likely played a crucial role instead in the intensification of the EKWC. Further investigation into the development of the Ulleung Warm Eddy will provide a more comprehensive understanding of the mechanisms driving the rapid intensification of the EKWC. Additionally, given the temporal coincidence possibly indicating a potential connection between the marine heatwave event and the intensification of the EKWC in the summer of 2021, further research is necessary to reveal the relationship between the marine heatwaves and the western boundary currents. During the summer of 2021, anomalous northerly winds along the east coast of Korea decelerate the EKWC. The EKWC might have had a higher velocity if the coastal southerly wind was at the climatological level or stronger in mid-June to late July 2021. Furthermore, the extremely intensified EKWC could have persisted for an extended duration in the absence of a typhoon affecting the East/Japan Sea in mid-August 2021. The intensification and weakening of the EKWC in relation to the warm eddy and typhoon, respectively, suggest potential insights into the mechanisms influencing western boundary currents in the open ocean. Such information will enhance our understanding of the long-term projections of western boundary currents under a future climate.
Data availability statement
The original contributions presented in the study are included in the article/supplementary material. Further inquiries can be directed to the corresponding author.
Author contributions
GP, S-WL, and J-HP derived the research ideas. GP and J-HP drafted the manuscript. GP spearheaded and conducted the analysis, with contributions from K-JL and HJ who utilized ocean observations and model data, respectively. K-JL conducted eddy detection based on the modeled SSH. All authors contributed to the article and approved the submitted version.
Funding
The author(s) declare financial support was received for the research, authorship, and/or publication of this article. This research was part of a project titled “Strengthening of Prediction Capabilities for Marine Changes and Future Projections of Ocean Climate around the Korean Peninsula (PEA0112)” funded by the Korea Institute of Ocean Science and Technology. This study was supported by the Korea Institute of Marine Science and Technology (KIMST) funded by the Ministry of Oceans and Fisheries, Korea (20190344, RS-2023-00256330).
Acknowledgments
The authors are grateful to the Coastal Disaster & Safety Research Department at the Korea Institute of Ocean Science and Technology for providing us with information on the intensification of the East Korea Warm Current during the summer of 2021.
Conflict of interest
The authors declare that the research was conducted in the absence of any commercial or financial relationships that could be construed as a potential conflict of interest.
Publisher’s note
All claims expressed in this article are solely those of the authors and do not necessarily represent those of their affiliated organizations, or those of the publisher, the editors and the reviewers. Any product that may be evaluated in this article, or claim that may be made by its manufacturer, is not guaranteed or endorsed by the publisher.
Footnotes
- ^ Lee, S.-W., Pak, G., Park, J.-H., Lee, S.-C., Jeong, J.-Y., and Noh, S.. Observation of Intensification of East Korea Warm Current in Summer of 2021, (Unpublished manuscript).
References
Bograd S. J., Jacox M. G., Hazen E. L., Lovecchio E., Montes I., Pozo Buil M., et al. (2023). Climate change impacts on eastern boundary upwelling systems. Annu. Rev. Mar. Sci. 15, 303–328. doi: 10.1146/annurev-marine-032122-021945
Brink K. H. (1991). Coastal-trapped waves and wind-driven currents over the continental shelf. Annu. Rev. Fluid Mech. 23, 389–412. doi: 10.1146/annurev.fl.23.010191.002133
Chang K.-I., Teague W. J., Lyu S. J., Perkins H. T., Lee D. K., Watts D. R., et al. (2004). Circulation and currents in the southwestern East/Japan sea: overview and review. Prog. Oceanogr. 61, 105–156. doi: 10.1016/j.pocean.2004.06.005
Chang K.-I., Zhang C.-I., Park C., Kang D.-J., Ju S.-J., Lee S.-H., et al. (2016). Oceanography of the East Sea (Japan Sea) (Switzerland: Springer).
Chelton D. B., Schlax M. G., Samelson R. M. (2011). Global observations of nonlinear mesoscale eddies. Prog. Oceanogr. 91, 167–216. doi: 10.1016/j.pocean.2011.01.002
Cho C.-B., Nam S., Chang K.-I. (2014). Subtidal temperature variability in stratified shelf water off the Mid-East coast of Korea. Cont. Shelf Res. 75, 41–53. doi: 10.1016/j.csr.2013.12.011
Coleman M. A., Roughan M., Macdonald H. S., Connell S. D., Gillanders B. M., Kelaher B. P., et al. (2011). Variation in the strength of continental boundary currents determines continent-wide connectivity in Kelp. J. Ecol. 99, 1026–1032. doi: 10.1111/j.1365-2745.2011.01822.x
Elsner J. B., Kossin J. P., Jagger T. H. (2008). The increasing intensity of the strongest tropical cyclones. Nature 455, 92–95. doi: 10.1038/nature07234
Fukudome K.-I., Yoon J.-H., Ostrovskii A., Takikawa T., Han I.-S. (2010). Seasonal volume transport variation in the Tsushima warm current through the Tsushima straits from 10 years of adcp observations. J. Oceanogr. 66, 539–551. doi: 10.1007/s10872-010-0045-5
Gordon A. L., Giulivi C. F., Lee C. M., Furey H. H., Bower A., Talley L. (2002). Japan/East sea intrathermocline eddies. J. Phys. Oceanogr. 32, 1960–1974. doi: 10.1175/1520-0485(2002)032<1960:JESIE>2.0.CO;2
Hamlington B. D., Strassburg M. W., Leben R. R., Han W., Nerem R. S., Kim K.-Y. (2014). Uncovering an anthropogenic sea-level rise signal in the Pacific Ocean. Nat. Clim. Change 4, 782–785. doi: 10.1038/nclimate2307
Han M., Cho Y.-K., Kang H.-W., Nam S. (2020). Decadal changes in meridional overturning circulation in the East sea (Sea of Japan). J. Phys. Oceanogr. 50, 1773–1791. doi: 10.1175/JPO-D-19-0248.1
Hersbach H., Bell B., Berrisford P., Hirahara S., Horányi A., Muñoz-Sabater J., et al. (2020). The era5 global reanalysis. Q. J. R. Meteorol. Soc 146, 1999–2049. doi: 10.1002/qj.3803
Hobday A. J., Oliver E. C., Gupta A. S., Benthuysen J. A., Burrows M. T., Donat M. G., et al. (2018). Categorizing and naming marine heatwaves. Oceanography 31, 162–173. doi: 10.5670/oceanog.2018.205
Jacobs G. A., Hogan P. J., Whitmer K. R. (1999). Effects of Eddy variability on the circulation of the Japan/East sea. J. Oceanogr. 55, 247–256. doi: 10.1023/a:1007898131004
Jung J., Cho Y.-K. (2020). Persistence of coastal upwelling after a plunge in upwelling-favourable wind. Sci. Rep. 10, 11938. doi: 10.1038/s41598-020-67785-x
Kim Y. H., Chang K.-I., Park J. J., Park S. K., Lee S.-H., Kim Y.-G., et al. (2009). Comparison between a reanalyzed product by 3-dimensional variational assimilation technique and observations in the Ulleung basin of the East/Japan sea. J. Mar. Syst. 78, 249–264. doi: 10.1016/j.jmarsys.2009.02.017
Kim Y.-Y., Cho Y.-K., Kim Y. H. (2018). Role of cold water and beta-effect in the formation of the East Korean warm current in the East/Japan sea: A numerical experiment. Ocean Dyn. 68, 1013–1023. doi: 10.1007/s10236-018-1175-3
Kim D., Choi J.-G., Park J., Kwon J.-I., Kim M.-H., Jo Y.-H. (2023). Upwelling processes driven by contributions from wind and current in the Southwest East sea (Japan sea). Front. Mar. Sci. 10. doi: 10.3389/fmars.2023.1165366
Kim K., Kim K.-R., Kim Y.-G., Cho Y.-K., Kang D.-J., Takematsu M., et al. (2004). Water masses and decadal variability in the East sea (Sea of Japan). Prog. Oceanogr. 61, 157–174. doi: 10.1016/j.pocean.2004.06.003
Kohyama T., Yamagami Y., Miura H., Kido S., Tatebe H., Watanabe M. (2021). The gulf stream and Kuroshio current are synchronized. Science 374, 341–346. doi: 10.1126/science.abh3295
Kuroda H., Setou T. (2021). Extensive marine heatwaves at the sea surface in the Northwestern Pacific Ocean in summer 2021. Remote Sens. 13, 3989. doi: 10.3390/rs13193989
Lee K., Nam S., Kim Y.-G. (2019). Statistical characteristics of East sea mesoscale eddies detected, tracked, and grouped using satellite altimeter data from 1993 to 2017. J. Korean Soc Oceanogr. 24, 267–281. doi: 10.7850/jkso.2019.24.2.267
Lee K., Nam S., Park J.-H. (2022). Alongshore Propagation of Subtidal Sea Level Fluctuations around the Korean Peninsula over Varying Stratification and Shelf Topography. Front. Mar. Sci. 8. doi: 10.3389/fmars.2021.802752
Lee D.-K., Niiler P. (2010a). Eddies in the Southwestern east/Japan sea. Deep Sea Res. I 57, 1233–1242. doi: 10.1016/j.dsr.2010.06.002
Lee D.-K., Niiler P. (2010b). Surface circulation in the Southwestern Japan/East sea as observed from drifters and sea surface height. Deep Sea Res. I 57, 1222–1232. doi: 10.1016/j.dsr.2010.06.003
Lentz S. J. (2008). Seasonal variations in the circulation over the Middle Atlantic Bight continental shelf. J. Phys. Oceanogr. 38, 1486–1500. doi: 10.1175/2007JPO3767.1
Li D., Chen Y., Qi J., Zhu Y., Lu C., Yin B. (2023). Attribution of the July 2021 record-breaking Northwest Pacific marine heatwave to global warming, atmospheric circulation, and enso. Bull. Am. Meteorol. Soc 104, E291–E297. doi: 10.1175/BAMS-D-22-0142.1
Liu S. S., Sun L., Wu Q., Yang Y. J. (2017). The responses of cyclonic and anticyclonic eddies to typhoon forcing: the vertical temperature-salinity structure changes associated with the horizontal convergence/divergence. J. Geophys. Res. Oceans 122, 4974–4989. doi: 10.1002/2017JC012814
Ma Z., Zhang Z., Fei J., Wang H. (2021). Imprints of tropical cyclones on structural characteristics of mesoscale oceanic eddies over the Western North Pacific. Geophys. Res. Lett. 48, e2021GL092601. doi: 10.1029/2021GL092601
Mitchell D. A., Watts D. R., Wimbush M., Teague W. J., Tracey K. L., Book J. W., et al. (2005). Upper circulation patterns in the Ulleung Basin. Deep Sea Res. II 52, 1617–1638. doi: 10.1016/j.dsr2.2003.09.005
Moon J.-H., Hirose N., Yoon J.-H., Pang I.-C. (2009). Effect of the along-strait wind on the volume transport through the Tsushima/Korea strait in September. J. Oceanogr. 65, 17–29. doi: 10.1007/s10872-009-0002-3
Pak G., Kim Y. H., Park Y.-G. (2019). Lagrangian approach for a new separation index of the East Korea warm current. Ocean Sci. J. 54, 29–38. doi: 10.1007/s12601-018-0059-2
Pak G., Noh J., Park Y.-G., Jin H., Park J.-H. (2022). Governing factors of the record-breaking marine heatwave over the mid-latitude Western North Pacific in the summer of 2021. Front. Mar. Sci. 9. doi: 10.3389/fmars.2022.946767
Palma E. D., Matano R. P., Piola A. R. (2008). A numerical study of the Southwestern Atlantic shelf circulation: stratified ocean response to local and offshore forcing. J. Geophys. Res. Oceans 113, C11010. doi: 10.1029/2007JC004720
Park K. A., Chung J. Y., Kim K. (2004). Sea surface temperature fronts in the East (Japan) sea and temporal variations. Geophys. Res. Lett. 31, L07304. doi: 10.1029/2004GL019424
Park K.-A., Kim K.-R. (2010). Unprecedented coastal upwelling in the East/Japan sea and linkage to long-term large-scale variations. Geophys. Res. Lett. 37, L09603. doi: 10.1029/2009GL042231
Park J., Lim B. (2018). A new perspective on origin of the East sea intermediate water: observations of Argo floats. Prog. Oceanogr. 160, 213–224. doi: 10.1016/j.pocean.2017.10.015
Park J. H., Nam S. (2018). Causes of interannual variation of summer mean alongshore current near the East coast of Korea derived from 16-year-long observational data. J. Geophys. Res. Oceans 123, 7781–7794. doi: 10.1029/2018JC014053
Park K.-A., Park J.-E., Choi B.-J., Byun D.-S., Lee E.-I. (2013). An oceanic current map of the East sea for science textbooks based on scientific knowledge acquired from oceanic measurements. J. Korean Soc Oceanogr. 18 (4), 234–265. doi: 10.7850/JKSO.2013.18.4.234
Park K.-A., Ullman D. S., Kim K., Chung J. Y., Kim K.-R. (2007). Spatial and temporal variability of satellite-observed subpolar front in the East/Japan sea. Deep Sea Res. I 54, 453–470. doi: 10.1016/j.dsr.2006.12.010
Sale P. F., Agardy T., Ainsworth C. H., Feist B. E., Bell J. D., Christie P., et al. (2014). Transforming management of tropical coastal seas to cope with challenges of the 21st century. Mar. pollut. Bull. 85, 8–23. doi: 10.1016/j.marpolbul.2014.06.005
Shin H.-R., Lee J.-H., Kim C.-H., Yoon J.-H., Hirose N., Takikawa T., et al. (2022). Long-term variation in volume transport of the Tsushima warm current estimated from adcp current measurement and sea level differences in the Korea/Tsushima strait. J. Mar. Syst. 232, 103750. doi: 10.1016/j.jmarsys.2022.103750
Shin H.-R., Shin C.-W., Kim C., Byun S.-K., Hwang S.-C. (2005). Movement and structural variation of warm eddy we92 for three years in the Western east/Japan sea. Deep Sea Res. II 52, 1742–1762. doi: 10.1016/j.dsr2.2004.10.004
Yun J.-Y., Magaard L., Kim K., Shin C.-W., Kim C., Byun S.-K. (2004). Spatial and temporal variability of the North Korean cold water leading to the near-bottom cold water intrusion in Korea strait. Prog. Oceanogr. 60, 99–131. doi: 10.1016/j.pocean.2003.11.004
Zhang W. G., Gawarkiewicz G. G. (2015). Dynamics of the direct intrusion of gulf stream ring water onto the Mid-Atlantic Bight shelf. Geophys. Res. Lett. 42, 7687–7695. doi: 10.1002/2015GL065530
Keywords: East Korea Warm Current, Western boundary current, Geostrophic balance, warm eddy, Coastal upwelling
Citation: Pak G, Lee K-J, Lee S-W, Jin H and Park J-H (2023) Quantification of the extremely intensified East Korea Warm Current in the summer of 2021: offshore and coastal variabilities. Front. Mar. Sci. 10:1252302. doi: 10.3389/fmars.2023.1252302
Received: 03 July 2023; Accepted: 06 November 2023;
Published: 23 November 2023.
Edited by:
Toru Miyama, Japan Agency for Marine-Earth Science and Technology, JapanReviewed by:
Hajoon Song, Yonsei University, Republic of KoreaHitoshi Kaneko, Japan Agency for Marine-Earth Science and Technology, Japan
Bunmei Taguchi, University of Toyama, Japan
Copyright © 2023 Pak, Lee, Lee, Jin and Park. This is an open-access article distributed under the terms of the Creative Commons Attribution License (CC BY). The use, distribution or reproduction in other forums is permitted, provided the original author(s) and the copyright owner(s) are credited and that the original publication in this journal is cited, in accordance with accepted academic practice. No use, distribution or reproduction is permitted which does not comply with these terms.
*Correspondence: Jae-Hyoung Park, b2NlYW5qaHBhcmtAcGtudS5hYy5rcg==