 Subrat Naik*
 Umakanta Pradhan
 P. Karthikeyan
 Debasmita BandyopadhyayRabindra Kumar SahooUma Sankar PandaPravakar MishraM. V. Ramana Murthy
- National Centre for Coastal Research (NCCR), Ministry of Earth Sciences, Chennai, India
Dynamic coastal waters are often polluted by chemical pollutants, affecting coastal ecosystems. A total of four scientific coastal cruises up to 10 km offshore from the coastline along the Chennai-Puducherry coast during 2019-20 were conducted. This study examined the spatiotemporal distribution of heavy metals (Cr, Cu, Pb, Cd, Ni, Zn, As, Co, Mn) in the coastal sediments using various geochemical indices, including the Geo-accumulation Index (Igeo), Enrichment Factor (EF), Contamination Factor (CF), and Ecological Risk Index (ERI), to understand the impacts, environmental risks, and pollution status in coastal and marine systems. The heavy metal concentrations of Cr, Cu, Pb, Cd, Ni, Zn, As, Co, and Mn in sediments are 16.48-74.70 μg/g, 2.01-3.78 μg/g, 1.37-17.54 μg/g, 0.20-21.76 μg/g, and 5.73-40.53 μg/g, 4.73-53.54 μg/g, 2.09-28.18 μg/g, 1.80-9.02 μg/g, 70.27-346.22 μg/g, respectively. The Igeo results revealed that none of the metals reached up to the contamination level except for Cd and As which showed a slightly contaminated level of the sediment. ERI indicated that coastal sediments are at moderate to high ecological risk from heavy metals. This study will help policymakers make informed decisions for combating or remediating metal pollution to safeguard the coastal environment.
Introduction
The accumulation of heavy metals in marine and coastal ecosystems is a serious global issue that has recently received significant attention due to its environmental persistence, biogeochemical cycling, and ecological concerns. There are several reports of industrial activities that directly discharge wastewater and solid waste, as well as processes that recycle electrical and electronic trash (Youssef and El-Said, 2011; Pan and Wang, 2012; Wang et al., 2013; Ra et al., 2014). Globally, an estimated 160 thousand industries discharge 41-57 thousand tons of toxic chemicals and 68 thousand tons of toxic metals into coastal waters (UNEP and UN-HABITAT, 2005). The heavy metal (As, Cd, and Pb) concentrations higher than the background levels are considered hazardous to marine life and human health (Persaud et al., 1993). The most toxic heavy metals, Cd, As, and Hg pose serious ecological threats to marine flora and fauna. They are carried in the water column, build up in sediments, and bio-accumulate in the food chain (Neff, 1997; Mason et al., 2000; Cotin et al., 2011; Nance et al., 2012). Several studies have also reported metal contamination from desalination plant effluents in coastal sediments in the Gulf States (de Mora et al., 2004; Naser, 2012; Naser, 2013).
Heavy metals are widely present in industrial effluents, anti-fouling paint on fishing boats, ships, and municipal wastewater, and large accumulations of industrial wastes and effluents have the potential to pollute the coastal environment (Jha et al., 2021; Xie et al., 2023). Several studies have found that heavy metal accumulation in sediments along the southeast coast of India may be caused by point sources such as direct discharge of significant amounts of industrial and domestic wastes into rivers and coastal waters (Muthu and Jayaprakash, 2008; Satpathy et al., 2012; Barath Kumar et al., 2017; Gopal et al., 2017; Tholkappian et al., 2018; Jha et al., 2019; Jha et al., 2021; Kannan et al., 2023). When heavy metals enter the aquatic environment, only a fraction of the metal ions dissolve in the water; the remainder is deposited in sediments through adsorption, hydrolysis, and co-precipitation, posing a risk to the environment, the biota, and human health (Li et al., 2013; Ke et al., 2017). However, sediments may move from the sink to the source of the water column when environmental conditions change as a result of a reversal in wind patterns (Prica et al., 2008; Zhuang and Gao, 2015). As a result, heavy metal concentrations in sediments are frequently investigated to provide information for assessing environmental risk (Long et al., 1995; SEPA (State Environmental Protection Administration of China), 2002). As far as the Indian coast is concerned, lots of heavy metals are being handled in the major ports available along the east and west coasts of India, and many industries have been established along the Indian coast, which releases lots of pollutants into the Bay of Bengal and Arabian seas (Sundararajan et al., 2016; Jha et al., 2019; Satheeswaran et al., 2019). Therefore, many possibilities and opportunities exist to monitor the heavy metal concentration in the coastal environment to avoid the major environmental potential loss due to heavy metal accumulation in water and marine sediments. Further, the species available in benthic sediments are very susceptible to the ingress of toxic heavy metals, which form the building block in the marine food chain (Nance et al., 2012).
The present investigation aimed to (i) evaluate the contamination status of metals (Cr, Cu, Pb, Cd, Co, Mn, Ni, Zn, and As) in the sediment and their spatio-temporal distribution, (ii) quantify and identify the sources and pollution status in the coastal sediments/marine system, and (iii) estimate the ecological risk of heavy metal contamination using various geochemical indices, including geo-accumulation index (Igeo), enrichment factor (EF), contamination factor (CF), and ecological risk index (ERI). Data on heavy metals in coastal sediments were collected during pre- and post-Covid-19 scenarios, where most of the industries and port operations were under lockdown. The metal concentrations reported in this study would be useful as reference values for the future evaluation of marine sediment quality and help government strategies for addressing environmental pollution, particularly heavy metal pollution, which not only has human hazard implications but also the power to paralyze the aquatic environment and associated species for a longer time scale.
Materials and methods
Study area
The study area extends within the geographical limits of (13° 03’ 59.99” N, 80° 17’ 25.63” E and 12° 31’ 18.59” N, 80° 9’ 56.60” E) and a coastal stretch of about 170 km extending from north Chennai to the south of Puducherry along the southeast coast of India (Figure 1). Sediment samples were collected at 11 transects (1 km, 5 km, and 10 km from the coast) such as Chennai Port (CP-1, CP-5, CP-10), Marina (MA-1, MA-5, MA-10), Adyar (AD-1, AD-5, AD-10), Kovalam (KO-1, KO-5, KO-10), Mahabalipuram (MH-1, MH-5, MH-10), Kalpakkam (KP-1, KP-5, KP-10), Edaikazhinadu (ED-1, ED-5, ED-10), Pondicherry University (PU-1, PU-5, PU-10), Gandhi statue (GS-1, GS-5, GS-10), Fishing harbor (FH-1, FH-5, FH-10), and Paradise beach (PB-1, PB-5, PB-10). The coast of Tamil Nadu has 3 major ports, 7 state ports, 16 minor ports, fishing ports, and various coastal industries such as nuclear power plants, thermal power plants, oil refineries, and fertilizer production. The megacity Chennai, the capital of Tamilnadu, has also experienced rapid industrial and population growth as well as seeing untreated domestic and industrial wastes discharged into the coastal waters (Rosado et al., 2023). Such coastal cities have an estimated population of around 20 million people (Ramesh et al., 2008). More than 10 million people live along the coast in the mega city of Chennai alone, resulting in more than 75 million gallons of waste being discharged into the sea every day (Ramesh et al., 2008). The Buckingham Canal, which is located within the study area, runs parallel to the coast and transports largely untreated sewage from the city and industrial effluents to the backwaters of the Cooum, Adyar, Muthukadu, Edaiyur, and Sadras. Additionally, the Madras Atomic Power Station (MAPS) on the Kalpakkam coast draws seawater through an intake structure that is submerged in water about 500 meters from the coastline. The hot seawater is discharged into the sea through an outfall canal after being heated by the condenser during the cooling process. The coast is characterized by a semi-diurnal tide of a maximum ~1.2 m tidal range. Coastal currents vary seasonally; with an average of 15 cm/s, northeasterly during the southwest (SW) monsoon and 17 cm/s in a southerly direction during the northeast (NE) monsoon. Five important tourist beaches viz., Marina (MA), Elliot (EL), Thiruvanmiyur (TH), and Kovalam (KO) in Chennai, and Paradise Beach (PB) in Puducherry, are located along the southeast coast of India.
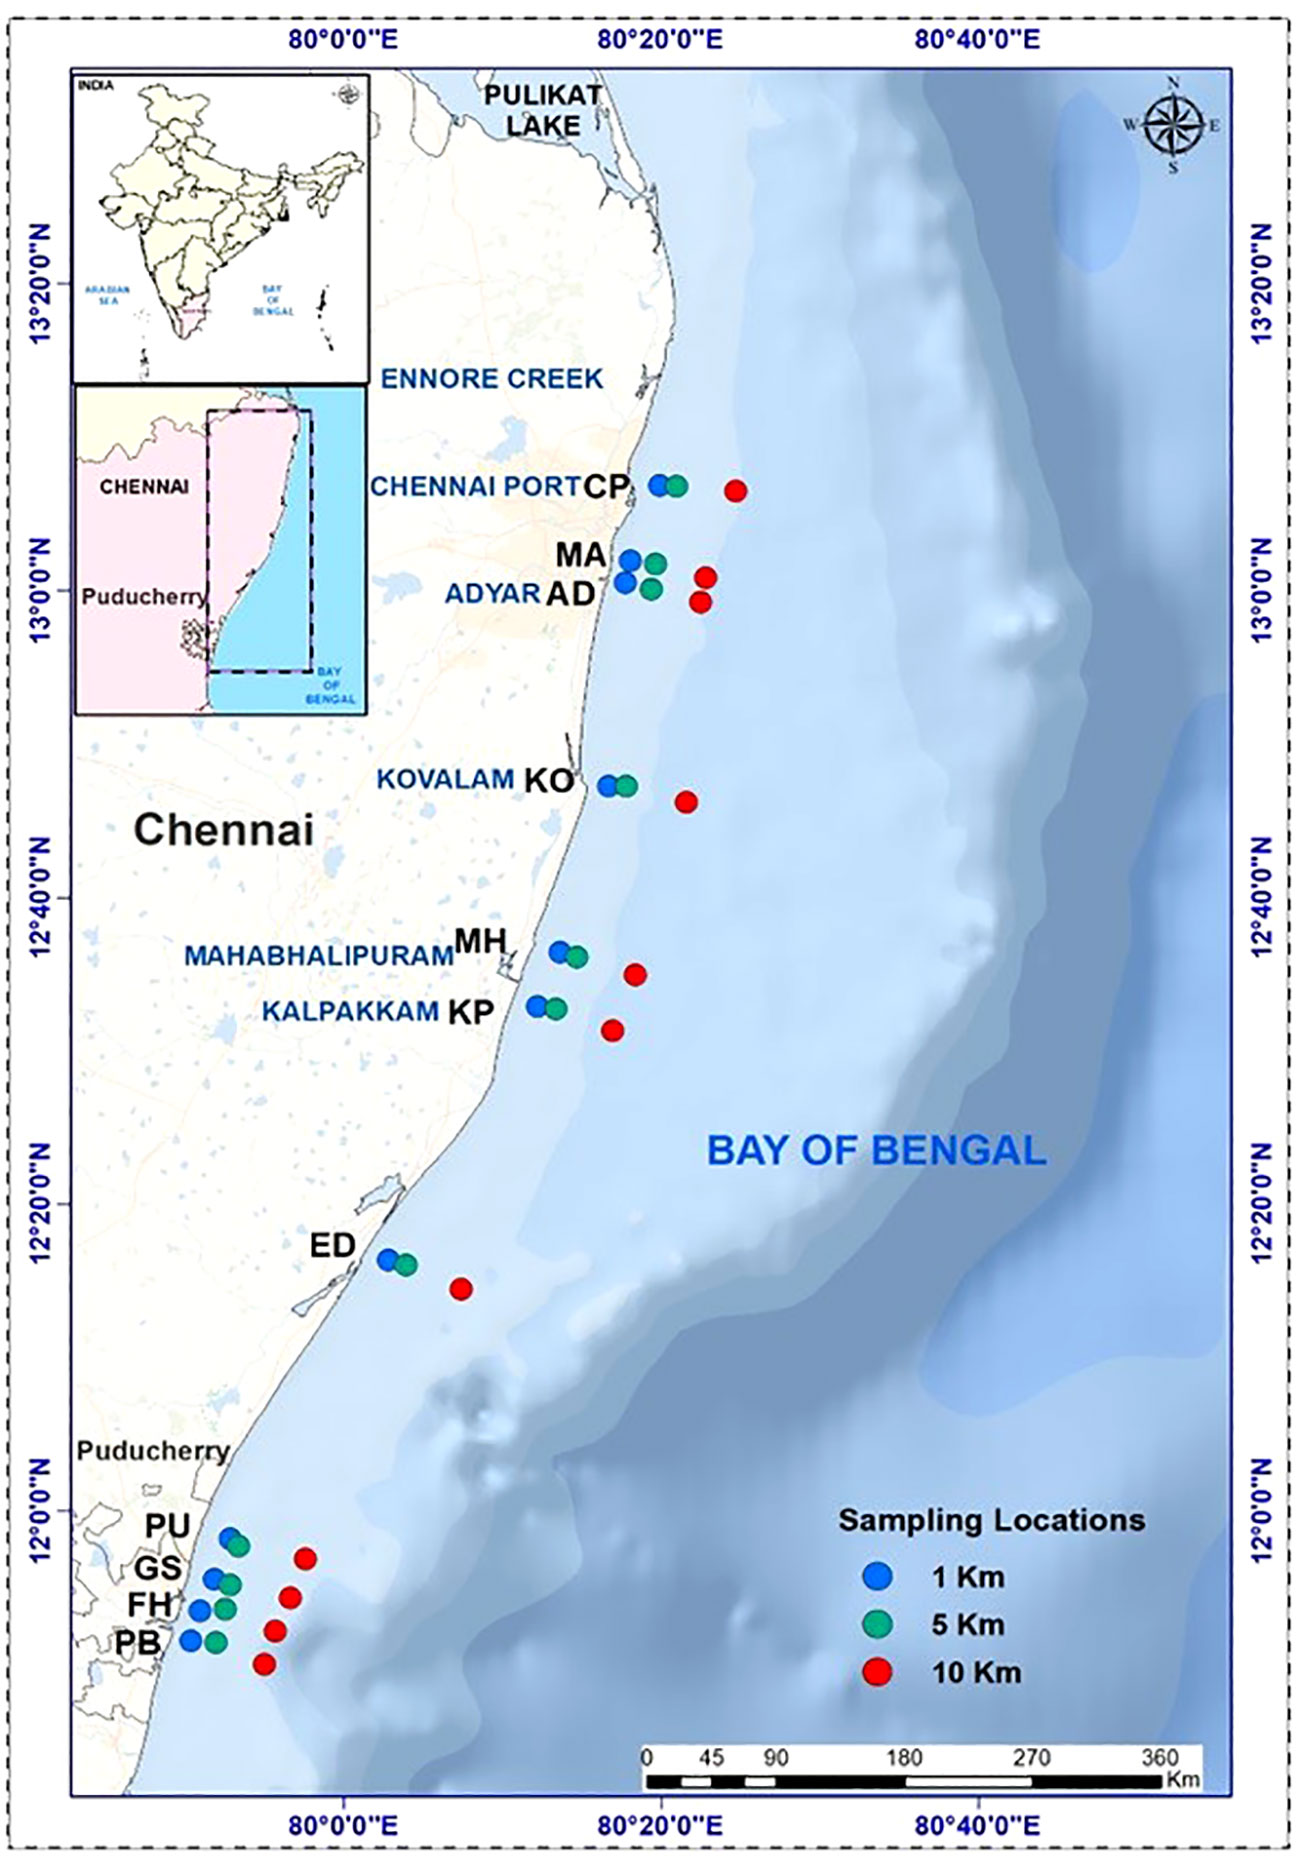
Figure 1 Sampling locations.
A total of four scientific coastal cruises up to 10 km from the coast along the Chennai-Puducherry region were conducted during 2019-20. The research vessels of the Ministry of Earth Sciences, Govt. of India were engaged for these on-board samplings. Details of the cruises are: first cruise- Mar 2019 by CRV Sagar Purvi, second cruise-January 2020 by ORV Sagar Manjusha, third cruise-July 2020 by CRV Sagar Anveshika, and fourth cruise-September 2020 by CRV Sagar Anveshika. The four cruise data sets were separated into two seasons. Depending on the amount of precipitation (IMD, 2020), the seasons are classified into dry periods (January and March) and wet periods (July and September). A total of 132 coastal sediment samples were collected from the Chennai-Puducherry coast. After collection, the sediment samples were air-dried for one week, then ground using a porcelain mortar and pestle, sieved through a 63 µ size, and stored in polyethylene bags at ambient room temperature. All analyses were carried out in duplicate and the results were expressed as mean. Briefly, 0.2 g of the sediment samples were digested with 1 ml H2O2, 4 ml HNO3, and 1 ml HCL in a 1:4:1 ratio. Samples were digested at 195°C in a microwave digestor for 90 min. The digested samples were then filtered through the Whatman No.1 filter and made up to 10 ml with Milli Q water (USEPA, 2007). Metal concentrations in extracted samples were measured by Inductively Coupled Plasma Optical Emission Spectrometry (ICP-OES, Make: Agilent; Model: 5110 VDV). The instrument was calibrated using a trace metals mix (Agilent Technologies) standard. The certified reference materials (CRMs) for marine sediment (PACS-3, Lot G 4169010, NRC, Canada) were used to validate the analysis of heavy metals (Persaud et al., 1993; MacDonald et al., 2000; ECMDEQ, 2007; Simpson et al., 2013) (Supplementary Table 1). The same acid digestion process used for the sediment samples was also used for CRMs. Sediment organic carbon (SOC) was determined using the Walkley-Black wet oxidation method (Walkley, 1935).
The pollution level and environmental quality status in marine sediments were assessed by using pollution indices such as enrichment factor (EF), contamination factor (CF), geo-accumulation index (Igeo), and ecological risk index (ERI). The background metal concentration is considered the standard value for reliable interpretation of the geochemical data. The average metal concentrations in sediments were measured following Turekian and Wedepohl (1961).
A popular normalization technique used to distinguish metals with natural variability from those with anthropogenic variability is the enrichment factor (EF) (Sinex and Helz, 1981; Selvaraj et al., 2004). To assess the anthropogenic impact on heavy metals in sediments, the EF for each element was determined as follows.
Where EF is the ratio of the relevant samples to background shale average values, and CX and CAl stand for the concentrations of metals X and Al, respectively.
According to Bam et al. (2011), EF is categorized as background concentration<1; depletion to minimum enrichment 1-2; moderate enrichment 2-5; significant enrichment 5-20, very high enrichment 20-40, and extremely high enrichment >40.
To measure the contamination in sediments from specific metals, the contamination factor (CF) was calculated using the following equation:
“Cbackground” in the equation above refers to the metal content in the sediments before any anthropogenic input. According to Hakanson (1980), CF<1 represents low contamination, 1< CF< 3 suggests moderate contamination, 3< CF< 6 denotes considerable contamination, and CF> 6 refers to high contamination.
The geoaccumulation index (Igeo) is the estimate of probable metal enrichment of metals in the sediments (Muller, 1979). The equation for the derivation of Igeo is provided here under,
Where Bn is the background concentration value for metal n and Cn is the concentration of metal n in the sediments (Turekian and Wedepohl, 1961), factor 1.5 is used to account for any variations in the background data due to lithological variances. Using the world average shale values, Igeo was effectively computed. Muller (1979) defined five levels of sediment pollution: non-polluted (Igeo< 1), very slightly polluted (1<Igeo< 2), slightly polluted (2<Igeo< 3), moderately polluted (3<Igeo< 4), highly polluted (4<Igeo< 5), and very highly polluted (Igeo> 5).
Overall, the ecological impact of metal contamination in the sediment is evaluated using the ecological risk index (ERI) (Hakanson, 1980). The ERI is calculated by the formula,
Where Tri stands for the toxic response factor for a certain metal, Cf i for contamination of a chosen metal, and Ef i for the enrichment of a particular metal. The degree of ecological risk is quantified using the following categories of ERI:
ERI< 40, which indicates low ecological risk due to metal pollution; 40 ≤ ERI< 80, which indicates moderate ecological risk; 80 ≤ ERI< 160, which indicates Considerable ecological risk; 160 ≤ ERI< 320 - high ecological risk; ≥ 320 - very high ecological risk.
Results and discussion
Coastal sediments are the ultimate storeroom for pollutants, hence monitoring and regulation are highly essential to conserve the ecosystem. Sediment quality guidelines (SQG) and environmental quality indices are widely recognized for the assessment of hazards from the toxic metals in the sediment (Oves et al., 2012; Kwok et al., 2014). The findings of the measurements made of the heavy metals and organic carbon in the coastal sediments at 33 different sites are shown in Table 1. A total of 132 numbers of coastal sediment samples were collected from the Chennai-Puducherry coast. Heavy metals (Cr, Cu, Pb, Cd, Co, Mn, Ni, Zn, As), as well as sediment organic carbon, were analyzed during the dry and wet periods. Overall higher metal concentrations were observed during the dry season attributing to accumulation and precipitation due to the lesser flow rate and dilution (Duncan et al., 2018; Santhosh et al., 2023). The concentration of chromium (Cr) ranged from 16.48 to 74.70 µg/g and maximum concentration was observed at ED-1 during the dry period. Copper (Cu) concentrations ranged between 2.01 µg/g and 53.78 µg/g and the concentration of Cu was higher at FH-5 in the dry period. Lead (Pb) concentration was observed from 1.37 to 17.54 µg/g and the ED-1 site was recorded with high levels during the dry period. Cadmium (Cd) was found in the range between 0.20 and 21.76 µg/g. The higher Cd concentration was recorded at MA-5 during the dry period. Higher Cobalt (Co) concentration was found during the wet period at KO-10 with an overall range of 1.80 - 9.02 µg/g. Manganese (Mn) varied from 70.27 to 346.22 µg/g and the highest concentration was found at ED-1 during the dry period. Nickel (Ni) varied from 5.73 to 40.53 µg/g and the highest concentration was found at PU-5 in the wet period. The Ni concentration observed in this study is lesser than the reported concentration of Ni from 15.6 to 23.6 µg/g in 2018 in Chennai coastal sediments (Tholkappian et al., 2018). Zinc (Zn) concentration ranged from 4.73 to 53.54 µg/g and the highest concentration was found at FH-5 during the wet period. Similarly, Tholkappian et al. (2018) reported the concentrations of Cr, Ni, Zn, Co, and Mn in the sediments of Chennai coastal waters. The mean concentrations of Cr, Ni, Zn, Co, and Mn were reported as 31.14, 18.79, 29.12, 2.85, and 160.8 mg/kg respectively. These concentrations are comparable with the metal levels observed in this study. The difference in the metal concentrations with the reported data may be due to various reasons such as reduced discharges due to Covid-19 restrictions. Arsenic (As) varied from 2.09 to 28.18 µg/g and the highest concentration was found at CP-5 during the wet period (Table 1). Miao et al. (2022) have recorded higher concentrations of metal in the sediment in the wet season. This is attributed to the large amounts of metals brought from various sources through monsoonal river run-off. The concentration of Cd and As exceeded the permissible limit according to Dutch standards and Persaud et al., 1993. Higher concentrations of Cd and As were detected at MA and CP stations, which were attributed to the Cooum River’s passage of industrial and municipal wastes as well as proximity to the major Chennai Port. Similarly, a high concentration of Cd was found in the sediment of the Gulf of Mannar and Palk Bay (Palanichamy and Rajendran, 2000). The sediment organic carbon (SOC) content in the sediments was found between 0.27% and 1.48% during the study period. A high SOC was noticed at MH-10 in the wet period (Table 1). Generally, the concentrations of SOC were higher in the silt and clay in both near-shore and offshore sediments, indicating that SOC is derived from marine and terrestrial inputs (Goslin et al., 2017).
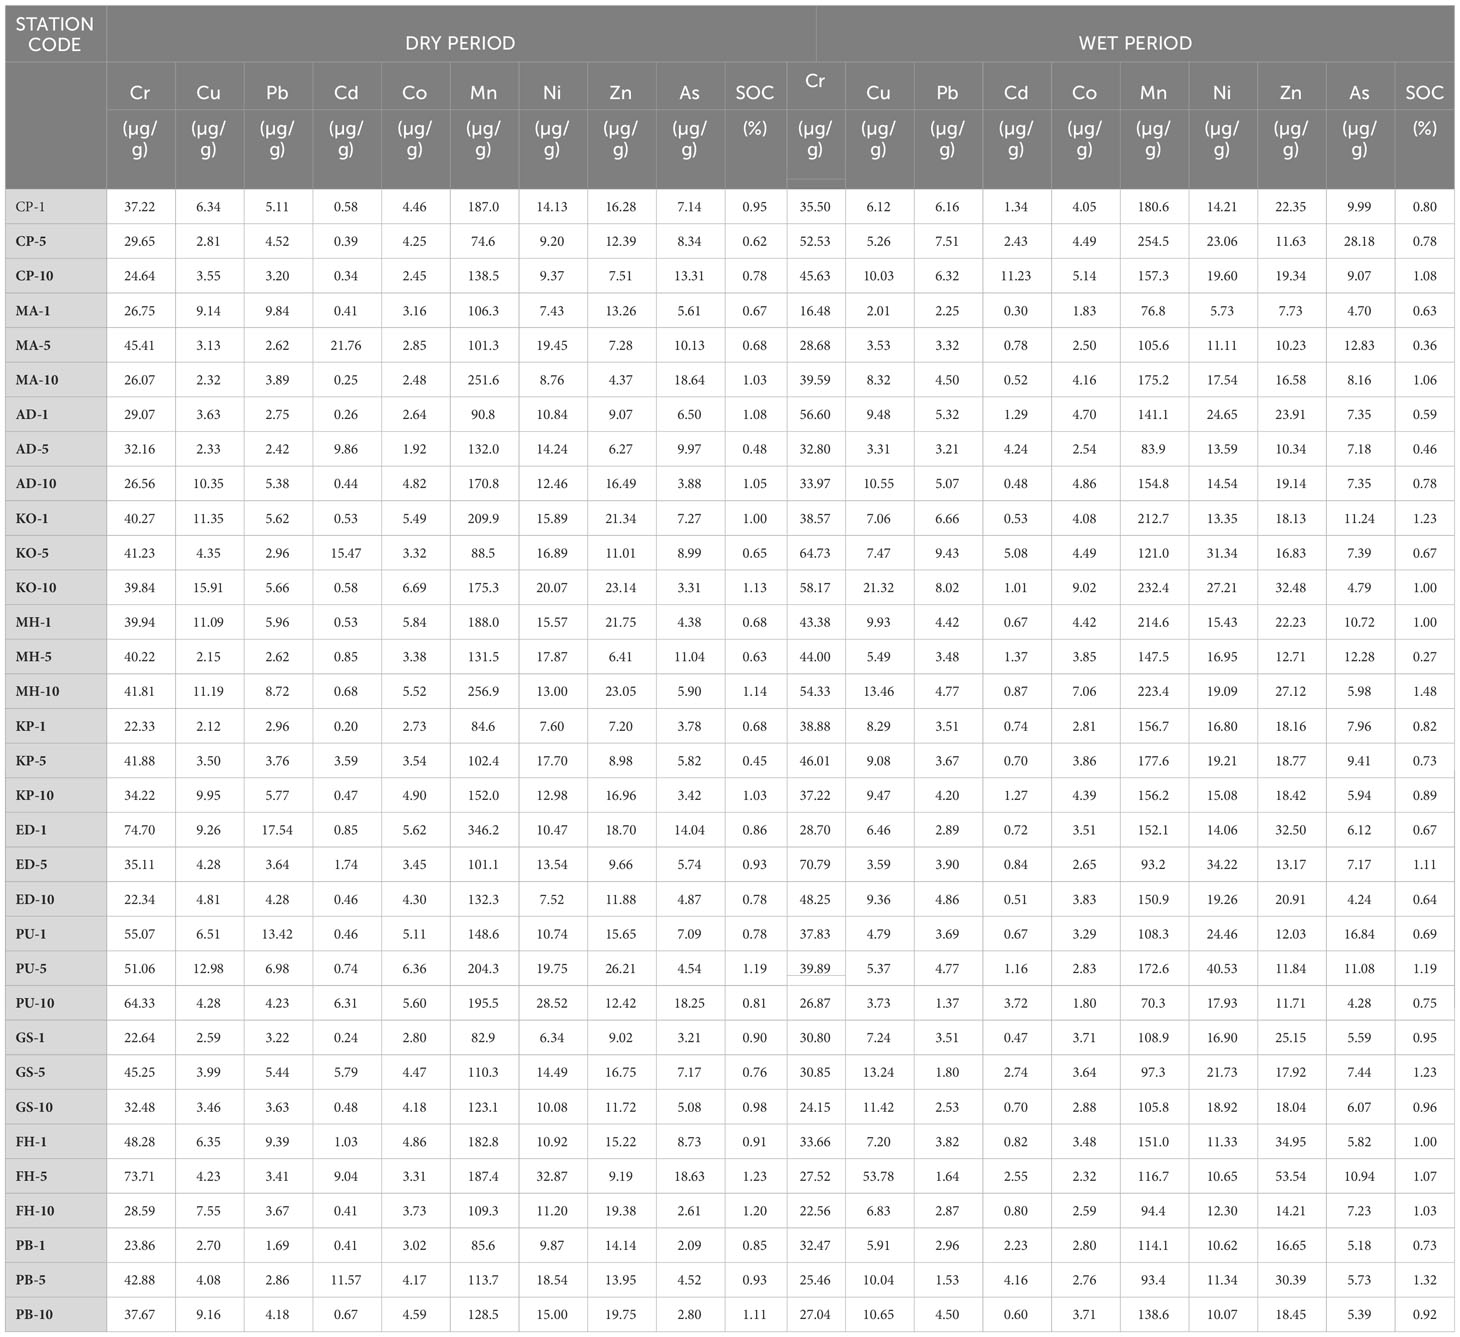
Table 1 Distribution of heavy metals (Cr, Cu, Pb, Cd, Co, Mn, Ni, Zn, As) and SOC in the coastal sediment.
Geo accumulation index
Geo accumulation index (Igeo) is a measure of metal deposit in the sediment in comparison with the contextual concentration of the specific metal. The Igeo values of the heavy metals are depicted in Figure 2A. The Igeo value of the surface sediments in the study area showed that Cr ranged from -2.6 to -1.3 (mean -1.9), Cu -4.4 to -2.9 (mean -3.6), Cd -0.1 to 2.2 (mean 1.1), Pb -4.8 to -2.0 (mean -3.2), Ni -3.8 to -2.2 (mean -2.9), Zn -4.2 to -2.8 (mean -3.3), and As from 0.4 to 2.4 (mean 1.6). The Igeo index categorized Cd and As under the slightly polluted category. The Igeo values of other metals such as Cr, Cu, Pb, Ni, and Zn were less than 1, so these metals are shown to be non-polluted (Figure 2A). The Igeo values obtained in this study are in agreement with the previously reported values in Chennai coastal sediments (Tholkappian et al., 2018). However, the Igeo value of Cd was >2 for sediments during the dry period (CP, KO, ED, FH), but the Igeo value of As was >2 during both dry and wet periods (CP, MA, MH, PU) locations, which indicates that these locations are slightly polluted. The heavy metals (Cd and As) pollution tends to be higher in the study area during both dry and wet periods, possibly due to anthropogenic inputs such as untreated sewage discharge, fertilizers, pharmaceuticals, paints, distilleries, cement clinker, refineries, and ship breaking. Similar observations are reported along the southeast coast of India (Ranjan et al., 2008; Sundaramanickam et al., 2016). The Igeo value of metals is in the following order: As >Cd >Cr >Ni >Pb>Cu (Figure 2A).
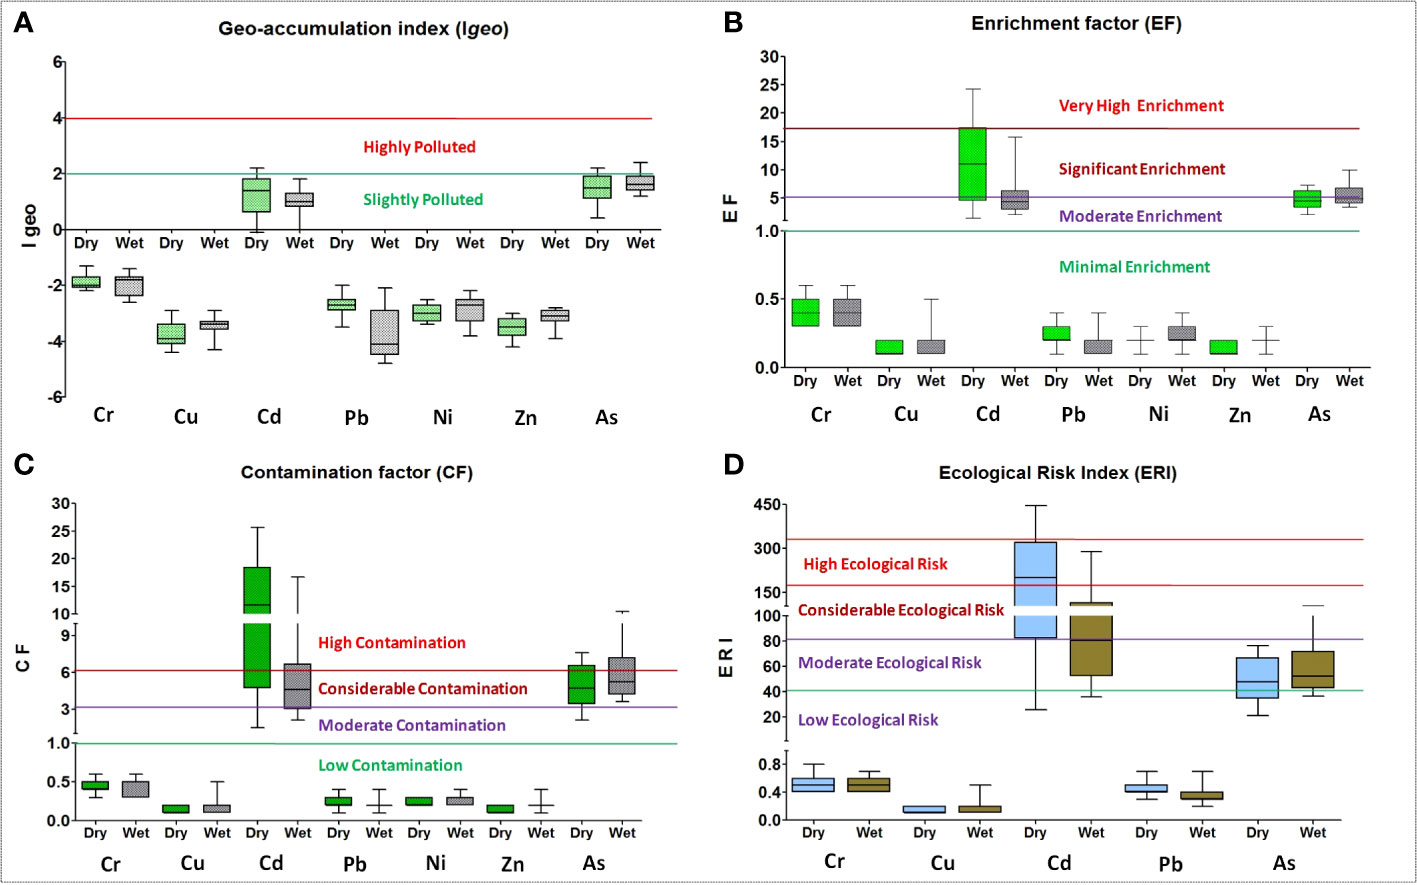
Figure 2 (A-D) Geoaccumulation index (lgeo), (B) Enrichment factor (EF), (C) Contamination factor (CF), (D) Ecological risk index (ERI) of the coastal sendiments.
Enrichment factor
The EF values for heavy metal pollution in the sediment are shown in Figure 2B. The EF value of the sediment for Cr ranged from 0.3 to 0.6 (mean 0.4), Cu 0.1 to 0.5 (mean 0.2), Cd 1.4 to 24.3 (mean 8.1), Pb 0.1 to 0.4 (mean 0.2), Ni 0.1 to 0.4 (mean 0.2), Zn 0.1 to 0.3 (mean 0.2), and As from 2 to 10 (mean 5.1), Cd showed the highest EF value followed by As among the other metals (Figure 2B). As was classified as moderate to significant enrichment whereas Cd was moderate to very high, while Cr, Cu, Pb, Ni, and Zn were classified as minimal enrichment which corroborates Figure 2B. Cd showed very high enrichment during the dry period whereas, As showed significant enrichment during the wet period. Except for MH and KP locations, the EF value of Cd was >5, while As was >5 at CP, MA, ED, PU, and FH. The average EF for Cr, Cu, Pb, Ni, and Cd was less than 1, while As was between 2 and 20, indicating that these metals were depleted to minimum to moderate enrichment in the sediments. The EF results revealed that the higher values for Cd and As are primarily attributable to contamination from metal-based industries such as electroplating and metallurgy, as well as automobile exhaust (Karthikeyan et al., 2020) The average order of EF values of metals was Cd > As > Cr >Ni >Pb>Cu (Figure 2B). Similarly, Rubalingeswari et al. (2021) found higher enrichment of Cr and Cu based on EF values of more than 30 in the sediment samples of the Adyar estuary on the Chennai coast. This indicates the metal load to the coastal sediments from the highly contaminated estuaries in the Chennai coastal region.
Contamination factor
CF values describe the level of metal contamination in the coastal environment. The CF values for heavy metal contamination in the sediment are shown in Figure 2C. The CF value of Cr ranged from 0.3 to 0.6 (mean 0.4), Cu 0.1 to 0.5 (mean 0.2), Cd 1.5 to 25.6 (mean 8.5), Pb 0.1 to 0.4 (mean 0.2), Ni 0.2to 0.4 (mean 0.2), Zn 0.1 to 0.4 (mean 0.2), and As from 2.1 to 10.5 (mean 5.4), Cd shows the highest CF value followed by As (Figure 2C). Cd and As were classified as considerable to high contamination, while Cr, Cu, Pb, Ni, and Zn were classified as low contamination in the study area. The coastal sediments are highly contaminated by Cd during the dry, whereas As was during the wet period. The CF of metals is in the following order: Cd > As >Cr >Ni >Pb>Cu (Figure 2C).
Ecological risk index
The ERI values for heavy metals in the sediment are shown in Figure 2D. The ERI value of Cr varied from 0.4 to 0.8 (mean 0.5), Cu 0.1 to 0.5 (mean 0.2), Cd 25.2 to 444.1 (mean 147.7), Pb 0.2 to 0.7 (mean 0.4), and As from 20.9 to 105 (mean 53.9), Cd shows the highest ERI value followed by As (Figure 2D). ERI classified the sediments as moderate to very high ecological risk from Cd during the dry period, while the coastal sediments are under moderate to considerable ecological risk by As during the wet period in the study area. This coastal region has low ecological risk from metals such as Cr, Cu, and Pb. The ERI of metals in the sediment samples are in the following order: Cd > As > Cr > Pb > Cu (Figure 2D). In a similar observation, an ERI value of less than 150 was reported in the southern tropical estuarine sediments of the Indian coast (Nishitha et al., 2022). These values indicate that the aquatic organisms are not at risk from these metals.
Correlation coefficient matrix
The correlation coefficient for Cr, Cu, Pb, Cd, Co, Mn, Ni, Zn, As, SOC, Sand, Silt, and Clay components are depicted in Table 2. The sand showed strong positive correlation with Cd (r2 = 0.986), Mn (r2 = 0.983), Co (r2 = 0.828), and Zn (r2 = 0.702), while Silt and clay showed strong positive correlation with SOC (r2 = 0.936), Ni (r2 = 0.933), Cr (r2 = 0.811), Pb (r2 = 0.756), and Cu (r2 = 0.753). This implies that these metals bond better to finer sand particles than to larger sand particles (Sundaramanickam et al., 2016) The SOC was strongly correlated with As (r2 = 0.981), and Zn (r2 = 0.703). This suggests that the sediment organic matter and its properties act as metal binders, with SOC playing an important role in its distribution pattern (Samuel and Phillips, 1988; Sundaramanickam et al., 2016). Additionally, As was strongly positively correlated with Cr (r2 = 0.982), Co (r2 = 0.853), and Pb (r2 = 0.619). Mn substantially correlated with Cd (r2 =0.900) and Pb (r2 =0.707), whereas Co positively correlated with Pb (r2 =0.877), Cu (r2 =0.865), Cr (r2 =0.811), and Cd (r2 =0.634), which shown in Table 2.
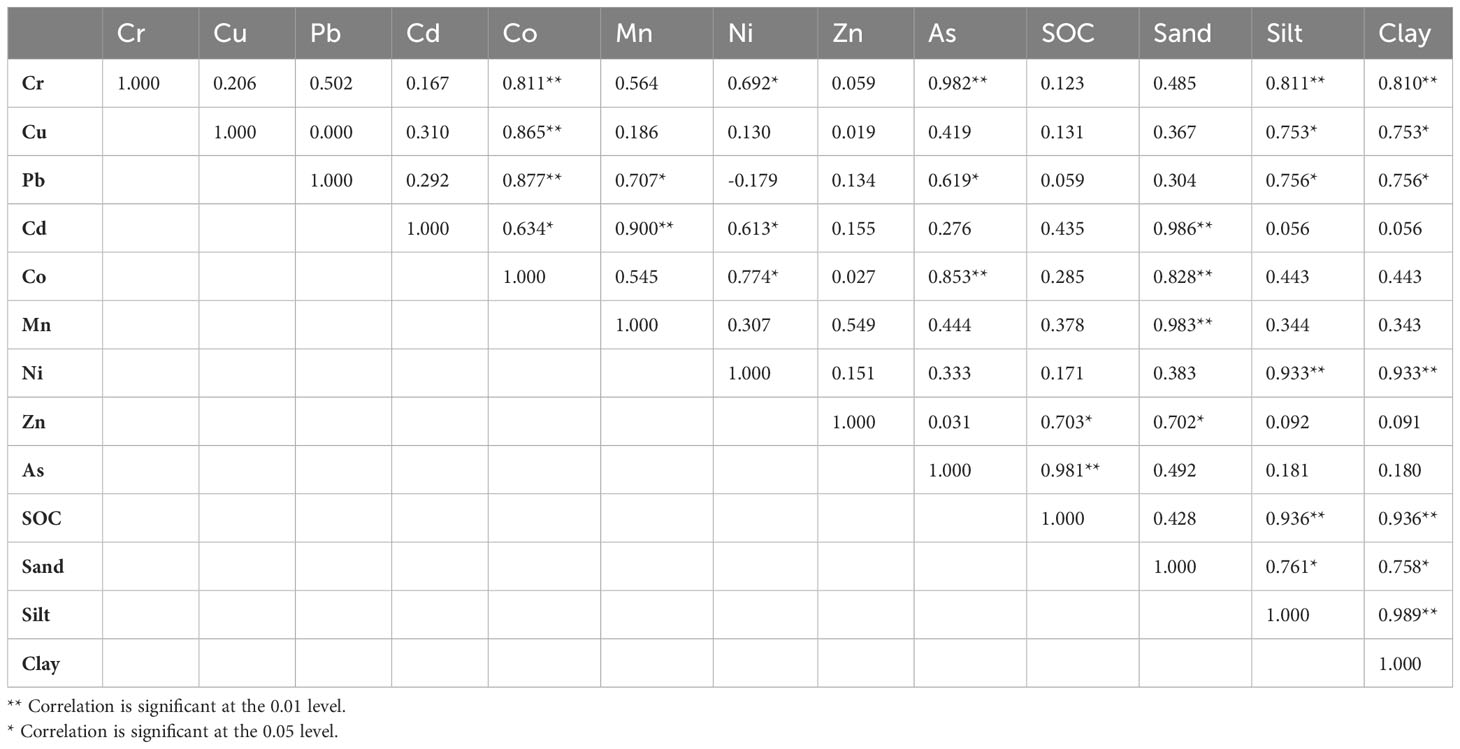
Table 2 Pearson’s correlation coefficient of heavy metals, SOC, Sand, Silt, and Clay in the coastal sediment.
Conclusion
In the present study, the coastal sediment shows elevated Cd and As concentrations. The results of Igeo suggested that the coastal sediments are slightly polluted by Cd and As, whereas, the sediment is uncontaminated by other metals. The CF shows high sediment contamination by Cd whereas, with considerable contamination by As. The ERI indicated that the coastal sediments are under threat with moderate to high ecological risk from As and Cd. The higher Cd and As concentrations than the background value were recorded, which are considered prime contributors to ecological risk. Geogenic and anthropogenic may be the major sources of the contamination. The level of pollutants, particularly metals (Cr, Cu, Pb, Cd, Co, Mn, Ni, Zn, As), would increase over time as a result of emerging industries such as ceramic, painting, glass, pesticides, herbicides, and battery manufacturing along the entire estuarine and coastal regions of Tamilnadu and therefore, further long-term monitoring is required. The finding of this study suggested that the increased heavy metals (Cd and As) concentration in the study area increases the toxicity in the coastal environment and affects the ecological balance. The study will enhance the awareness of policymakers/environmental agencies on heavy metal pollution and facilitate appropriate pollution control measures in the coastal waters.
Data availability statement
The original contributions presented in the study are included in the article/Supplementary Material. Further inquiries can be directed to the corresponding author.
Ethics statement
This study is based on coastal sediment sample, animal tests are not performed in the study.
Author contributions
SN: Conceptualization, Data curation, Investigation, Methodology, Validation, Writing – original draft. UP: Formal Analysis, Investigation, Methodology, Writing – review & editing. PK: Data curation, Formal Analysis, Writing – review & editing. DB: Investigation, Methodology, Writing – review & editing. RKS Writing – review & editing. USP: Investigation, Writing – review & editing. PM: Supervision, Writing – review & editing. MR: Project administration, Writing – review & editing.
Funding
The author(s) declare that no financial support was received for the research, authorship, and/or publication of this article.
Acknowledgments
The authors are grateful to the Secretary, Ministry of Earth Sciences (MoES), Government of India for his continuous support and encouragement. This manuscript has an NCCR contribution no. NCCR/MS/398.
Conflict of interest
The authors declare that the research was conducted in the absence of any commercial or financial relationships that could be construed as a potential conflict of interest.
Publisher’s note
All claims expressed in this article are solely those of the authors and do not necessarily represent those of their affiliated organizations, or those of the publisher, the editors and the reviewers. Any product that may be evaluated in this article, or claim that may be made by its manufacturer, is not guaranteed or endorsed by the publisher.
Supplementary material
The Supplementary Material for this article can be found online at: https://www.frontiersin.org/articles/10.3389/fmars.2023.1255466/full#supplementary-material
References
Bam E. K. P., Akiti T. T., Osea S. D., Ganyaglo S. Y., Gibrilla A. (2011). Multivariate cluster analysis of some major and trace elements distribution in an unsaturated zone profile, Densu river Basin, Ghana. Afr. J. Environ. Sci. Technol. 5 (3), 155–167.
Barath Kumar S., Padhi R. K., Mohanty A. K., Satpathy K. K. (2017). Elemental distribution and trace metal contamination in the surface sediment of the southeast coast of India. Mar. pollut. Bull. 114 (2), 1164–1170. doi: 10.1016/j.marpolbul.2016.10.038
Cotin J., García-Tarrasón M., Sanpera C., Jover L., Ruiz X. (2011). Sea, freshwater or saltpans? Foraging ecology of terns to assess mercury inputs in a wetland landscape: the Ebro Delta. Estuar. Coast. Shelf Sci. 92 (1), 118–194. doi: 10.1016/j.ecss.2010.12.024
de Mora S., Fowler S., Wyse E., Azemard S. (2004). Distribution of heavy metals in marine bivalves,fish and coastal sediments in the Gulf and Gulf of Oman. Mar. pollut. Bull. 49, 410–424. doi: 10.1016/j.marpolbul.2004.02.029
Duncan A. E., de Vries N., Nyarko K. B. (2018). Assessment of heavy metal pollution in the sediments of the River Pra and its tributaries. Water Air Soil pollut. 229, 1–10. doi: 10.1007/s11270-018-3899-6
ECMDEQ (Environment Canada and Ministère du Développement durable, de l’Environnement et des Parcs du Québec) (2007). Criteria for the assessment of sediment quality in Quebec and application frameworks: prevention, dredging and remediation (Quebec, Canada: Environment Canada and Ministère du Développement durable, de l'Environnement et des Parcs du Québec), 27. Available at: http://www.planstlaurent.qc.ca/fileadmin/publications/diverses/Registre_de_dragage/Criteria_sediment_2007E.pdf.
Gopal V., Krishnakumar S., Simon Peter T., Nethaji S., Suresh Kumar K., Jayaprakash M., et al. (2017). Assessment of trace element accumulation in surface sediments off the Chennai coast after a major flood event. Mar. Pollut. Bull. 114 (2), 1063–1071. doi: 10.1016/j.marpolbul.2016.10.019
Goslin J., Sansjofre P., Van Vliet-Lanoe B. V., Denmark C. (2017). Carbon Stable Isotope and Elemental (TOC, TN) geochemistry in Salymarsh Surface sediments (Western Brittany, France): a Useful Tool for reconstructing Holocene Relative Sea-Level. J. Quat. Sci. 32 (7), 987–1007. doi: 10.1002/jqs.2971
Hakanson L. (1980). Ecological risk index for aquatic pollution control, a sedimentological approach. Water Res. 14 (8), 975–1001. doi: 10.1016/0043-1354(80)90143-8
IMD. (2020). Rainfall statistics of India-2020, India meteorological department, ministry of earth sciences, government of India, New Delhi, Report No.ESSO/IMD/HS/Rainfall Report. 133.
Jha D. K., Dharani G., Verma P., Ratnam K., Kumar R. S., Rajaguru S. (2021). Evaluation of factors influencing the trace metals in Puducherry and Diu coasts of India through multivariate techniques. Mar. Pollut. Bull. 167, 112342. doi: 10.1016/j.marpolbul.2021.112342
Jha D. K., Ratnam K., Rajaguru S., Dharani G., Devi M. P., Kirubagaran R. (2019). Evaluation of trace metals in seawater, sediments, and bivalves of Nellore, southeast coast of India, by using multivariate and ecological tool. Mar. pollut. Bull. 146, 1–10. doi: 10.1016/j.marpolbul.2019.05.044
Kannan G., Mghili B., Di Martino E., Sanchez-Vidal A., Figuerola B. (2023). Increasing risk of invasions by organisms on marine debris in the Southeast coast of India. Mar. Pollut. Bull. 195, 115469. doi: 10.1016/j.marpolbul.2023.115469
Karthikeyan P., Marigoudar S. R., Mohan D., Nagarjuna A., Sharma K. V. (2020). Ecological risk from heavy metals in Ennore estuary, South East coast of India. Environ. Chem Ecotoxicol. 2, 182–193. doi: 10.1016/j.enceco.2020.09.004
Ke X., Gui S., Huang H., Zhang H., Wang C., Guo W. (2017). Ecological risk assessment and source identification for heavy metals in surface sediment from the Liaohe River protected area, China. Chemosphere 175, 473–481. doi: 10.1016/j.chemosphere.2017.02.029
Kwok K. W., Batley G. E., Wenning R. J., Zhu L., Vangheluwe M., Lee S. (2014). Sediment quality guidelines: challenges and opportunities for improving sediment management. Environ. Sci. pollut. Res. 21, 17–27. doi: 10.1007/s11356-013-1778-7
Li F., Huang J., Zeng G., Yuan X., Li X., Liang J., et al. (2013). Spatial risk assessment and sources identification of heavy metals in surface sediments from the Dongting Lake, Middle China. J. Geochem. Explor. 132, 75–83. doi: 10.1016/j.gexplo.2013.05.007
Long E. R., Macdonald D. D., Smith S. L., Calder F. D. (1995). Incidence of adverse biological effects within ranges of chemical concentrations in marine and estuarine sediments. Environ. Manage. 19, 81–97. doi: 10.1007/BF02472006
MacDonald D., Ingersoll C., Berger T. (2000). Development and evaluation of consensus-based sediment quality guidelines for freshwater ecosystems. Arch. Environ. Contam. Toxicol. 39, 20–31. doi: 10.1007/s002440010075
Mason R. P., Laporte J. M., Andres S. (2000). Factors controlling the bioaccumulation of mercury, methyl mercury, arsenic, selenium and cadmium by freshwater invertebrates and fish. Arch. Environ. Contam. Toxicol. 38, 283–297. doi: 10.1007/s002449910038
Miao X., Liang J., Hao Y., Zhang W., Xie Y., Zhang H. (2022). The influence of the reduction in clay sediments in the level of metals bioavailability—An investigation in Liujiang river basin after wet season. Int. J. Environ. Res. Public Health 19 (22), 14988. doi: 10.3390/ijerph192214988
Muller G. (1979). Schwermetalle in den sedimenten des Rheins-VeraÈnderungenseit. Umschau 79, 778–783.
Muthu S. R., Jayaprakash M. (2008). Distribution and enrichment of trace metals in marine sediments of Bay of Bengal, off Ennore, south-east coast of India. Environ. Geol. 56, 207–217. doi: 10.1007/s00254-007-1156-1
Nance P., Patterson J., Willis A., Foronda N., Dourson M. (2012). Human health risks from mercury exposure from broken compact fluorescent lamps (CFLs). Regul. Toxicol. Pharmacol. 62 (3), 542–552. doi: 10.1016/j.yrtph.2011.11.008
Naser H. A. (2012). “Metal concentrations in marine sediments influenced by anthropogenic activitiesin Bahrain, Arabian Gulf,” in Metal contaminations: sources, detection andenvironmental impacts. Ed. Shao H. B. (New York: NOVA Science Publishers, Inc.), 157–175.
Naser H. A. (2013). Assessment and management of heavy metal pollution in the marine environment of the Arabian Gulf: a review. Mar. pollut. Bull. 72 (1), 6–13. doi: 10.1016/j.marpolbul.2013.04.030
Neff J. M. (1997). Ecotoxicology of arsenic in the marine environment. Environ. Toxicol. Chem. 16 (5), 917–927. doi: 10.1002/etc.5620160511
Nishitha D. S., Amrish V. N., Arun K., Warrier A. K., Udayashankar H. N., Balakrishna K. (2022). Study of trace metal contamination and ecological risk assessment in the sediments of a tropical river estuary, Southwestern India. Environ. Monit. Assess. 194 (2), 94. doi: 10.1007/s10661-021-09728-1
Oves M., Khan M. S., Zaidi A., Ahmad E. (2012). “Soil contamination, nutritive value, and human health risk assessment of heavy metals: an overview,” in Toxicity of heavy metals to legumes and bioremediation. Eds. Zaidi A., Wani P. A., Khan M. S. (Vienna: Springer), 1–27. doi: 10.1007/978-3-7091-0730-0_1
Palanichamy S., Rajendran A. (2000). Heavy metal concentration in seawater and sediment of Gulf of Mannar and Palk Bay, southeast coast of India. Indian J. Mar. Sci. 29, 116–119.
Pan K., Wang W.-X. (2012). Trace metal contamination in estuarine and coastal environments in China. Sci. Total Environ. 421-422, 3–16. doi: 10.1016/j.scitotenv.2011.03.013
Persaud D., Jaaguagi R., Hayton A. (1993). Guidelines for the protection and management of aquatic sediment quality in Ontario (Toronto: Ontario Ministry of the Environment), 27. Available at: http://hdl.handle.net/10214/15797.
Prica M., Dalmacija B., Roncˇevic´ S., Krcˇmar D., Becˇelic´ M. (2008). A comparison of sediment quality results with acid volatile sulfide (AVS) and simultaneously extracted metals (SEM) ratio in Vojvodina (Serbia) sediments. Sci. Total Environ. 389 (2-3), 235–244. doi: 10.1016/j.scitotenv.2007.09.006
Ra K., Kim J. K., Hong S. H., Yim U. H., Shim W. J., Lee S. Y., et al. (2014). Assessment of pollution and ecological risk of heavy metals in the surface sediments of Ulsan Bay, Korea. Ocean Sci. J. 49, 279–289. doi: 10.1007/s12601-014-0028-3
Ramesh R., Nammalwar P., Gowri V. S. (2008). Database on coastal information of Tamilnadu (Chennai: Environmental Information System (ENVIS) Centre, Department of Environment, Government of Tamilnadu), 133. Available at: https://tnenvis.nic.in/tnenvis_old/coastal%20data.pdf.
Ranjan R. K., Ramanathan A. L., Singh G., Chidambaram S. (2008). Assessment of metal enrichments in tsunamigenic sediments of Pichavaram mangroves, southeast coast of India. Environ. Monit. Assess. 147, 389–411. doi: 10.1007/s10661-007-0128-y
Rosado D., Castillo F., Nambi I., Sadhasivam R., Valleru H., Fohrer N. (2023). Evaluating heavy metal levels and their toxicity risks in an urban lake in Chennai, India. Int. J. Environ. Sci. Technol. doi: 10.1007/s13762-023-05086-2
Rubalingeswari N., Thulasimala D., Giridharan L., Gopal V., Magesh N. S., Jayaprakash M. (2021). Bioaccumulation of heavy metals in water, sediment, and tissues of major fisheries from Adyar estuary, southeast coast of India: An ecotoxicological impact of a metropolitan city. Mar. Pollut. Bull. 163, 111964. doi: 10.1016/j.marpolbul.2020.111964
Samuel N. L., Phillips D. J. H. (1988). Distribution, variability and impacts of trace elements in San Francisco Bay. Mar. Pollut. Bull. 19 (9), 413–425. doi: 10.1016/0025-326X(88)90396-7
Santhosh A. P., Pyary A., Biju A., Partheeban E. C., Vethanayaham J., Rajendran R., et al. (2023). Heavy metal contamination along different tidal zones of a tropical Bay of Bengal coastal environment influenced by various anthropogenic activities. Environ. Sci. Pollut Res. 30 (10), 27980–27995. doi: 10.1007/s11356-022-24112-3
Satheeswaran T., Yuvaraj P., Damotharan P., Karthikeyan V., Jha D. K., Dharani G., et al. (2019). Assessment of trace metal contamination in the marine sediment, seawater, and bivalves of Parangipettai, southeast coast of India. Mar. Pollut. Bull. 149, 110499. doi: 10.1016/j
Satpathy K. K., Mohanty A. K., Prasad M. V. R., Natesan U., Sarkar S. K. (2012). Studies on the variations of heavy metals in the marine sediments off Kalpakkam, East Coast of India. Environ. Earth Sci. 65, 89–101. doi: 10.1007/s12665-011-1067-z
Selvaraj K., Mohan V. R., Szefer P. (2004). Evaluation of metal contamination in coastal sediments of the Bay of Bengal, India: geochemical and statistical approaches. Mar. pollut. Bull. 49, 174–185. doi: 10.1016/j.marpolbul.2004.02.006
SEPA (State Environmental Protection Administration of China) (2002). Marine sediment quality (GB 18668-2002). (Beijing: Standards Press of China).
Simpson S. L., Batley G. B., Chariton A. A. (2013). Revision of the ANZECC/ARMCANZ sediment quality guidelines. CSIRO land and water science report. Available at: http://hdl.handle.net/102.100.100/126155?index=1.
Sinex S. A., Helz G. R. (1981). Regional geochemistry of trace elements in Chesapeake Bay sediments. Environ. Geol. 3, 315–323. doi: 10.1007/bf02473521
Sundaramanickam A., Shanmugam N., Cholan S., Kumaresan S., Madeswaran P., Balasubramanian T. (2016). Spatial variability of heavy metals in estuarine, mangrove and coastal ecosystems along Parangipettai, Southeast coast of India. Environ. pollut. 218, 186–195. doi: 10.1016/j.envpol.2016.07.048
Sundararajan S., Khadanga M. K., Kumar J., Raghumaran S., Vijaya R., Jena B. K. (2016). Ecological risk assessment of trace metal accumulation in sediments of Veraval Harbor, Gujarat, Arabian Sea. Mar. pollut. Bull. 114 (1), 592–601. doi: 10.1016/j.marpolbul.2016.09.016
Tholkappian M., Ravisankar R., Chandrasekaran A., Jebakumar J. P. P., Kanagasabapathy K. V., Prasad M. V. R., et al. (2018). Assessing heavy metal toxicity in sediments of Chennai Coast of Tamil Nadu using Energy Dispersive X-Ray Fluorescence Spectroscopy (EDXRF) with statistical approach. Toxicol. Rep. 5, 173–182. doi: 10.1016/j.toxrep.2017.12.020
Turekian K. K., Wedepohl K. H. (1961). Distribution of the elements in some major units of the Earth’s crust. Geol. Soc Am. Bull. 72, 175. doi: 10.1130/0016-7606(1961)72[175:DOTEIS]2.0.CO;2
UNEP, UN-HABITAT (2005) Coastal area pollution – the role of cities. Available at: http://www.unep.org/urban_environment/PDFs/Coastal_Pollution_Role_of_Cities.pdf (Accessed 01 Jan 2015).
USEPA. (2007). Method 3051A (SW-846): Microwave assisted acid digestion of sediments, sludges, and oils (Revision 1) (Washington, DC), 30. Available at: http://www.jonesenv.com/PDF/3051a.pdf.
Walkley A. (1935). An examination of methods for determining organic carbon and nitrogen in Soils1.(With one text-figure.). J. Agric. Sci. 25 (4), 598–609. doi: 10.1017/S0021859600019687
Wang S. L., Xu X. R., Sun Y. X., Liu J. L., Li H. B. (2013). Heavy metal pollution in coastal areas of South China: a review. Mar. pollut. Bull. 76 (1-2), 7–15. doi: 10.1016/j.marpolbul.2013.08.025
Xie S., Jiang W., Sun Y., Yu K., Feng C., Han Y., et al. (2023). Interannual variation and sources identification of heavy metals in seawater near shipping lanes: Evidence from a coral record from the northern South China Sea. Sci. Total Environ. 854, 158755. doi: 10.1016/j.scitotenv.2022.158755
Youssef D. H., El-Said G. F. (2011). Assessment of some heavy metals in surface sediments of the Aqaba Gulf, Egypt. Environ. Monit. Assess. 180, 229–242. doi: 10.1007/s10661-010-1784-x
Keywords: heavy metals, geochemical indices, ecological risk index, sediment quality, Bay of Bengal
Citation: Naik S, Pradhan U, Karthikeyan P, Bandyopadhyay D, Sahoo RK, Panda US, Mishra P and Murthy MVR (2023) Ecological risk assessment of heavy metals in the coastal sediment in the South-western Bay of Bengal. Front. Mar. Sci. 10:1255466. doi: 10.3389/fmars.2023.1255466
Received: 08 July 2023; Accepted: 02 October 2023;
Published: 27 October 2023.
Edited by:
Dilip Kumar Jha, National Institute of Ocean Technology, IndiaReviewed by:
Vikas Pandey, Council of Scientific and Industrial Research (CSIR), IndiaGopalakrishnan Thilagam, Pachaiyappa’s College for Men, India
Copyright © 2023 Naik, Pradhan, Karthikeyan, Bandyopadhyay, Sahoo, Panda, Mishra and Murthy. This is an open-access article distributed under the terms of the Creative Commons Attribution License (CC BY). The use, distribution or reproduction in other forums is permitted, provided the original author(s) and the copyright owner(s) are credited and that the original publication in this journal is cited, in accordance with accepted academic practice. No use, distribution or reproduction is permitted which does not comply with these terms.
*Correspondence: Subrat Naik, bmFpa3N1YnJhdEBnbWFpbC5jb20=