 Elisa Klein
 Emma Hadré
 Sebastian Krastel
 Morelia Urlaub
- 1Dynamic of the Ocean Floor, GEOMAR - Helmholtz Centre for Ocean Research Kiel, Kiel, Germany
- 2Marine Geophysics and Hydroacoustics, Institute for Geosciences, Kiel University, Kiel, Germany
Digital elevation models (DEMs) are crucial in natural hazard assessments, as they often present the only comprehensive information. While satellites deliver remote sensing information of the land surface of up to 2m resolution, only 25% of the seafloor is mapped with a minimum resolution of 400m. The acquisition of high-resolution bathymetry requires hydroacoustic surveys by research vessels or autonomous vehicles, which is time-consuming and expensive. Predicted bathymetry from satellite altimetry, on the other hand, is widely available but has a significantly lower spatial resolution and high uncertainties in elevation, especially in shallow waters. The research on volcanic islands as a source of both volcanic as well as marine hazards such as tsunamis, is greatly limited by the lack of high-resolution bathymetry. Here we compare 24 geomorphometric parameters of 47 volcanic islands derived from a) the comprehensive bathymetric data of the General Bathymetric Chart of the Ocean (GEBCO) and b) high-resolution (< 250m), ship-based bathymetry. Out of 24 parameters tested, 20 show < ± 2.5% median deviation, and quartiles < ± 10%. Parameters describing the size of a volcanic island are the most robust and slope parameters show the greatest deviations. With this benchmark, we will be able to increase geomorphometric investigations to volcanic islands where little or no high-resolution bathymetry data is available.
1 Introduction
Digital elevation models (DEM) are crucial in the assessment of natural hazards such as flooding and landslides, as they often provide the only comprehensive information available. While satellites deliver remote sensing information of the land surface of up to 2m resolution on non-polar terrestrial regions of the Earth (i.e. EarthDEM, Porter et al. (2022), only 25% of the seafloor is mapped with a minimum resolution of 400m (National Oceanographic Centre, 2023). Acquisition of high-resolution ship-based bathymetry data is time-consuming and labor-intensive and even the physically highest achievable resolutions of of ship-based surveys (30-50m in most depths) are still not measuring up to the resolution on land. Coastal areas are of special concern considering the increase in population, demand for economic use as well as sea-level rise. Yet, a “coastal white ribbon” remains widely unmapped (Weymer et al., 2022). This is also true for volcanic islands, where not only the population on the island is in danger of volcanic hazards, such as explosive and effusive eruptions, pyroclastic flows, and volcanic earthquakes, but also the population of the surrounding coasts, since volcanic islands can cause considerable tsunamis during eruptions (Lane, 2022) and lateral collapses (Ramalho et al., 2015). These tsunamis often cause high numbers of casualties because of the lack of early warning (Grilli et al., 2019). The volcanic earthquakes associated with eruptions and flank collapses are often not large enough to be felt or identified by the global seismological network. Thus, earthquakes are not suitable as a warning sign and volcanic tsunamis are challenging to detect in time to evacuate the surrounding coasts effectively. It is therefore important to find alternative ways to identify potentially unstable marine volcanic edifices prior to the occurrence of potentially tsunamigenic catastrophic collapses. In an attempt to quantify the tsunami hazard of volcanoes in Indonesia, Zorn et al. (2022) combined all available information into a ranking index. Due to the lack of high-resolution bathymetry, however, they were unable to include information about the submarine flanks of these volcanic islands.
Predicted bathymetry from satellite altimetry provides a promising remedy for previously unmapped areas. The General Bathymetric Chart of the Oceans [GEBCO, GEBCO Compilation Group (2021)] is a combined, continuous land surface and seafloor model relative to WGS84 with global coverage. The recent versions of GEBCO have a resolution of 15 arc seconds, equal to 500m grid cell size at the equator (GEBCO Compilation Group, 2021). GEBCO provides morphological information of the seafloor in surveyed areas, as well as of uncharted ones, derived from ship soundings and satellite altimetry, respectively. However, the low lateral resolution in combination with depth uncertainties of ±150-180m and other limitations (Tozer et al., 2019) make it unsuitable for a lot of scientific questions (Figure 1).
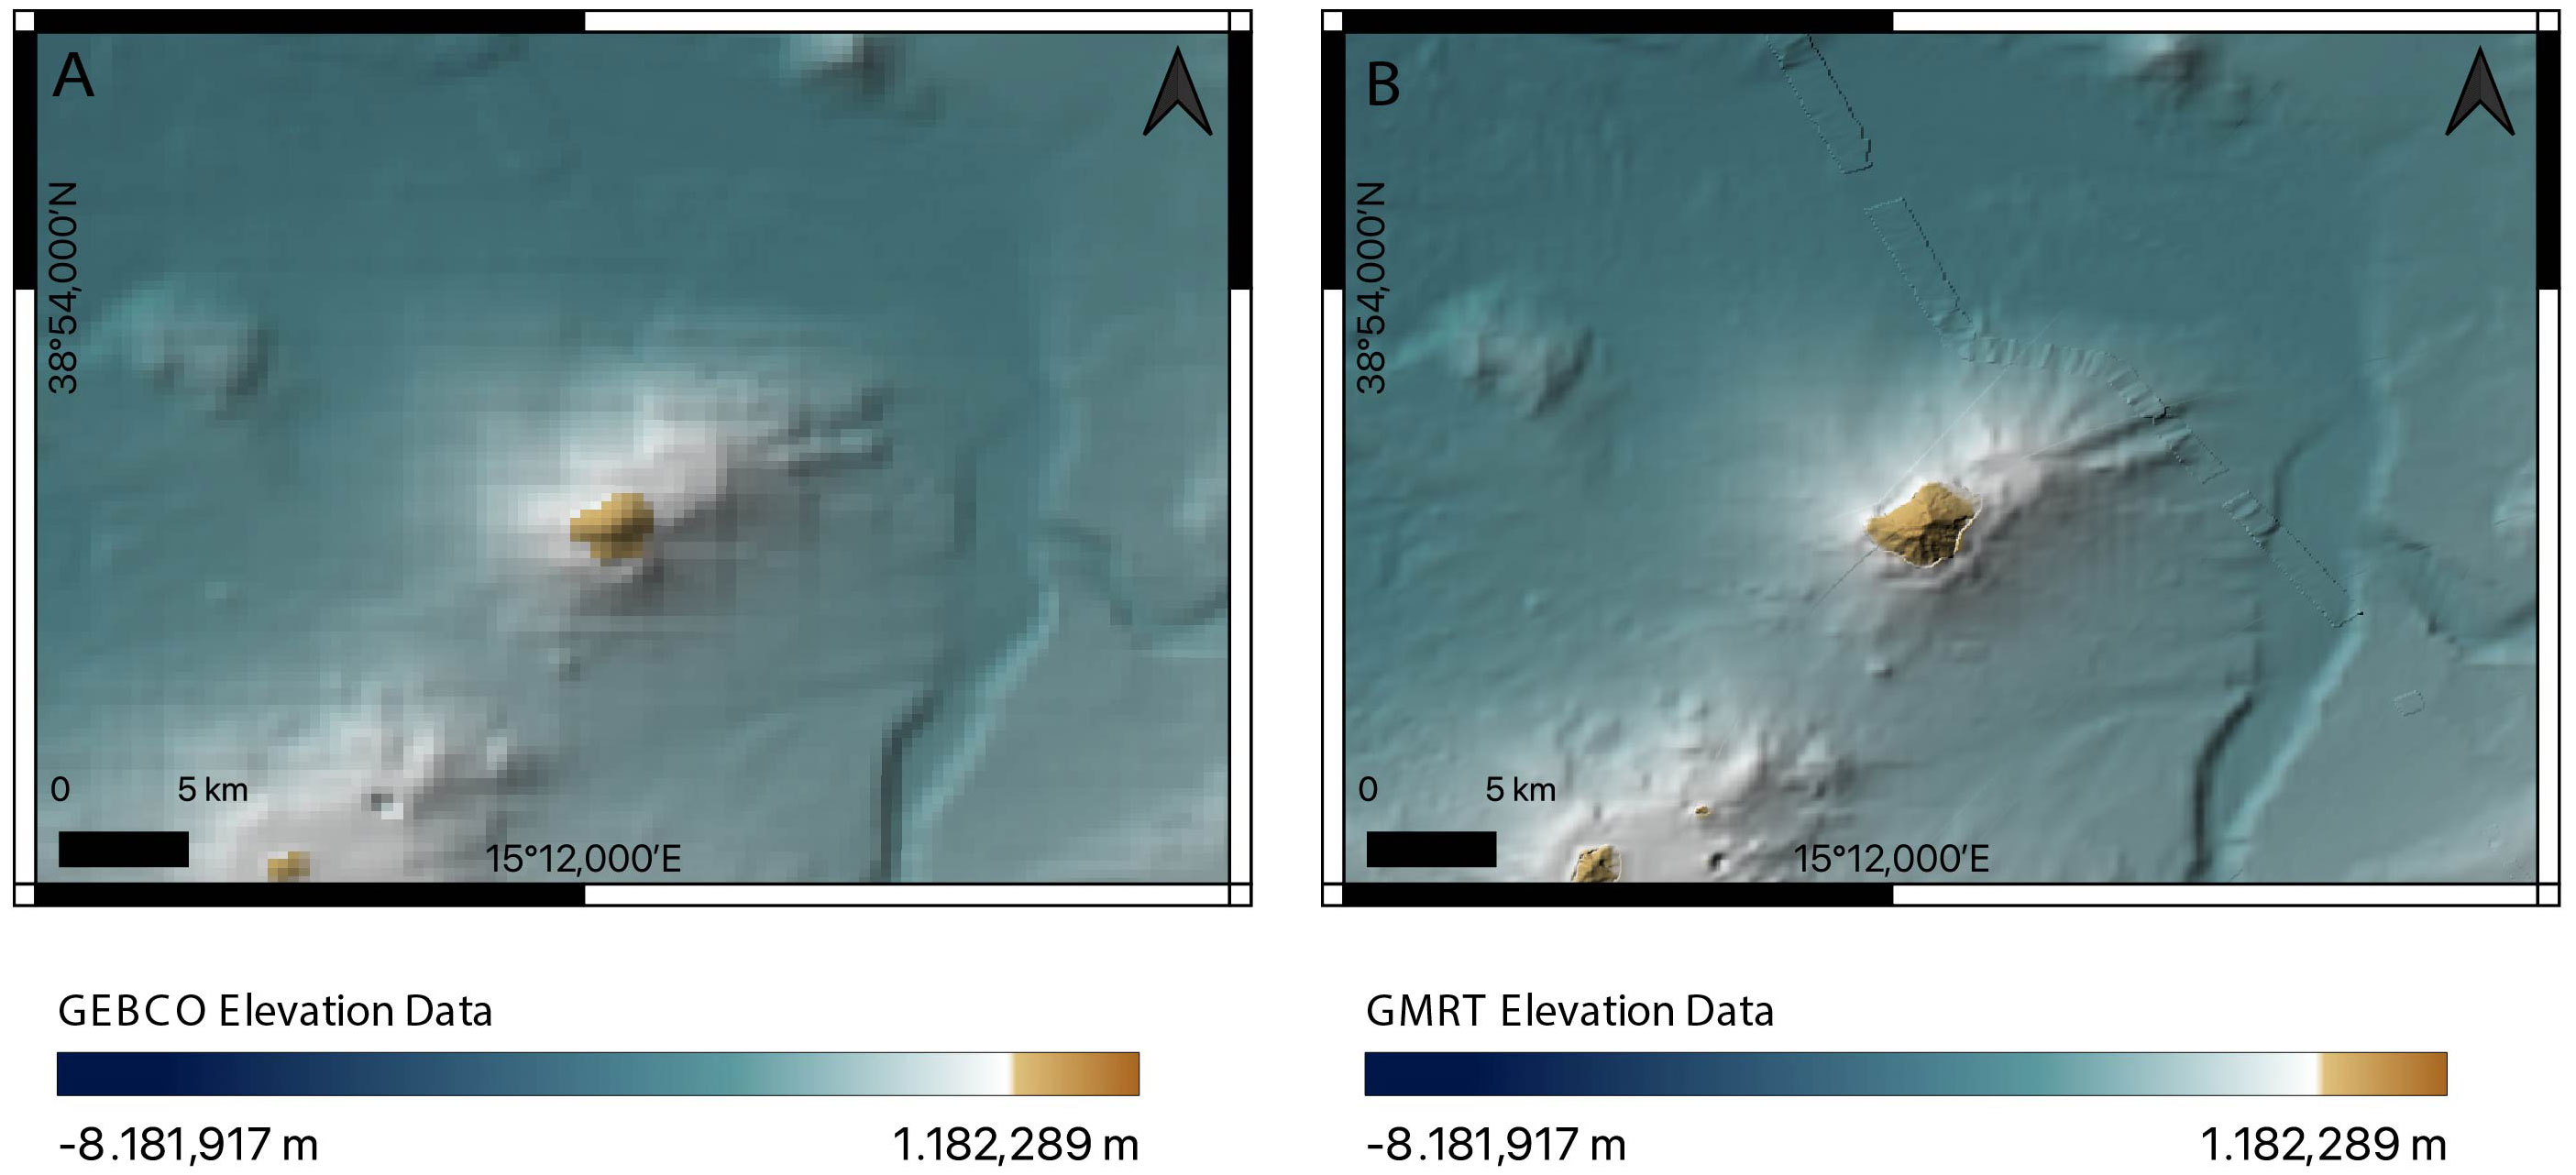
Figure 1 The volcanic island of Stromboli, Aeolian Islands, imaged from (A) GEBCO and (B) GMRT. Only a small part of the island is subaerial. (A) has a visibly lower resolution.
Here, we evaluate the accuracy of using GEBCO in a shoreline-crossing geomorphometric investigation of volcanic islands. We compare 24 geomorphometric parameters derived from GEBCO with those calculated using high-resolution (< 250m), ship-based bathymetry DEMs. Additionally, we investigate how the parameters are influenced by a partial coverage with ship-based, high-resolution bathymetry.
2 Methods
Figure 2 shows an overview of our workflow. Preparatory steps included the identification and selection of volcanic islands based on the database of the Global Volcanism Program (2023) (GVP), the compilation of high-resolution bathymetry from online platforms and colleagues, as well as the preparation of the DEMs (reprojection, resampling, interpolation if necessary). The major steps were then the delineation of the volcanic base (2.2) with a semi-automated approach, using the 3°slope contour line, the extraction of geomorphometrical parameters (2.3) and finally, the calculation of the deviation of the two datasets (2.4).
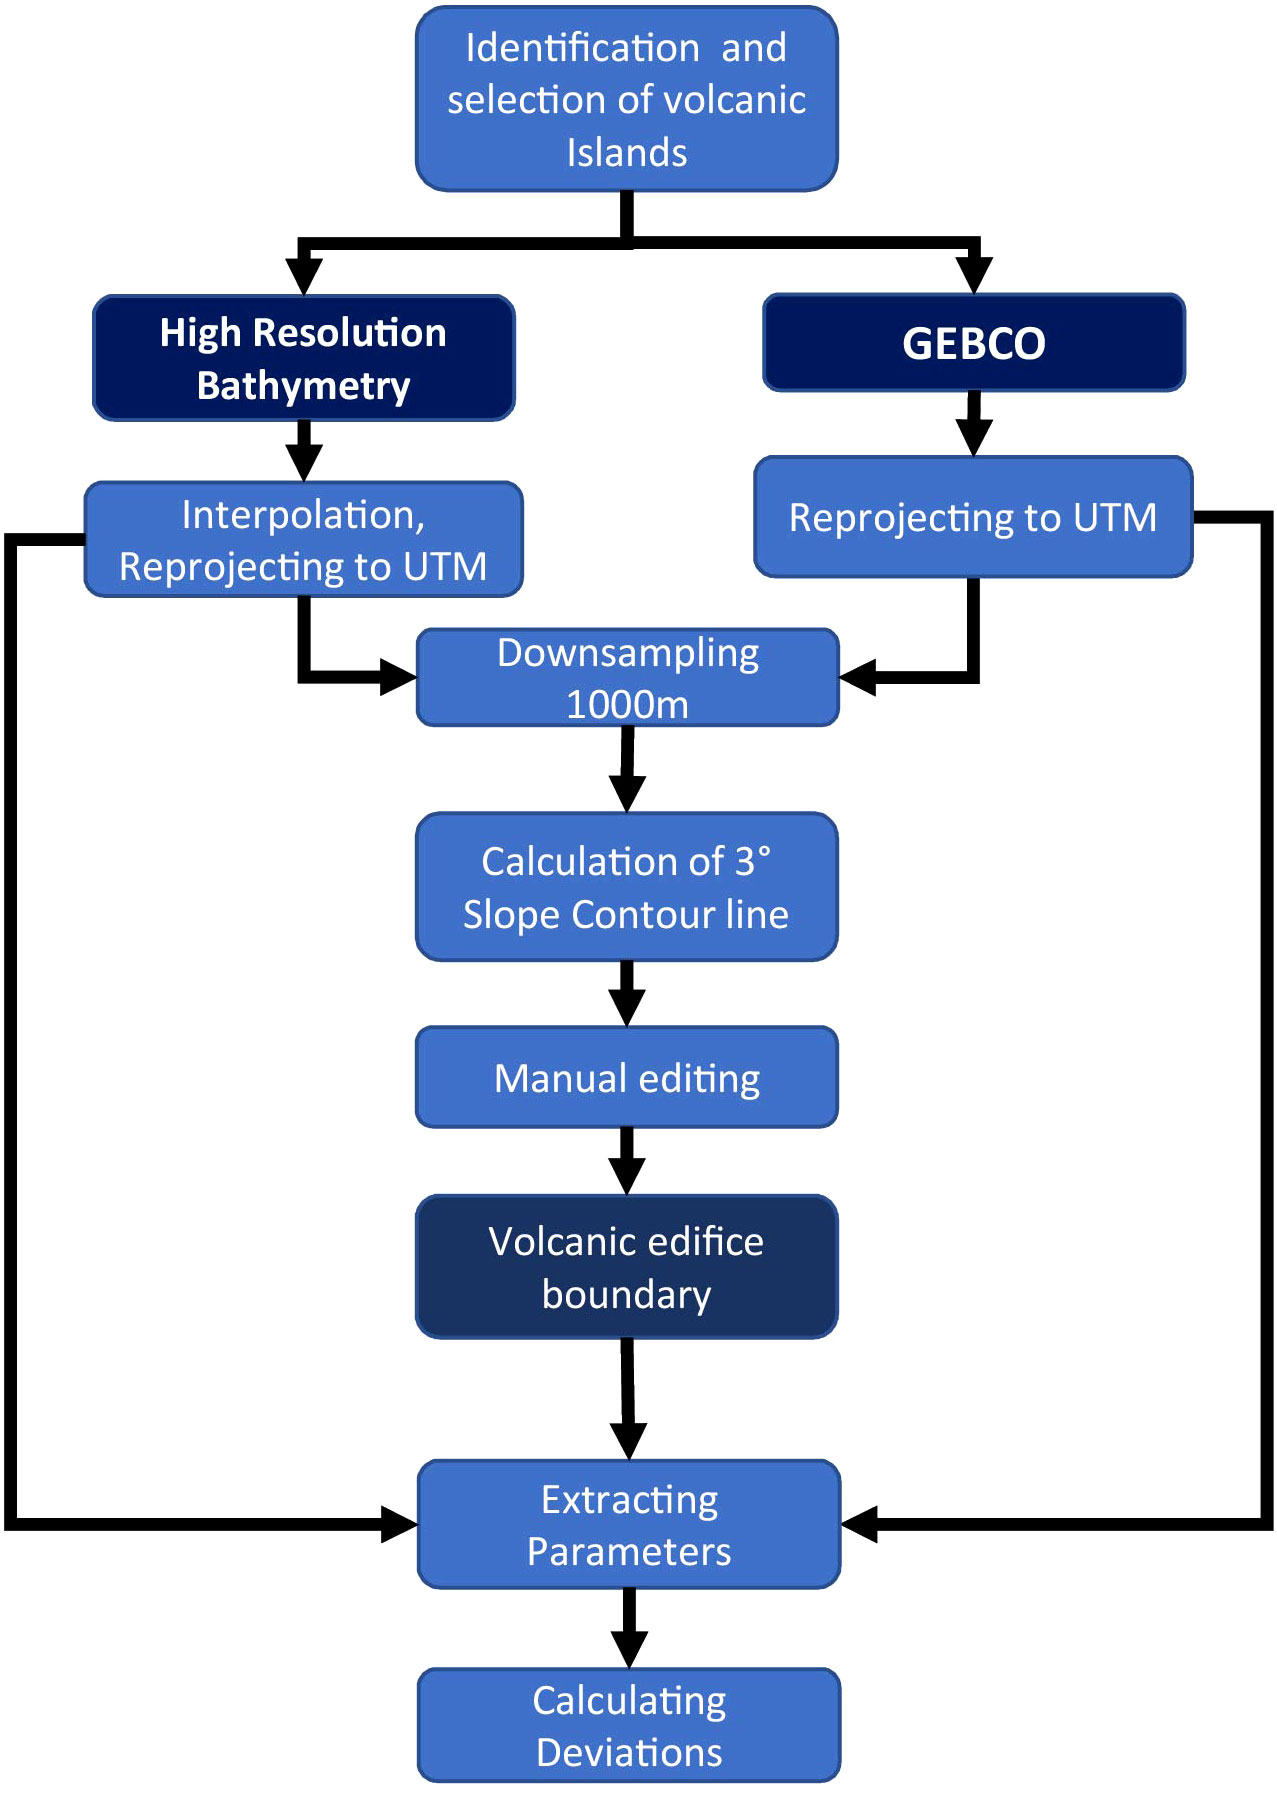
Figure 2 Schematic flow chart of necessary steps to extract and compare morphometric parameters from the DEM.
2.1 Data compilation and preparation
Out of the 2652 Holocene and Pleistocene volcanoes in the Global Volcanism Program (2023) Database, we identified 370 edifices as volcanic islands. In this study, we investigated 47 of these in three groups.
Group A consisted of 26 volcanic islands in 4 archipelagos (Aeolian Islands, Canary Islands, Hawaii, and South Sandwich Islands) that were almost completely covered by high-resolution bathymetry data (Table 1). The only unmapped part in the archipelagos of Group A was the coastal white ribbon, which has proven to be a major challenge to investigate (Weymer et al., 2022). The islands were chosen for their high data coverage, as well as for representing a variety of volcanic island types and sizes. The ship-based high-resolution bathymetry for the Aeolian Islands, the Canaries, and Hawaii were downloaded from the online platform of the Global Multi-Resolution Topography (GMRT) (Ryan et al., 2009), at the highest available resolution, which was between 120m and 240m grid cell size. Besides this global compilation, several regional platforms such as EMODnet (Europe) or JAMSTEC (Japan) as well as bigger more general platforms such as PANGAEA provide bathymetric data. We chose to use only the high-resolution data (masked) and interpolated the coastal white ribbon for these datasets. The data from the South Sandwich Islands was provided by Fretwell (2015). This is a data compilation (200m resolution) of various sources, including GEBCO and, below 60°South, the International Bathymetric Chart of the Southern Ocean (IBCSO), where direct measurements were not available.
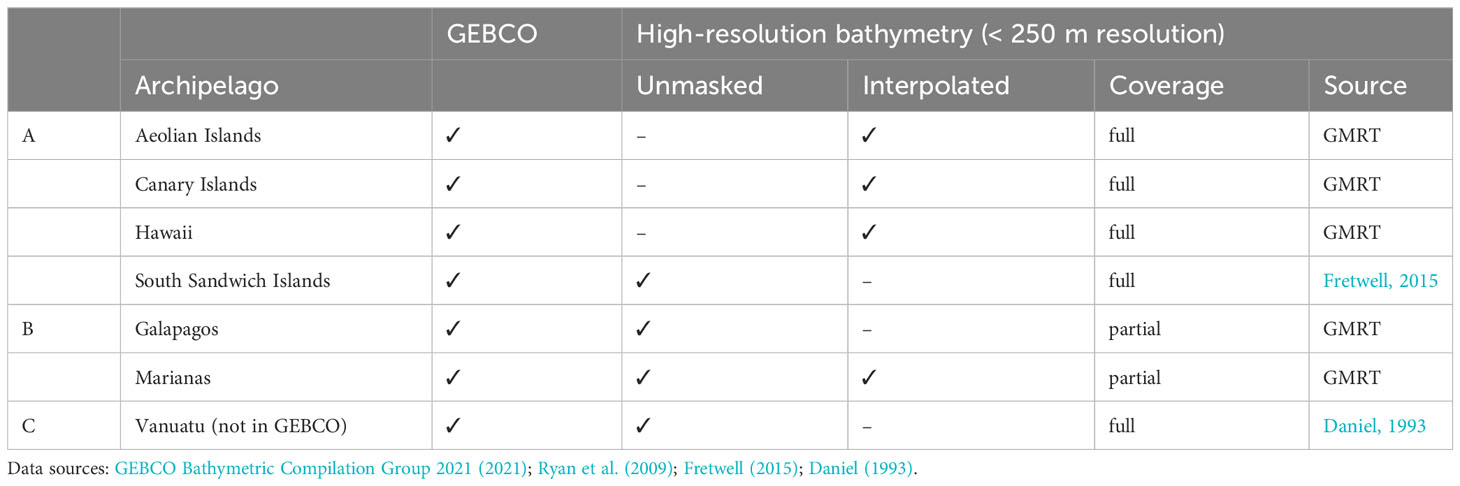
Table 1 Overview of compiled datasets; The data is separated in three groups (A, B, C).
In addition, we investigated 18 volcanic islands from the Marianas and the Galapagos Islands, which form group B. The islands of these archipelagos were only partly covered with high-resolution bathymetry. To study the effect straightforward interpolation has on the geomorphological parameters we investigated, compared to using GEBCO in data gaps (unmasked), we used both versions (unmasked and interpolated) grids of the Marianas. These, along with the unmasked bathymetry of the Galapagos Islands, were also downloaded from GMRT.
The GEBCO grid is a combination of direct measurements and indirect measurements such as predicted bathymetry from satellite altimetry (Weatherall et al., 2015; Tozer et al., 2019). For the volcanic islands of Group A and B, a major part of the grid covering the islands is based on direct measurements. To isolate the difference between indirect measurements and ship-based high-resolution bathymetry, three volcanic islands from Vanuatu (Group C) were included. The high-resolution bathymetry was provided by Daniel (1993) for these islands, however, the GEBCO grid in the same area is based on indirect measurements only.
2.2 Volcanic base delineation
Several automatic algorithms for the delineation of volcanic edifice outlines have been published with the intent to decrease the time and subjectivity a manual delineation is subject to, such as the Matlab-based program MBOA (Bohnenstiehl et al., 2012) or the ENVI IDL-based NetVolc (Euillades et al., 2013). Nevertheless, manual delineation is often less time-consuming and less sensitive to artefacts in the DEM. Thus, morphometric studies of volcanic edifices are often performed with manual delineations. In an attempt to decrease the subjectivity of this critical step, we modified a semi-automated approach by Van Wees et al. (2021), where the 3° slope contour line is used as a starting delineation and is manually edited where necessary. To make the delineation more robust and comparable across different volcanic edifices and less sensitive to artefacts, we resampled all datasets in this study to 1000m grid cell size for the delineation. For the parameter calculation, the unaltered DEM is used. For isolated islands on a flat seafloor and good data coverage, the initial delineation did not need to be modified considerably. For the remaining islands, the three main challenges were a) islands whose edifices share a plateau and need to be delineated separately, b) undulating terrain at the volcanic base due to spreading processes or sediment waves that result in a complex wavy pattern of contour lines and c) other complex terrain at the surrounding seafloor that results in a puzzle of shorter contour lines, rather than a single closed one. Several derivatives of the DEM (hillshade, slope, aspect etc.) were used as visual guides for the manual editing. For the separation of islands, catchment delineations proved the most useful. Of the 47 volcanic islands of this study, 8 were left with minimal manual edits, for 18 the only edits were the separation of edifices, and 21 require > 50% of the outline to be edited manually.
2.3 Geomorphometric parameter extraction
Using the software QGIS and Python, we created an algorithm that is able to extract the morphometric parameters described in Table 2 and in the following section. Though the MorVolc algorithm created by Grosse et al. (2012) was unavailable to us at the time of processing, we did use a modified version of their list of geomorphometric parameters. As we were primarily interested in the shoreline-crossing and submarine characteristics of the volcanic islands, we focus on the basic size and shape and omit any information about the summit region that are important in a terrestrial environment. In addition to the parameters we extracted for the entire edifice, we looked at the subaerial and submarine parts separately. The inputs were the interpolated DEM and the edifice boundary.
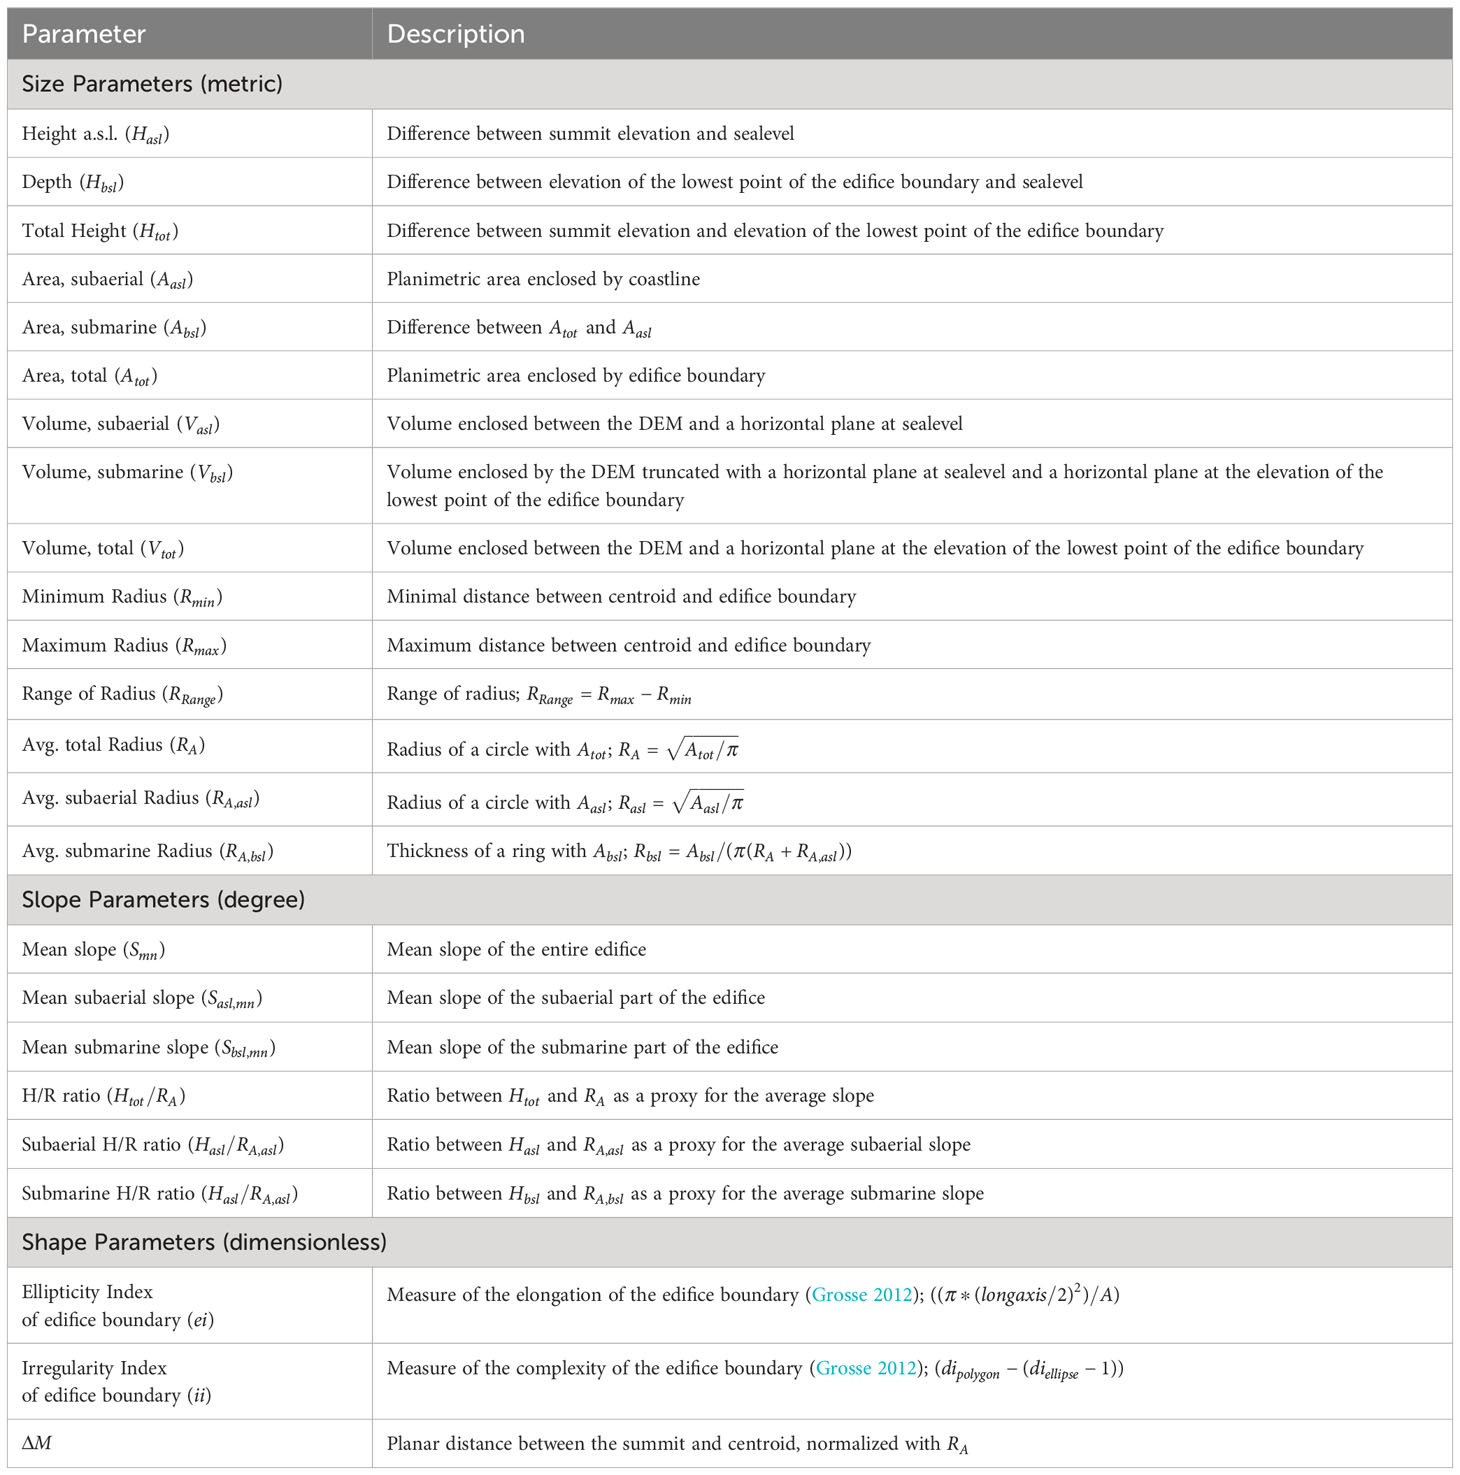
Table 2 List of geomorphometric parameters of volcanic islands.
2.3.1 Size parameters (metric)
We calculated the total height of the island (Htot) as the difference between summit elevation and elevation of the lowest point of the edifice boundary. Similarly, the height above sea level (Hasl) is the difference between summit elevation and sea level, and the depth (Hbsl) is the difference between the elevation of the lowest point of the edifice boundary and sea level. The total area of the edifice (Atot) is the planimetric area enclosed by the edifice boundary. Additionally, we calculated the area of the subaerial part of the island (Aasl) with the help of the coastline. Since available coastline vector files are often inaccurate for the relatively small islands, we used the 0m contour line of the respective DEM. Finally, the area of the submarine part of the island is the difference of (Atot) and (Aasl). The total volume of the edifice (Vtot) is the volume enclosed between the DEM and a horizontal plane at the elevation of the lowest point of the edifice boundary and the subaerial volume (Vasl) between the DEM and a horizontal plane at sea level. For the submarine volume (Vbsl) we used the difference of the total volume (Vtot) and the subaerial volume (Vasl). This is equivalent to the volume enclosed by the DEM truncated with a horizontal plane at sea level and a horizontal plane at the elevation of the lowest point of the edifice boundary.
The minimum (Rmin) and maximum radii were calculated as the shortest and longest distance of the centroid of the polygon enclosed by the edifice boundary and the vertices of the edifice boundary, respectively. Additionally, we calculated the range of the radius (RRange) as the difference between minimum radius (Rmin) and maximum radius (Rmax). While the average radius can be calculated in different ways, our calculations confirm the findings of Favalli et al. (2009) that the most robust values are achieved by using the area of the polygon. For the average radius of the entire edifice (RA) and the average subaerial radius (RA,asl) we calculated the radius of a circle with Atot and Aasl, respectively, using . The average submarine radius (RA,bsl) is not precisely a radius, but rather the thickness of a circular ring with Absl around a circle with RA,asl, using the transformed geometric formula: .
2.3.2 Slope parameters (degree)
The slope of the flanks of volcanoes plays a significant role in various processes. Here, we calculated mean values of the slope of the entire edifice (Smn), as well as the mean subaerial slope (Sasl,mn) and the mean submarine slope (Sbsl,mn) from the slope grid derived from the DEM. Slope calculations like these are usually biased by the resolution of the DEM [see Results, Shortridge (2001)]. We therefore calculated the height over radius ratio for the entire edifice (Htot/RA) as well as for the subaerial part (Hasl/RA,asl) and the submarine part (Hbsl/RA,bsl) as a proxy for the average slope, respectively. In this study, all H/R ratios were calculated in degree to be directly comparable to the other slope measurements.
2.3.3 Shape parameters (dimensionless)
ΔM is the planar distance between the summit (highest point in the DEM) and the centroid of the polygon enclosed by the edifice boundary. It was then normalized by RA to get a dimensionless parameter ranging between 0 (the points are in the same location) and 1 (the distance is equal to the average radius). The parameter gives an impression of how asymmetric a volcanic island is. Theoretically, values higher than 1 are possible, but the geomorphological scenarios would be highly unlikely and we did not observe these exceptions here.
The ellipticity (ei) and irregularity indexes (ii) are dimensionless parameters describing the shape of the edifice boundary. They were described in detail by Grosse et al. (2012) and references therein. The ellipticity index of the edifice boundary (ei) is a measure of the elongation.
Where L is the long axis of the polygon enclosed by the edifice boundary and A is its area. It yields values of 1 for a circle and increases with increasing elongation of the edifice. The irregularity index of edifice boundary (ii) is a measure of complexity. It is based on the dissection index di, which describes the relationship between the perimeter of a contour and the area enclosed by it, which was modified by Grosse et al. (2012).
Where A is the area enclosed by the edifice boundary with a perimeter of P. However, di still contains ellipticity, which the irregularity index ii was designed to separate, in order to have a measure of pure irregularity:
Where diellipse is the di of an ellipse with a eiellipse = eicontour. The result is a dimensionless parameter equal to 1 for ellipses and circles. It increases with increasing irregularity of the edifice boundary.
2.4 Calculating deviations
The previous steps were taken separately for each dataset mentioned in Table 1, resulting in a vector file for each volcanic island and DEM. The results were summarized in *.csv files and further processed in Python. We then calculated the deviation (D) of the results of the parameter extraction using GEBCO for both steps (G) from those of the high-resolution data (B) in percent:
D is negative when GEBCO underestimates values compared to the high-resolution bathymetry, and positive when overestimating. Additionally, we produced a table of parameters using the GEBCO DEM with the delineation derived from the high-resolution bathymetry (C). This enabled us to calculate the deviations of the results produced by the difference of the edifice boundary and the DEM used in parameter extraction separately, using the following equations:
In addition to the comparison of the parameters, we calculated the Jaccard Index (aka Tanimoto Index), a measure of the similarity of sample sets in statistics, or in this case, polygons. This will yield information about how different the edifice boundary is, depending on which DEM was used for the delineation. The index is the ratio of Intersection and Union of the polygons enclosed by the edifice boundaries resulting from the delineations with both DEMs, respectively:
Where G and C are the polygons enclosed by the edifice boundaries produced with GEBCO and high resolution bathymetry, respectively. This results in an index ranging from 0 (no overlap) to 1 (perfect overlap).
3 Results
3.1 Parameter statistics
Figure 3 shows an overview of the parameters calculated from high-resolution bathymetry data for all three data groups investigated. In the figure, the x-axis follows a non-linear sorting of the volcanic islands descending by total height Htot for all subplots.
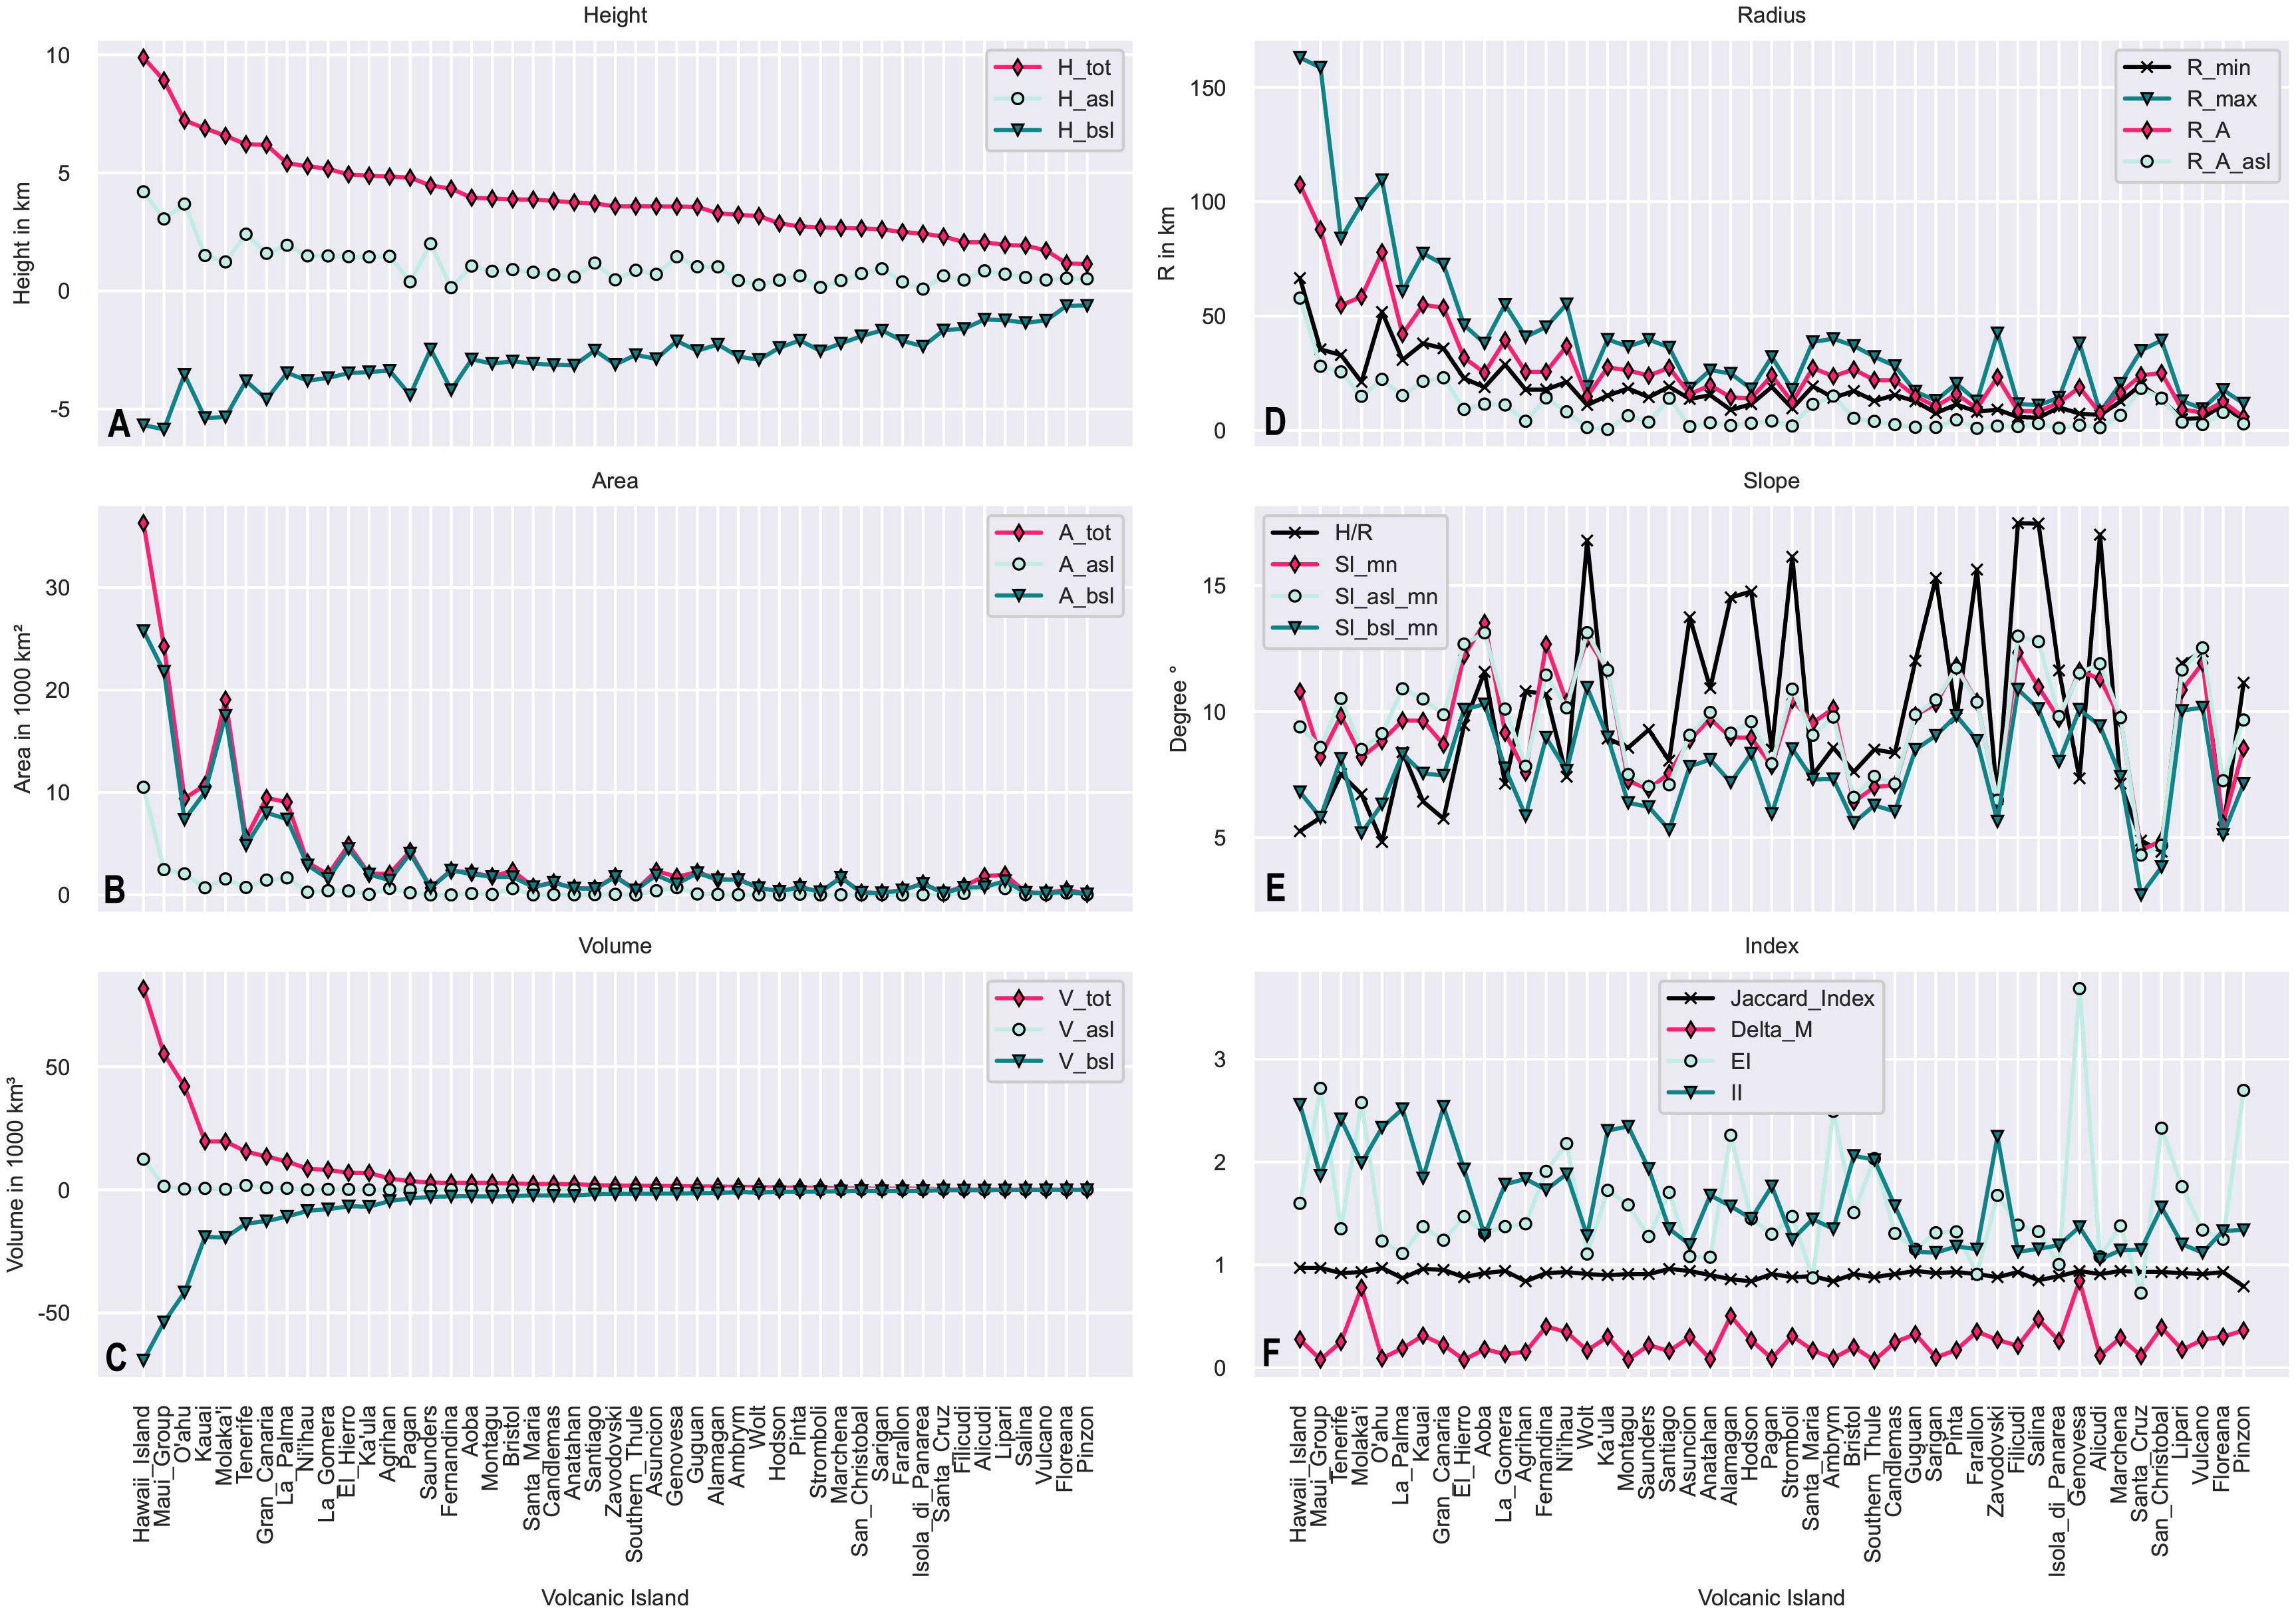
Figure 3 Distributions of (A) Height, (B) Area, (C) Volume, (D) Radii, (E) slope parameters and (F) shape parameters plus Jaccard Index. The x-axes are volcanic islands sorted descending by Htot.
Our study covers a great range of sizes of volcanic islands from Genovesa (Galapagos), with 78m the smallest island by elevation above sea level to the great Hawaiian Islands which reach more than 4000m a.s.l. (Figure 3A). There is a trend of volcanic islands with higher elevation above sea level also reaching into lower depths (-623m, Floreana, Galapagos; -5864m Maui edifice group, Hawaii), resulting in total heights from 1138m (Pinzon, Galapagos) to 9878m (Hawaii main Islands, Hawaii) from the seafloor to the summit. The distribution of the area is shown in Figure 3B. The area above sea level mostly ranges from 0.5km² (Ka’ula, Hawaii) to 2468km² (Maui edifice group, Hawaii), with Hawaii Island being the exception with 10500km². The area below sea level Absl contributes between 79km² (Pinzon, Galapagos) and 25780km² (Hawaii Island, Hawaii), resulting in total areas between 104.8km² (Pinzon, Galapagos) and 36289km² (Hawaii Island, Hawaii).
In Figure 3C the distribution of the volume of the islands is shown. Vasl ranges from 0.2km³ (Ka’ula, Hawaii) to 12000km³ (Hawaii Island, Hawaii) and Vbsl from 25km³ (Pinzon, Galapagos) to 69000km³ (Hawaii Island). This results in total edifice volumes (Vtot) from 29km³ (Pinzon, Galapagos) up to 81000km³ (Hawaii Island, Hawaii). Additionally, there are two bends visible in Figure 3, separating the islands into three groups by volume; those larger than Kauai (three islands from the Hawaiian archipelago), those larger than Agrihan (islands from Hawaii and the Canaries), and the remaining islands. The radius parameters are visualized in Figure 3D). The average radius of the islands calculated from the area varies from 5776m (Pinzon) to 107477m (Hawaii Island). Its values lie between those of Rmin (3932m - Pinzon, 66572m Hawaii) and Rmax (7957m - Alicudi - Aeolean; 163006m - Hawaii Island). Additionally, we calculated RA,asl producing values between 415m (Ka’ula) and 57838m (Hawaii) and Rbsl ranging from 2912m to 59844m (Maui edifice group). Some of the smaller islands show significantly larger Rmax than expected from their height, producing peaks in the graph in Figure 3D.
Figure 3E shows the distribution of several slope parameters. Unlike the parameters previously mentioned in this section, none of the slope parameters show any trend correlating with the height, the volcanic islands on the x-axis are sorted by. The average slope above sea level Slasl,mn is ranging from 4.3° (Santa Cruz, Galapagos) to 13.1° (Wolt, Galapagos). The average across all the islands of 9.6° is 2° higher than that of the average submarine slope Slbsl,mn (7.6°), which shows values between 2.7° (Santa Cruz) and 10.9° (Wolt). For the average slope of the entire edifice, Slmn ranges between 4.5° (Santa Cruz) and 13.5° (Aoba, Vanuatu). The Height over Radius ratio for the entire edifice H/R, on the other hand, shows higher values, both on average (9.9°) and in a number of high values of up to 17.5° (Filicudi, Aeolian Islands). The most shallow values are in a similar range (4.4°, San Christobal). H/Rasl and H/Rbsl (data not shown) have a similar relationship as the corresponding slope parameters. H/Rasl is ranging from 2.0° (Genovesa, Galapagos) to 28.3° (Alicudi). However, there is one island (Wolt, Galapagos) with an even higher value of 57.7°. We consider this to be an outlier with questionable accuracy. On average the ratio on land (11.6°) is 1.2° higher than the values in the submarine part (10.4°). It ranges from 5.5° (O’ahu, Hawaii) to 17.6° (Salina, Aeolian Islands).
In Figure 3F the dimensionless parameters are summarized. ΔM ranges from 0.07 (Southern Thule; South Sandwich Islands) to 0.84 (Genovesa, Galapagos) with an average of 0.25. The ellipticity index ei describes the elongation of an edifice. The majority of islands show values between 1.003 (Lipari, Aeolian), which is close to a perfectly circular edifice boundary, and 2.72 (Maui group, Hawaii). There are, however, outliers on both sides with Genovesa showing an ellipticity of 3.69 on the one hand and values below 1 for three islands, including Santa Cruz at 0.73. Values under 1 are errors since no edifice can be more circular than a circle. There is no visible trend in Figure 3F regarding ei, but unusually high values usually correlate with high values of Rmax in Figure 3D. Finally, ii is ranging from 1.05 (Alicudi, Aeolian Islands) to 2.56 (Hawaii Island) with an average of 1.63. In Figure 3F, a trend of larger islands having higher values of ii is visible. In addition to the aforementioned parameters, we calculate the Jaccard Index, which is a measure of similarity between the polygons enclosed by the edifice boundaries produced with GEBCO and the high-resolution bathymetry, respectively. It is ranging from 0.79 to 0.97 with a median of 0.91.
3.2 Deviation
Figure 4 shows the deviation of the values calculated using GEBCO from those using high-resolution data (D) as well as the influence of the delineation on the deviation (DDelineation) and the influence of the DEM (DDEM).
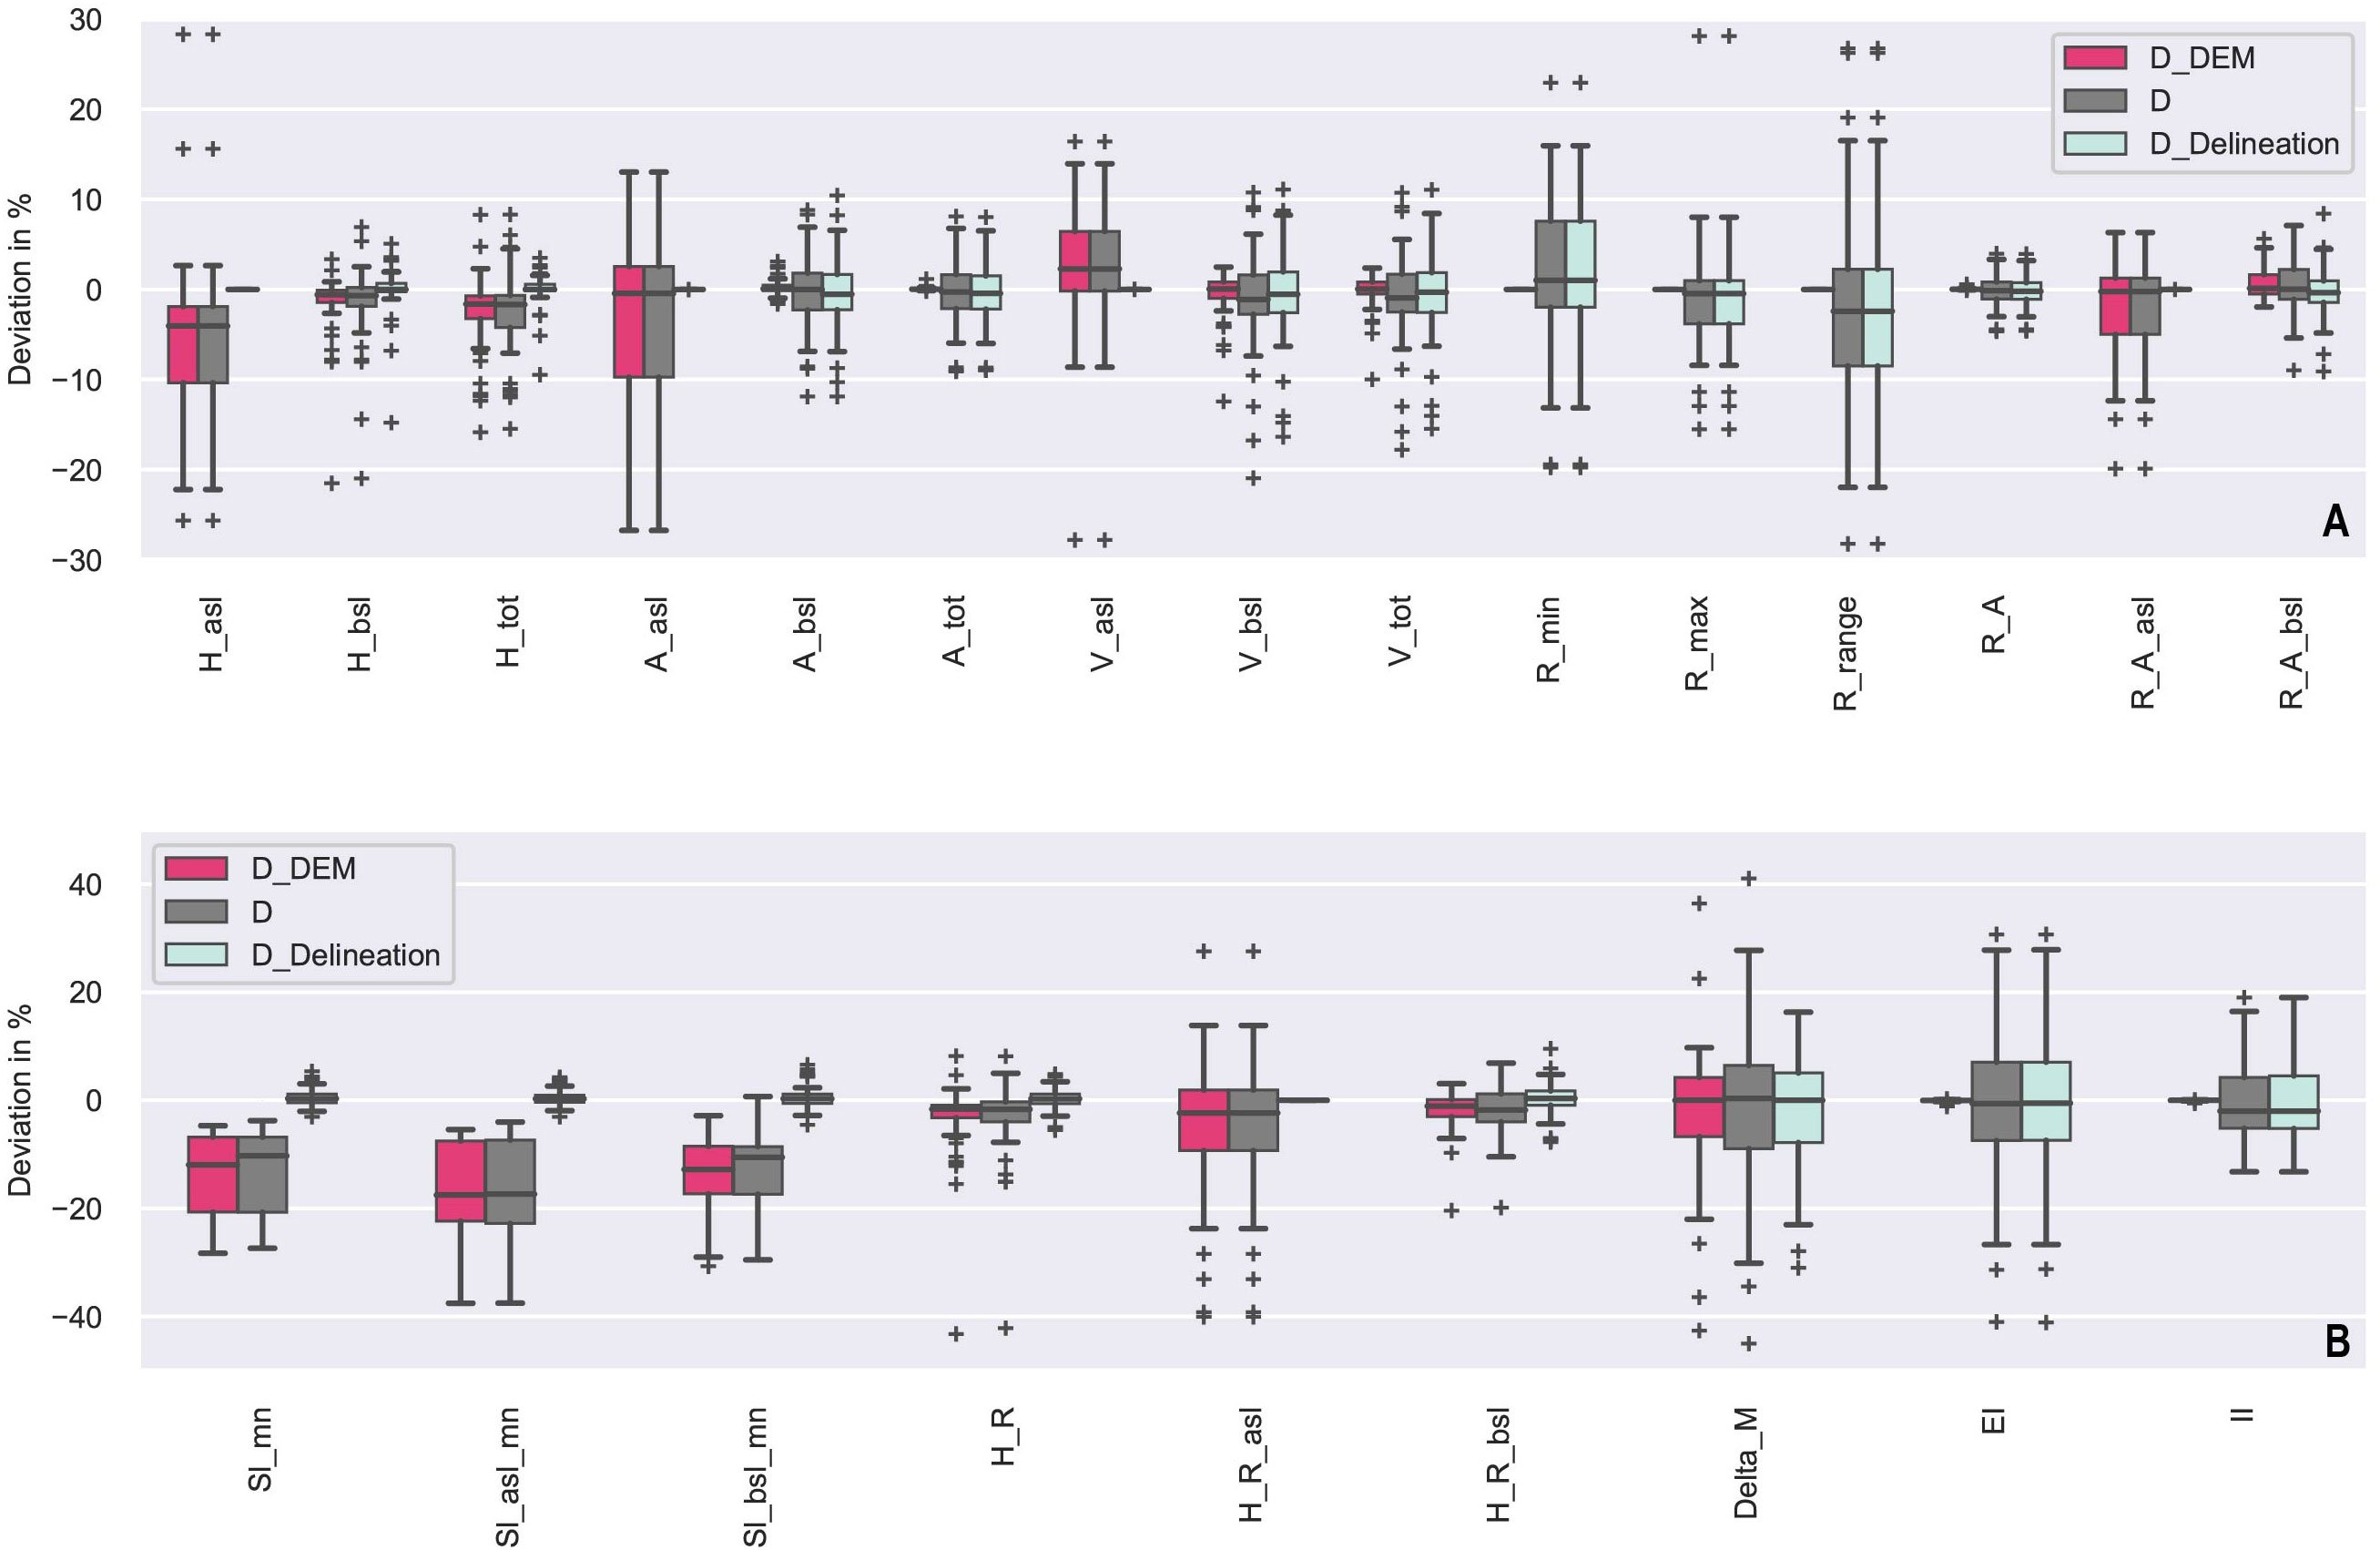
Figure 4 Deviation of (A) size parameters and (B) slope and shape parameters, derived from GEBCO D in percent (Groups A, B and C). Background data in grey, Influence of Delineation DDelineation highlighted in light blue, influence of DEM DDEM in pink.
The total volume Vtot and area Atot as well as volume Vbsl and area Absl below sea level show a median total deviation D of less than ±1% and quartiles lower than ±5%. The influence on the deviation by the delineation DDelineation shows similar values, while DDEM quartiles are below ±1% for these parameters. The total height (Htot) and the depth below sea level (Hbsl) show a slight systematic underestimation of the parameters by GEBCO, mostly visible at the shifted quartiles, rather than the median values (-1.7% and 0.7%, respectively). DDelineation is symmetric around zero, with quartiles lower than ±1% for both of these parameters, while DDEM follows the same trend as D, but with smaller quartiles. Where the outliers of the aforementioned parameters lie well within the ±30%, visualized in Figure 4A, the three parameters calculated above sea level (Hasl, Aasl, Vasl) show significantly higher values of up to ±120% deviation. These outliers are not shown in Figure 4 for reasons of better visualization. While the median deviation of Aasl is close to zero (-0.4%), the height (Hasl) is slightly underestimated (-4.1%) and the volume (Vasl) slightly overestimated (+2.3%) by the values calculated with GEBCO. Here, DDEM is identical to D, while DDelineation is zero for all three parameters.
Figure 4A also contains the results of the parameters related to the radius of the island. All of these parameters show median deviations of less than ±3% and percentiles of less than ±9%. Rmin is slightly overestimated and Rmax underestimated when using GEBCO for our calculations, mostly visible in the shifted quartiles, rather than the median values (1%, -0.5% respectively). Consequently, the range of radius Rrange has a slightly negative median deviation as well (-2.4%). For all three parameters, DDelineation is identical to D and DDEM is zero. The average radius RA shows quartiles of ±1% or less for all deviations. For RA,asl D and DDEM are identical and show quartiles of -5.0% to 1.2% with a median of -0.2% while DDelineation is zero. For RA,bsl the median deviation and quartiles are within ±2.3% with a slightly positive shift. DDEM shows a small upward and DDelineation downward shift, with minimal overall deviations of less than ±1.6%. Three outliers ±30% of Rrange are not shown in Figure 4A.
Figure 4B shows the results of slope-related parameters. Here, we find the highest systematic median deviations of our investigation with -10.3%, -17.4%, and 10.5% for the mean slope of the entire edifice (Slmn), above sea level (Slasl,mn) and below sea level (Slbsl,mn), respectively. The quartiles for all three lie between -6.8% and -22%. These values are almost identical for DDEM. The median and quartiles of DDelineation, however, remain < ± 1% for all slope-related parameters. While the height-over-radius ratios HR, HR(asl) and HR(bsl) show significantly smaller median deviations, they are still all negative with -1.7%, -2.3%, and -1.8%, respectively. For HR and HR(bsl) DDEM shows similar trends with smaller overall deviations, while it is identical to D for HR(asl). DDelineation on the other hand, is zero for HR(asl) and shows quartiles of < ± 2% around a median of almost zero. Additionally, these parameters produce stronger outliers than the slope parameters. Two outliers of HR(asl) were omitted for the creation of Figure 4B.
In Figure 4B the results of the shape parameters are shown. All three parameters show median deviations of less than 2%, and quartiles of < ± 10%. DDEM is almost zero for both the ellipticity (ei) and irregularity index (ii), while DDelineation is almost identical to D. They show a median deviation of -0.6% and -1.9% as well as quartiles of -7.5%, 7.1% and 5.1%, 4.2%, respectively. The parameter ei produced a single outlier of 133% that was omitted in Figure 4B). ΔM, the distance between centroid and summit shows median deviations of ±0.3%, and quartiles of -8.9% and 6.5% as well as many outliers, several of which were higher than 50% and were thus not shown in Figure 4B. DDEM and DDelineation follow similar trends but with lower overall deviations.
In summary, 20 out of 24 parameters show < ± 2.5% median deviation, and quartiles < ± 10%. Only the slope parameters (Slmn, Slasl,mn, Slbsl,mn) and Hasl have systematic deviations greater than that.
4 Discussion
4.1 Parameters
The graph of the size parameters in Figures 3A–D follows the trend of the “law of high numbers” or “law of large events” (Verma et al., 2006) where large-scale events, or in this case large volcanic islands are less common than small volcanic islands. This is especially evident in Figure 3C, depicting the volume, where we observe the two bends in the graphs. This confirms that the chosen sample of volcanic islands is indeed representative. Figure 3E illustrates how the ratio of height over radius shows higher peaks and a higher average value than the equivalent slope parameter derived directly from the DEM. This is likely due to the resolution dependency of slope parameters (Carrera-Hernández, 2021), which is further discussed in the following subsections. This does not necessarily mean that the H/R is more accurate, we find high outliers, such as Wolt (Galapagos) with a subaerial H/R of 57.7°. Even though Wolt is known for extremely steep slopes (Mouginis-Mark et al., 1996), this proxy for the average slope exceeds the values commonly found for the steepest parts of the island. We therefore consider this to be an error. Figure 3F shows the dimensionless shape parameters. The irregularity index ii appears to be dependent on the size of the volcanic island. This is due to the enormous difference in the size of the edifices, being investigated with the same resolution. Larger islands such as Hawaii are represented in detail, compared to their size. Consequently, their outline will be more complex than a small island delineated with the same resolution. We also see that islands with high values of ei usually also show higher values of Rmax and ΔM, which confirms the ability of these parameters to give information about the asymmetry of a volcanic island.
4.2 Deviations
In the following section, we will repeatedly refer to parameters being underestimated or overestimated by using GEBCO. This is relative to the higher resolution ship-based bathymetry data, which in itself can be subject to artefacts or other misrepresentations of the bathymetry. It is, however, currently the most accurate data available and for the sake of this evaluation, we assume it to be the best approximation of reality. This subsection refers to the investigation of all three data groups (A, B, C), in subsection 4.3 and 4.4, we investigate Group B and Group C in more detail, respectively. Even though most of the parameters show only small deviations, there are general trends.
4.2.1 Influence of the DEM
Using GEBCO for parameter extraction leads to a slight underestimation of height parameters, but more strikingly, the slope parameters show a significant systematic error. It is known that slope values are dependent on the resolution of the grid (Shortridge, 2001) with lower resolutions resulting in lower average slope values. This also reduces the range of elevation, as rare, extreme values are smoothed out, resulting in the underestimation of elevation parameters in our analysis. Ratios of height over distance are commonly used as a more independent proxy for the slope. In our data, we find that, while H/R is significantly more robust, it is still showing negative deviations (avg. -2%). This is due to the underestimation of H, which propagates into this parameter. This shows that, while height over distance ratios are good proxies for the slope, they are not completely independent of resolution.
4.2.2 Influence of the delineation
Elevation and slope are determined by changes on the vertical axes. Thus, changes in the delineation do not have a significant impact here. Small deviations occur, which are caused by the minimal changes of elevation at the edifice boundary. On the other hand, parameters in the horizontal plane show a great dependence on the delineation and almost none on the DEM. This includes the area (Atot, Absl) and radius parameters (Rmin, Rmax, Rrange, RA) as well as the ellipticity ei and irregularity index ii. Favalli et al. (2009) find that calculating the diameter or radius from the area of the polygon is robust. Here we can confirm this, as RA shows deviations of less than ±5% including outliers. Since both grids have been down-sampled to 1000m pixel size for the edifice boundary delineation, the effect of the resolution differences between GEBCO and the high-resolution bathymetry is eliminated. Nevertheless, there is evidence in the parameters that the edifice boundary is more uniform and circular when using GEBCO. Compared to the processing with high-resolution bathymetry, the range of the radius is underestimated, because the minimal radius shows a positive deviation and the maximal radius shows a negative deviation. Apparently, using higher-resolution data results in more extreme values for the radius, while GEBCO produces edifice boundaries that are more uniform. This is also supported by the irregularity index, which is slightly lower, which means a less complex edifice boundary when using GEBCO. Additionally, a slight negative shift of the ellipticity index (0.6% median) could indicate a trend of boundaries created with GEBCO being less elliptic and more circular. As this trend is below ±1% and the distribution is otherwise random, it is impossible to say so with great certainty. This is also the case for the area parameters, which show negative deviations of less than 1%.
Of course, the delineation process itself is subject to uncertainty as well. In order to be able to quantify this better, we also calculated the Jaccard Index of the two polygons enclosed by the edifice boundaries, derived from GEBCO and the high-resolution bathymetry, respectively. We find that it ranges from 0.79 to values as high as 0.97, with an average of 0.91. These values are higher than those Van Wees et al. (2021) calculated, when evaluating the subjectivity of eight researchers while delineating the same volcanic edifices. This means that the influence of the subjectivity of an individual researcher is higher than the influence of the DEM used to delineate the edifice boundary.
4.2.3 Parameters above sea level
Since this study focuses on the evaluation of two bathymetric grids, we used the terrestrial data integrated in GEBCO and the high-resolution bathymetry. Though this is based on satellite measurements, it is down-sampled and smoothed to match the respective bathymetry data in the processing of the providing platforms. Thus parameters calculated above sea level are creating the same type of systematic deviations as the other parameters. The significantly stronger deviation in the values above sea level is likely a bias caused by the fact that the absolute values are smaller since the terrestrial part of an island is usually only a few percent of its entire volume. Hence, the percentage error is larger, even though the absolute deviations may be within the same magnitude. Additionally, the highest slope values are usually found in the subaerial part of the island, meaning that it is more susceptible to small changes. As expected, the parameters above sea level are independent of the edifice boundary delineation. They are instead calculated within polygons bound by the coastline, which is the contour line of zero elevation and thus dependent on the DEM used to calculate it. These changes are not taken into account in the calculation of DDelineation and thus appear within DDEM. This effect is evident when comparing RA, RA,asl and RA,bsl in Figure 4A. While RA is independent of the DEM, RA,asl seems to be only dependent on the DEM. Since the DEM has so little effect on RA, however, it is safe to assume that this apparent dependency is mostly caused by the differences in coastline delineation. RA,bsl is calculated for the area bounded by both the coastline and the edifice boundary and does indeed show dependencies of both in the data. Similarly, Vbsl and Vtot are mostly affected by the delineation of the edifice boundary, so Vasl is likely dependent on the delineation of the coastline.
4.2.4 Summary
The most robust parameter of our analysis is RA, followed by area, volume and height for the entire edifice and below sea level. While the parameters calculated for the terrestrial part of the island show significantly higher deviations, this can be improved by using adequate satellite data. The highest deviations were shown by the slope parameters, followed by parameters that are dependent on a single value, such as Rmin or contained parameters of the latter, such as Rrange. The most prominent example of this is the parameter showing the highest scattering ΔM. This parameter is dependent on the position of the highest point and the position of the centroid, both easily influenced by small changes in the DEM and the delineation, respectively. Overall we consider all parameters, except average slope and the parameters above sea level in their current form, to be sufficiently reliable to use with GEBCO in future investigations, depending on the nature of the scientific objective.
4.3 Partial high-resolution coverage
In our investigation, we included two archipelagos with partial high-resolution coverage: the Marianas and the Galapagos Islands. We tested the effect of using a nearest neighbour interpolation of the data gaps in the Mariana Islands compared to using the unmasked (i.e. underlain with GEBCO) version of the dataset provided by GMRT. We found random differences of about ±1%, so this does not seem to have a significant effect on the delineation or the resulting parameters. A major challenge with composite datasets, however, is the artefacts on the borders between high-resolution and background information. These cannot be avoided and are often directly visible in the GEBCO grid. They can create problems, both during the delineation, where the edifice boundary falsely follows the artefact, and during parameter extraction, where they can create distortions in the elevation and slope and thus create a bias in some parameters. Figure 5 shows a plot to compare the distribution of the parameters of the Marianas and Galapagos Islands to the other archipelagos. The Marianas do not show a significantly different distribution compared to the rest of the data, except perhaps for the slope parameters. Here, the islands of this archipelago tend to cluster slightly above the median. Since they are only partially covered with high-resolution bathymetry, the interpolated areas are more similar to GEBCO, resulting in overall lower deviations. The Galapagos islands, on the other hand, do show a slightly different picture, especially concerning the most extreme negative outliers. The Galapagos Islands were the most difficult to delineate, not only because of their partial coverage but also because they are situated in shallow water depths and edifices tend to overlap underwater. They contained one of the smaller islands of the study, Wolt, which is responsible for the negative outliers of about -100% in Figure 5. This raises the question of whether there is a size threshold for volcanic islands to be investigated with GEBCO. We are unable to define a clear threshold because too many factors besides the size of the island (proximity to other islands, undulating terrain, artefacts, the morphology of the edifice) influence the success of the automatic part of the delineation.
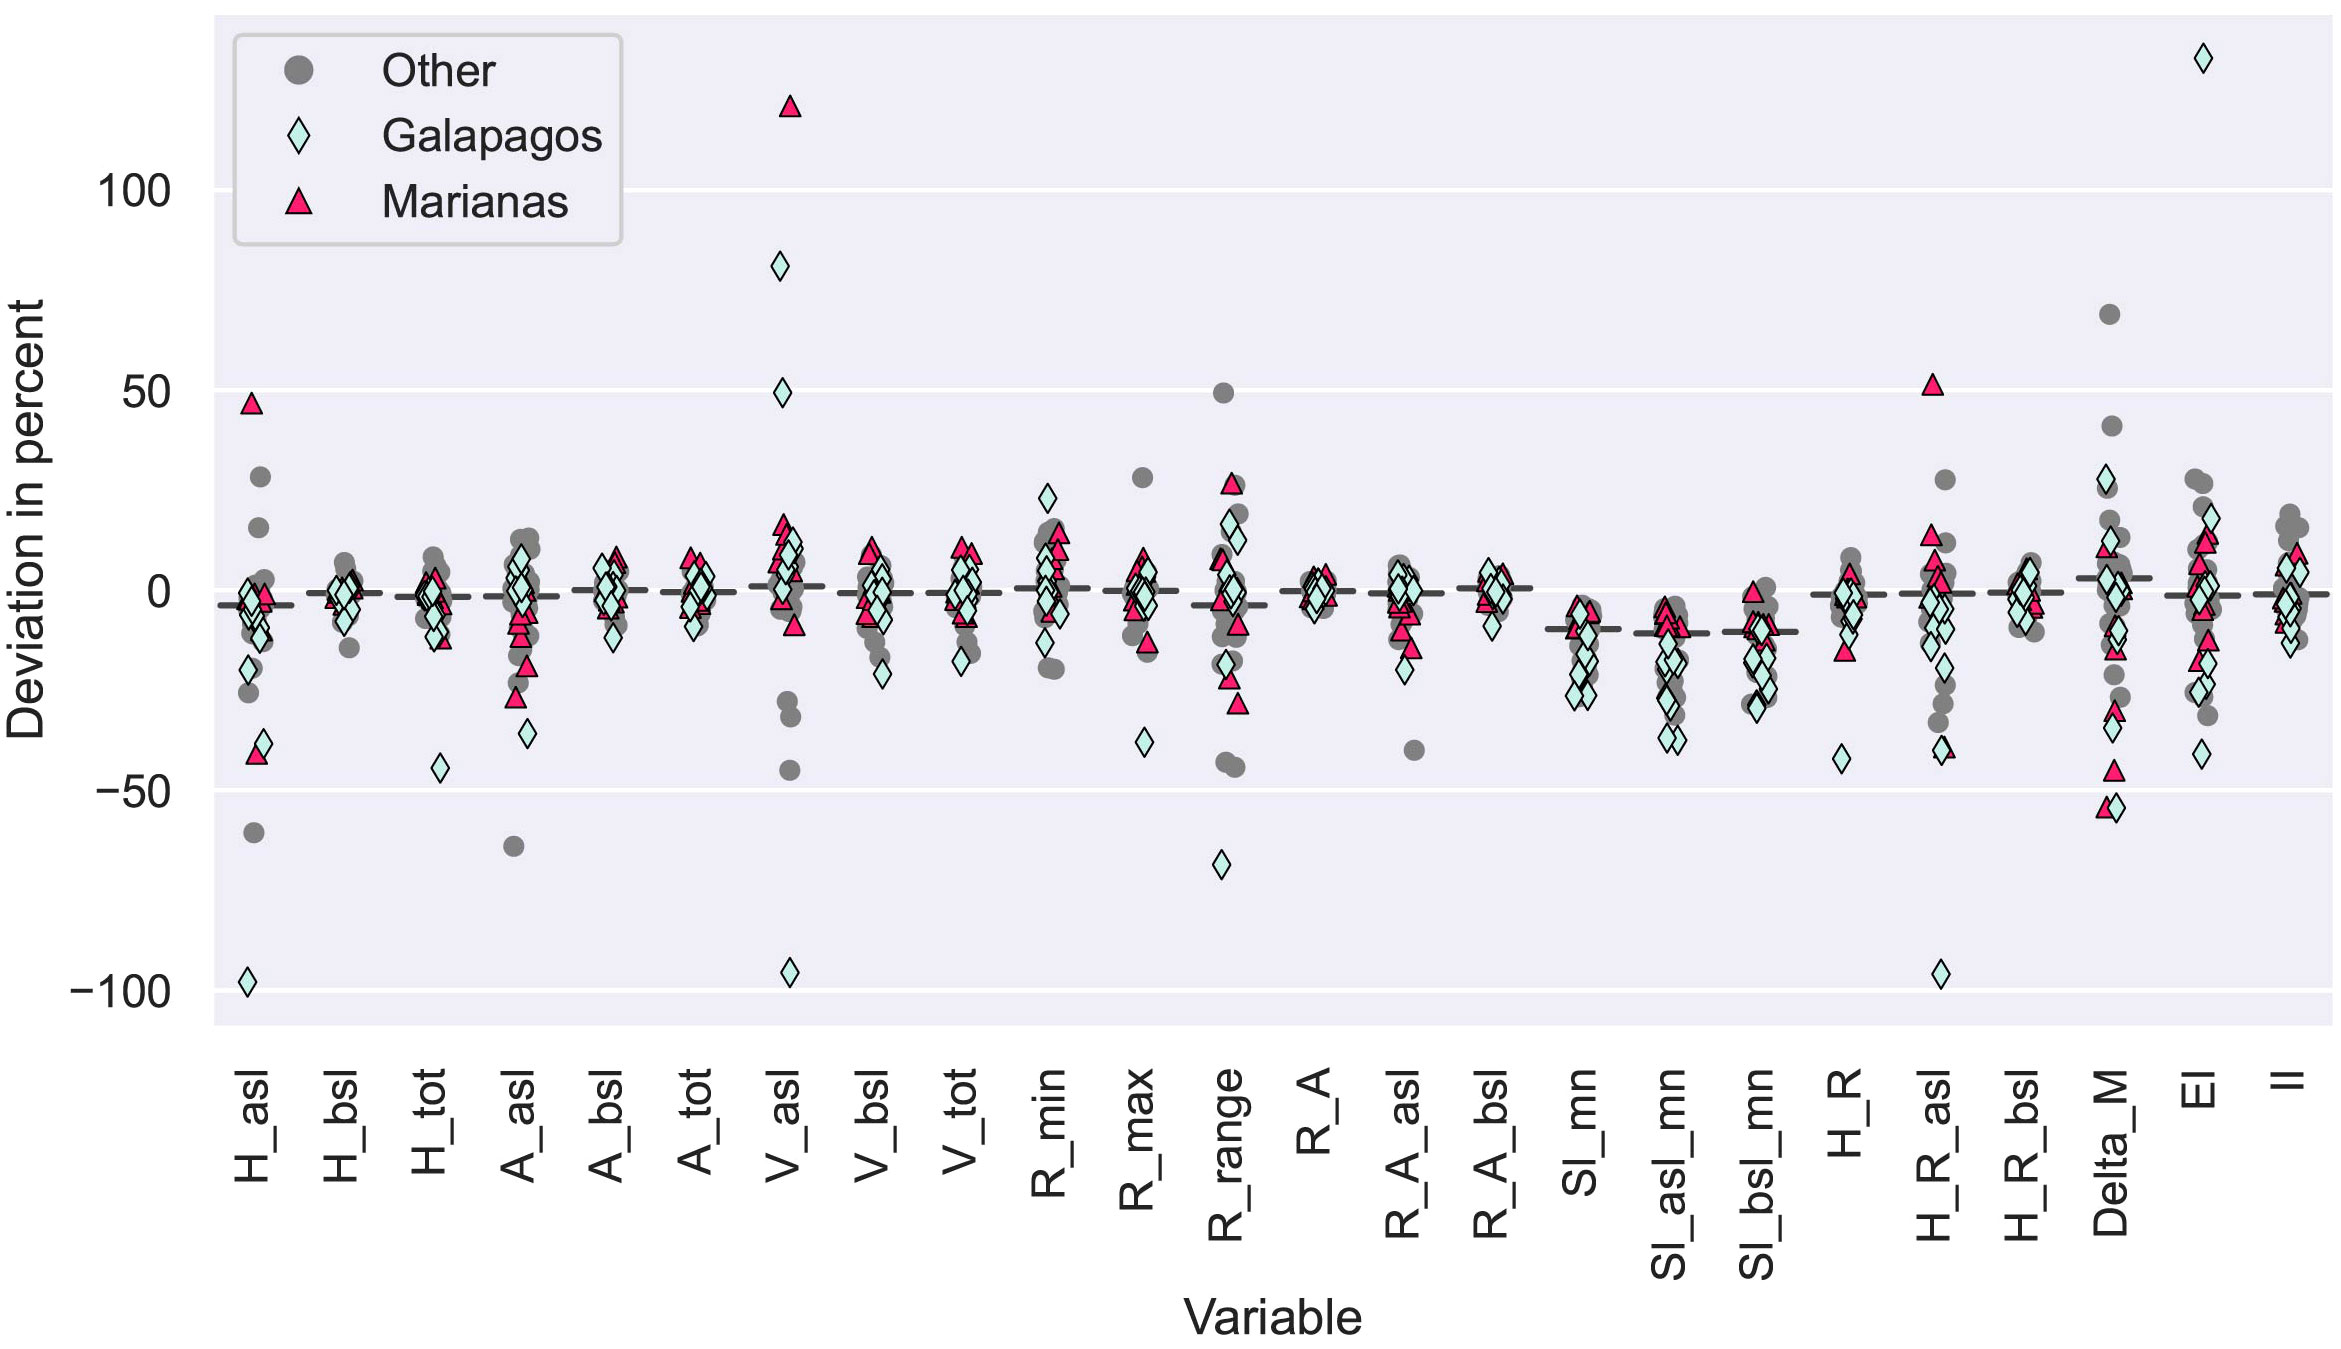
Figure 5 Difference of deviation of parameters D between Group A in grey and Group B. Marianas highlighted as pink triangles are in the same range as Group A, Galapagos shown as lightblue diamonds show some more negative outliers.
4.4 No high-resolution coverage
In addition to the two archipelagos with partial high-resolution coverage, we included three examples from Vanuatu. The high-resolution data from Daniel (1993) for these three islands is not freely available and not included in GEBCO. Figure 6 shows a strip plot in which these three islands are highlighted in pink. Though a sample of three is admittedly small, there appears to be no significant systematic error except for the slope parameters, which show a clustering below the median. This is likely the effect of the indirect satellite measurements, which form the base of GEBCO here, already being smoother compared to those areas where high-resolution bathymetry is incorporated in GEBCO. This data is then additionally smoothed during the processing of GEBCO, increasing the difference in slope between the high-resolution data and the satellite-based GEBCO. We, therefore, conclude that even though our dataset mostly consists of volcanic islands covered by bathymetry created from direct measurements, our findings will be applicable to areas where this is not the case.
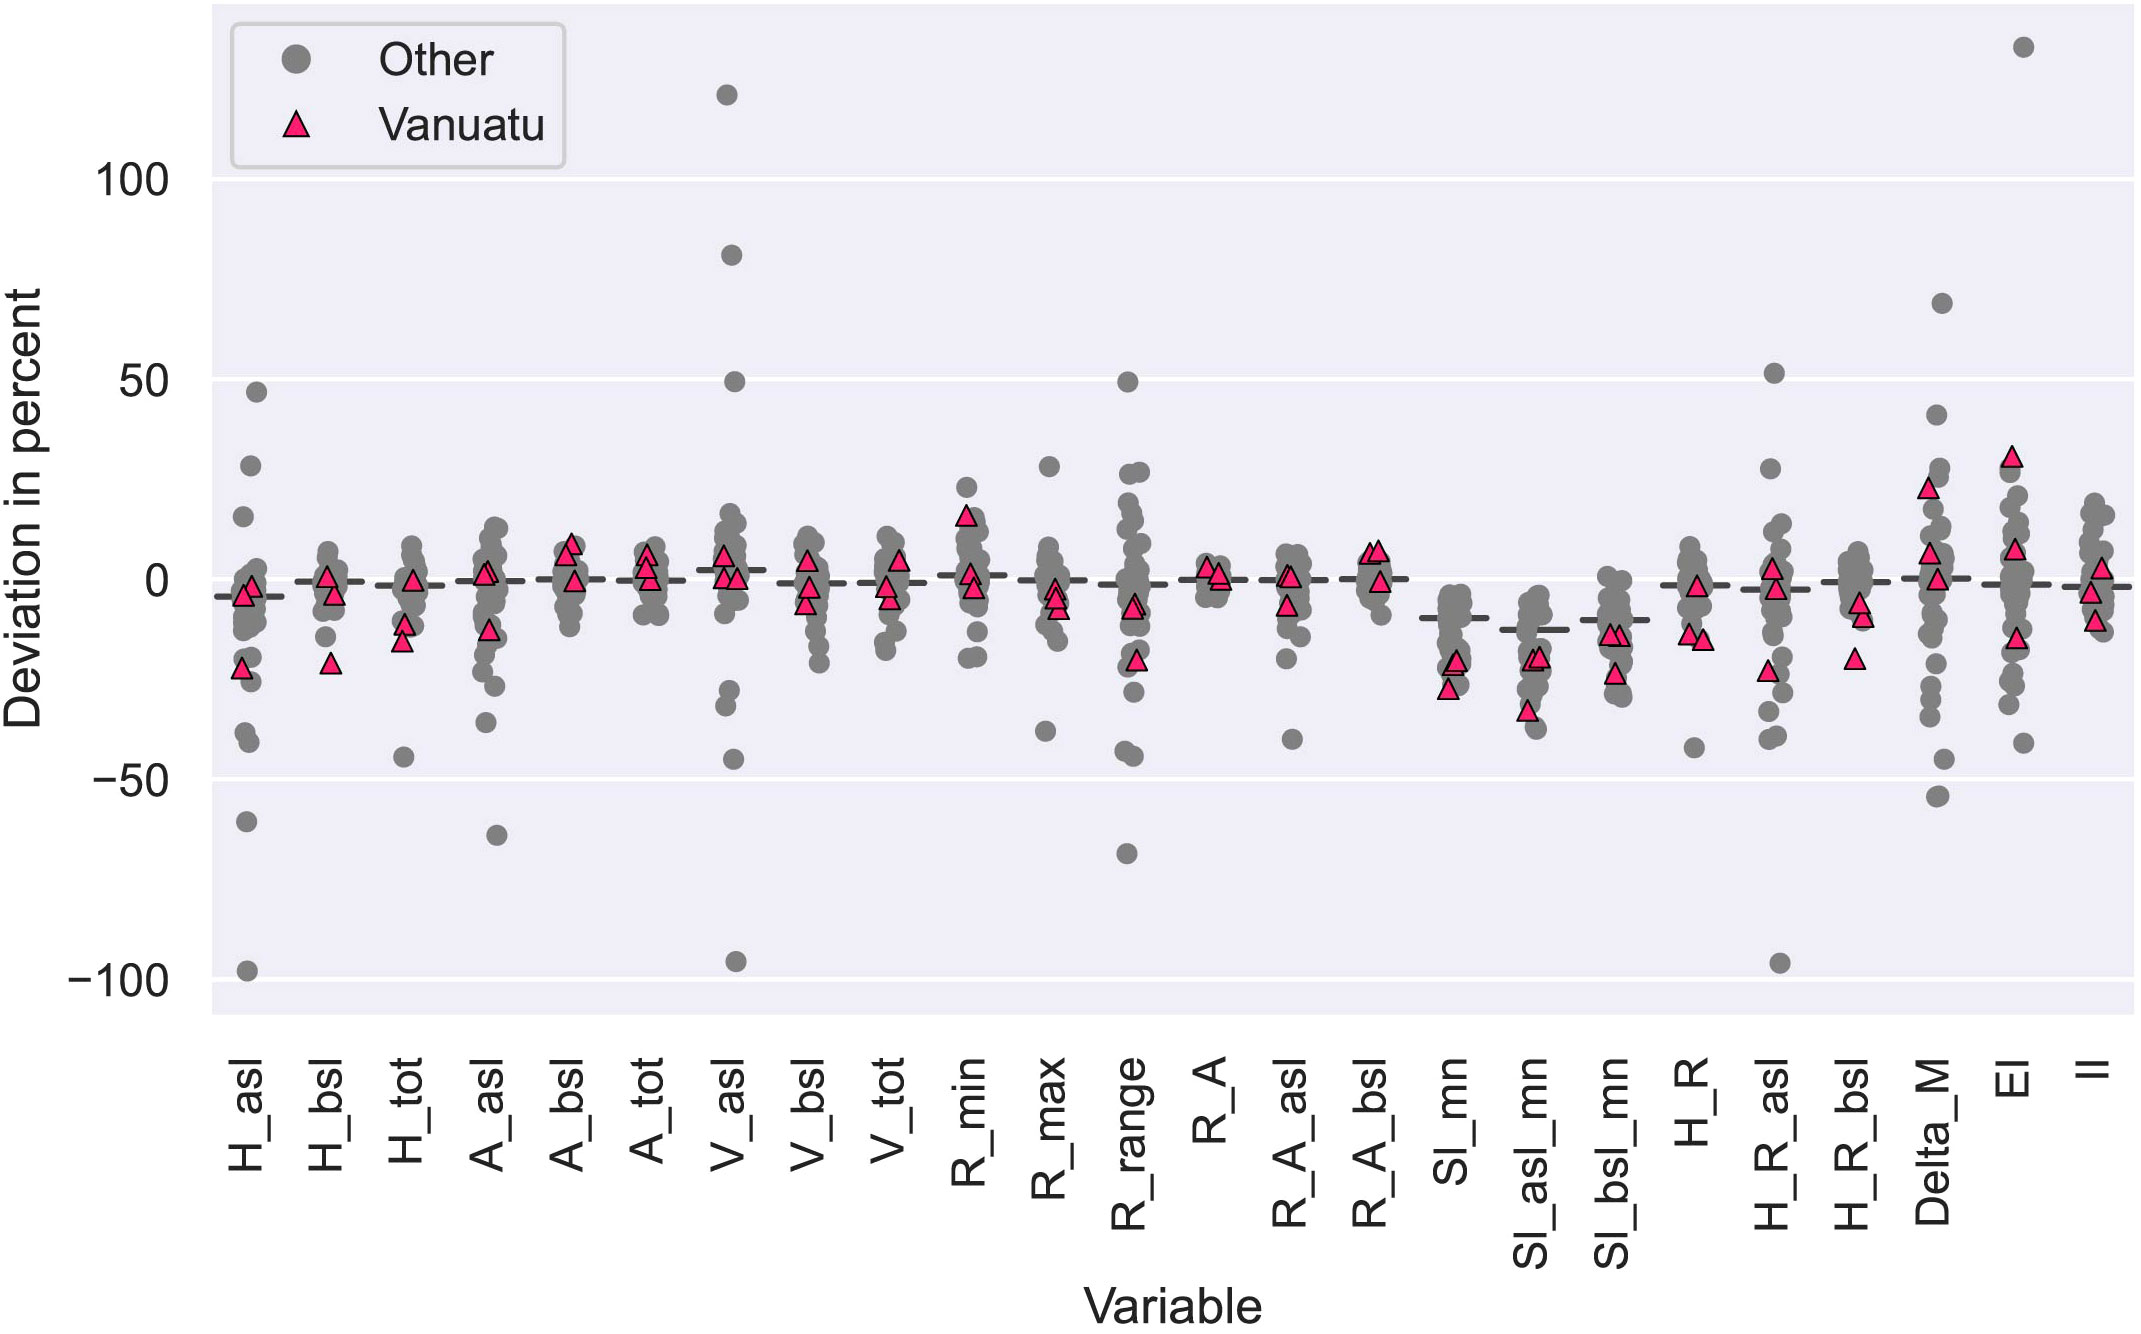
Figure 6 Difference of deviation of parameters D between Group A and B in grey and Group C (Vanuatu). The three islands from Vanuatu (pink triangles) fall within the same range as A and B.
5 Conclusion
When using bathymetric data of volcanic islands in geomorphometrical studies, a few guidelines are recommendable: It is crucial to be aware that the lower resolution, as well as the deliberate smoothing of the data in processing steps of the GEBCO data, leads to a significant underestimation of slope-related characteristics. Using proxies such as the H/R is only more robust if the Htot of the edifice is not underestimated by the same effect. Even though high-resolution satellite data is incorporated into GEBCO and GMRT onshore, it is smoothed and re-sampled to a lower resolution. These steps lead to a loss of detail and accuracy. We, therefore, recommend using available satellite data on terrestrial parts of the island, even though the handling of multi-resolution datasets introduces additional challenges.
With the knowledge gained during this study, we will be able to expand our investigations into areas where only GEBCO data is available. The attempt of Zorn et al. (2022) to find potentially tsunamigenic volcanoes in Indonesia, by creating a ranking system based on globally available datasets, for example, can potentially be improved with additional information below the sea level. With an extensive database, a probabilistic volcanic hazard approach, similar to the methods of Bertin et al. (2022) will become possible.
The application of our methods to other marine geomorphologies are possible. While similar investigations for seamounts have been made (Etnoyer, 2005; Gevorgian et al., 2023) investigations of smaller features such as coral reefs and other habitats will rely on bathymetric measurements by ship or autonomous vehicles for the time being. Larger-scale morphologies such as tectonic features (horst and graben structures, trenches and basins) can be investigated with DEMs reliant on indirect measurements. A systematic investigation of continental margins regarding their morphology is an additional possible application.
The availability and quality of bathymetric data is constantly improving. Additional shipborne bathymetry is constantly being collected and added to the GEBCO grid, which is updated annually. Several satellite missions with altimeters on board are currently collecting data (Tozer et al., 2019), improving regions of uncharted seafloor that rely on predicted bathymetry derived from satellite altimetry data. Once these datasets are available, the resolution of the predicted bathymetry is expected to improve and GEBCO will release a new generation of the grid at a higher overall resolution. Simultaneously, a new method of predicted bathymetry is under development (SYNBATH) that statistically corrects the altimetry data to yield more realistic topography (Sandwell et al., 2022).
Data availability statement
The bathymetric data used in this study is available at GEBCO (GEBCO Compilation Group, 2021), (https://www.gebco.net/) and GMRT, (Ryan et al., 2009) (https://www.gmrt.org/) respectively, with the exception of the South Sandwich Islands, which was provided by Fretwell (2015) and Vanuatu, provided by Daniel (1993) which are not openly available. Please contact the authors of the data directly. The database generated and analysed for this study can be downloaded from Zenodo.org: https://doi.org/10.5281/zenodo.8356264.
Author contributions
EK: Data curation, Formal Analysis, Investigation, Visualization, Writing – original draft, Writing – review & editing. EH: Data curation, Investigation, Writing – review & editing. SK: Supervision, Writing – review & editing. MU: Conceptualization, Funding acquisition, Project administration, Supervision, Writing – review & editing.
Funding
The author(s) declare financial support was received for the research, authorship, and/or publication of this article. The PRE-COLLAPSE project has received funding from the European Research Council (ERC) under the European Union’s Horizon 2020 research and innovation program (grant agreement No. 948797).
Acknowledgments
We would like to thank the members of the Pre-collapse team, as well as Anna Jegen and Felix Gross for their support. Many thanks to Marian and Hannelore Klein for language proofreading.
Conflict of interest
The authors declare that the research was conducted in the absence of any commercial or financial relationships that could be construed as a potential conflict of interest.
Publisher’s note
All claims expressed in this article are solely those of the authors and do not necessarily represent those of their affiliated organizations, or those of the publisher, the editors and the reviewers. Any product that may be evaluated in this article, or claim that may be made by its manufacturer, is not guaranteed or endorsed by the publisher.
Supplementary material
The Supplementary Material for this article can be found online at: https://www.frontiersin.org/articles/10.3389/fmars.2023.1259262/full#supplementary-material
References
Bertin D., Lindsay J. M., Cronin S. J., De Silva S. L., Connor C. B., Caffe P. J., et al. (2022). Probabilistic volcanic hazard assessment of the 22.5–28°S segment of the central volcanic zone of the andes. Front. Earth Sci. 10. doi: 10.3389/feart.2022.875439
Bohnenstiehl D. R., Howell J. K., White S. M., Hey R. N. (2012). A modified basal outlining algorithm for identifying topographic highs from gridded elevation data, Part 1: Motivation and methods. Comput. Geosciences 49, 308–314. doi: 10.1016/j.cageo.2012.04.023
Carrera-Hernández J. (2021). Not all DEMs are equal: An evaluation of six globally available 30 m resolution DEMs with geodetic benchmarks and LiDAR in Mexico. Remote Sens. Environ. 261, 112474. doi: 10.1016/j.rse.2021.112474
Etnoyer P. (2005). Seamount resolution in satellite-derived bathymetry. Geochemistry Geophysics Geosystems 6, Q03004. doi: 10.1029/2004GC000833
Euillades L. D., Grosse P., Euillades P. A. (2013). NETVOLC: An algorithm for automatic delimitation of volcano edifice boundaries using DEMs. Comput. Geosciences 56, 151–160. doi: 10.1016/j.cageo.2013.03.011
Favalli M., Karátson D., Mazzarini F., Pareschi M. T., Boschi E. (2009). Morphometry of scoria cones located on a volcano flank: A case study from Mt. Etna (Italy), based on high-resolution LiDAR data. J. Volcanology Geothermal Res. 186, 320–330. doi: 10.1016/j.jvolgeores.2009.07.011
Fretwell P. T. (2015). A bathymetric and topographic compilation of the South Sandwich Island Volcanic Arc, V1. (Version None) [Data set] (Cambridge, CB3 0ET, UK: Polar Data Centre; British Antarctic Survey, Natural Environment Research Council). doi: 10.5285/B8143952-421C-4544-8437-58F339253D30
GEBCO Compilation Group. (2021). The GEBCO 2021 Grid - a continuous terrain model of the global oceans and land. doi: 10.5285/C6612CBE-50B3-0CFF-E053-6C86ABC09F8F
Gevorgian J., Sandwell D. T., Yu Y., Kim S.-S., Wessel P. (2023). Global distribution and morphology of small seamounts. Earth Space Sci. 10, e2022EA002331. doi: 10.1029/2022EA002331.E2022EA002331
Global Volcanism Program (2023). [Database] Volcanoes of the World (v. 4.10.0. ; 29 June 2021). Distributed by Smithsonian Institution, compiled by Venzke E. doi: 10.5479/si.GVP.VOTW5-2022.5.0
Grilli S. T., Tappin D. R., Carey S., Watt S. F. L., Ward S. N., Grilli A. R., et al. (2019). Modelling of the tsunami from the December 22, 2018 lateral collapse of Anak Krakatau volcano in the Sunda Straits, Indonesia. Sci. Rep. 9, 11946. doi: 10.1038/s41598-019-48327-6
Grosse P., van Wyk de Vries B., Euillades P. A., Kervyn M., Petrinovic I. A. (2012). Systematic morphometric characterization of volcanic edifices using digital elevation models. Geomorphology 136, 114–131. doi: 10.1016/j.geomorph.2011.06.001
Lane E. M. (2022). Atmospheric waves reinforced tsunami after Tongan eruption. Nature 609, 677–678. doi: 10.1038/d41586-022-01855-0
Mouginis-Mark P. J., Rowland S. K., Garbeil H. (1996). Slopes of Western Galapagos volcanoes from airborne interferometric radar. Geophysical Res. Lett. 23, 3767–3770. doi: 10.1029/96GL03280
National Oceanographic Centre (2023). A quarter of the ocean floor is now mapped (Southampton: National Oceanographic Centre).
Porter C., Howat I., Husby E., Noh M.-J., Khuvis S., Danish E., et al. (2022). EarthDEM Mosaics, Version 1. Harvard Dataverse, V1. doi: 10.7910/DVN/MVOWY7
Ramalho R. S., Winckler G., Madeira J., Helffrich G. R., Hipólito A., Quartau R., et al. (2015). Hazard potential of volcanic flank collapses raised by new megatsunami evidence. Sci. Adv. 1, e1500456. doi: 10.1126/sciadv.1500456
Ryan W. B. F., Carbotte S. M., Coplan J. O., O’Hara S., Melkonian A., Arko R., et al. (2009). Global multi-resolution topography synthesis: GLOBAL MULTI-RESOLUTION TOPOGRAPHY SYNTHESIS. Geochemistry Geophysics Geosystems 10, n/a–n/a. doi: 10.1029/2008GC002332
Sandwell D. T., Goff J. A., Gevorgian J., Harper H., Kim S.-S., Yu Y., et al. (2022). Improved bathymetric prediction using geological information: SYNBATH. Earth Space Sci. 9, e2021EA002069. doi: 10.1029/2021EA002069
Shortridge A. (2001). “Characterizing uncertainty in digital elevation models,” in Spatial Uncertainty in Ecology. Eds. Hunsaker C. T., Goodchild M. F., Friedl M. A., Case T. J. (New York, NY: Springer New York), 238–257. doi: 10.1007/978-1-4613-0209-4_11
Tozer B., Sandwell D. T., Smith W. H. F., Olson C., Beale J. R., Wessel P. (2019). Global bathymetry and topography at 15 arc sec: SRTM15+. Earth Space Sci. 6, 1847–1864. doi: 10.1029/2019EA000658
Van Wees R., Tournigand P.-Y., O’Hara D., Grosse P., Kereszturi G., Campforts B., et al. (2021). The role of erosion in the morphometry of composite volcanoes. EGU General Assembly 2021, EGU21-14500. doi: 10.5194/egusphere-egu21-14500
Verma M. K., Manna S., Banerjee J., Ghosh S. (2006). Universal scaling laws for large events in driven nonequilibrium systems. Europhysics Lett. 76, 1050. doi: 10.1209/epl/i2006-10413-1
Weatherall P., Marks K. M., Jakobsson M., Schmitt T., Tani S., Arndt J. E., et al. (2015). A new digital bathymetric model of the world’s oceans. Earth Space Sci. 2, 331–345. doi: 10.1002/2015EA000107
Weymer B. A., Everett M. E., Haroon A., Jegen-Kulcsar M., Micallef A., Berndt C., et al. (2022). The coastal transition zone is an underexplored frontier in hydrology and geoscience. Commun. Earth Environ. 3, 323. doi: 10.1038/s43247-022-00655-8
Keywords: volcanic islands, lateral collapse, tsunami, multiresolution, geomorphometry
Citation: Klein E, Hadré E, Krastel S and Urlaub M (2023) An evaluation of the General Bathymetric Chart of the Ocean in shoreline-crossing geomorphometric investigations of volcanic islands. Front. Mar. Sci. 10:1259262. doi: 10.3389/fmars.2023.1259262
Received: 15 July 2023; Accepted: 21 September 2023;
Published: 26 October 2023.
Edited by:
Mariacristina Prampolini, National Research Council (CNR), ItalyReviewed by:
Daniela Ruberti, University of Campania Luigi Vanvitelli, ItalyMarzia Rovere, Institute of Marine Sciences, Italy
Copyright © 2023 Klein, Hadré, Krastel and Urlaub. This is an open-access article distributed under the terms of the Creative Commons Attribution License (CC BY). The use, distribution or reproduction in other forums is permitted, provided the original author(s) and the copyright owner(s) are credited and that the original publication in this journal is cited, in accordance with accepted academic practice. No use, distribution or reproduction is permitted which does not comply with these terms.
*Correspondence: Elisa Klein, ZWtsZWluQGdlb21hci5kZQ==