 Anfisa Berezina1*
 Svetlana Pakhomova1
 Igor Zhdanov2Olga Mekhova2,3
 Tatiana Polivanova2,4
 Matvei Novikov2,5
 Maria Pogojeva2,6,7
 Alexander Osadchiev2,8
 Natalia Stepanova2
 Evgeniy Yakushev1
- 1Oceanography Section and Water Chemistry Analysis Section, Norwegian Institute for Water Research (NIVA), Oslo, Norway
- 2Shirshov Institute of Oceanology, Russian Academy of Sciences, Moscow, Russia
- 3Institute of Earth Sciences, St. Petersburg State University, St Petersburg, Russia
- 4Faculty of Geography, Lomonosov Moscow State University, Moscow, Russia
- 5Marine Research Center of Lomonosov Moscow State University, Moscow, Russia
- 6Marine Environmental Monitoring Laboratory, N.N.Zubov’s State Oceanographic Institute, Moscow, Russia
- 7Laboratory of Integrated Research of the Arctic “Land-Shelf” System, National Research Tomsk State University, Tomsk, Russia
- 8Moscow Institute of Physics and Technology, Arctic Oceanography Laboratory, Dolgoprudny, Russia
Despite ongoing research into microplastics pollution in the Arctic Ocean, the region remains underexplored. In the Eurasian Arctic studies mainly focus on the Barents Sea, while there are only limited and variable data from few stations in the Kara Sea. The study aims to perform an extensive survey of microplastics floating on the sea surface in the Kara Sea. The sampling throughout the Kara Sea was carried out using a neuston net in the August 2021 starting from the Kara Gate strait, reaching 83N latitude and ending in the north-eastern part of the Barents Sea along the border with the Kara Sea. Average abundance of microplastics was 0.124 ± 0.383 items/m3 in the Kara Sea. The Kara Gate exhibited the highest abundance of microplastics (0.93 ± 0.73 items/m3), suggesting that it is an important source of the microplastics pollution of the Kara Sea. The results suggest that the Ob and Yenisey rivers do not substantially contribute to the microplastic pollution of the Kara Sea due to significantly lower concentrations in the river plume water (0.008 ± 0.009 items/m3) compared to the other regions of the Kara Sea. Further, the river plume differs in chemical composition of microplastics dominated by expanded polystyrene (EPS) particles (52%) in contrast to other regions where the predominant polymer is polyethylene (PE) (64-77%). The study highlights the potential of the Kara Sea to accumulate the microplastics due to its semi-enclosed nature and complex interaction between inflow of waters originating from the North Atlantic and Ob-Yenisey river plume.
Introduction
The problem of the pollution with microplastics (MPs) in the Arctic region is a challenge for the scientists. Microplastics can pollute marine organisms because they can adsorb high concentrations of persistent organic chemical contaminants in seawater (Mato et al., 2001) and can be a sink for radioactive materials via biofilms (Ikenoue et al., 2022). Despite active research, data are scarce, and the Arctic Basin remains a blank spot on the ocean pollution map. Studies in the Eurasian part of the Arctic Ocean are mainly limited by the Barents Sea. Prior to the present study, only several studies of microplastics in the surface waters were conducted in the Kara Sea (Cózar et al., 2017; Tošić et al., 2020; Yakushev et al., 2021) that were restricted by a few stations in the Kara Sea and reported varying concentrations of microplastics. Furthermore, different methods were applied, resulting in disparate datasets. This lack of methodological uniformity has made it challenging to make any conclusions about the extent of microplastic pollution within the Kara Sea.
The Kara Sea is predominantly located on the continental shelf, with depths mainly ranging from 50 to 100 meters. It receives substantial freshwater inputs from the Ob and Yenisey rivers, leading to significant variations in salinity across different regions. Almost the entire sea is covered with locally formed ice for most of the year. The ice formation typically begins in September.
Atlantic waters enter the Kara Sea through the Kara Gate strait. The Kara Gate, located between the Barents and Kara Seas, has a width of 45 km. The strait is bridged by a ridge that connects Novaya Zemlya to the continent. The crest of this ridge reaches depths of 35-40 meters (Morozov et al., 2003). The depths on both sides of the ridge can reach 200 meters or more. The average current in the Kara Gate is directed from the Barents Sea into the Kara Sea, with a speed in the core ranging from 6 to 26 cm/s (Harms & Karcher, 1999). The return flow of bottom waters at depths over 200 meters has an average speed of about 11 cm/s. There also exists a weak surface current, from the Kara Sea through the strait into the Barents Sea (Litke’s current) (McClimans et al., 2000). The outflows are much weaker than the main inflow into the Kara Sea (Morozov et al., 2003).
The volume of water through the Kara Gate (average inflow per year is 0.3 Sv) is much larger than the combined river discharge to the Kara Sea (from 0.01 to 0.15 Sv depending on season) (Harms & Karcher, 1999). The Yamal Current begins at the Kara Gate and turns to the east as part of the cyclonic circulation. Then, it turns to the north and propagates along the Yamal coast over the 100-m isobath. The prevailing belief is that the Eastern Novaya Zemlya Current generally flows in a southwest direction. However, there are arguments suggesting that it can flow in the opposite direction to the northeast (Zatsepin et al., 2010).
Estuaries and the southern region of the Kara Sea experience intense interaction between fresh, warm river waters and cold, saline offshore seawaters. Water circulation in the near-estuary area of the Kara Sea is characterized by seasonal variations due to atmospheric forcing with northerly currents prevailing in spring and summer due to north-westerly winds and northerly to north-easterly currents activated by westerly and southwestern winds in winter.
Only a limited number of studies (Lusher et al., 2015; Yakushev et al., 2021; Ikenoue et al., 2023), considered salinity, temperature, and wind conditions when analysing microplastic concentrations in the Arctic. Yakushev et al. (2021) underscored the importance of these factors in understanding the microplastic distribution in the Siberian Arctic.
The studies mentioned above covered different regions of the Kara Sea, with (Tošić et al., 2020) focusing on Eastern Novaya Zemlya, (Cózar et al., 2017) on the Northern and Central Kara Sea, and (Yakushev et al., 2021) on the southern Kara Sea. Moreover, different size groups of microplastics were studied there. These disparate focus areas and methodologies make it difficult to draw conclusions about the sources and pathways of microplastics across the entire Kara Sea region.
The primary objective of this study was to conduct an extensive survey to understand the distribution of surface microplastics throughout the Kara Sea. In this paper, we attempt to associate the observed distribution patterns of microplastics with environmental characteristics and analyse the potential sources and pathways.
Materials and methods
Study sites
A comprehensive sampling effort was conducted in the Kara Sea, resulting in a total of 42 stations strategically distributed across various regions (Figure 1). The sampling included 5 net thrawlings specifically performed in the Kara Gate. Six stations were made in the middle of the western part of the Kara Sea shelf to capture the representative conditions in this area. Recognizing the importance of the Ob-Yenisey river plume, 13 stations were dedicated to this region to assess the impact of freshwater inputs. To explore the northern reaches of the Kara Sea, 3 stations were located beyond the 82N latitude. The northernmost point was at 83N. Six stations were positioned over the St. Anna Trough, a dynamic and hydrologically important area. Finally, 8 stations were placed to the north of Novaya Zemlya in the zone influenced by the Western Novaya Zemlya Current, providing valuable insights into this region.
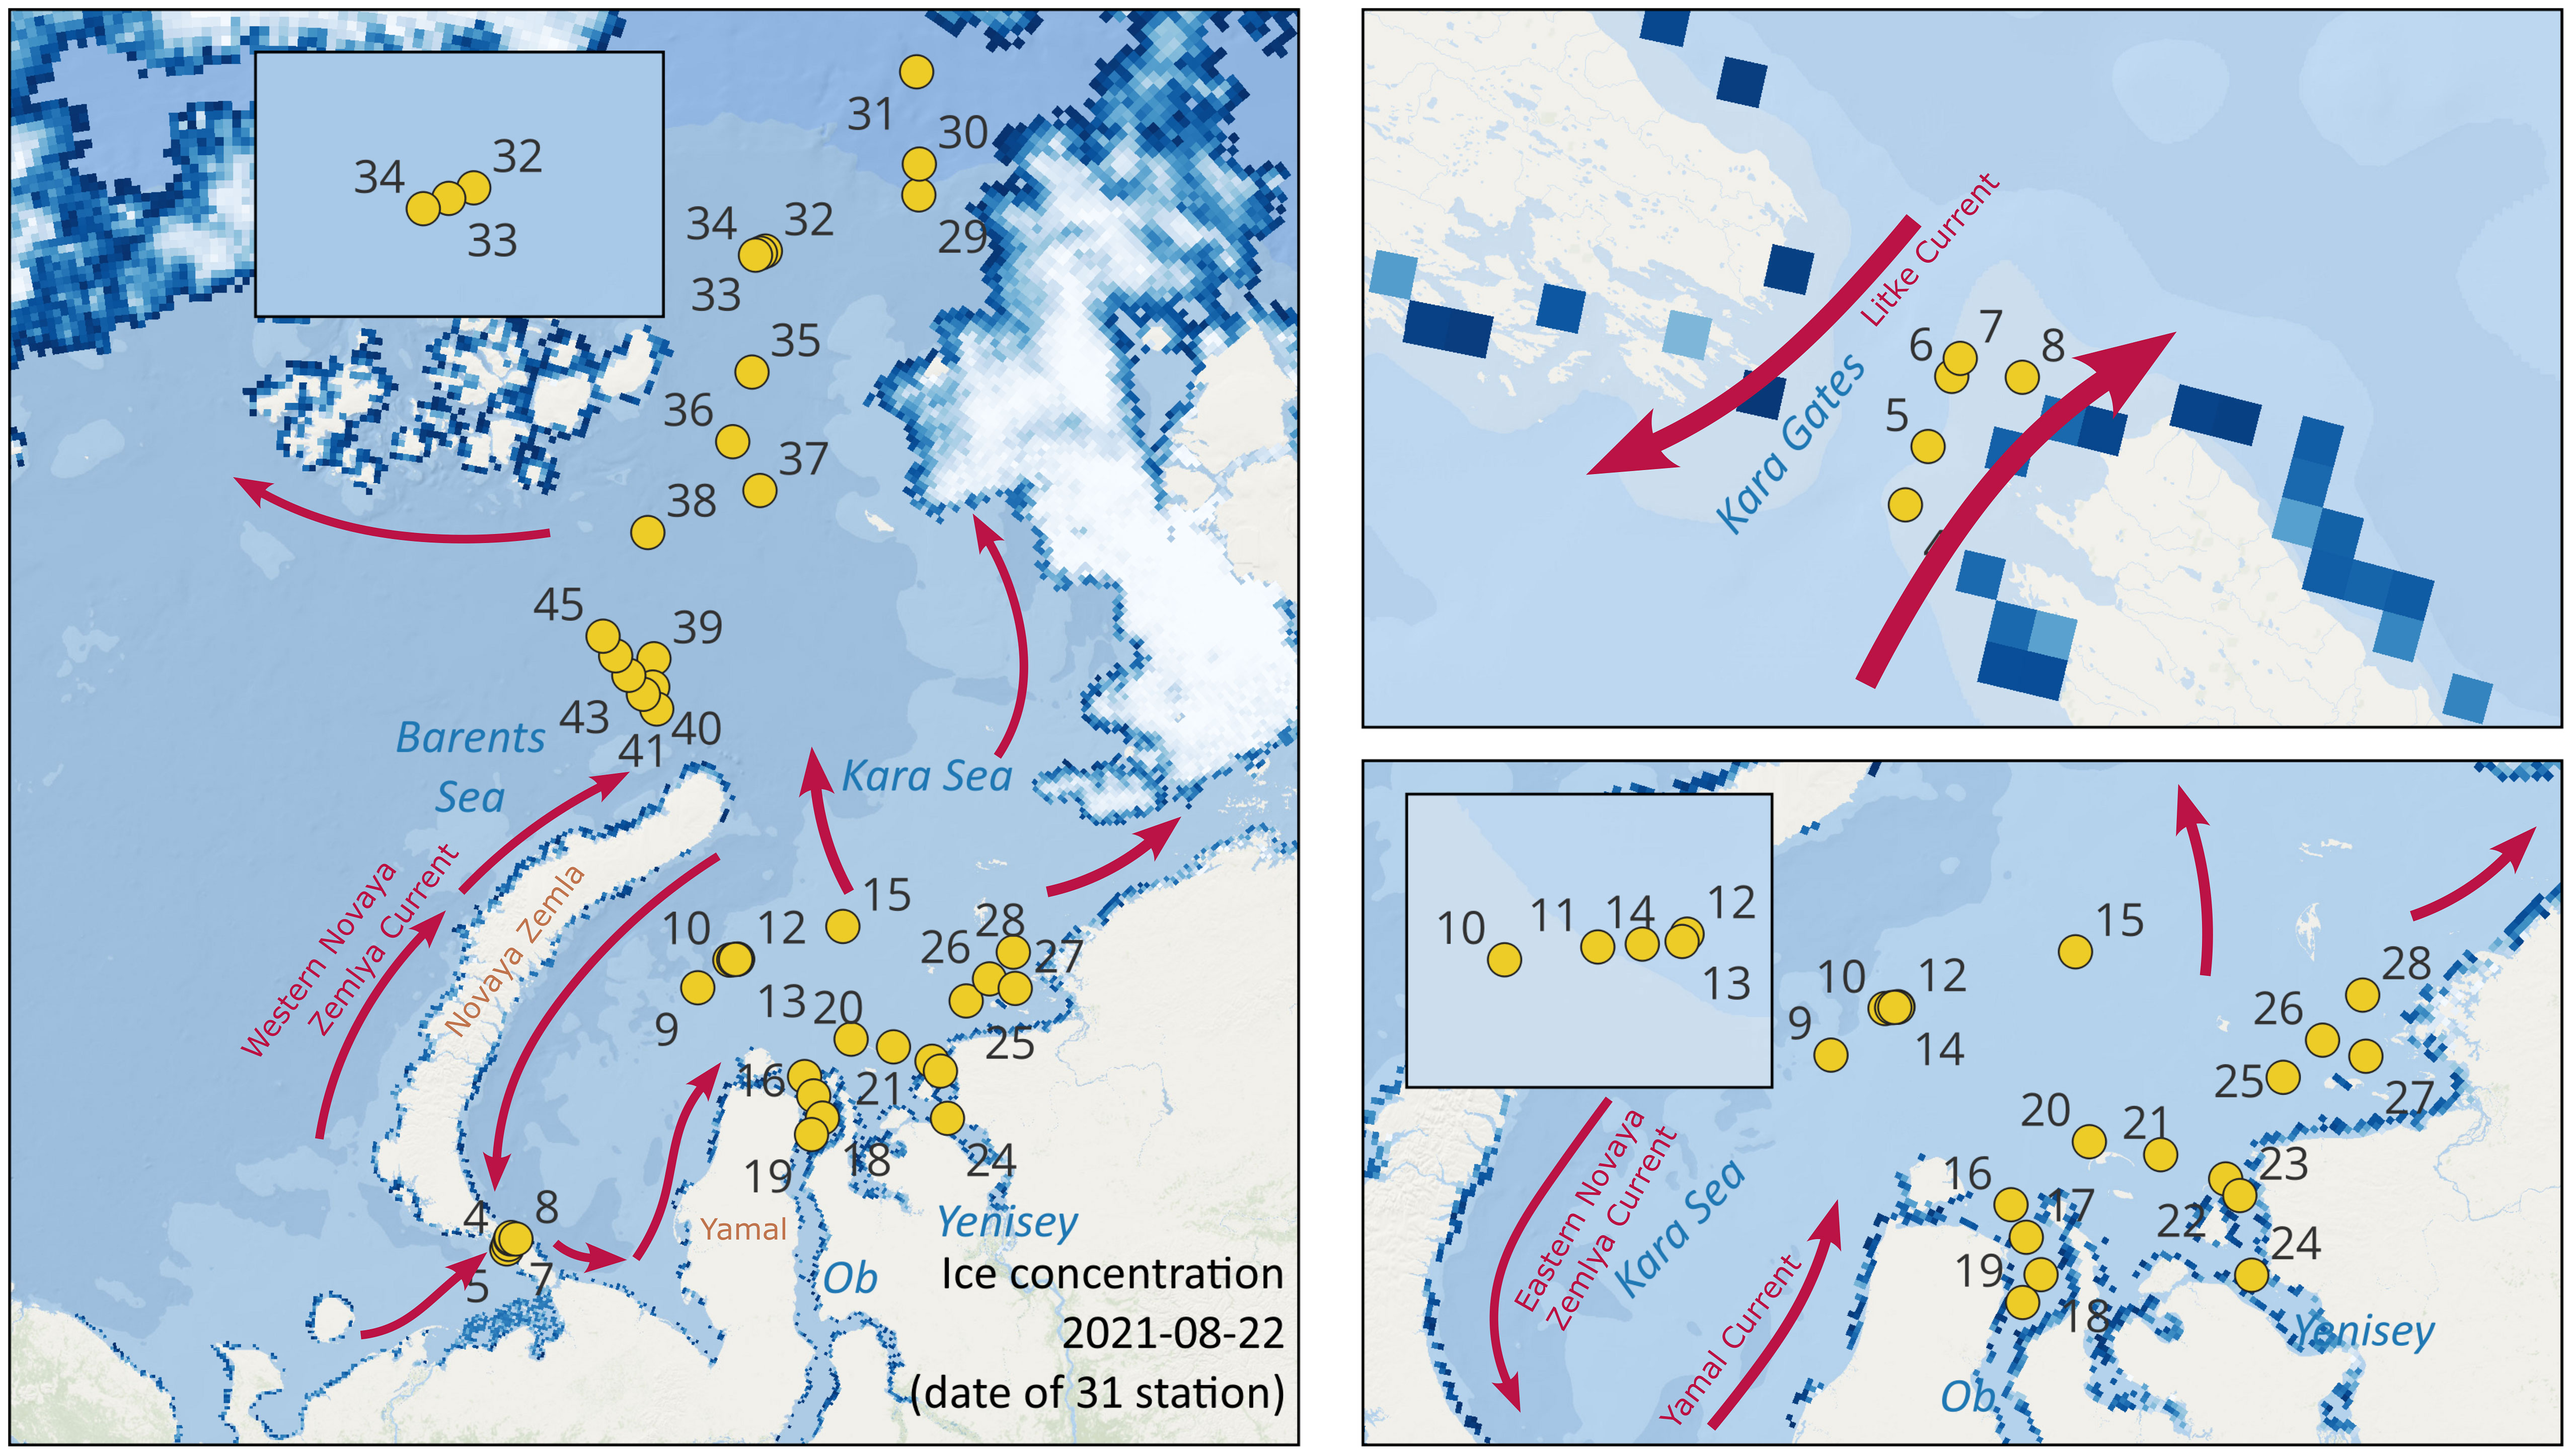
Figure 1 Stations map for sampling surface microplastics. White-blue shading shows the sea ice concentration 2021-08-22 obtained from MODIS AMSR-2. Red arrows show the mean currents in the studied region; adapted from (Galimov et al., 2006; Panteleev et al., 2007).
Sampling
The collection of microplastics floating on the sea surface was carried out by neuston net (40 x 60 cm opening, nylon material, 0.333 mm mesh size) trawling over the sea surface at low vessel speed (2-3 knots) for about 20 min. 20 cm of the net opening was submerged. The method was recommended for surface water microplastic sampling by AMAP (AMAP, 2021). After trawling, the net was washed from the outside with sea water and the content of cod end was washed off with filtered water (0.45 µm pore size filter) into a clean glass jar with a lid. The jars with suspended matter were transferred to a clean room for further processing. Flowmeter was used to calculate the exact filtered water volume, which varied between 76-616 m3.
Additionally, hydrophysical parameters of the surface water were continuously measured in the flow system at 3 m depth during the cruise. The system was equipped by a thermosalinograph (SBE 21 SeaCAT) that was continuously recording salinity and temperature of the subsurface seawater.
Sample handling and laboratory analysis
No treatment was carried out prior to the analysis. Collected suspended matter was washed off with filtered water from the jars into a plastic basin for primary visual analysis (Lusher et al., 2020) for the presence of microplastics (>500µm) in the sample. After visual sorting, the sample was washed onto a metal sieve with a mesh of 0.5 mm for final verification, so the size range of microplastics in this study was 0.5 – 5 mm. During the analysis, a lamp with an illuminated magnifying glass was used. Potential plastic particles were stored in Eppendorf tubes before analysis where all particles were photographed on graph paper then weighted for each station (AND GH-252 dual-range analytical balance) and all the found particles were identified by Fourier Transform Infrared Spectroscopy (Perkin Elmer FT-IR ATR Spectrum Two). Measurements were obtained at 4 cm-1 spectral resolution for the range 4000 to 600 cm-1. Library matching was performed in the Spectrum 10 software (v. 10.6.2). Each spectrum was compared to several different libraries available at NIVA: PerkinElmer ATR Polymers library, BASEMAN library (Primpke et al., 2018), and several in-house libraries including reference polymers, different textile materials, and potential sources of laboratory contamination. All spectra were manually inspected to ensure that spectra showed characteristic peaks of polymers and the library matches were acceptable (>0.8). Textile fibers were not included in the dataset as it was impossible to control contamination by fibers during sampling and used analysis by visual sorting is not suitable for quantitative extraction of microfibers. Technical (solid) fibers like fishing lines were included into the dataset.
QA/QC
To control and minimise external contamination, the following steps were performed: Only distilled and filtered water was used to wash the equipment and working surfaces. The neuston net was rinsed from outside with seawater before each sampling. The composition of all plastic materials used during sampling and analysis was identified and taken into account during analysis (material of the net, boat, laboratory equipment). For control of airborne contamination, a wetted GF/A filter was exposed in an open glass Petri dish close to the sample during processing and analysed for foreign plastic particles after sample processing. Given that no contamination was observed within the target size range we did not perform any corrections of our data, apart from removing particles which were not shown to be plastic after FTIR. Furthermore, textile fibers were excluded from the analysis due to the challenges of controlling for this contamination during field sampling.
To control the quality of the analysis a recovery test was performed in the laboratory. Standard material of three polymers (polyethylene, polypropylene and polystyrene) were added to the cod ends containing some marine suspended matter. Specifically, 21 particles (0.5 – 5 mm) were added to the samples and processed in the same way as the samples. This was performed in 3 replicates to ensure method validity. All analysis steps were followed according to the field samples, including visual sorting and FTIR measurements. The test showed 100% recovery rate and correct polymer identification.
Data analysis
The Python 3 packages for data analysis (scipy, pandas, scikit-learn) were used to process the raw field data. Several regions in Kara Sea were identified based on hydrophysical properties of water (temperature and salinity) using Ward’s hierarchical clustering method. Main statistics (mean and standard deviation) were calculated for microplastics data within the determined sea regions. The t-test for independent samples was used to quantify the difference between the arithmetic means of the microplastics abundance, weight concentrations and particles sizes.
Wind data were obtained from Global Ocean Hourly Sea Surface Wind and Stress from Scatterometer and Model (European Union-Copernicus Marine Service, 2022). Wind direction and speed were also averaged with hourly frequency, which allowed us to plot wind roses for every sampling site. Satellite MODIS AMSR-2 sea ice concentration was used to map the ice margin during the cruise.
Maps were plotted with QGIS 3.28. Microplastics concentrations were calculated in different units, in items/km2, items/m3 and µg/m3, so that they can be easily compared with the results of other studies. Abundance (items/km2) was calculated as follows:
Results
Hydrophysics/environmental conditions
Using the hierarchical Ward method based on the dendrogram, three classes of water were identified (Figure 2A):
■ Highly saline warm: influenced by transformed Atlantic waters - from the Kara Gate to the Ob and Yenisei rivers. Salinity range S = (27.6 - 32.6) PSU, temperature range T = (9.8 - 12.1) °C.
■ Riverine: the area affected by the Ob and Yenisey rivers. Salinity range S = (0.5 - 10.4) PSU, temperature range T= (9 - 12.8) °C.
■ Highly saline cold: the northern parts of the Kara Sea and northeast part of the Barents Sea. Salinity range S = (32.9 - 34.4) PSU, temperature range T = (1.4 - 3.4) °C.
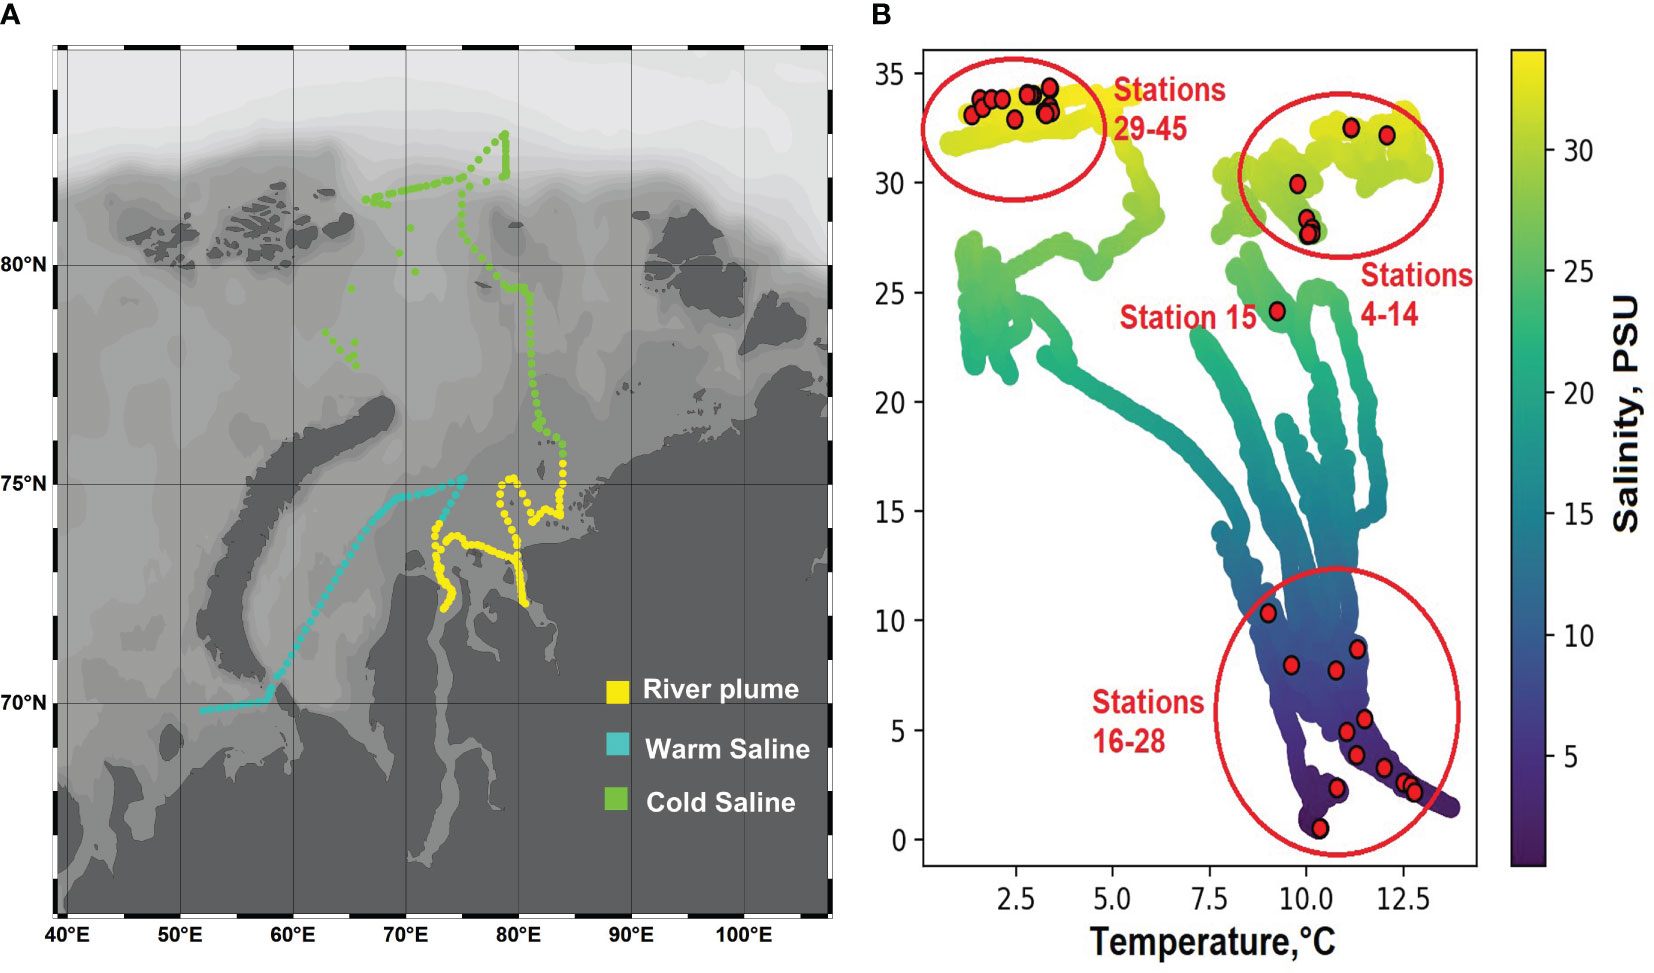
Figure 2 (A) distribution of the water classes; (B) TS diagram for the whole cruise and microplastics sampling stations plotted according to its temperature and salinity.
The temperature and salinity at microplastic stations were plotted on the TS diagram of the cruise (Figure 2B). Stations 4-14 were assigned to the class of highly saline warm waters, stations 16-28 to the class of riverine waters, and stations 29-45 to the class of highly saline cold waters. Station 15 was excluded from the classification because its temperature (9.2°C) and salinity (24.4PSU) did not fit into any of the described classes. In further analysis the Kara Gate stations (4-8) were isolated into a separate class. It was done due to the significantly higher number of plastic particles found there (1374 in total for 4-8 stations), differing by 2 orders of magnitude from the other stations. Also, stations from the class of highly saline cold waters were divided into two regions according to the water circulation patterns: stations 29-37 in the Northern Kara Sea including St. Anna trough and further to the Arctic Ocean basin, and stations 38-45, influenced mainly by Western Novaya Zemlya Current and belonging to the Barents Sea (Table 1).
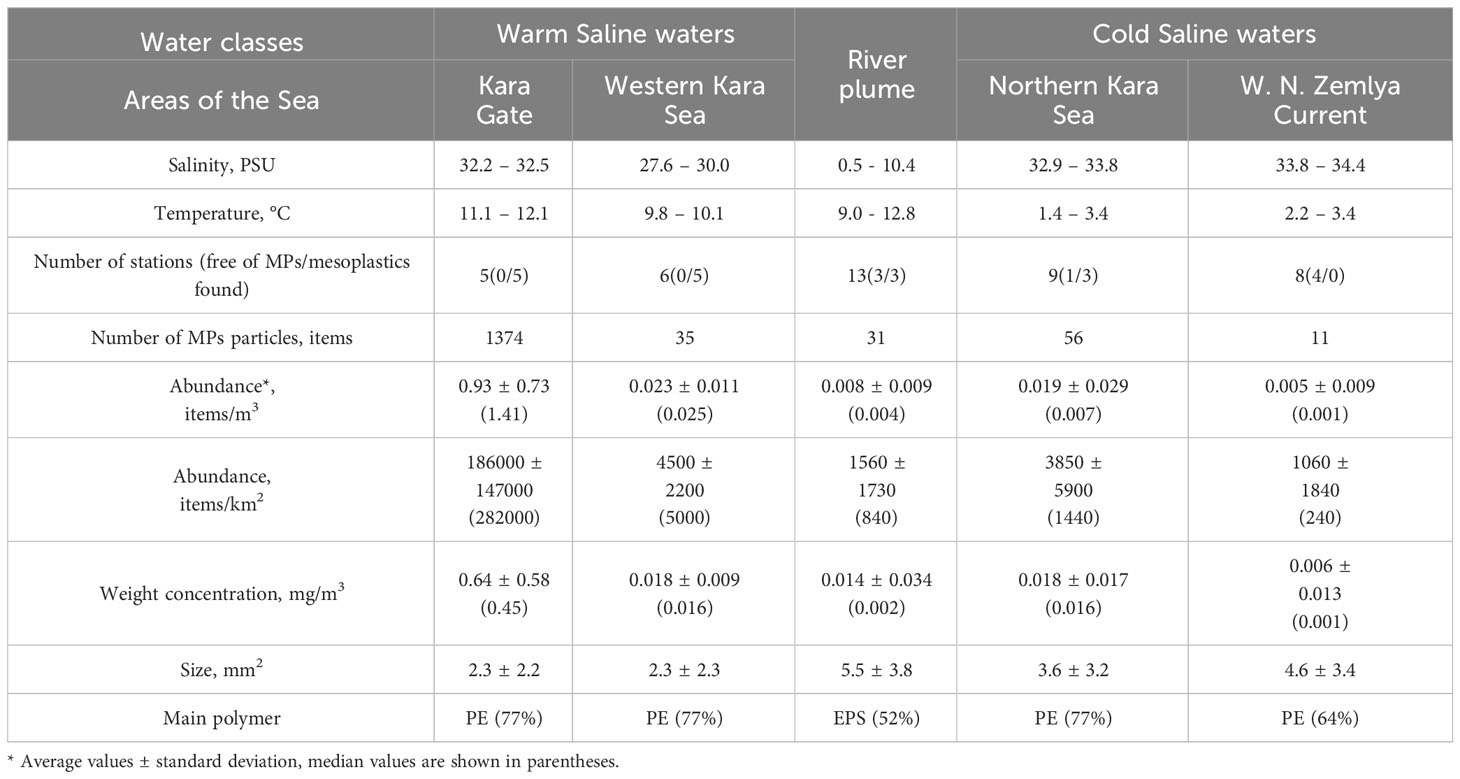
Table 1 Properties of the water classes identified in the study and microplastics characteristics within different areas of the Kara Sea.
Plastics
A total of 1679 found particles were identified as plastic, where 1507 items (90%) were<5 cm in size and belonged to microplastics. Fibers (lines) were detected only in the Kara Gate, representing on average 10% of the total microplastic fraction in this area, all other found items were fragments. The abundance of microplastics varied from 0 items/m3 to the maximum value in the Kara Gate 1.53 items/m3. The average value for the entire study area is 0.124 ± 0.383 items/m3. All types of plastics with positive buoyancy have been found, the most common being polyethylene (PE), polypropylene (PP) and expanded polystyrene (EPS). The results are summarized in the Table 1 (in details is given in Supplementary Table S1).
Microplastics characteristics for different areas of the Kara Sea
The difference between the divided areas of the Kara Sea was found in terms of the number of stations free from MPs. Overall distribution was quite patchy, especially in the river plume and at W. N. Zemlya Current were 23 and 50% of stations were free of MPs, respectively. The most polluted was the Kara Gate and Western Kara Sea – MPs were observed at all stations here. Moreover, most of the particles >5 mm, meso- and macroplastics, were also found in the Kara Gate and Western Kara Sea (Figure 3; Table 1).
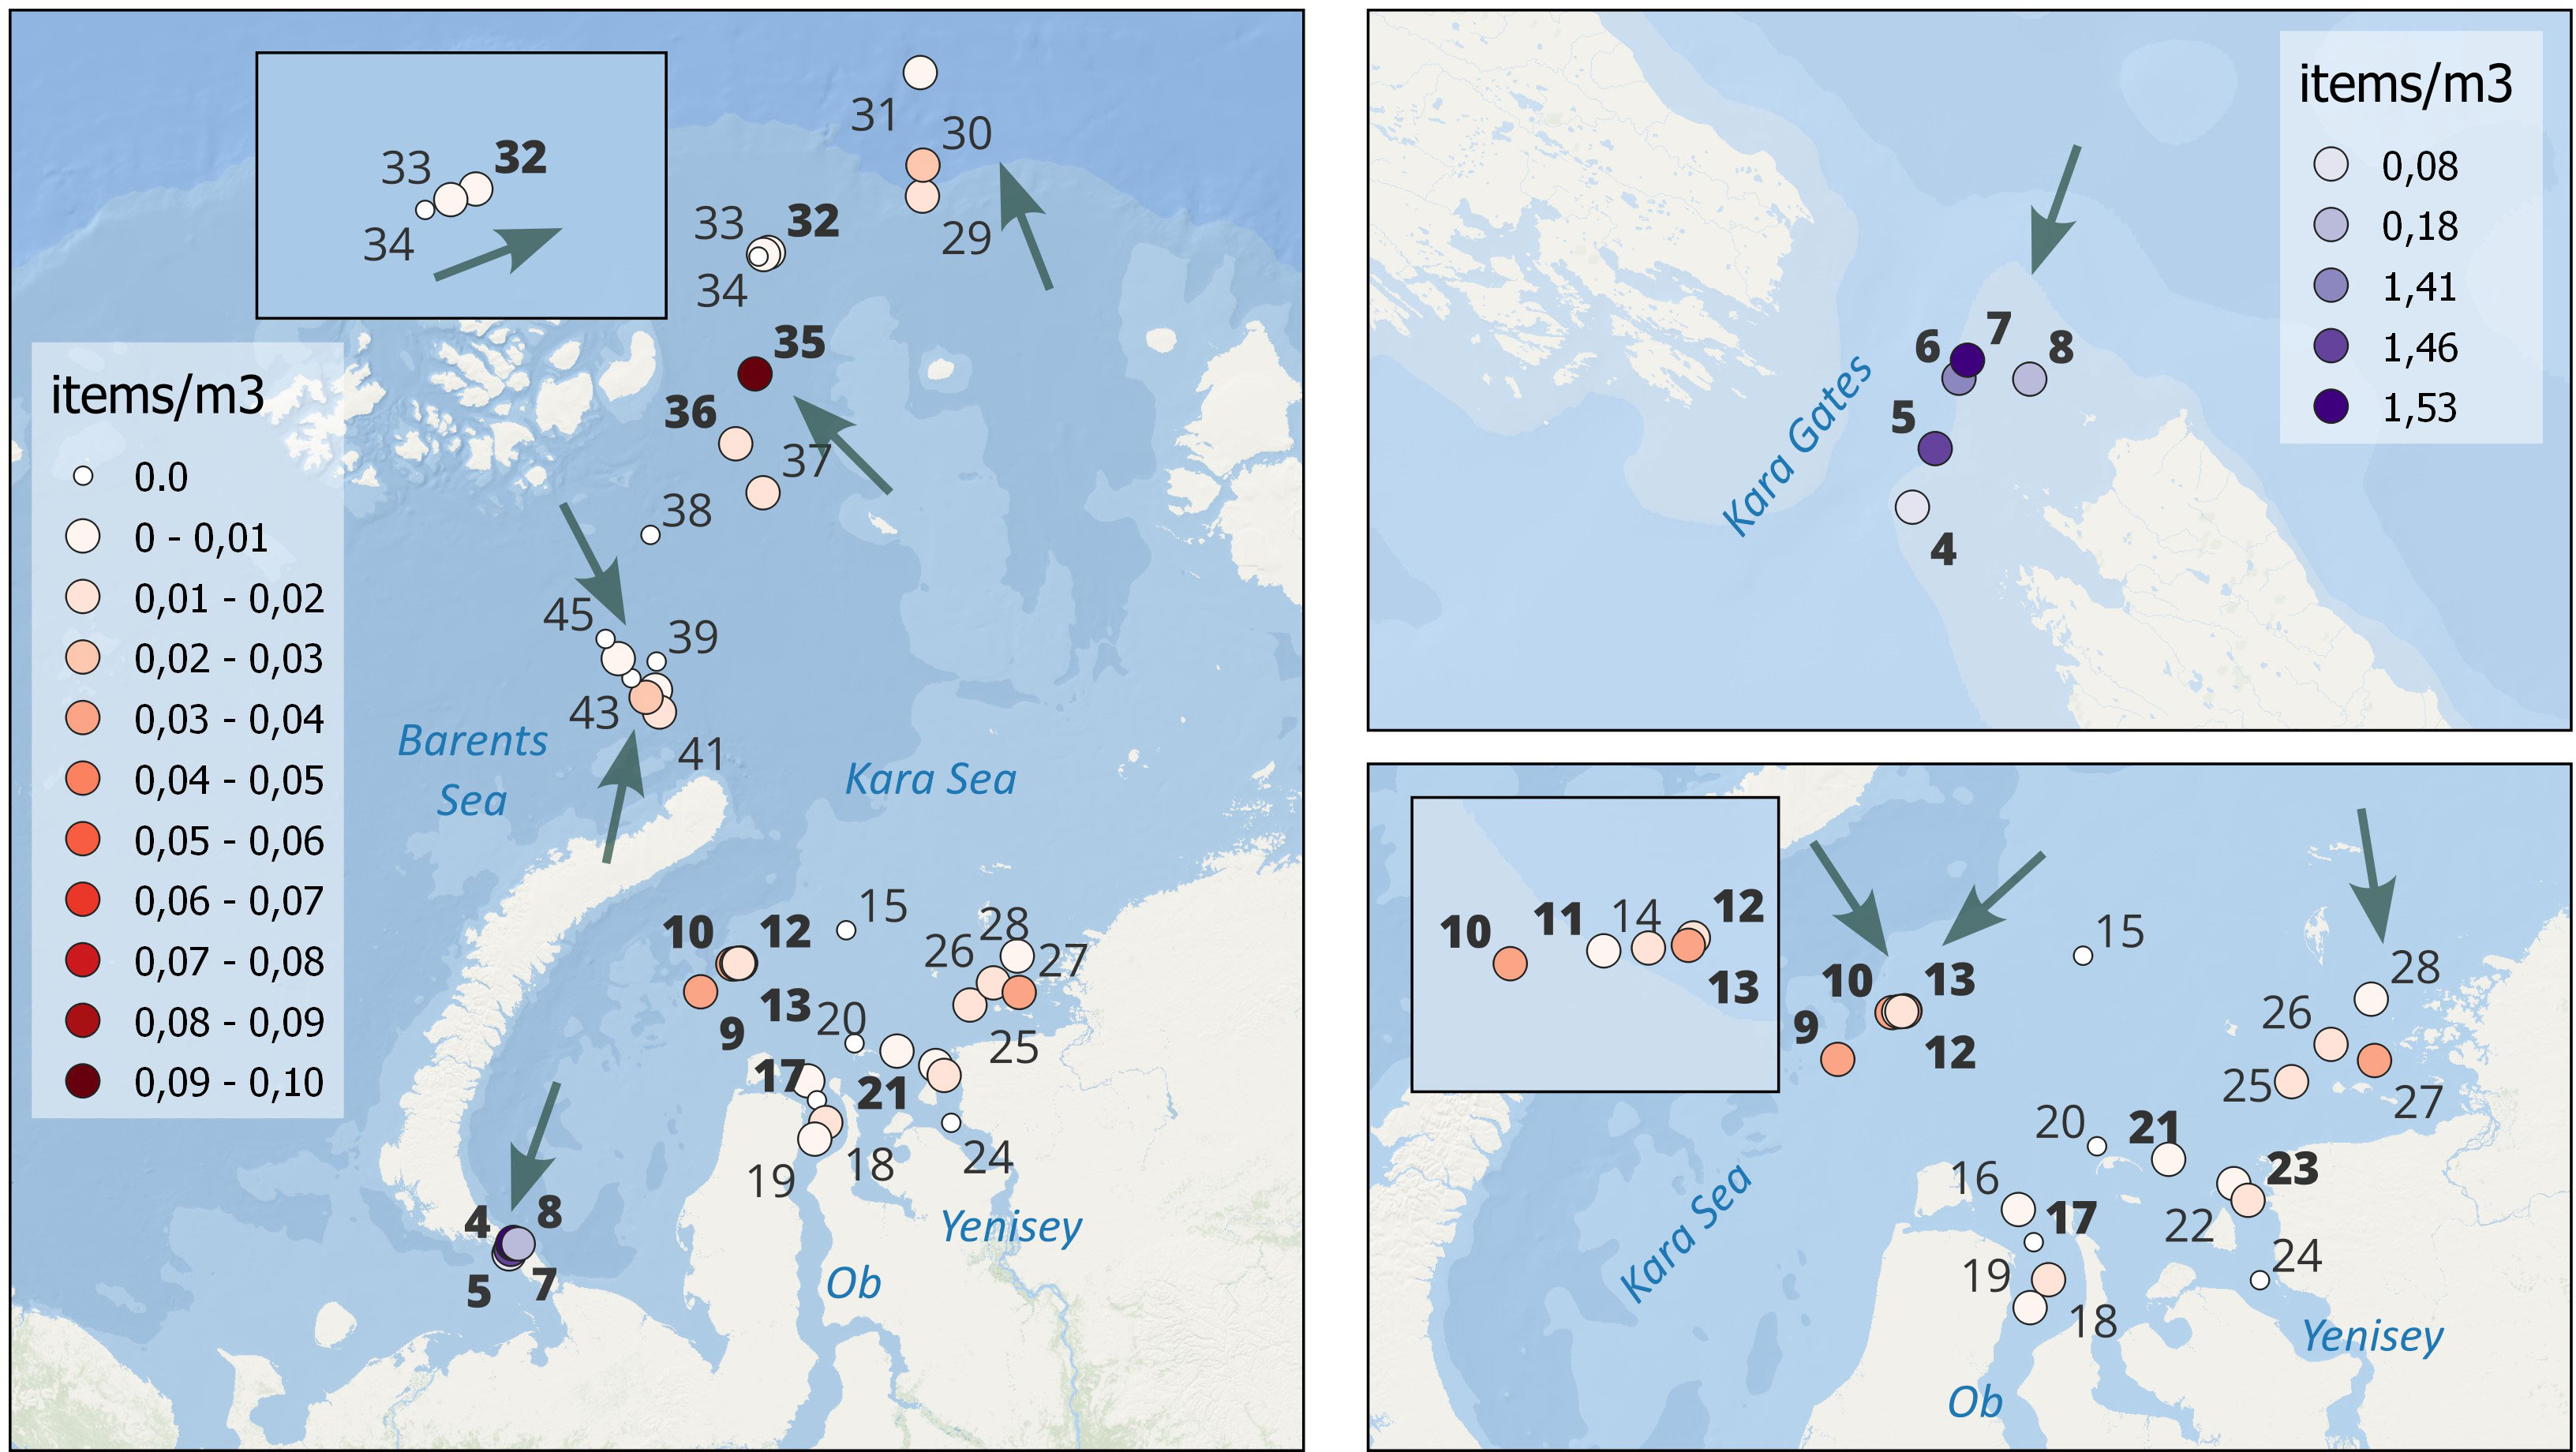
Figure 3 Map of microplastics abundance in the Kara Sea in items/m3. Note the separate scales for the Kara Gate and the main region. Green arrows show the predominant wind direction in the sampling sites in July-August 2021 (see the windroses plots and full description in the Supplementary Material). Bold font is used to highlight the stations where meso- and macroplastics were found.
Abundance
Microplastics abundance was the highest in the Kara Gate, where 1374 microplastic particles in total were found at 4 stations that resulted in average MPs abundance 0.93 ± 0.73 items/m3 and differed significantly, up to 2 orders of magnitude from all other areas of the Kara Sea (Figure 4; Table 1). The amount of microplastics in the Western Kara Sea (0.023 ± 0.011 items/m3) was significantly higher than in plume waters (0.008± 0.009 items/m3) and W. N. Zemlya Current (0.005± 0.009 items/m3). There was not found statistical difference between MPs abundance in the Northern Kara Sea (0.019 ± 0.029 items/m3) and other areas except the Kara Gate (Supplementary Table S2).
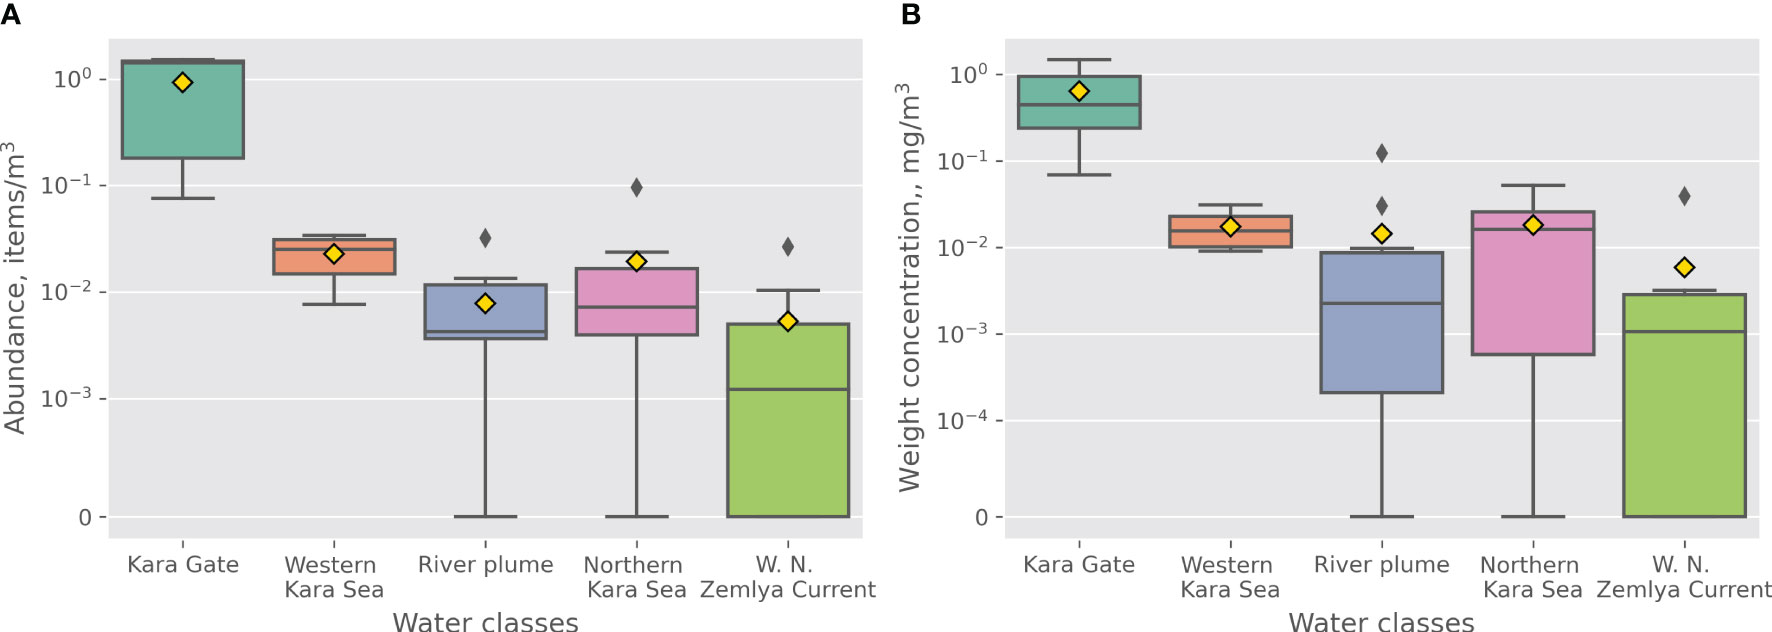
Figure 4 (A) Abundance (items/m3) and (B) weight concentrations (mg/m3) within the identified regions. Boxplots display the minimum, the maximum, the first and third quartiles, the sample median (line in the box), and the average (yellow diamond).
Size
Kara Gate and the Western Kara Sea were characterized by smaller MPs items size, average surface size 2.3 mm2 for both areas, belonging to the same water class. MPs items in the River plume, W. N. Zemlya Current and the Northern Kara Sea were up to twice bigger in size, average 5.5, 4.6, 3.6 mm2 respectively (Figure 5; Table 1) and had no significant difference from each other (Supplementary Table S2).
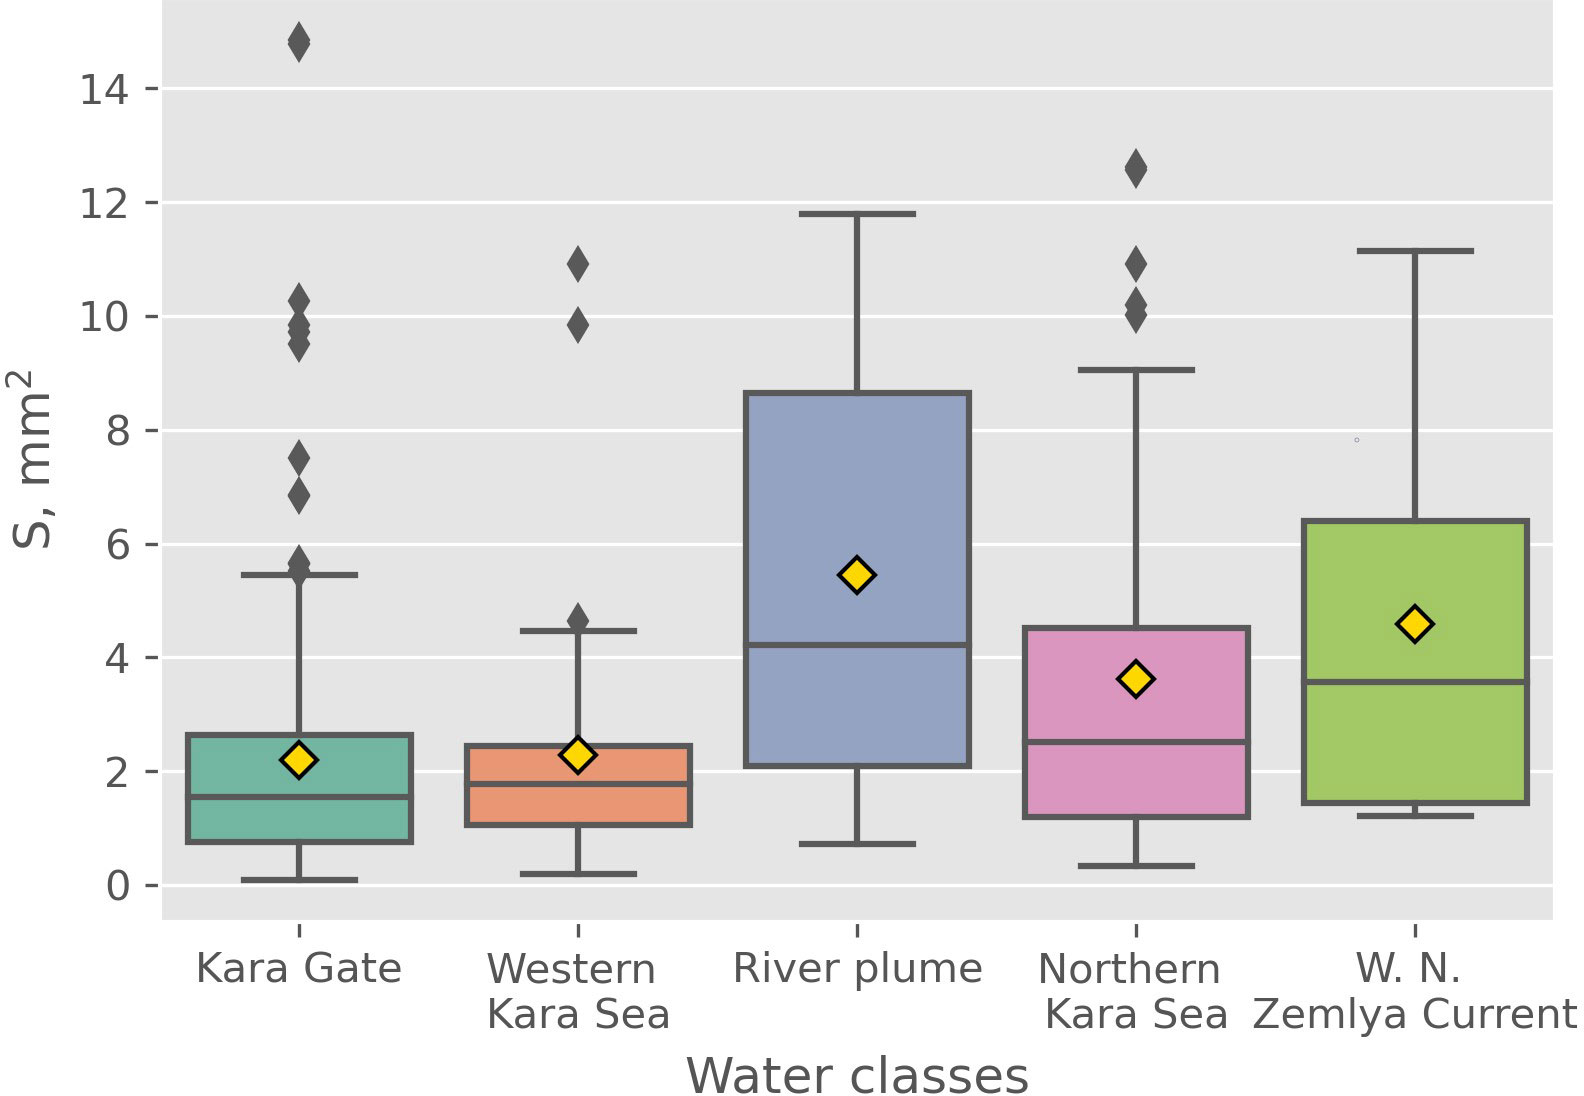
Figure 5 Particles size (mm2) within the identified regions.
Polymer types
Two areas belonging to the class of warm saline waters had quite similar diversity of polymer types of found items where 77% were PE and 20% - PP (Figure 6). For microplastics items in the W. N. Zemlya Current PE was also recognized as the main polymer type but with lower share, 64% followed by 18% for both PP and Others (represented by polyamide and polyurethane). Polymer composition of MPs items in the River plume differed significantly from the other areas of the Kara Sea, with EPS as the main polymer type, 52%, followed by PE, 29% and PP, 19%. MPs items composition found in the Northern Kara Sea were similar to the items in the warm saline waters with 77% of PE but smaller share of PP, 18% and higher share of EPS, 5%.
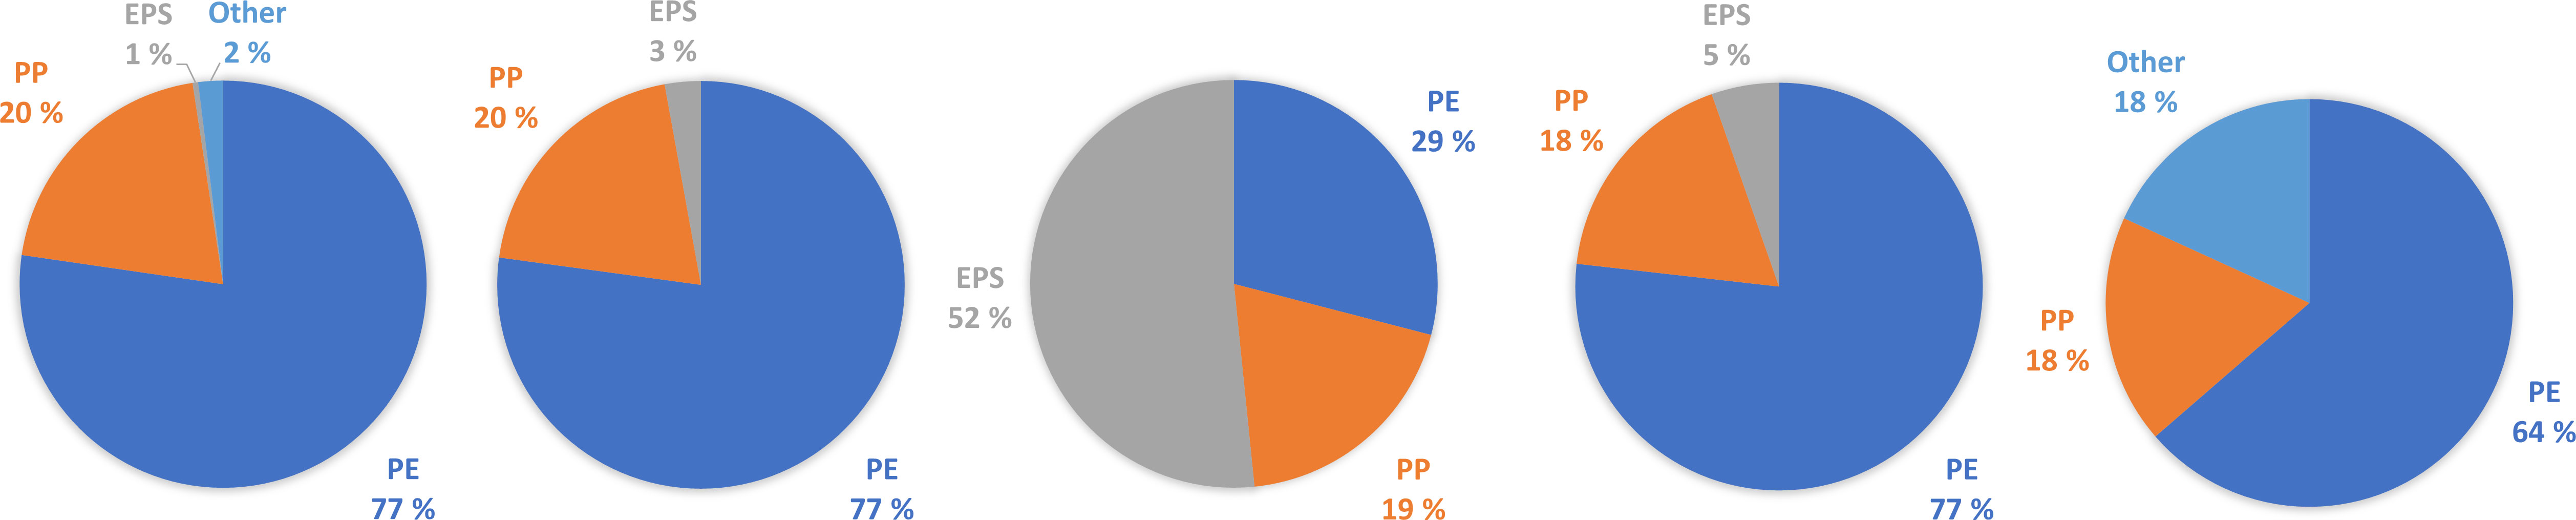
Figure 6 Polymer composition of microplastics within the identified regions.
Weight concentration
The same as for abundance, maximum weight concentration of microplastics was found in the Kara Gate (0.64 ± 0.58 mg/m3), the lowest – in the river plume and W. N. Zemlya Current (0.014 ± 0.034 and 0.006 ± 0.013 mg/m3, respectively) (Figure 4; Table 1). MPs weight concentration in the Western and Northern Kara Sea was characterized by the same average weight concentration, 0.018 mg/m3.
Gathering all the findings from obtained data:
● Plume waters and W. N. Zemlya Current contained microplastics of a different polymer type, size and are characterized by lower concentration than warm saline waters (p< 0.05).
● The characteristics of microplastics in the Northern Kara Sea do not differ significantly from other areas of the sea and have some similarities with warm saline waters, the river plume, and W. N. Zemlya Current result from the influence of both Barents Sea and river waters on this region.
● The Kara Gate belongs to the class of warm saline waters and has the same properties of microplastic items as in the Western Kara Sea, but the concentration is an order of magnitude higher. It suggests that the distribution of microplastic depends not only on water origin (represented by salinity and temperature) but also on other factors (wind transport, formation of frontal zones, local sources, maritime activity).
Discussion
Sources and pathways
The results revealed that the Kara Gate exhibited the highest abundance of microplastics (0.93 ± 0.73 items/m3), marking it a critical point for microplastics transport into the Kara Sea. This influx of MPs potentially represents a composite of MPs contained within the Norwegian Coastal Current, branch of North Atlantic Current, affected by inputs from coastal sources along its way. Additionally, contributions may originate from the White Sea and local sources within the coastal zone of the Barents Sea. The Western Novaya Zemlya Current may serve as a significant conveyor of MPs directly from the North Atlantic Ocean. Local sources within the open Barents Sea, that is maritime activity, may also play a crucial role.
The water coming from the Barents Sea spreads across the Kara Sea shelf; some part of it is captured by the Yamal Current that directs it towards extensive Ob-Yenisey river plume. Plume front limits the further propagation of MPs from the Barents sea to the east and contributes to its retention in the Western Kara Sea. Higher abundance of microplastics within Western Kara compared to ambient concentrations were observed before (Pakhomova et al., 2023). While the Ob and Yenisey rivers have been identified as potential pathways for microplastic pollution in the Kara Sea (Yakushev et al., 2021), our results suggest their contributions might not be the predominant sources due to significantly lower (p< 0.05) concentrations (0.008 ± 0.009 items/m3) compared to Western Kara Sea (0.023 ± 0.011 items/m3) and Kara Gate (0.93 ± 0.73 items/m3). Instead, the presence of microplastics may be attributable to intensive maritime activities, particularly in the Gulf of Ob, including shipping, fishing, and oil and gas operations. Only the upstream regions of Ob and Yenisey rivers are populated, which can be a source of MPs pollution. It can be assumed that when transported downstream, plastic particles are fragmented, beached, consumed by biota and sink to the bottom. The main plastic pollution remains in upstream regions of the rivers (Frank et al., 2021).
It is well-documented that the dynamics of the river plume in the Kara Sea, and hence the dispersion of riverine microplastics, besides buoyancy, are largely driven by wind patterns (Osadchiev et al., 2017). Strong southern (offshore) winds in late summer and autumn induces eastward Ekman transport of the freshwater plume and promotes its spreading towards Vilkitsky Strait (Osadchiev et al., 2020). The north-western wind is dominant during the summer period with the “western” type of the river plume propagation. Such wind induces the Ekman transport directed to the west or northwest (Kubryakov et al., 2016). A month before the sampling campaign northern wind prevailed in the Ob-Yenisey river plume area that impeded the spreading of riverine microplastics seaward. These patterns significantly influence the transport and distribution of riverine microplastics, steering them towards certain areas. As such, the prevailing wind conditions play a fundamental role in determining the spread and fate of riverine microplastics within the Kara Sea.
Importantly, we also observed significant differences in the polymer compositions of microplastics from river sources and those in saline waters. The most pronounced case is the predominance of EPS particles (52%) in the River Plume in contrast to other regions dominated by PE. EPS is frequently used for packaging, insulation, and as a cushioning material in the transport of goods. Activities along the river coast, such as construction and waste disposal, might contribute to the direct input of EPS particles into the river system. Due to its low density and porous structure, EPS particles can float on the water surface, making them more likely to be transported downstream the river. The predominance of EPS suggests that land-based activity is a main source of microplastics in the river plumes of the Kara Sea. The divergence in chemical composition of microplastics from river sources correspond to the findings reported by (Yakushev et al., 2021), highlighting the diverse origin and possibly differing environmental impacts of microplastics based on their source.
Northern Kara Sea is affected by waters coming from the rivers, from the North Atlantic via W. N. Zemlya Current, by coastal Barents Sea water entering through the Kara Gate and spreading in western Kara Sea as well as by Arctic Ocean water from the North. Microplastic composition found in the Northern Kara Sea suggests several contributing sources. These include inputs from the Western Novaya Zemlya Current and the Kara Gate, indicated by similar fractions of PP and PE – 77% PE and 18% PP in the Northern Kara Sea and 64, 77% PE and 18, 20% PP in W. N. Zemlya Current and the Kara Gate respectively. Given the large proportions of PP and PE in both the Warm Saline waters and the Western Novaya Zemlya Current, identifying the prevailing source becomes a challenging task. From the other site, presence of EPS (5%) in the Northern Kara Sea can point on influence of riverine waters here as in the river plume EPS was the main polymer type found (52%) while it was negligible in the Kara Gate and the W.N.Zemlya Current. Additionally, drifting ice can capture and transport microplastics over long distances (Obbard et al., 2014; Kanhai et al., 2020; Kim et al., 2021; Mountford & Morales Maqueda, 2021), so this can explain the mere fact of presence of microplastics in the northern Kara Sea beyond 82N.
During winter and extensive sea ice coverage, the movement and dispersion of microplastics are impeded, as the ice acts as a physical barrier that restricts their transport and accumulation.
In recent studies, a substantial presence of microplastics has been reported within the Arctic’s sea ice, reflecting alarming levels of pollution (Peeken et al., 2018; Huntington et al., 2020). This detection of high concentrations raises concerns about the potential release of particles as the sea ice retreats during the summer. Though, these processes were not directly accessed in the present study, the results did not indicate an increase in microplastic concentrations near the ice margins in the northern part of the Kara Sea (stations 29-31).
Kara Gate
The highest microplastics abundance (up to 1.53 items/m3) was found in the Kara Gate, suggesting that it is an important source of the microplastics pollution of the Kara Sea.
The hydrological conditions in the Kara Gate are influenced by the dynamics of the Pechora river plume and wind-driven currents. Recent studies revealed regular advection of the Pechora plume through the Kara Gate into the Kara Sea (Rogozhin et al., 2023). Pechora plume can act as a barrier from the south for microplastics coming from the Barents Sea and direct particles towards the Kara Gate or prevent the influx of MPs coming from Barents Sea.
During summer surface water from the Barents Sea carried by Pechora current in the south flows eastward while the water from the Kara Sea (Litke current) flows towards the west (Figure 1). In the summer the Pechora River discharge represents a large portion of the easterly flow, mixed with saline waters of Atlantic origin (Pfirman et al., 1997). North-east and east wind promotes the outflow from the Kara Sea and reduces the inflow of Barents Sea water (Pavlov et al., 1994). In August, when the observations were conducted in this study, the incoming surface current typically increases in width (Pfirman et al., 1997). The stations 4-8 were made in Pechora current according to the decreased salinity of surface water (32.2 – 32.5 PSU) affected by Pechora plume and higher temperature (11.1 – 12.1°C).
Given the relatively higher concentrations of macro- and microplastics in the Barents Sea (Grøsvik et al., 2018; Novikov et al., 2021; Pakhomova et al., 2022). Pechora current can potentially introduce substantial amounts of microplastics into the Kara Sea. Under favourable conditions, the intersection of two opposing currents can generate eddies, creating a local trapping zone for microplastics (van Sebille et al., 2020). This could lead to localized areas of higher microplastic concentration (Pfirman et al., 1997). It is worth noting that, as the Kara Gate is a coastal zone, generally, a higher concentration of microplastics might be expected in this region compared to the open ocean.
Another point is that the Kara Gate, as a part of the Northern Sea Route, experiences relatively significant maritime activity. This high traffic maritime zone is a potential hotspot for the introduction of microplastics into the marine environment due to operational activities, including waste discharge, cargo handling, shipping accidents, and hull maintenance. Ships can discharge microplastics through the dumping of waste and litter, the spilling of cargo that contains plastic materials, or the release of gray and black water that contains synthetic fibers from laundry.
Approximately 80% of the plastic coming from ships or maritime activities originates from fishing ships, especially their gear (Deville et al., 2023). Modern fishing nets and ropes are predominantly made from three types of polymers: polypropylene, polyethylene, and nylon (Lipinski et al., 2020). Within the whole Kara Sea microfibers were only identified in the Kara Gate, and their composition predominantly of PP (polypropylene) strongly suggests an origin linked to fishing and shipping activities.
Comparison with previous studies
Currently, data on floating microplastics in the Eurasian part of the Arctic, excluding the findings from this study, are limited to 3 publications (see Table 2). The table below also includes data by (Ikenoue et al., 2023) as Abundances (items/km2) were presented there.
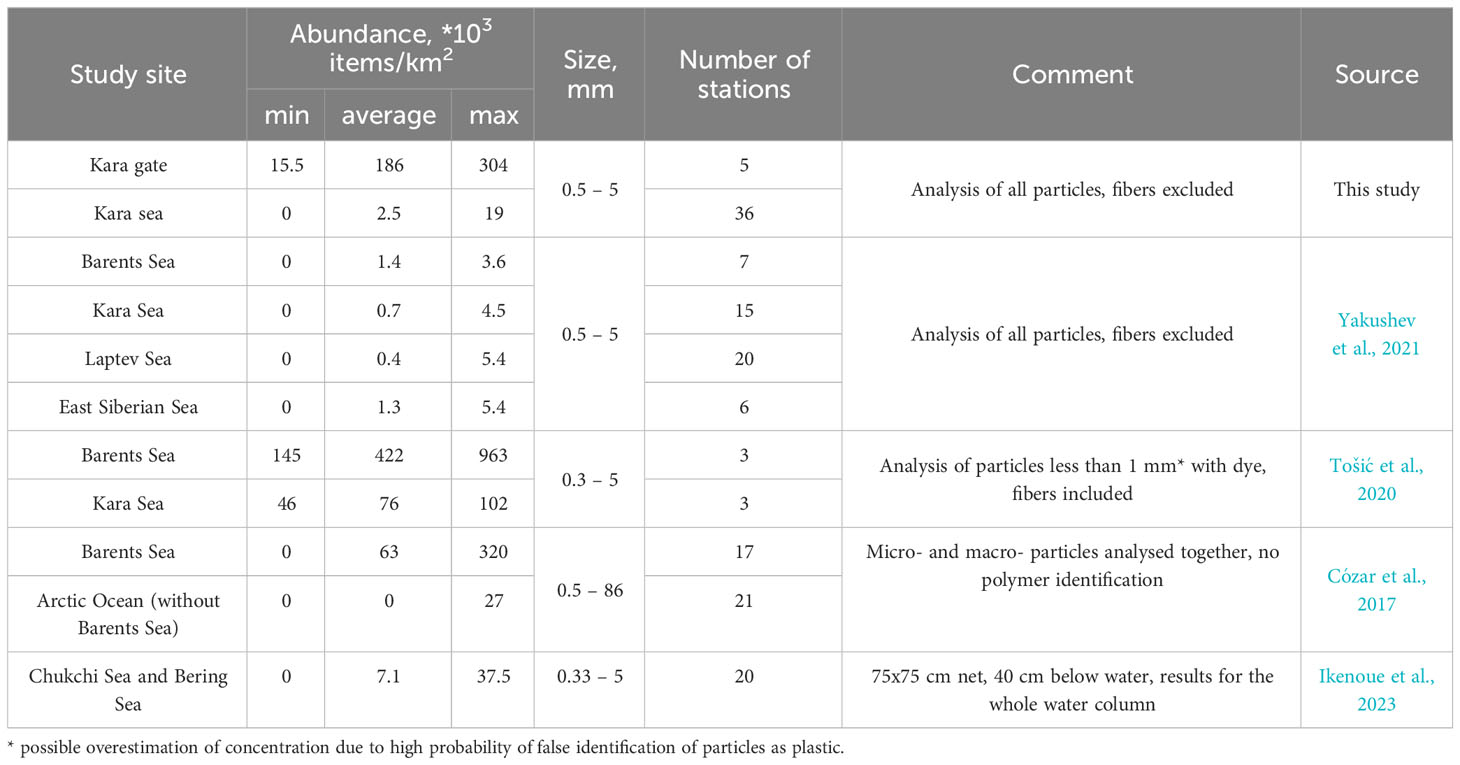
Table 2 Comparison of the data presented in the paper with previous studies.
Cózar et al., 2017 sampled both micro- and macroplastics, while the Tošić et al., 2020 focused on smaller particle sizes and also included fibers in their data analysis. These methodological differences can lead to higher reported plastic concentrations and hinder direct data comparisons. Nonetheless, a shared trend across all three studies is evident: the highest concentrations are observed in the Barents Sea, decreasing eastward. The average abundance of microplastics in the Kara Sea was found to be comparable to the data presented by (Ikenoue et al., 2023) for the Chukchi Sea.
Conclusions
The study presents the first extensive survey of surface microplastics in the Kara Sea that allowed to compare the abundances and characteristics of particles between different regions of the sea. In particular, sampling of the floating microplastics was performed at the northernmost station at 83N. This enabled us to show that microplastics spread from its sources northward to the central Arctic basin and that it is not free from microplastic pollution.
The highest concentrations were observed in the Kara Gate, providing a hint, that water inflow here may serve as a substantial source of microplastics in the Kara Sea. At the same time Ob and Yenisey rivers are unlikely to supply significant amount of microplastic particles. Interestingly, riverine microplastics differ by its chemical composition from those in saline waters and are dominated by EPS. This feature allows us to indirectly trace the presence of microplastics coming from rivers in the Northern Kara Sea. However, the chemical profile points that the main contributions to microplastics supply to the North of the Kara Sea are made by the Barents Sea waters coming through the Kara Gate and waters brought by Western Novaya Zemlya Current.
The results reveal the potential of the Kara Sea to accumulate the microplastics due to its semi-enclosed nature and complex interplay between inflow of waters originating from the North Atlantic and Ob-Yenisey river plume.
Data availability statement
The original contributions presented in the study are included in the article/Supplementary Material. Further inquiries can be directed to the corresponding author.
Author contributions
AB: Investigation, Software, Visualization, Writing – original draft, Writing – review & editing. SP: Conceptualization, Investigation, Methodology, Validation, Writing – original draft, Writing – review & editing. IZ: Investigation, Methodology, Writing – original draft, Writing – review & editing. OM: Investigation, Methodology, Writing – original draft, Writing – review & editing. TP: Data curation, Formal Analysis, Investigation, Software, Visualization, Writing – original draft, Writing – review & editing. MN: Data curation, Investigation, Writing – review & editing. MP: Conceptualization, Investigation, Writing – review & editing. AO: Conceptualization, Funding acquisition, Project administration, Resources, Writing – review & editing. NS: Conceptualization, Funding acquisition, Project administration, Resources, Writing – review & editing. EY: Conceptualization, Project administration, Supervision, Writing – review & editing.
Funding
The author(s) declare financial support was received for the research, authorship, and/or publication of this article. This work was partly funded by the Norwegian Ministry of Climate and Environment project RUS-19/0001 “Establish regional capacity to measure and model the distribution and input of microplastics to the Barents Sea from rivers and currents (ESCIMO)”, “Model-based mapping of marine litter and microplastic in the Barents Sea (MAMBA) and Research council of Norway project "Bio-essential and toxic elements transformation and transport in the Arctic under pressure of Siberian Continental Shelf permafrost thawing (BEST-Siberian)". SP was supported by FMWE-2021-0016; EY, IZ were supported by FMWE-2021-0001 and NFR project 315317. MP was supported by Tomsk State University Development Programme (Priority2030). All financial support and project activity were finalised prior to the Russian invasion of Ukraine. AO was supported by the Moscow Institute of Physics and Technology development program Priority-2030.
Acknowledgments
The authors wish to thank the crews of R/V “Akademik Ioffe” for their valuable support in our Arctic surveys, especially captain Andrey Zybin and chief mate Sergey Ponomarenko. The authors wish to thank the “Floating University” scientific and educational program for support in organisation of field measurements.
Conflict of interest
The authors declare that the research was conducted in the absence of any commercial or financial relationships that could be construed as a potential conflict of interest.
Publisher’s note
All claims expressed in this article are solely those of the authors and do not necessarily represent those of their affiliated organizations, or those of the publisher, the editors and the reviewers. Any product that may be evaluated in this article, or claim that may be made by its manufacturer, is not guaranteed or endorsed by the publisher.
Supplementary material
The Supplementary Material for this article can be found online at: https://www.frontiersin.org/articles/10.3389/fmars.2023.1268879/full#supplementary-material
References
AMAP (2021). AMAP litter and microplastics monitoring guidelines. Version 1.0. (Tromsø, Norway: Arctic Monitoring and Assessment Programme (AMAP)). 257pp.
Cózar A., Martí E., Duarte C. M., García-de-Lomas J., van Sebille E., Ballatore T. J., et al. (2017). The Arctic Ocean as a dead end for floating plastics in the North Atlantic branch of the Thermohaline Circulation. Sci. Adv. 3 (4), e1600582. doi: 10.1126/sciadv.1600582
Deville A., Vazquez-Rowe I., Ita-Nagy D., Kahhat R. (2023). Ocean-based sources of plastic pollution: an overview of the main marine activities in the Peruvian EEZ. Mar. pollut. Bull. 189, 114785. doi: 10.1016/j.marpolbul.2023.114785
European Union-Copernicus Marine Service (2022). Global ocean hourly sea surface wind and stress from scatterometer and model (Mercator Ocean International). doi: 10.48670/MOI-00305
Frank Y. A., Vorobiev D. S., Kayler O. A., Vorobiev E. D., Kulinicheva K. S., Trifonov A. A., et al. (2021). Evidence for microplastics contamination of the remote tributary of the yenisei river, siberia—The pilot study results. Water 13 (22), 3248. doi: 10.3390/w13223248
Galimov E. M., Kodina L. A., Stepanets O. V., Korobeinik G. S. (2006). Biogeochemistry of the Russian Arctic. Kara Sea: research results under the SIRRO project 1995–2003. Geochemistry Int. 44 (11), 1053–1104. doi: 10.1134/S0016702906110012
Grøsvik B. E., Prokhorova T., Eriksen E., Krivosheya P., Horneland P. A., Prozorkevich D. (2018). Assessment of marine litter in the barents sea, a part of the joint norwegian–Russian ecosystem survey. Front. Mar. Sci. 5. doi: 10.3389/fmars.2018.00072
Harms I. H., Karcher M. J. (1999). Modeling the seasonal variability of hydrography and circulation in the Kara Sea. J. Geophysical Research: Oceans 104 (C6), 13431–13448. doi: 10.1029/1999JC900048
Huntington A., Corcoran P. L., Jantunen L., Thaysen C., Bernstein S., Stern G. A., et al. (2020). A first assessment of microplastics and other anthropogenic particles in Hudson Bay and the surrounding eastern Canadian Arctic waters of Nunavut. FACETS 5 (1), 432–454. doi: 10.1139/facets-2019-0042
Ikenoue T., Nakajima R., Fujiwara A., Onodera J., Itoh M., Toyoshima J., et al. (2023). Horizontal distribution of surface microplastic concentrations and water-column microplastic inventories in the Chukchi Sea, western Arctic Ocean. Sci. Total Environ., 159564. doi: 10.1016/j.scitotenv.2022.159564
Ikenoue T., Yamada M., Ishii N., Kudo N., Shirotani Y., Ishida Y., et al. (2022). Cesium-137 and 137Cs/133Cs atom ratios in marine zooplankton off the east coast of Japan during 2012–2020 following the Fukushima Dai-ichi nuclear power plant accident. Environ. pollut. 311, 119962. doi: 10.1016/j.envpol.2022.119962
Kanhai L. D. K., Gardfeldt K., Krumpen T., Thompson R. C., O’Connor I. (2020). Microplastics in sea ice and seawater beneath ice floes from the Arctic Ocean. Sci. Rep. 10 (1), 5004. doi: 10.1038/s41598-020-61948-6
Kim S.-K., Lee H.-J., Kim J.-S., Kang S.-H., Yang E.-J., Cho K.-H., et al. (2021). Importance of seasonal sea ice in the western Arctic ocean to the Arctic and global microplastic budgets. J. Hazardous Materials 418, 125971. doi: 10.1016/j.jhazmat.2021.125971
Kubryakov A., Stanichny S., Zatsepin A. (2016). River plume dynamics in the Kara Sea from altimetry-based lagrangian model, satellite salinity and chlorophyll data. Remote Sens. Environ. 176, 177–187. doi: 10.1016/j.rse.2016.01.020
Lipinski B. M., Morris L. S., Silberstein M. N., Coates G. W. (2020). Isotactic poly(propylene oxide): a photodegradable polymer with strain hardening properties. J. Am. Chem. Soc 142, 6800–6806. doi: 10.1021/jacs.0c01768
Lusher A. L., Munno K., Hermabessiere L., Carr S. (2020). Isolation and extraction of microplastics from environmental samples: an evaluation of practical approaches and recommendations for further harmonization. Appl. Spectrosc. 74 (9), 1049–1065. doi: 10.1177/0003702820938993
Lusher A. L., Tirelli V., O’Connor I., Officer R. (2015). Microplastics in Arctic polar waters: the first reported values of particles in surface and sub-surface samples. Sci. Rep. 5 (1), 14947. doi: 10.1038/srep14947
Mato Y., Isobe T., Takada H., Kanehiro H., Ohtake C., Kaminuma T. (2001). Plastic resin pellets as a transport medium for toxic chemicals in the marine environment. Environ. Sci. Technol. 35 (2), 318–324. doi: 10.1021/es0010498
McClimans T. A., Johnson D. R., Krosshavn M., King S. E., Carroll J., Grenness Ø. (2000). Transport processes in the Kara Sea. J. Geophysical Research: Oceans 105 (C6), 14121–14139. doi: 10.1029/1999JC000012
Morozov E. G., Parrilla-Barrera G., Velarde M. G., Scherbinin A. D. (2003). The straits of Gibraltar and Kara Gates: a comparison of internal tides. Oceanologica Acta 26 (3), 231–241. doi: 10.1016/S0399-1784(03)00023-9
Mountford A. S., Morales Maqueda M. A. (2021). Modeling the accumulation and transport of microplastics by sea ice. J. Geophysical Research: Oceans 126 (2). doi: 10.1029/2020JC016826
Novikov M. A., Gorbacheva E. A., Prokhorova T. A., Kharlamova M. N. (2021). Composition and distribution of marine anthropogenic litter in the Barents Sea. Oceanology 61 (1), 48–57. doi: 10.1134/S0001437021010148
Obbard R. W., Sadri S., Wong Y. Q., Khitun A. A., Baker I., Thompson R. C. (2014). Global warming releases microplastic legacy frozen in Arctic Sea ice. Earth’s Future 2 (6), 315–320. doi: 10.1002/2014EF000240
Osadchiev A. A., Izhitskiy A. S., Zavialov P. O., Kremenetskiy V. V., Polukhin A. A., Pelevin V. V., et al. (2017). Structure of the buoyant plume formed by Ob and Y enisei river discharge in the southern part of the Kara Sea during summer and autumn. J. Geophysical Research: Oceans 122 (7), 5916–5935. doi: 10.1002/2016JC012603
Osadchiev A. A., Pisareva M. N., Spivak E. A., Shchuka S. A., Semiletov I. P. (2020). Freshwater transport between the Kara, Laptev, and East-Siberian seas. Sci. Rep. 10 (1), 13041. doi: 10.1038/s41598-020-70096-w
Pakhomova S., Berezina A., Lusher A. L., Zhdanov I., Silvestrova K., Zavialov P., et al. (2022). Microplastic variability in subsurface water from the Arctic to Antarctica. Environ. pollut. 298, 118808. doi: 10.1016/j.envpol.2022.118808
Pakhomova S., Zhdanov I., Berezina A., Mekhova O., Yakushev E. (2023). Spatial and interannual trends of surface water microplastics pollution in the Eurasian Arctic (Tromsø, Norway: Arctic Frontiers 2023 Moving North).
Panteleev G., Proshutinsky A., Kulakov M., Nechaev D. A., Maslowski W. (2007). Investigation of the summer Kara Sea circulation employing a variational data assimilation technique. J. Geophysical Research: Oceans 112 (4), 1–21. doi: 10.1029/2006JC003728
Pavlov V. K., Baskakov G. A., Timohov L. A. (1994). Hydrometeorological regime of the Kara, Laptev and east Siberian Seas. Arctic Antarctic Res. Institute 179.
Peeken I., Primpke S., Beyer B., Gütermann J., Katlein C., Krumpen T., et al. (2018). Arctic sea ice is an important temporal sink and means of transport for microplastic. Nat. Commun. 9 (1), 1505. doi: 10.1038/s41467-018-03825-5
Pfirman S. L., Kögeler J. W., Rigor I. (1997). Potential for rapid transport of contaminants from the Kara Sea. Sci. Total Environ. 202 (1–3), 111–122. doi: 10.1016/S0048-9697(97)00108-3
Primpke S., Wirth M., Lorenz C., Gerdts G. (2018). Reference database design for the automated analysis of microplastic samples based on Fourier transform infrared (FTIR) spectroscopy. Analytical Bioanalytical Chem. 410 (21), 5131–5141. doi: 10.1007/s00216-018-1156-x
Rogozhin V., Osadchiev A., Konovalova O. (2023). Structure and variability of the Pechora plume in the southeastern part of the Barents Sea. Front. Mar. Sci. 10. doi: 10.3389/fmars.2023.1052044
Tošić T. N., Vruggink M., Vesman A. (2020). Microplastics quantification in surface waters of the Barents, Kara and White Seas. Mar. pollut. Bull. 161, 111745. doi: 10.1016/j.marpolbul.2020.111745
van Sebille E., Aliani S., Law K. L., Maximenko N., Alsina J. M., Bagaev A., et al. (2020). The physical oceanography of the transport of floating marine debris. Environ. Res. Lett. 15 (2), 023003. doi: 10.1088/1748-9326/ab6d7d
Yakushev E., Gebruk A., Osadchiev A., Pakhomova S., Lusher A., Berezina A., et al. (2021). Microplastics distribution in the Eurasian Arctic is affected by Atlantic waters and Siberian rivers. Commun. Earth Environ. 2 (1), 23. doi: 10.1038/s43247-021-00091-0
Keywords: microplastic, Arctic, Kara Sea, Kara Gate, Ob and Yenisey plumes
Citation: Berezina A, Pakhomova S, Zhdanov I, Mekhova O, Polivanova T, Novikov M, Pogojeva M, Osadchiev A, Stepanova N and Yakushev E (2023) Surface microplastics in the Kara Sea: from the Kara Gate to the 83°N. Front. Mar. Sci. 10:1268879. doi: 10.3389/fmars.2023.1268879
Received: 28 July 2023; Accepted: 23 October 2023;
Published: 07 November 2023.
Edited by:
Fabiana Corami, National Research Council (CNR), ItalyReviewed by:
Takahito Ikenoue, Japan Agency for Marine-Earth Science and Technology (JAMSTEC), JapanAtsuhiko Isobe, Kyushu University, Japan
Anna Vesman, Arctic and Antarctic Research Institute (AARI), Russia
Copyright © 2023 Berezina, Pakhomova, Zhdanov, Mekhova, Polivanova, Novikov, Pogojeva, Osadchiev, Stepanova and Yakushev. This is an open-access article distributed under the terms of the Creative Commons Attribution License (CC BY). The use, distribution or reproduction in other forums is permitted, provided the original author(s) and the copyright owner(s) are credited and that the original publication in this journal is cited, in accordance with accepted academic practice. No use, distribution or reproduction is permitted which does not comply with these terms.
*Correspondence: Anfisa Berezina, YW5maXNhLmJlcmV6aW5hQG5pdmEubm8=