 Ellen Oldenburg
 Raphael M. Kronberg
 Barbara Niehoff
 Oliver Ebenhöh
 Ovidiu Popa
- 1Institute of Theoretical and Quantitative Biology, Heinrich Heine University, Düsseldorf, North Rhine-Westphalia, Germany
- 2Cluster of Excellence on Plant Sciences, Heinrich Heine University, Düsseldorf, North Rhine-Westphalia, Germany
- 3Mathematical Modelling of Biological Systems, Heinrich Heine University, Düsseldorf, North Rhine-Westphalia, Germany
- 4Polar Biological Oceanography, Alfred- Wegener- Institut Helmholtz Center for Polar and Marine Research, Bremerhaven, Germany
Zooplankton play a crucial role in the ocean’s ecology, as they form a foundational component in the food chain by consuming phytoplankton or other zooplankton, supporting various marine species and influencing nutrient cycling. The vertical distribution of zooplankton in the ocean is patchy, and its relation to hydrographical conditions cannot be fully deciphered using traditional net casts due to the large depth intervals sampled. The Lightframe On-sight Keyspecies Investigation (LOKI) concentrates zooplankton with a net that leads to a flow-through chamber with a camera taking images. These high-resolution images allow for the determination of zooplankton taxa, often even to genus or species level, and, in the case of copepods, developmental stages. Each cruise produces a substantial volume of images, ideally requiring onboard analysis, which presently consumes a significant amount of time and necessitates internet connectivity to access the EcoTaxa Web service. To enhance the analyses, we developed an AI-based software framework named DeepLOKI, utilizing Deep Transfer Learning with a Convolution Neural Network Backbone. Our DeepLOKI can be applied directly on board. We trained and validated the model on pre-labeled images from four cruises, while images from a fifth cruise were used for testing. The best-performing model, utilizing the self-supervised pre-trained ResNet18 Backbone, achieved a notable average classification accuracy of 83.9%, surpassing the regularly and frequently used method EcoTaxa (default) in this field by a factor of two. In summary, we developed a tool for pre-sorting high-resolution black and white zooplankton images with high accuracy, which will simplify and quicken the final annotation process. In addition, we provide a user-friendly graphical interface for the DeepLOKI framework for efficient and concise processes leading up to the classification stage. Moreover, performing latent space analysis on the self-supervised pre-trained ResNet18 Backbone could prove advantageous in identifying anomalies such as deviations in image parameter settings. This, in turn, enhances the quality control of the data. Our methodology remains agnostic to the specific imaging end system used, such as Loki, UVP, or ZooScan, as long as there is a sufficient amount of appropriately labeled data available to enable effective task performance by our algorithms.
1 Introduction
Imaging has become an important tool in marine zooplankton studies, in both the laboratory and the field, in the last decades (Gorsky et al., 1989; Schulz et al., 2010; Hauss et al., 2016; Kiko et al., 2020; Rubbens et al., 2023). To digitize and analyze preserved samples that have been collected by traditional net tows, the lab-based ZooScan system (Grosjean et al., 2004) has been developed. Also, several in-situ systems that continuously take images during deployment have been developed, allowing the study of the patchy distribution of particles and zooplankton organisms (Cowen and Guigand, 2008; Lertvilai, 2020). Among these, the underwater vision profiler (UVP, Hydroptic, France) is one of the most frequently used, being deployed worldwide (Picheral et al., 2010; Kiko et al., 2020; Picheral et al., 2022). The UVP takes images directly in the water column; therefore often the resolution is limited. However, it excels at capturing fragile organisms such as gelatinous zooplankton and particles that are typically destroyed by zooplankton nets. The LOKI (Lightframe-Onsight Key species Investigation; Isitec, Germany) system, in contrast, has been designed to collect high-resolution images by concentrating the zooplankton with a net that leads to a flow-through chamber with a digital camera (Schulz et al., 2010). LOKI captures images of genera or species and sometimes even developmental stages of rather hard-bodied organisms such as copepods, which often dominate zooplankton communities (Hirche et al., 2014; Orenstein et al., 2022). The device captures images continuously during vertical drops and records hydrographic parameters, including salinity, temperature, oxygen concentration and fluorescence. This enables a thorough analysis of the species distribution. For general in-situ zooplankton images, various approaches for digital classification have been employed (Rubbens et al., 2023). Initially, ensemble models were used (Schmid et al., 2016). With advancements in computing power, Deep Learning approaches emerged (LeCun et al., 2015), leveraging convolutional neural networks to process entire images and extract intricate patterns (Luo et al., 2018). Additionally, Transfer Learning, which involves the transfer of knowledge from large datasets to smaller ones (Yosinski et al., 2014), has been employed in Deep Learning algorithms to enhance their performance (Orenstein and Beijbom, 2017; Orenstein et al., 2022). For UVP and ZooScan images, the analysis software ZooProcess, a macro of ImageJ, and the web-based annotation tool EcoTaxa (Picheral et al., 2017) have been developed. In addition, there are numerous other methods (Bi et al., 2015; Bi et al., 2022; Yue et al., 2023). ZooProcess extracts numerical parameters from each image and automatically measures the size of each object (Grosjean et al., 2004; Picheral et al., 2017). EcoTaxa is then used to annotate the images, i.e., to sort the objects on the images into categories and label each image accordingly. EcoTaxa also allows to manually drag and drop images into the respective category; however, the application also provides automated annotation functionality through a Random Forest algorithm to predict the categories based on numerical image parameters. The algorithm must be trained with annotated images, and the better the training set, the more accurate the prediction is. For example, depending on the taxonomic resolution, over 80% of zooplankton images from the Fram Strait that were taken with ZooScan were correctly annotated (B. Niehoff, pers. obs.).
For the analysis of LOKI images, a software tool - the LOKI browser - was developed and provided together with LOKI hardware (Schulz et al., 2010). Similar to ZooProcess, this application generates numeric image descriptors and, similar to EcoTaxa, allows to sort the objects into categories. Unfortunately, the LOKI browser is outdated and lacks user-friendliness. For instance, the process of uploading more than 150,000 images from a single cruise requires manual handling of small batches of 2,000-5,000 images. Furthermore, the annotation procedure is inconvenient as it does not provide direct access to specific categories but requires traversing the entire taxonomic tree, which results in multiple clicks per image, especially in the case of species categorization. It also has to be noted that working on the EcoTaxa server requires a stable internet connection, which is not always a given during cruises to remote areas such as the Arctic. Therefore, the image data can typically only be processed after the cruise. In summary, the current workflow for LOKI images faces several issues: the time-consuming and upload-limited image pre-processing, the low prediction accuracy, and the dependence on internet access. Addressing these issues, we present an alternative workflow. (1) We developed two deep learning methods using the images as input instead of image descriptors and thus omitted the tedious upload to the LOKI browser, saving time and personnel. Aiming at a better prediction of the categories, we implemented a deep transfer learning (DTL) and a two-step self-supervised learning approach based on first pre-train self-supervised and then fine-tuning supervised, called self-distillation with no labels (DINO), which currently is one of the state of the art methods (Chen et al., 2020; He et al., 2020; Caron et al., 2021). To ensure that only images with a high level of confidence in their label assignments are sorted into their respective categories, we implemented a confidence threshold, which is only used within the GUI as a parameter and not for training or evaluation. A similar approach for threshold implementation on CNNs was previously shown by (Kraft et al., 2022). By implementing this threshold, we can effectively exclude images for which the algorithm exhibits lower confidence in label assignments, thereby enabling a more precise categorization relying on confident predictions (on inference). As provided in EcoTaxa, we’ve included categories for artifacts such as bubbles, detritus, and unknown objects to allow for the categorization of these as well. (2) To allow for immediate analyses onboard, we adopted a small backbone model that is suitable for deployment on mobile laptops for both our methods, eliminating the need for constant internet connectivity. The objectives of this study thus were to enhance the classification accuracy in comparison to the existing workflow for zooplankton image analyses and to provide a user-friendly approach that can be readily applied on board. We utilized a dataset of 215,000 images from five cruises, which had been fully annotated at Alfred-Wegener-Institut (AWI) in advance, to perform a comprehensive evaluation of a reference dataset to assess and compare the efficiency of three distinct methods: the EcoTaxa workflow, as well as two innovative deep learning approaches, i.e., DTL and DINO.
2 Methods
2.1 Data
Please note: In this paper, we use category for the technical term class to avoid confusion with the biological term (taxa) classes. The technical term class, which we call category, refers to a collection of pictures containing similar motifs that are building a group after the classification procedure. In contrast, the taxonomical term class (for example, Ostracoda or Copepoda) refers to the rank of the organisms in an ancestral or hereditary hierarchy.
For the present study, we used images that were taken with the optical plankton recorder Lightframe On-Sight Keyspecies Investigation (LOKI) in Fram Strait during five expeditions of RV Polarstern (Table 1). Each of the 33 categories used in this study corresponds to a group of zooplankton fauna at several taxonomic levels (Supplementary Material DeepLOKI Section 2). LOKI consists of a net (150µm mesh size) that concentrates the plankton during a vertical tow from a maximum of 1000m depth to the surface. The net leads to a flow-through chamber with a 6.1 MP camera (Prosilica GT 2750 with Sony ICX694 runs 19.8 frames per second at 6.1 MP resolution.) that takes images at a frame rate of max. 20sec−1. At the same time, sensors record depth, temperature, salinity, fluorescence, and oxygen concentration. The LOKI underwater computer extracts objects and stores the resulting images as well as sensor data on a hard drive (Schulz et al., 2010).
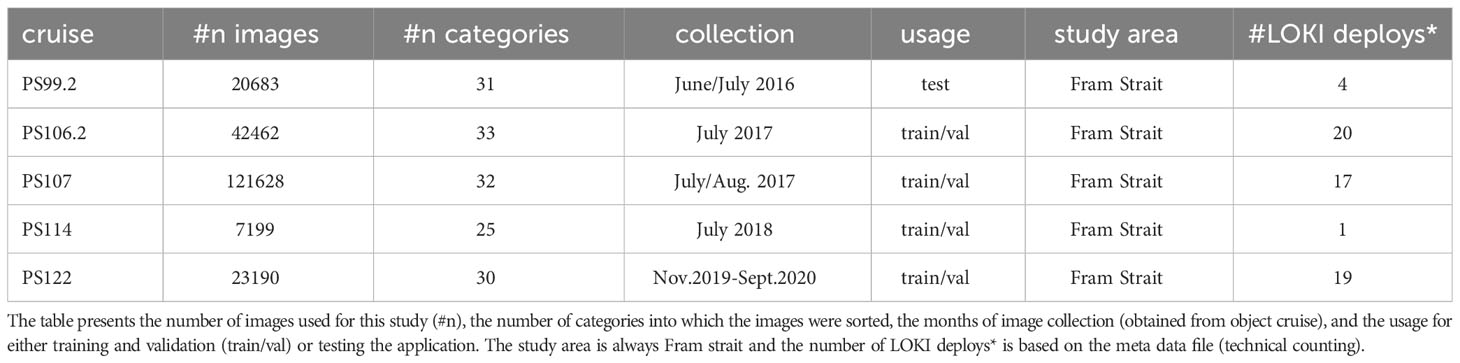
Table 1 Overview of LOKI images from five RV Polarstern cruises.
2.2 Workflow
Once the LOKI images are captured, they are stored on a hard drive. Depending on the classification tool being used, there are two distinct data pre-processing pipelines Figure 1. The current approach involves preparing the data for classification using EcoTaxa by importing the images into a specialized “LOKI browser” software, which calculates numeric features (Schulz et al., 2010). However, due to computational limitations and the need for internet access, the subsequent steps must be carried out after the cruise. This involves applying ZOOMIE software (Schmid et al., 2015) to exclude multiple images of the same organism, followed by loading the data into EcoTaxa for classification and storage Figure 1. In contrast, our proposed pipeline involves only one step. The DeepLOKI tool can directly classify raw images without any preparation steps like, for example, feature extraction by the LOKI browser. As a final stage at the end of both pipelines, a human carries out a final assessment of the pre-sorted images. During this process, any necessary label corrections and duplicate removals are made Figure 1. We display the current and the proposed workflow (Figures 1, 2).
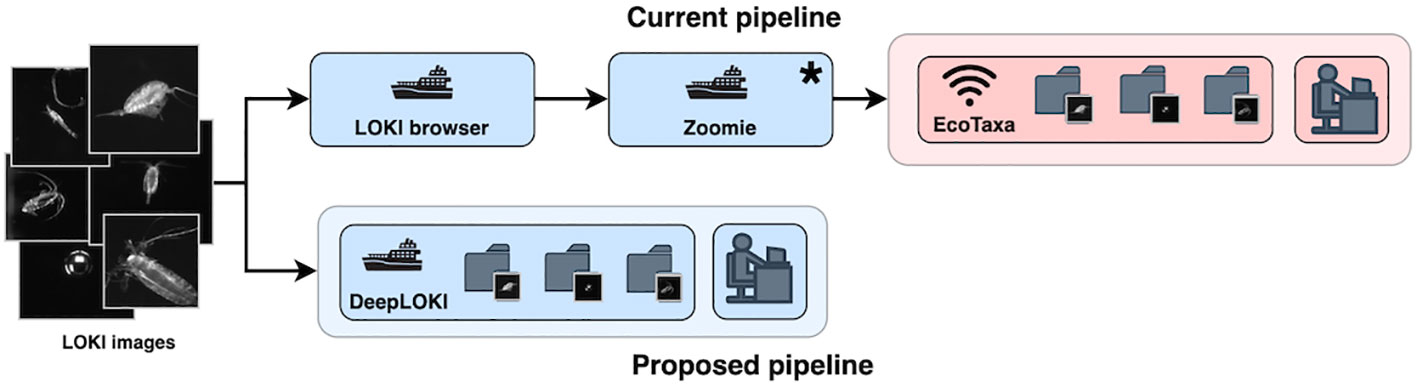
Figure 1 Overview of the current workflow (top) and the DeepLOKI pipeline (bottom) to categorize objects on LOKI images. Current pipeline: images are loaded into the LOKI Browser, then processed with ZOOMIE to remove double takes, and loaded to the EcoTaxa website for automatic classification based on numeric image parameters fed to random-forest algorithms, and finally for a quality check by a scientist. The DeepLOKI pipeline consists of the automatic classification of images based on one of the two variants of the ResNet18 neural network (DTL or DINO), and a final check by a scientist as well. Blue boxes: step can be performed on the ship; red box: step requires internet access. Optional steps are indicated by *.
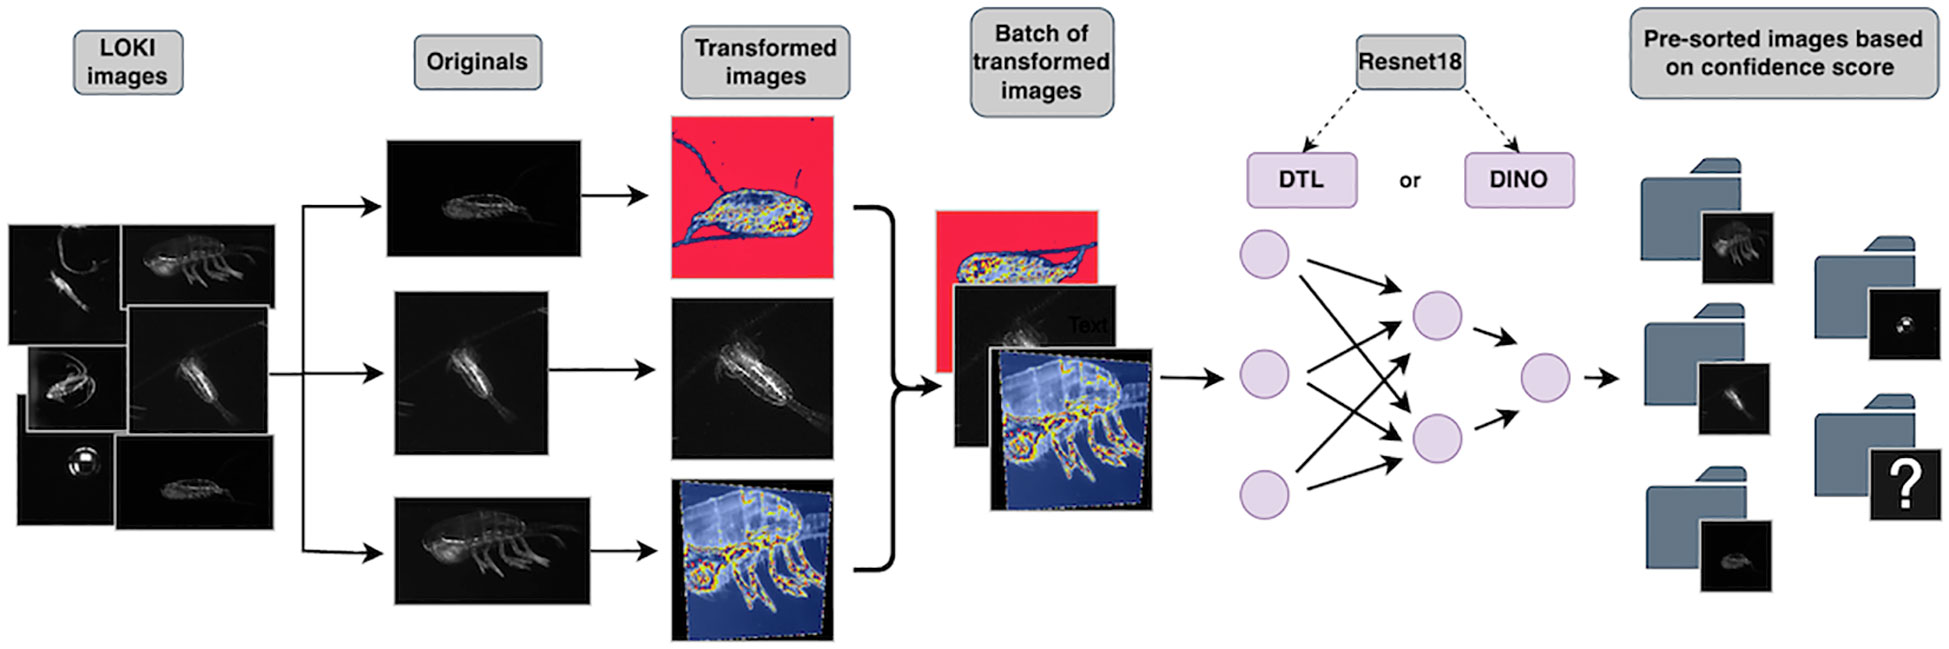
Figure 2 DeepLOKI workflow in detail: Images extracted from LOKI undergo augmentation through torchvision transform functions such as cropping, flipping, and auto-contrast. These augmented images are then inputted into one of the two variants of the ResNet18 neural network for classification (DTL, DINO). Our approach consists of two steps, first data training and classification and second data sorting in particular group after passing a confidence threshold, that we identify as classification likelihood. Images that fall below the threshold are moved to a folder labeled as unknown/unclear.
2.3 Data acquisition and ground truth
For the classification procedure, we used the images from all five cruises after applying ZOOMIE to reduce the number of duplicates.
To develop the new pipeline, we used a data set of 194,479 (train/val) images (Supplementary Material DeepLOKI Table S3) that, in addition, underwent parameterization using the LOKI browser. All objects on these LOKI images were previously identified by zooplankton scientists, often through manual efforts in order to reach the lowest possible taxonomic level. In our study, however, we aimed at a less detailed distinction of taxa, and thus, we combined categories to higher taxonomic levels
(see (Supplementary Material DeepLOKI Table S3), Figure 3). For instance, we grouped the several morphologically very similar developmental stages of specific copepod species, as determined by marine biologists, into a single species category. We, however, solely utilized the images themselves and not their associated parameters. Additionally, we analyzed a dataset for double takes using ZOOMIE and re-categorized the images with EcoTaxa, including both automatic predictions and final evaluations by a scientist. To ensure accurate model development, 80% of these images were randomly chosen for training purposes. The remaining 20% of the data was reserved exclusively for internal model validation, ensuring its reliability. To evaluate the model’s effectiveness, images from the fifth cruise (Supplementary Material DeepLOKI Table S3) that had not been used for pipeline development were used, providing an objective measure of its performance. The dataset encompassed various quantities of images within its categories, with the smallest category, Foraminifera, comprising n = 121 images, while the largest category, (Copepoda_Calanus), contained n =43,620 images (Supplementary Material DeepLOKI Table S3).
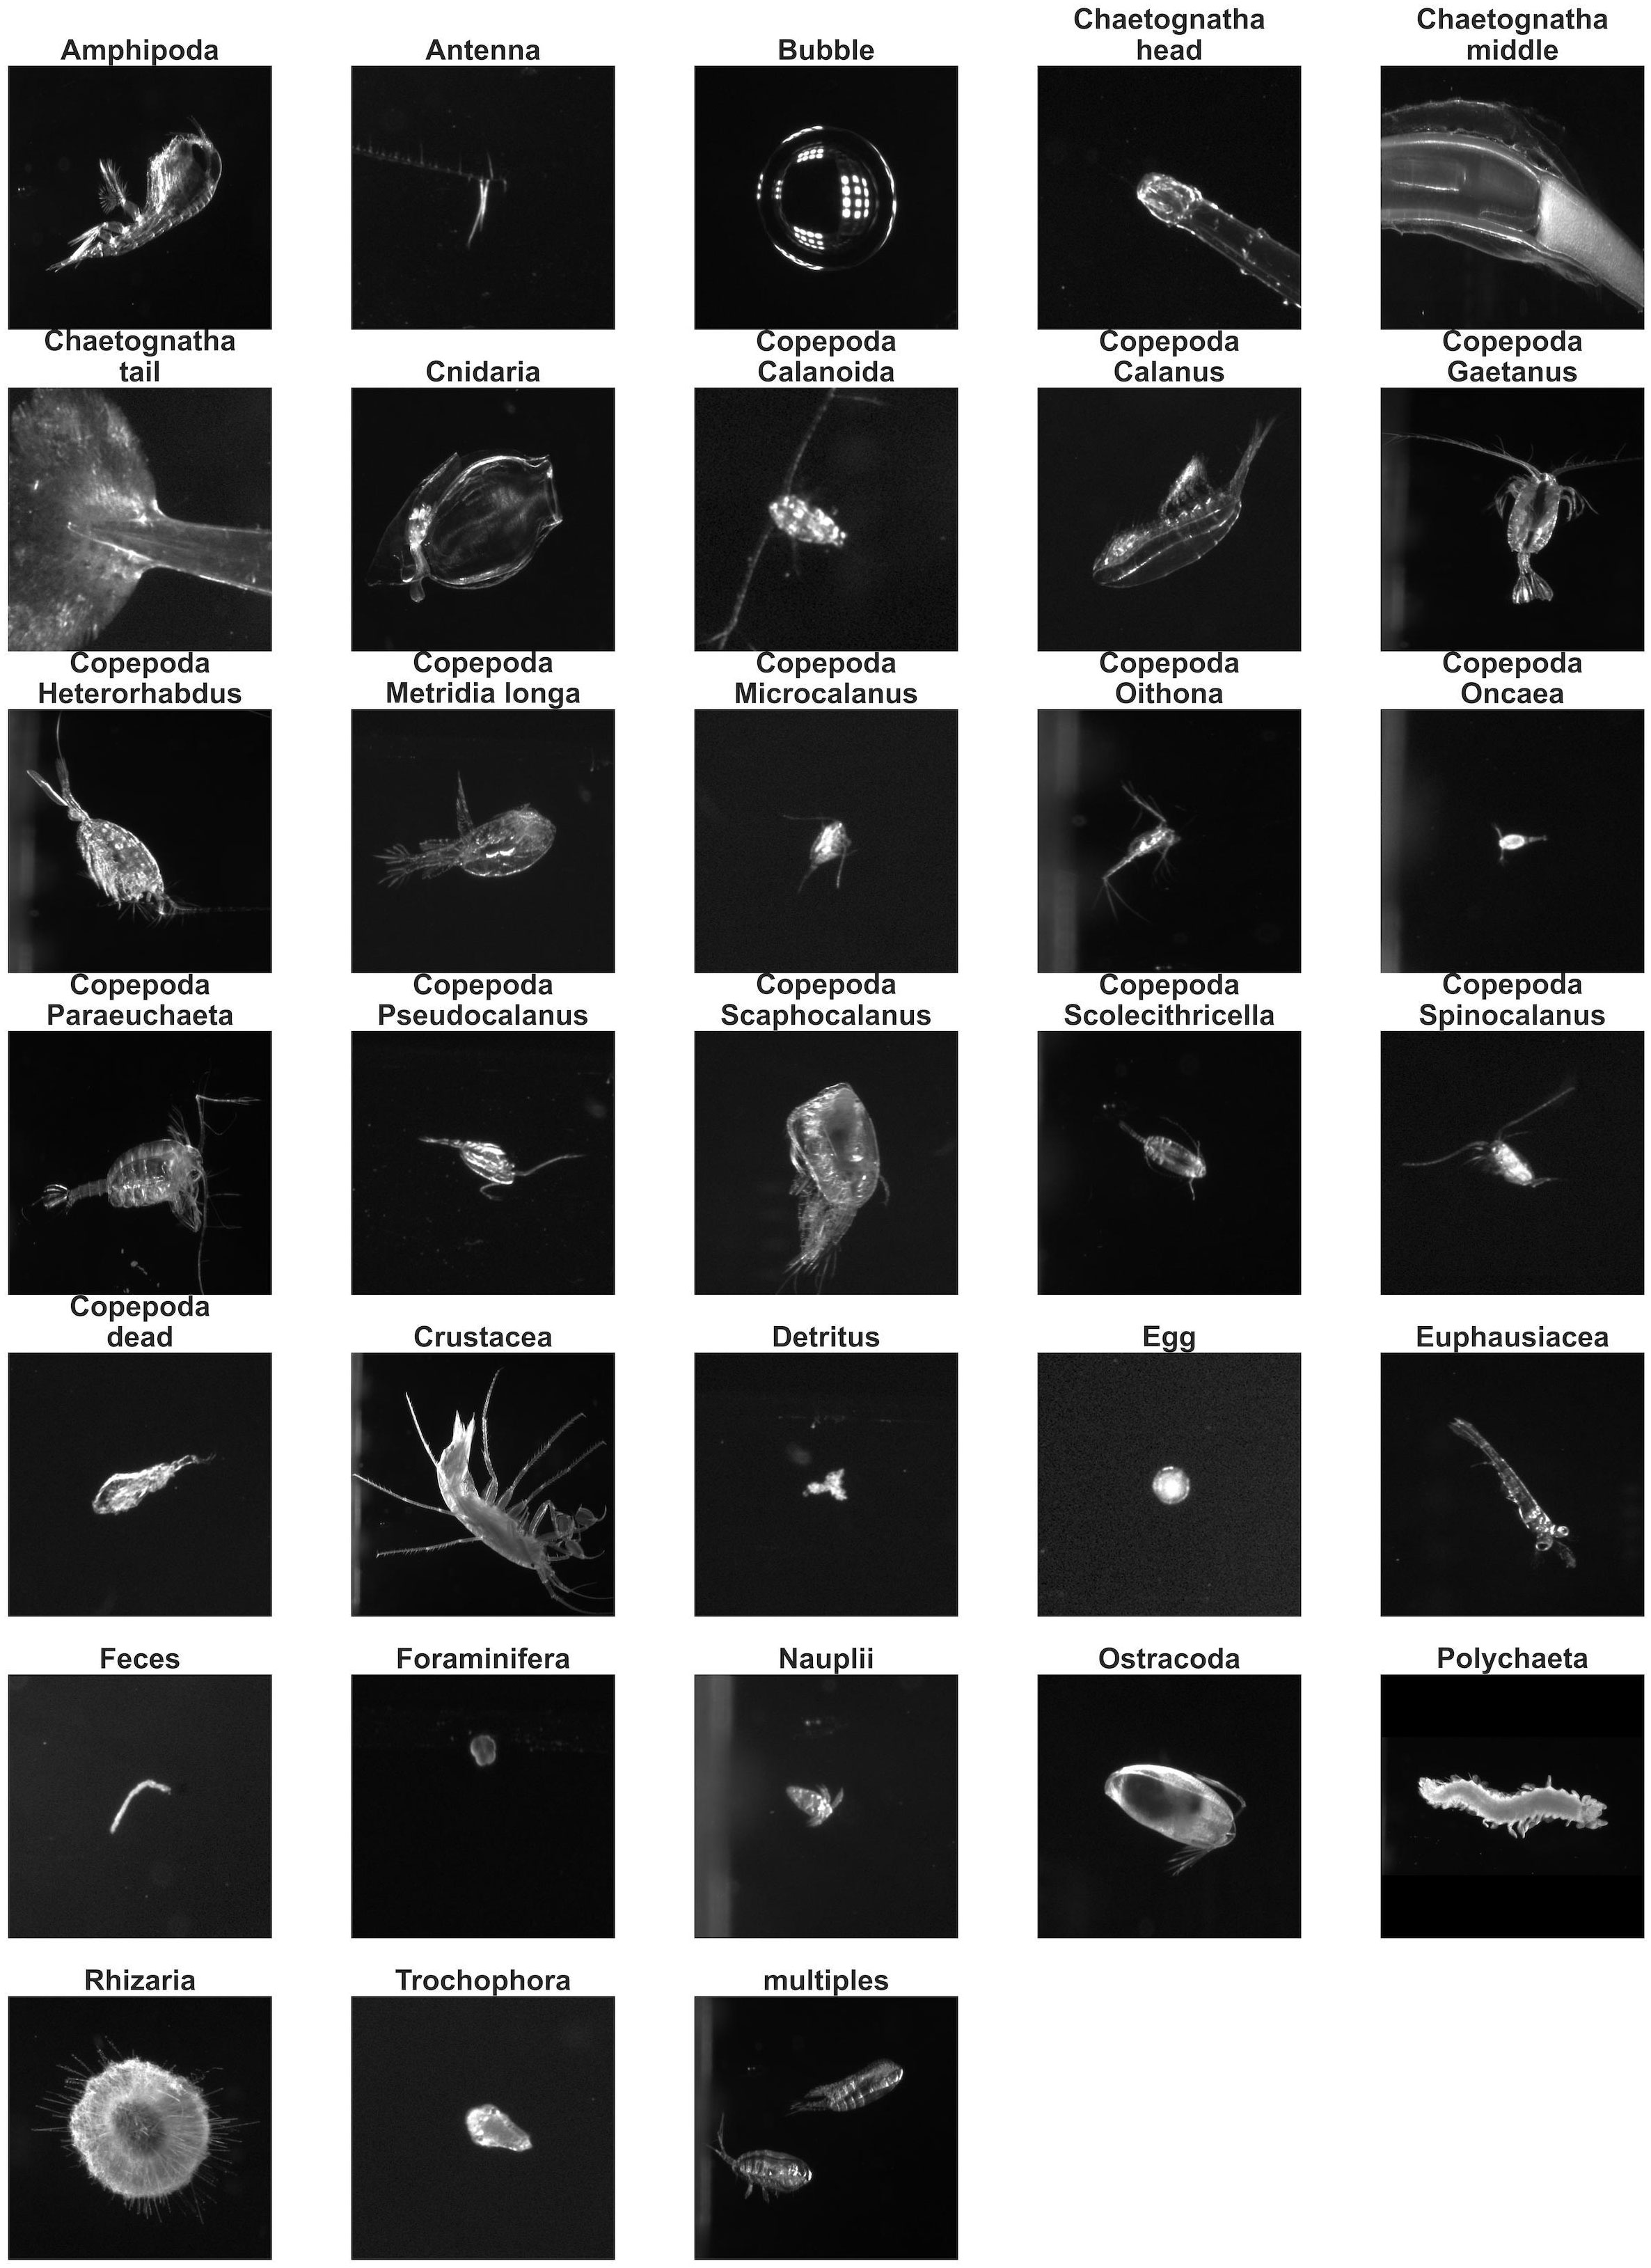
Figure 3 Examples for the 33 categories that were utilized in this study. Each image corresponds to zooplankton fauna at different taxonomic levels or other objects (antennae, bubbles, feces, multiples, detritus), arranged alphabetically according to their name.
2.4 The baseline: EcoTaxa
The classification pipeline via the LOKI browser and EcoTaxa was used as a baseline to compare the performance of DeepLOKI. To ensure comparability between results obtained by our approach and those via the EcoTaxa workflow, we extracted the categories that have been distinguished by the scientists in EcoTaxa but grouped, for example, development stages of species at a higher taxonomic level. The EcoTaxa classifier was trained using up to 5,000 images per category as a maximum. The default for EcoTaxa is a Random Forest classifier, and although it is possible to upload other model implementations (https://github.com/ecotaxa/ecotaxa_ML_template/blob/main/4.train_classifier.py), the images have only been processed with the standard algorithm. The Random Forrest performance is constrained due to imposed parameters (optimized for UPV or ZooScan images) or training data restrictions due to EcoTaxa. To evaluate the performance of our classification tool, DeepLOKI, we first evaluated the accuracy of EcoTaxa’s current classifier. Therefore, we established a new project on the EcoTaxa platform and utilized its integrated training and classification services, using 122,693 image training examples. The exact configuration can be found in the Supplementary Material EcoTaxa Setup.
2.5 Metrics
We’ve compiled the following metrics into a detailed table (Supplementary Material DeepLOKI Table S4) that displays Precision, Recall, F1-Score, and sample size for every class. The last three rows of the table indicate accuracy, followed by the columns macro and weighted averages. Additionally, we’ve created a visual depiction of the confusion matrix by plotting the human-labeled ground truth against the predictions generated by our algorithm. To evaluate and compare our models, we used the following five metrics, here defined for the binary case. Consider a scenario in which the dataset consists of samples that fall into one of two distinct categories. Each sample can be assigned to either to these categories, resulting in a binary classification problem. The scores of the metrics are in an interval from 0 to 1, with higher scores indicating better performance.
In the context of multicategory classification, where the dataset contains more than two possible categories (technical term: classes) for each sample, we employed the One-vs-All approach. This approach involved designating one class as the Positive (P) category, which served as the target category for calculating specific metrics such as Precision. Conversely, all other categories were treated as Negative (N) categories.
By adopting this approach, we were able to compute separate metrics for True Positives (TP), False Positives (FP), True Negatives (TN), and False Negatives (FN), allowing us to assess the performance of the model for each category individually.
2.6 Deep learning
For our Deep Learning approach, we used two variants of the ResNet18 neural network and compared them. The first approach involved Deep Transfer Learning, where we used a pre-trained ResNet18 model on ImageNet (Tan et al., 2018; Kronberg, 2022; Kronberg et al., 2022). This approach was selected due to its well-documented effectiveness in diverse areas of biology and medicine, with a specific emphasis on image analysis. Another factor that influenced our decision was the efficiency of fine-tuning, allowing us to train the model on hardware configurations, such as a Macbook, without requiring extensive computational resources. (Using Visual Transformers instead of simple ResNet18 could boost the accuracy by a bit, as tested in CNNs vs ViTs by the authors for (Yue et al., 2023) For our second method, we chose the DINO approach (Caron et al., 2021) primarily because it integrates one of the most advanced self-supervised pre-training techniques available in the field of computer vision. To ensure compatibility with our GPU infrastructure, we made slight adjustments to the DINO method.
2.6.1 Image augmentation
Here, we describe the pre-processing steps applied to the images extracted from the LOKI dataset for the Training. The primary image augmentation techniques utilized are as follows:
1. Random Resized Crop: Images are randomly cropped and resized to a fixed size of 300 pixels while maintaining an aspect ratio within the range of 0.8 to 1.0. This resizing process ensures that the model receives input images of varying scales, improving its robustness to different object sizes.
2. Random Rotation: We apply random rotations to the images, introducing variability in the orientation of objects. This augmentation technique helps the model learn to recognize objects from various angles and perspectives, with degrees of rotation up to 15 degrees.
3. Random Horizontal Flip: Images are subjected to random horizontal flips. This operation allows the model to learn features that may appear differently when mirrored horizontally, aiding in better generalization.
4. Center Crop: After the aforementioned augmentations, we perform a center crop on the images, resulting in a final image size of 224x224 pixels. This cropping operation ensures that the model focuses on the central region of the image, which often contains the most relevant information.
5. Normalization: Normalization is applied to the pixel values of the images. We subtract the mean values [0.485, 0.456, 0.406] and divide by the standard deviations [0.229, 0.224, 0.225] for each color channel. This step helps standardize the input data, making it suitable for neural network training.
6. Random Autocontrast: Autocontrast is applied randomly with a probability of 25%. This technique enhances image contrast, which can be beneficial for improving the model’s ability to distinguish between objects with subtle variations in lighting and contrast.
7. Random Perspective: Images undergo random perspective transformations with a distortion scale of 0.25 and a probability of 25%. This augmentation introduces geometric distortions, simulating variations that may occur in real-world scenarios.
8. Random Adjust Sharpness: Random sharpness adjustments are applied with a sharpness factor of 4 and a probability of 25%. This operation can help the model focus on fine details and edges within the images.
These augmentation techniques collectively contribute to a more diverse and informative dataset, enabling our model to better generalize and recognize objects under various conditions and orientations.
2.6.2 Deep transfer learning
To implement our DTL approach architecture (Tan et al., 2018; Kronberg, 2022; Kronberg et al., 2022) (Supplementary Material DeepLOKI Section 4), we used a pre-processing pipeline that involved resizing the images (Height, Width, Color channel) = (300, 300, 3) and crop to the input size of (224, 224, 3), as well as normalization, and various augmentations to add robustness to the training. We fine-tuned the ResNet18 neural network (He et al., 2016) as previously described (Werner et al., 2021) and adapted it for our purposes. Specifically, we exchanged the fully connected layer(matching to our number of classes) of the ResNet18 model (Figure 4) and fine-tuned the full network. Adam (Kingma and Ba, 2014) (Supplementary Material DeepLOKI Def. Adam) was used as the optimizer for this deep transfer learning approach. The network was trained with a batch size of 1536 and trained for 3 out of 20 epochs due to early stopping on the images of 80% of the samples from the dataset using the biologists’ labeled images as ground truth. The predicted probability for each image to contain each of the labels of our 33 classes was used as the objective/loss function (Supplementary Material DeepLOKI Def. Cross-entropy loss) in training. We used an initial learning rate of 0.0001.

Figure 4 Architecture of the implemented neuronal network. Convolutional layers (Conv.): These layers use filters (k x k, Conv. f where k is the kernel size and f the number filters) to extract features from the input image. ResNet18 has a total of 17 convolutional layers. Batch normalization layers: These layers normalize the output of the convolutional layers, which helps to improve the stability and performance of the network. Pooling layers (Max/Average Pooling): These layers reduce the spatial dimensions of the feature maps generated by the convolutional layers, which helps to decrease the number of parameters in the network and reduce overfitting. Fully connected layers (FC layers): These layers connect all the neurons in one layer to all the neurons in the next layer. In ResNet18, there is one fully connected layer at the end of the network, which is used for classification (He et al., 2016).
To assess the performance of our trained model, we conducted an evaluation on the remaining 20% of the dataset, which was not encountered by the algorithm during the training phase. By comparing the results obtained from the model with the ground truth, we were able to gauge its effectiveness. To ensure fair and unbiased comparison among different algorithmic approaches, we incorporated a reference dataset, specifically the Cruise PS99.2, throughout the study. This reference dataset served as a standardized benchmark for evaluating the performance of our model alongside other approaches.
2.6.3 Self-supervised pre-training and then supervised fine-tuning (DINO)
For the self-supervised pre-training stage, we utilized all available images in our dataset, disregarding any label information (Noroozi et al., 2018). The purpose was to train the model to learn a latent space representation, as described in (Caron et al., 2021). To maintain consistency with our DTL approach, to be able to compare the ImageNet pre-trained ResNet18 with the pre-training using self-super-vised learning method, we decided to employ the same ResNet18 architecture as the backbone for the self-supervised pre-training. In the original paper even a ResNet50 was used. To reduce training and inference computing costs, we decided to downscale to ResNet18. For the DINO approach, we used a 450 epoch for pre-training and trained on 8 x A100 GPUs with 64 workers and a batch size of 512. The full parameter setup can be found in our GitHub Repo using the lightly Python package. Consequently, during the fine-tuning stage, we added the fully connected layers accordingly to our classification problem and then fine-tuned all layers using our training dataset Figure 4. This fine-tuning process was performed for and trained for 12 out of 20 epoch due to early stopping (on the validation accuracy with patience of 2) while keeping all parameters identical to the previous approach.
2.6.3.1 Visualization of the latent space after self-supervised pre-training
The purpose of this approach is to learn a condensed representation of the classes in a lower-dimensional vector space. Put simply; it aims to create a representation where images of the same class are closer to each other while images of different classes are farther apart. In general, there are two commonly used methods for visualizing classification results based on a latent space: UMAP and t-SNE. UMAP tends to preserve more of the overall structure of the data, while t-SNE focuses on highlighting the local structure (van der Maaten and Hinton, 2008; McInnes et al., 2018). We employed UMAP (Uniform Manifold Approximation and Projection) as another dimensionality reduction technique to visualize the results from the classification algorithms. UMAP provides an alternative perspective on the relationships among the data points in a lower-dimensional space.
2.7 Graphic User Interface
A web-based Graphical User Interface (GUI) has been developed to streamline the use of DeepLOKI, our powerful deep learning framework for taxa group recognition in zooplankton images. Through the incorporation of the Streamlit Python library, a seamless and intuitive interface has been created, thereby simplifying the process of image classification. Supplementary Tools have also been integrated, offering a user-friendly interface for labeling new images, thus enabling further training (Supplementary Material DeepLOKI) Figure 1.
2.8 Hard and software
Training and Validation were performed on an Nvidia A100 (Nvidia Corp., Santa Clara, CA, USA) and on Apple M1 MAX with 32 GB (Apple, USA), depending on the computational power needed, for example, self-supervised pre-training was performed on a Hyper performing cluster with Nvidia A100. On the Macbook Pro (Apple, USA) we used:
Python VERSION:3.10.5
pyTorch VERSION:13.1.3
On the cluster we used cluster specifics versions of the software:
Python VERSION:3.10.5
pyTorch VERSION:13.1.3
CUDNN VERSION:1107)
3 Results
This section describes and compares the results of the image analyses based on three methods: EcoTaxa (web link required), ResNet18 with DTL (autonomous), and ResNet18 with DINO (autonomous). For the comparisons, we use the PS99.2 data set (20,683 images). AS evaluation metrics, we deliberately decided to use the F1-score and, in addition, the classification accuracy to highlight the different aspects of the “quality of label assignment”.
3.1 EcoTaxa default classifier performance - study baseline
The automatic EcoTaxa categorization process generated a dataset where each data point (image) was assigned its respective categorization. These categories include non-living objects (detritus, bubbles, feces), high-level taxonomic groups (Crustacea (not further identified), Amphipoda, Calanoida (not further identified) Euphausiacea, and Ostracoda; Polychaeta; Cnidaria, Rhizaria (not further identified) and Foraminifera), copepod genera (Calanus, Geatanus, Heterorhabudus, Metridia, Microcalanus, Oithona, Oncaea, Paraeuchaeta, Pseudocalanus, Scaphocalanus, Scolethricella, Spinocalanus), dead copepods, early life stages (eggs, nauplii, and trochophora larvae), specific parts of organisms (antennae as well as heads, middle parts and tails of chaetognaths) and “multiples” with images with more than one object. We compared these labels to the scientists’ final annotations and produced a confusion matrix and classification report (Figure 5). The EcoTaxa algorithm achieved an accuracy of 44.4% applied to a PS99.2 dataset of 20,683 images. Examining the F1-scores, which consider both precision and recall, we found an overall score of 44% for all categories Supplementary Material DeepLOKI Table S5). Among the categories, the highest-performing categories were Detritus, Chaetognata middle, and Bubble, with a score of 70 -73% (3,363, 184 and 209 images). Categories such as Copepoda_Heterorhabdus, Copepoda_Scolecithricella, Copepoda_Spinocalanus, Copepoda_dead, Crustacea, Euphausiacea, Foraminifera, Trochophora had the lowest scores of 0%, however, these categories contained few images (i.e. 148, 22, 10, 0,28, 4, 5,0 images, respectively) (Figure 5, Supplementary Material DeepLOKI Table S5). It should be noted that zero image counts correspond to misclassified images when the category was present in the training set but absent in the test set. In summary, 17% of the total images, representing only 2 out of 33 categories, attained an F1-score of 70% or higher.
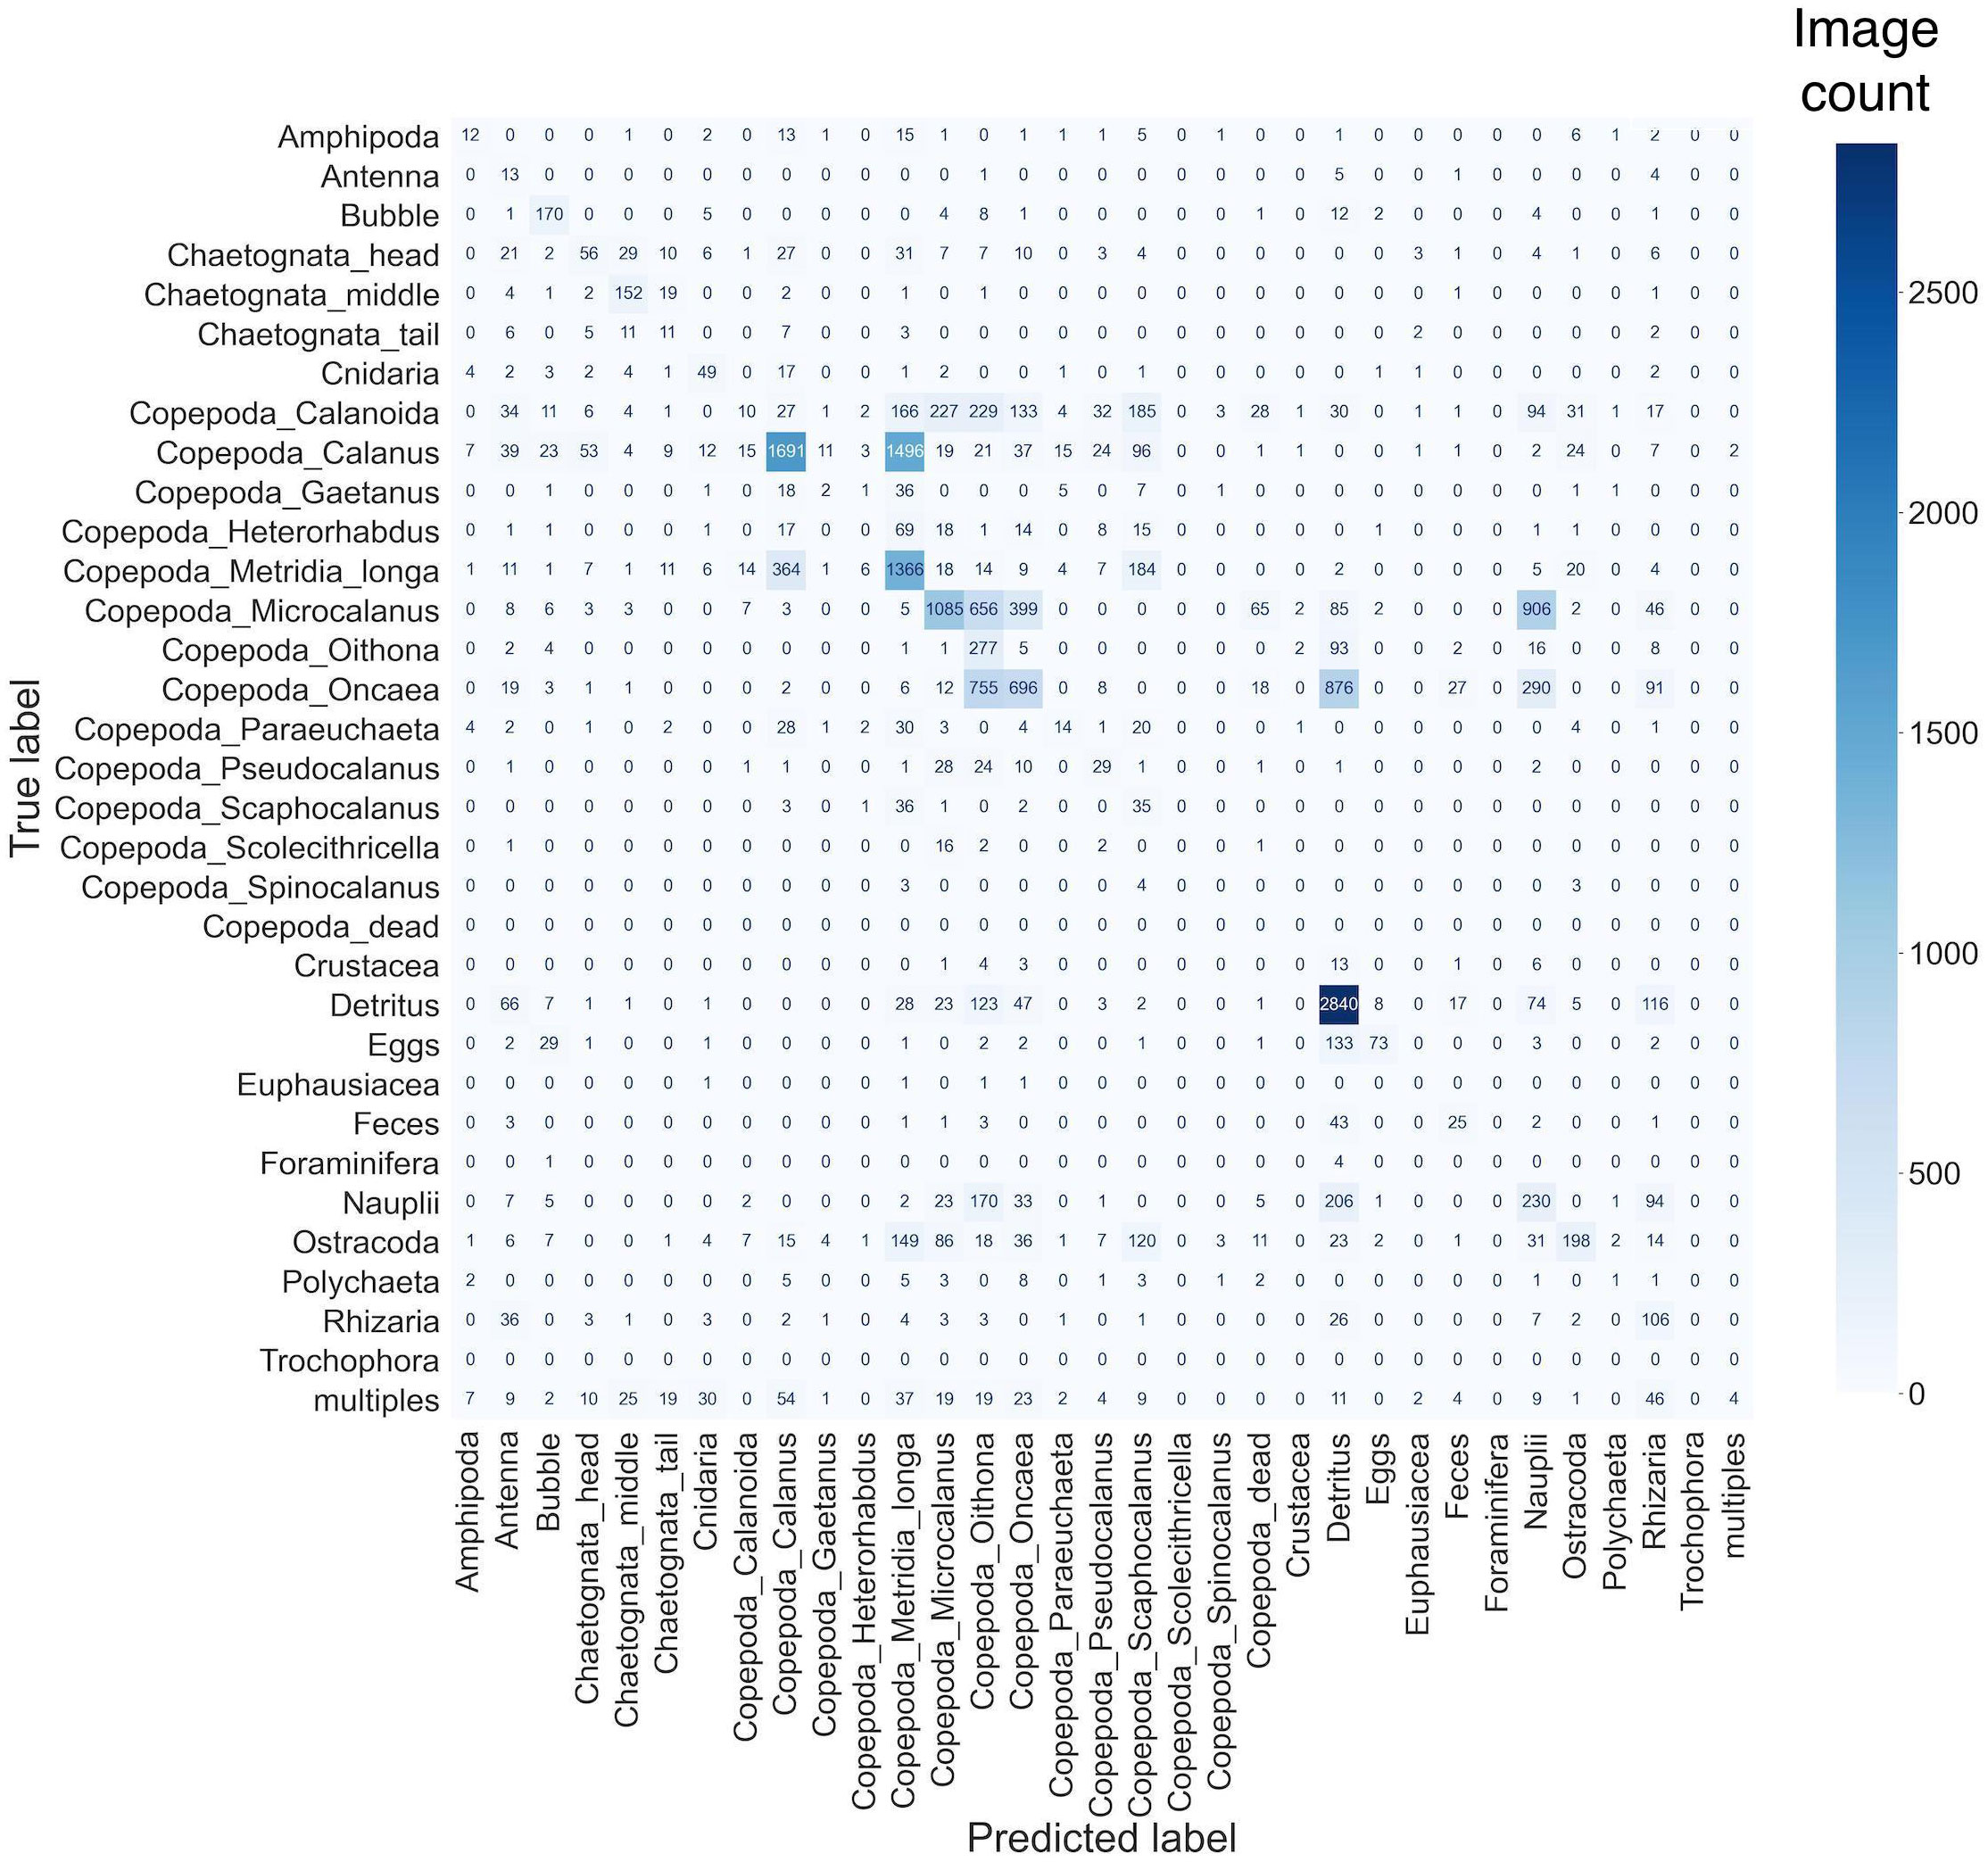
Figure 5 Confusion matrix of categories predicted by EcoTaxa versus final categorization by a scientist: The y-axis shows the evaluated labels and the x-axis the predicted labels of PS99.2. The color gradient indicates the number of images.
3.2 DeepLOKI: ResNet18 - DTL classifier
As part of our DeepLOKI framework, we initially employed a Transfer Learning approach, utilizing a fine-tuned ResNet18 model pre-trained on the ImageNet dataset (Yang et al., 2020). The ImageNet dataset consists of 1000 categories, encompassing various objects such as animals, cars, and airplanes. By employing this technique, we achieved an overall accuracy of 83.1% on our test dataset. Using a zooplankton test dataset PS99.2 containing 20,683 images, the ResNet18 model achieved a weighted average F1-score of 82.4% for all categories (Supplementary Material DeepLOKI Table S6). Notably, the categories Ostracoda, Bubble, and Copepoda_Calanus exhibited the highest F1- scores, reaching 92-95% (748, 209, and 3,614 images, respectively). Conversely, the categories Copepoda_Scolecithricella Copepoda_Spinocalanus, Copepoda_dead, Crustacea, Euphausiacea, Foraminifera, Trochophora again had the lowest scores of 0%. However, these categories contained few images (Figure 6, as summarized in Supplementary Material DeepLOKI Table S6).
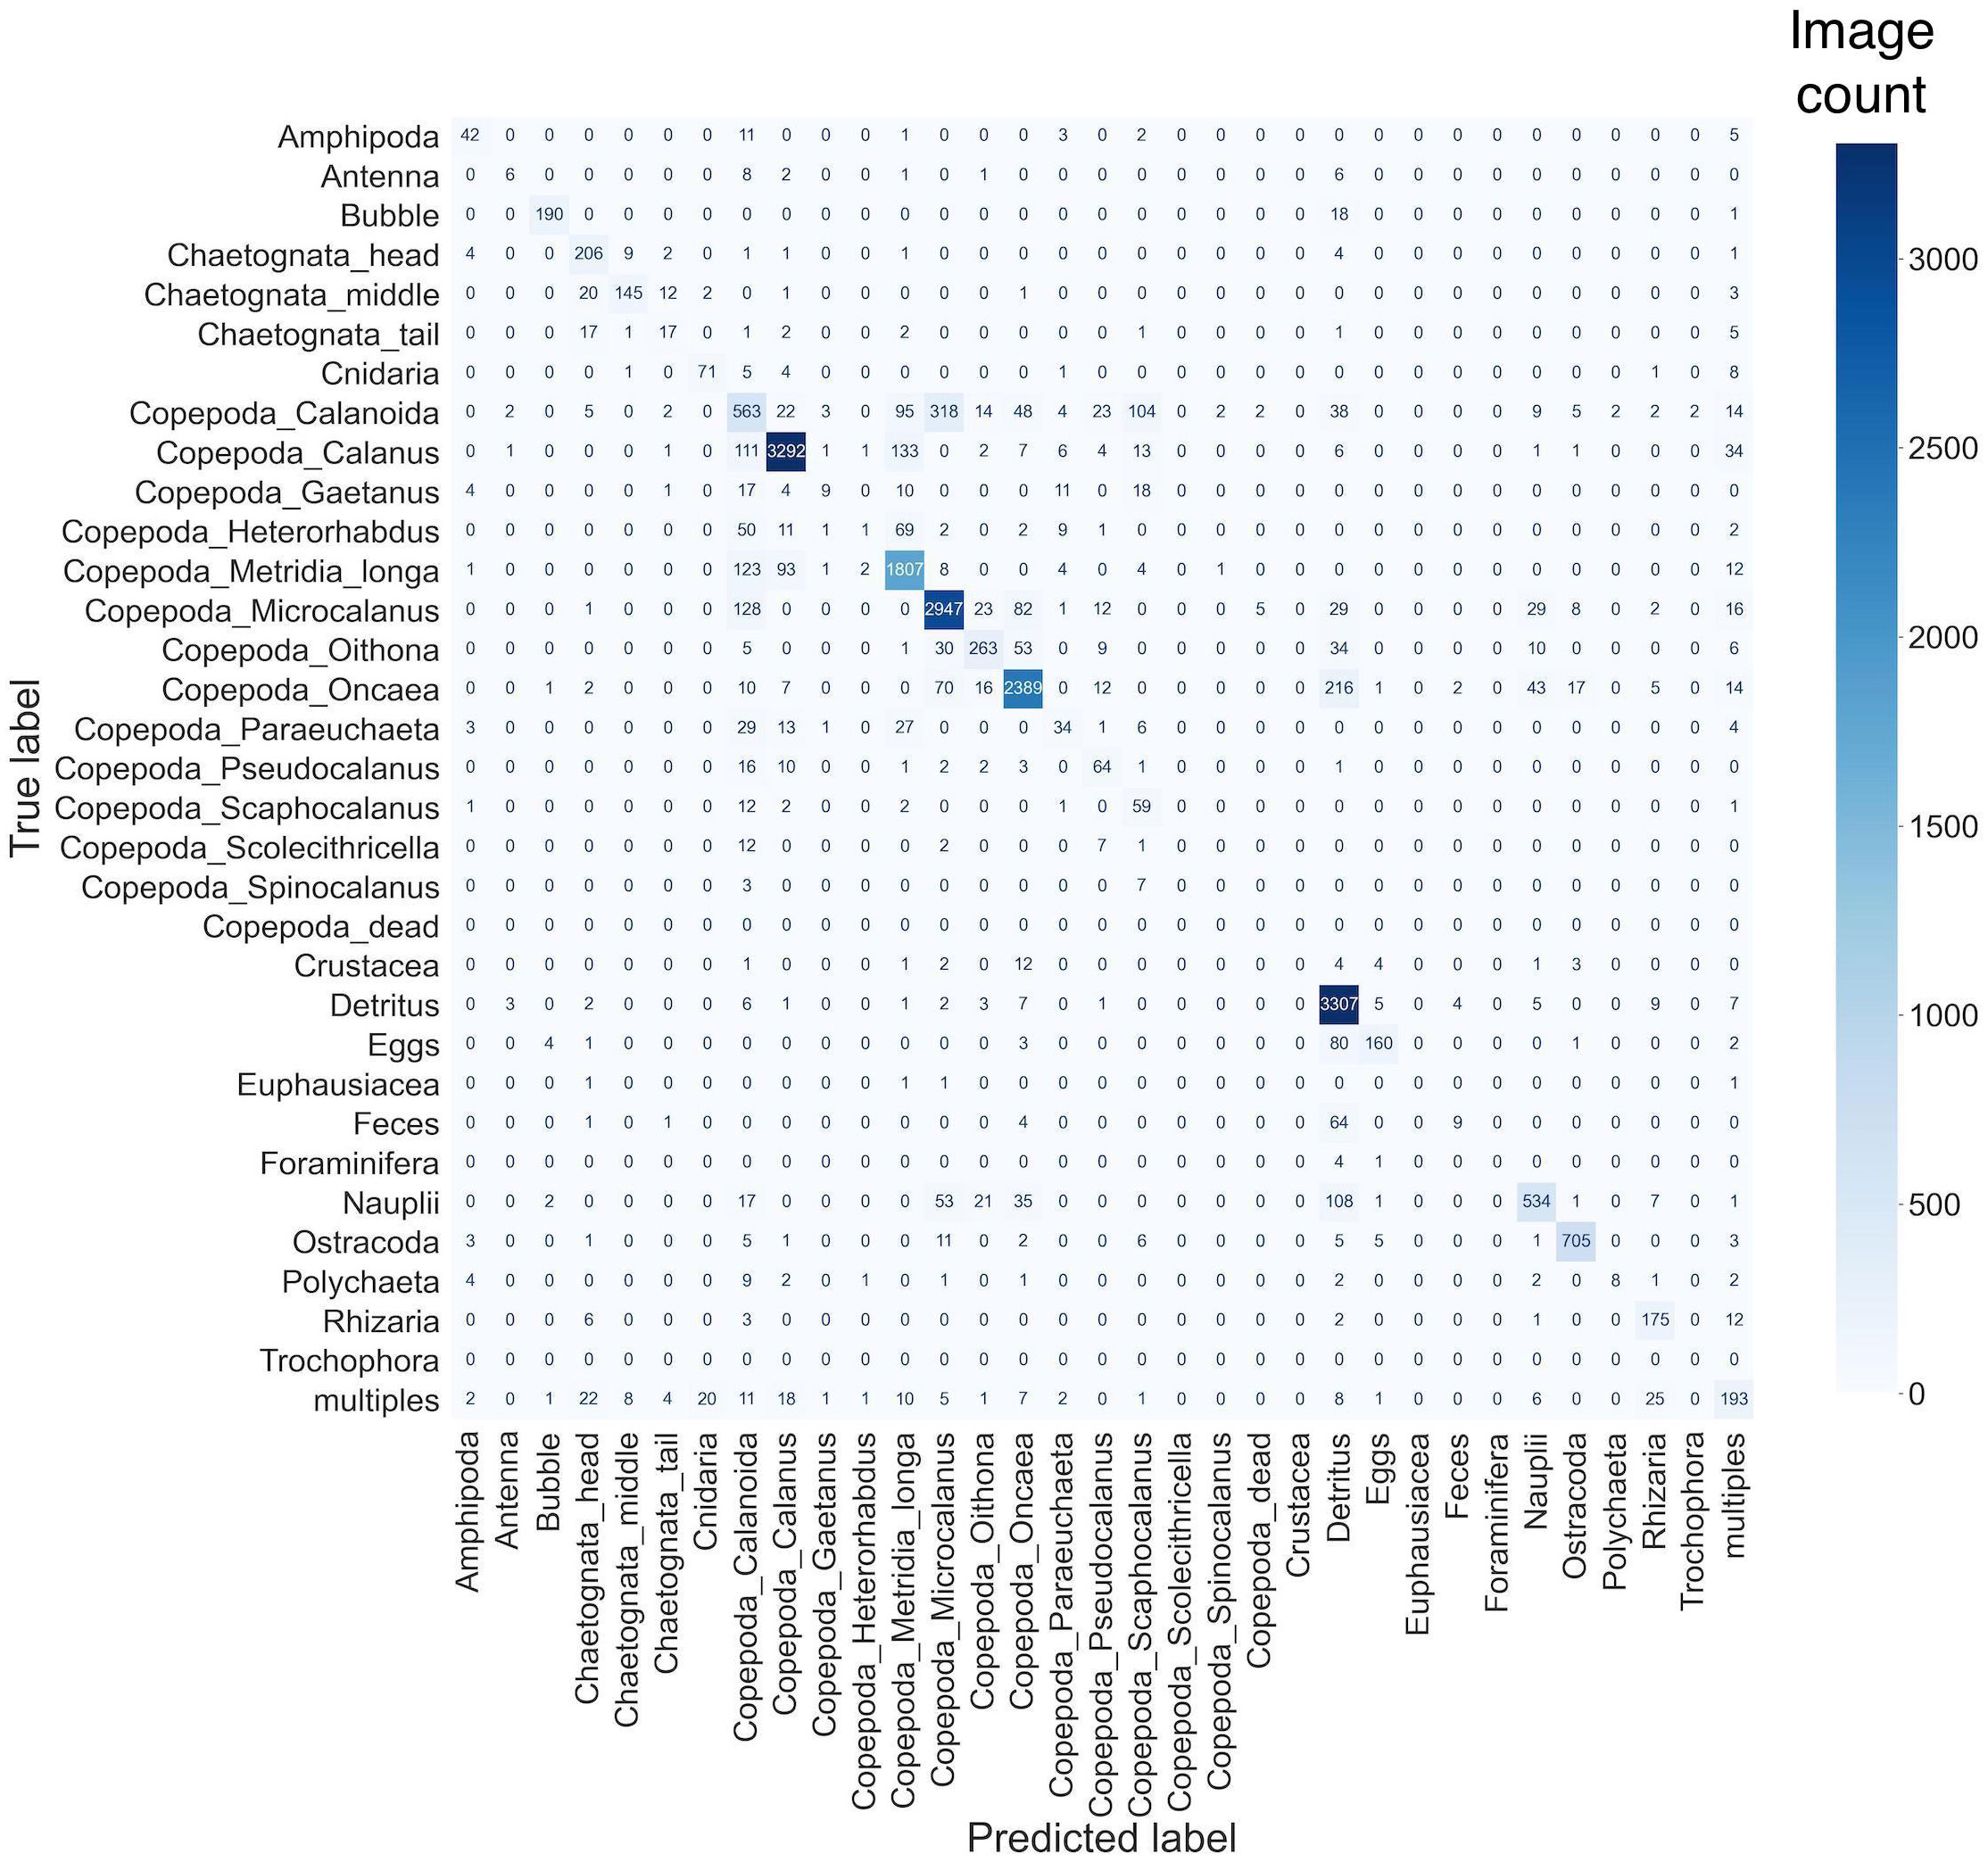
Figure 6 Confusion matrix of categories predicted by DTL ResNet18 -Classifier versus final categorization by a scientist: The y-axis presents the evaluated labels and the x-axis the predicted labels of PS99.2. The color gradient indicates the number of images.
In summary, 13 out of 33 categories, comprising 86% of all images, achieved an F1-score of 70% or higher. As with the EcoTaxa results, we generated a confusion matrix from the categorization outcomes. Our findings revealed that images belonging to the groups prefixed with Copepoda exhibited a high level of confusion. This confusion was evident from the higher values observed in the non-diagonal elements of the matrix. Specifically, we observed a distinct pattern of confusion within a block encompassing various species and sub-species of Copepoda, as indicated by the framed region, notably in the category Copepoda_Calanoida: here, 318 images were misclassified as Copepoda_Mircocalanus, 95 as Copepoda_Metridia_longa, 104 as Copepoda_Scapohocalanus and some smaller number of images to other that have in their assigned category name Copepoda Figure 6.
3.3 DeepLOKI: ResNet18 - DINO classifier
Using state-of-the-art methods involving self-supervised learning, specifically a slightly down-scaled student-teacher approach (Caron et al., 2021), followed by fine-tuning on our labeled data, we achieved an overall accuracy of 83.9% on the PS 99.2 dataset of 20,683 images. This performance surpassed both the EcoTaxa workflow and the DTL approach. Notably, the categories Ostracoda, Bubble, and Copepoda_Calanus demonstrated the highest accuracy rates (measured as F1-score), ranging from 92% to 95% (748, 209, and 3,614 images, respectively Supplementary Material DeepLOKI Table S7). Conversely, the poorest-performing categories were Copepoda_Scolecithricella Copepoda_Spinocalanus, Copepoda_dead, Crustacea, Euphausiacea, Foraminifera, Trochophora each with a 0% F1-score, (Figure 7, data summarized in Supplementary Material DeepLOKI Table S7). In summary, 12 out of 33 categories, covering 86.5% of all images, achieved an F1-score of 70% or higher.
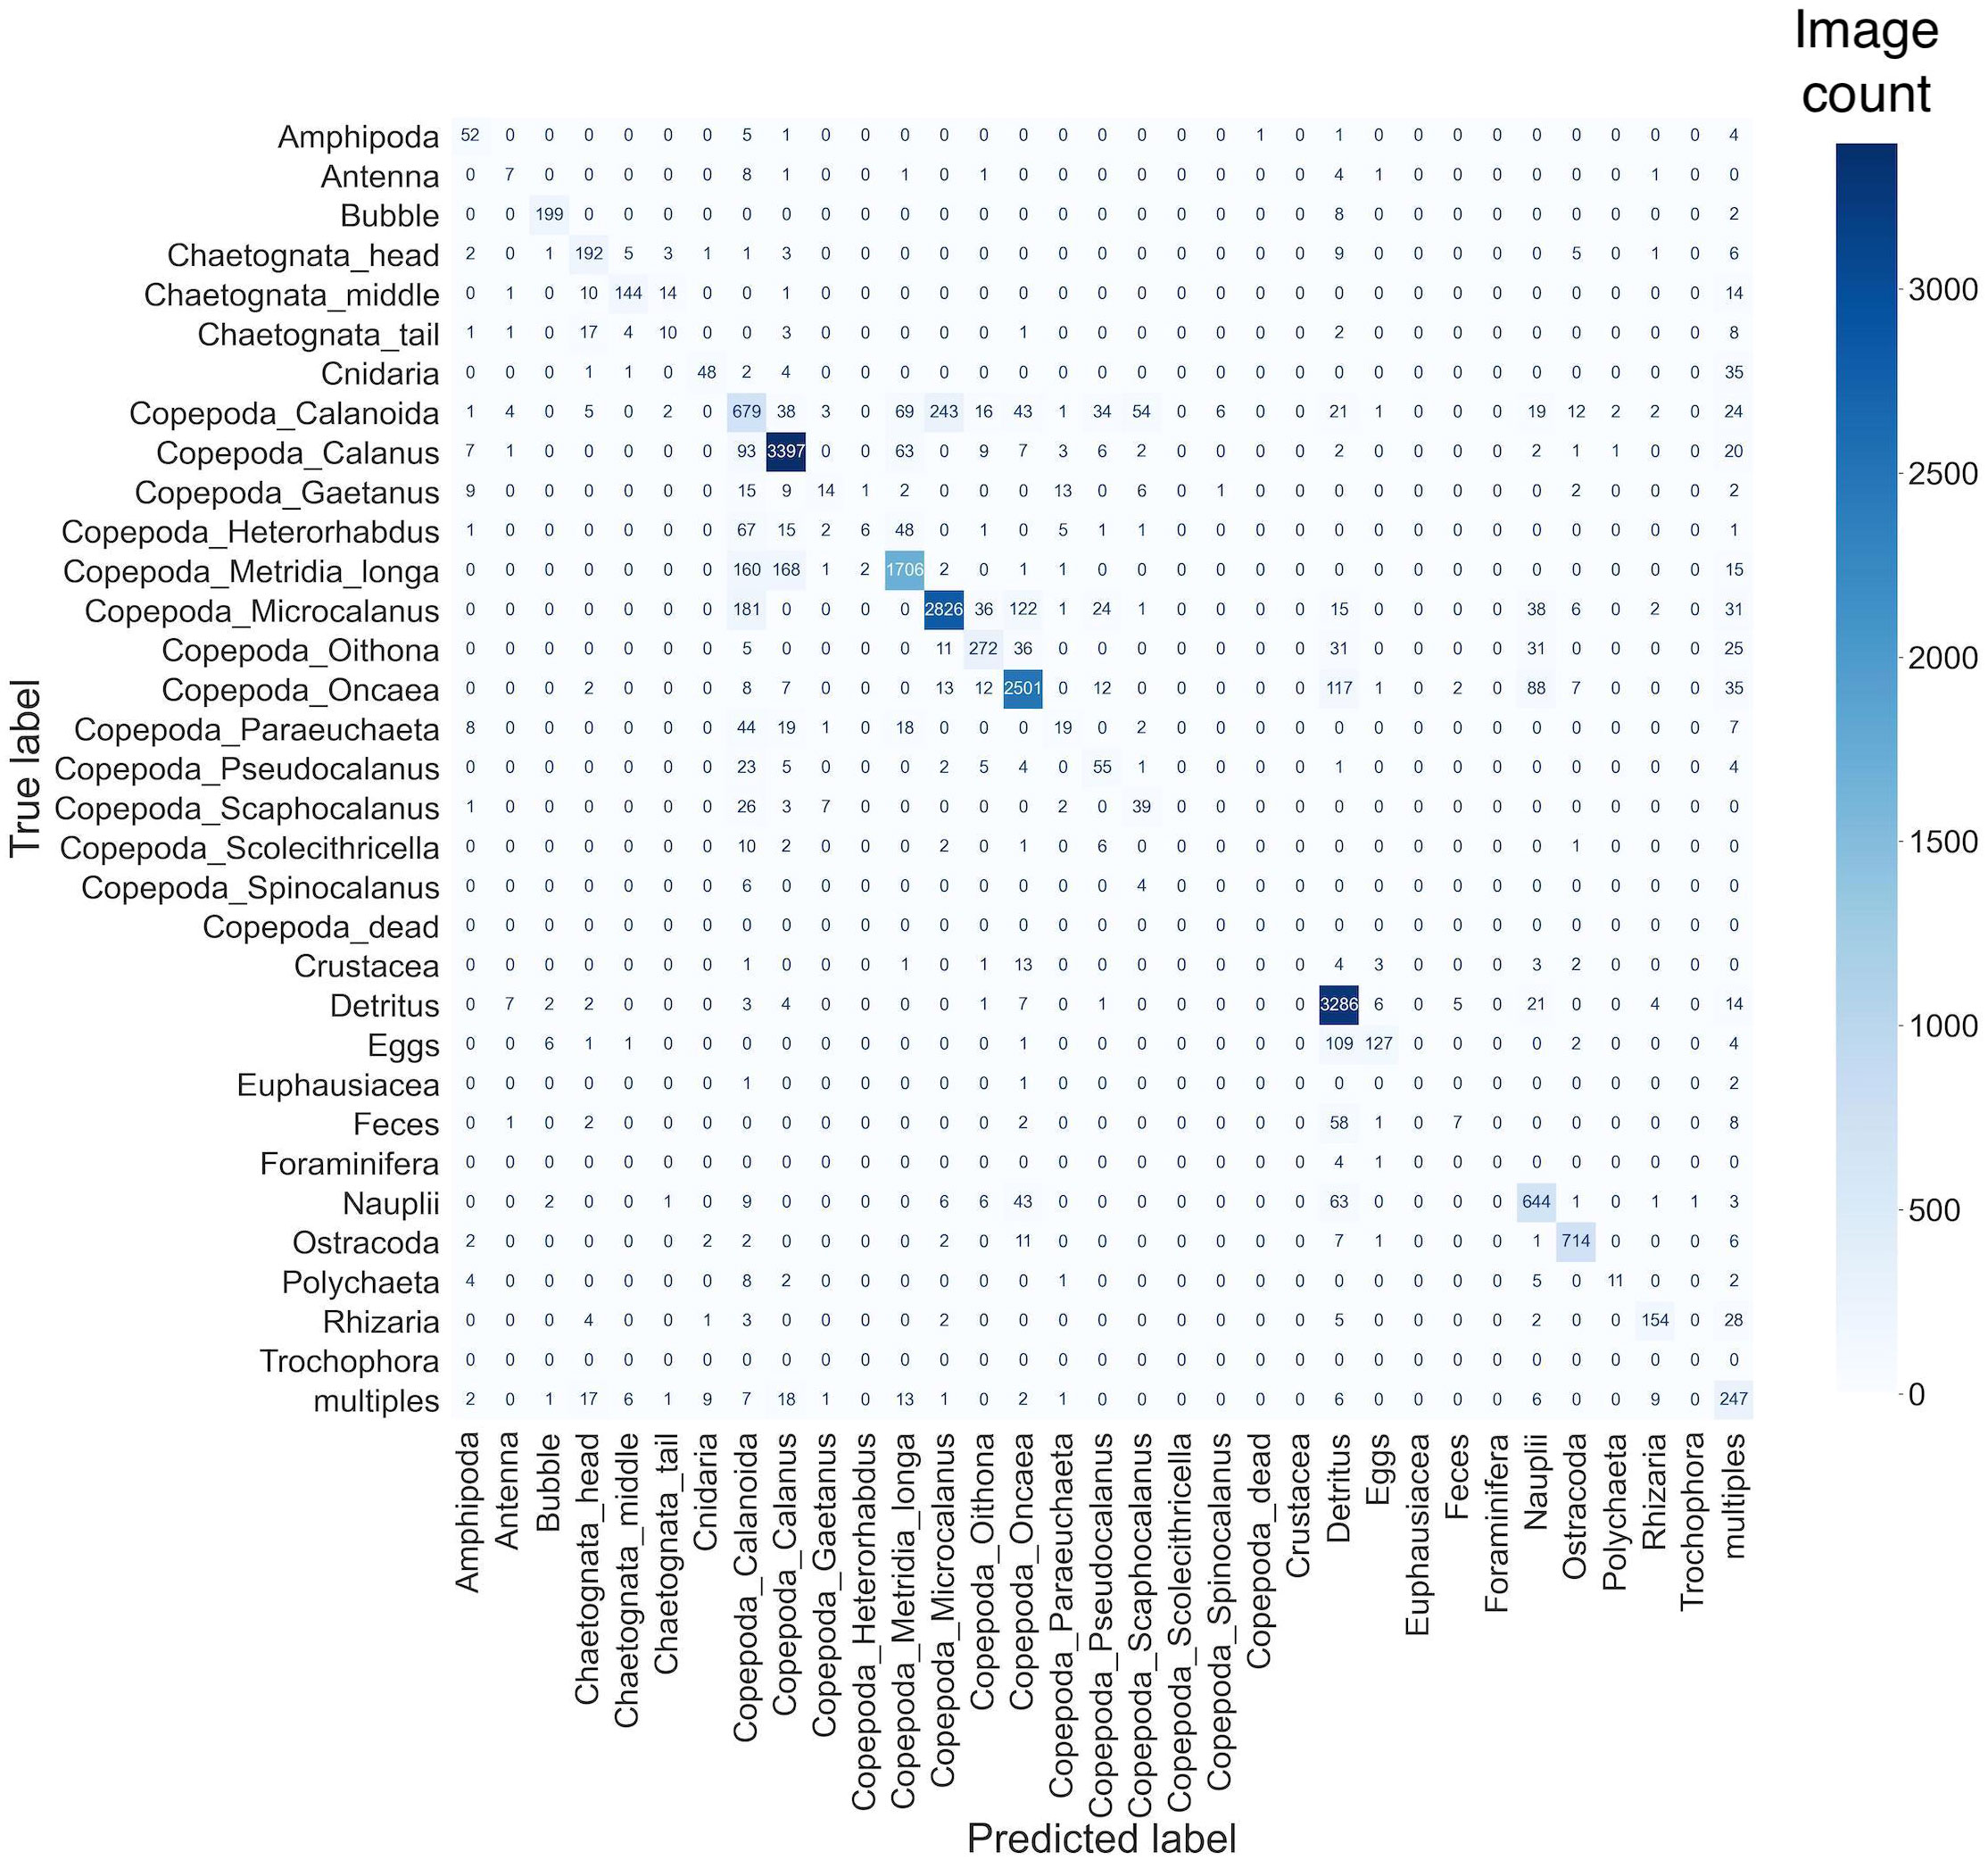
Figure 7 Confusion matrix of categories predicted by Dino DTL ResNet18 -Classifier versus final categorization by a scientist: The y-axis presents the evaluated labels and the x-axis the predicted labels of PS99.2. The color gradient indicates the number of images.
The confusion matrix analysis for this categorization of zooplankton images revealed a consistent pattern. Similar to DTL analysis, images from the Copepoda groups exhibited higher non-diagonal values, indicating confusion.
This pattern was particularly noticeable within a framed block representing various Copepoda species and sub-species. Remarkably similar to the DTL approach is the high confusion in the category Copepoda Calanoida: here, 243 images are misclassified as Copepoda_Mircocalanus, 69 as Copepoda_Metridia longa, 54 as Copepoda_Scaphocalanus and similar patterns for the smaller categories including Copepoda in their names Figure 7.
3.3.1 Data projection on latent space
To visualize the classification of the self-supervised pre-trained ResNet18 (DINO) approach, we used UMAP (Figure 8) as a dimension reduction approach to project the data on a 2D space. Each dot represents an image, and the distance to each other reflects their similarity. Dots that are close to each other reflect the same or similar image content. The coloring was done based on the pre-defined categories.
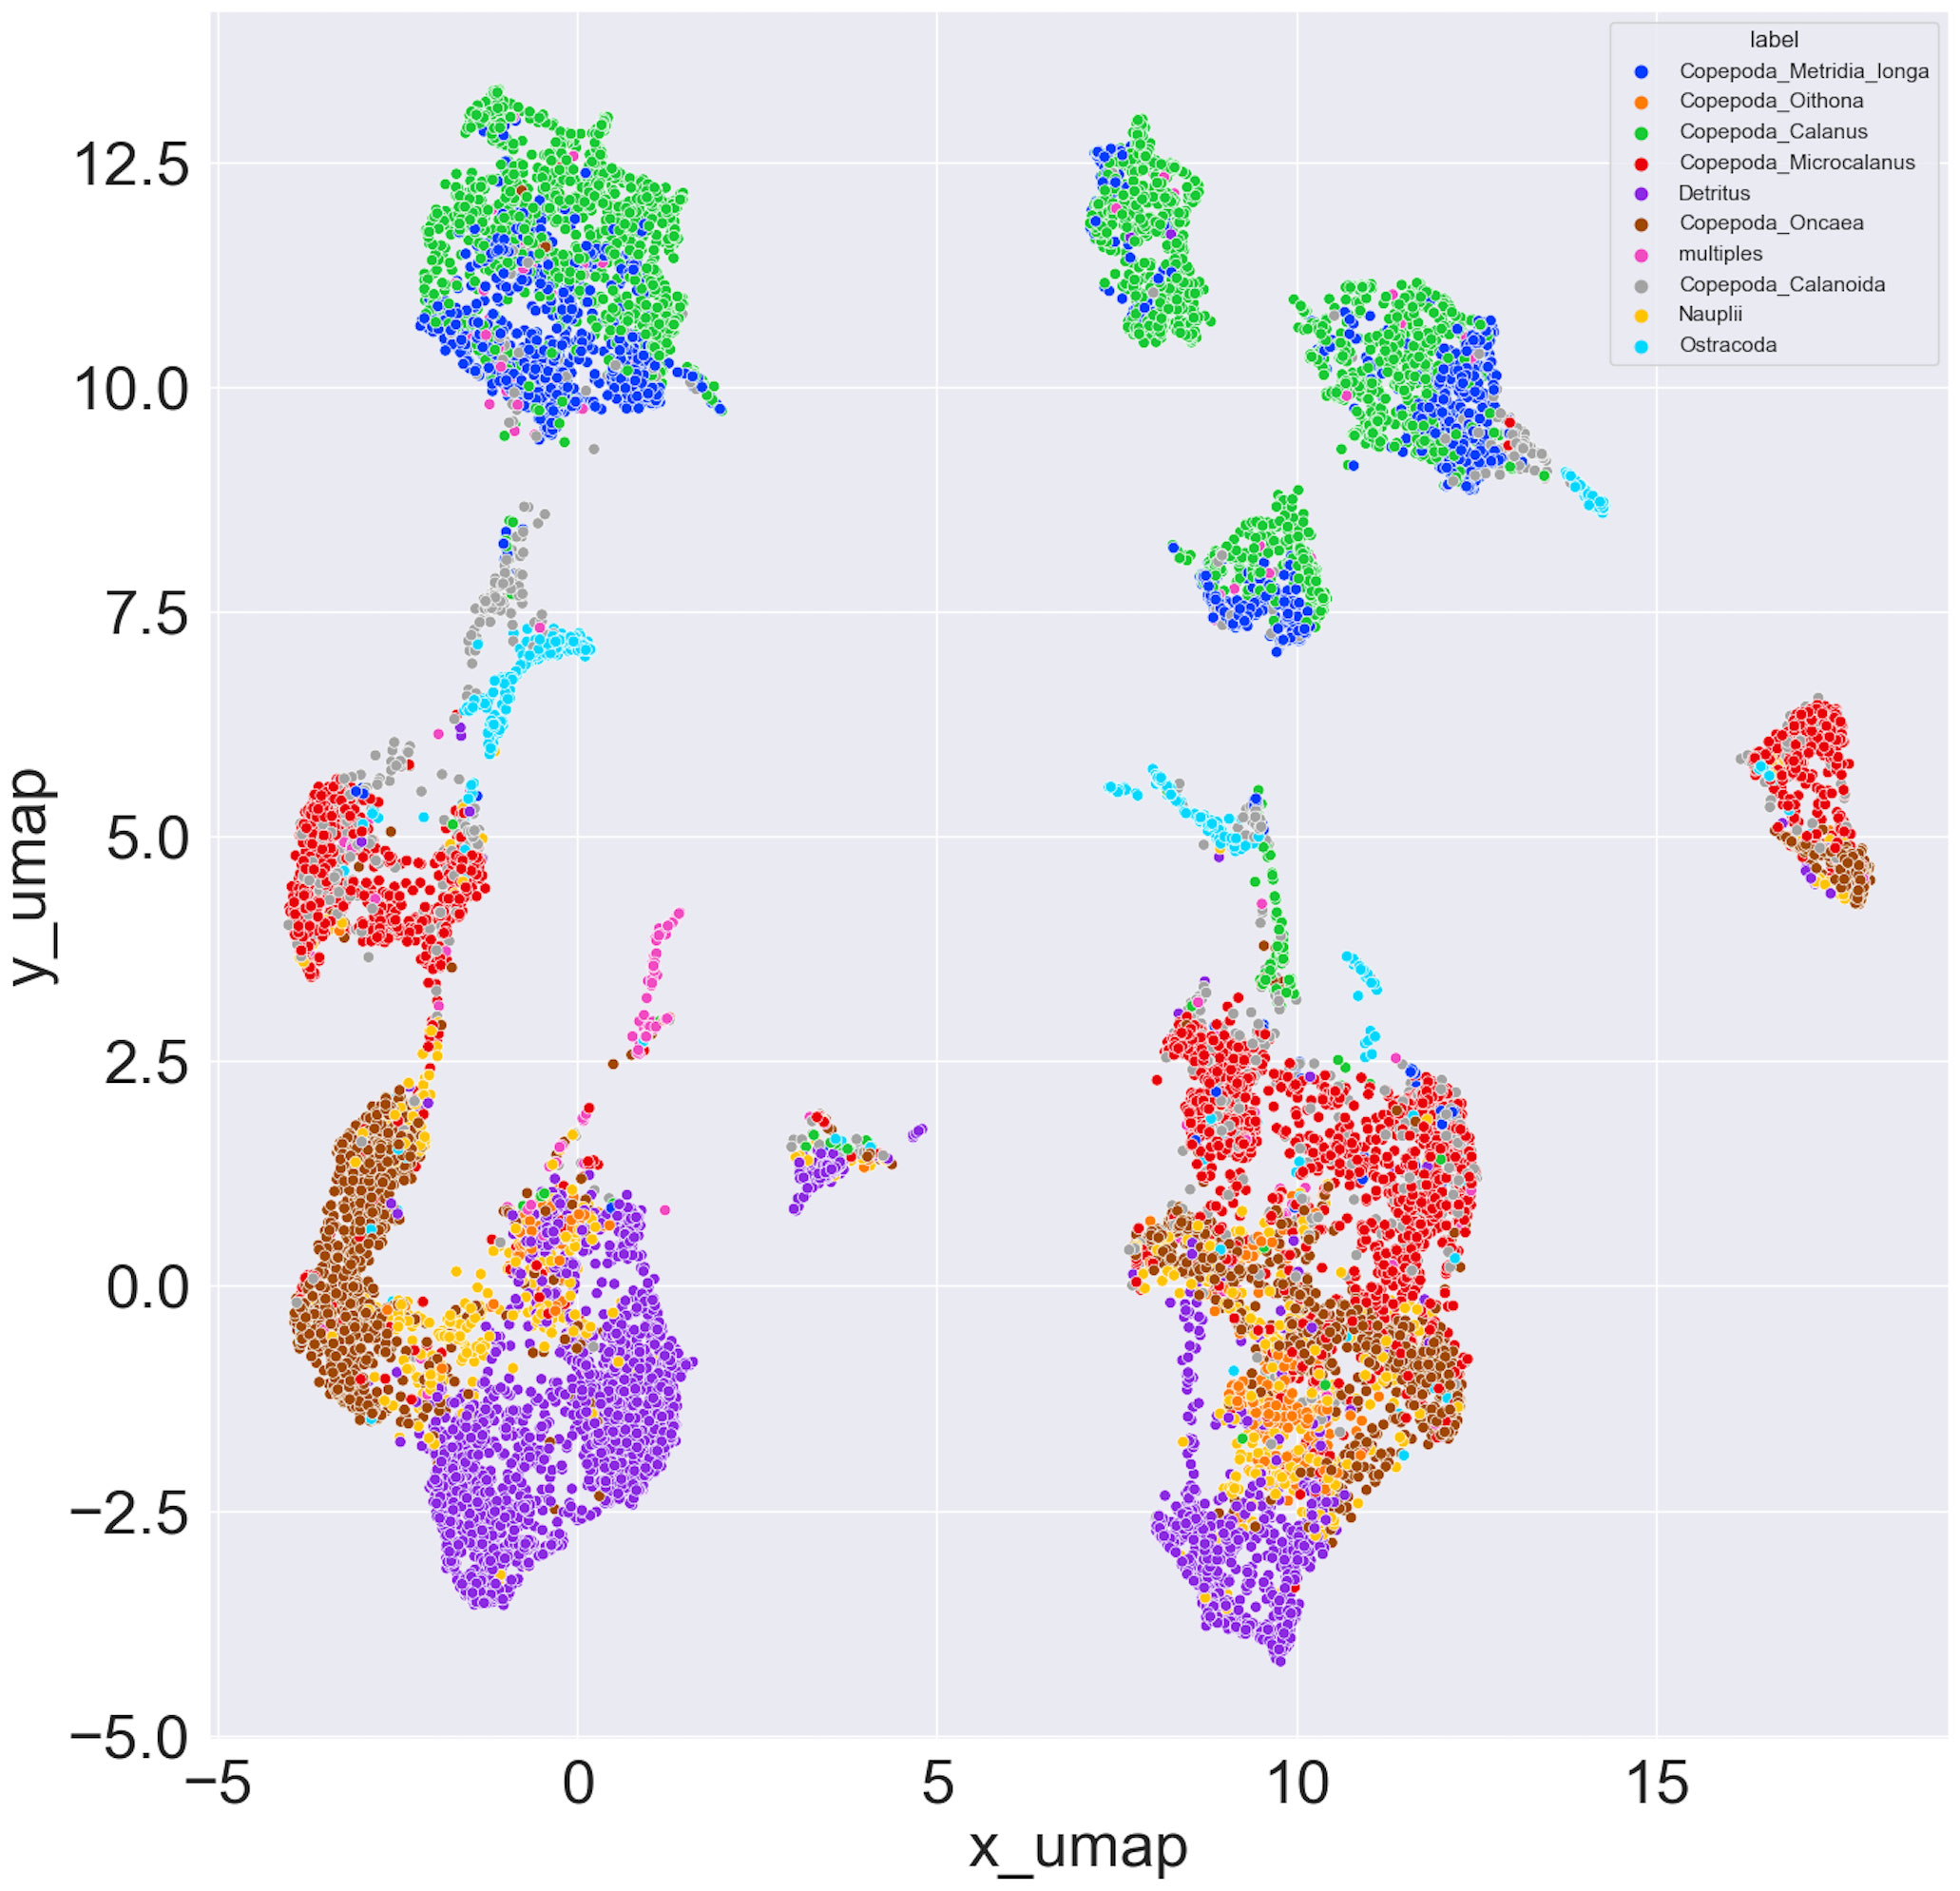
Figure 8 Learned latent-space Embedding using UMAP: The UMAP plot of the 512-dimensional latent space representation is displayed, which was obtained from self-supervised pre-training with DINO. This plot displays the ten categories, which accounted for 95% of the data. The UMAP plot provides an alternative visualization of the clustering of these species in the latent space. The color corresponds to the images categories as validated by the scientists.
These are Copepoda_Microcalanus, Copepoda_Calanus, Detritus, Copepoda_Oncaea, Copepoda_Calanoida, Copepoda_Metridia_longa,multiples, Ostracoda, Nauplii and Copepoda_Oithona. The UMAP plot has revealed the presence of a mirror symmetry at the x = 5 coordinate, effectively dividing the plot into two distinct regions. Notably, comparable clusters can be observed on both the left and right sides of this axis. This finding suggests a symmetrical organization of data points with similar characteristics in both regions. The two taxa Copepoda_Calanus and Copepoda_Metridia_longa exhibited close proximity to each other in the two-dimensional latent space plot, mirroring their similar morphology. It is worth mentioning that the groups Copepoda_Oncaea, Copepoda_Microcalanus, Nauplii, and Detritus exhibited a tendency to cluster closely together within a specific region of the plot. The categories Copepoda_Calanoida and Ostracoda show a similar representation in the latent space.
Upon conducting a deeper analysis of the metadata, particularly focusing on the stations, we discovered that the initial group of clusters, the left clusters (comprising all clusters with x umap ¡ 5), was linked to three specific locations. Interestingly, these three locations were distinct from the other locations in the dataset. Notably, the stations were not part of the pre-training or training processes of the DINO ResNet18 model, yet their consideration offered meaningful insights into the separation of these clusters based on distinct geographical associations.
3.4 Comparison of the default EcoTaxa classifier, with the two DeepLOKI classifiers: DTL ResNet18 and Dino ResNet18
Our proposed DINO classifier demonstrated an accuracy of 83.9% in predicting categories for objects on LOKI images.
Furthermore, our classifier reached higher F1-Scores for 26 out of 33 categories, which accounted for 93,9% of all samples. These categories excluded Copepoda_Scolecithricella, Copepoda_Spinocalanus, Copepoda_dead, Crustacea, Euphausiacea, Foraminifera, Trochophora and Feces, where only the category Feces was Eco Taxa more accurate with a delta of 0.16. For the remaining categories both classifiers reached 0% F1-Score (Supplementary Material DeepLOKI Table S4, Figure 9).
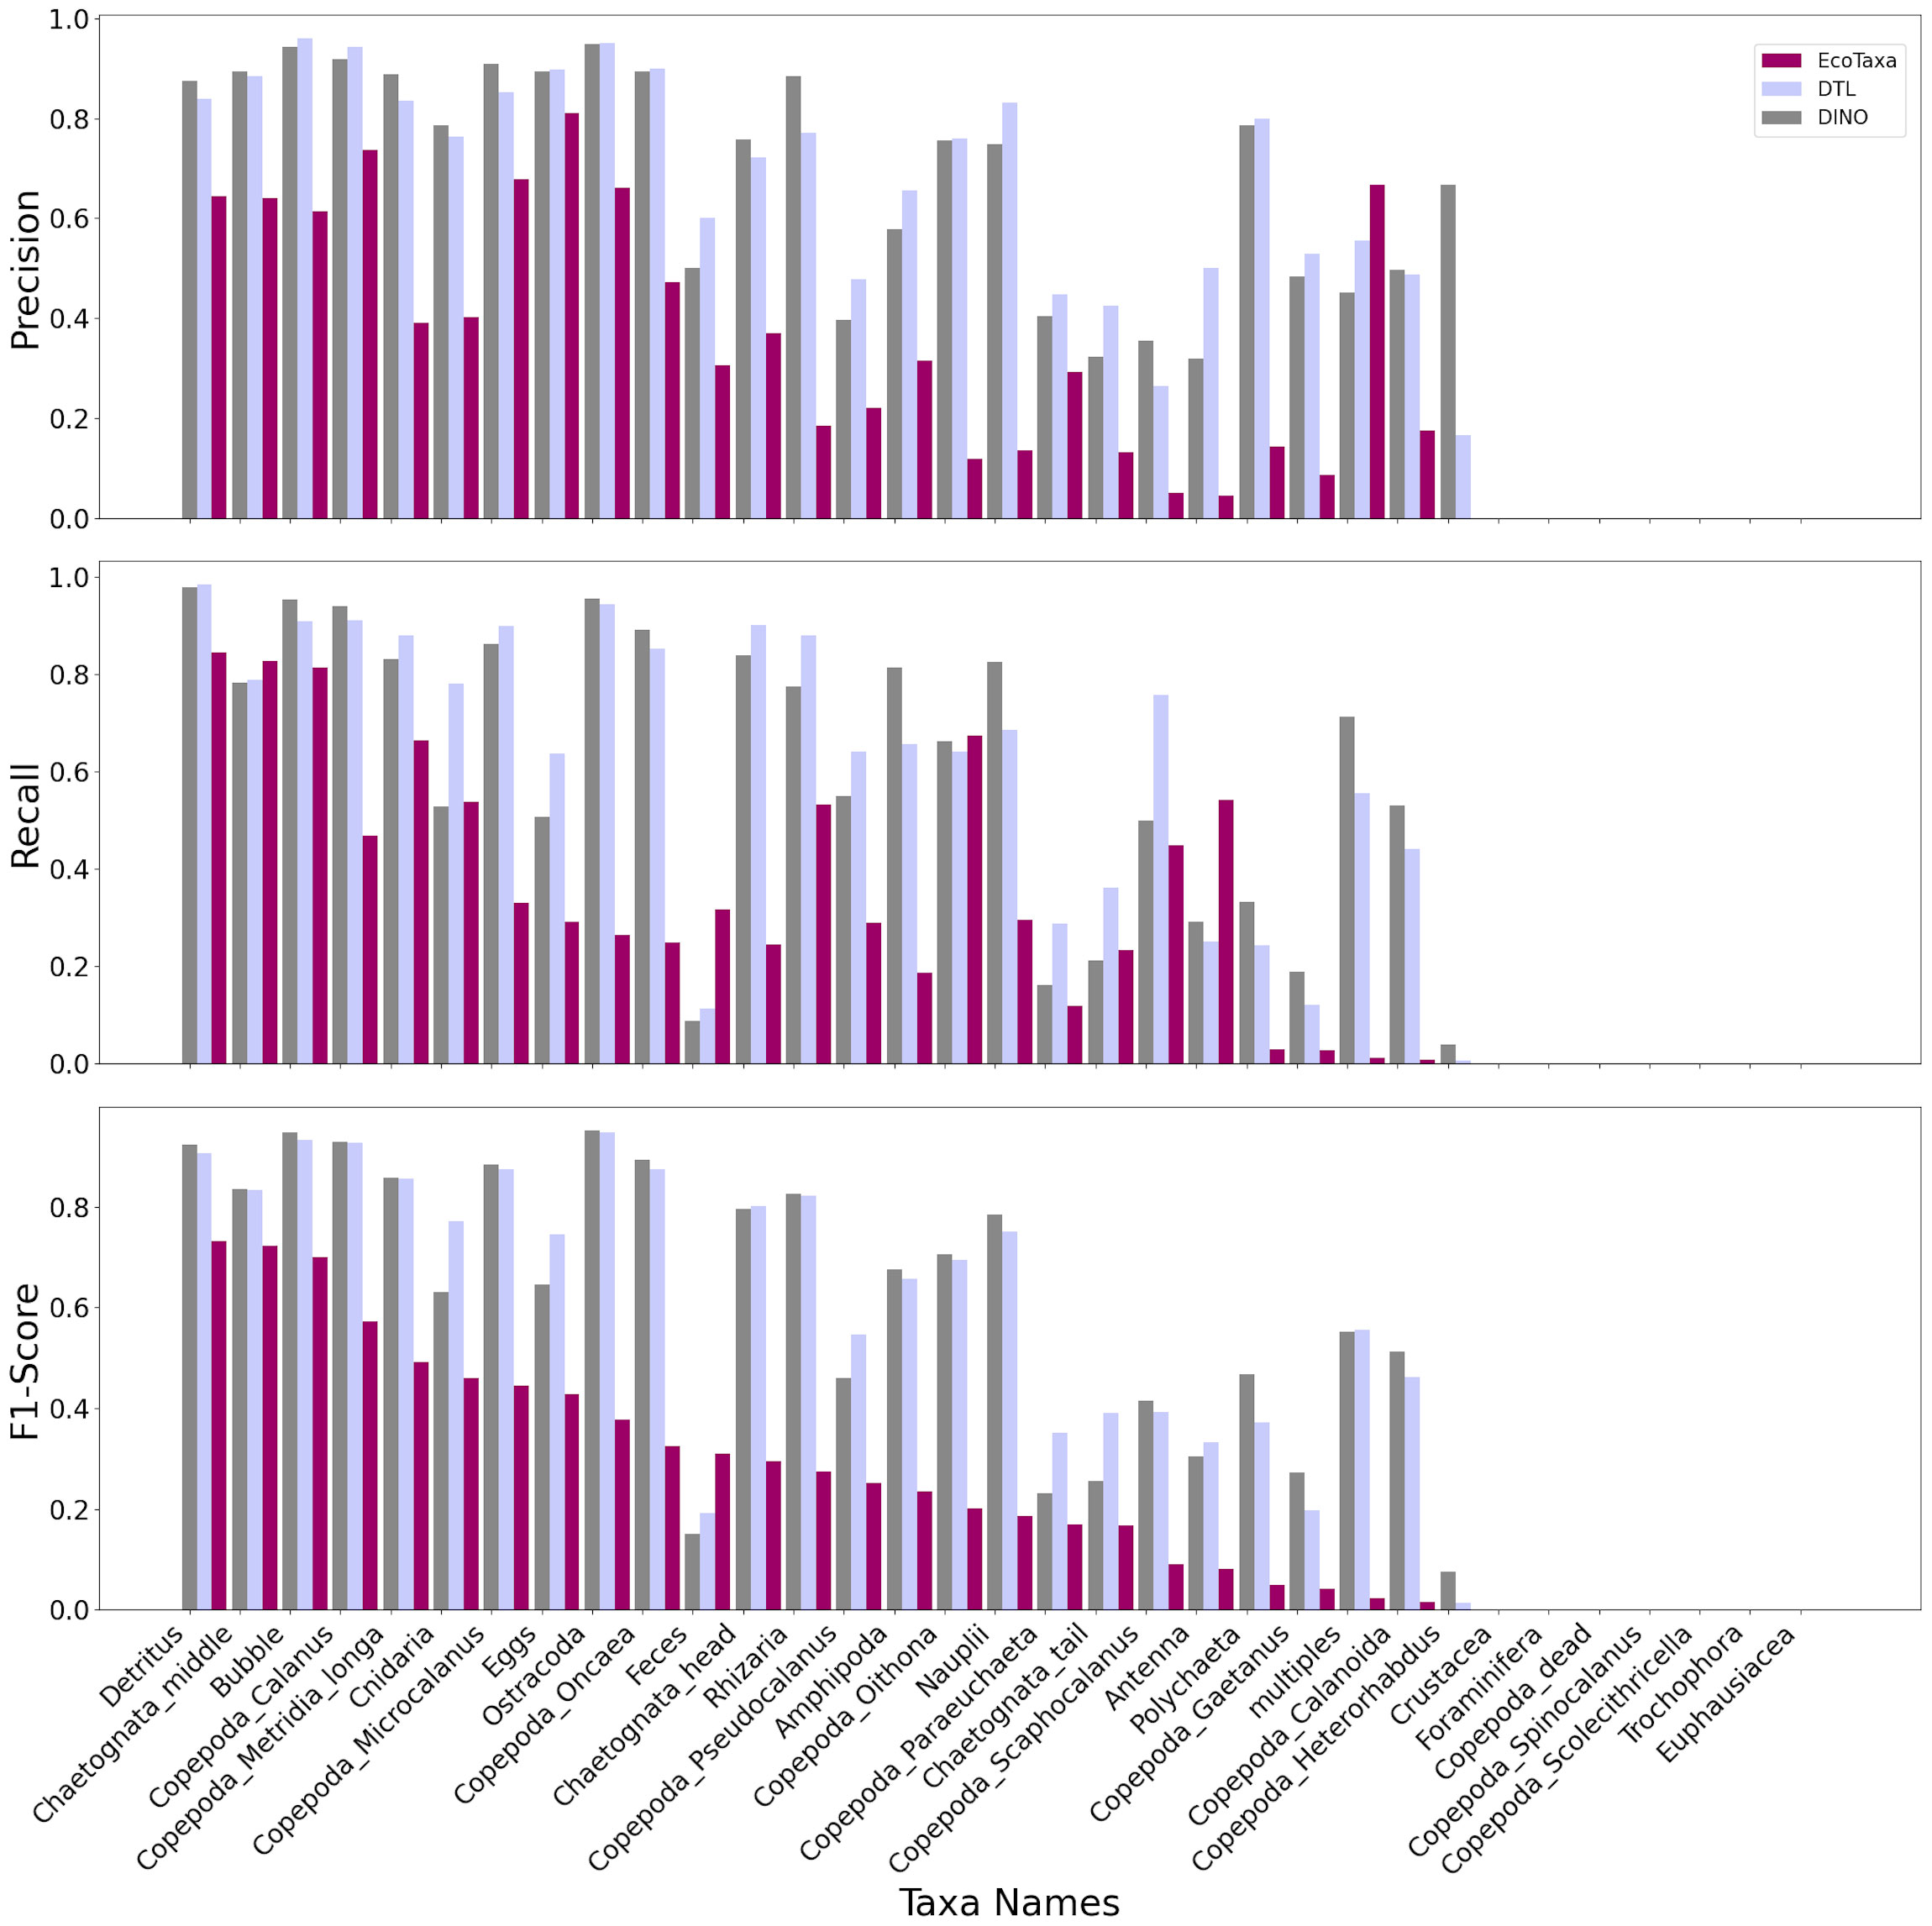
Figure 9 Precision, Recall and F1-Score on the hold out test dataset the images of Cruise P99.2 for the classes. The y-axis indicates the scores and the x-axis indicates the label for each of the 33 classes.
Overall, the newly developed DeepLOKI classifier proved to be superior for LOKI images when compared to the standard random forest classifier employed in EcoTaxa that had been designed for UVP and ZooScan images Figure 9.
3.5 The GUI interface
We have developed a graphical user interface (GUI) for pre-sorting purposes and for manual labeling, which includes a user-friendly image viewer. The GUI was built using Streamlit, a framework that enables easy deployment of web applications. One of the key advantages of our GUI is that it can be accessed directly through a web browser (platform independent), without the need for an internet connection (Figure 10, Supplementary Material DeepLOKI Figure S1).
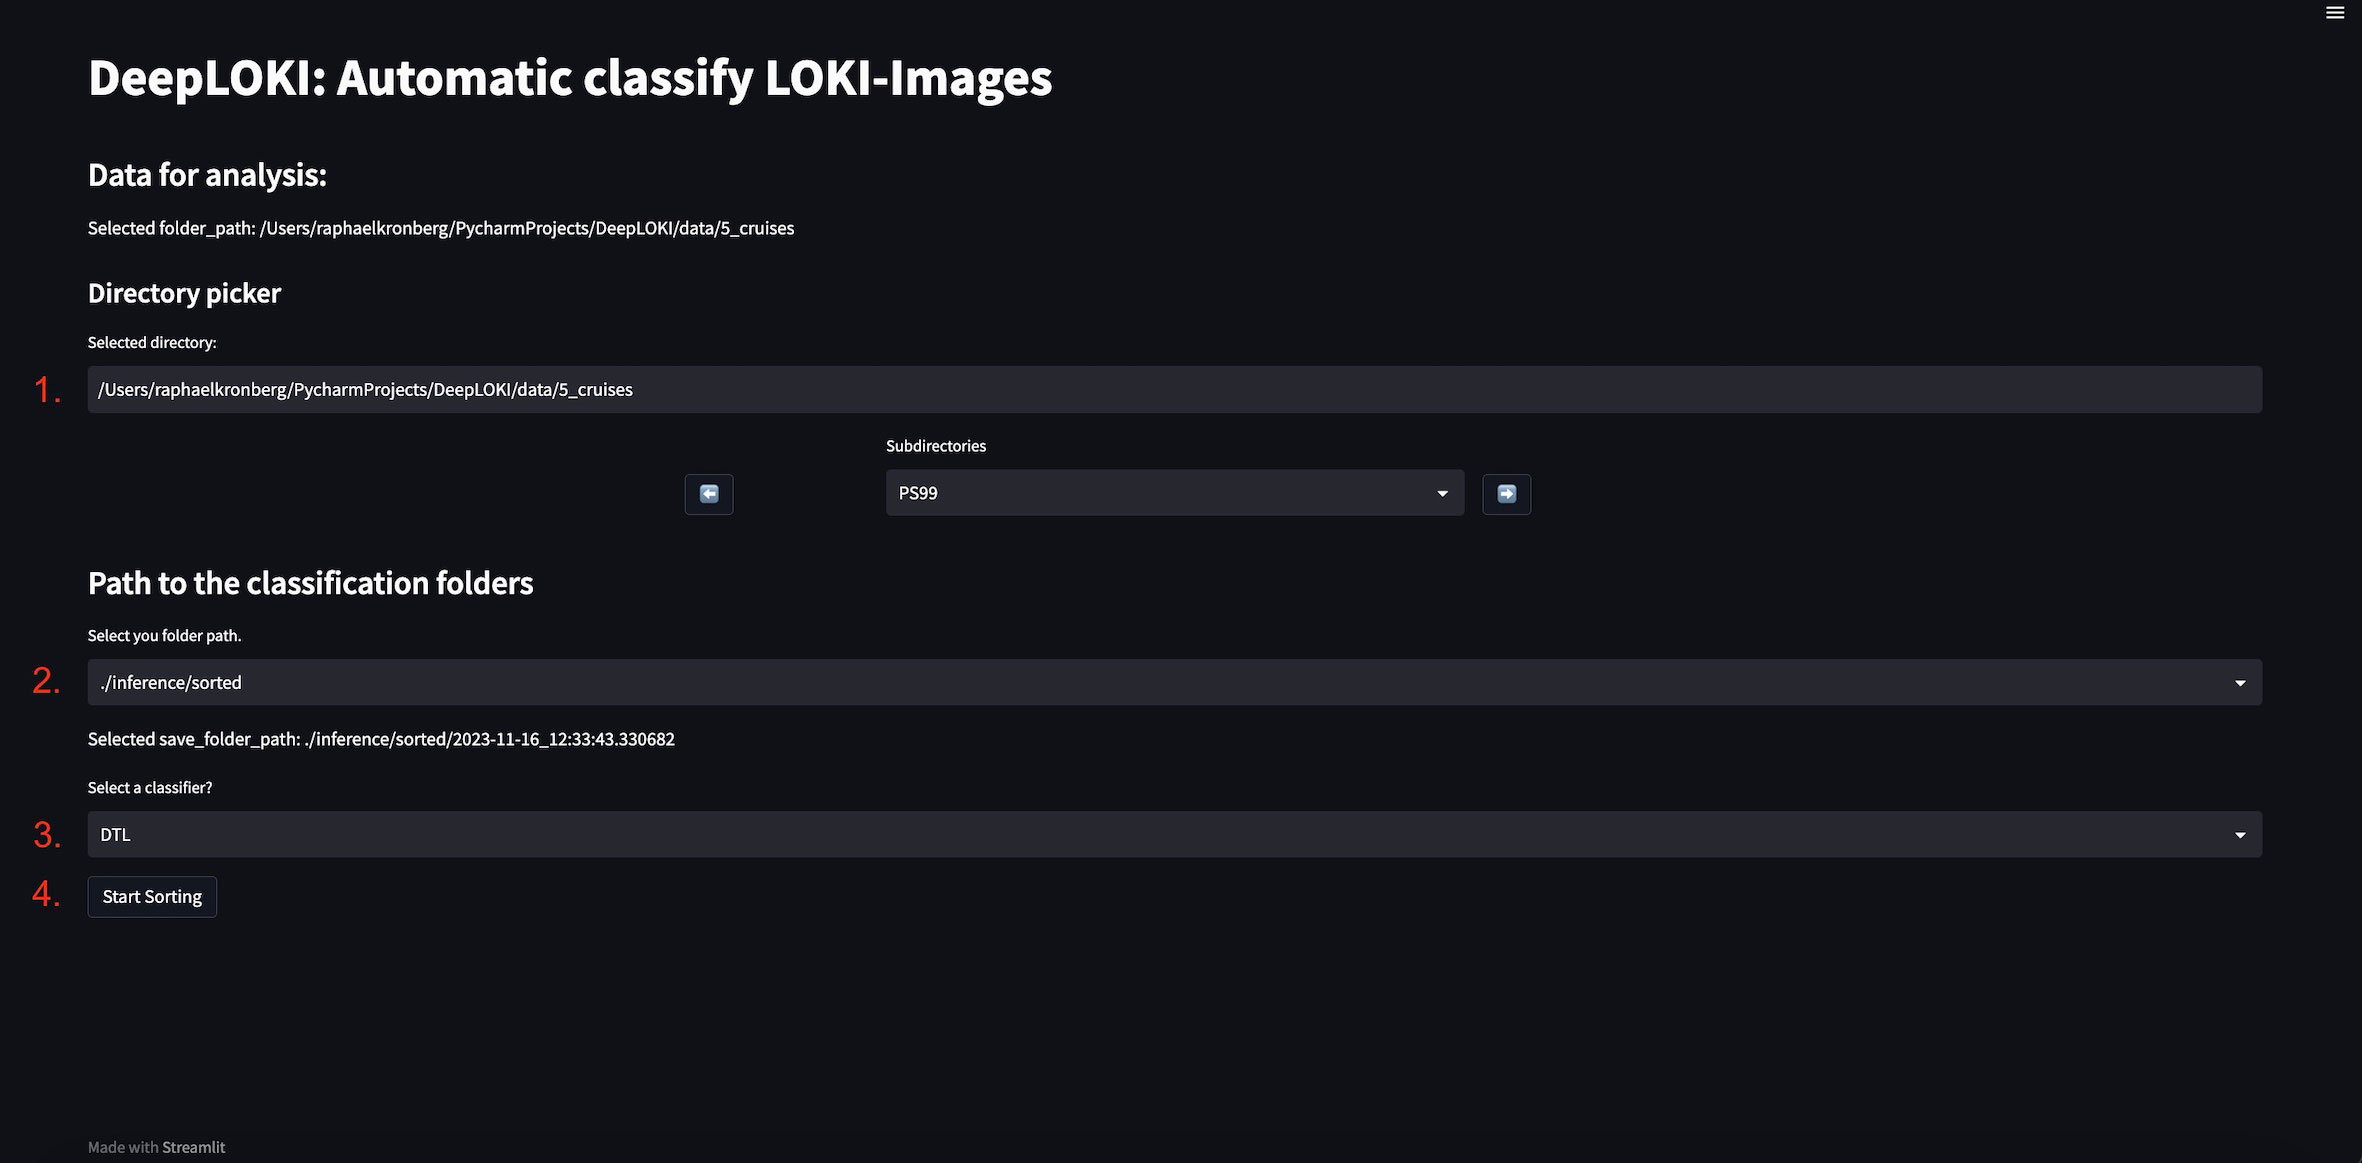
Figure 10 Graphical User Interface (GUI) of the DeepLOKI tool - Sorting:1. A directory picker to select the folder with the image, that should be pre-sorted. 2. A second input field to determine the location of class folders and the unknown folder. 3. A drop down menu to select the classifier. Folder directly from the Loki System can be process in a few minutes. 4. The Start Sorting Button for starting the sorting process.
3.6 Time consumption and benchmark
The pre-training with 450 epochs took less than two days on the 8 - A100 GPU DGX system. The inference of the Haul containing about 1,400 images only took 14.8202 seconds.
4 Discussion
This study introduces the framework DeepLOKI, designed for categorizing objects on high-resolution black-and-white images obtained from the LOKI system (Schulz et al., 2010). Our approach incorporates advanced deep learning techniques, specifically convolutional neural networks (CNNs), utilizing both deep transfer learning and self-supervised learning methods. In terms of accuracy and F1-score, DeepLOKI outperforms the currently used web-based tool EcoTaxa that has been developed for images collected by other camera systems, specifically the UVP and the ZooScan (Grosjean et al., 2004; Picheral et al., 2017). To improve the usability of DeepLOKI, we have developed a user-friendly graphical user interface (GUI) that simplifies interaction with the framework. This GUI streamlines the classifying of zooplankton images, making this process easy to use. An advantage of DeepLOKI is that the application can be executed on a portable computer, making it suitable for implementation during cruises as it does not rely on internet access, which is often limited in remote regions such as the Arctic. Our DeepLOKI pipeline thus allows for fast image classification immediately after a cast and prompt evaluation of the zooplankton community in almost real-time. In this study, we utilized a training set of approximately 194,479 images collected during four cruises. We achieved a classification accuracy of 83.9% when classifying images from an independent fifth cruise, including 20,683 images. Both our proposed approaches are considered to be supervised, because the fine-tuning is based on labeled data. This demonstrates the effectiveness and robustness of DeepLOKI in accurately categorizing zooplankton images from the same area, i.e., Fram Strait. This approach significantly improves the efficiency of the research process and empowers researchers to make more informed decisions on sampling during a cruise.
Deep transfer learning has been employed to classify plankton data successfully(Orenstein and Beijbom, 2017; Cheng et al., 2019; Lumini and Nanni, 2019). Utilizing openly accessible datasets of categorized plankton images can facilitate the development of such designs (Sosik et al., 2015; Elineau et al., 2018; González et al., 2019; Cornils et al., 2022). Instead of just relying on transfer learning, the focus has now shifted to a two-step process called self-supervised learning. In this approach, a backbone is first pre-trained using self-supervised data to obtain a latent space representation of the images. Once the backbone has been pre-trained and its weights learned, it can then be fine-tuned for a classification task using annotated images. Numerous such methods exist, for example, Momentum contrast (MoCo), Self-distillation with no labels (DINO),and Simple Framework for Contrastive Learning (SimCLR): (Chen et al., 2020; He et al., 2020; Caron et al., 2021). We applied the DINO method for our work but did not evaluate the other approaches. It’s worth noting that these alternative methods incur additional computational overhead compared to simply utilizing the pre-trained ImageNet models. Our framework is designed to be modular. We have presented two potential classifiers in this paper, but it can be extended with more classifiers, which should be implemented in PyTorch. Thus, we abstain from comparing our approach to others since both our classifiers are based on a relatively simple backbone architecture. This architecture may be replaced or expanded, given sufficient resources. Our framework facilitates the training and inference of these methods. To make appropriate methods comparisons, standardized benchmark datasets should be employed. Our study utilized exclusive proprietary data due to the specialized nature of our LOKI dataset. Our main goal is to simplify workflow and integrate the self-supervised learning technique Dino in LOKI images, along with presenting a detailed representation of the latent space.
To enhance the initial sorting process and the precision of image categorization, we incorporated a confidence threshold for the neural network. This threshold enables us to exercise greater caution when assigning images to specific category folders. As a consequence, an image that may have previously been classified with uncertainty is now allocated to the “unknown” folder. This approach minimizes the risk of mislabeling images. However, it is important to note that implementing this method may result in a trade-off with recall, which refers to the ability to detect true positives. While our focus on improving classification precision may lead to a decrease in recall, as we may detect fewer true positive cases, the overall result is a more reliable classification system with lower numbers of misclassifications. We don’t tackle the problem of “Previously unseen classes and unknown particles” (Eerola et al., 2023); this could be future work and is out of scope for this study.
For the automatic removal of duplicate images, certain algorithms that do not rely on image parameters could be implemented. However, it is beyond the scope of this study.
To recap, our approach optimizes the allocation of resources by automatically categorizing images and allows researchers to focus on more complex cases, i.e., images that are marked as unknown by the algorithm. Our approach also enables the identification and separation of artifacts, such as dead tissue, eggs, and bubbles. This not only enhances the overall accuracy of the classification process but also saves valuable time by streamlining the analysis.
During our analysis, we noticed some mislabeled images within the annotated image data, particularly in categories that comprise copepod genera (i.e., Copepoda_Metridia, Copepoda_Pseudocalanus). This highlights the need for additional datasets to improve the performance of neural networks in zooplankton classification. Accurate identification of the calanoids is especially critical in deep learning-based analyses of LOKI images, as this is the specific area where the algorithms encountered the highest level of confusion. Focusing on improving the network’s ability to correctly identify these species is crucial for enhancing the overall effectiveness of the analysis. Furthermore, our study successfully demonstrated the classification of species with a relatively low number of images in the training data. This indicates the potential of our approach to effectively classify zooplankton species even when limited training data is available. For instance, we achieved an F1-Score of 0.83 for Chaetognata_middle, despite having only 1063 training/validation available for training and 184 test images for testing. However, our algorithm encountered difficulties when dealing with smaller categories, such as Foraminifera, with a training dataset size of only 121 examples.
We observed the trend that for categories with less than 1000 training images, the F1-Score was below 50% with the exception of Cnidaria, which are morphologically very distinct from all other categories. The accuracy of neural networks, in general, (Kavzoglu, 2009; LeCun et al., 2015; Krizhevsky et al., 2017) tends to increase with data set size. This is because a larger dataset provides more diverse examples, allowing the network to learn more robust representations of the underlying patterns. Based on more data, the network can also better capture the underlying distribution of the problem space and improve its generalization capabilities. However, it’s worth noting that the relationship between data size and accuracy is not always linear and can reach a plateau or even decrease with excessively large datasets (Echle et al., 2020). By augmenting (i.e., rotating the data) the training data, we can provide an algorithm with a more comprehensive and representative set of examples, enabling it to better understand and classify groups that have limited representation in the current dataset.
Our analysis of the latent space embedding of zooplankton images obtained through self-supervised pre-training using ResNet18 revealed an insightful observation. By examining the metadata, specifically station information, we discovered a distinct clustering pattern that was not influenced by the pre- or training process of the ResNet18 model. These clusters were primarily associated with three specific geographic locations (longitude, latitude), which were separated from all other locations in the dataset. When we tested the image parameters extracted from the LOKI browser, we found significant differences in most descriptors, indicating that the images from different geographic locations indeed differed in their optical properties (For example, see Supplementary Material DeepLOKI Table S1 and Supplementary Material DeepLOKI Table S2 that display the variations in image parameters and image descriptors for Copepoda_Calanus). At present, these differences cannot be explained by, for example, zooplankton population dynamics, and more detailed analyses would be necessary to make use of this result. Deep-learning-supported annotation has some requirements that the researchers must meet. For example, the DINO approach that we implemented needs access to sufficient computing power. We recommend re-pre-training the DINO ResNet18 when a sufficient number of new data (i.e. the next 200,000 images) is available through additional cruises. If these images are annotated, DINO and DTL should undergo retraining utilizing the finetuning techniques. To mitigate such resource limitations, we employed a small ResNet18 model as the backbone, enabling inference (pre-sorting of the images) on portable computers and mitigating all resource limitations. Our data clearly illustrate the ability of various algorithmic approaches to differentiate among the 33 categories present in our dataset. Nevertheless, during the training phase, we observed that the ResNet18 model with student-teacher self-supervised pre-training exhibited strong performance for the specific task at hand. The current method performed successfully and promises to enhance LOKI image analyses. It has to be noted that LOKI is currently used only in few working groups, however, with the technical improvements of cameras, the resolution of images from other optical systems used in marine studies may increases considerably. DeepLOKI does not require high-resolution images only; it resizes (convert down in resolution) the image down to 224 x224 pixel.
Therefore, our pipeline can serve as a valuable principle for future applications. Its successful performance and ability to handle the challenges specific to high-resolution images that present great morphological details could make it a promising framework that can be adapted and extended for further image-based research and analysis in marine environments.
5 Conclusion
Our study presents a novel and effective approach for zooplankton image classification using a self-supervised pre-trained ResNet18 model in conjunction with the LOKI system. The results clearly demonstrate the advantages of this approach over traditional methods, such as random forest classification, especially when a large training dataset is available. Compared to the default random forest available in EcoTaxa, the ResNet18 classification performance was two times higher. The DeepLOKI framework offers streamlined processes that save time and minimize potential errors, eliminating the need for calculating image parameters and providing a more efficient pipeline from the LOKI system to the classified images. Deep learning-based classification not only improves accuracy but also expedites the estimation of organism density at each station. By considering the potential for miss-classification, density is inferred based on the number of organisms sorted into specific folders.
Despite the promising results, there is still room for further improvement by including additional data samples to enhance the model’s performance.
One of the advantages of our deep learning framework is its versatility and flexibility. Besides handling just images from a single device like the LOKI system, the framework can be easily adapted to different image data, for example, phytoplankton obtained from multiple devices. By leveraging the power of deep learning, our framework effectively extracts meaningful features and patterns to classify images, making it a valuable tool for researchers working with diverse datasets in various domains.
In conclusion, our study demonstrates the efficacy of utilizing a self-supervised pre-trained ResNet18 model in combination with the LOKI system for zooplankton image classification. The DeepLOKI framework offers improved performance, efficiency, and adaptability, making it a promising approach for advancing zooplankton research and facilitating accurate analysis across different ecosystems.
Data availability statement
The data analyzed in this study is subject to the following licenses/restrictions: The data used for the model training, validation and testing are part of other research projects, not all of these dataset are fully annotated by now. The datasets to test the GUI can be found in the Sciebo https://uni-duesseldorf.sciebo.de/s/okWh4728VwnCBGp. The codes available at https://gitlab.com/qtb-hhu/qtb-sda/DeepLOKI. Requests to access these datasets should be directed to Barbara Niehoff Barbara.Niehoff@awi.de; Ellen Oldenburg Ellen.Oldenburg@hhu.de.
Author contributions
EO: Data curation, Formal analysis, Methodology, Project administration, Supervision, Visualization, Writing – original draft, Conceptualization. RMK: Conceptualization, Formal analysis, Methodology, Software, Visualization, Writing – original draft. BN: Data curation, Funding acquisition, Resources, Validation, Writing – review & editing. OE: Funding acquisition, Writing – review & editing. OP: Conceptualization, Resources, Validation, Writing – review & editing.
Funding
The author(s) declare financial support was received for the research, authorship, and/or publication of this article. This work was further supported by The Deutsche Forschungsgemeinschaft (DFG) under grant number EB 418/6-1 (From Dusk till Dawn) and under Germany’s Excellence Strategy - EXC-2048/1 - project ID 390686111 (CEPLAS)(EO and OE). The image analyses were supported by the BMBF funded projects QUARCS (grant number 03F0777A) and MAZE (03V01666).
Acknowledgments
Computational infrastructure and support were provided by the Centre for Information and Media Technology at Heinrich Heine University Düsseldorf. We thank Nicole Hildebrandt, Benjamin Meyer and Dong-yung Kim for evaluating the automatic LOKI image classification. We also thank the scientists, the captains and crews of RV Polarstern for their excellent support at sea during the, expeditions included for this study. Ship time for RV Polarstern was provided under grants AWI_PS99, AWI_PS106, AWI_PS107_05, AWI_PS114_01, AWI_PS122 of RV Polarstern. We are grateful to both reviewers for their valuable input and time dedicated to improving our manuscript. Their insights have been instrumental in enhancing its quality.
Conflict of interest
The authors declare that the research was conducted in the absence of any commercial or financial relationships that could be construed as a potential conflict of interest.
Publisher’s note
All claims expressed in this article are solely those of the authors and do not necessarily represent those of their affiliated organizations, or those of the publisher, the editors and the reviewers. Any product that may be evaluated in this article, or claim that may be made by its manufacturer, is not guaranteed or endorsed by the publisher.
Supplementary material
The Supplementary Material for this article can be found online at: https://www.frontiersin.org/articles/10.3389/fmars.2023.1280510/full#supplementary-material
References
Bi H., Guo Z., Benfield M. C., Fan C., Ford M., Shahrestani S., et al. (2015). A semi-automated image analysis procedure for in situ plankton imaging systems. PloS One 10, e0127121. doi: 10.1371/journal.pone.0127121
Bi H., Song J., Zhao J., Liu H., Cheng X., Wang L., et al. (2022). Temporal characteristics of plankton indicators in coastal waters: high-frequency data from planktonscope. J. Sea Res. 189, 102283. doi: 10.1016/j.seares.2022.102283
Caron M., Touvron H., Misra I., Jégou H., Mairal J., Bojanowski P., et al. (2021). “Emerging properties in self-supervised vision transformers,” 2021 IEEE/CVF International Conference on Computer Vision (ICCV), Montreal, QC, Canada. 9650–9660. doi: 10.1109/ICCV48922.2021.00951
Chen T., Kornblith S., Norouzi M., Hinton G. (2020). “A simple framework for contrastive learning of visual representations,” in International conference on machine learning (PMLR), vol 119 of Proceedings of Machine Learning Research 1597–1607. https://proceedings.mlr.press/v119/chen20j.html
Cheng K., Cheng X., Wang Y., Bi H., Benfield M. C. (2019). Enhanced convolutional neural network for plankton identification and enumeration. PloS One 14, e0219570. doi: 10.1371/journal.pone.0219570
Cornils A., Thomisch K., Hase J., Hildebrandt N., Auel H., Niehoff B. (2022). Testing the usefulness of optical data for zooplankton long-term monitoring: Taxonomic composition, abundance, biomass, and size spectra from zooscan image analysis. Limnol. Oceanogr.: Methods 20, 428–450. doi: 10.1002/lom3.10495
Cowen R. K., Guigand C. M. (2008). In situ ichthyoplankton imaging system (isiis): system design and preliminary results. Limnol. Oceanogr.: Methods 6, 126–132. doi: 10.4319/lom.2008.6.126
Echle A., Grabsch H. I., Quirke P., van den Brandt P. A., West N. P., Hutchins G. G., et al. (2020). Clinical-grade detection of microsatellite instability in colorectal tumors by deep learning. Gastroenterology 159, 1406–1416. doi: 10.1053/j.gastro.2020.06.021
Eerola T., Batrakhanov D., Barazandeh N. V., Kraft K., Haraguchi L., Lensu L., et al. (2023). Survey of automatic plankton image recognition: Challenges, existing solutions and future perspectives. arXiv preprint arXiv:2305.11739. doi: 10.48550/arXiv.2305.11739
Elineau A., Desnos C., Jalabert L., Olivier M., Romagnan J.-B., Brandao M., et al. (2018). Zooscannet: plankton images captured with the zooscan. SEANOE.
González P., Castaño A., Peacock E. E., Díez J., Del Coz J. J., Sosik H. M. (2019). Automatic plankton quantification using deep features. J. Plankton Res. 41, 449–463. doi: 10.1093/plankt/fbz023
Gorsky G., Guilbert P., Valenta E. (1989). The autonomous image analyzer–enumeration, measurement and identification of marine phytoplankton. Mar. Ecol. Prog. Ser. 58, 133–142. doi: 10.3354/meps058133
Grosjean P., Picheral M., Warembourg C., Gorsky G. (2004). Enumeration, measurement, and identification of net zooplankton samples using the zooscan digital imaging system. ICES J. Mar. Sci. 61, 518–525. doi: 10.1016/j.icesjms.2004.03.012
Hauss H., Christiansen S., Schütte F., Kiko R., Edvam Lima M., Rodrigues E., et al. (2016). Dead zone or oasis in the open ocean? zooplankton distribution and migration in low-oxygen modewater eddies. Biogeosciences 13, 1977–1989. doi: 10.5194/bg-13-1977-2016
He K., Fan H., Wu Y., Xie S., Girshick R. (2020). “Momentum contrast for unsupervised visual representation learning,” in Proceedings of the IEEE/CVF conference on computer vision and pattern recognition. 9729–9738. doi: 10.1109/CVPR42600.2020.00975
He K., Zhang X., Ren S., Sun J. (2016). “Deep residual learning for image recognition,” in Proceedings of the IEEE conference on computer vision and pattern recognition. 770–778. doi: 10.1109/CVPR.2016.90
Hirche H., Barz K., Ayon P., Schulz J. (2014). High resolution vertical distribution of the copepod calanus Chilensis in relation to the shallow oxygen minimum zone off northern Peru using loki, a new plankton imaging system. Deep Sea Res. Part I: Oceanogr. Res. Papers 88, 63–73. doi: 10.1016/j.dsr.2014.03.001
Kavzoglu T. (2009). Increasing the accuracy of neural network classification using refined training data. Environ. Model. Softw. 24, 850–858. doi: 10.1016/j.envsoft.2008.11.012
Kiko R., Brandt P., Christiansen S., Faustmann J., Kriest I., Rodrigues E., et al. (2020). Zooplanktonmediated fluxes in the eastern tropical north atlantic. Front. Mar. Sci. 7, 358. doi: 10.3389/fmars.2020.00358
Kingma D. P., Ba J. (2014). Adam: A method for stochastic optimization. arXiv preprint arXiv:1412.6980. doi: 10.48550/arXiv.1412.6980
Kraft K., Velhonoja O., Eerola T., Suikkanen S., Tamminen T., Haraguchi L., et al. (2022). Towards operational phytoplankton recognition with automated high-throughput imaging, near-real-time data processing, and convolutional neural networks. Front. Mar. Sci. 9, 867695. doi: 10.3389/fmars.2022.867695
Krizhevsky A., Sutskever I., Hinton G. E. (2017). Imagenet classification with deep convolutional neural networks. Commun. ACM 60, 84–90. doi: 10.1145/3065386
Kronberg R. M. (2022). Applications of Supervised Deep (Transfer) Learning for Medical Image Classification. Ph.D. thesis (HHU).
Kronberg R. M., Haeberle L., Pfaus M., Xu H. C., Krings K. S., Schlensog M., et al. (2022). Communicator-driven data preprocessing improves deep transfer learning of histopathological prediction of pancreatic ductal adenocarcinoma. Cancers 14, 1964. doi: 10.3390/cancers14081964
Lertvilai P. (2020). The in situ plankton assemblage explorer (ipax): An inexpensive underwater imaging system for zooplankton study. Methods Ecol. Evol. 11, 1042–1048. doi: 10.1111/2041-210X.13441
Lumini A., Nanni L. (2019). Deep learning and transfer learning features for plankton classification. Ecol. Inf. 51, 33–43. doi: 10.1016/j.ecoinf.2019.02.007
Luo J. Y., Irisson J.-O., Graham B., Guigand C., Sarafraz A., Mader C., et al. (2018). Automated plankton image analysis using convolutional neural networks. Limnol. Oceanogr.: Methods 16, 814–827. doi: 10.1002/lom3.10285
McInnes L., Healy J., Melville J. (2018). Umap: Uniform manifold approximation and projection for dimension reduction. arXiv preprint arXiv:1802.03426. doi: 10.48550/arXiv.1802.03426
Noroozi M., Vinjimoor A., Favaro P., Pirsiavash H. (2018). “Boosting self-supervised learning via knowledge transfer,” in Proceedings of the IEEE conference on computer vision and pattern recognition. 9359–9367. doi: 10.1109/CVPR.2018.00975
Orenstein E. C., Ayata S.-D., Maps F., Becker É. C., Benedetti F., Biard T., et al. (2022). Machine learning techniques to characterize functional traits of plankton from image data. Limnol. Oceanogr. 67, 1647–1669. doi: 10.1002/lno.12101
Orenstein E. C., Beijbom O. (2017). “Transfer learning and deep feature extraction for planktonic image data sets,” in 2017 IEEE Winter Conference on Applications of Computer Vision (WACV) (IEEE). 1082–1088. doi: 10.1109/WACV.2017.125
Picheral M., Catalano C., Brousseau D., Claustre H., Coppola L., Leymarie E., et al. (2022). The underwater vision profiler 6: an imaging sensor of particle size spectra and plankton, for autonomous and cabled platforms. Limnol. Oceanogr.: Methods 20, 115–129. doi: 10.1002/lom3.10475
Picheral M., Colin S., Irisson J. (2017). Ecotaxa, a tool for the taxonomic classification of images.
Picheral M., Guidi L., Stemmann L., Karl D. M., Iddaoud G., Gorsky G. (2010). The underwater vision profiler 5: An advanced instrument for high spatial resolution studies of particle size spectra and zooplankton. Limnol. Oceanogr.: Methods 8, 462–473. doi: 10.4319/lom.2010.8.462
Rubbens P., Brodie S., Cordier T., Destro Barcellos D., Devos P., Fernandes-Salvador J. A., et al. (2023). Machine learning in marine ecology: an overview of techniques and applications. ICES J. Mar. Sci. 80 (7), 1829–1853. doi: 10.1093/icesjms/fsad100
Schmid M. S., Aubry C., Grigor J., Fortier L. (2015). Zoomie v1. 0 (zooplankton multiple image exclusion).
Schmid M. S., Aubry C., Grigor J., Fortier L. (2016). The loki underwater imaging system and an automatic identification model for the detection of zooplankton taxa in the arctic ocean. Methods Oceanogr. 15, 129–160. doi: 10.1016/j.mio.2016.03.003
Schulz J., Barz K., Ayon P., Luedtke A., Zielinski O., Mengedoht D., et al. (2010). Imaging of plankton specimens with the lightframe on-sight keyspecies investigation (loki) system. J. Eur. Optical Society Rapid Publications 5. doi: 10.2971/jeos.2010.10017s
Sosik H. M., Peacock E. E., Brownlee E. F. (2015) Annotated plankton images data set for developing and evaluating classification methods. Available at: http://darchive.mblwhoilibrary.org/handle/1912/7341.
Tan C., Sun F., Kong T., Zhang W., Yang C., Liu C. (2018). “A survey on deep transfer learning,” in International conference on artificial neural networks (Springer). 270–279. doi: 10.1007/978-3-030-01424-7_27
van der Maaten L., Hinton G. (2008). Visualizing data using t-sne. J. Mach. Learn. Res. 9, 2579–2605.
Werner J., Kronberg R. M., Stachura P., Ostermann P. N., Müller L., Schaal H., et al. (2021). Deep transfer learning approach for automatic recognition of drug toxicity and inhibition of sars-cov-2. Viruses 13, 610. doi: 10.3390/v13040610
Yang K., Qinami K., Fei-Fei L., Deng J., Russakovsky O. (2020). “Towards fairer datasets: Filtering and balancing the distribution of the people subtree in the imagenet hierarchy,” in Conference on Fairness, Accountability, and Transparency. 547–558. doi: 10.1145/3351095.3375709
Yosinski J., Clune J., Bengio Y., Lipson H. (2014). How transferable are features in deep neural networks? Adv. Neural Inf. Process. Syst. 27.
Keywords: computer vision, deep learning, DeepLOKI, keystone species, marine and zooplankton
Citation: Oldenburg E, Kronberg RM, Niehoff B, Ebenhöh O and Popa O (2023) DeepLOKI- a deep learning based approach to identify zooplankton taxa on high-resolution images from the optical plankton recorder LOKI. Front. Mar. Sci. 10:1280510. doi: 10.3389/fmars.2023.1280510
Received: 24 August 2023; Accepted: 06 November 2023;
Published: 30 November 2023.
Edited by:
Carolin Müller, Leibniz Centre for Tropical Marine Research (LG), GermanyReviewed by:
Tuomas Eerola, LUT University, FinlandKatrin Linse, British Antarctic Survey (BAS), United Kingdom
Copyright © 2023 Oldenburg, Kronberg, Niehoff, Ebenhöh and Popa. This is an open-access article distributed under the terms of the Creative Commons Attribution License (CC BY). The use, distribution or reproduction in other forums is permitted, provided the original author(s) and the copyright owner(s) are credited and that the original publication in this journal is cited, in accordance with accepted academic practice. No use, distribution or reproduction is permitted which does not comply with these terms.
*Correspondence: Ellen Oldenburg, RWxsZW4uT2xkZW5idXJnQGhodS5kZQ==
†These authors have contributed equally to this work and share first authorship