 Takahito Ikenoue1*
 Ryota Nakajima1
 Pravakar Mishra2
 Eswara Venkatesaperumal Ramasamy3
 Amane Fujiwara1
 Shigeto Nishino1
 Akihiko Murata1Eiji Watanabe1
 Motoyo Itoh1
- 1Research Institute for Global Change, Japan Agency for Marine-Earth Science and Technology (JAMSTEC), Yokosuka, Japan
- 2National Centre for Coastal Research (NCCR), Ministry of Earth Sciences (MoES), Chennai, Tamil Nadu, India
- 3School of Environmental Sciences, Mahatma Gandhi University, Kottayam, Kerala, India
The microplastics inflow into the Arctic Ocean may increase environmental stress on the Arctic marine ecosystem on the Pacific side, where sea ice has been significantly reduced because of global warming. However, quantitative data on microplastics are very limited in the Beaufort Sea, which is covered by sea ice for most of the year, even in summer. We therefore observed microplastic concentrations over a wide area of the southern Beaufort Sea using a neuston net from 30 August to 10 September 2022 to estimate the total number (particle inventory) and mass (mass inventory) of microplastics in the entire water column. The particle inventory during the sampling period ranged from 937 to 28,081 pieces km−2 (mean ± standard deviation, 7570 ± 7600 pieces km−2). The mass inventory of microplastics ranged from 22 to 664 g km−2 (179 ± 180 g km−2). Relatively high microplastic inventories (>6500 pieces km−2) were observed off Utqiaġvik and the mouth of the Mackenzie River, suggesting that some microplastics originate not only in the Pacific but also in the Arctic. These values indicate that waters in the southern Beaufort Sea is contaminated with microplastics to the same order of magnitude as the Chukchi Sea.
1 Introduction
At present, 0.41 to 4.0 million tons of plastic litter are released into the global ocean through rivers every year (Lebreton et al., 2017; Schmidt et al., 2017). Plastic debris can cause serious marine pollution because it is fragmented by ultraviolet light, biotic factors and physically crushed into smaller, non-recoverable particles of less than 5 mm (microplastics, hereafter referred to as MPs)(Zhang et al., 2021). The weight of plastic debris accumulated in the global ocean since the 1960s is estimated to be about 25 million tons based on computer simulations (Isobe and Iwasaki, 2022). However, based on actual observations, the estimated weight of plastic debris floating on the global ocean surface totals approximately 0.23 million tons for sizes larger than 4.76 mm (Eriksen et al., 2014) and 0.58 million tons for MPs between 0.33 and 5 mm (Isobe et al., 2021), for a total weight of 0.81 million tons. Thus, the weight of plastic debris floating in the surface layer of the world’s oceans represents only about 3% of the total weight that has accumulated in the oceans to date, and the location of the remaining 97% is unknown.
Microplastics are prone to sorb many substances, including persistent organic pollutants such as polychlorinated biphenyls (Mato et al., 2001). Therefore, this is a matter of serious concern as the toxicity from the accumulation of chemical contaminants in marine organisms due to the uptake of MPs may hinder growth and reduce fertility (Au et al., 2015; Jeong et al., 2016; Yeo et al., 2020). Microplastics have been reported with biofilms (structures of bacteria and other microbial communities) on their surfaces that can transport exotic organisms, including pathogens, and organic carbon to other waters (Zhao et al., 2021). Microplastics may also cause long-term retention of radioactive materials in the ocean surface layer via biofilms (Ikenoue et al., 2022). Thus, the MPs inflow into the oceans may have a significant impact on biogeochemical cycles as carriers of various substances. The Arctic Ocean is already under multiple environmental stresses due to global warming and associated sea-ice melting, such as increased surface water temperatures, ocean acidification, and nutrient limitation by stratification enhancement and freshening. Therefore, the inflow of MPs may further increase the environmental stress on its marine ecosystems, and it is urgent that the current status of MP pollution in the Arctic Ocean be quantitatively clarified.
Although the Arctic Ocean is far from human habitation, MPs are transported from lower latitudes through ocean currents and the atmosphere (Mishra et al., 2021; Bergmann et al., 2022), and high concentrations of MPs have been reported from sea ice and snowfall (Peeken et al., 2018; Kim et al., 2021). The Pacific side of the Arctic Ocean (Chukchi Sea, Beaufort Sea, and East Siberian Sea) is one of the potential accumulation sites for plastic debris from the Pacific Ocean. However, quantitative data on MPs are biased toward the Atlantic side of the Arctic Ocean, and for the Pacific side there exists a gap in the MP distribution data (Ikenoue et al., 2023). Recently, the concentration of MPs in the Chukchi and Beaufort Seas was reported to be lower than that on the Atlantic side of the Arctic Ocean, suggesting relatively low inflows of MPs from the Pacific and Atlantic to this region (Ross et al., 2021; Ikenoue et al., 2023). On the other hand, focusing on the Pacific side of the Arctic Ocean, the total of 77 tons of MPs in the water of the Chukchi Sea cannot even explain the 420 tons of Pacific-origin MPs that enter the Chukchi Sea in a year, indicating that the Beaufort Sea, a downstream region of Pacific-origin water, may be one of the accumulation sites for Pacific-origin MPs (Ikenoue et al., 2023). However, the abundance (total number and weight) of MPs in the Beaufort Sea has not yet been estimated.
To fill this knowledge gap, we performed a micro- and mesoplastic investigation using a neuston net in the southern Beaufort Sea of the Arctic Ocean, in early September 2022. Here we report the extensive distribution of micro- and mesoplastics larger than 0.33 mm in the surface waters in the southern Beaufort Sea and estimate for the first time water-column inventories of MPs in the region.
2 Materials and methods
2.1 Study area
The Beaufort Sea is located north of Canada and Alaska, and its boundary with the Chukchi Sea is the Barrow Canyon, Alaska. The Beaufort Sea consists of the Beaufort Sea shelf and the Canada Basin. The Beaufort Sea shelf comprise the Alaskan shelf (44,000 km2), the Mackenzie shelf (65,000 km2) and the Banks Island shelf (23,000 km2) (Macdonald et al., 2004). The Beaufort Sea shelf is narrow, ranging from 40–150 km in width, the widest being 150 km north of the mouth of the Mackenzie River in Canada. Along the Beaufort Sea coast, the major cities with populations >2000 are Utqiaġvik and Prudhoe Bay in Alaska, and Inuvik in Canada (Figure 1).
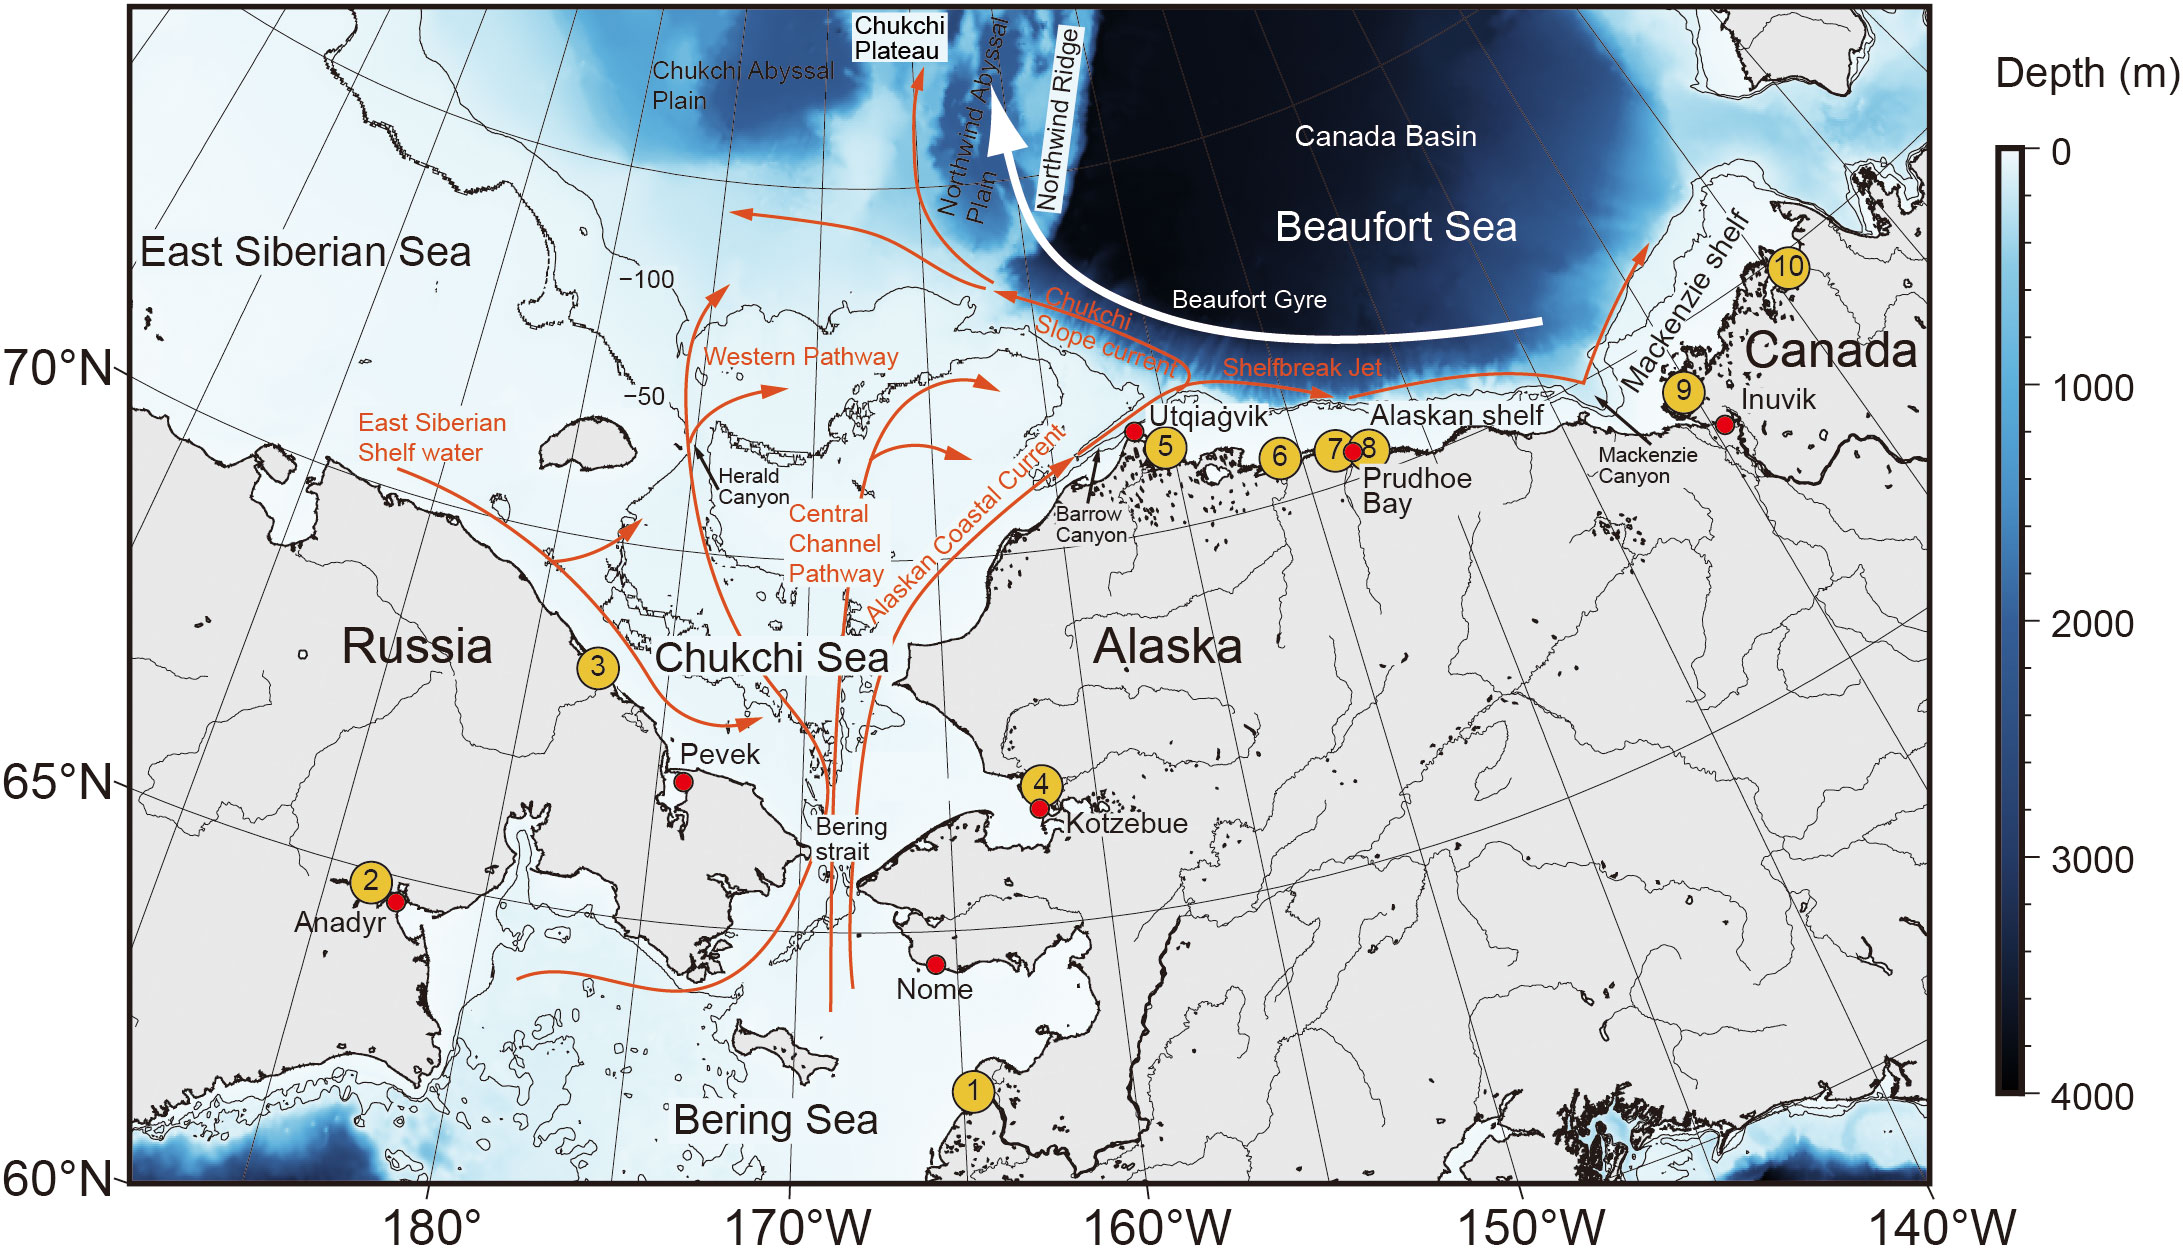
Figure 1 Map of the study area modified from Ikenoue et al. (2023) and schematic of the general surface circulation on the Pacific side of the Arctic Ocean based on Corlett and Pickart (2017). Arrows represent surface currents. Red circles indicate cities with populations of more than 2000 near the coast of the western Arctic Ocean and Bering Strait. Yellow circles represent the mouths of major rivers flowing into the western Arctic Ocean. The numbers in the yellow circles correspond to the following rivers: 1, Yukon; 2, Anadyr; 3, Kolyma; 4, Kobuk; 5, Ikpikpuk; 6, Colville; 7, Kuparuk; 8, Sagavanirktok; 9, MacKenzie; 10, Anderson. Blue shading indicates bottom depth.
The oceanography of the Beaufort Sea is represented by river-water input, strong stratification, and connections with the Pacific Ocean. Pacific-origin water enters the Chukchi Sea through the 85-km-wide Bering Strait and flows northward across the Chukchi Shelf via three pathways (Figure 1): the western pathway through Herald Canyon, the Central Channel pathway, and the Alaskan Coastal Current (Paquette and Bourke, 1979; Pickart et al., 2010; Lin et al., 2019). Most of the Pacific-origin water is transported from the Chukchi Shelf via Barrow Canyon in summer (Itoh et al., 2013; Gong and Pickart, 2015; Itoh et al., 2015). After passing through Barrow Canyon, most of the Pacific-origin water is transported westward by the Chukchi Slope Current (Corlett and Pickart, 2017; Watanabe et al., 2017), while a part of the Pacific-origin water is transported eastward by the Beaufort shelfbreak jet (Pickart, 2004; Nikolopoulos et al., 2009); the Beaufort shelfbreak jet then mixes with the Mackenzie River outflow and flows further eastward.
In the Canada Basin, the Beaufort Gyre dominates the upper ocean circulation (Proshutinsky et al., 2002), and this circulation is related to the generation of the Chukchi Slope Current. It has been reported that geostrophic currents on the periphery of the Beaufort Gyre were recently intensified by freshwater accumulation with the enhanced sea-ice melting and riverine water volume (Yamamoto-Kawai et al., 2008; Proshutinsky et al., 2009; Nishino et al., 2011; McPhee, 2013). A large amount of freshwater accumulates in the Canada Basin (Carmack et al., 2008), which has as its main source Pacific-origin water (Yamamoto-Kawai et al., 2008). On the Pacific side of the Arctic Ocean, the fraction of freshwater at depths of 0–300 m derived from North American rivers is less than 20%, and that freshwater is distributed only in the 0–30-m surface layer in estuarine and coastal areas (Yamamoto-Kawai et al., 2005).
The Beaufort Sea is covered by sea ice throughout the year, except for August–September when it melts near the coast and opens up a 50–100-km-wide area. The surface water of the Beaufort Sea up to 150-m depth is Pacific-origin water, with a surface mixed layer (salinity< 28) formed by a mixture of Pacific-origin water, sea-ice meltwater, and riverine water (Macdonald et al., 2002; Kadko and Swart, 2004; Cooper et al., 2008). The surface mixed layer is 5–10 m thick in ice-covered areas, but it can be more than twice that in ice-free areas because of wind-driven mixing (Rainville et al., 2011).
2.2 Field sampling
Micro- and mesoplastic particles floating in surface waters were collected using a neuston net at 10 stations in the southern Beaufort Sea (Alaskan and Mackenzie shelves) from 30 August to 10 September 2022 during cruise MR22-06C of the R/V Mirai of the Japan Agency for Marine-Earth Science and Technology (JAMSTEC) (Table 1, Figure 2). The neuston net (RIGO Co., Ltd., Tokyo, Japan) had a rectangular mouth opening of 75-cm height × 100-cm width and a net with 0.33-mm mesh-openings. The volume of water sampled by the net was calculated from the net-opening area and measurements from a flow meter installed in the mouth of the net. The neuston net was towed on the starboard side of the ship for 20 min at 1–2 kn (0.5–1.0 m s–1) in the upper 0.4 m of the sea surface (Michida et al., 2019). A single sample was collected at Station (Stn.) 13. Duplicate samples were collected at the remaining nine stations by repeated net towing. Samples were fixed with 5% formalin–seawater buffered with borax, and stored in 450-mL glass bottles at room temperature until further analysis.
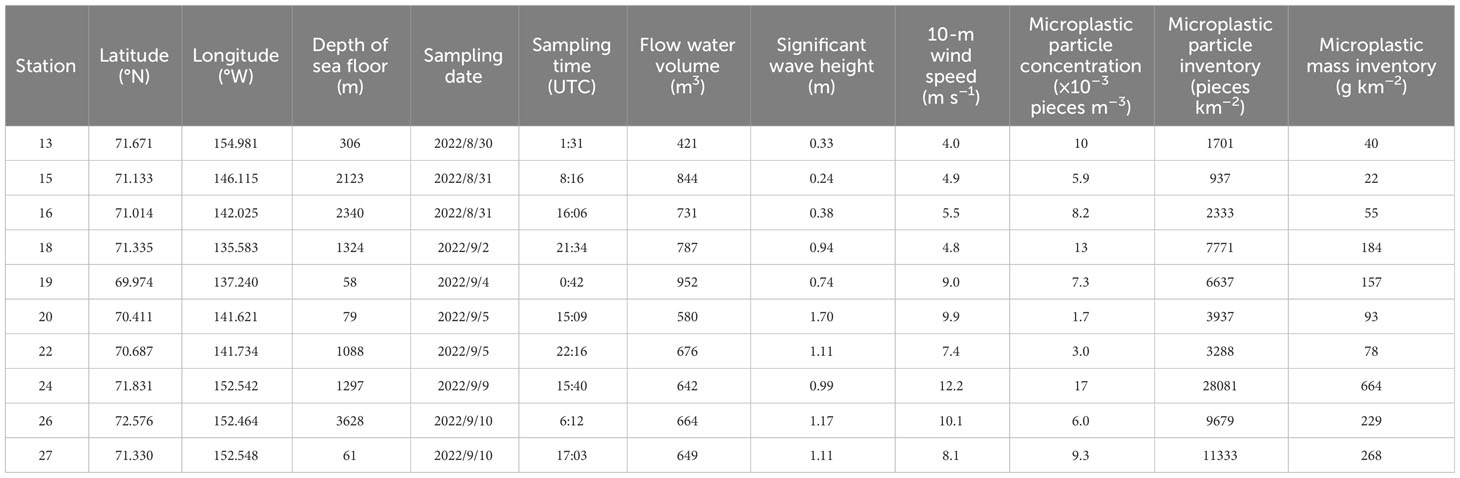
Table 1 Summary information for sampling stations, neuston-net tows, surface microplastic particle concentrations, and water-column inventories in the southern Beaufort Sea.
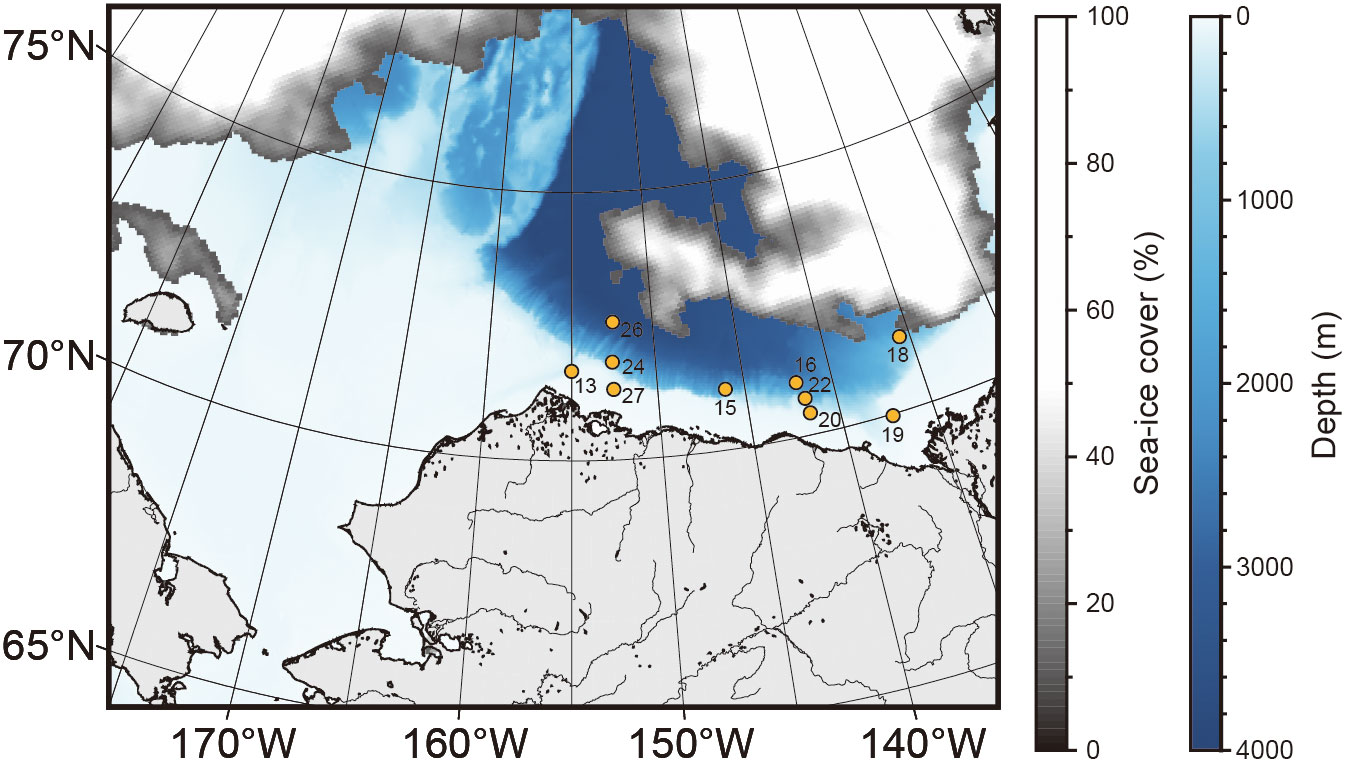
Figure 2 Location of sampling stations during cruise MR22-06C of the R/V Mirai from 30 August to 10 September 2022. Yellow circles indicate sampling stations. Grey shading represents the average sea-ice cover observed by the Advanced Microwave Scanning Radiometer 2 during the sampling periods.
To convert the surface MP concentrations to the total number of MPs in the entire water column, independent of vertical mixing, we measured wind speeds at 25 m above the sea surface and significant wave heights using the MIRAI Surface Meteorological observation (SMet) system on the R/V Mirai. We averaged the data recorded during the neuston-net samplings. The wind speeds at 25 m above the sea surface were converted to wind speeds at 10 m above the sea surface using the following equation based on the power law of wind velocity (Elliot et al., 1986).
where Wm is the measured wind speed at height Zm, and Wr is the wind speed at the required height Zr. The exponent α depends on the surface roughness; a value of 1/7 for low surface roughness and well-exposed areas such as the ocean was applied in this study.
2.3 Laboratory analysis
The neuston-net samples were processed in the same manner as described by Ikenoue et al. (2023). The details of Laboratory analysis are described in Note S1 in the Supplementary Material. Briefly, samples were processed in a laminar flow hood. The samples were digested with 30% H2O2 for 7 d at room temperature (Hurley et al., 2018). All potential plastic particles were manually pulled from the samples using forceps under a stereomicroscope (SZX16; Olympus, Tokyo, Japan). The particles were classified by shape into “fragments” (a mixture of hard fragments and film) and “lines” (thread-like materials excluding textile microfibers). Each particle was measured for maximum length. Because of potential airborne contamination by microfibers from clothing during sampling or processing (Foekema et al., 2013; Cózar et al., 2014) or paint flakes from the research vessel during observations, textile microfibers and paint flakes were excluded from our analyses.
We used Fourier transform infrared (FTIR) spectroscopy with single-reflection diamond attenuated total reflection (ATR) (Nicolet iS5; Thermo Fisher Scientific, Waltham, MA, USA) to determine the polymer types in each sorted plastic-like particle based on a method described previously (Nakajima et al., 2022).
Particles identified as plastic were weighed on an electronic balance (BM‐252; A&D Company, Tokyo, Japan). The individual micro- and mesoplastic particles in each sample were counted, and concentrations (number of pieces m–3) were calculated from the volume of water sampled. For sample blanks, we placed wide-mouth glass bottles containing 100 mL of ultrapure water in each of the workspaces for 30 min.
2.4 Conversion of MP concentrations to numbers of MP particles and their mass per unit area
Surface concentrations of MPs can vary depending on the degree of vertical mixing from oceanic turbulence. Therefore, to compare the number of MPs between different stations, we calculated the total number of MPs in the entire water column, independent of vertical mixing. We used the following equation (Isobe et al., 2019) to convert surface MP concentrations into the total number of MPs in the water column (particle inventory; pieces km–2).
where M (pieces km−2) is the particle inventory of MPs described above, N0 (pieces m−3) is the surface MP concentration determined from the neuston-net sample, u* represents the friction velocity of water (0.0012W10), W10 (m s−1) is the wind speed at 10 m above the sea surface (Kukulka et al., 2012), k is the von Karman coefficient (0.4), Hs (m) is the significant wave height, and w is the terminal rise velocity of plastics (5.3 mm s−1; Reisser et al., 2015). Note that this calculation excludes mesoplastics larger than 5 mm. For W10 and Hs, we used the average of the values measured at each station at the time of the survey. Particle inventories were converted to mass inventories (i.e., total MP mass per unit area, g km−2) by using the Level-2w1 calculation method of Isobe et al. (2021).
2.5 Environmental data
To investigate the relationship between MPs and sea-ice meltwater and riverine water, those water fractions were estimated using chemical variables. Partial pressures of CO2 (pCO2), total dissolved inorganic carbon (TCO2), temperature, and salinity were continuously measured in surface seawater at a depth of 4.5 m along the cruise track by CO2- and TCO2-measuring systems (Nihon ANS, Inc., Tokyo, Japan) and a continuous sea-surface water monitoring system aboard the R/V Mirai. An off-axis, integrated-cavity, output spectroscopy gas analyzer (Off-Axis ICOS; 911-0011, Los Gatos Research, Mountain View, CA, USA) was used for pCO2 measurement; a coulometer was used as the detector for TCO2; temperature and salinity were measured using a thermosalinograph (SBE-45; Sea-Bird Electronics, Inc., Bellevue, WA, USA). Details of these measurements are described by Murata et al. (2022).
Seawater was collected by using a pump placed 4.5 m below the sea surface. Total alkalinity was then calculated from pCO2, TCO2, temperature, and salinity (Murata et al., 2022). The fractions of sea-ice meltwater and other freshwaters (consisting of precipitation, riverine water, and freshwater carried by Pacific-origin water) in surface seawater at a depth of 4.5 m during the sampling period were calculated from salinity and total alkalinity as described by Yamamoto-Kawai et al. (2005). The southern Beaufort Sea is likely influenced by the water originated in the Chukchi Sea, where North American rivers characterize the endmember values of freshwater other than the sea-ice meltwater (Nishino et al., 2016). Thus, we used their endmember values as the optimal values for endmembers in the southern Beaufort Sea. For Stns. 18 and 19 at the mouth of the Mackenzie River with salinity<20, however, end-member values of 1900 mmol kg–1 (Telang et al., 1991) were used for the total alkalinity of the other freshwaters. The salinity and total alkalinity values used in the calculations were those at the time of neuston-net sampling for each station; however, if the corresponding measurements did not exist, we used the measurements from the location and time as close as possible to those of the neuston-net sampling.
Level-3 standard sea-ice cover data were obtained from the Japan Aerospace Exploration Agency (web portal: https://gportal.jaxa.jp/gpr/) at 10-km resolution. Both ascending and descending daily passes were composited during the field sampling period of 30 August–10 September 2022 (Figure 2).
3 Results
3.1 Particle and mass inventory
A total of 58 micro- and mesoplastic particles (56 microplastic particles, 2 mesoplastic particles) were identified in the neuston-net tow samples (Table S1). The particle and mass concentrations of micro- and mesoplastic particles in the surface water are shown in Note S2, Table S1, and Figure S1. All plastic particles detected in the blank samples were textile microfibers and therefore did not affect the results of this study.
The particle and mass inventories of MPs in the entire water column at each station are shown in Table 1. The distribution of the particle and mass inventories of MPs is shown in Figure 3 The particle inventory of MPs during the sampling period ranged from 937 to 28,081 pieces km−2 (mean ± standard deviation, 7570 ± 7600 pieces km−2). The particle inventory of MPs exceeded 6500 pieces km−2 at Stns. 24, 26, and 27 off Utqiaġvik and at Stns. 18 and 19 off the mouth of the Mackenzie River. Of these, Stn. 24 had the highest particle inventory at 28,081 pieces km−2, followed by Stn. 27 at 11,333 pieces km−2. The mass inventory of MPs ranged from 22 to 664 g km−2 (179 ± 180 g km−2). The mass inventory of MPs exceeded 150 g km−2 at Stns. 24, 26, and 27 off Utqiaġvik and at Stns. 18 and 19 off the mouth of the Mackenzie River. Of these, Stn. 24 had the highest mass inventory at 664 g km−2, followed by Stn. 27 at 268 g km−2.
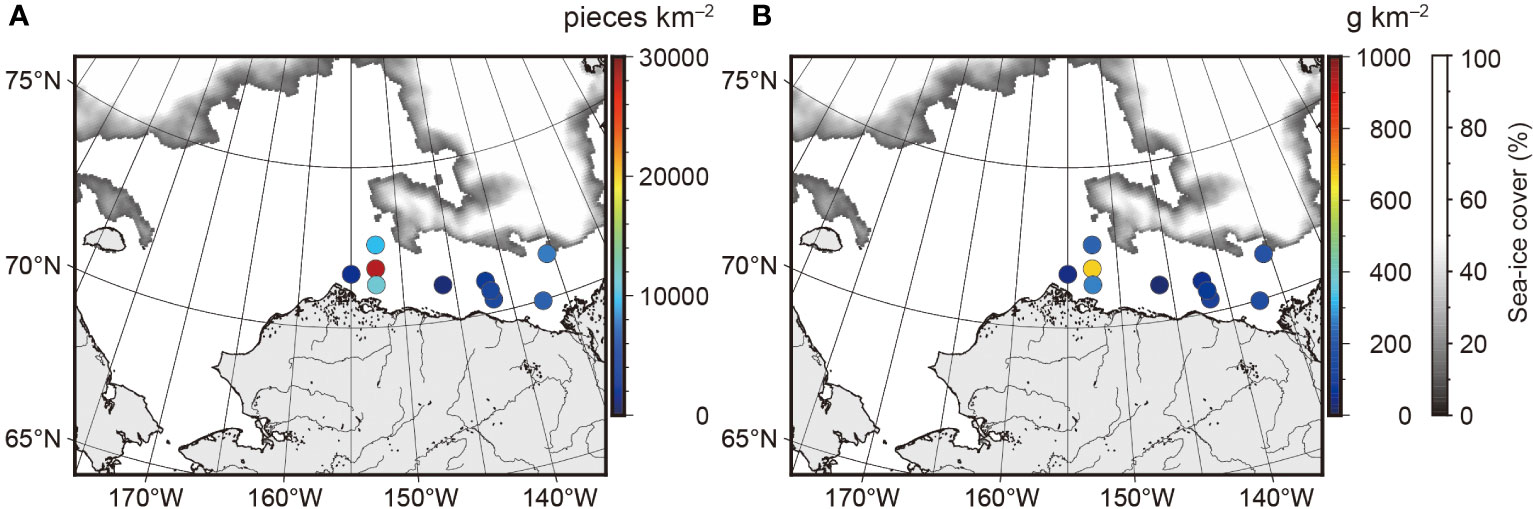
Figure 3 Microplastic inventory at sampling stations in the southern Beaufort Sea. (A) Particle inventories; (B), mass inventories.
3.2 Particle shape, polymer type, and size
Micro- and mesoplastic particles were classified into two shapes: fragment and line. Fragments were the most common (96.6%) (Table S2 and Figure 4A). Among all micro- and mesoplastic particles, 10 polymer types were observed (Table S2 and Figure 4B). Polydimethylsiloxane (PDMS) was the most common (36.2%), followed by polyethylene (PE, 27.6%), polyurethane (13.8%), and polyethylene terephthalate (PET, 8.6%). Polyvinyl chloride and polyamide each accounted for 3.4%, and other polymers accounted for 6.9%. The mean particle size was 2.31 mm (standard deviation, 1.29 mm), with particles in the size range 0.5–1.0 mm being the most common (41.4%), followed by 1.0–2.0 mm (36.2%) (Table S2 and Figure S2). The number of mesoplastics accounted for 3.4% of the total.
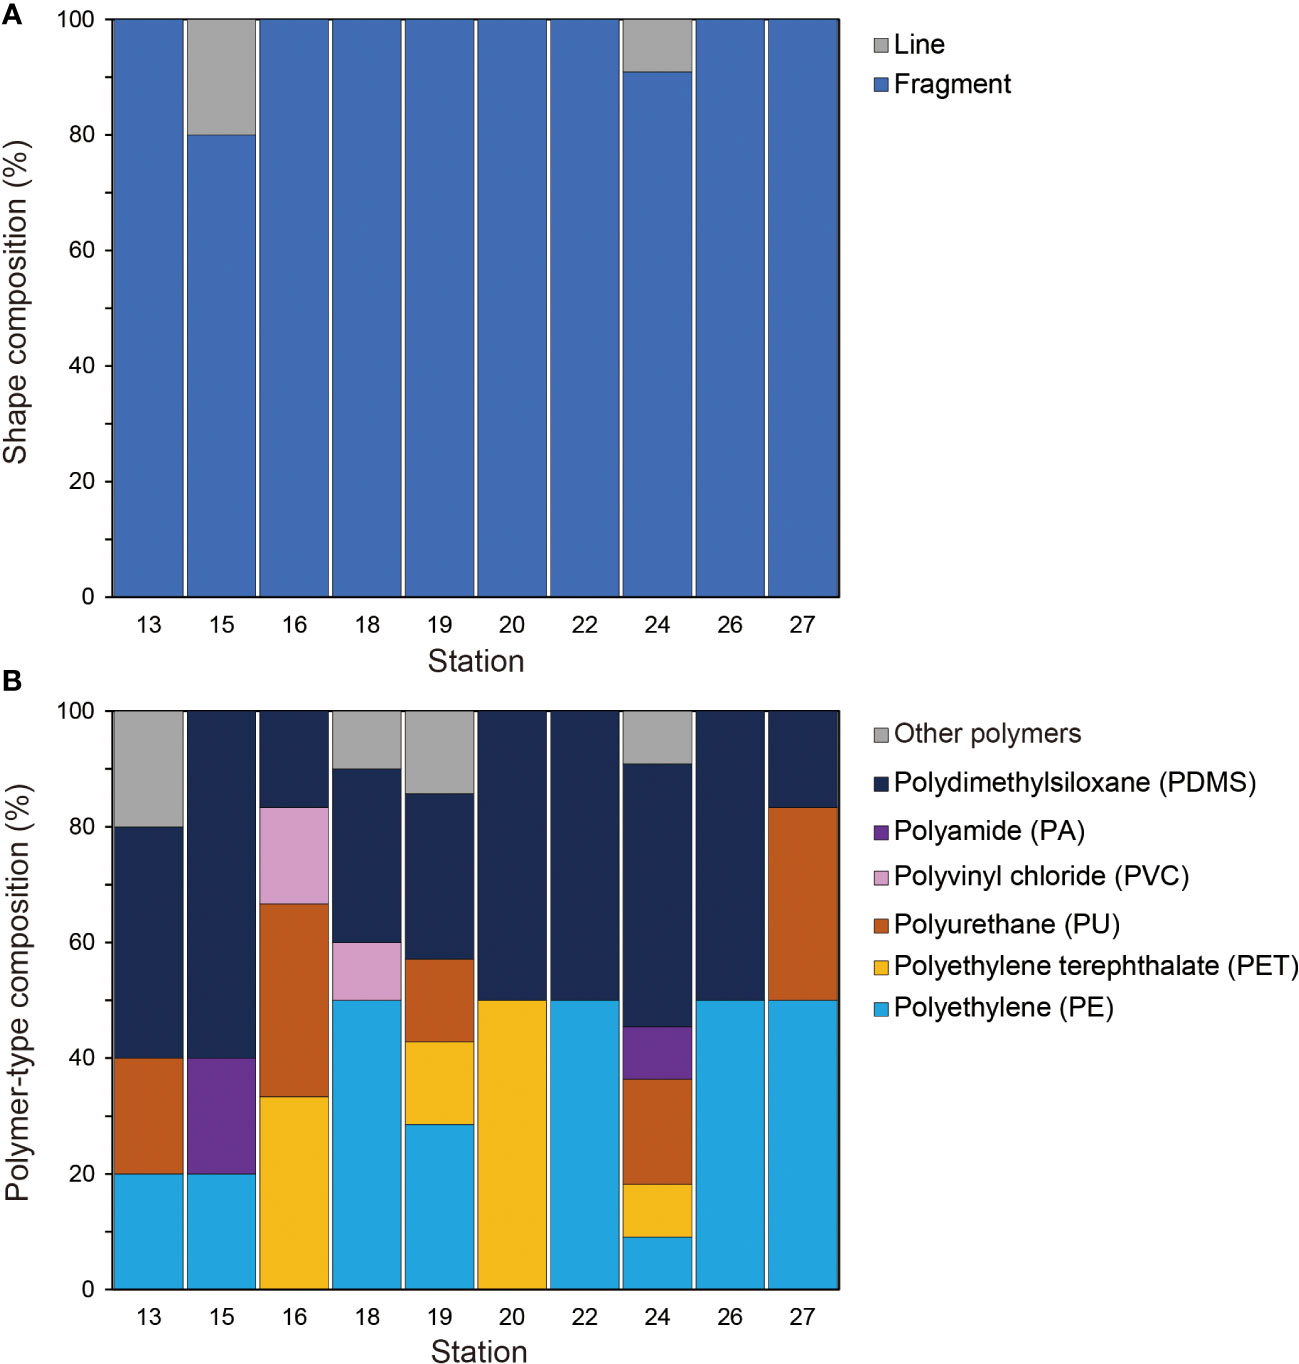
Figure 4 Composition of micro- and mesoplastic particles in the southern Beaufort Sea by (A) shape and (B) polymer type.
3.3 Freshwater fraction
The pCO2, TCO2, temperature, salinity, total alkalinity, and estimated freshwater fractions at each station are shown in Table S3. The distribution of freshwater fractions at each station is shown in Figure 5. During the sampling period, the sea-ice meltwater fraction ranged from 5.9% to 16.8% (10.5% ± 3.5%). The higher sea-ice meltwater fractions, with values above 10%, were observed toward the Canada Basin, with the highest values at Stns. 18 (14.4%) and 26 (16.8%), near the sea ice. Excluding sea-ice meltwater, other freshwater fractions ranged from 9.8% to 36.2% (18.2% ± 3.5%). The other freshwater fractions were ≤11% at the four western stations near Utqiaġvik, but they exceeded 15% at all stations farther east. Among these, Stns. 18–20, near the mouth of the Mackenzie River, were particularly high, with values greater than 23%; a maximum value of 36.2% was observed at Stn. 19.
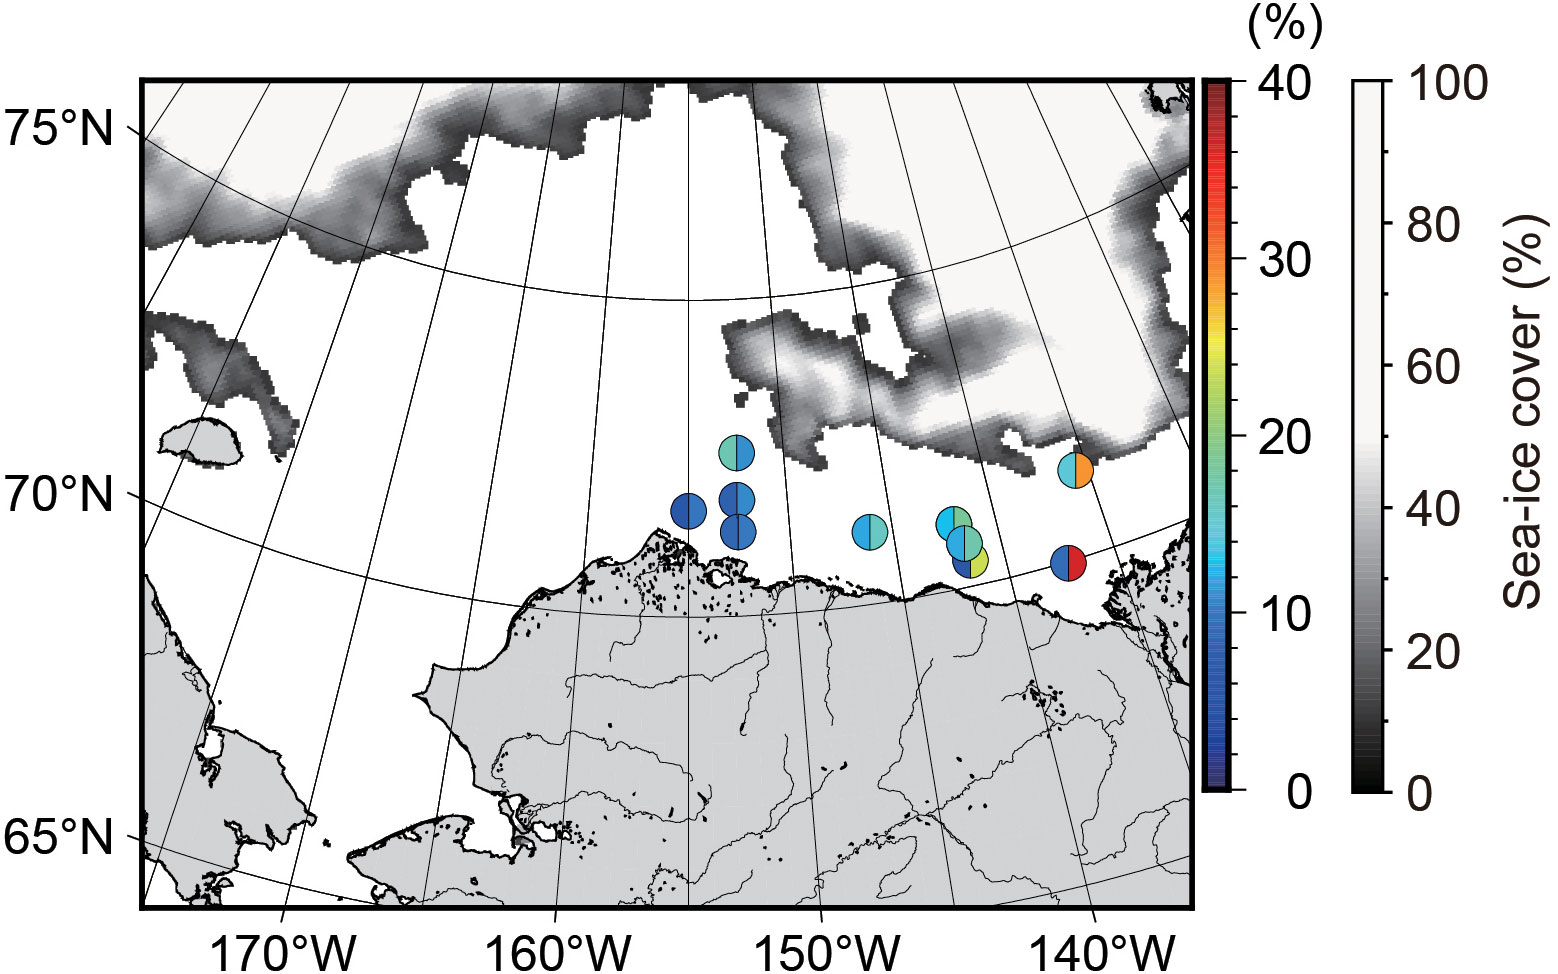
Figure 5 Freshwater fractions at sampling stations in the surface waters of the southern Beaufort Sea during the sampling period from 30 August to 10 September 2022. The color on the left side of each circle represents the fraction of sea-ice meltwater, and that on the right side represents the fraction of other freshwater.
4 Discussion
4.1 Horizontal distribution of microplastic inventory in the southern Beaufort Sea
The mean particle inventory of MPs in the southern Beaufort Sea in this study was 7570 particles km−2, suggesting that waters in the southern Beaufort Sea is polluted with microplastics at the same order of magnitude as the Chukchi Sea (5236 particles km−2; Ikenoue et al., 2023) (Table 2). The mean sea-ice meltwater fraction in the surface waters of the Beaufort Sea was 10.5% (Table S3, Figure 5), which is higher than that of the Chukchi Sea (6.8%) during summer (Ikenoue et al., 2023), reflecting the geographical proximity of the stations in this study to the northern sea-ice area. However, there was no correlation (r = −0.11) between the MP particle inventory and the sea-ice meltwater fraction, which was due to differences in the diffusion rates of sea-ice meltwater and microplastics. The mean value for the other freshwater fractions, excluding meltwater, was 18.2%, and even excluding Stns. 18–20 near the Mackenzie River, was 13.3% (Table S3, Figure 5). These values are higher than the mean (3.3%) of the other freshwater fractions in the Chukchi Sea (Ikenoue et al., 2023), indicating that the freshwater fractions of the surface waters of the study region were more influenced by the river waters of Northern Alaska and Northern Canada than those of the Chukchi Sea. However, there was no correlation between the MP inventory and other freshwater fractions (r = −0.25). This is probably because river water does not necessarily contain MPs when rivers are far from populated areas. Utqiaġvik and Inuvik are cities with populations of more than 2000, and Inuvik is adjacent to the Mackenzie River. Therefore, the relatively high MP particle inventory (>6500 pieces km−2) observed offshore around Utqiaġvik and at the mouth of the Mackenzie River may reflect the local origin of MPs from Utqiaġvik and Inuvik. However, at this stage it is not possible to conclude whether this distribution is due to the retention of Pacific-origin MPs in a particular area or to the effect of local MP additions.
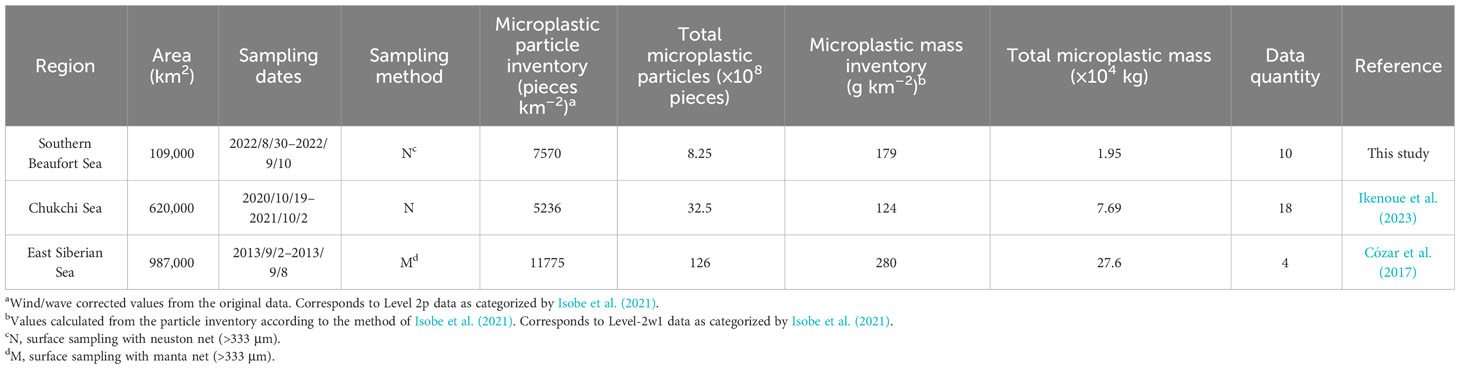
Table 2 Summary of microplastic particle numbers and masses in seawater on the Pacific side of the Arctic Ocean.
4.2 Characteristics of plastic particles in the southern Beaufort Sea
Micro- and mesoplastic particles in the southern Beaufort Sea were mostly fragments (96.6%), and the size distribution of MPs showed a frequency peak around 1 mm (Table S2, Figures 4 and S2). This trend is similar to previously reported size distributions of MPs in East Asia, the Southern Ocean, and the Chukchi Sea (Isobe et al., 2015; Isobe et al., 2017; Mu et al., 2019; Ikenoue et al., 2023). Mesoplastics, on the other hand, are frequently observed in East Asian waters (Isobe et al., 2017), but their occurrence in the Chukchi Sea and Southern Ocean is rare (Isobe et al., 2015; Ikenoue et al., 2023). The occurrence of mesoplastics was also rare in the southern Beaufort Sea, accounting for 3.4% of all micro- and mesoplastic particles (Figure S2). Plastic particles in the southern Beaufort Sea were more fine-grained than those in the Chukchi Sea, with 84.5% of particles less than 2 mm in size, compared with 65.1% in the Chukchi Sea (Ikenoue et al., 2023) (Figure S2). This suggests that MP particles in the southern Beaufort Sea were transported with more physical and chemical degradation than those in the Chukchi Sea. In addition, the coast of the Beaufort Sea has more cities and rivers than that of the Chukchi Sea. Therefore, these fine-grained MPs may include not only MPs of Pacific origin, but also MPs transported long distances from lower latitudes via rivers, and MPs weathered on the coast by the cold Arctic climate.
There is a major difference between the polymer type of plastic particles in the southern Beaufort Sea in this study and those in the Chukchi Sea described by Ikenoue et al. (2023) in the proportions of PDMS [described as “silicone resin” by Ikenoue et al. (2023)] and PP in the total plastic particles. In the Chukchi Sea, PDMS was minor and observed at only two stations, whereas PP accounted for 18.6% of the total polymers (Ikenoue et al., 2023). In the southern Beaufort Sea, on the other hand, PDMS was observed at all stations (accounting for 36.2% of total polymers on average), and PP was not observed at all. The samples in this study were collected in the same manner as in the study of Ikenoue et al. (2023), using the same research vessel and neuston net, which was cleaned before each observation. It is therefore unlikely that the PDMS in the samples in this study originated from contamination during the observations. The density of PDMS is 0.98 g cm−3, which is less than that of seawater (Osswald, 2006), so it can remain in the ocean surface layer. Although there are few reports of PDMS in the ocean, in the Arctic Ocean, PDMS reportedly accounts for 2% of all plastic particles at a depth of 3 m in the Barents Sea (Pakhomova et al., 2022). In the North Atlantic, PDMS also reportedly occurs in aerosol samples collected over pelagic waters (Trainic et al., 2020). No trend of increased PDMS at stations near cities or estuaries was observed in this study. Therefore, the appearance of PDMS in this study could reflect contributions from industrial activities and fisheries in the Beaufort Sea, or the presence of PDMS sources over a wide coastal area. The lack of observed PP may also be due to compositional changes caused by the sinking of plastic particles during transport from the Chukchi Sea to the Beaufort Sea.
4.3 Missing microplastics
The southern Beaufort Sea (Alaskan and Mackenzie shelves) has an area of 109,000 km2 (Macdonald et al., 2004). Therefore, the total number of MPs in the southern Beaufort Sea, calculated from the average MP particle inventory, is about 0.825 billion pieces (19,500 kg). The estimated total amount of MPs in the seawater of the Pacific side of the Arctic Ocean is 16.7 billion pieces (Table 2), but this does not account for the 18 billion MP particles that enter the Chukchi Sea from the Pacific each year through the Bering Strait (Ikenoue et al., 2023). Because microplastics suspended in the ocean surface layer settle to the seafloor after one to three years in the open ocean (Okubo et al., 2023), some of the missing MPs that passed through the Bering Strait would have accumulated on the seafloor in the downstream region of Pacific-origin waters.
Sea ice is another candidate for substantial MP accumulation because it incorporates MPs from the surrounding water during its formation. The northern sea-ice areas of the Chukchi and Beaufort Seas (Chukchi Borderland and Canada Basin) are downstream regions of Pacific-origin water (Watanabe et al., 2022). Because the Beaufort Sea is covered by sea ice during non-summer months, MPs might accumulate in the sea ice in this area, as sea-ice production exceeds sea-ice melting. After passing through Barrow Canyon, 0.50 ± 0.07 Sverdrups (1 Sv = 106 m3 s−1) (mean ± standard deviation) of Pacific-origin water is transported westward as the Chukchi slope current (Corlett and Pickart, 2017), and 0.13 ± 0.08 Sverdrups is transported eastward as the Beaufort shelfbreak jet (Nikolopoulos et al., 2009). The annual mean transport through the Bering Strait is 0.8 Sverdrups (Woodgate et al., 2005), so 63% of Pacific-origin water is transported westward and 16% eastward to the Beaufort Sea. Therefore, assuming that MPs suspended in the surface layer follow the same pattern as Pacific-origin water, 11.3 billion of the Pacific-origin MPs are transported toward the Chukchi Borderland each year, and 2.9 billion are transported to the Beaufort Sea each year, and the remaining 3.8 billion are transported to the East Siberian Sea each year.
The total number of MPs in the southern Beaufort Sea water estimated in this study was 0.825 billion, of which 36.2% composed of PDMS may be not of Pacific origin but rather of Arctic origin. Therefore, most of the Pacific-origin MPs transported to the Beaufort Sea would accumulate annually in sea ice and in seafloor sediments in the Beaufort Sea, or farther downstream. In addition, Leng et al. (2021) have suggested that the portion of the Chukchi slope current flowing along the deeper isobaths is redirected northward and eventually transports the materials into the Beaufort Gyre, whereas the portion flowing along the upper shelf slope may reach the East Siberian Sea. Furthermore, organic-matter transport by oceanic eddies to the Northwind Abyssal Plain has increased about twofold since the 1990s due to sea-ice reduction (Watanabe et al., 2014). These observations suggest that the majority of Pacific-origin MPs may be accumulating in the northern sea ice and on the seafloor under sea ice. In fact, high concentrations of microplastics have been observed in seawater in the northern Chukchi Sea, far from land (Ikenoue et al., 2023). In Fram Strait, high concentrations of MPs have been observed in the ice algae Melosira arctica, suggesting that this species takes up MPs from melting ice and ambient seawater and transports them to the deep seafloor as they settle (Bergmann et al., 2023). Because this species also occurs in the Pacific side of the Arctic Ocean (Ambrose et al., 2005; Poulin et al., 2014; Katlein et al., 2015), the same phenomenon may already be occurring in the Pacific side of the Arctic Ocean.
5 Conclusions
We estimated the total number and mass of MPs in the water column in the southern Beaufort Sea. The inventory of MPs in the southern Beaufort Sea suggests that this area is polluted with microplastics to the same order of magnitude as the Chukchi Sea. The distribution of MPs in the southern Beaufort Sea and the polymer-type composition of micro- and mesoplastic particles suggest that some plastic particles originate not only from Pacific-origin water but also from local industrial activities and fisheries in the Arctic. However, future studies on inflows of all polymer types, including PDMS from industries, fisheries, cities, and rivers, are needed to reveal the details of the MP contribution from the Arctic. The MP content in seawater on the Pacific side of the Arctic Ocean, estimated from current data to be 16.7 billion pieces, does not at all explain the fate of the 18 billion MPs per year entering from the Pacific Ocean through the Bering Strait. Most of the missing MPs would have reached the northern sea-ice areas of the Chukchi and Beaufort Seas with Pacific-origin water or settled during transport and accumulated on the seafloor. Therefore, to clarify the full extent of MP circulation on the Pacific side of the Arctic Ocean, it is important to investigate the total number and mass of MPs in sea ice and in seafloor sediments in the sea-ice areas, and the sedimentation process from the sea surface to the seafloor.
Data availability statement
The original contributions presented in the study are included in the article/Supplementary Material. Further inquiries can be directed to the corresponding author.
Author contributions
TI: Conceptualization, Data curation, Formal Analysis, Funding acquisition, Investigation, Methodology, Validation, Visualization, Writing – original draft, Writing – review & editing, Project administration. RN: Conceptualization, Project administration, Supervision, Writing – review & editing. PM: Project administration, Writing – review & editing. EVR: Project administration, Writing – review & editing. AF: Visualization, Writing – review & editing. SN: Writing – review & editing. AM: Writing – review & editing, Data curation. EW: Funding acquisition, Writing – review & editing. MI: Project administration, Writing – review & editing.
Funding
The authors declare financial support was received for the research, authorship, and/or publication of this article. This study is a contribution of the JAMSTEC–India joint project “Microplastic contamination in water and sediments of the Arctic Ocean: Abundance, Distribution, Type and Polymer Profile of Microplastics”. This study was supported by Grants-in-Aid for Scientific Research from the Japan Society for the Promotion of Science (JSPS, grant number 23K11414) to TI, and by the Arctic Challenge for Sustainability II (ArCS II, grant number JPMXD1420318865) funded by the Ministry of Education, Culture, Sports, Science and Technology, Japan.
Acknowledgments
We are grateful to the captain, officers, and crews of the R/V Mirai for their technical help onboard. We also thank Koto Sugimoto of Kobe University for her assistance during the neuston-net sampling.
Conflict of interest
The authors declare that the research was conducted in the absence of any commercial or financial relationships that could be construed as a potential conflict of interest.
Publisher’s note
All claims expressed in this article are solely those of the authors and do not necessarily represent those of their affiliated organizations, or those of the publisher, the editors and the reviewers. Any product that may be evaluated in this article, or claim that may be made by its manufacturer, is not guaranteed or endorsed by the publisher.
Supplementary material
The Supplementary Material for this article can be found online at: https://www.frontiersin.org/articles/10.3389/fmars.2023.1288301/full#supplementary-material
References
Ambrose W. G., Quillfeldt C. V., Clough L. M., Tilney P. V., Tucker T. (2005). The sub-ice algal community in the Chukchi Sea: large- and small-scale patterns of abundance based on images from a remotely operated vehicle. Polar Biol. 28, 784–795. doi: 10.1007/s00300-005-0002-8
Au S. Y., Bruce T. F., Bridges W. C., Klaine S. J. (2015). Responses of Hyalella azteca to acute and chronic microplastic exposures. Environ. Toxicol. Chem. 34, 2564–2572. doi: 10.1002/etc.3093
Bergmann M., Allen S., Krumpen T., Allen D. (2023). High levels of microplastics in the Arctic Sea ice alga Melosira arctica, a vector to ice-associated and benthic food webs. Environ. Sci. Technol. 57, 6799–6807. doi: 10.1021/acs.est.2c08010
Bergmann M., Collard F., Fabres J., Gabrielsen G. W., Provencher J. F., Rochman C. M., et al. (2022). Plastic pollution in the Arctic. Nat. Rev. Earth Environ. 3, 323–337. doi: 10.1038/s43017-022-00279-8
Carmack E. C., McLaughlin F. A., Yamamoto-Kawai M., Itoh M., Shimada K., Krishfield R., et al. (2008). “Freshwater storage in the Northern Ocean and the special role of the Beaufort Gyre,” in Arctic–Subarctic Ocean Fluxes, Defining the Role of the Northern Seas in Climate. Eds. Dickson R. R., Meincke J., Phines P. (Dordrecht, Netherlands: Springer), 145–169. doi: 10.1007/978-1-4020-6774-7_8
Cooper L. W., McClelland J. W., Holmes R. M., Raymond P. A., Gibson J. J., Guay C. K., et al. (2008). Flow-weighted values of runoff tracers (δ18O, DOC, Ba, alkalinity) from the six largest Arctic rivers. Geophys. Res. Lett. 35, L18606. doi: 10.1029/2008GL035007
Corlett W. B., Pickart R. S. (2017). The Chukchi slope current. Prog. Oceanogr. 153, 50–65. doi: 10.1016/j.pocean.2017.04.005
Cózar A., Echevarria F., Gonzalez-Gordillo J. I., Irigoien X., Ubeda B., Hernandez-Leon S., et al. (2014). Plastic debris in the open ocean. Proc. Natl. Acad. Sci. U.S.A. 111, 10239–10244. doi: 10.1073/pnas.1314705111
Cózar A., Martí E., Duarte C. M., García-de-Lomas J., van Sebille E., Ballatore T. J., et al. (2017). The Arctic Ocean as a dead end for floating plastics in the North Atlantic branch of the thermohaline circulation. Sci. Adv. 3, e1600582. doi: 10.1126/sciadv.1600582
Elliot D. L., Holladay C. G., Barchet W. R., Foote H. P., Sandusky W. F. (1986). Wind energy resource atlas of the United States (Golden, Colorado: Solar Technical Information Program, Solar Energy Research Institute), 210 pp.
Eriksen M., Lebreton L. C. M., Carson H. S., Thiel M., Moore C. J., Borerro J. C., et al. (2014). Plastic pollution in the world’s oceans: more than 5 trillion plastic pieces weighing over 250,000 tons afloat at sea. PloS One 9, e111913. doi: 10.1371/journal.pone.0111913
Foekema E. M., De Gruijter C., Mergia M. T., van Franeker J. A., Murk A. J., Koelmans A. A. (2013). Plastic in North Sea fish. Environ. Sci. Technol. 47, 8818–S8824. doi: 10.1021/es400931b
Gong D., Pickart R. S. (2015). Summertime circulation in the eastern Chukchi Sea. Deep Sea Res. Part II Top. Stud. Oceanogr. 118, 18–31. doi: 10.1016/j.dsr2.2015.02.006
Hurley R. R., Lusher A. L., Olsen M., Nizzetto L. (2018). Validation of a method for extracting microplastics from complex, organic-rich, environmental matrices. Environ. Sci. Technol. 52, 7409–7417. doi: 10.1021/acs.est.8b01517
Ikenoue T., Nakajima R., Fujiwara A., Onodera J., Itoh M., Toyoshima J., et al. (2023). Horizontal distribution of surface microplastic concentrations and water-column microplastic inventories in the Chukchi Sea, western Arctic Ocean. Sci. Total Environ. 855, 159564. doi: 10.1016/j.scitotenv.2022.159564
Ikenoue T., Yamada M., Ishii N., Kudo N., Shirotani Y., Ishida Y., et al. (2022). Cesium-137 and 137Cs/133Cs atom ratios in marine zooplankton off the east coast of Japan during 2012–2020 following the Fukushima Dai-ichi nuclear power plant accident. Environ. pollut. 311, 119962. doi: 10.1016/j.envpol.2022.119962
Isobe A., Azuma T., Cordova M. R., Cózar A., Galgani F., Hagita R., et al. (2021). A multilevel dataset of microplastic abundance in the world’s upper ocean and the laurentian Great Lakes. Micropl. Nanopl. 1, 16. doi: 10.1186/s43591-021-00013-z
Isobe A., Iwasaki S. (2022). The fate of missing ocean plastics: Are they just a marine environmental problem? Sci. Total Environ. 825, 153935. doi: 10.1016/j.scitotenv.2022.153935
Isobe A., Iwasaki S., Uchida K., Tokai T. (2019). Abundance of non-conservative microplastics in the upper ocean from 1957 to 2066. Nat. Commun. 10, 1–13. doi: 10.1038/s41467-019-08316-9
Isobe A., Uchida K., Tokai T., Iwasaki S. (2015). East asian seas: a hot spot of pelagic microplastics. Mar. pollut. Bull. 101, 618–623. doi: 10.1016/j.marpolbul.2015.10.042
Isobe A., Uchiyama-Matsumoto K., Uchida K., Tokai T. (2017). Microplastics in the Southern Ocean. Mar. pollut. Bull. 114, 623–626. doi: 10.1016/j.marpolbul.2016.09.037
Itoh M., Nishino S., Kawaguchi Y., Kikuchi T. (2013). Barrow Canyon volume, heat, and freshwater fluxes revealed by long-term mooring observations between 2000 and 2008. J. Geophys. Res. Oceans 118, 4363–4379. doi: 10.1002/jgrc.20290
Itoh M., Pickart R. S., Kikuchi T., Fukamachi Y., Ohshima K. I., Simizu D., et al. (2015). Water properties, heat and volume fluxes of Pacific water in Barrow Canyon during summer 2010. Deep Sea Res. Part II Top. Stud. Oceanogr. 102, 43–54. doi: 10.1016/j.dsr.2015.04.004
Jeong C. B., Won E. J., Kang H. M., Lee M. C., Hwang D. S., Hwang U. K., et al. (2016). Microplastic size-dependent toxicity, oxidative stress induction, and p-JNK and p-p38 activation in the Monogonont rotifer (Brachionus koreanus). Environ. Sci. Technol. 50, 8849–8857. doi: 10.1021/acs.est.6b01441
Kadko D., Swart P. (2004). The source of the high heat and freshwater content of the upper ocean at the SHEBA site in the Beaufort Sea in 1997. J. Geophys. Res. 109, C01022. doi: 10.1029/2002JC001734
Katlein C., Fernández-Méndez M., Wenzhöfer F., Nicolaus M. (2015). Distribution of algal aggregates under summer sea ice in the Central Arctic. Polar Biol. 38, 719–731. doi: 10.1007/s00300-014-1634-3
Kim S. K., Lee H. J., Kim J. S., Kang S. H., Yang E. J., Cho K. H., et al. (2021). Importance of seasonal sea ice in the western Arctic ocean to the Arctic and global microplastic budgets. J. Hazard. Mater. 418, 125971. doi: 10.1016/j.jhazmat.2021.125971
Kukulka T., Proskurowski G., Morét-Ferguson S., Meyer D. W., Law K. L. (2012). The effect of wind mixing on the vertical distribution of buoyant plastic debris. Geophys. Res. Lett. 39, L07601. doi: 10.1029/2012GL051116
Lebreton L. C. M., van der Zwet J., Damsteeg J.-W., Slat B., Andrady A., Reisser J. (2017). River plastic emissions to the world’s oceans. Nat. Commun. 8, 15611. doi: 10.1038/ncomms15611
Leng H., Spall M. A., Pickart R. S., Lin P., Bai X. (2021). Origin and fate of the Chukchi slope current using a numerical model and in-situ data. J. Geophys. Res. Oceans 126, e2021JC017291. doi: 10.1029/2021JC017291
Lin P., Pickart R. S., Moore G. W. K., Spall M. A., Hu J. (2019). Characteristics and dynamics of wind-driven upwelling in the Alaskan Beaufort Sea based on six years of mooring data. Deep Sea Res. Part II Top. Stud. Oceanogr. 162, 79–92. doi: 10.1016/j.dsr2.2018.01.002
Macdonald R. W., McLaughlin F. A., Carmack E. C. (2002). Fresh water and its sources during the SHEBA drift in the Canada Basin of the Arctic Ocean. Deep Sea Res. I: Oceanogr. Res. Pap. 49, 1769–1785. doi: 10.1016/S0967-0637(02)00097-3
Macdonald R. W., Naidu A. S., Yunker M. B., Gobeil C. (2004). The Beaufort Sea: distribution, sources, fluxes and burial of organic carbon. In: Stein R., MacDonald R. W. Stein, R., MacDonald, R.W. (Eds.), The Organic Carbon Cycle in the Arctic Ocean. (Berlin Heidelberg: Springer), 177–193. doi: 10.1007/978-3-642-18912-8
Mato Y., Isobe T., Takada H., Kanehiro H., Ohtake C., Kaminuma T. (2001). Plastic resin pellets as a transport medium for toxic chemicals in the marine environment. Environ. Sci. Technol. 35, 318–324. doi: 10.1021/es0010498
McPhee M. (2013). Intensification of geostrophic currents in the Canada Basin, Arctic Ocean. J. Climate 26, 3130–3138. doi: 10.1175/JCLI-D-12-00289.1
Michida Y., Chavanich S., Cózar C. A., Hagmann P., Hinata H., Isobe A., et al. (2019). Guidelines for harmonizing ocean surface microplastic monitoring methods. Version 1.1. (Chiyoda-ku, Tokyo, Japan: Ministry of the Environment Japan), 71 doi: 10.25607/OBP-867
Mishra A. K., Singh J., Mishra P. P. (2021). Microplastics in polar regions: an early warning to the world’s pristine ecosystem. Sci. Total Environ. 784, 147149. doi: 10.1016/j.scitotenv.2021.147149
Mu J., Zhang S., Qu L., Jin F., Fang C., Ma X., et al. (2019). Microplastics abundance and characteristics in surface waters from the Northwest Pacific, the Bering Sea, and the Chukchi Sea. Mar. pollut. Bull. 143, 58–65. doi: 10.1016/j.marpolbul.2019.04.023
Murata A., Inoue J., Nishino S., Yasunaka S. (2022). Early wintertime CO2 uptake in the western Arctic Ocean. J. Geophys. Res. Oceans 127, e2021JC018037. doi: 10.1029/2021JC018037
Nakajima R., Miyama T., Kitahashi T., Isobe N., Nagano Y., Ikuta T., et al. (2022). Plastic after an extreme storm: the typhoon-induced response of micro- and mesoplastics in coastal waters. Front. Mar. Sci. 8. doi: 10.3389/fmars.2021.806952
Nikolopoulos A., Pickart R. S., Fratantoni P. S., Shimada K., Torres D. J., Jones E. P. (2009). The western Arctic boundary current at 152°W: Structure, variability, and transport. Deep Sea Res. Part II Top. Stud. Oceanogr. 56, 1164–1181. doi: 10.1016/j.dsr2.2008.10.014
Nishino S., Kikuchi T., Fujiwara A., Hirawake T., Aoyama M. (2016). Water mass characteristics and their temporal changes in a biological hotspot in the southern Chukchi Sea. Biogeosciences 13, 2563–2578. doi: 10.5194/bg-13-2563-2016
Nishino S., Kikuchi T., Yamamoto-Kawai M., Kawaguchi Y., Hirawake T., Itoh M. (2011). Enhancement/reduction of biological pump depends on ocean circulation in the sea-ice reduction regions of the Arctic Ocean. J. Oceanogr. 67, 305–314. doi: 10.1007/s10872-011-0030-7
Okubo R., Yamamoto A., Kurima A., Sakabe T., Ide Y., Isobe A. (2023). Estimation of the age of polyethylene microplastics collected from oceans: Application to the western North Pacific Ocean. Mar. pollut. Bull. 192, 114951. doi: 10.1016/j.marpolbul.2023.114951
Osswald T. A. (2006). International Plastics Handbook: the Resource for Plastics Engineers (Ohio: Hanser Gardner Publications).
Pakhomova S., Berezina A., Lusher A. L., Zhdanov I., Silvestrova K., Zavialov P., et al. (2022). Microplastic variability in subsurface water from the Arctic to Antarctica. Environ. pollut. 298, 118808. doi: 10.1016/j.envpol.2022.118808
Paquette R. G., Bourke R. H. (1979). Temperature fine structure near the sea-ice margin of the Chukchi Sea. J. Geophys. Res. Oceans 84, 1155–1164. doi: 10.1029/jc084ic03p01155
Peeken I., Primpke S., Beyer B., Gütermann J., Katlein C., Krumpen T., et al. (2018). Arctic sea ice is an important temporal sink and means of transport for microplastic. Nat. Commun. 9, 1–12. doi: 10.1038/s41467-018-03825-5
Pickart R. S. (2004). Shelfbreak circulation in the Alaskan Beaufort Sea: Mean structure and variability. J. Geophys. Res. 109, C04024. doi: 10.1029/2003jc001912
Pickart R. S., Pratt L. J., Torres D. J., Whitledge T. E., Proshutinsky A. Y., Aagaard K., et al. (2010). Evolution and dynamics of the flowthrough Herald Canyon in the western Chukchi Sea. Deep Sea Res. Part II Top. Stud. Oceanogr. 57, 5–26. doi: 10.1016/j.dsr2.2009.08.002
Poulin M., Underwood G. J., Michel C. (2014). Sub-ice colonial Melosira arctica in Arctic first-year ice. Diatom. Res. 29, 213–221. doi: 10.1080/0269249X.2013.877085
Proshutinsky A., Bourke R. H., McLaughlin F. A. (2002). The role of the Beaufort Gyre in Arctic climate variability: seasonal to decadal climate scales. Geophys. Res. Lett. 29, 2100. doi: 10.1029/2002GL015847
Proshutinsky A., Krishfield R., Timmermans M. L., Toole J., Carmack E., McLaughlin F., et al. (2009). Beaufort Gyre freshwater reservoir: state and variability from observations. J. Geophys. Res. 114, C00A10. doi: 10.1029/2008JC005104
Rainville L., Lee C. M., Woodgate R. A. (2011). Impact of wind-driven mixing in the Arctic Ocean. Oceanography 24, 136–145. doi: 10.5670/oceanog.2011.65
Reisser J., Slat B., Noble K., Du Plessis K., Epp M., Proietti M., et al. (2015). The vertical distribution of buoyant plastics at sea: an observational study in the North Atlantic Gyre. Biogeosciences 12, 1249–1256. doi: 10.5194/bg-12-1249-2015
Ross P. S., Chastain S., Vassilenko E., Etemadifar A., Zimmermann S., Quesnel S. A., et al. (2021). Pervasive distribution of polyester fibres in the Arctic Ocean is driven by Atlantic inputs. Nat. Commun. 12, 106. doi: 10.1038/s41467-020-20347-1
Schmidt C., Krauth T., Wagner S. (2017). Export of plastic debris by rivers into the sea. Environ. Sci. Technol. 51, 12246–12253. doi: 10.1021/acs.est.7b02368
Telang S. A., Pocklington R., Naidu A. S., Romankevich E. A., Gitelson I. I., Gladyshev M. I. (1991). “Carbon and mineral transport in major North American, Russian, Arctic, and Siberian rivers: The St. Lawrence, the Mackenzie, the Yukon, the Arctic Alaskan rivers, the Arctic Basin rivers in the Soviet Union, and the Yenisey,” in Biogeochemistry of Major World Rivers. Eds. Degens E. T., Kempe S., Richey J. E. (Hoboken, N. J: John Wiley), 75–104.
Trainic M., Flores J. M., Pinkas I., Pedrotti M. L., Lombard F., Bourdin G., et al. (2020). Airborne microplastic particles detected in the remote marine atmosphere. Commun. Earth Environ. 1, 64. doi: 10.1038/s43247-020-00061-y
Watanabe E., Onodera J., Harada N., Honda M. C., Kimoto K., Kikuchi T., et al. (2014). Enhanced role of eddies in the Arctic marine biological pump. Nat. Commun. 5, 3950. doi: 10.1038/ncomms4950
Watanabe E., Onodera J., Itoh M., Mizobata K. (2022). Transport processes of seafloor sediment from the Chukchi shelf to the western Arctic basin. J. Geophys. Res. Oceans 127, e2021JC017958. doi: 10.1029/2021JC017958
Watanabe E., Onodera J., Itoh M., Nishino S., Kikuchi T. (2017). Winter transport of subsurface warm water toward the Arctic Chukchi Borderland. Deep Sea Res. I Oceanogr. Res. Pap. 128, pp115–pp130. doi: 10.1016/j.dsr.2017.08.009
Woodgate R. A., Aagaard K., Weingartner T. J. (2005). Monthly temperature, salinity, and transport variability of the Bering Strait through flow. Geophys. Res. Lett. 32, L04601. doi: 10.1029/2004GL021880
Yamamoto-Kawai M., McLaughlin F. A., Carmack E. C., Nishino S., Shimada K. (2008). Freshwater budget of the Canada Basin, Arctic Ocean, from salinity, 18O, and nutrients. J. Geophys. Res. 113, C01007. doi: 10.1029/2006JC003858
Yamamoto-Kawai M., Tanaka N., Pivovarov S. (2005). Freshwater and brine behaviors in the Arctic Ocean deduced from historical data of δ18O and alkalinity, (1929–2002 A.D.). J. Geophys. Res. 110, C10003. doi: 10.1029/2004JC002793
Yeo B. G., Takada H., Yamashita R., Okazaki Y., Uchida K., Tokai T., et al. (2020). PCBs and PBDEs in microplastic particles and zooplankton in open water in the Pacific Ocean and around the coast of Japan. Mar. pollut. Bull. 151, 110806. doi: 10.1016/j.marpolbul.2019.110806
Zhang K., Hamidian A. H., Tubić A., Zhang Y., Fang J. K., Wu C., et al. (2021). Understanding plastic degradation and microplastic formation in the environment: A review. Environ. pollut. 274, 116554. doi: 10.1016/j.envpol.2021.116554
Keywords: neuston net, particle inventory, mass inventory, microplastic inflows, wind/wave correction
Citation: Ikenoue T, Nakajima R, Mishra P, Ramasamy EV, Fujiwara A, Nishino S, Murata A, Watanabe E and Itoh M (2023) Floating microplastic inventories in the southern Beaufort Sea, Arctic Ocean. Front. Mar. Sci. 10:1288301. doi: 10.3389/fmars.2023.1288301
Received: 04 September 2023; Accepted: 29 September 2023;
Published: 12 October 2023.
Edited by:
Camilla Della Torre, University of Milan, ItalyReviewed by:
Giuseppe Suaria, National Research Council, ItalyMohamed Mohsen, Jimei University, China
Copyright © 2023 Ikenoue, Nakajima, Mishra, Ramasamy, Fujiwara, Nishino, Murata, Watanabe and Itoh. This is an open-access article distributed under the terms of the Creative Commons Attribution License (CC BY). The use, distribution or reproduction in other forums is permitted, provided the original author(s) and the copyright owner(s) are credited and that the original publication in this journal is cited, in accordance with accepted academic practice. No use, distribution or reproduction is permitted which does not comply with these terms.
*Correspondence: Takahito Ikenoue, aWtlbm91ZXRAamFtc3RlYy5nby5qcA==