Abstract
The available sea surface temperature (SST) products are too coarse to assess the fine-scale (<1 km) SST variations related to coral bleaching. In this study, we proposed an optimal SST inversion model using Landsat 8 thermal infrared sensor (TIRS) images to derive fine-scale SST patterns in the coral reef habitats of the Xisha Islands, South China Sea. Our study included two parts: 1) six SST inversion models were developed using the radiative transfer method and the split window (SW) algorithm in the hot season and cool season, from which the optimal SST inversion model was determined; and 2) the optimal model was applied to 47 Landsat 8 TIRS images to derive the SST spatial and temporal pattern among the geomorphic zones of six reefs in hot and cool season conditions. Compared with the measured sea temperature data and the verified MODIS SST products, the SST6 model using the SW algorithm was optimal, with an RMSE of approximately 0.64°C in the hot season. The average SST results usually had a pattern of reef flat > lagoon > reef slope/offshore sea. The reef flat was usually approximately 0.05°C–0.2°C hotter than the lagoon in the hot season. The SST in the lagoon also increased from south to north and the shallow lagoon was usually warmer than the deep lagoon in the hot season. Our results suggested that scleractinian corals in the reef flat and the lagoon were more susceptible to bleaching-level thermal stress than other geomorphic zones. During the cool season, the SST fluctuated markedly among coral reefs and geomorphic zones.
1 Introduction
Coral reef ecosystems have rich biodiversity and high productivity, but they are vulnerable to various environmental stressors induced by climate change (Bellwood et al., 2004). Abnormally high sea temperature is one of the most serious threats affecting coral reefs and it can lead to frequent large-scale coral bleaching and coral degradation in various regions of the world (Skirving et al., 2019; Eakin et al., 2022). The thermal stress indicators developed using sea surface temperature (SST) are often used in thermal stress intensity evaluation and coral bleaching alerts (Liu et al., 2014; Zuo et al., 2015; Qin et al., 2023). High-resolution SST data can identify more detailed spatial variations in thermal stress, which are essential for the conservation and management of coral reef ecosystems.
Remote sensing can obtain long-term, continuous, and large-scale SST data in comparison with field surveys. Hereher et al. (2021) explored the spatio-temporal relationship between the distribution of coral reefs in the Red Sea and SST using the 4 km MODIS SST product. Zhang et al. (2013) analyzed the spatial distribution trend of thermal stress in Coral Bay on Ningaloo Reef using the Global 1-km SST (G1SST) product and found that the SST in the inner lagoon was usually higher than that in the offshore sea, and the entire reef SST was higher under extreme weather conditions. Caballero-Aragon et al. (2023) used the 1 km SATcoral–SIMAR product developed on the basis of the Operational SST and Ice Analysis and Group for High Resolution SST data to investigate the spatial pattern of SST and thermal stress between shallow reefs and deep reefs in the Cuban archipelago. Van Wynsberge et al. (2020) used G1SST products to study differences in SST in the Raroia atoll lagoon and forereef and found that their SST variations in the cool season and warm season showed opposite trends. However, the above studies on SST variations related to coral reef areas mostly adopted kilometer-scale SST products. Research suggests that the occurrence and severity of coral bleaching has spatial heterogeneity at a finer scale (<1 km) (Safaie et al., 2018). Thus, the resolution of the present SST products is too coarse to study the fine-scale spatial variation of sea temperature in small coral reef areas.
High spatial resolution thermal infrared satellite data, such as HJ 1B TIRS, Landsat 7 ETM+, and Landsat 8 TIRS, with resolutions from 30 m to 300 m, can be used to derive high-resolution SST data(Lamaro et al., 2013; Pan et al., 2014; Simon et al., 2014; Jaelani and Alfatinah, 2017; Liu et al., 2020). The Landsat 8 TIRS products provide dual thermal infrared bands, which better meet the need for low-cost SST data with higher spatial resolution (30 m) in coral reef areas. At present, there are few studies on the use of SST data on the basis of Landsat 8 TIRS in coral reef habitats. Attamimi and Saraswati (2019) inverted the SST data for coral reefs in Bunaken National Park using Landsat 7 ETM+ and Landsat 8 TIRS images, but they did not further analyze the spatial pattern in SST. Rajput and Ramakrishnan (2021) found that SST in the lagoon had high heterogeneity and was different from that in the surrounding sea using inverted Landsat 8 TIRS data in the Lakshadweep Islands, but they did not further analyze the differences in SST patterns among geomorphic zones on coral reefs. Because coral cover and diversity have little difference within geomorphic zones but large differences between geomorphic zones (Zuo et al., 2017), fine-scale SST analysis according to local conditions is essential for the protection of coral reefs.
Comparison of the Landsat 8 TIRS retrieval methods for SST in different coastal areas (Xing et al., 2015; Jaelani and Alfatinah, 2017; Jang and Park, 2019; Liu et al., 2020) shows that the optimal SST retrieval methods have regional dependence. Among them, the radiation transfer equation method (RTM) and split window (SW) algorithm have higher accuracy in retrieving SST (Xing et al., 2015; Zhang et al., 2015; Jaelani and Alfatinah, 2017; Liu et al., 2020). For example, Zhang et al. (2015) concluded that the RTM model with an RMSE of less than 1°C was the most accurate, followed by the SW algorithm with an RMSE of approximately 3°C in the sea around Hongyanhe nuclear power station in China. Jaelani and Alfatinah (2017) concluded that the SW algorithm generally had higher accuracy than other models in all tested waters. Liu et al. (2020) also suggested that SW algorithm was better than the RTM for deriving SST in the Daya Bay area in China. Overall, the SST retrieval method of RTM has strong compatibility (Zhang et al., 2015; Jaelani and Alfatinah, 2017), but it is easily affected by the atmospheric environment. The widely-used SW algorithm requires few parameters and less computation, but its regional compatibility is poor (Xing et al., 2015; Zhang et al., 2015; Jaelani and Alfatinah, 2017; Jang and Park, 2019). The applicability and accuracy of RTM and SW methods using Landsat 8 TIRS images in coral reef habitats need further evaluation.
In this study, we took coral reefs in the Xisha Islands in the South China Sea (SCS) as the study area. Six SST inversion models were constructed on the basis of the RTM and SW approaches using 14 Landsat 8 TIRS satellite images. The models were built in the hot season (average SST >29°C) and cool season (average SST<26°C). The optimal SST inversion model was determined and further applied to 47 Landsat 8 TIRS images of six reefs. Our aims were to 1) obtain the optimal SST inversion model from Landsat 8 TIRS images with 30 m resolution for coral reefs, and 2) investigate the fine-scale spatial and temporal pattern of SST among geomorphic zones in coral reefs in the Xisha Islands. This study not only provides methodology for retrieval of high resolution SST satellite data for coral reef habitats, but also provides details of the SST spatial pattern for reef ecosystem conservation and management.
2 Materials and methods
2.1 Study area
The coral reefs of the Xisha Islands are located in the northwest of the SCS (Figure 1). There are more than 30 coral reefs, with 37–38 genera and 204 species of scleractinian corals (Morton and Blackmore, 2001). The Xisha Islands belong to the tropical marine climate system. The hot season is from May to September and the cool season is from November to the following April. The monthly mean SST is approximately 25–30°C (Zuo et al., 2015). The Xisha Islands are affected by a monsoon circulation, with northeast winds in the cool season and southwest winds in the hot season. The SST patterns among the geomorphic zones of six reefs—Bei Reef, Langhua Reef, Lingyang Reef, Panshi Islet, Qilian Islet and Yuzhuo Reef—in the Xisha Islands were investigated.
Figure 1
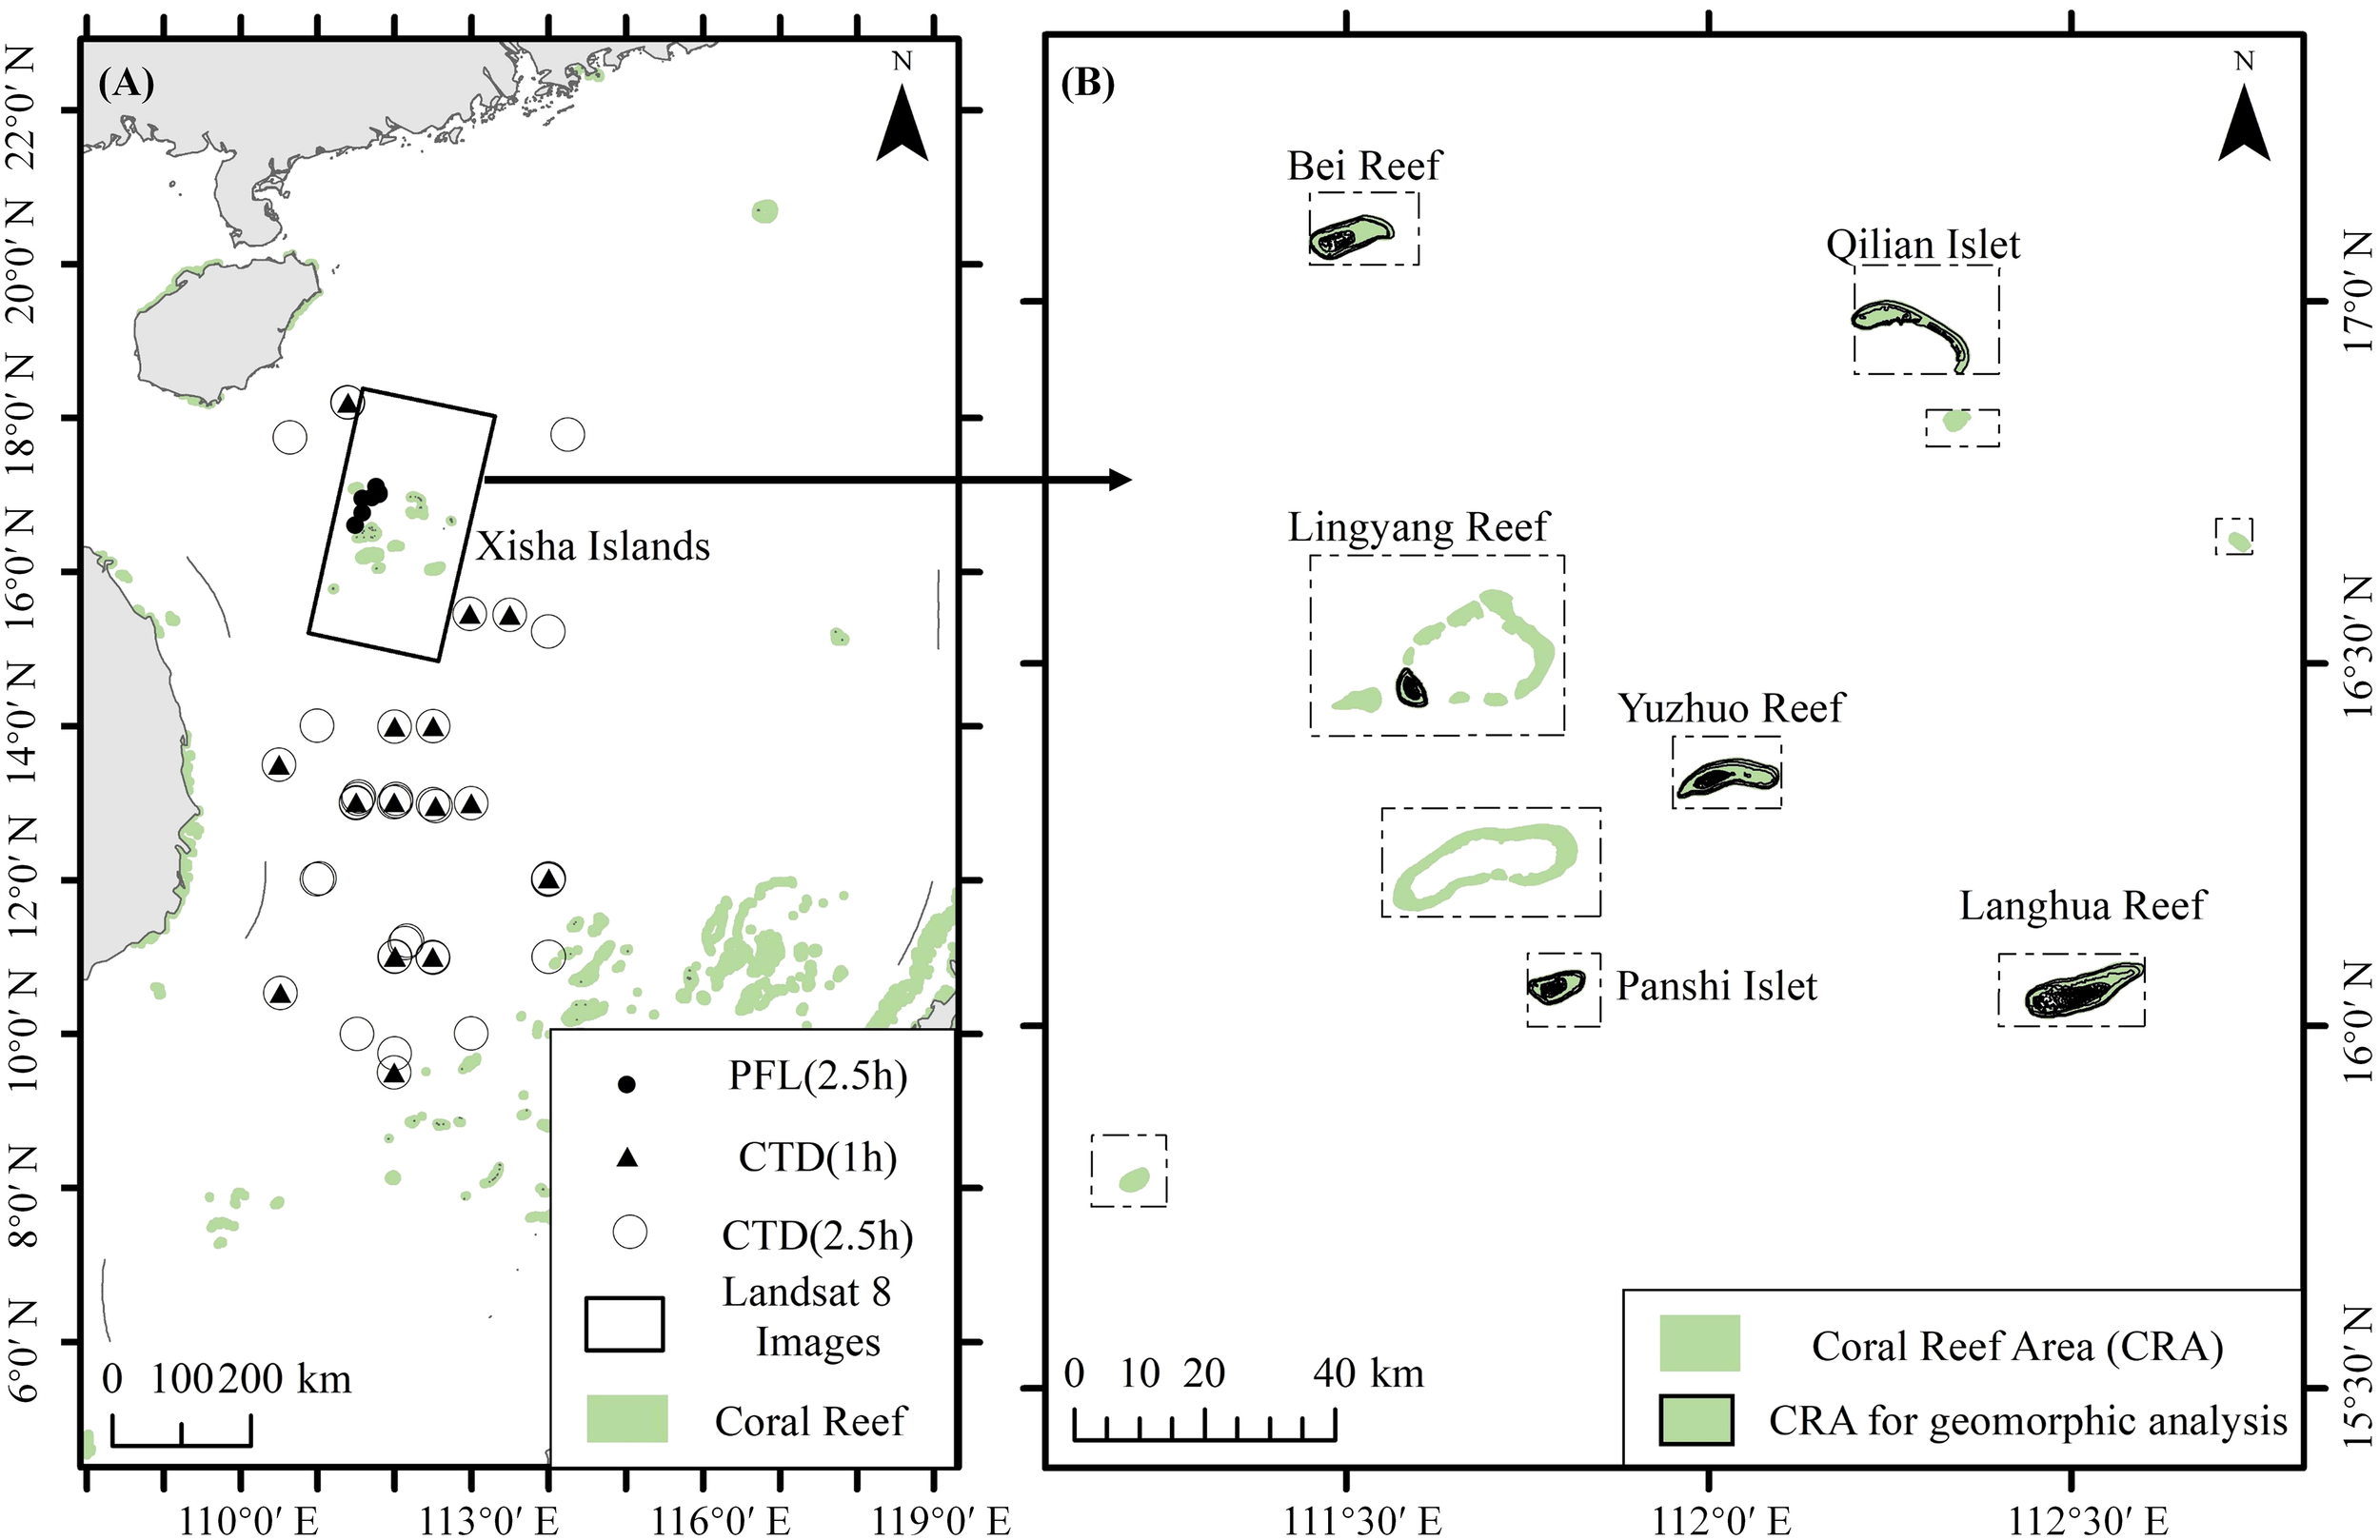
Study area of the Xisha Islands in the South China Sea and locations of field SST data: (A) ● is the field SST location of profiling float (PFL) data within 2.5 hours of Landsat 8 imaging time; ▲ indicates the field SST location of conductivity temperature depth (CTD) data within 1 hour of MODIS SST imaging time; ○ indicates the field SST location of CTD within 2.5 hours of MODIS SST imaging time; □ is the Landsat 8 satellite image area; (B) the coral reefs in the Xisha Islands, the dashed box indicates the validation reefs of SST inversion results by MODIS SST.
2.2 Dataset
2.2.1 Landsat 8 satellite TIRS data
The thermal infrared spectrum of Landsat 8 images are bands 10 and 11, ranging from 10.6 μm to 12.51 μm with 30 m spatial resolution. By observing the MODIS SST and the cloud cover, a total of 47 Landsat 8 images of Xisha Islands in 2014-2021 in the hot season(average SST>29°C) and in the cool season(average SST<26°C) were downloaded from the USGS EarthExplorer (http://earthexplorer.usgs.gov/). The local time of image acquisition was approximately 10:50 am. These images covered all the months except October, when high cloud coverage existed. Ten images were used as experimental data and four images were adopted as validation data (Table 1). A total of 47 Landsat 8 images (Table 2) were further used to study the SST pattern among coral reef geomorphic zones in the six coral reefs (Bei Reef, Langhua Reef, Lingyang Reef, Panshi Islet, Qilian Islet and Yuzhuo Reef) in the hot season and the cool season.
Table 1
| SST | Spatial Resolution(m) | Path/Row | Acquisition Date (Year-Month-Day) |
Acquisition Time (Local) |
Cloud(%) | Application |
|---|---|---|---|---|---|---|
| Hot | 30 | 122/048 | 2014-08-12 | 10:54 | 5.07 | Model |
| Hot | 30 | 122/049 | 2014-08-12 | 10:54 | 2.91 | Model |
| Hot | 30 | 122/048 | 2016-06-14 | 10:54 | 5.02 | Model |
| Hot | 30 | 122/049 | 2016-06-14 | 10:54 | 1.34 | Model |
| Cool | 30 | 122/048 | 2018-03-16 | 10:53 | 1.45 | Model |
| Cool | 30 | 122/049 | 2018-03-16 | 10:53 | 2.33 | Model |
| Cool | 30 | 122/048 | 2019-03-03 | 10:54 | 0.44 | Validation |
| Cool | 30 | 122/049 | 2019-03-03 | 10:54 | 4.76 | Validation |
| Hot | 30 | 122/048 | 2020-07-27 | 10:54 | 8.96 | Validation |
| Hot | 30 | 122/049 | 2020-07-27 | 10:54 | 1.25 | Validation |
| Hot | 30 | 122/048 | 2020-09-13 | 10:54 | 18.82 | Model |
| Hot | 30 | 122/049 | 2020-09-13 | 10:54 | 0.49 | Model |
| Hot | 30 | 122/048 | 2021-07-30 | 10:54 | 11.66 | Model |
| Hot | 30 | 122/049 | 2021-07-30 | 10:54 | 1.09 | Model |
Screened Landsat 8 satellite images.
Table 2
| Coral reef | Hot season | Cool season | ||
|---|---|---|---|---|
| Number of Images | Acquisition Date (Year-Month-Day) |
Number of Images |
Acquisition Date (Year-Month-Day) |
|
| North Reef | 10 | 2014-08-12、2014-09-13、2015-06-28、2016-07-16、2017-08-04、2018-06-20、2018-08-07、2020-07-27、2021-07-14、2021-07-30 | 13 | 2014-02-17、2014-03-21、2015-02-04、2016-01-06、2016-01-22、2018-03-16、2018-11-11、2019-03-03、2019-03-19、2020-01-17、2020-03-05、2020-03-21、2022-02-07、2022-03-27 |
| Langhua Reef | 4 | 2015-08-15、2017-08-04、2019-07-09、2021-07-14 | 13 | 2014-02-17、2016-01-22、2018-03-16、2019-01-30、2019-02-15、2019-03-03、2019-03-19、2020-03-21、2021-03-08、2022-01-22、2022-02-07 |
| Lingyang Reef | 15 | 2014-08-12、2014-09-13、2015-06-28、2015-08-15、2016-06-14、2017-08-04、2018-06-20、2019-05-22、2019-06-07、2019-07-09、2019-08-10、2020-07-27、2020-09-13、2021-07-14、2021-07-30 | 12 | 2015-02-04、2015-03-08、2016-01-22、2018-03-16、2018-10-10、2019-01-30、2019-03-03、2020-01-17、2020-03-05、2020-03-21、2021-03-08、2021-04-09 |
| Panshi Islet | 14 | 2014-08-12、2015-06-28、2015-08-15、2016-06-14、2017-08-04、2017-09-05、2018-05-03、2018-06-20、2019-05-22、2019-06-07、2020-07-27、2020-09-13、2021-05-11、2021-07-14 | 11 | 2015-02-04、2015-03-08、2018-03-16、2019-02-15、2019-03-03、2019-03-19、2019-11-14、2020-03-05、2021-03-08、2022-01-22、2022-02-07 |
| Qilian Islet | 8 | 2014-08-12、2015-08-15、2017-08-04、2018-06-20、2019-06-07、2019-08-10、2020-07-27、2020-09-13 | 12 | 2015-02-04、2015-03-08、2015-11-19、2016-04-11、2018-03-16、2019-01-30、2019-02-15、2019-03-03、2019-03-19、2020-01-17、2021-04-09、2022-03-27 |
| Yuzhuo Reef | 12 | 2014-08-12、2014-09-13、2015-05-11、2015-05-27、2015-06-28、2015-08-15、2017-08-04、2017-09-21、2018-06-20、2019-06-07、2021-07-14、2021-07-30 | 18 | 2015-02-04、2015-03-08、2016-01-22、2016-04-11、2017-12-26、2018-03-16、2018-11-11、2019-01-30、2019-03-03、2019-03-19、2019-11-14、2020-01-17、2020-03-05、2020-03-21、2021-03-08、2022-01-22、2022-02-07、2022-03-27 |
Landsat 8 TIRS images used for SST analysis of geomorphic zones in the six reefs.
2.2.2 MODIS SST
Because the coral reefs in the study area were far from the mainland, validated MODIS SST products were used to evaluate the accuracy of the Landsat SST inversion models owing to their verification by the long-term buoy data and ship reports (Liu et al., 2020). MODIS SST L3 level products were acquired from NASA Ocean Color (https://oceancolor.gsfc.nasa.gov/), with temporal resolution of 1 day and a spatial resolution of 4 km. Because the Terra satellite had no detection area within the study area, the Aqua MODIS SST products most synchronized with the acquisition time of Landsat 8 images were downloaded (Figure 1). The local imaging time of Aqua MODIS SST was approximately 13:30, which was a 2.5 h time difference compared with that of the Landsat 8 images.
2.2.3 World Ocean Database 2018 data
The World Ocean Database (WOD) is a uniformly formatted and quality controlled collection of ocean profile data, including conductivity temperature depth (CTD) data, profiling float (PFL) data and other datasets (Sun et al., 2022). The 2018 WOD data were acquired and extracted from the National Centers for Environmental Information (https://www.ncei.noaa.gov/products/world-ocean-database) as in situ SST data to verify the MODIS SST and Landsat inverted SST data. First, the CTD-measured SST profile data from August to October during 2014–2017 and at 1 m depth were selected. Secondly, the selected CTD data were further screened to be within a time difference of ±1 h and ±2.5 h of the MODIS SST acquisition time. Then, the PFL-measured SST profile data (Figure 1) within a time difference of 2.5 hours compared with the Landsat 8 image acquisition time and within a distance of 200 m were selected to verify the accuracy of the optimal Landsat 8 inversion model. A total of 38 CTD-collected SST data and 7 PFL SST data were finally adopted (Figure 1).
2.3 Methods
2.3.1 Workflow
The conceptual workflow for data processing and algorithms of the satellite derived SST is depicted in Figure 2. First, the screened Landsat 8 data were preprocessed, and then the MODIS SST data were verified by using the WOD data. The MODIS SST data were also cloud removed. The above data were used to construct models based on Radiation Transfer Equation Method and Split Window algorithm and inverted the SST in Landsat 8 TIRS images. The accuracy of SST data obtained by the inversion of the all models were analyzed, and the optimal inversion model was selected. Finally, the monthly SST distribution pattern of coral reefs and the distribution characteristics of SST among geomorphic zones were analyzed by using the SST data inverted by the optimal inversion model.
Figure 2
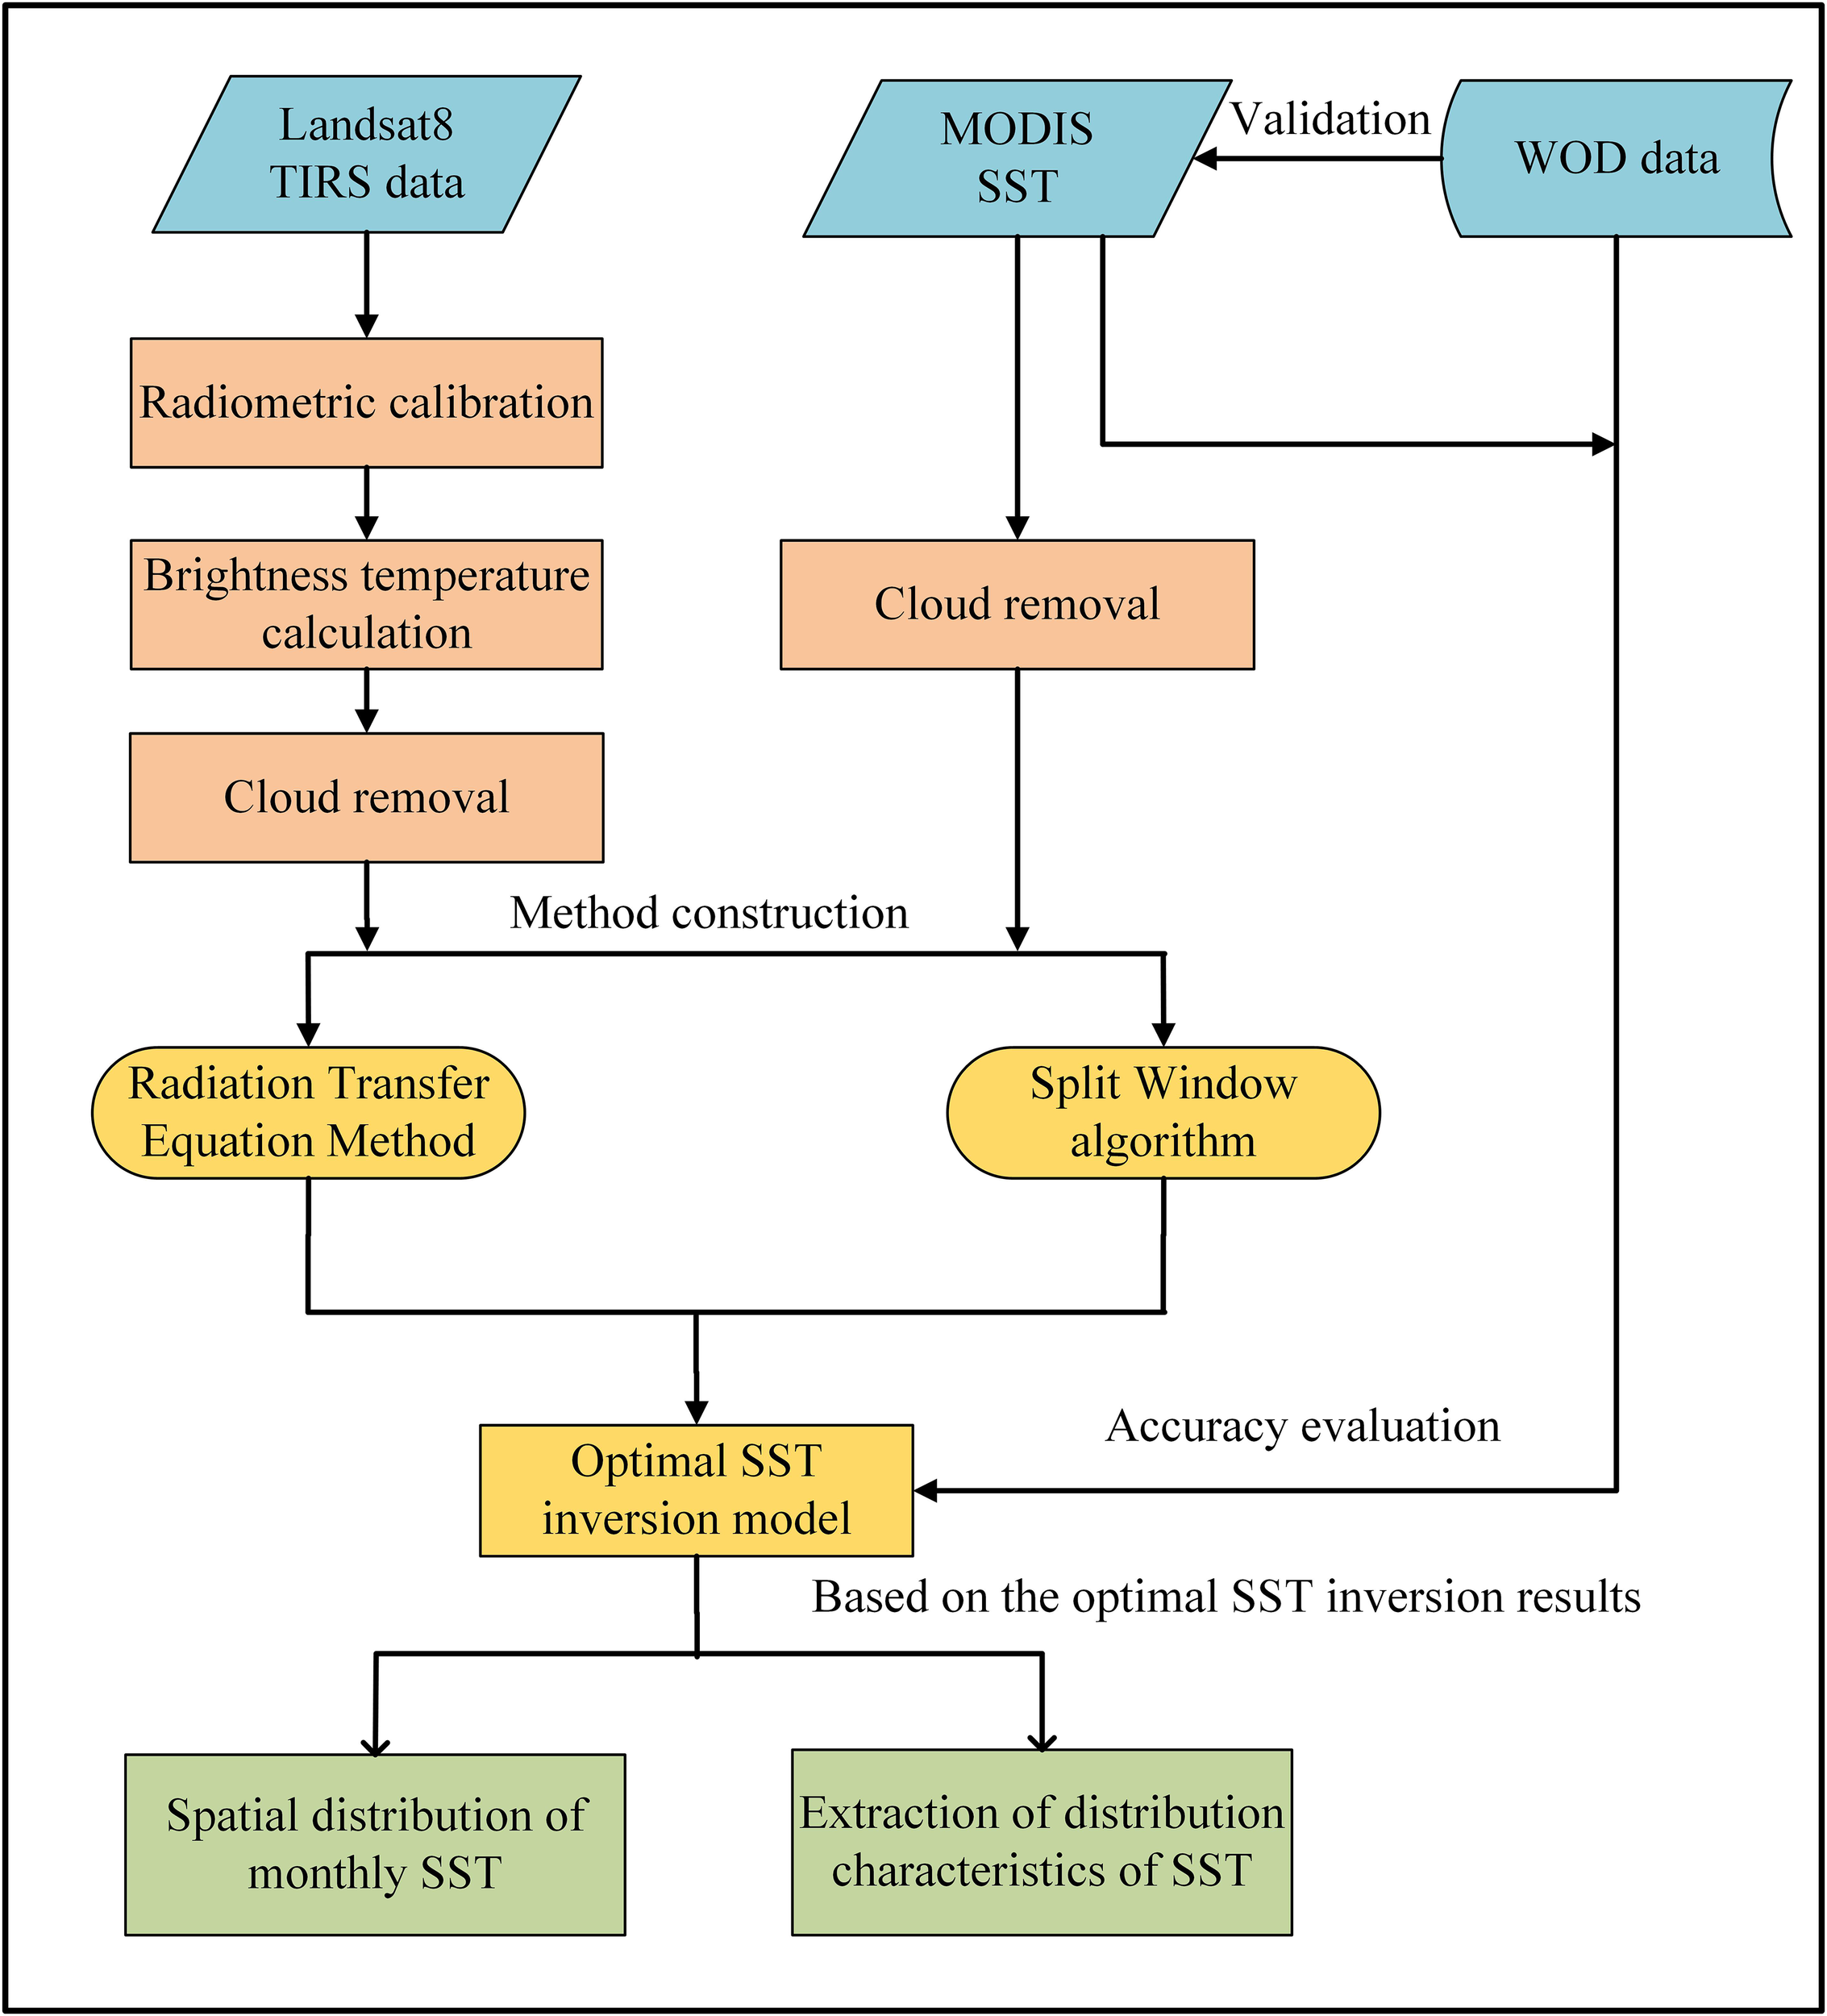
The flowchart of the entire study.
2.3.2 Landsat 8 TIRS preprocessing
Radiometric calibration, brightness temperature calculation and cloud removal were performed for the TIRS bands of Landsat 8. First, according to the TIRS header file, the absolute scaling coefficient was used to calculate the radiance of band 10 and band 11. Second, the brightness temperature was calculated using the Planck function and the radiance values. Then, by combining brightness temperature data and the Landsat 8 multispectral optical bands and Top of Atmosphere reflectance data of the cirrus band, the Fmask3.2 algorithm (Zhu et al., 2015) was used to remove cloud cover areas in the Landsat 8 TIRS images. The cloud cover areas in the MODIS SST data were also eliminated.
2.3.3 Accuracy assessment of MODIS SST data
The reliability of MODIS SST products in different regions needed to be verified (Jang and Park, 2019). Using the CTD sampling point (Figure 1) as the center, a 3×3 window was adopted and abnormal values that deviated from the local median by more than three times the standard deviation were excluded from the sliding window. The mean value was calculated as the true value to compare with the MODIS SST in the same location. Indicators of bias, root mean square error (RMSE), mean absolute error (MAE), and standard deviation (STD) (Jang and Park, 2019; Liu et al., 2020; Kang et al., 2021) were used to evaluate the accuracy. The validation results showed that the MAE of MODIS SST in the SCS ranged from 0.69°C to 0.72°C, and the STD ranged from 0.78°C to 0.87°C (Table 3). A previous study showed that the bias of the MODIS SST ranged from −0.11 to −0.22, and its STD error ranged from 0.58°C to 0.67°C in the daytime over the SCS after verification with the SST data from the CTD of actual voyages and the WOD09 database (Qin et al., 2014). This was consistent with our study. Therefore, the error of MODIS SST was low and it could be used to verify the Landsat inverted SST in the study area.
Table 3
| Time difference\h | BIAS | RMSE\°C | MAE\°C | STD\°C |
|---|---|---|---|---|
| ± 1h | -0.0046 | 0.8623 | 0.7204 | 0.8793 |
| ± 2.5h | -0.0085 | 0.8102 | 0.6947 | 0.7808 |
Verification accuracy of MODIS SST using CTD data under different conditions.
2.3.4 Radiation transfer equation method
For the Landsat 8 TIRS images, the artifacts magnitude in band 11 by banding and absolute calibration errors was roughly twice as much as it was in band 10 (Montanaro et al., 2014). Because the calibration parameters of band 11 is not ideal, and the atmospheric transmissivity in band 10 is higher (Xu, 2015), studies commonly use band 10 to invert SST. The specific calculation can be seen in equations (1) and (2).
where B is the blackbody radiation of the sea surface, Lsensor is the spectral radiance received by the sensor (W*m−2*sr−1*µm−1), Lup is the upwelling radiance, Ldown is the downwelling radiance (W*m−2*sr−1*µm−1), and τ is the atmospheric transmissivity. For band 10, Lup, Ldown and τ were calculated using the NASA atmospheric correction parameter calculator (https://atmcorr.gsfc.nasa.gov/), which were shown in appendix Table 1 for 14 Landsat 8 satellite images for modelling. ε is the sea water surface emissivity. For band 10, K1 = 774.89 (W*m−2*sr−1*µm−1) and K2 = 1321.08K.
2.3.5 Split window algorithm
The SW algorithm was initially proposed by McMillan (Mcmillin, 1980) for NOAA/AVHRR sensors. It primarily uses the atmospheric transmission difference between two thermal infrared channels to eliminate the atmospheric influence. A variety of improved algorithms have been developed since then. On the basis of the SW algorithm, we established a statistical model between the MODIS SST at 4 km resolution and the Landsat 8 brightness temperature resampled to 4 km, to obtain the coefficients of the Landsat 8 TIRS SST inversion models. These coefficients were then applied to Landsat 8 brightness temperature with 30 m resolution to obtain 30 m SST data. The specific equations are as follows:
where SSTL is the 4 km MODIS SST. T1L and T2L are the brightness temperature of band 10 and band 11 of Landsat 8 TIRS image resampled to 4 km resolution. T1H and T2H are brightness temperature of band 10 and 11 of the Landsat 8 TIRS images with 30 m resolution. F represents the function relationship between the brightness temperature of the Landsat 8 TIRS images and SST, which was constructed by different band combinations of band 10 and band 11.
In this study, the SST4 and SST5 models were constructed using the traditional SW algorithm (Mcmillin, 1980) and the non-linear SST algorithm (Jang and Park, 2019), respectively. The SST6 model was the deformation of the SW algorithm. In addition, SST2 and SST3 of two single-band statistical methods were added for comparison.The specific equations and parameters are shown in Table 4.
Table 4
| SST inversion models | a0 | a1 | a2 | a3 | R2 |
|---|---|---|---|---|---|
| SST2 = a0+a1×T11+a2×T1×T11 | 192.790 | -16.667 | 0.416 | / | 0.6366 |
| SST3 = a0+a1×T1+a2/T1 | -464.299 | 11.974 | 5018.431 | / | 0.6388 |
| SST4 = a0+a1*T11+a2*(T11-T12) | 11.038 | 0.408 | 3.389 | / | 0.9277 |
|
SST5 = a0+a1*T11+a2*(T11-T12)+
a3*(T11-T12)*Tsfc |
13.360 | 0.310 | 2.594 | 0.027 | 0.9288 |
| SST6 = a0+a1*T11+a2*(T11-T12)+ a3*(T11-T12)*(T11-T12) | 11.427 | 0.402 | 3.162 | 0.047 | 0.9278 |
SST inversion models with different band combinations.
T11: Brightness temperature of band 10 of Landsat 8; T12: Brightness temperature of band 11 of Landsat 8, unit: °C; a1, a2, a3 and a4: regression coefficients; for SST5 model, Tsfc is an a priori estimate of the SST, which adjusts the difference between T11 and T12. Tsfc can refer to the climate SST or the estimated satellite SST. In this study, the satellite SST estimated by the RTM SST1 model was adopted as Tsfc.
2.3.6 Accuracy and the optimal SST model
The accuracy of the six SST inversion models in cool, hot, and mixed temperature conditions were evaluated by the MODIS SST products verified by CTD data. The PFL-measured SST data (Figure 1) were adopted to evaluate the accuracy of the optimal inversion model in the Xisha Islands. Indices, including RMSE (Eq. 5), BIAS (Eq. 6), and MAE (Eq. 7), were used to evaluate the accuracy of the SST inversion models and select the optimal model.
where N is the total number of grids, M is the MODIS SST, L is the Landsat 8 TIRS inverted SST. RMSE is the overall deviation between inverted SST and the in situ measured SST, ranging from 0 to +∞. BIAS is the overestimation or underestimation of the Landsat 8 inverted SST compared with the in situ measured SST, ranging from −1 to 1, with a positive value representing overestimation and a negative value representing underestimation. MAE is similar to BIAS but with absolute values, which is used to avoid the cancellation of positive and negative values, ranging from 0 to +∞.
2.3.7 SST spatial pattern among geomorphic zones
On the basis of the optimal Landsat 8 SST inversion model, the SST of the six coral reefs at different dates (Table 2) was inverted using 47 Landsat 8 images. Then, the SST spatial pattern of coral reefs in each month except October was compared and analyzed. The average SST of each geomorphic zone for the six coral reefs was further calculated and compared in the hot season and cool season. Finally, the average SST of other geomorphic zones minus the average SST of the lagoon was used to investigate the SST spatial pattern among geomorphic zones and coral reefs. The geomorphic data including five zones of the Xisha Islands referenced Duan (2022) and Zuo et al. (2018), and it had an overall accuracy of 90.7% (Figure 3). Four geomorphic zones related to coral growth including the offshore sea, reef slope, reef flat, shallow lagoon, and deep lagoon, were selected (Figure 3). The offshore area was defined as 1 km outward from the reef slope.
Figure 3
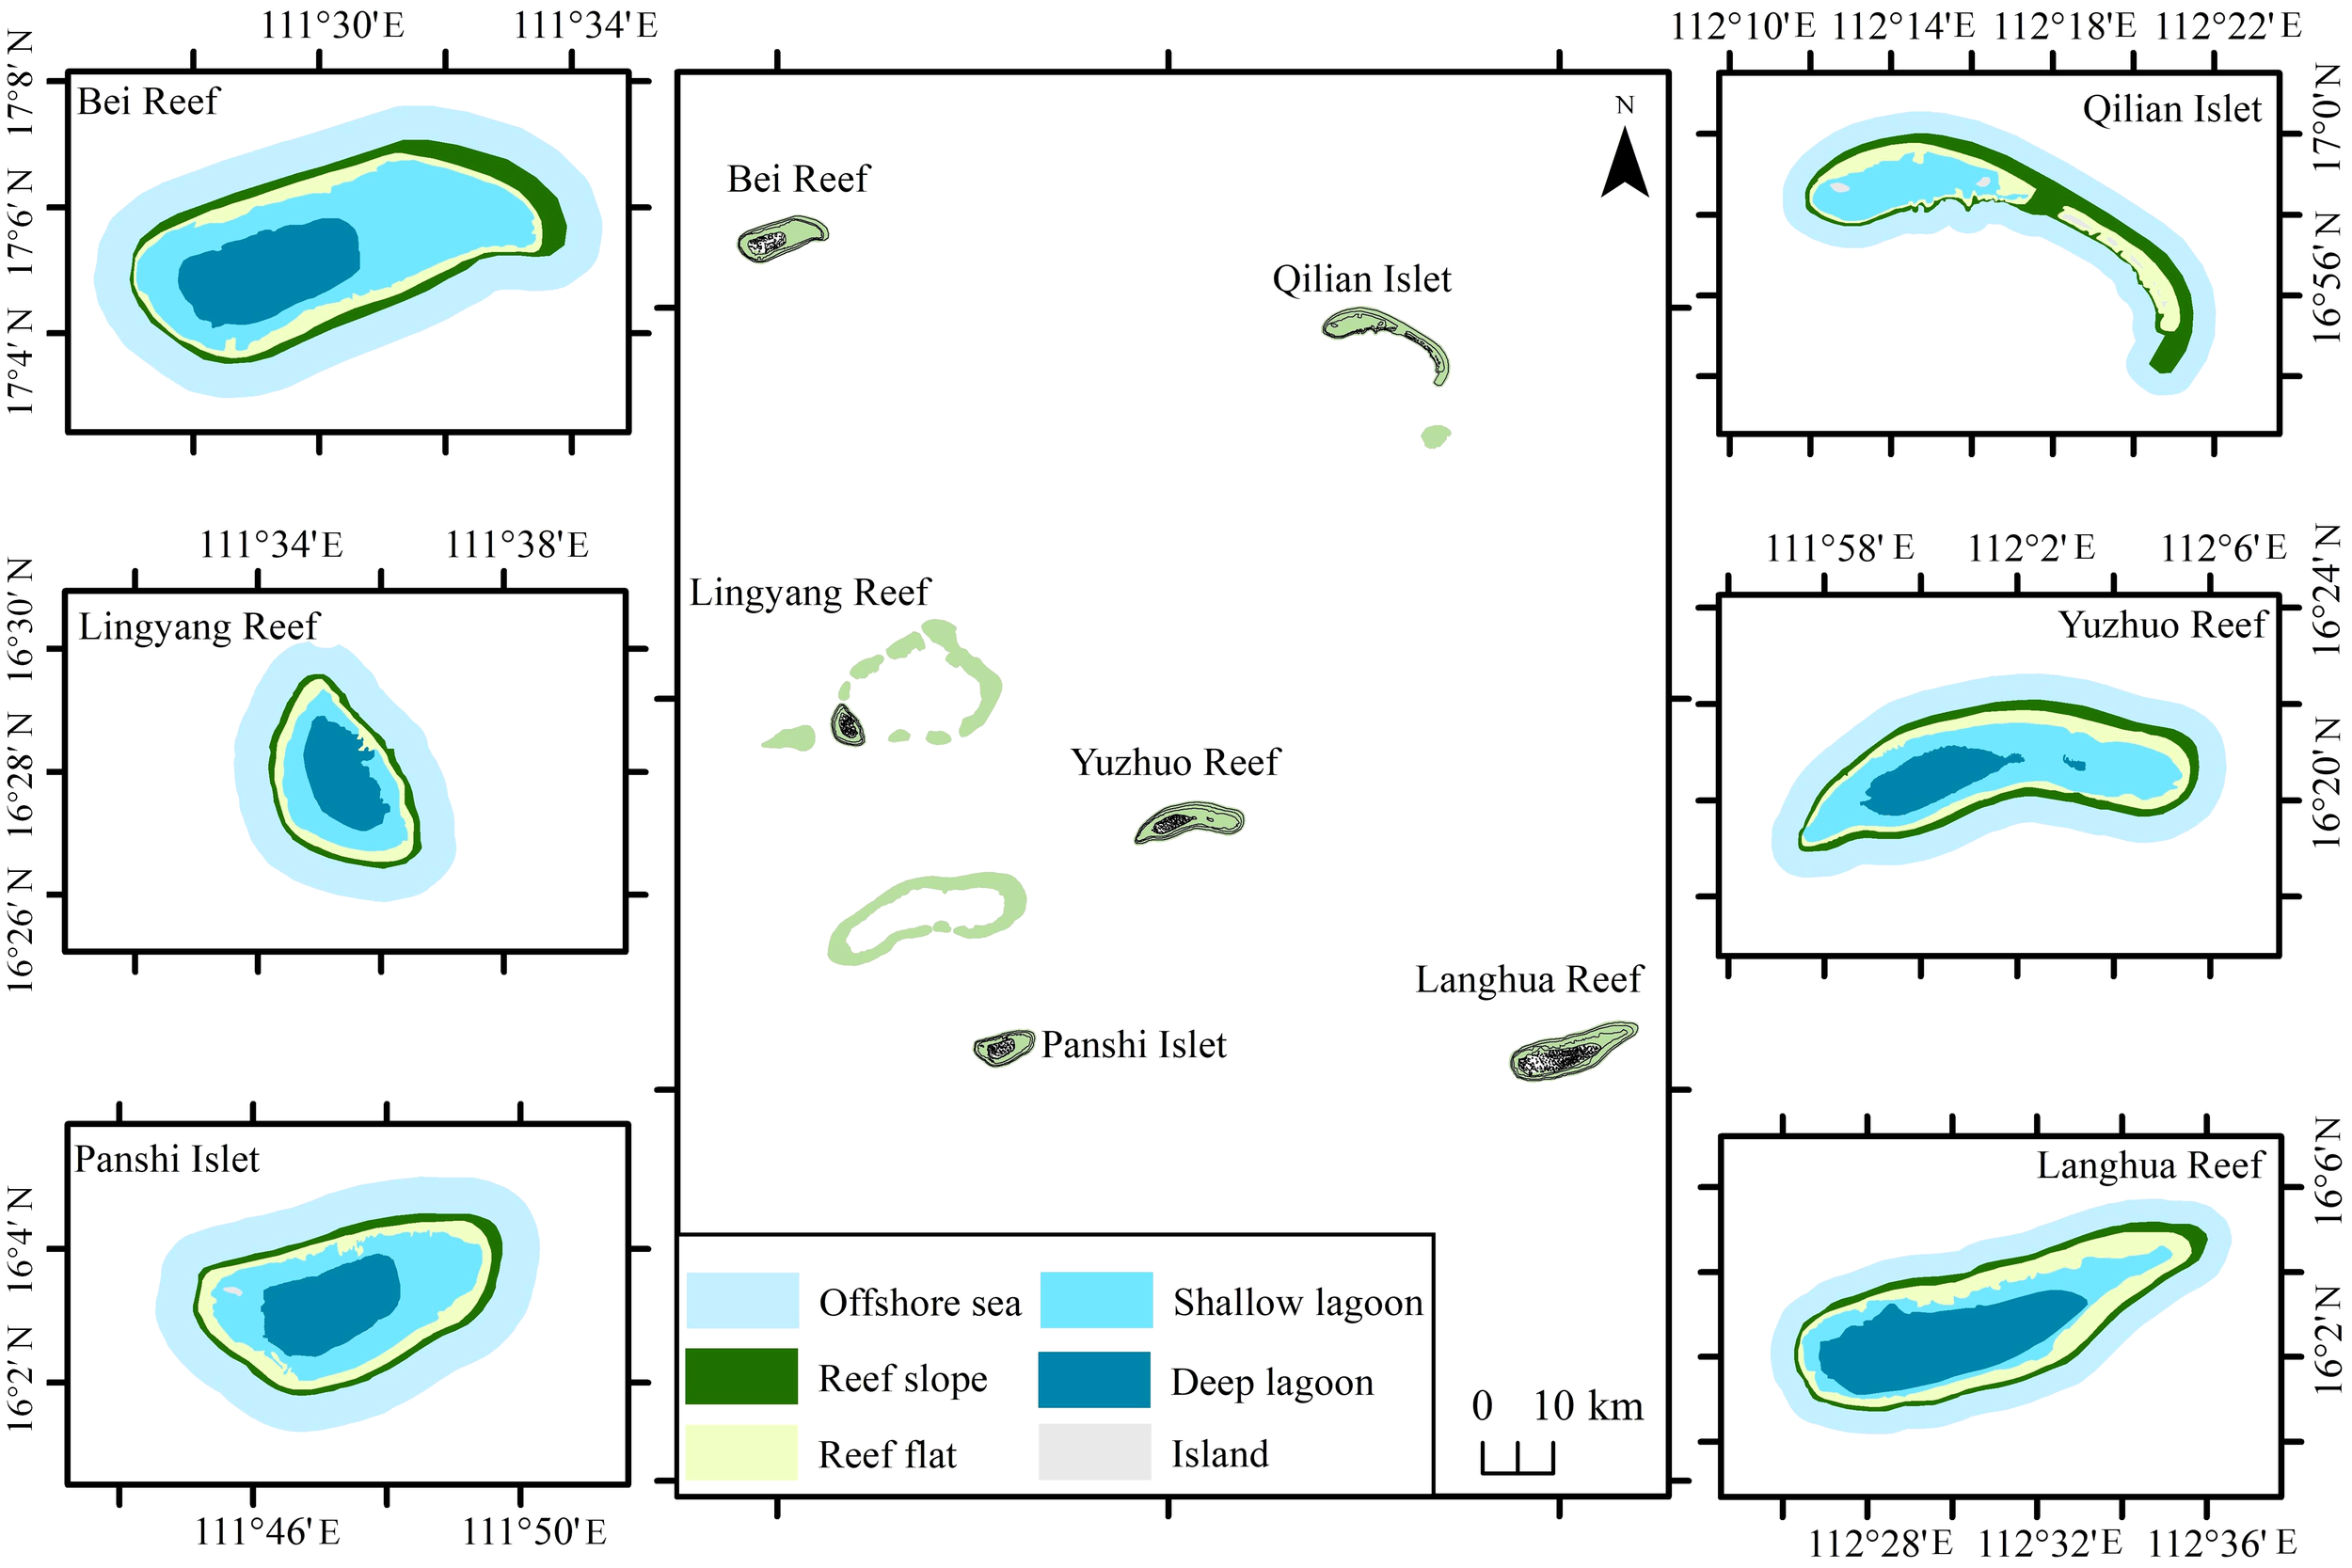
Geomorphic map of the six coral reefs in the Xisha Islands (Zuo et al., 2018; Duan, 2022).
3 Results
3.1 Accuracy of SST inversion models
Validation results suggested that the accuracy of SST2 and SST3 models are generally low compared with other models (Figures 4 and 5). In the cool season, models of SST1, SST4, SST5 and SST6 had SST underestimation of approximately 0.5–0.8°C. The SST6 model had the highest accuracy (RMSE=0.99°C, MAE=0.78°C, BIAS=−0.03) (Figure 4). In the hot season, the SST4 model (RMSE=0.63°C, MAE=0.49°C, BIAS=0.01) and SST6 model (RMSE=0.64°C, MAE=0.50°C, BIAS=0.01) had the highest accuracy (Figure 5). In the mixed temperature conditions, the SST4 model (RMSE=0.89°C, MAE=0.68°C, BIAS=−0.01) and the SST6 model (RMSE=0.88°C, MAE=0.67°C, BIAS=−0.01) were the best (Table 5). Overall, the SST6 was the optimal SST inversion model for coral reefs in the Xisha Islands in all temperature conditions. The verification using the screened PFL in situ measured SST data suggested that the bias of SST data inverted by the SST6 model was within 1°C of the PFL data and the minimum SST bias was 0.08°C (Table 6).
Figure 4
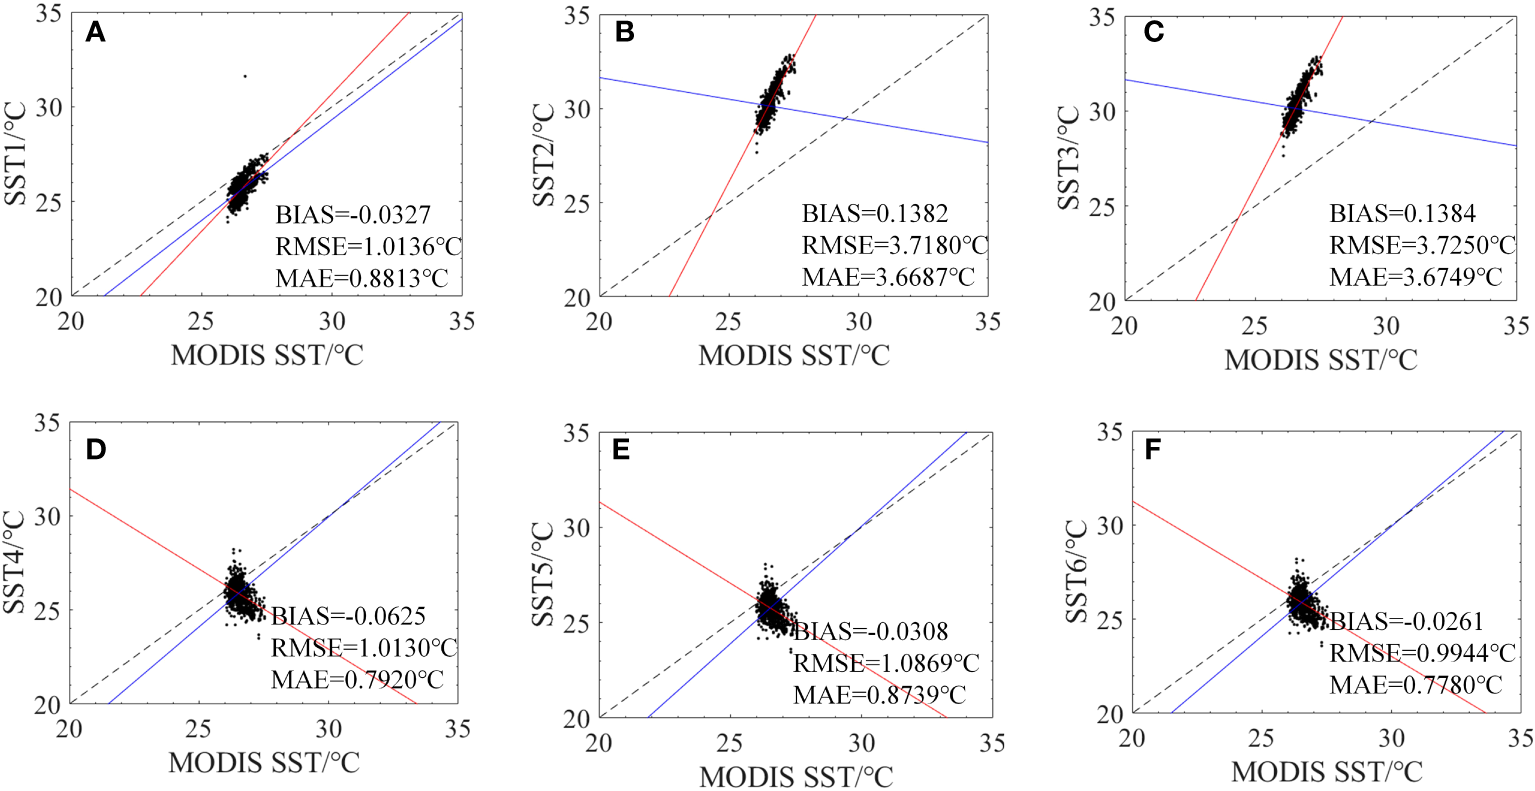
The accuracy of six Landsat 8 SST inversion models of SST1 (A), SST2 (B), SST3 (C), SST4 (D), SST5 (E), and SST6 (F) compared with MODIS SST in the cool season. The red line represents the fitted line for discrete points in cool season, and the blue line represents the fitted line for all data including hot season and cool season.
Figure 5
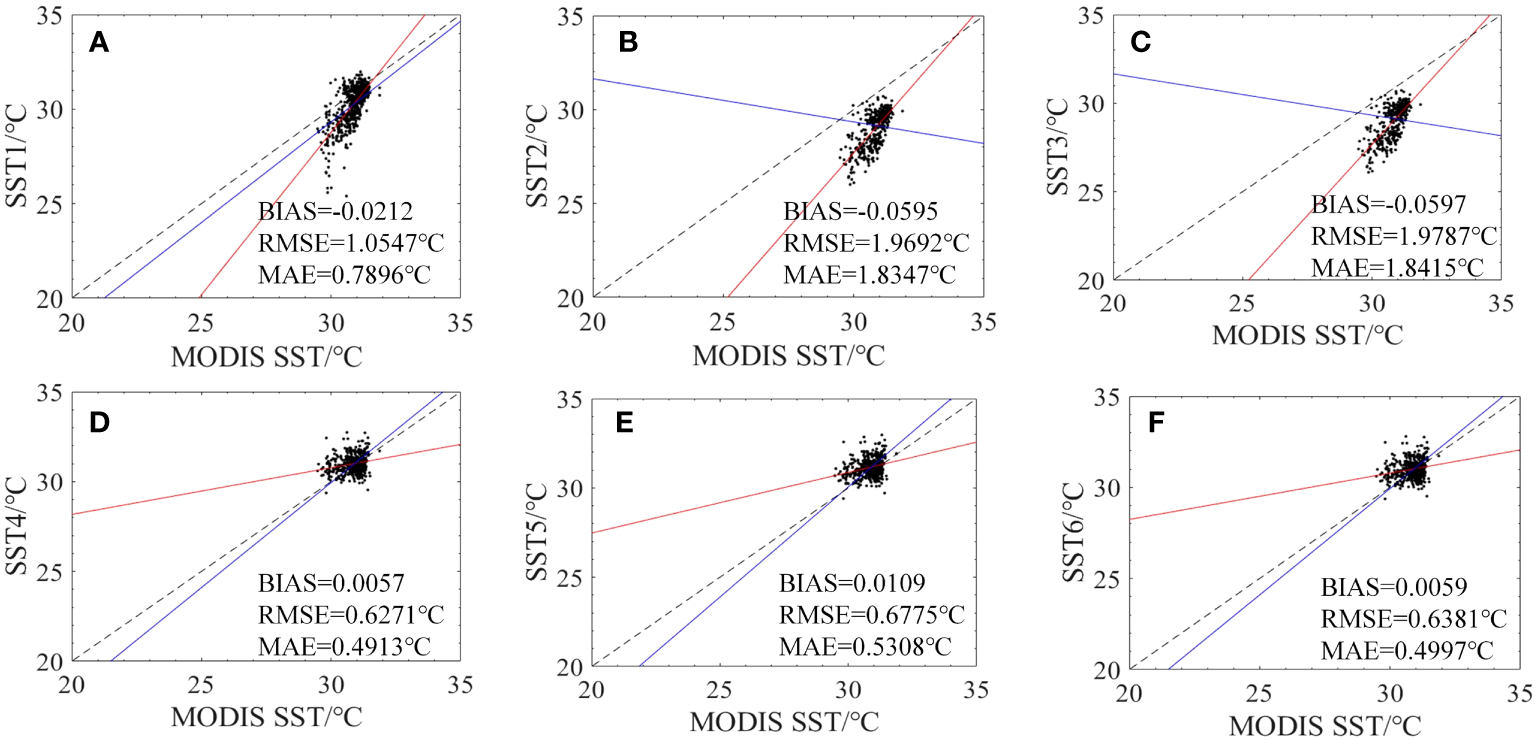
The accuracy of six Landsat 8 SST inversion models of SST1 (A), SST2 (B), SST3 (C), SST4 (D), SST5 (E) and SST6 (F) compared with MODIS SST in the hot season. The red line represents the fitted line for discrete points in hot season, and the blue line represents the fitted line for all data including hot season and cool season.
Table 5
| Model | BIAS | RMSE/°C | MAE/°C |
|---|---|---|---|
| SST1 | -0.0280 | 1.0291 | 0.8470 |
| SST2 | 0.0568 | 3.1753 | 2.9789 |
| SST3 | 0.0568 | 3.1827 | 2.9853 |
| SST4 | -0.0133 | 0.8877 | 0.6789 |
| SST5 | -0.0136 | 0.9538 | 0.7449 |
| SST6 | -0.0129 | 0.8776 | 0.6733 |
The overall accuracy of six Landsat 8 SST inversion models of SST1, SST2, SST3, SST4, SST5 and SST6 compared with MODIS SST in the hot and cool seasons.
Table 6
| Date | Lon/° | Lat/° | Time/h(UTC) | Depth/m | SST_PFL/°C | SST6/°C | SSTD/°C |
|---|---|---|---|---|---|---|---|
| 20180807 | 111.482 | 16.614 | 4.83 | 6.26 | 29.91 | 28.73 | -1.18 |
| 20180823 | 111.575 | 16.775 | 4.73 | 6.16 | 29.55 | 29.63 | 0.08 |
| 20180924 | 111.756 | 17.115 | 5.34 | 4.37 | 29.26 | 29.44 | 0.18 |
| 20181010 | 111.796 | 17.018 | 5.11 | 4.47 | 28.50 | 28.70 | 0.2 |
| 20181026 | 111.794 | 17.032 | 5.25 | 5.17 | 28.96 | 28.03 | -0.93 |
| 20181111 | 111.701 | 16.971 | 5.30 | 5.86 | 27.87 | 27.22 | -0.65 |
| 20181213 | 111.576 | 16.961 | 5.20 | 5.17 | 27.07 | 27.23 | 0.16 |
The SST data inverted by the optimal SST6 model and the corresponding field profiling float (PFL) seawater temperature data.
SSTD (°C)=SST6 (°C)−SST_PFL (°C).
3.2 Fine-scale SST spatial and temporal pattern of coral reefs
3.2.1 Monthly SST pattern
At the satellite image acquisition time, the lagoon SST was usually the highest, and it was always higher than the offshore sea SST in the hot season (May–September) (Figure 6). The lagoon SST gradually increased from south to north and was the highest in the area adjacent to the northern reef flat (Figure 6F). The comparison of SST among the different coral reefs showed that the Lingyang Reef had the highest relative SST, followed by Panshi Islet, while Langhua Reef had the lowest relative SST (Figure 6).
Figure 6
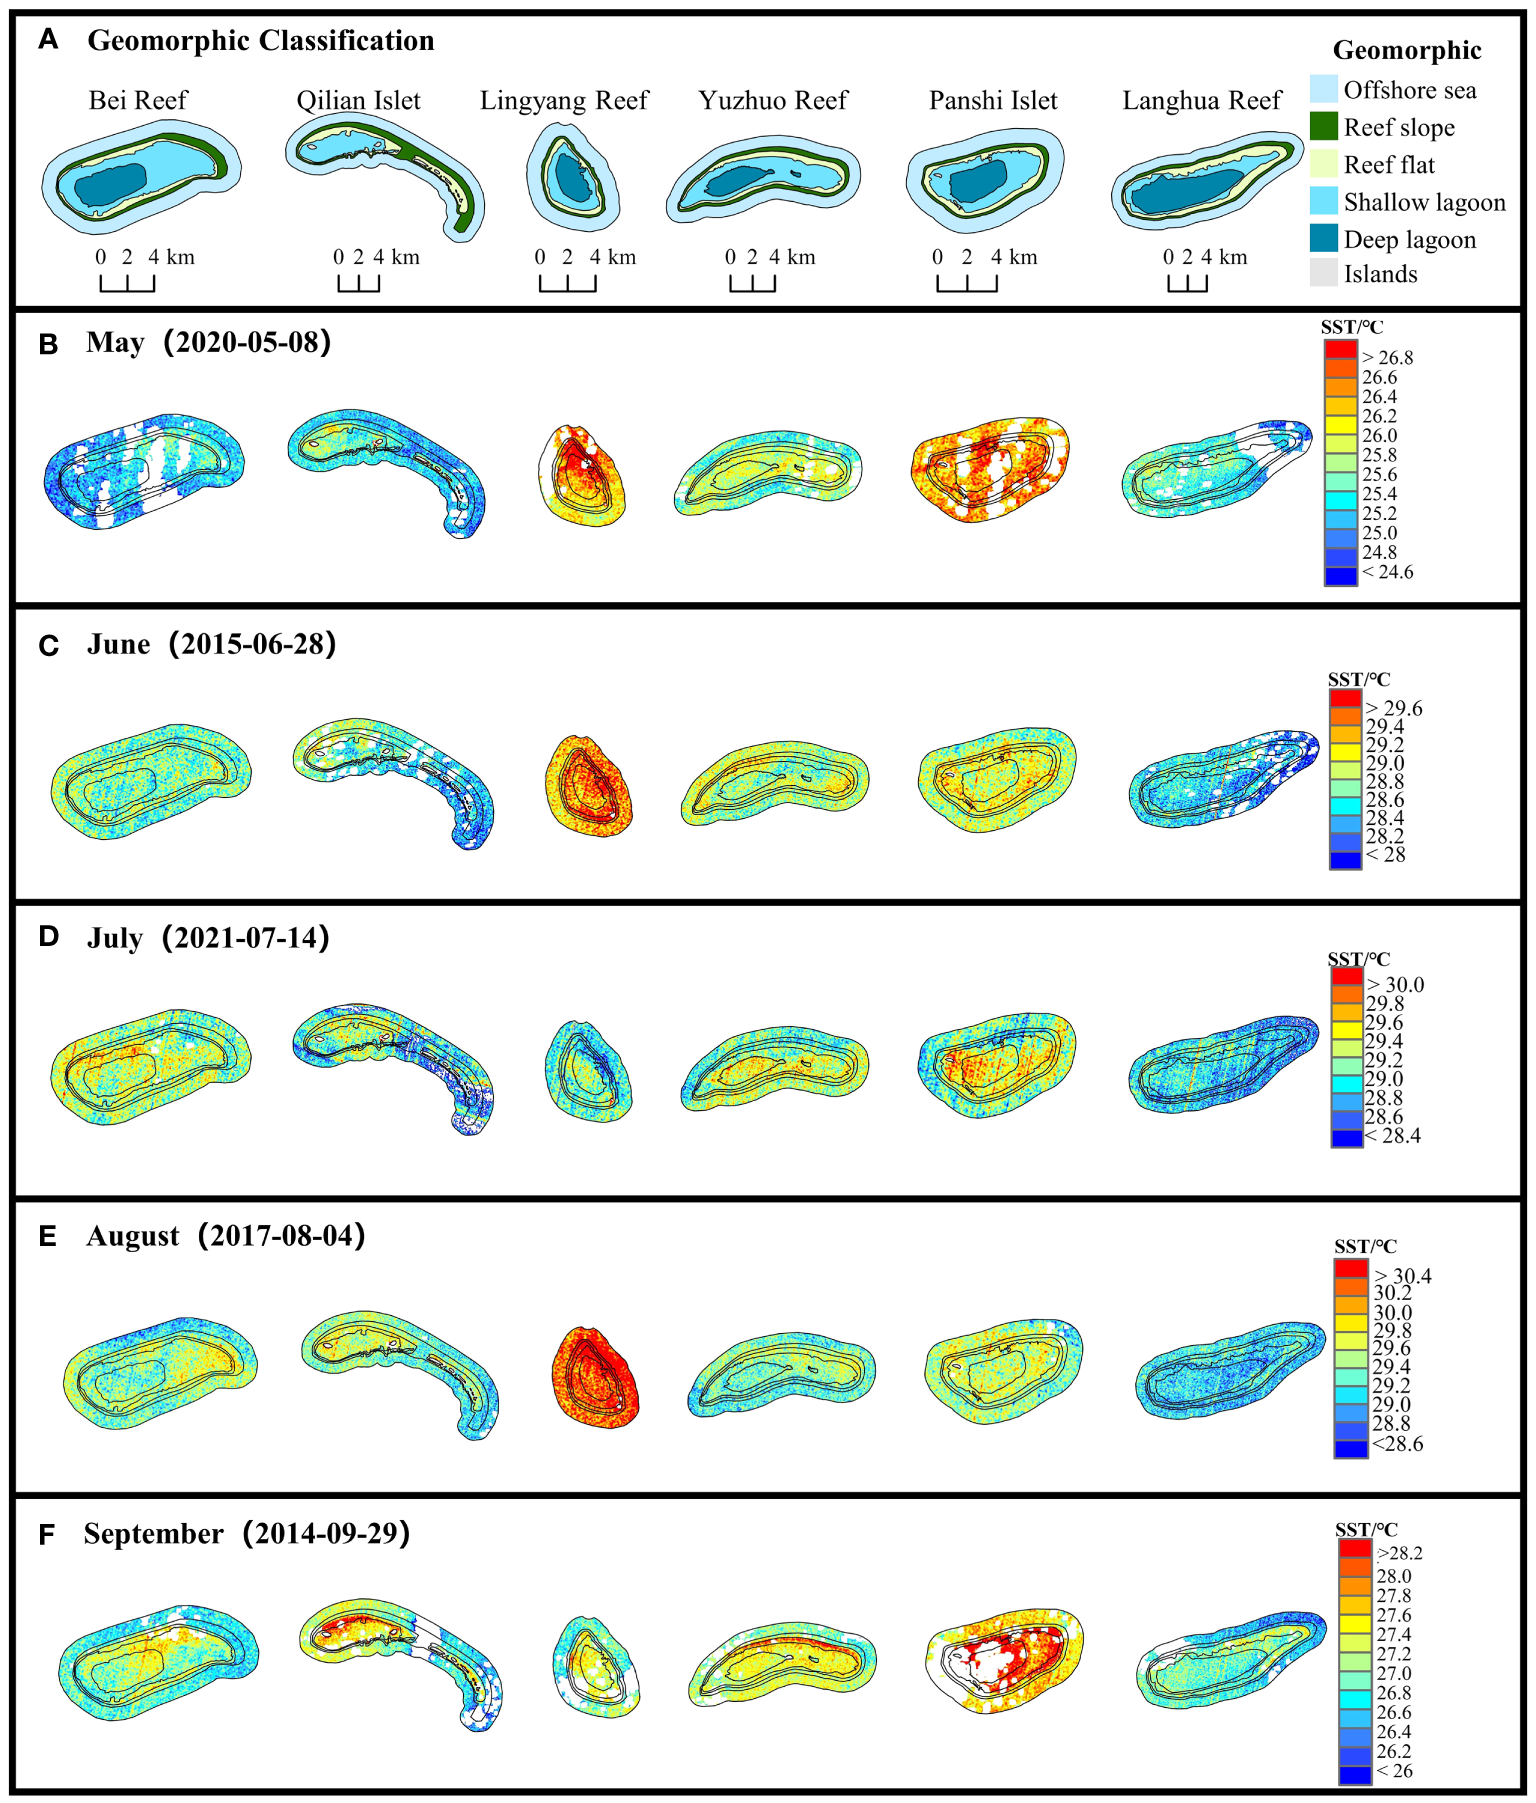
SST maps of the six reefs in the Xisha Islands from May to September at the satellite image acquisition time.
In the cool season (November to the next April), the SST of the lagoon was generally lower than the reef slope/offshore SST (Figures 7B–D, F), but this was not a general phenomenon. The SST of Lingyang Reef and Panshi Islet was relatively the highest (Figure 7). Compared with the hot season (Figure 6), the SST difference among coral reefs in the cool season was larger at approximately 2°C–3°C (Figure 7), and the difference even reached approximately 4°C between Bei Reef and Panshi Islet on March 16, 2018 (Figure 7D).
Figure 7
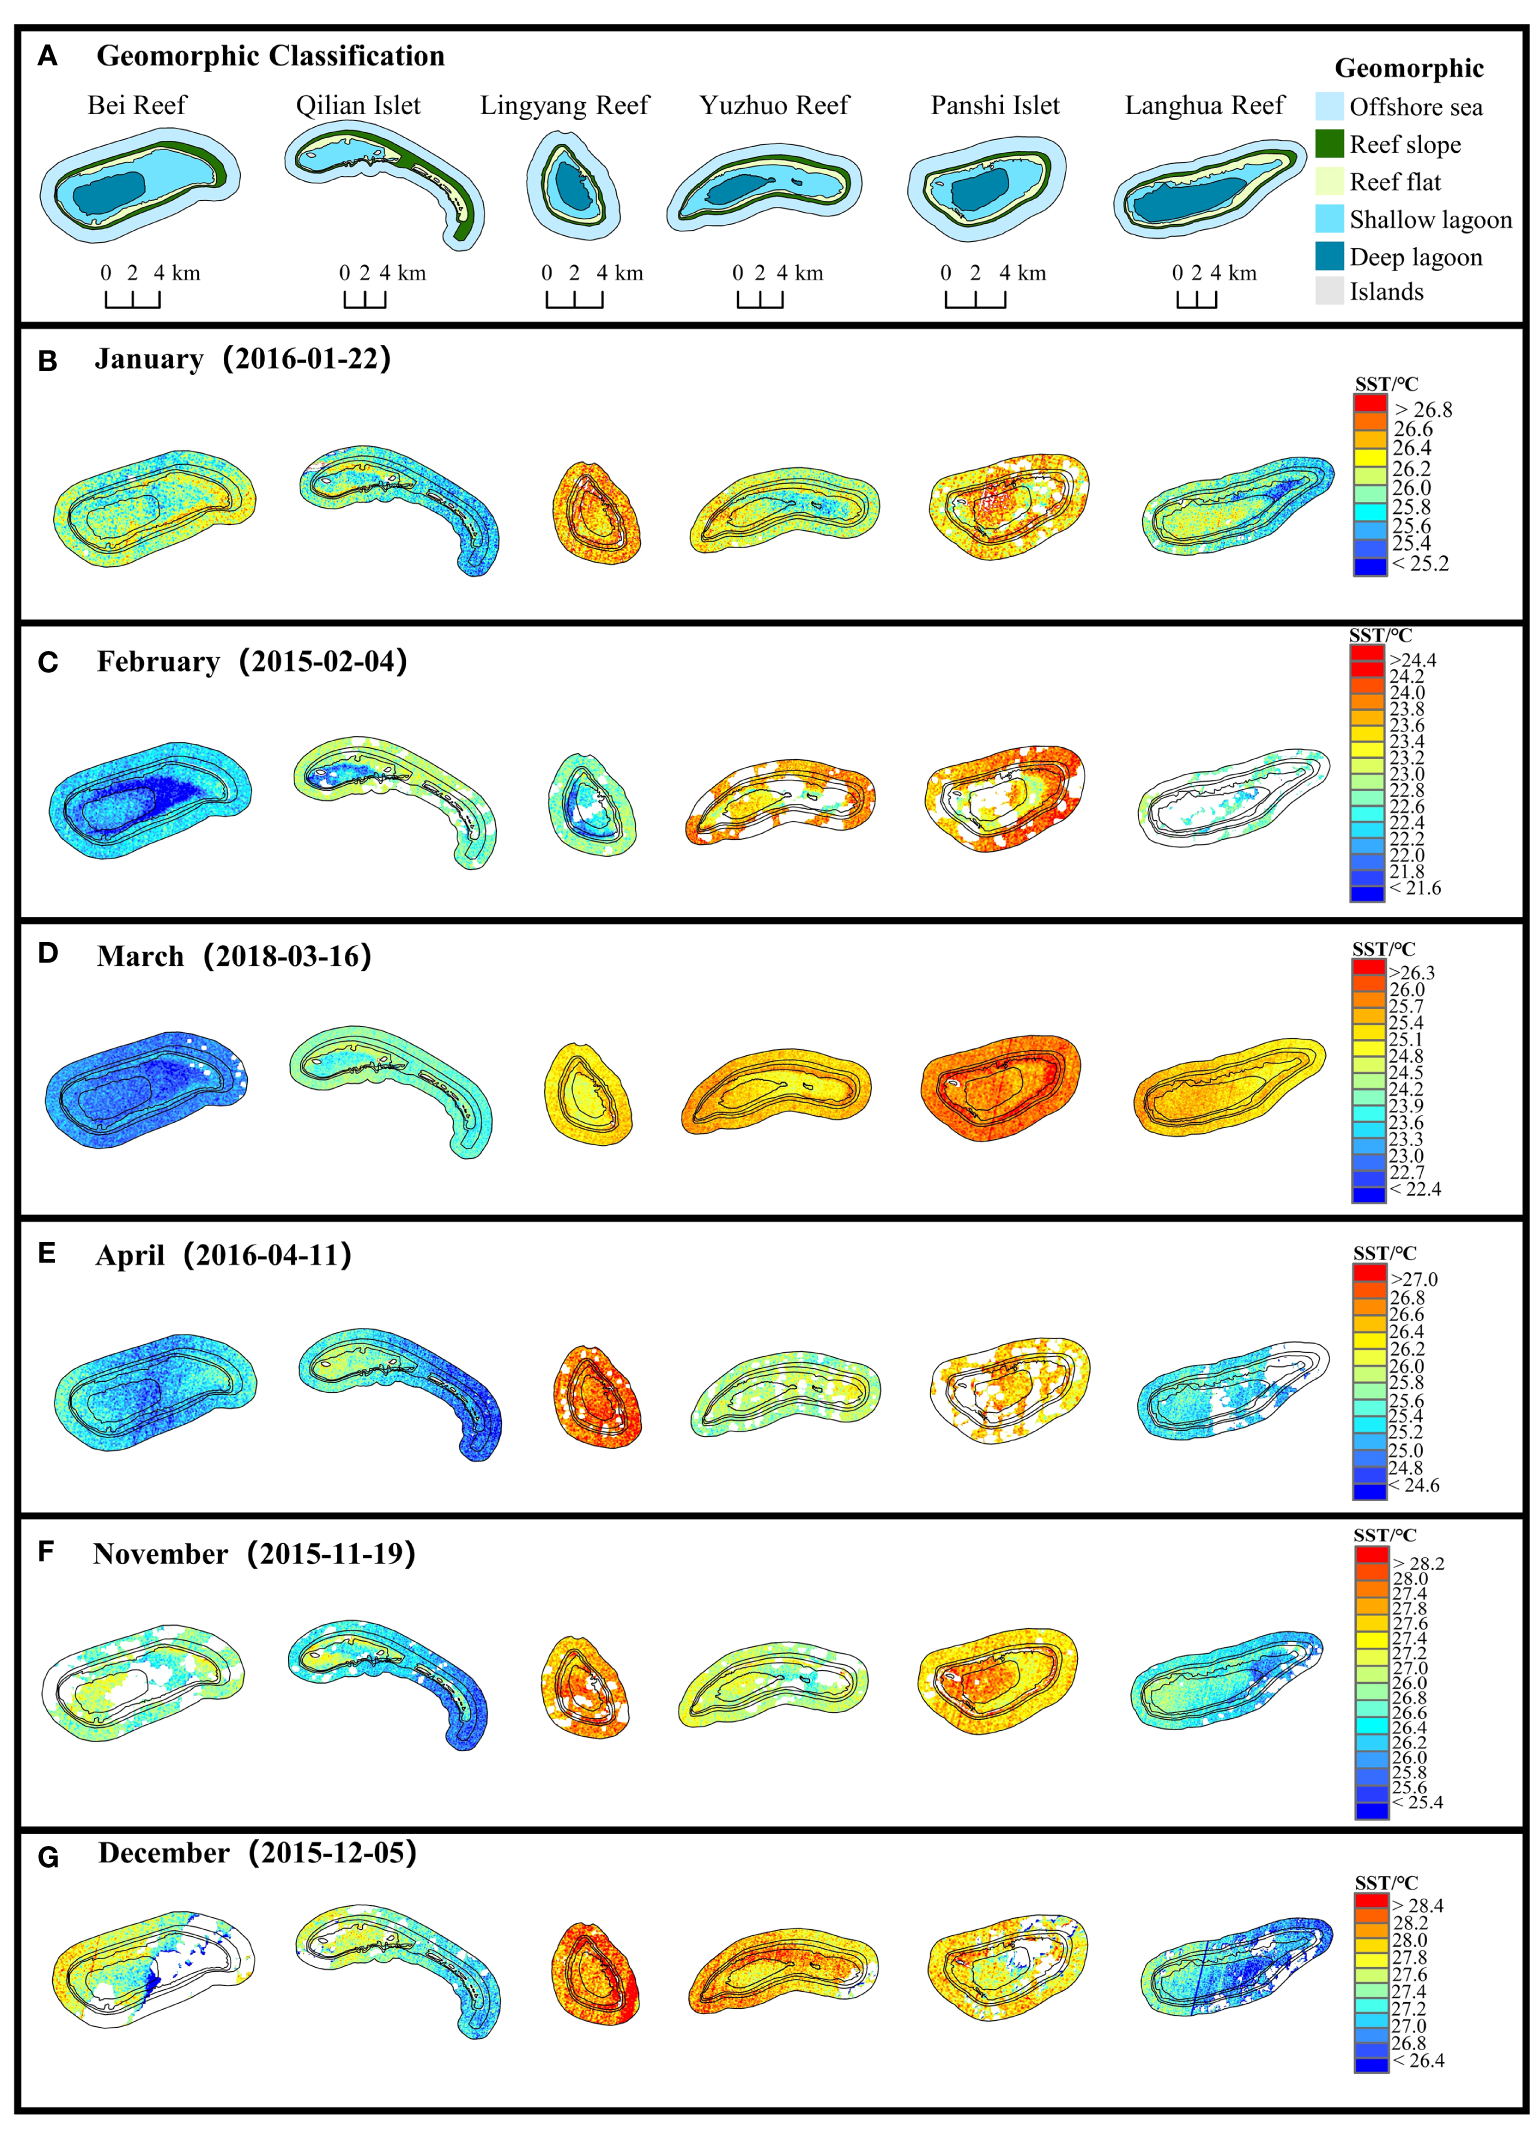
SST maps of the six reefs in the Xisha Islands from January to April as well as November to December at the satellite image acquisition time.
3.2.2 Average SST pattern among coral reef geomorphic zones
For Lingyang Reef (Figures 8C, I), Bei Reef (Figures 8A, G), Yuzhuo Reef (Figures 8E, K), and Langhua Reef (Figures 8B, H), the average SST among geomorphic zones in the hot and the cool seasons usually presented a pattern of reef flat > lagoon > reef slope/offshore sea. The average SST in the reef flat was usually approximately 0.05°C–0.2°C higher than that in the lagoon, with the maximum temperature difference approximately 0.3°C–0.4°C during the cool season (Figures 8G, I, K, L). The average SST in the reef slope and the offshore sea was approximately 0.1°C lower than the SST in the lagoon. The minimum difference in the average SST in Bei Reef, Yuzhuo Reef, and Langhua Reef was approximately 0.3°C–0.4°C in cool season (Figures 8G, K, H). The SST fluctuation in Lingyang Reef in the cool season was relatively large, approximately ±0.5°C (Figure 8I). For Panshi Islet and Qilian Islet, the average SST among the geomorphic zones in the hot season showed a pattern of lagoon > reef flat > reef slope/offshore sea (Figures 8D, E). The mean SST of the reef flat was approximately 0.05°C lower than the lagoon SST, and it was approximately 0.2°C higher than the mean offshore SST during the hot season (Figures 8D, E). In addition, the SST of the shallow lagoon was usually 0.1°C greater than that of the deep lagoon during the hot season (Figures 8A–C, E), while it was usually 0.1°C lower than that of the deep lagoon for all the coral reefs in the cool season (Figure 8I).
Figure 8
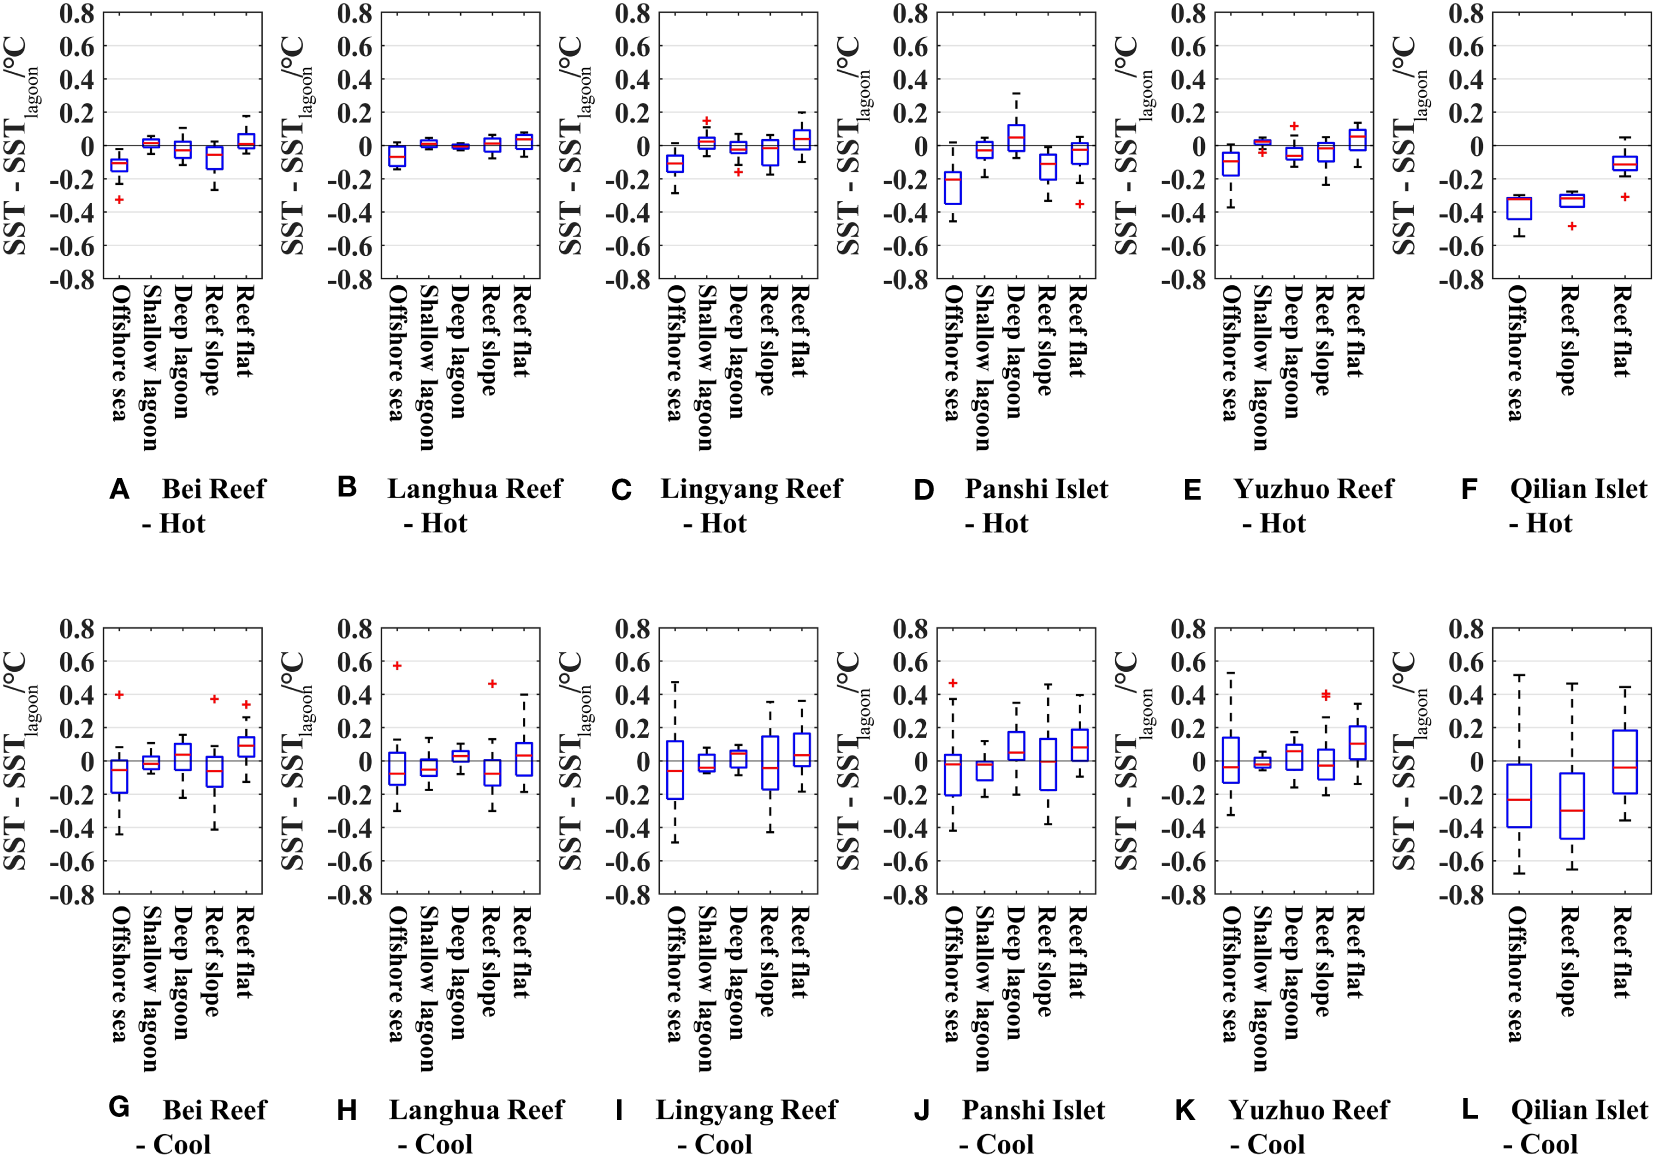
Differences in mean SST of geomorphic zones relative to the mean SST of lagoons. The red horizontal line (-) in each figure represents the median value; the blue horizontal line (-) represents the values of upper and lower quartiles; the black line (-) represents the maximum and minimum values excluding extreme values, and the red plus sign (+) represents the 1.5 times quartile difference, indicating that there may be extreme fluctuations in SST on the day; Figures (A-F) shows the SST differences in hot season; Figures (G-L) shows the SST differences in cool season.
4 Discussion
4.1 SST inversion models
This study developed six SST inversion models on the basis of Landsat 8 TIRS images and the RTM and SW algorithms. The validation results showed that SST6 model using the SW algorithm was optimal in the sea areas of the Xisha Islands in the SCS. The SST1 model using the RTM method was more stable in the hot and cool seasons (Figures 4 and 5). However, the SST1 model require additional atmospheric parameters such as atmospheric transmissivity, upwelling radiance and downwelling radiance acquired from NASA website, which was a relatively cumbersome process. The SST6 model used the atmospheric transmission difference to eliminate atmospheric influence, and obtained fitting coefficients by statistically analyzing a large amount of sea temperature data. Thus, it was simple to develop. However, the SST6 model has regional dependence and is not transferable (Xing et al., 2015; Jaelani and Alfatinah, 2017; Jang and Park, 2019; Liu et al., 2020). Therefore, the appropriate optimal fitting coefficients need to be determined in different regions.
4.2 Monthly SST spatial and temporal pattern
In the hot season, the lagoon SST gradually increased from the south to the north and reached the highest in the area adjacent to the northern reef flat (Figure 6F). This may be due to the influence of the southwest monsoon in the hot season in the SCS. Among all the coral reefs, Lingyang Reef experienced higher SST than other coral reefs, followed by Panshi Islet (Figure 6). Coral bleaching analysis on the basis of satellite data in 2005–2018 suggested that the Lingyang Reef experienced the highest level of severe bleaching approximately 33.3% in the Xisha Islands, and Panshi Islet experienced the severe bleaching approximately 20.6% (Pang et al., 2021), which was consistent with this study. This finding indicated that the SST anomaly was one of the important factors leading to coral bleaching in the Xisha Islands.
In the cool season, influenced by the northeast monsoon, the lagoon SST was generally lower than the reef slope/offshore sea SST (Figures 7B–D, F), but this was not a general phenomenon. It can also be seen from the SST variations between the geomorphic zones that the average SST of the lagoon in the hot season was clearly higher than that on the reef slope, while the average SST difference between these areas was much smaller in the cool season (Figures 4 and 5). Compared with the hot season, the SST difference among coral reefs in the cool season was larger, at approximately 2°C–3°C (Figures 6 and 7). The latitude of Bei Reef was higher than the Panshi Islet, which may be the cause of the 4°C difference between Bei Reef and Panshi Islet on March 16, 2018 (Figure 7D). Thus, the SST fluctuated greatly among the geomorphic zones in the cool season. However, the SST fluctuation was within the suitable range for coral survival and did not induce cold thermal stress on the reefs.
4.3 SST spatial and temporal pattern among geomorphic zones
This study suggested that the spatial pattern of SST varied among the geomorphic zones. Atmospheric conditions and local factors in the coral reef area are considered to be the causes of small-scale local SST variations. First, cloud, wind, solar radiation intensity, air relative humidity, and other factors related to atmospheric conditions (Falter et al., 2013; Leahy et al., 2013; Falter et al., 2014), directly or indirectly affect the heat exchange between the atmosphere and sea surface. For example, the net atmospheric heating flux is stronger when coral reefs are located in tropical regions with higher relative humidity (Falter et al., 2014). In addition, factors related to the local environment and topography, including wave, tide, current, reef topography, and coral reef habitat type (Lowe et al., 2009; Lowe et al., 2010; Falter et al., 2013; Falter et al., 2014; Maina et al., 2016), can affect the small-scale water retention time and thus influence the accumulation of seawater heat in the coral reef area.
The average SST variations among geomorphic zones in the hot season usually presented a pattern of reef flat > lagoon > reef slope/offshore sea (Figures 8A–F). The SST in the reef flat was the highest among all the geomorphic zones during the hot season, which may be due to the shallow water and lower hydrodynamic forces. Previous studies have found that the interior or less wave-affected areas of coral reefs experience more extreme SST than the offshore sea or more wave-affected areas (Davis et al., 2011). According to field surveys, the first coral bleaching event in Hawaii in 1996 occurred mainly in shallow water areas with limited circulation, while there was less coral bleaching in open coastal areas adjacent to the deep oceans (Jokiel and Brown, 2004). In June 2015, the SST anomaly on the reef flat of Dongsha Atoll in the northern SCS was 2°C higher than the open-ocean SST anomaly, because of the high solar radiation and the low advection cooling influenced by an unusual high pressure system that reduced the tidal and wave-driven water velocity on the reef flat (DeCarlo et al., 2017).
Studies have also found that the SST in the lagoon is higher than the SST in the offshore sea in the hot season (Zhang et al., 2013), because the water circulation in the lagoon is poor and the water retention time is long. The SST on the reef slope and offshore sea is susceptible to the influence of waves and upwelling (Jokiel and Brown, 2004; Zhang et al., 2013; Li and Reidenbach, 2014). In 1998, massive coral death occurred in the lagoon of the Dongsha Atoll in the northern SCS, while there was less coral bleaching on the northern and eastern reef slopes because of the intermittent deep-water upwelling caused by gravity waves (Dai, 2006). In situ temperature measurements indicated that the maximum temperature in the shallow lagoon of Dongsha Atoll in 1998 was 1–2°C higher than that on the outer reef area (Kumar and Balasubramanian, 2012; Tkachenko and Russ, 2014). The most enclosed Persian Gulf is the world’s hottest coral sea, where some coral species can withstand hot season temperatures up to 10°C higher than corals in other places (Coles and Riegl, 2013).
Previous studies have mainly focused on the SST variation between the lagoon and the open sea in the hot season. The current study further investigated the temperature difference among the reef flat, lagoon, reef slope and the open sea. Overall, our study suggests that scleractinian corals in the reef flat and the lagoon are more susceptible to bleaching-level thermal stress than other geomorphic zones, while the corals in the reef slope will be the last areas affected in the hot season. The reef flat of atolls in the SCS is a major reef-building coral growth zone, dominated by branching corals that are very sensitive to high temperatures (Zuo et al., 2017; Thinesh et al., 2019). We suggest that detailed SST monitoring and coral bleaching early warning studies in reef areas need to be further strengthened.
4.4 Limitations
The accuracy of SST data retrieved from Landsat 8 TIRS images and other thermal infrared satellite data is influenced by factors such as algorithms, spectral radiation received by the sensor, and the surrounding environment. There is still room for improvement in current retrieval methods. Firstly, striping issues arise in the SST retrieval results owing to the large error of band 11(Kang et al., 2021), which can be further processed to remove stripes and improve the data quality. Secondly, further improvement in the removal of clouds and atmospheric water vapor is needed, which can introduce errors when resampling for data matching.
5 Conclusion
The Landsat 8 TIRS images provide an effective and high spatial resolution data source to retrieve fine-scale SST data for coral reef habitats. Using Landsat 8 TIRS images, this study developed six SST inversion models using the RTM and SW algorithms for coral reef habitats. Accuracy evaluation at hot, cool, and mixed temperature conditions suggested that the SST6 model using the SW algorithm was the optimal model for all weather conditions. The RMSE between the SST6 inverted SST and the MODIS SST was approximately 0.64°C in the hot season (average SST >29°C). On the basis of the SST results retrieved by the SST6 model, we found that the SST patterns among geomorphic zones of coral reefs differed in time and space. In the hot season, the average SST usually presented the pattern of reef flat > lagoon > reef slope/offshore sea. The SST in the reef flat was usually approximately 0.05°C–0.2°C higher than that in the offshore sea, and the SST in the lagoon increased from south to north. The shallow lagoon was usually 0.1°C warmer than the deep lagoon in the hot season. During the cool season, the SST fluctuated markedly between different coral reefs and between geomorphic zones and did not induce cold stress on coral reefs in the study area.
This study provided a fine-scale SST inversion model and derived the SST pattern among geomorphic zones on coral reefs during the hot and cool seasons. The driving factors and the thermal stress intensity on fine-scale coral reef habitats need to be further investigated. We propose combining multiple influential factors to establish a fine-scale SST spatial model for real-time warning of coral bleaching, to better protect and restore coral reefs according to local conditions.
Statements
Data availability statement
The original contributions presented in the study are included in the article/Supplementary Material. Further inquiries can be directed to the corresponding authors.
Author contributions
X-LZ: Conceptualization, Formal Analysis, Investigation, Methodology, Project administration, Supervision, Writing – original draft, Writing – review & editing. K-FY: Writing – review & editing, Supervision. B-NQ: Formal Analysis, Methodology, Writing – original draft. X-PD: Formal analysis, Writing – review & editing. Z-FY: Conceptualization, Writing – review & editing, Supervision. F-ZS: Conceptualization, Investigation, Project administration, Writing – review & editing.
Funding
The author(s) declare financial support was received for the research, authorship, and/or publication of this article. This work was supported by the Guangxi Natural Science Foundation of China [grant number 2022GXNSFAA035548]; National Natural Science Foundation of China [grant numbers 42276182, 41801341, 42090041]; the Natural Science and Technology Innovation Development Doubling Program of Guangxi University [grant number 2023BZRC019]; the National Key Research and Development Program of China [Grant numbers 2022YFC3103105 and 2022YFC3103100].
Acknowledgments
We thank the USGS EarthExplorer for providing the Landsat 8 TIRS satellite products.
Conflict of interest
The authors declare that the research was conducted in the absence of any commercial or financial relationships that could be construed as a potential conflict of interest.
Publisher’s note
All claims expressed in this article are solely those of the authors and do not necessarily represent those of their affiliated organizations, or those of the publisher, the editors and the reviewers. Any product that may be evaluated in this article, or claim that may be made by its manufacturer, is not guaranteed or endorsed by the publisher.
Supplementary material
The Supplementary Material for this article can be found online at: https://www.frontiersin.org/articles/10.3389/fmars.2023.1293414/full#supplementary-material
References
1
Attamimi N. R. Saraswati R. (2019). Coral reefs degradation pattern and its exposure towards climate change in Bunaken National Park. GEOMATE J.17 (60), 170–175. doi: 10.21660/2019.60.8342
2
Bellwood D. R. Hughes T. P. Folke C. Nystrm M. (2004). Confronting the coral reef crisis. Nature429 (6994), 827–833. doi: 10.1038/nature02691
3
Caballero-Aragón H. Armenteros M. Perera-Valderrama S. et al . (2023). Wave exposure and temperature drive coral community structure at regional scale in the Cuban archipelago. Coral Reefs42 (1), 43–61. doi: 10.1007/s00338-022-02308-w
4
Coles S. L. Riegl B. M. (2013). Thermal tolerances of reef corals in the Gulf: A review of the potential for increasing coral survival and adaptation to climate change through assisted translocation. Mar. pollut. Bull.72 (2), 323–332. doi: 10.1016/j.marpolbul.2012.09.006
5
Dai C. F. (2006). “Dongsha atoll in the South China Sea: past, present, and future,” in Proceedings of the 10th Int.ernational Coral Reef Symposium. 1587–1592.
6
Davis K. A. Lentz S. J. Pineda J. Farrar J. T. Starczak V. R. Churchill J. H. (2011). Observations of the thermal environment on Red Sea platform reefs: a heat budget analysis. Coral Reefs30 (1), 25–36. doi: 10.1007/s00338-011-0740-8
7
DeCarlo T. Cohen A. Wong G. Davis K. A. Lohmann P. Soong K. (2017). Mass coral mortality under local amplification of 2 degrees ocean warming. Sci. Rep.7, 44586. doi: 10.1038/srep44586
8
Duan Z. (2022). Evaluation of coral reef ecological resistence in Xisha Islands based on remote sensing technology. (Nanning, China: Guangxi University)
9
Eakin C. M. Devotta D. Heron S. F. Connolly S. Liu G. Geiger E. et al . (2022). The 2014-17 global coral bleaching event: the most severe and widespread coral reef destruction. Biol. Sci. doi: 10.21203/rs.3.rs-1555992/v1. PREPRINT (Version 1) available at Research Square.
10
Falter J. L. Lowe R. J. Zhang Z. McCulloch M. (2013). Physical and biological controls on the carbonate chemistry of coral reef waters: effects of metabolism, wave forcing, sea level, and geomorphology. PloS One8 (1), e53303. doi: 10.1371/journal.pone.0053303
11
Falter J. L. Zhang Z. Lowe R. J. Mcgregor F. Mcculloch M. T. (2014). Assessing the drivers of spatial variation in thermal forcing across a nearshore reef system and implications for coral bleaching. Limnol. Oceanogr.59 (4), 1241–1255. doi: 10.4319/lo.2014.59.4.1241
12
Hereher M. Bantan R. Gheith A. El-Kenawy A. (2021). Spatio-temporal variability of sea surface temperatures in the Red Sea and their implications on Saudi Arabia coral reefs. Geocarto Int.37, 5636–5652. doi: 10.1080/10106049.2021.1922513
13
Jaelani L. M. Alfatinah A. (2017). Sea surface temperature mapping at medium scale using Landsat 8 TIRS satellite image. IPTEK J. Proc. Ser.3 (6), 582–587. doi: 10.12962/j23546026.y2017i6.3307
14
Jang J. C. Park K. A. (2019). High-resolution sea surface temperature retrieval from Landsat 8 OLI/TIRS data at coastal regions. Remote Sens.11 (22), 2687. doi: 10.3390/rs11222687
15
Jokiel P. L. Brown E. K. (2004). Global warming, regional trends and inshore environmental conditions influence coral bleaching in Hawaii. Global Change Biol.10 (10), 1627–1641. doi: 10.1111/j.1365-2486.2004.00836.x
16
Kang S. H. Choi Y. Choi J. Y. (2021). Restoration of missing patterns on satellite infrared sea surface temperature images due to cloud coverage using Deep Generative Inpainting Network. J. Mar. Sci. Eng.9 (3), 310. doi: 10.3390/jmse9030310
17
Kumar T. T. A. Balasubramanian T. (2012). “Bleaching of corals in Agatti-lakshadweep, India: a Window View,” in Proceedings of 12th International Coral Reef Symposium, Cairns, Australia. 2012
18
Lamaro A. A. Marinelarena A. Torrusio S. E. Sala S. E. (2013). Water surface temperature estimation from Landsat 7 ETM+ thermal infrared data using the generalized single-channel method: Case study of Embalse del Río Tercero (Córdoba, Argentina). Adv. Space Res.51 (3), 492–500. doi: 10.1016/j.asr.2012.09.032
19
Leahy S. M. Kingsford M. J. Steinberg C. R. (2013). Do clouds save the Great Barrier Reef? Satellite Imagery Elucidates the Cloud-SST Relationship at the Local Scale. PloS One8 (7), e70400. doi: 10.1371/journal.pone.0070400
20
Li A. Reidenbach M. A. (2014). Forecasting decadal changes in sea surface temperatures and coral bleaching within a Caribbean coral reef. Coral Reefs33 (3), 847–861. doi: 10.1007/s00338-014-1162-1
21
Liu G. Heron S. Eakin C. Muller-Karger F. Vega-Rodriguez M. Guild L. et al . (2014). Reef-scale thermal stress monitoring of coral ecosystems: new 5-km global products from NOAA Coral Reef Watch. Remote Sens.6 (11), 11579–11606. doi: 10.3390/rs61111579
22
Liu M. Yin X. Xu Q. Chen Y. Wang B. (2020). Monitoring of fine-scale warm drain-off water from nuclear power stations in the Daya Bay based on Landsat 8 data. Remote Sens.12 (4), 627. doi: 10.3390/rs12040627
23
Lowe R. J. Falter J. L. Monismith S. G. Atkinson M. J. (2009). A numerical study of circulation in a coastal reef-lagoon system. J. Geophys. Res.: Oceans. 14(C6), C06022. doi: 10.1029/2008JC005081
24
Lowe R. J. Hart C. Pattiaratchi C. B. (2010). Morphological constraints to wave-driven circulation in coastal reef-lagoon systems: A numerical study. J. Geophys. Res. Oceans115, C09021. doi: 10.1029/2009JC005753
25
Maina J. Kithiia J. Cinner J. Neale E. Noble S. Charles D. et al . (2016). Integrating social–ecological vulnerability assessments with climate forecasts to improve local climate adaptation planning for coral reef fisheries in Papua New Guinea. Regional Environ. Change16 (3), 881–891. doi: 10.1007/s10113-015-0807-0
26
Mcmillin L. M. (1980). The split window retrieval algorithms for sea surface temperature derived from satellite measurements. Remote Sens. Atmos. Oceans, 437–455. doi: 10.1016/B978-0-12-208460-7.50022-4
27
Montanaro M. Gerace A. Lunsford A. Reuter D. (2014). Stray light artifacts in imagery from the Landsat 8 Thermal Infrared Sensor. Remote Sens.6 (11), 10435–10456. doi: 10.3390/rs61110435
28
Morton B. Blackmore G. (2001). South China Sea. Mar. pollut. Bull.42, 1236–1263. doi: 10.1016/S0025-326X(01)00240-5
29
Pan X. Li Z. Gu X. Zhao L. Yu T. Meng Q. et al . (2014). Sea water temperature retrieval model for Daya Bay based on HJ-1B thermal infrared remote sensing data and its application. Remote Sens. Land Resour.26 (1), 132–138. doi: 10.6046/gtzyyg.2014.01.23
30
Pang J. Z. Ren G.-B. Shi Q. Zhu H. Hu Y. Dong J. et al . (2021). Analysis of coral reef bleaching in Yongle Islands of Xisha from 2005 to 2018 based on sediment types change monitoring. Mar. Sci.45 (6), 92–106. doi: 10.11759/hykx20200729002
31
Qin B. Yu K. Zuo X. (2023). Study of the bleaching alert capability of the CRW and CoRTAD coral bleaching heat stress products in China’s coral reefs. Mar. Environ. Res.186, 105939. doi: 10.1016/j.marenvres.2023.105939
32
Qin H. Chen G. Wang W. Wang D. Zeng L. (2014). Validation and application of MODIS-derived SST in the South China Sea. Int. J. Remote Sens.35 (11-12), 4315–4328. doi: 10.1080/01431161.2014.916439
33
Rajput P. Ramakrishnan R. (2021). “Investigating the temporal variability of sea surface temperature over the enclosed water bodies of coral reef lagoon at Lakshadweep Islands,” in 2021 IEEE International India Geoscience and Remote Sensing Symposium (InGARSS). 448–452. doi: 10.1109/InGARSS51564.2021.9791943
34
Safaie A. Silbiger N. J. Mcclanahan T. R. Pawlak G. Barshis D. J. Hench J. L. et al . (2018). High frequency temperature variability reduces the risk of coral bleaching. Nat. Commun.9 (1), 1671. doi: 10.1038/s41467-018-04074-2
35
Simon R. N. Tormos T. Danis P. A. (2014). Retrieving water surface temperature from archive LANDSAT thermal infrared data: Application of the mono-channel atmospheric correction algorithm over two freshwater reservoirs. Int. J. Appl. Earth Observ. Geoinform.30, 247–250. doi: 10.1016/j.jag.2014.01.005
36
Skirving W. J. Heron S. F. Marsh B. L. Liu G. Cour J. L. D. L. (2019). The relentless march of mass coral bleaching: a global perspective of changing heat stress. Coral Reefs38, 547–557. doi: 10.1007/s00338-019-01799-4
37
Sun F. Yang H. Shi Q. Wang G. (2022). Changes in coral bacterial communities during a natural bleaching event linked to El Niño in the South China Sea. Regional Stud. Mar. Sci.53, 102383. doi: 10.1016/j.rsma.2022.102383
38
Thinesh T. Meenatchi R. Jose P. A. Kiran G. S. Selvin J. (2019). Differential bleaching and recovery pattern of southeast Indian coral reef to 2016 global mass bleaching event: Occurrence of stress-tolerant symbiont Durusdinium (Clade D) in corals of Palk Bay. Mar. pollut. Bull.145, 287–294. doi: 10.1016/j.marpolbul.2019.05.033
39
Tkachenko K. S. Russ J. (2014). The influence of repetitive thermal stresses on the dominance of reef-building Acropora spp. (Scleractinia) on coral reefs of the Maldive Islands. Russian J. Mar. Biol.40, 286–294. doi: 10.1134/S1063074014040105
40
Van Wynsberge S. V. Gendre R. L. Sangare N. Aucan J. Andréfout S. (2020). Monitoring pearl farming lagoon temperature with global high resolution satellite-derived products: An evaluation using Raroia Atoll, French Polynesia. Mar. pollut. Bull.160, 111576. doi: 10.1016/j.marpolbul.2020.111576
41
Xing X. Liu Y. Dong W. . (2015). “An algorithm to inverse sea surface temperatures at offshore water by employing Landsat 8/TIRS Data,” in 36th Asian Conference on Remote Sensing. 4504–4511.
42
Xu H. (2015). Retrieval of the reflectance and land surface temperature of the newly-launched Landsat 8 satellite. Chin. J. Geophys.58 (3), 741–747. doi: 10.6038/cjg20150304
43
Zhang Y. Chen H. Chen Y. (2015). Comparative study on sea surface temperature retrieval methods of Hongyanhe Nuclear Power Plant based on Landsat-8/TIRS. Spacecraft Recovery & Remote Sensing36 (5), 96–104. doi: 10.3969/j.issn.1009-8518.2015.05.012
44
Zhang Z. Falter J. Lowe R. Ivey G. McCulloch M. (2013). Atmospheric forcing intensifies the effects of regional ocean warming on reef-scale temperature anomalies during a coral bleaching event. J. Geophys. Res. Oceans118 (9), 4600–4616. doi: 10.1002/jgrc.20338
45
Zhu Z. Wang S. Woodcock C. E. (2015). Improvement and expansion of the Fmask algorithm: Cloud, cloud shadow, and snow detection for Landsats 4-7, 8, and Sentinel 2 images. Remote Sens. Environ.159, 269–277. doi: 10.1016/j.rse.2014.12.014
46
Zuo X. SU F. WU W. Chen Z. Shi W. (2015). Spatial and temporal variability of thermal stress to China′s coral reefs in South China Sea. Chin. Geogr. Sci.25, 159–173. doi: 10.1007/s11769-015-0741-6
47
Zuo X. Su F. Zhao H. Zhang J. Wang Q. Wu D. (2017). Regional hard coral distribution within geomorphic and reef flat ecological zones determined by satellite imagery of the Xisha Islands, South China Sea. Chin. J. Oceanol. Limnol.35 (3), 501–514. doi: 10.1007/s00343-017-5336-x
48
Zuo X. Su F. Zhao H. Fang Y. Yang J. (2018). Development of a geomorphic classification scheme for coral reefs in the South China Sea based on high-resolution satellite images. Prog. Geogr.37 (11), 1463–1472. doi: 10.1007/10.18306/dlkxjz.2018.11.003
Summary
Keywords
coral reef, Landsat 8 TIRS, SST, remote sensing, Xisha Islands, fine-scale
Citation
Zuo X-L, Yu K-F, Qin B-N, Duan X-P, Yao Z-F and Su F-Z (2023) Deriving fine-scale patterns of sea surface temperature in coral reef habitats using the Landsat 8 thermal infrared sensor. Front. Mar. Sci. 10:1293414. doi: 10.3389/fmars.2023.1293414
Received
13 September 2023
Accepted
23 October 2023
Published
03 November 2023
Volume
10 - 2023
Edited by
Mingming Jia, Chinese Academy of Sciences (CAS), China
Reviewed by
Qi Wang, Shandong Jianzhu University, China; Bo Ping, Tianjin University, China
Updates
Copyright
© 2023 Zuo, Yu, Qin, Duan, Yao and Su.
This is an open-access article distributed under the terms of the Creative Commons Attribution License (CC BY). The use, distribution or reproduction in other forums is permitted, provided the original author(s) and the copyright owner(s) are credited and that the original publication in this journal is cited, in accordance with accepted academic practice. No use, distribution or reproduction is permitted which does not comply with these terms.
*Correspondence: Zuo-Fang Yao, zfyao@gxu.edu.cn; Fen-Zhen Su, sufz@lreis.ac.cn
Disclaimer
All claims expressed in this article are solely those of the authors and do not necessarily represent those of their affiliated organizations, or those of the publisher, the editors and the reviewers. Any product that may be evaluated in this article or claim that may be made by its manufacturer is not guaranteed or endorsed by the publisher.