Abstract
Ocean-based industries like shipping, aquaculture, and wind energy are growing at an unprecedented rate resulting in challenges related to siting and environmental management. As marine aquaculture and other ocean-based industries continue to expand, robust marine spatial planning analyses that reconcile existing ocean uses and integrate pertinent environmental and planning data are critical for identifying compatible locations. In this study, a series of geospatial analyses were used for aquaculture siting within and around a heavily trafficked and highly utilized maritime port in the San Diego Bay area of California, USA. Using a centralized geodatabase representing key aquaculture planning spatial datasets, recommendations for specific areas for aquaculture were developed based on appropriate environmental conditions for candidate shellfish and algae aquaculture species culture systems. Areas that were known constraints were first identified to determine potentially usable areas for shellfish and macroalgae (i.e., seaweed) aquaculture using an exclusion analysis, a type of multi-criteria decision analysis, to eliminate all areas without compatibility. Within the remaining usable area, we further considered shellfish and macroalgae culture system-specific factors within a ‘culture systems analysis’ to determine where different culture systems have potential for success. This analysis provides a foundation of coastal intelligence for guiding the aquaculture industry and natural resource managers towards appropriate siting decisions. This study can serve as a replicable example of aquaculture spatial planning approaches for siting sustainable aquaculture and other blue economy industries.
Introduction
Globally, the coastal ocean encompasses a broad range of sensitive and complex ecosystems (e.g., estuaries, coral reefs, rocky shores, mangrove forests) providing habitat to a diverse array of species. These same waters provide transportation of goods and services, food, jobs, and recreation for millions of people (National Oceanic and Atmospheric Administration (NOAA), 2023). Anthropogenic activities within the coastal ocean can lead to many unintended consequences. Therefore, planning for anticipated uses can aid in avoiding or minimizing any negative impacts. Aquaculture is one growing coastal ocean use that can result in negative environmental impacts unless appropriate marine spatial planning is conducted and tradeoffs are assessed (Gentry et al., 2016; Theuerkauf et al., 2021).
Planning and siting for marine aquaculture operations requires thorough synthesis and spatial analyses of critical environmental data and ocean space use conflicts (Kapetsky et al., 2013). To determine where suitable space does exist, planning at various spatial and temporal scales is required to minimize user conflicts and ensure compatibility of aquaculture within an ecosystem and with other industries. To this end, marine spatial planning (MSP), a data-driven approach to identify areas where space-use conflicts and adverse environmental interactions can be minimized and mitigated, is often used, and typically requires use of geographic information systems (GIS) (Ehler, 2018).
Here we demonstrate how a specific MSP approach, multi-criteria decision analysis (MCDA), provides reconnaissance level information for marine industries, reducing interactions with current ocean uses and sensitive habitats. We use a maritime port authority as a demonstration study area for shellfish and macroalgae aquaculture foundational planning. Marine ports were the focus of the present case study as they play a unique and ubiquitous role in the coastal oceans worldwide, serving as operators, regulators, and environmental stewards overseeing large intertidal and marine offshore areas. Worldwide, ports are well-poised to substantially contribute to the development, benefits, and operations of aquaculture—potentially contributing to seafood production, development of biomass for end uses such as biofuel production (e.g., macroalgae), and delivery of ecosystem services (e.g., nutrient removal, habitat for important fish and invertebrate species) to support ecosystem recovery goals, amongst others (Alleway et al., 2019; Gentry et al., 2020; Chopin and Tacon, 2021).
As with global initiatives, along the United States’ (U.S.) Pacific coastline in the southern portion of the state of California, initiatives supporting aquaculture development are occurring in multiple maritime ports, including the Humboldt Bay Harbor, Recreation, and Conservation District (Humboldt Bay Harbor Recreation and Conservation District (HBHRCD), 2022), Ports of Los Angeles (AltaSea, 2023), Ventura (Ventura Port District, 2023), and San Diego (Port of San Diego (PSD), 2022). The Port of San Diego (hereafter “The Port”) is less than 10 km (6 mi) from the U.S./Mexico international border. It owns and manages the waterfront along San Diego Bay (hereafter ‘the Bay’) with jurisdiction over 4,775 ha of tideland waters, 971 ha of tideland lands, and has developed innovative approaches to facilitate environmentally sustainable management of these areas. The Port is bustling with military, commercial, and recreational traffic, ranking as one of the US’ top 30 containership ports, with an annual cargo shipping volume of 2.7 million metric tons. In recent years, the Port has supported specific initiatives to develop sustainable aquaculture within its jurisdictional boundaries.
This study extends beyond previous work that has primarily focused on use of MSP tools to avoid space-use or natural resource conflicts by incorporating a broad range of spatial criteria focused on where shellfish and macroalgae aquaculture operations have potential for success. We aimed to develop a geospatial methodology for determining specific locations and the total available area for gear and species-specific aquaculture development (i.e., meeting requirements for specific gear types and associated culturable species known to occupy the area). Employing both an ‘exclusion analysis’ and a ‘culture systems analysis,’ we account for spatial use constraints, gear thresholds, and oceanographic factors that may limit aquaculture gear and cultivation potential and identify those locations where specific aquaculture types have potential for success.
Methods
Defining the project spatial requirements and study area
San Diego Bay is located along California’s coastline with the Pacific Ocean in the southern California Bight. The Bay is a natural embayment that has been modified over time by dredging and filling operations beginning in the early 1900s. This crescent-shaped bay is 23 km long and bordered by two peninsulas separated at the mouth by about 600 m. The Bay has a variable width ranging from 0.3 to 5.8 km and covers over 49 km2 of water and land (Stransky et al., 2016). The Bay provides extensive shallow water eelgrass habitat that supports unique assemblages of fishes, as well as important nursery habitat for juvenile fishes (Pondella and Williams, 2009). The study area (Figure 1) was confined to California state waters (i.e., within 5.56 km of shore) and is 203 km² in area. The initial study area was defined in ArcPro 3.0.3 (Esri, 2022) using a polygon shapefile that was bordered by the eastern shore of the Bay, the US Exclusive Economic Zone border to the south, the federal/state waters boundary to the west (as defined by the US Submerged Lands Act), and the northern-most tip of the Bay at Point Loma (Figure 1). Bathymetry was analyzed using the San Diego, California 1/3 Arc-second Mean High Water (MHW) Coastal Digital Elevation Model (National Centers for Environmental Information (NCEI), 2012) and ranged from 0 m in the southern portion of the Bay, to 84 m in the deepest portion of the ocean side of the study area. Due to major differences in oceanographic data and oceanographic conditions inside and outside of the Bay area, we subdivided the Bay area into the estuarine area and ocean area for modeling purposes (Figure 1).
Figure 1
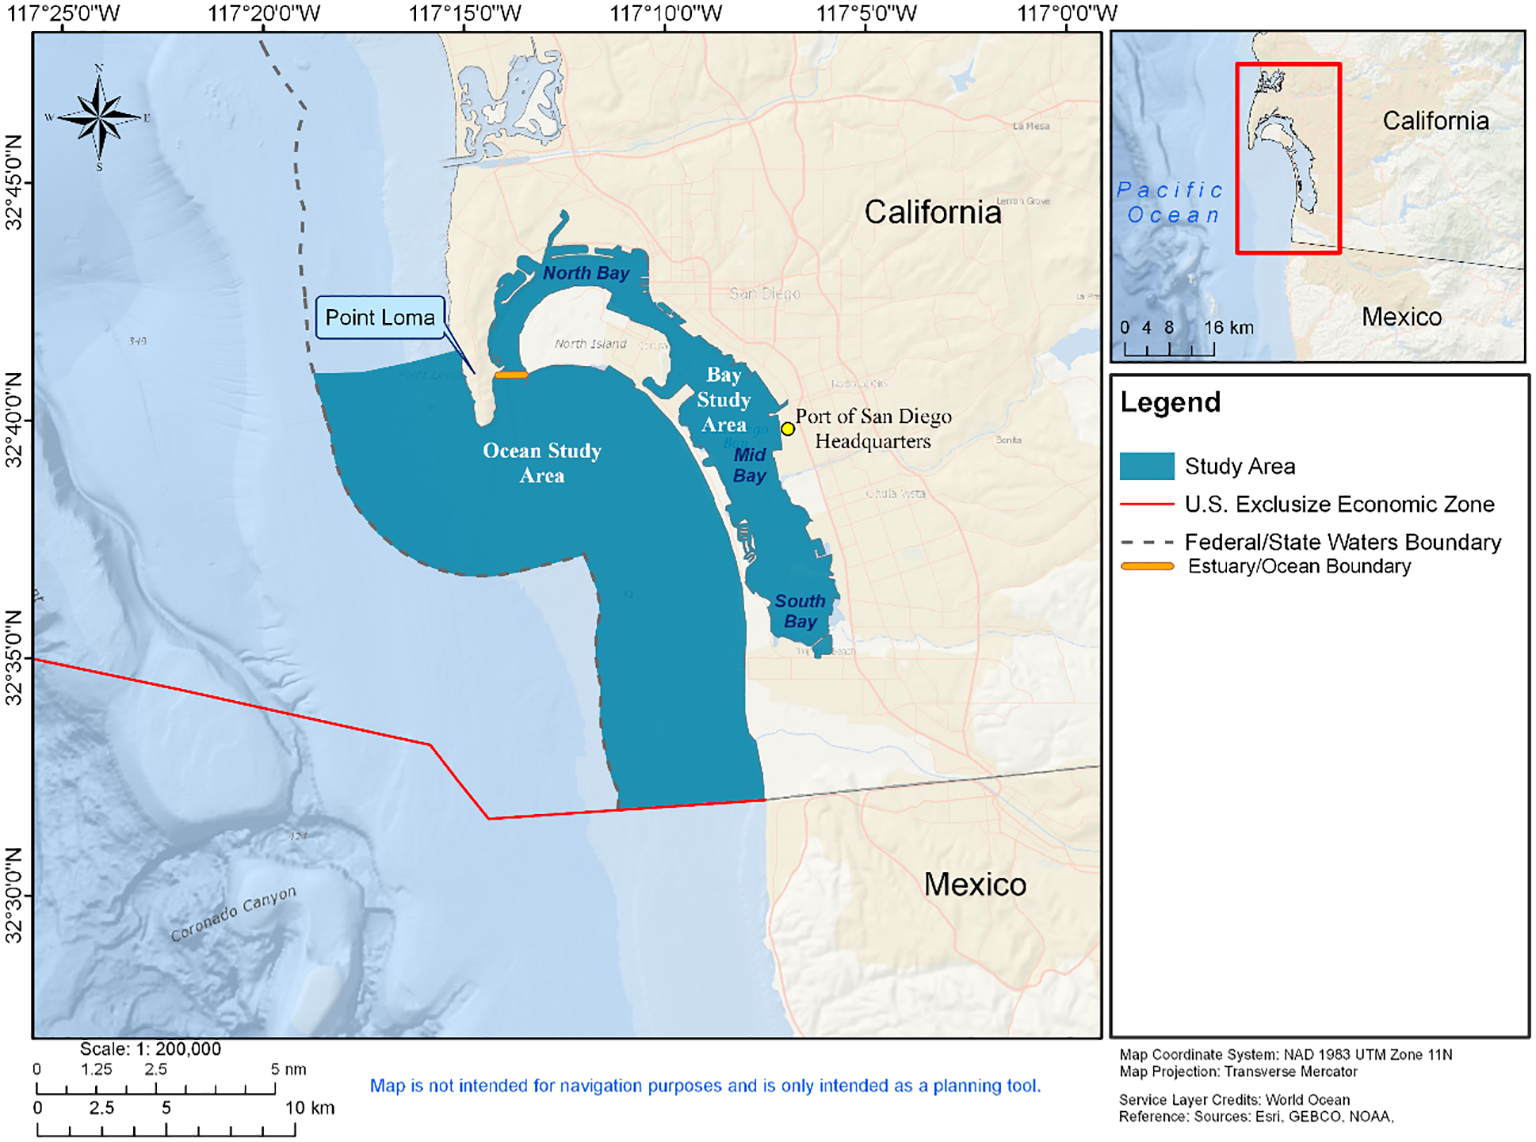
Study area for the San Diego Bay aquaculture opportunity analysis. The study area was defined to the east by the eastern shore of the Bay, to the south by the US Exclusive Economic Zone (red line), to the west by the federal/state waters boundary (as defined by the Submerged Lands Act; gray dotted line), and to the northern-most tip of the Bay at Point Loma.
Marine aquaculture spatial planning workflow
Regardless of the complexity or scale of the aquaculture objective, planning for aquaculture siting and development requires integration of spatially explicit information to characterize and identify suitable areas for aquaculture, and to minimize impacts to other existing ocean uses and the environment (Wever et al., 2015; Kelly et al., 2017; Voyer and van Leeuwen, 2019). Spatial planning processes often follow a standard workflow, including: 1) identification of the planning objective, 2) development of a data inventory 3) geospatial analysis of data (e.g., exclusion and culture system analysis), 4) interpretation of results and further characterization, and 5) description of overall conclusions, limitations, and caveats associated with the study (Stelzenmüller et al., 2017; Lester et al., 2018). Spatial data are utilized to represent known or potential environmental and ocean space use conflicts that could constrain, or conditionally constrain, the siting of aquaculture activities. Using a multi-criteria decision analysis (MCDA) approach allows for evaluation of numerous spatial data types for a location and provides a relative comparison of suitability for marine aquaculture (Longdill et al., 2008).
Data acquisition, inventory, and screening
Geospatial analysis and MSP require the acquisition and balanced consideration of multiple, often disparate datasets (Longdill et al., 2008). Acquisition of best available spatial data that represent key factors (e.g., vessel traffic, sensitive habitats) are essential underpinnings of spatial analysis success (Molina et al., 2013). Data categorization and schemas are often used to organize relationships among groups of data for suitability modeling. Within this study, data categorization was implemented according to Lightsom et al. (2015), where categories are defined specifically for marine planning. A comprehensive spatial data inventory was developed including data layers relevant to administrative boundaries, national security (i.e., military), navigation and transportation, industry infrastructure, natural and cultural resources, and oceanography and water quality (i.e., non-living resources). The data categorization framework utilized in this study ensured all relevant, available data needed for exclusion and subsequent culture system analysis, a specific type of ocean planning, were included.
Data were evaluated for completeness and quality, and the most authoritative, recent sources were used. All data were projected, and calculations performed using Universal Transverse Mercator (UTM) NAD 1983 Zone 11N (EPSG:26911). See Supplementary Information, Appendix A for the complete data inventory generated for the spatial planning analysis. After all necessary data were obtained, each dataset was reviewed to determine if a data layer was a true constraint for aquaculture infrastructure within the exclusion analysis approach. Within this step, locations corresponding with geospatial data associated with major constraining factors (e.g., military danger and restricted areas) were removed from further spatial planning consideration and are not included within the subsequent culture systems analysis.
Modeling framework
A culture system analysis, using the MCDA approach, was performed to identify areas constrained by known ocean uses, and areas in and around the Bay where opportunity for aquaculture gear and associated species may exist. Spatial data layers with no compatibility with aquaculture development (e.g., shipping fairways) were captured in the list of incompatible areas and removed using the Erase tool in ArcPro 3.0.3 (Esri, 2022) during an exclusion analysis (Table 1). Once all known incompatible areas were excluded from the study area using an ‘exclusion analysis,’ a ‘culture systems analysis’ for each gear and species combination was performed. The output of these analyses identified areas where potential exists for successful development of various shellfish or macroalgae (i.e., seaweed) aquaculture activities.
Table 1
| Constraint | Type |
|---|---|
| Wastewater Treatment Discharge structures (100-m setback) | Industry |
| Pipeline and Cables Areas | Industry |
| Unexploded Ordnance Areas | Military |
| Water Drop Zones | Military |
| Military Ranges | Military |
| Detonation Areas | Military |
| Mine Warfare Areas | Military |
| Anchorage Areas* | Military |
| Military Training Areas | Military |
| Search and Rescue Areas | Military |
| Active Test Areas | Military |
| Danger Zones and Restricted Areas | Military |
| State Parks | Natural & Cultural Resources |
| Seagrass Distribution (1999 - 2019) | Natural & Cultural Resources |
| Hardbottom Habitat | Natural & Cultural Resources |
| Pacific Green Sea Turtle Home Range*** | Natural & Cultural Resources |
| Kelp Canopy (1989 - 2014) (25-m setback) | Natural & Cultural Resources |
| Moorings and Docks** | Navigation & Transportation |
| Marinas | Navigation & Transportation |
| Slips | Navigation & Transportation |
| ENC and AWOIS shipwrecks (152.4-m setback) | Navigation & Transportation |
| Coronado Ferry Route (50-m setback) | Navigation & Transportation |
| High-density Traffic Area (AIS derived layer) | Navigation & Transportation |
| Coastal Maintained Channels | Navigation & Transportation |
| Anchorage Areas | Navigation & Transportation |
| Water Quality Monitoring Stations (500-m setback) | Water Quality |
| Regional Harbor Monitoring Program Stations (500 -m setback) |
Water Quality |
Constraint variables (i.e., data layers = 0) removed from the study area.
*Some military areas were considered conditionally constrained based on various multi-party blue economy initiatives and conversations on future use.
** Setback distance was calculated for total perimeter for each dock polygon, in meters, was divided by the number of mooring faces, and this value was assigned to the buffer distance size for each polygon. The resulting buffer areas scale with the expected size of a vessel at each dock, accounting for the differing footprint of use based on vessel size.
***Calculated from McDonald et al. (2012) estimation of known home ranges. The high-density area was used as an exclusion layer.
Data layers with no overlap with study area were not considered.
Exclusion analysis
The exclusion analysis, a binary analysis (i.e., 0 = incompatible to gear placement; 1 = compatible to gear placement) using a GIS was used to remove areas where ocean use activities restrict aquaculture activities (i.e., restriction ruling out variables as feasible solutions) (Malczewski, 2006). The study area polygon had each data layer in Table 1 removed from it using the Erase Tool in ArcGIS Pro 3.0.3 (Esri, 2022). Thus, all area that remained could potentially be compatible with aquaculture and was further explored within the ‘culture systems analysis’.
Some exclusion data layers were created, including a high vessel traffic layer and a dock/pier exclusion layer. Vessel traffic data (i.e., Automated Identification System data from 2018, 2019) were also used by first determining quantiles of the numeric distribution, and then formulating a categorical layer for the areas where the upper quantile of distribution (i.e., consistently high vessel traffic) were determined. Data for all vessel types and then specifically less maneuverable vessels (cargo, tanker vessels) were analyzed, and areas where the highest density of vessel traffic occurred (top quantile) into and out of the Bay were digitized and used as a constraint layer. Also, any structures that were over land that had not already been considered in the exclusion analysis were removed based on 2020 aerial imagery (OCM Partners, 2022). For instance, the Zuniga Point jetty, sea walls, the salt ponds associated with South Bay Salt Works, and the San Diego Bay National Wildlife Refuge were all examined or digitized from aerial imagery. Lastly, a manual removal process was executed on the remaining area to remove any areas less than 2.02 ha (5 ac) (i.e., the minimum size established for an aquaculture pilot study).
Culture systems analysis
Once known constrained areas were removed from the study area, a shellfish and macroalgae culture systems analysis was performed on the remaining area. This analysis examined and identified areas suitable for numerous, varying culture gear types and parameters through assessment of constraints (e.g., depth, water temperature, water current speed). The culture systems analysis was more spatially focused on areas with potential feasibility for future aquaculture infrastructure development. After obtaining a list of possible candidate aquaculture species from the Port, gear types associated with each possible species (i.e., culture systems) were identified (Table 2). Sixteen different candidate species (twelve species of shellfish and four species of macroalgae) (Table 3) and sixteen associated gear types were examined within and around the Bay in the culture system analysis. For each proposed candidate species, salinity, water temperature, and current speed minimum and maximum threshold tolerances were established from both literature and local manager’s knowledge (Table 3) (Leighton, 1979; Newell, 1989; Hobday, 2000; Wasson et al., 2014; Food and Agricultural Organization – United Nations (FAO), 2018). For relative comparison of species’ salinity and temperature thresholds, climatologies (i.e., ca. 20-year period) from NASA MODIS and HYCOM + NCODA were used to determine if thresholds were ever exceeded. Within the Bay, three oceanographic buoy stations were deployed for a short period (April 2010 to October 2011) indicating temperature ranged from 12 – 24°C and salinity ranged from 32- 36. For current speed the NOAA 2 km high-frequency radar data was used to determine if exceedances of thresholds occurred. Parameterization of culture systems, specifically the gear specifications, was completed through an extensive literature review, acquisition of expert engineering perspectives, and industry documentation. Through this process, each culture system was given generalized definitions according to current aquaculture and ocean engineering practitioners (Personal Communication, Matthew Campbell; Personal Communication, K. Barry King; March 25, 2022) (Tables 4, 5).
Table 2
| Gear Type | Associated Species (Common Name) | Genus species | General Type of Aquaculture |
|---|---|---|---|
| Floating Bags | Olympia oyster, Pacific oyster | Ostrea lurida, Crassostrea gigas | Shellfish - estuary |
| Floating Cages | Olympia oyster, Pacific oyster | Ostrea lurida, Crassostrea gigas | Shellfish- estuary |
| Supported Cages | Olympia oyster, Pacific oyster | Ostrea lurida, Crassostrea gigas | Shellfish- estuary |
| Stakes | Olympia oyster, Pacific oyster | Ostrea lurida, Crassostrea gigas | Shellfish- estuary |
| Rack and Bag | Olympia oyster, Pacific oyster | Ostrea lurida, Crassostrea gigas | Shellfish- estuary |
| Hanging Basket | Olympia oyster, Pacific oyster | Ostrea lurida, Crassostrea gigas | Shellfish- estuary |
| Horizontal Longline | Baywide Mytilus mussel complex | Mytilus spp. and their hybrids | Shellfish - ocean |
| Raft Culture | Baywide Mytilus mussel complex | Mytilus spp. and their hybrids | Shellfish - estuary |
| In-bottom | Geoduck clam | Panopea generosa | Shellfish - estuary |
| Covered In-bottom | Manila clam | Venerupis philippinarum | Shellfish - estuary |
| Lantern Cages | Black abalone | Haliotis cracherodii | Shellfish - estuary |
| Green abalone | Haliotis fulgens | Shellfish - estuary | |
| Pink abalone | Haliotis corrugata | Shellfish - estuary | |
| Red abalone | Haliotis rufescens | Shellfish - estuary | |
| White abalone | Haliotis sorenseni | Shellfish - estuary | |
| Giant keyhole limpet | Megathura crenulata | Shellfish - estuary | |
| Lantern Cages, Hanging Baskets | Purple hinge rock scallop | Crassadoma gigantea (Hinnites giganteus) | Shellfish - estuary |
| Substrate Nets, Line cultivation | Red ogo | Gracilaria pacifica | Macroalgae - estuary |
| Substrate Nets, Line cultivation | Red algae | Gracilariopsis spp. | Macroalgae - estuary |
| Substrate Nets, Line cultivation | Green algae | Ulva lactuca | Macroalgae - estuary |
| Line Cultivation, Seabed cultivation | Giant kelp | Macrocystis pyrifera | Macroalgae - ocean |
Gear types characterized for the opportunity analysis, associated species generally grown with those gear types, and general type (i.e., shellfish, macroalgae).
Table 3
| Common Name | Scientific Name | Temp Min (C) | Temp Max (C) | Current Min (m/s) | Current Max (m/s) | Salinity Min | Salinity Max |
|---|---|---|---|---|---|---|---|
| Pacific Oyster | Crassostrea gigas | 8.0 | 40.0 | 0.1 | 1.0 | 25.0 | 35.0 |
| Olympia Oysters | Ostrea lurida | 6.0 | 38.0 | 0.1 | 1.0 | 25.0 | 40.0 |
| Blue Mussel | Mytilus edulis | 5.0 | 20.0 | 0.1 | 0.2 | 13.0 | 35.0 |
| Mediterranean Mussel | Mytilus galloprovincialis | 10.0 | 17.0 | 0.1 | 0.2 | 13.0 | 37.0 |
| San Diego Bay Mussel Species Complex (*) | M. edulis, M. galloprovincialis, M. trossulus, and their hybrids | 5.0 | 20.0 | 0.1 | 0.2 | 13.0 | 35.0 |
| Manila Clam | Venerupis philippinarum (R. philippinarum) | 5.0 | 28.0 | 0.2 | 1.0 | 14.0 | 35.0 |
| Geoduck Clam | Panopea generosa | 8.0 | 19.0 | 0.1 | 0.8 | 26.0 | 34.0 |
| Giant Keyhole Limpet | Megathura crenulata | 11.0 | 26.0 | 0.0 | 4.0 | 30.0 | 36.0 |
| Purple Hinge Scallop | Crassadoma gigantea (Hinnites giganteus) | 14.0 | 22.0 | 0.0 | 0.1 | 14.0 | 40.0 |
| Red Abalone | Haliotis rufescens | 14.0 | 18.0 | 0.0 | 4.0 | 27.0 | 40.0 |
| Pink Abalone | Haliotis corrugata | 18.0 | 24.0 | 0.0 | 4.0 | 27.0 | 35.0 |
| Green Abalone | Haliotis fulgens | 18.0 | 24.0 | 0.0 | 4.0 | 27.0 | 35.0 |
| White Abalone | Haliotis sorenseni | 18.0 | 22.0 | 0.0 | 4.0 | 27.0 | 35.0 |
| Black Abalone | Haliotis cracherodii | 14.0 | 18.0 | 0.0 | 4.0 | 27.0 | 35.0 |
| Red Ogo | Gracilaria pacifica | 13.0 | 34.0 | 0.1 | 0.5 | 20.0 | 40.0 |
| Red Algae | Gracilariopsis spp. | 20.0 | 30.0 | 0.1 | 0.5 | 25.0 | 40.0 |
| Giant Kelp | Macrocystis pyrifera | 5.0 | 21.0 | 0.2 | 3.0 | 15.0 | 33.0 |
| Green Algae | Ulva lactuca | 12.3 | 26.0 | 0.1 | 0.3 | 20.0 | 40.0 |
Literature (Leighton, 1979; Newell, 1989; Hobday, 2000; Wasson et al., 2014; Food and Agricultural Organization – United Nations (FAO), 2018) and regional manager derived values for culture species modeled in this study including requirements for temperature, salinity, and current speed (i.e., minimum and maximum thresholds) included in the study.
(*) The Port intends to culture mussels from broodstock collected from within San Diego Bay. We refer to this as the Bay Mussel Species Complex, which consists of Mytilus edulis, M. galloprovincialis, M. trossulus, and their hybrids. Environmental tolerances were based on those reported for blue mussels (M. edulis).
Table 4
| Category | Gear Type | Definition |
|---|---|---|
| Bottom | Cultch Planting | Distribution of suitable substrate (i.e., cultch) on the seabed to encourage oyster recruitment. |
| Bottom | In-bottom Culture | Bivalve species planted within the intertidal or subtidal zone. Predator exclusion materials may be used to cover shellfish beds. |
| Bottom | On-bottom Culture | Shellfish bottom culture practices that include distribution of oyster seed on the bottom or shellfish containment systems that may extend to an elevation of 0.61 m above the seabed (e.g., bottom cages, rack and bag, intertidal oyster longline) |
| Off-Bottom | Floating Bag System | Shellfish are grown in high-density polyethylene (i.e., rigid plastic) mesh bags that are supported by floats. Bags are tethered to a main line that is anchored at each end. Bags are semi-submerged in the water to allow oysters to feed. To control biofouling, bags are flipped to allow for air drying and ultraviolet light exposure. Floating bag systems may be sited within shallow waters to allow personnel to access the farm in water, or they may be sited in deeper waters which require service by boat. |
| Off-Bottom | Floating Cage System | Shellfish are grown in high-density polyethylene (i.e., rigid plastic) mesh bags that are housed in a large floating cage system. Cages may have up to six compartments for mesh bags. Cages are supported by large floats or pontoons that allow suspension of oysters in the water column. Cages are tethered together and anchored at each end. Despite their large size, cages are flipped to allow for air drying and ultraviolet light exposure, which provides some control of biofouling. Floating cages systems may be sited within shallow waters to allow personnel to access the farm in water, but more commonly they are sited in deeper waters and serviced by boat. |
| Off-Bottom | Hanging Basket | Shellfish are grown in high-density polyethylene (i.e., rigid plastic) mesh baskets that hang along an adjustable longline system. The system is constructed of a tensioned monofilament line strung between posts in the intertidal zone. Lines can be adjusted for optimal positioning of the basket within the water column and to allow for air drying and ultraviolet light exposure to provide control of biofouling. |
| Off-Bottom | Lantern Nets and Hanging Cages | Suspended net systems that extend through the water column that are often used for the culture of oysters and scallops. Lantern nets are easily transported because they are light in weight and collapsible, whereas hanging cages are rigid. Both lantern nets and hanging cages come in a variety of mesh sizes, heights (number of tiers), and shapes (round or square). They are suspended by a longline system that may be submerged below the surface to allow vessel traffic and safe navigation over the farm. |
| Off-Bottom | Raft culture | A floating raft structure typically used for the culture of mussels. The raft consists of a framework from which seed collectors or growing ropes are suspended. Each raft is securely anchored to the seabed. |
| Off-Bottom | Horizontal Longlines | Mussel farms that utilize longline technology can occur in offshore or inshore locations, but siting is dependent upon sufficient depth to utilize a significant portion of the water column for production. Generally, mussels are grown in mesh socks that may extend to 3 m in length through the water column. The mussels are suspended by a longline system that may be submerged below the surface to allow vessel traffic and safe navigation over the farm. |
| Off-Bottom | Kelp Line Cultivation | Kelp are grown on longline systems within the coastal ocean and deep-water estuaries. General design criteria include kelp grown on submerged lines at a depth that optimizes production with light penetration, nutrient supply, and water flow, and minimizes biofouling. Longlines are anchored at each end and buoys distributed along main lines help maintain depth. Depending on the depth of submergence, the farm may allow for vessel traffic and safe navigation over the farm. |
| Off-Bottom | Seaweed Surface Line Cultivation | Seaweed production system designed for shallow estuaries that uses an array of suspended or floating lines. Seaweed is attached to the lines by entwining or tying and are grown out on lines anchored at each end and buoys distributed along each line. |
| Off-Bottom | Substrate Nets | Gear systems designed to grow macroalgae in low energy environments; consists of a regular grid of lines with algae attached to the lines at regular intervals for growth |
Culture system gear descriptions. In this study, many aquaculture gear types were best suited for the Bay area, where wave action and increased and variable current speed may reduce the performance. While there are exceptions, we considered longline gear and kelp lines as the only gear that can withstand exposure and conditions of the ocean environment.
*Further descriptions of gear and gear orientation can be found from Baluyut (1989) and Theuerkauf et al. (2021).
Table 5
| Gear Type | Estuarine or Ocean | Aquaculture Type | Tide Min (m) | Tide Max (m) | Depth Min (m) | Depth Max (m) |
|---|---|---|---|---|---|---|
| Cultch Planting | Estuarine | Shellfish | 0.13 | -1.63 | -0.25 | -1.25 |
| In Bottom | Estuarine | Shellfish | 0.13 | -1.63 | -0.25 | -1 |
| On Bottom | Estuarine | Shellfish | 0.13 | -1.63 | -0.03 | -1.25 |
| Seabed Cultivation | Estuarine | Shellfish | -1.63 | + | -3 | + |
| Bottom Cages | Estuarine | Shellfish | -1.63 | + | -0.75 | + |
| Rack and Bag | Estuarine | Shellfish | 0.13 | -1.63 | -0.75 | -1.5 |
| Stakes* | Estuarine | Shellfish | 0.13 | -1.63 | -0.3 | -1.5 |
| Floating Bags | Estuarine | Shellfish | 0.13 | + | -0.75 | + |
| Floating Cages | Estuarine | Shellfish | 0.13 | + | -0.75 | + |
| Hanging Basket | Estuarine | Shellfish | -1.63 | + | -0.75 | + |
| Lantern Nets and Hanging Cages | Estuarine | Shellfish | -1.63 | + | -5 | + |
| Raft Culture | Estuarine | Shellfish | -1.63 | + | -5 | + |
| Horizontal Longlines | Ocean | Shellfish | -1.63 | + | -8 | + |
| Kelp Line Cultivation | Ocean | Seaweed | -1.63 | + | -3 | + |
| Seaweed Surface Line Cultivation | Estuarine | Seaweed | -1.63 | + | -0.75 | + |
| Substrate Nets | Estuarine | seaweed | -1.63 | + | -2 | + |
Gear thresholds set for the opportunity analysis for each variable considered.
+No maximum depth limit defined for gear type.
*Several variations on the design; generally, either poles lashed together in a grid like pattern for oyster growth or two poles spaced apart x distance with two horizontal lines running between the two main poles. Vertical lines are then attached to the horizontal lines. These vertical lines can be seeded with oysters for grow out and harvest.
A “+” sign indicates no maximum depth defined for gear type. The negative values are associated with bathymetric data representing relative depth of water.
Each gear type required further delineation of engineering requirements (i.e., gear thresholds established) and determination of whether each gear type was engineered and suitable for estuarine ecosystem environments (e.g., lower wave heights, shallower operational depths, needed tidal variation) or for the open ocean environment where deeper water, more variable and increased ocean current speed and direction, and significant wave heights occurs. This estuary/ocean break was demarcated at the mouth of the Bay at the ecoregion boundary used for previous habitat studies whereby the North Bay is the outer most portion of the estuary and the Outer Bay in first section of ocean area (Merkel and Associates, 2020) (Figure 1). This representative line is about 1 km wide aligned north-south between Point Loma and the constructed Zuniga Jetty and differentiates data needs and availability for estuarine versus ocean modeling (Figure 1).
Two gear types, mussel horizontal longlines and kelp lines, could potentially occur outside the Bay (i.e., ocean portion) as no maximum depth or maximum tidal height were identified for these gear types. In these cases, additional gear threshold parameters were considered, including maximum current speed and significant wave height. The daily maximum significant wave height was used as a measure of episodic storm event exposure for gear, annual maximum significant wave heights were used as a measure of long-term storm event wave forces. All ocean-side useable areas were reviewed using hourly current speed data from January through November for 2021 and were derived from U.S. Integrated Ocean Observing System (IOOS) high-frequency radar data at 2 km resolution (Southern California Coastal Ocean Observing System (SCCOOS), 2021). Significant wave heights were characterized using annualized significant wave height data from the Pacific Northwest National Laboratory’s SWAN (Simulating WAves Nearshore) model (Delft, 2021). For each shellfish and macroalgae gear type, the culture system areas were classified based on the depth requirements of the gear, and in the case of the horizontal longlines and kelp lines, current speed and significant wave height thresholds (Table 4). The areas identified in the culture systems analysis for each species and gear combination were reviewed and finalized. The area was calculated for each combination, with any areas less than ca. 2 ha (5 ac) removed.
Results
Exclusion analysis
The largest category of uses considered in the exclusion model for aquaculture was national security (i.e., military training operation areas). The San Diego Bay area is important for national security and support for military training and operations (Figure 2). All areas with known military constraints or concerns with compatibility were removed from further analysis, with the exception of some areas around Zuniga Point, where partnerships between the military and the Port may bolster the overall health of the Bay and be mutually beneficial. Next, all other categories of uses were considered, with important natural and cultural resource areas (e.g., kelp beds, hardbottom areas, state parks), navigation and transportation areas (e.g., coastally maintained channels, mooring areas, anchorage areas), industrial uses (e.g., pipelines, submarine cables) and monitoring stations (e.g., Point Loma water quality monitoring stations) excluded both inside and around the Bay (Figure 3). In some instances, setback distances were also used to exclude a constraint from further analysis depending on the use area and geometry type (i.e., points and lines both received a setback). For instance, a 500-m setback was applied to the Point Loma buoys, to ensure no interference with data collection would occur due to any aquaculture activities.
Figure 2
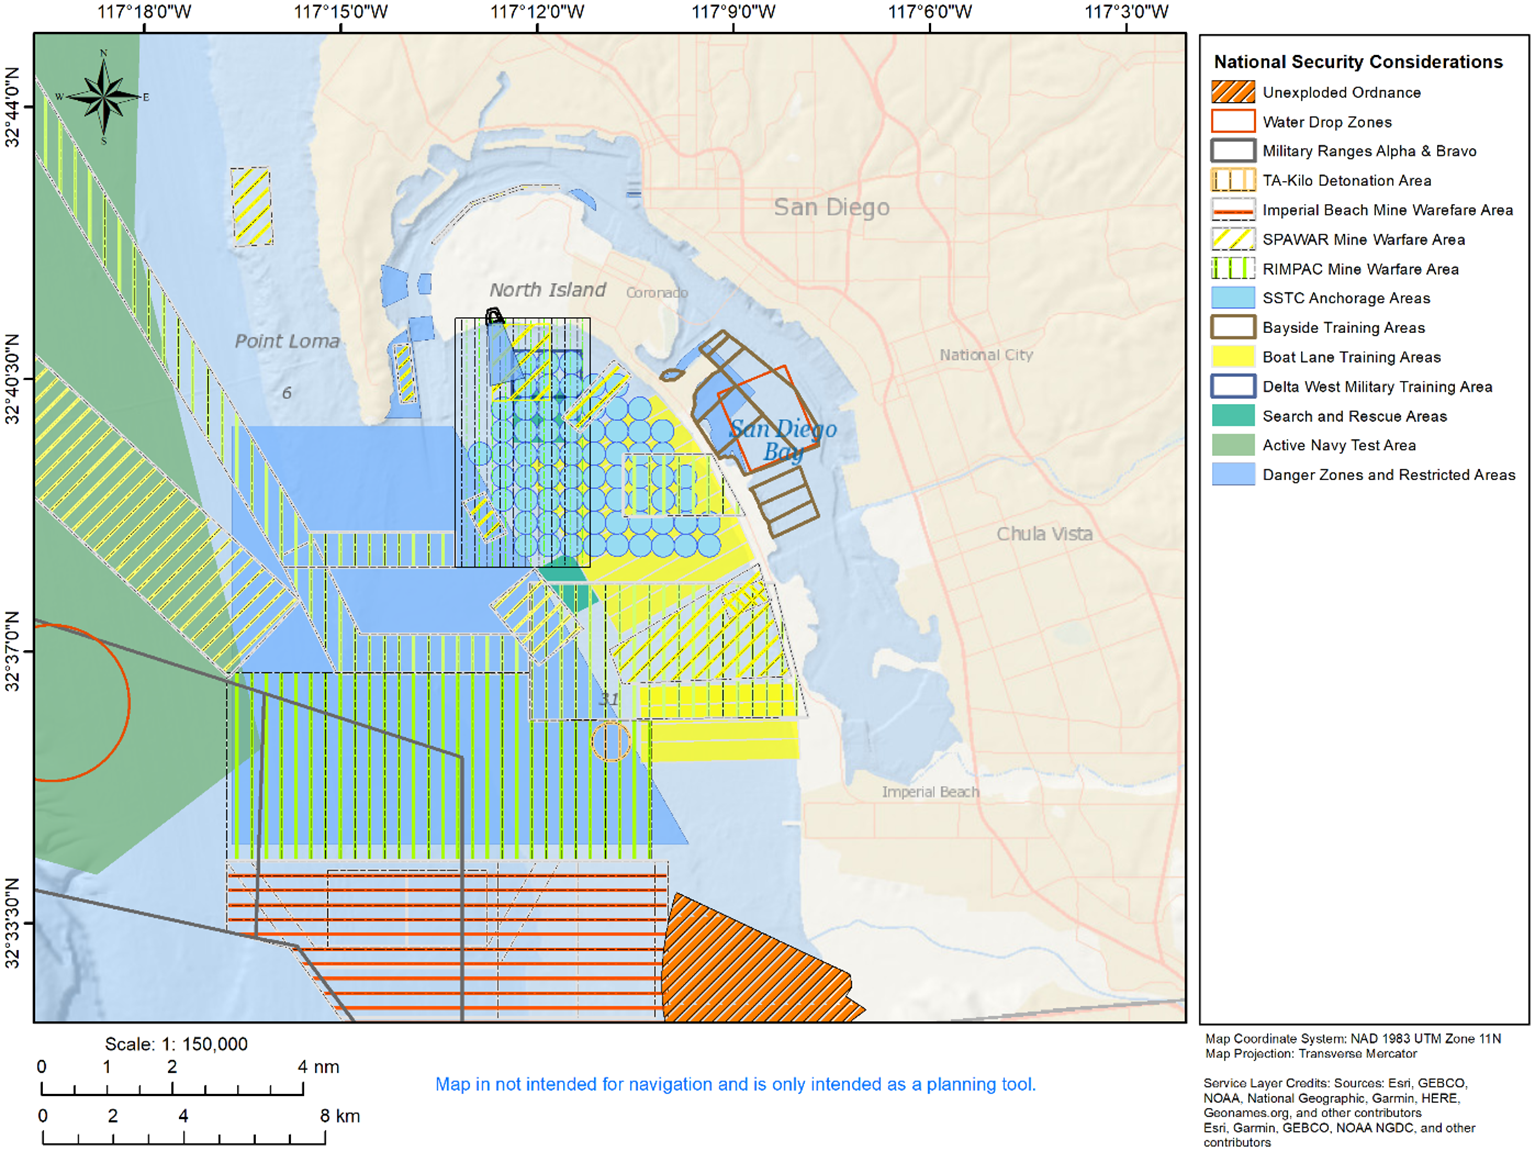
National Security and Military (e.g., U.S. Navy, U.S. Marine Corps) test and training areas and designated danger zones and restricted areas considered within the exclusion analysis. As an exception, several military training areas occur south of North Island, which are currently only considered conditionally constrained until further military/Port discussions occur concerning future area use.
Figure 3
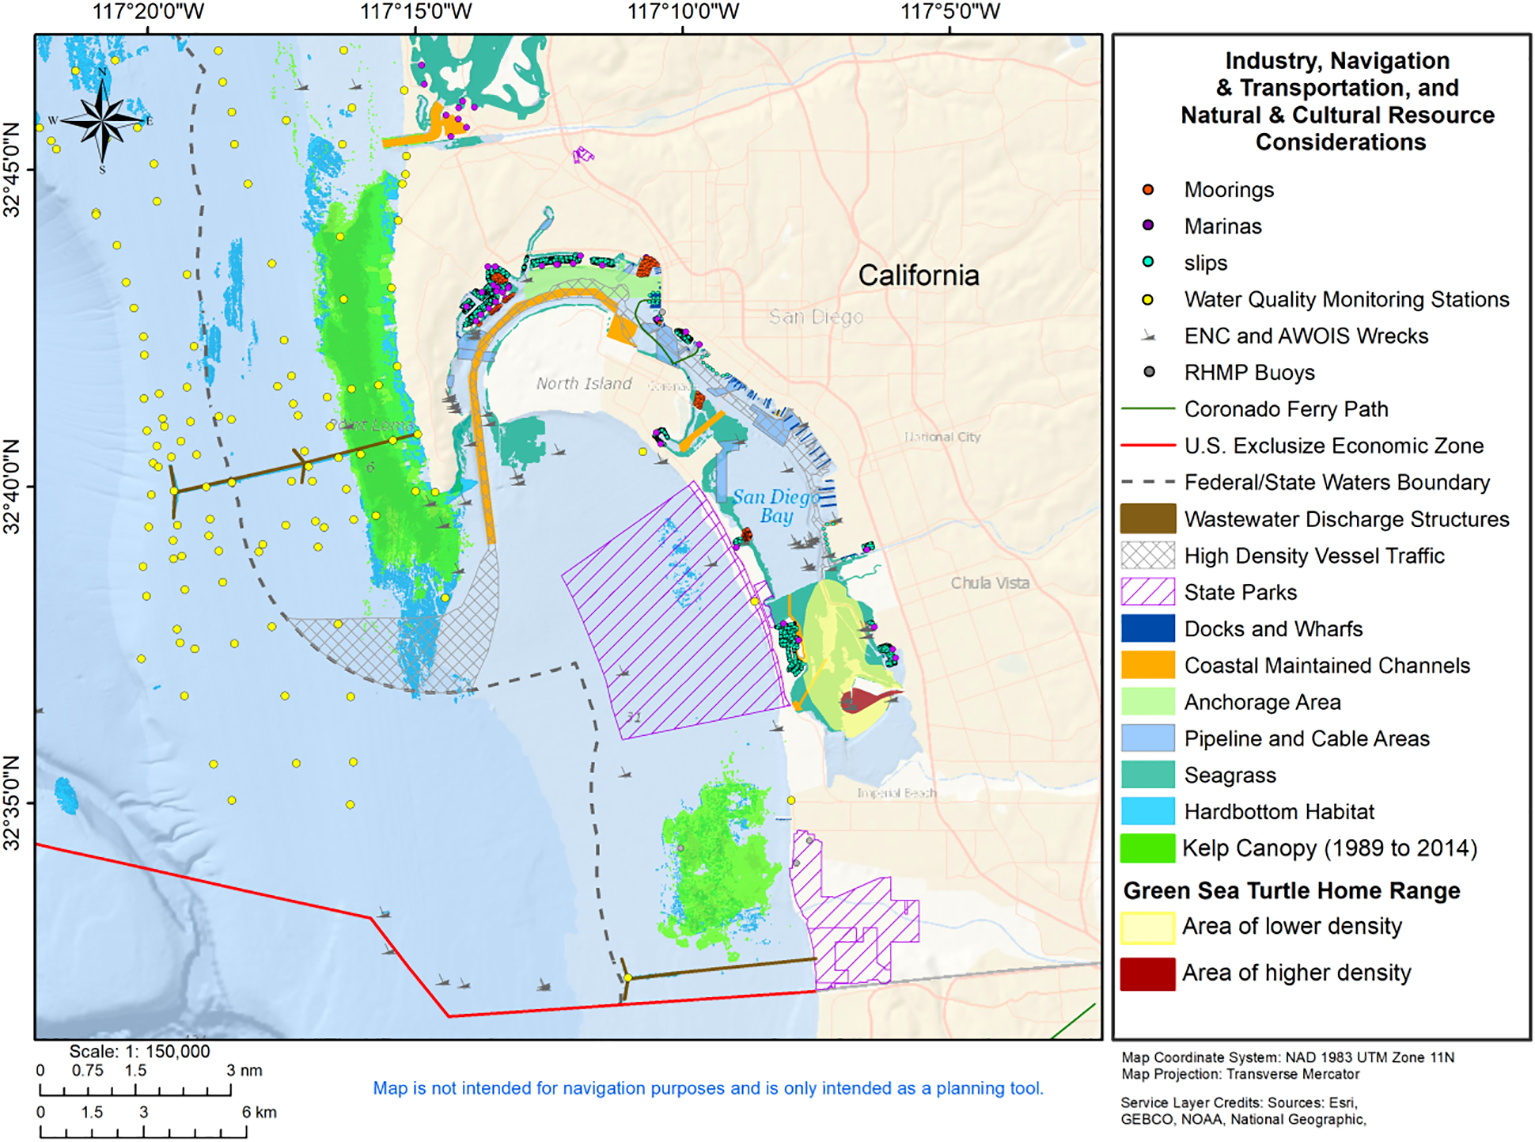
Non-military (i.e., natural and cultural resources, navigation and transportation, industry) considered for the gear type opportunity analysis.
Lastly, a manual removal process eliminated areas less than 2.02 ha (5 ac; the minimum size for an aquaculture pilot study), or any areas that were over land-based structures (docks, piers) not already removed elsewhere in the exclusion analysis. The final resulting area (Figure 4) was then analyzed further for gear compatibility within the culture system analysis. In total, 7.5 km² were left for further assessment inside the Bay (estuarine) and 14.23 km² were available for culture system analysis outside the Bay (ocean). The exclusion analysis resulted (Figure 4) in a more concise focal area for the culture system analysis that highlights all potentially usable area within and surrounding the San Diego Bay for aquaculture development, minimizing conflict with other public trust uses and supporting suitable conditions for economically and environmentally beneficial aquaculture operations.
Figure 4
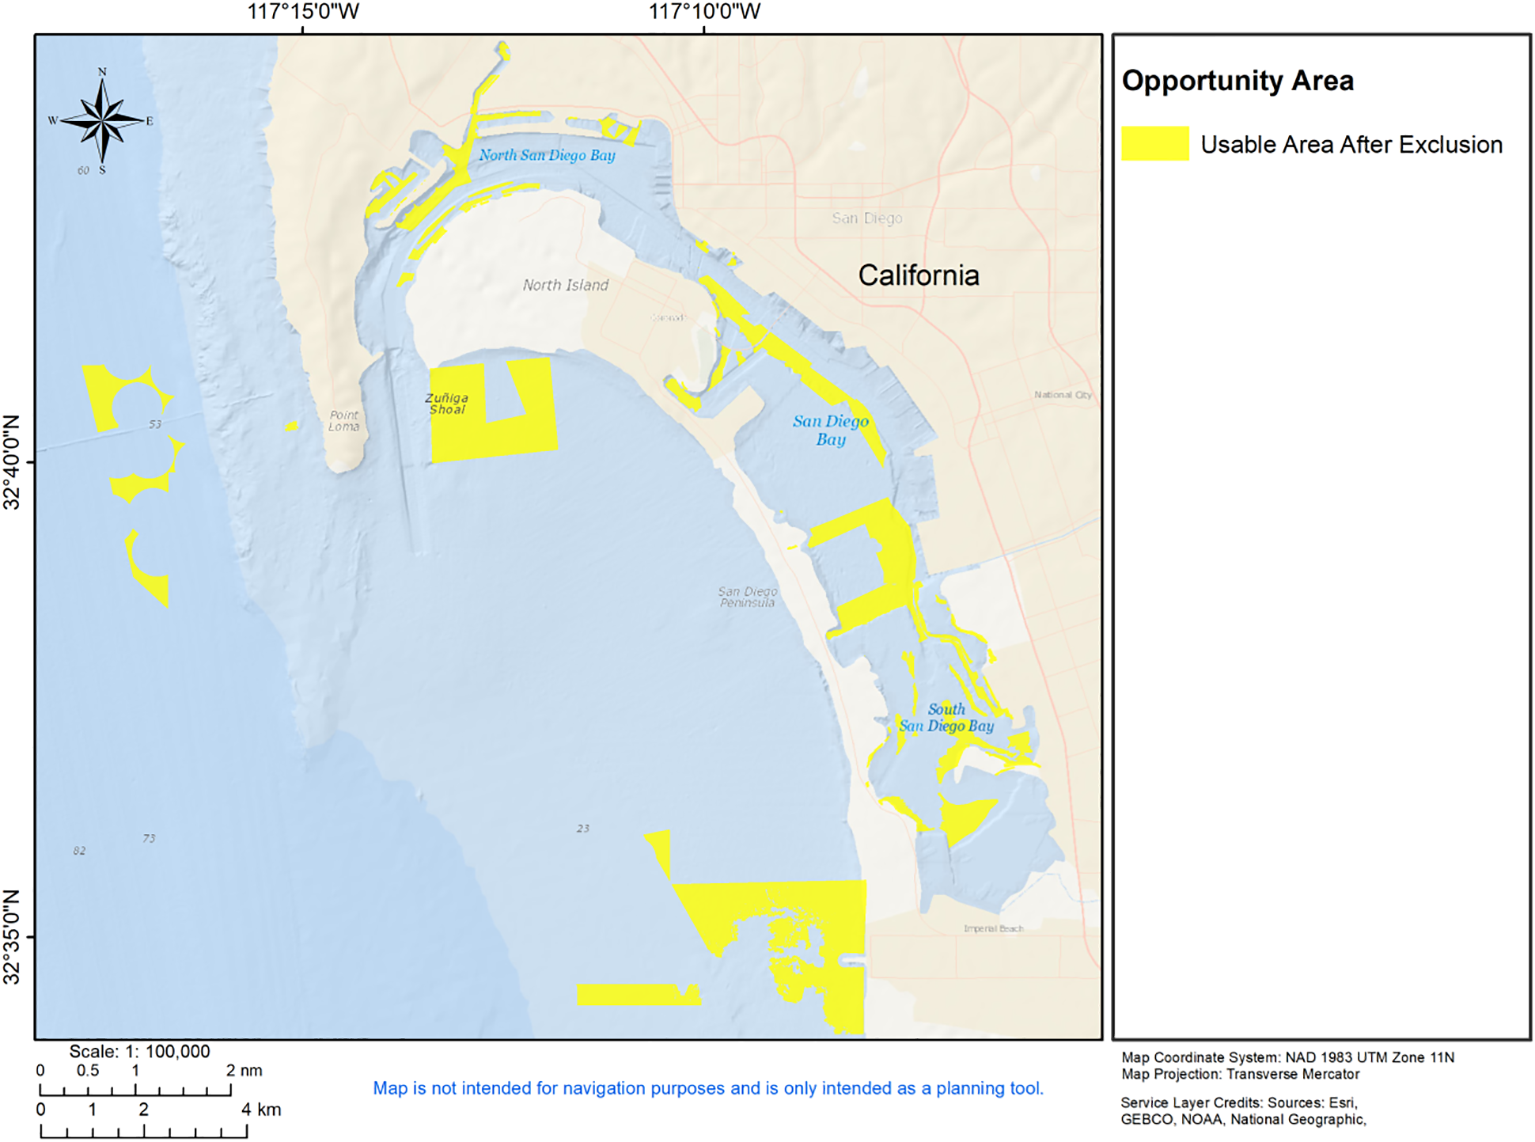
Exclusion model results, with yellow areas indicating 21.73 km² of potentially usable area remain for aquaculture and will be further considered in the opportunity analysis.
Culture systems analysis
In general, the oceanography and climate of the Bay region promote relatively high and stable salinity throughout the Bay as well as relatively stable temperatures (Stransky et al., 2016). When comparing literature-derived thresholds (Leighton, 1979; Newell, 1989; Hobday, 2000; Wasson et al., 2014; Food and Agricultural Organization – United Nations (FAO), 2018) to satellite-derived temperature and salinity climatologies (i.e., ca. 20-year period) (i.e., NASA MODIS, HYCOM + NCODA) for the area, species parameter thresholds were never exceeded (Table 3). The three oceanographic buoys within the Bay also indicated no exceedance, but due to the short temporal period, information derived from the buoys is limited in use. Additionally, NOAA high-frequency radar data (2 km resolution) reviewed for current speed indicated no threshold exceedances of culture system thresholds. Predominant considerations for gear placement included depth as well as tidal differential. Tides in the Bay are mixed diurnal-semidiurnal, with a dominant semidiurnal component (Chadwick and Largier, 1999). Mean tidal differential (Δ = 1.6 m) was defined from the MLLW (i.e., mean low water mark delineated from a tidally derived surface) to classify gear into known, needed vertical zones for culture (e.g., intertidal, subtidal, floating, suspended, or on-bottom/in-bottom) (Figure 5). For instance, intertidal areas (i.e., areas flooded during peaks of daily high tide, but dry for periods between high tides) are needed for rack and bag or off-bottom cages or trays for oyster culture and covered in-bottom or in-bottom culture of clams. For all gear types in estuarine and ocean systems, depth and tidal zone thresholds were developed and used within the final culture system analysis (Table 4).
Figure 5
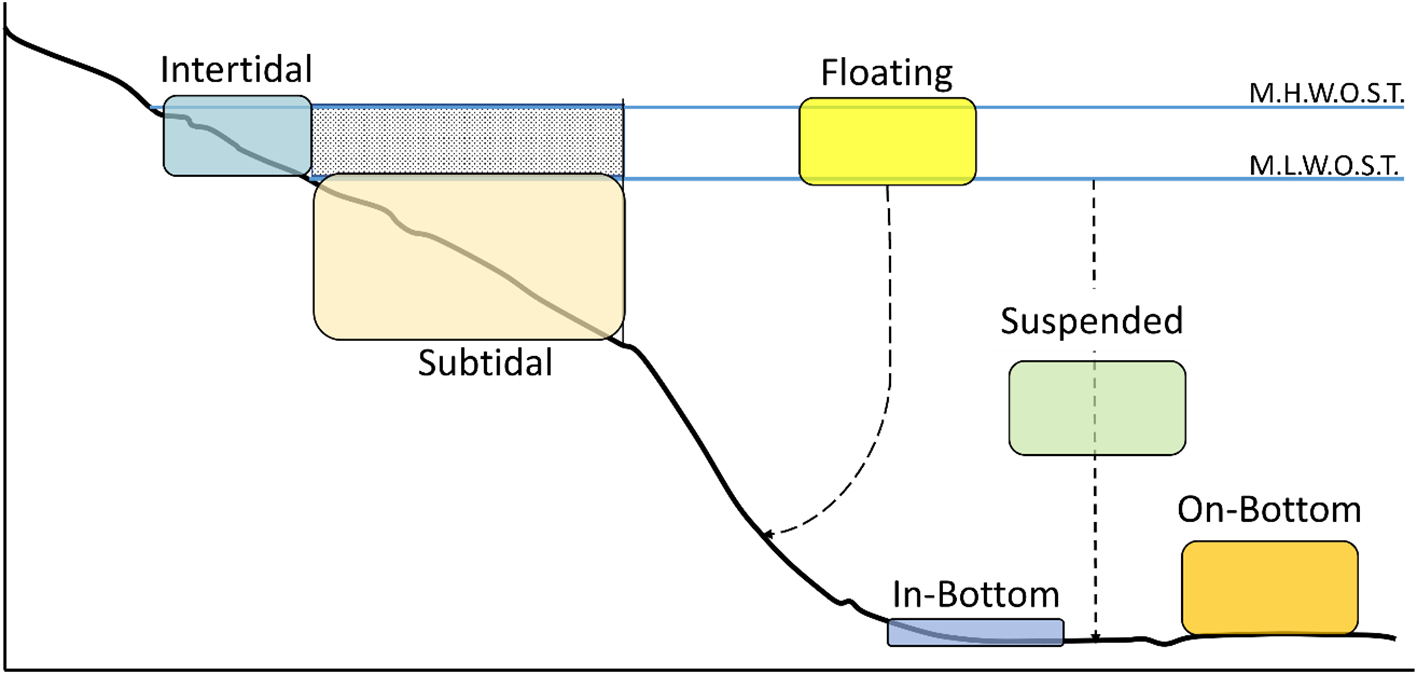
Marine aquaculture generalized zones for culture gear types including intertidal, subtidal, floating, suspended, in-bottom and on-bottom techniques. The intertidal range is depicted from mean high water at ordinary spring tide (M.H.W.O.S.T.) to mean low water at ordinary spring tide (M.L.W.O.S.T.). Adapted from North Carolina Sea Grant (2016).
For the culture system analysis, each gear type was reported according to the associated major culture species category (i.e., Olympia and Pacific oysters, Mytilus spp. mussels, manila and geoduck clams, purple hinge rock scallop, several species of abalone, and four species of macroalgae). Importantly, each culture system model was conducted and reported separately, therefore reported areas of opportunity overlap spatially in some instances. Within the estuarine study area, the deepest portions of the Bay are coastal maintained channels, which are continually maintained through dredging, and therefore were removed in the exclusion analysis. Some of the shallowest areas exist around small boat harbors, which were also removed during the manual exclusion analysis. For the remaining areas, shallower depths lie in the southern portion of the Bay (<1 - 4 m), and depth generally increases in the middle and north portions of the Bay area (mean depth = 12 m). All ocean side useable areas have current speeds less than 1.0 m/s based on NOAA high-frequency radar data at 2 km resolution - looking at the max hourly values from Jan 1st, 2021 to Nov 30th, 2021 (Southern California Coastal Ocean Observing System (SCCOOS), 2021). Significant wave heights were also assumed to be acceptable (i.e., significant wave heights were below 2 m in all instances) for ocean side culture systems after assessing annualized significant wave height data from 1979 – 2010 output from the SWAN model for all useable areas.
Oyster species (e.g., Olympia oysters and Pacific oysters) had several culture systems with potential for success, all within the interior portion of the Bay study area (Figure 6). Oyster species had varying degrees of viability in the Bay using floating bags (623 ha or 1,539 ac), floating cages (623 ha or 1,539 ac), hanging baskets (601 ha or 1,484 ac), bottom cages (601 ha or 1,484 ac), rack and bag (16 ha or 40 ac), stakes (34 ha or 84 ac), and mechanically (601 ha or 1,484 ac) and manually (31 ha or 76 ac) harvested planted seed cultch (Figure 7). Like oysters, hanging basket gear (a type of suspended gear in mid-water column) can also be used for purple hinge rock scallop culture (601 ha or 1,484 ac) (Figure 8).
Figure 6
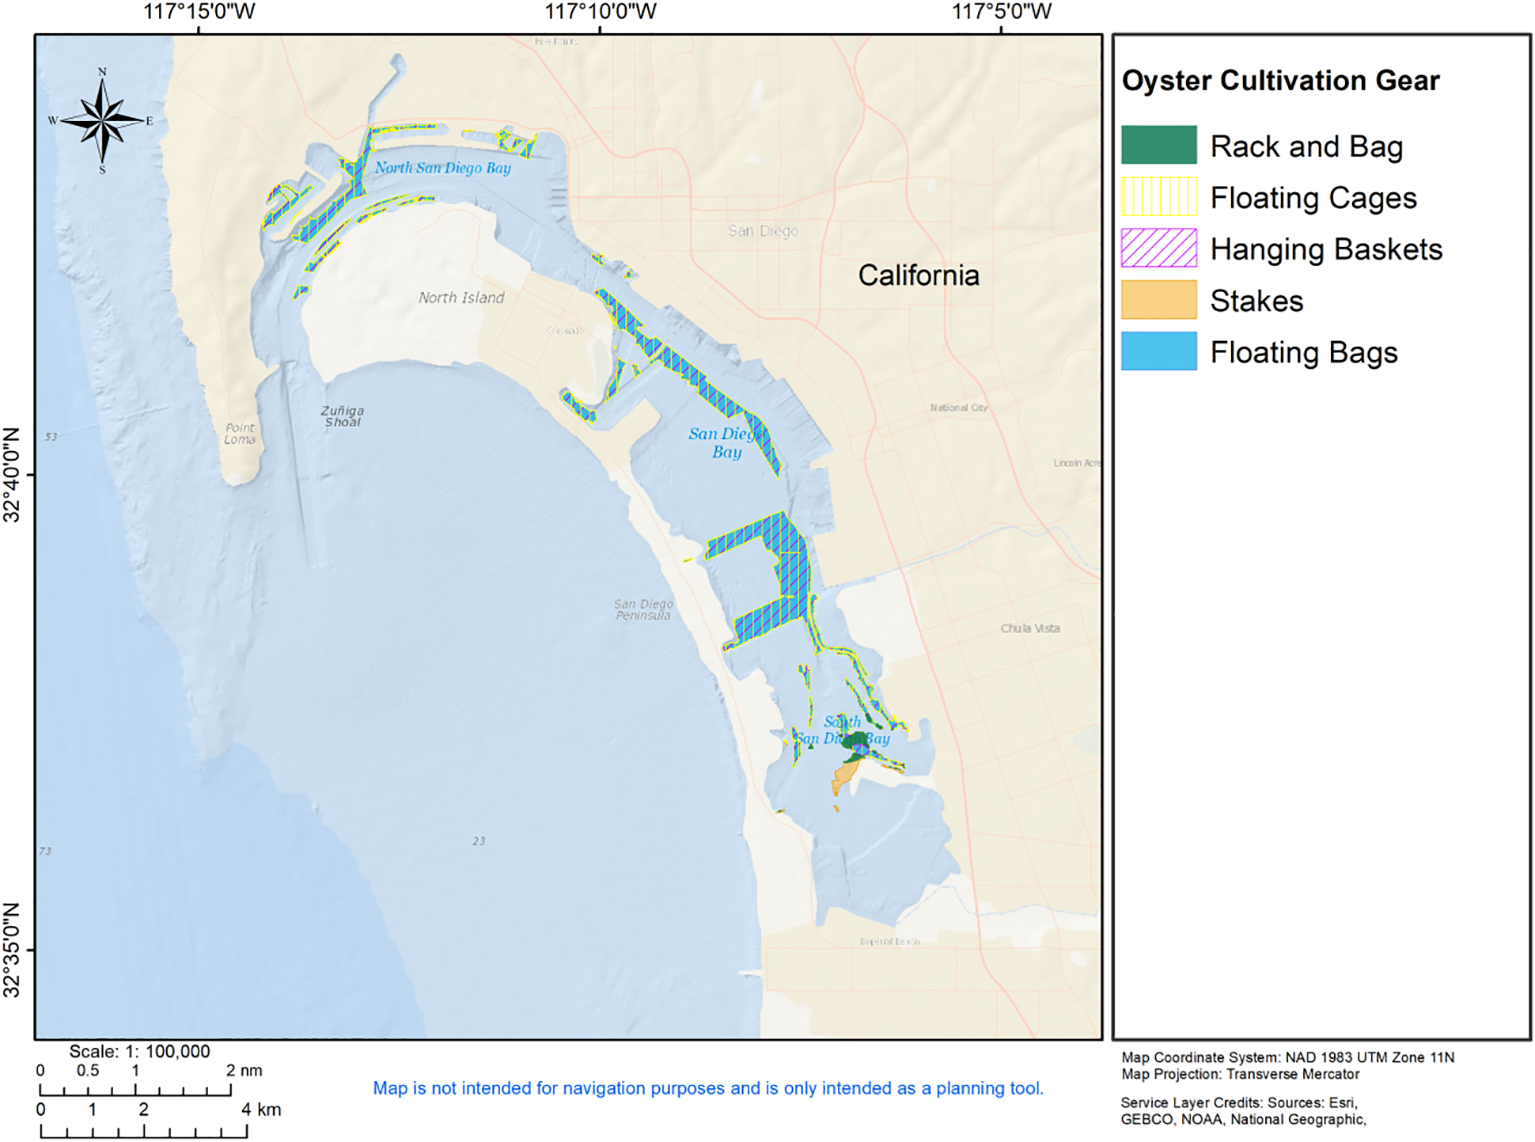
Olympic and Pacific oyster aquaculture gear types (rack and bag – green, floating cages – yellow horizontal stripe, hanging baskets – purple horizontal stripe, stakes – orange, floating bags – blue) within the study area.
Figure 7
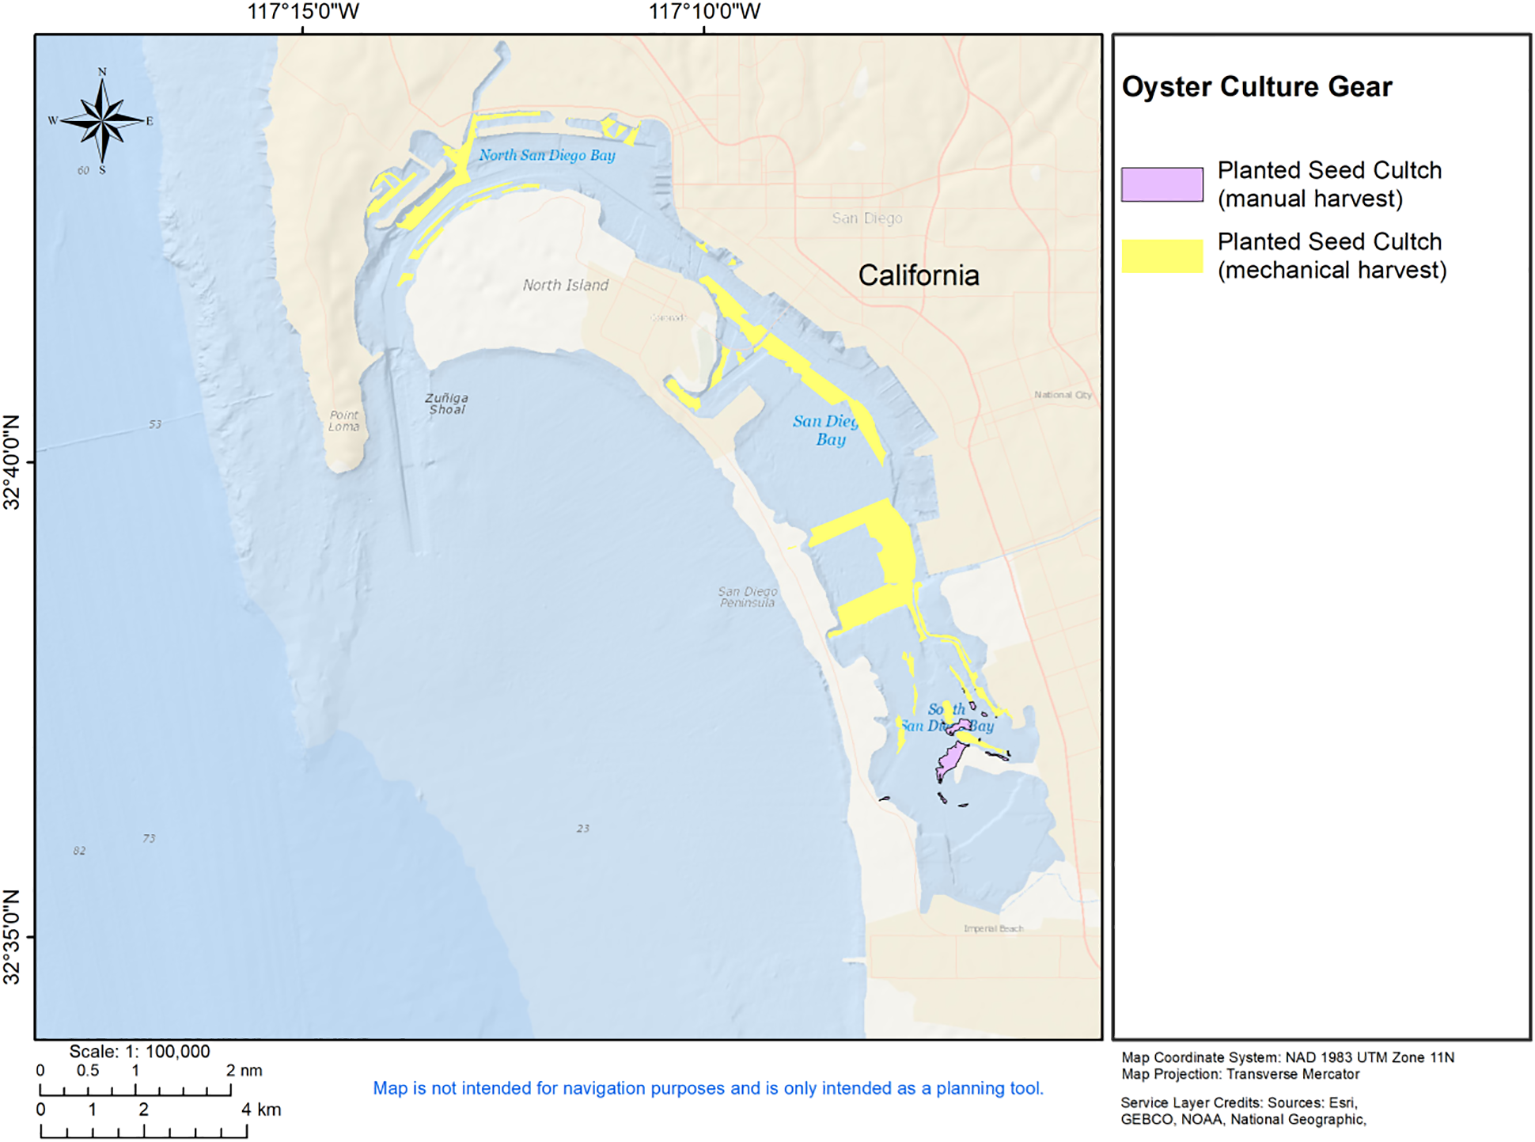
Oyster cultch gear types and harvest considerations (planted seed cultch with manual harvest – purple, planted seed cultch mechanical harvest – yellow) within the study area.
Figure 8
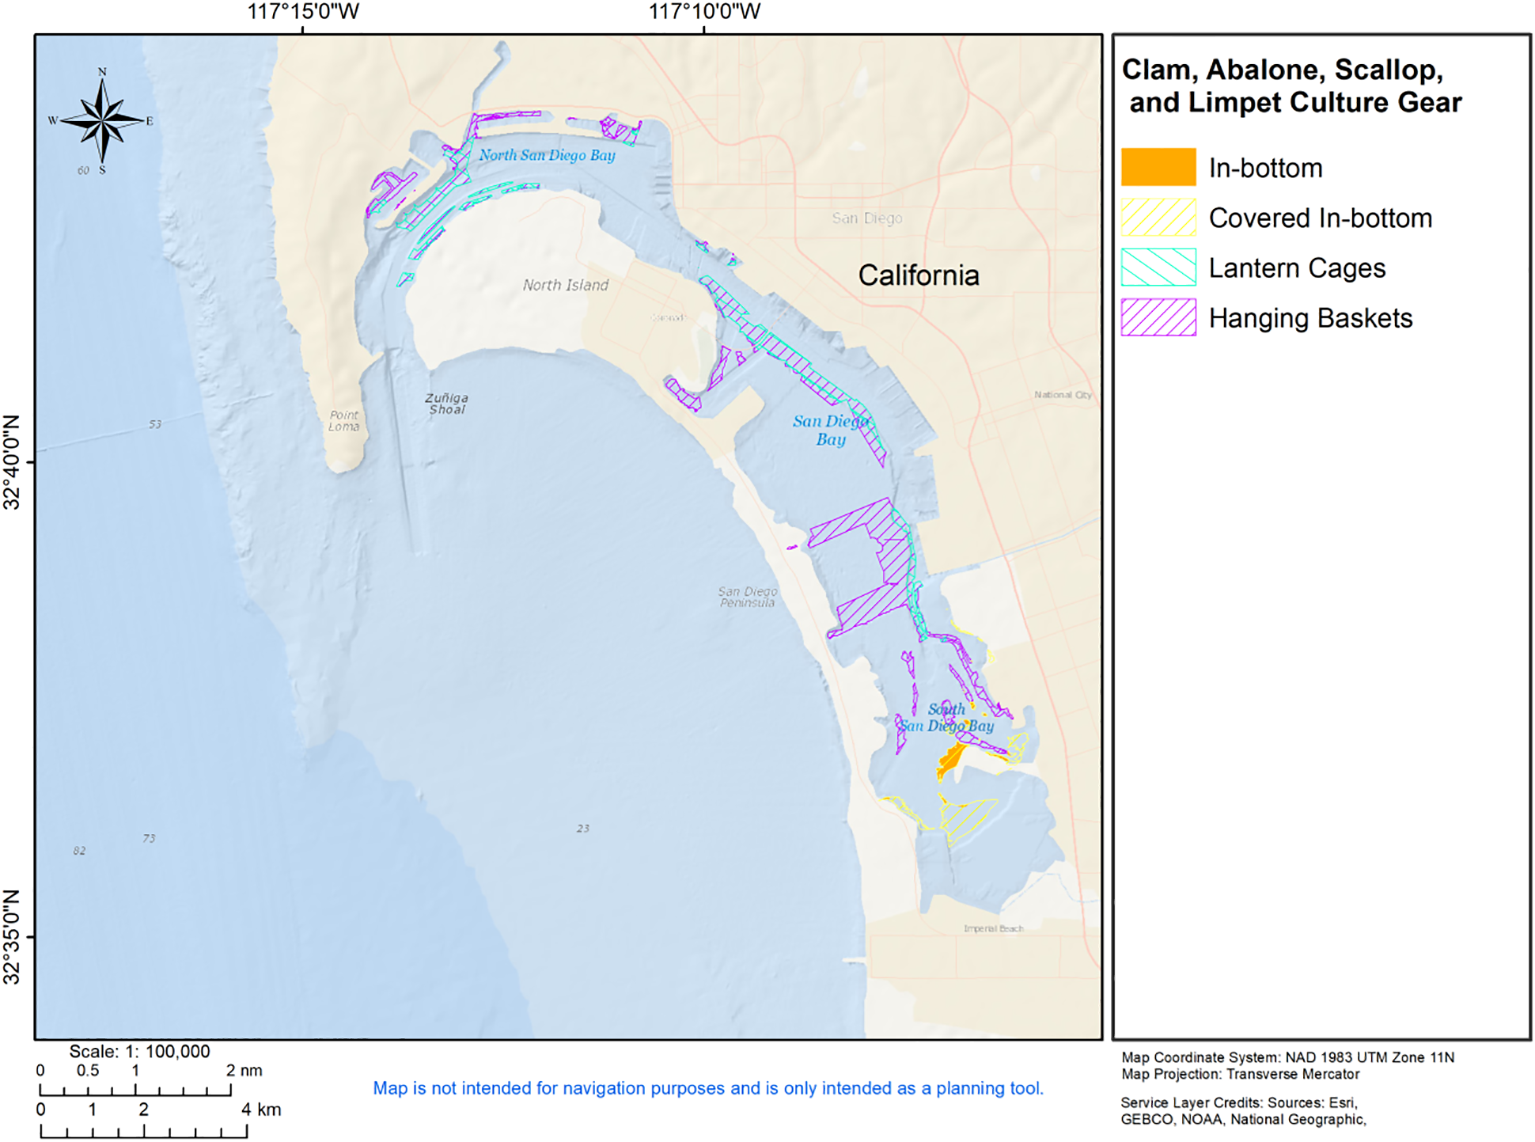
Clams, abalone, scallop, and limpet aquaculture gear types (in—bottom orange, covered in—bottom - yellow horizontal stripe, lantern cages - light blue horizontal stripe, and hanging backets - purple horizontal stripe) opportunity output for the study area.
Manila clams are the only candidate species using covered in-bottom gear and have 106 ha (261 ac) of potential culturable area within the Bay (Figure 8). Similarly, geoduck clams are the only candidate species where in-bottom culture techniques are used and only have 23 ha (57 ac) possible for culture systems. Lantern net cages are a type of suspended (mid-water column) gear associated with red, green, pink, white, black abalones and giant keyhole limpet culture. Here, lantern cages culture systems have a potential area of 227 ha (562 ac) in San Diego Bay. Culture of the Mytilus bay mussel complex can occur inside the Bay using raft culture (227 ha or 562 ac) or outside the Bay (i.e., ocean) using horizontal longline culture (950 ha or 2,349 ac) (Figure 9). Giant kelp cultivation can also occur inside the Bay using seabed cultivation techniques (491 ha or 1,214 ac) or outside the Bay using line culture (1,315 ha or 3,248 ac), although seabed cultivation (i.e., planting of kelp fingerlings on the seafloor) in unlikely (Figure 10). For green algae, red algae, and red ogo all culture systems have the potential to occur in the Bay using either seaweed surf lines (601 ha or 1,484 ac) or substrate nets (575 ha or 1,420 ac) (Figure 10).
Figure 9
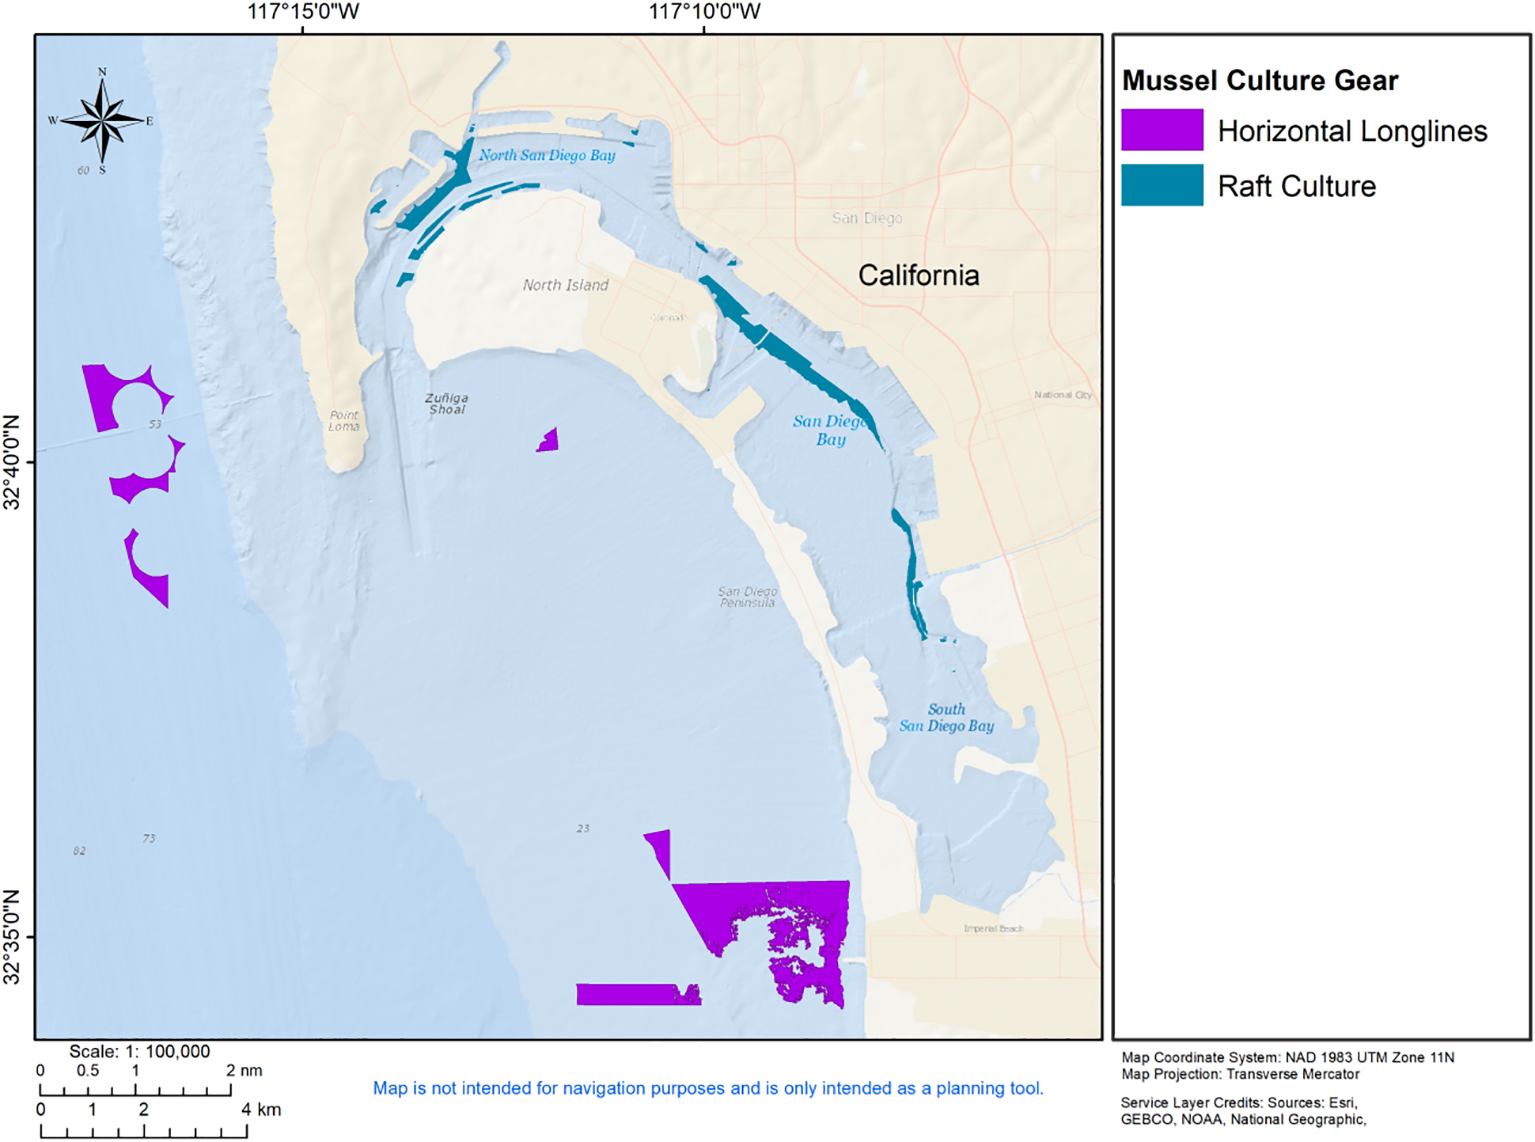
Mussel Complex aquaculture gear types (mussel horizontal longlines, purple polygons; raft culture, blue polygons) opportunity output for the study area. Raft culture offers opportunity within the protected waters of San Diego Bay, while mussel horizontal longlines may afford opportunity in more exposed areas of the coastal ocean.
Figure 10
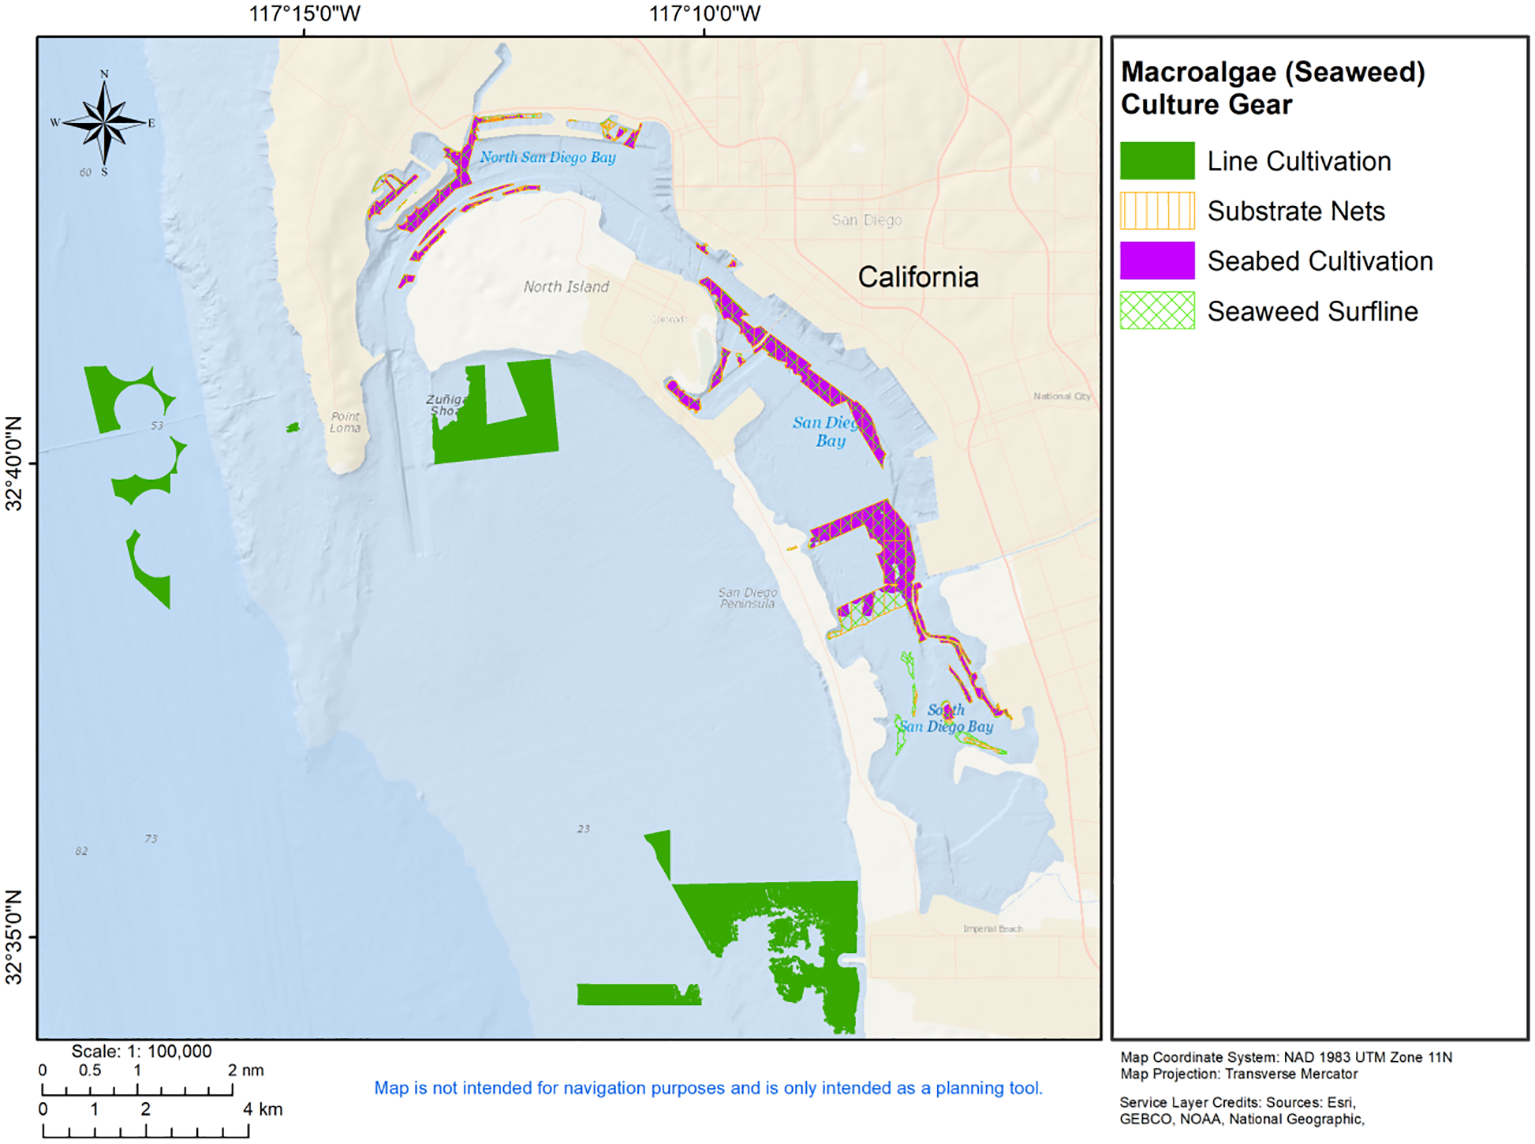
Macroalgae (seaweed spp.) aquaculture gear types (line cultivation - green, substrate nets – orange vertical stripe, seabed cultivation - purple, or seaweed surflines – double-hatch green) opportunity output for the study area.
Discussion
Marine spatial planning (MSP) approaches to inform siting of new ocean industries often focus on analyses to identify the ‘least worst’ location—fitting a new ocean use into an often busy, complex patchwork of existing ocean users and sensitive natural resources. While a focus on conflict minimization is imperative, an emphasis on the use of spatial criteria that identify potentially successful areas for the new ocean use is also essential. Within this study, we extend beyond the use of ‘exclusion analyses’ that remove areas of known constraints to include ‘culture systems analyses’ that identify where various shellfish and seaweed aquaculture activities have potential for success. Our approach considered the full suite of shellfish and seaweed species and culture systems that are possible and appropriate for the focal area for our analyses—an extension from the typical single species or single culture system approach utilized in many previous studies (e.g., Bertolini et al., 2021; Jiang et al., 2022). The underlying spatial analysis approach used in this study can be broadly replicated and applied in other regions to inform both natural resource managers and the aquaculture industry of specific locations where growth of aquaculture has the greatest potential.
The present study indicated that oyster culture systems had the most potential for success in the estuarine area of interest—particularly in the middle and north Bay areas where floating bags and cages could be implemented over a large portion of the usable area. The most limiting culture systems for oysters were stakes and rack and bag due to their limited extent within the intertidal zone (i.e., lack of proper substrate). While included in the study for coverage of the broad range of possible culture systems, oyster stakes are not common in actual practice in the United States. Clam, abalone, scallop and limpet culture systems include in-bottom, covered in-bottom, lantern cages, and hanging baskets. In-bottom (i.e., geoduck clam) culture systems had the least amount of area for potential compatibility due to requirements for intertidal placement. Covered in-bottom culture systems have limited options in the Bay, with successful systems possibly focused in the southern or middle portion of the Bay, where the highest compatability exists. Lantern cages and hanging baskets had the most potentially compatible area for culture in the estuarine portion of the Bay, with possibilities ranging from the south-central portion of the Bay to northern locations. For mussels, modeling of raft culture systems only occured inside the Bay due to the inability of the culture system to withstand the open ocean environemnt. However, the coastal ocean outside of the Bay has opportunity available for mussel culture as longline gear is more tolerant of relatively higher wave heights and current speeds.
For all macroalgae species considered (see Table 2), giant kelp and line cultivation in the ocean environment has the most potential opportunity as a culture system. Substrate nets and macroalgae surflines have some suitable areas on the inside of the Bay for red, green, and red ogo algae culture. All shellfish and macroalgae culture systems planned within the present study have the potential to provide a variety of ecosystem services, if their siting, design and operations are carefully considered (Theuerkauf et al., 2019; Thurerkauf et al., 2021).
Limitations
The best available oceanographic data were used for this analysis, however narrow timeframes, limited sample sites, and other data limitations constrained insights derived from the analyses. For example, temporal and spatial resolution limitations on current speed, significant wave height, and water quality data were limited inside of the Bay area, and therefore assumptions had to be made in this study. Additionally, culture species’ biophysical requirements were only considered from a minimum and maximum ‘extremes’ perspective, while the authors acknowledge that sub-lethal impacts can occur at other levels. Establishing a greater number of oceanographic and water quality monitoring buoys inside the Bay area would strengthen data quality, and therefore modeling inputs. Further, bacterial and contaminant monitoring data for both the Point Loma and Tijuana offshore wastewater outfalls, need consideration during the final culture system location. In certain cases, cultivated macroalgae and shellfish aquaculture could perform a bioremediation function for nutrient removal outside the Bay area and could be co-sited with those areas. Continued monitoring of known contaminants in the San Diego Bay is needed so focal areas for bioremediation aquaculture can occur, or these areas can be avoided for other types of aquaculture (e.g., food). Sensitive habitats (e.g., native seagrass and kelp beds) and protected species require certain regulatory protections and consultation in the US, and need to be checked before any area is considered completely viable (Longdill et al., 2007; Cardia et al., 2017). The culture systems areas identified within this study should only be viewed as potential use areas, as additional constraints may be present or other areas may possess the capacity for aquaculture. Thorough on-site validation of physical and oceanographic conditions and confirmation of suitability for specific gear and species combinations is recommended prior to engaging in in-water aquaculture activities. From a coastal manager’s standpoint, this study indicates areas in and around the Bay where aquaculture is constrained (i.e., exclusion), and areas where future opportunities may be sought for aquaculture activities (i.e., culture systems). Other considerations needed include economics (e.g., cost of gear, price of commodity) and port infrastructure (e.g., hatchery infrastructure, processing facilities). Site-specific survey-level considerations of local oceanography and sedimentology (e.g., site-level habitat survey, water quality and clarity, chlorophyll a, current speed and variability, prevailing current direction, sediment size, slope, higher resolution bathymetry) are recommended beyond this study’s outputs for more-informed planning decisions.
Next steps
These series of spatial analyses represent an important first planning step towards gauging the potential for shellfish and macroalgae aquaculture in a highly utilized coastal ocean area, San Diego Bay. By defining usable and compatible space for various gear and species combinations, this study establishes a foundation for further ground-truthing, future research, and robust planning of future aquaculture growth. The results of this study are being used to delineate three pilot areas for further shellfish and macroalgae carrying capacity modeling from culture systems identified as potentially successful in this work. In each of the three pilot study areas, high resolution data (Frieder et al., 2022) for turbidity and TSS, dissolved oxygen, water clarity indicators, nutrient profiles, depth, current speed and direction, significant wave height, and salinity and temperature profiles will be used in a spatial analysis to further determine the probability of success for certain culture systems. In parallel with this extension of this culture systems study, two other aquaculture pilot projects were conducted to further knowledge of other aspects of possible culture in the Bay system. The first project was with San Diego Bay Aquaculture to operate a shellfish nursery using floating upweller system (FLUPSY) technology (Port of San Diego (PSD), 2022). The project successfully demonstrated the efficacy of rearing the nursery stage (seed to juvenile) of oysters and other shellfish in the Bay with resulting juveniles being exported to various US west coast and Baja California, Mexico farms for further grow out. Sunken Seaweed, LLC executed the second pilot project exploring the feasibility of rearing macroalgae species using longline and hanging basket gears (Port of San Diego (PSD), 2022). Fingerlings of brown kelps, green and red seaweeds, reared for a year in the Bay, resulted in successful grow out for all species to support nutrient bioremediation through macroalgae aquaculture within the Bay. In all, both pilot projects are now ready to scale, which require resources to provide a more enabling environment to support scalable shellfish and seaweed operations in and around the Bay. Notably, through these pilot projects demonstration of other variations of culture systems (e.g., longline and hanging basket gear used for macroalgae growth inside the Bay) that were experimental in nature, occurred during the development and execution of this study. It is recommended in future spatial analyses in the Bay, demonstrated successful experimental culture systems in pilot projects are considered.
Conclusions
This study within and around San Diego Bay, illustrates the benefits of utilizing such an MSP approach in any shellfish or macroalgae culture system decision-making process in a highly utilized coastal ocean area. While the exclusion analysis removed all areas with known incompatibilities with aquaculture, the culture system analyses evaluated a range of factors to determine compatible areas based on culture system type. With the results of this study, successful culture system selection can occur for coastal managers and farmers well in advance of in-water deployment, leading to a reduction of project false starts, potential economic losses due to farm failure, or unintended impacts to the surrounding area. For example, if not properly sited, many macroalgae species will be pruned and shellfish will remain perpetually dormant if they are consistently exposed to breaking waves. Similarly, if culture equipment intended for deeper waters is deployed in waters too shallow, siltation, waves, or bottom interference may occur with the system. In complex, crowded coastal ocean space, MSP approaches, such as the one demonstrated here, create focused areas for further planning of multiple culture systems streamlining considerations for needed, integrated planning success.
Statements
Data availability statement
The datasets presented in this study can be found in online repositories. The names of the repository/repositories and accession number(s) can be found in the article/Supplementary Material.
Author contributions
LW: Conceptualization, Data curation, Formal Analysis, Investigation, Methodology, Software, Validation, Visualization, Writing – original draft, Writing – review & editing. JJ: Conceptualization, Data curation, Formal Analysis, Investigation, Methodology, Software, Validation, Writing – original draft, Writing – review & editing. ST: Conceptualization, Formal Analysis, Investigation, Methodology, Validation, Writing – original draft, Writing – review & editing. BJ: Writing – review & editing. BK: Investigation, Methodology, Writing – review & editing. TH: Formal Analysis, Investigation, Writing – original draft. PS: Conceptualization, Investigation, Writing – review & editing. JM: Conceptualization, Funding acquisition, Investigation, Methodology, Project administration, Resources, Validation, Visualization, Writing – review & editing. KR: Conceptualization, Funding acquisition, Investigation, Methodology, Project administration, Resources, Validation, Visualization, Writing – review & editing.
Funding
The author(s) declare financial support was received for the research, authorship, and/or publication of this article. Funding and support for this project were provided by NOAA Fisheries Office of Aquaculture and the NOAA National Centers for Coastal Ocean Science. We thank the NOAA Ernest F. Hollings Undergraduate Scholarship for support of T. Henry. We also acknowledge the many contributions from the Port of San Diego, NOAA Fisheries West Coast Region; U.S. Navy Environmental Information Management System; Port of San Diego Regional Harbor Monitoring Program, and California Sea Grant.
Conflict of interest
The authors declare that the research was conducted in the absence of any commercial or financial relationships that could be construed as a potential conflict of interest.
Publisher’s note
All claims expressed in this article are solely those of the authors and do not necessarily represent those of their affiliated organizations, or those of the publisher, the editors and the reviewers. Any product that may be evaluated in this article, or claim that may be made by its manufacturer, is not guaranteed or endorsed by the publisher.
Author disclaimer
The scientific results and conclusions, as well as any views or opinions expressed herein, are those of the authors and do not necessarily reflect the views of the United States Department of Commerce or the National Oceanic and Atmospheric Administration Permitting for aquaculture development may require coordination or consultation with federal, state, tribal, and local authorities.
Supplementary material
The Supplementary Material for this article can be found online at: https://www.frontiersin.org/articles/10.3389/fmars.2023.1294501/full#supplementary-material
References
1
Alleway H. K. Gillies C. Bishop M. J. Gentry R. Theuerkauf S. J. Jones R. et al . (2019). The ecosystem services of marine aquaculture: valuing benefits to people and nature. BioScience69, 59–68. doi: 10.1093/biosci/biy137
2
AltaSea (2023). Project Blue (Los Angeles, CA, USA: AltaSea)., Vol. 10. 2023.
3
Baluyut E. A. (1989). Aquaculture Systems and Practices: A Selected Review (Rome, Italy: Food and Agricultural Organization – United Nations (FAO).
4
Bertolini C. Brigolin D. Porporato E. M. D. Hattab J. Pastres R. Tiscar P. G. (2021). Testing a Model of Pacific Oysters’ (Crassostrea gigas) Growth in the Adriatic Sea: Implications for Aquaculture Spatial Planning. Sustainability.13 (6), 3309. doi: 10.3390/su13063309
5
Cardia F. Ciattaglia A. Corner R. A. (2017). Guidelines and Criteria on Technical and Environmental Aspects of Cage Aquaculture Site Selection in the Kingdom of Saudi Arabia (Rome, Italy: Food and Agricultural Organization (FAO).
6
Chadwick D. B. Largier J. L. (1999). Tidal Exchange at the Bay-Ocean Boundary. J. Geophysical Res.104 (C12), 29901–29924. doi: 10.1029/1999JC900165
7
Chopin T. Tacon A. G. L. (2021). Importance of seaweeds and extractive species in global aquaculture production. Rev. Fisheries Sci. Aquaculture29, 139–148. doi: 10.1080/23308249.2020.1810626
8
Delft U. T. (2021). SWAN Model. (Arlington, VA, USA: TUDelft).
9
Ehler C. N. (2018). “Marine spatial planning,” in Offshore Energy and Marine Spatial Planning, 1st ed. Eds. YatesK. L.BradshawC. J. A. (London (UK): Routledge), 6–17. Available at: https://www.taylorfrancis.com/books/edit/10.4324/9781315666877/offshore-energy-marine-spatial-planning-katherine-yates-corey-bradshaw.
10
Esri . (2022). ArcGIS Pro: Release 3.0.3 Redlands (Rendlands, CA, USA: Environmental Systems Research Institute).
11
Food and Agricultural Organization – United Nations (FAO) (2018). Pacific Oyster Cultured Aquatic Species Information Programme Crassostrea gigas. (Rome, Italy: Food and Agricultural Organization – United Nations).
12
Frieder C. A. Chao Y. Chamecki M. Dauhajre D. McWilliams J. C. Infante J. et al . (2022). A Macroalgal Cultivation Modeling System (MACMODS): Evaluating the Role of Physical-Biological Coupling on Nutrients and Farm Yield. Front. Mar. Sci.9. doi: 10.3389/fmars.2022.752951
13
Gentry R. R. Alleway H. K. Bishop M. J. Gillies C. L. Jones W. T. (2020). R. Exploring the potential for marine aquaculture to contribute to ecosystem services. Rev. Aquac.12 (2), 499–512. doi: 10.1111/raq.12328
14
Gentry R. R. Lester S. E. Kappel C. V. White C. Bell T. B. Stevens J. et al . (2016). Offshore aquaculture: spatial planning principles for sustainable development. Ecol. Evol.7, 733–743. doi: 10.1002/ece3.2637
15
Hobday A. J. (2000). Persistence and transport of fauna on drifting kelp (Macrocystis pyrifera (L.) C. Agardh) rafts in the Southern California Bight. J. Exp. Mar. Biol. Ecol.253 (1), 75–96. doi: 10.1016/s0022-0981(00)00250-1
16
Humboldt Bay Harbor Recreation and Conservation District (HBHRCD) (2022). Humboldt Bay Mariculture Permitting and Pre-permitting. (Humboldt, CA, USA: Humboldt Bay Harbor, Recreation, & Conservation District), Vol. 26. 2023.
17
Jiang B. Boss E. Kiffney T. Hesketh G. Bourdin G. Fan D. et al . (2022). Oyster Aquaculture Site Selection Using High-Resolution Remote Sensing: A Case Study in the Gulf of Maine, United States. Front. Mar. Sci.9. doi: 10.3389/fmars.2022.802438
18
Kapetsky J. M. Aguilar-Manjarrez J. Jenness J. (2013). A global assessment of potential for offshore mariculture development from a spatial perspective (Rome: FAO: FAO Fisheries and Aquaculture Technical Paper No. 549).
19
Kelly R. Pecl G. T. Fleming. A. (2017). Social license in the marine sector: a review of understanding and application. Mar. Policy81, 21–28. doi: 10.1016/j.marpol.2017.03.005
20
Leighton D. L. (1979). A growth profile for the rock scallop Hinnites multirugosus held at several depths off La Jolla, California. Mar. Biol.51 (3), 229–232. doi: 10.1007/BF00386802
21
Lester S. E. Stevens J. M. Gentry R. R. Kappel C. V. Bell T. W. Costello C. J. et al . (2018). Marine spatial planning makes room for offshore aquaculture in crowded coastal waters. Nat. Commun.9, 945. doi: 10.1038/s41467-018-03249-1
22
Lightsom F. L. Cicchetti G. Wahle. C. M. (2015). Data categories for marine planning: U.S. Geological Survey open-file report 2015–1046. (Reston, Virginia, USA: United States Geological Survey).
23
Longdill P. C. Healy T. R. Black K. P. (2008). An integrated GIS approach for sustainable aquaculture management area site selection. Ocean Coast. Manage.51 (8-9), 612–624. doi: 10.1016/j.ocecoaman.2008.06.010
24
Longdill P. C. Healy T. R. Black K. P. Mead S. T. (2007). Integrated sediment habitat mapping for aquaculture zoning. J. Coast. Res.ICS2007, 173–179. Available at: https://hdl.handle.net/10289/2862.
25
Malczeswki J. (2006). GIS-based multicriteria decision analysis: a survey of the literature. International J. Geographical Information Sci.20 (70), 703–726.
26
MacDonald B. D. Lewison R. L. Madrak S. V. Seminoff J. A. Eguchi T. (2012). Home ranges of East Pacific green turtles Chelonia mydas in a highly urbanized temperate foraging ground. Mar. Ecol. Prog. Series461, 211–221.
27
Merkel and Associates . (2020). 2020 San Diego Bay Eelgrass Inventory. Prepared for the US Navy Region Southwest Naval Facilities Engineering Command (Accessed November 25, 2023).
28
Molina J. L. Rodríguez-Gonzálvez P. Molina M.-C. González-Aguilera D. Balairon L. Espejo F. et al . (2013). River morphodynamics modelling through suitability analysis of geomatic methods. In: WangZ.LeeJ. H. W.GaoJ.CaoS. Eds. Proceedings of the 35th IAHR World Congress; Chengdu, China. Beijing: Tsinghua University Press.
29
National Centers for Environmental Information (NCEI) (2012). San Diego bathymetry. (Stennis, MS, USA: National Oceanic and Atmospheric Administration National Centers for Environmental Information).
30
National Oceanic and Atmospheric Administration (NOAA) (2023). Coastal Ecosystem Science. (Washington, DC, USA: National Oceanic and Atmospheric Administration). Vol. 50. Available at: https://www.govinfo.gov/app/details/GOVPUB-I49-PURL-LPS73977.
31
Newell R. I. Morgan D. (1989). Species profiles: life histories and environmental requirements of coastal fishes and invertebrates (North and Mid-Atlantic)–blue mussel. U.S. Fish. Wildl. Serv. Biol. Rep. Available at: https://apps.dtic.mil/sti/citations/ADA212654.
32
North Carolina Sea Grant . (2016). Shellfish Aquaculture Gear. (Morehead City, NC, USA: National Oceanic and Atmospheric Administration Sea Grant), Vol. 7. 2023.
33
OCM Partners . (2022). 2020 California NAIP 4-Band 8 Bit Imagery (Charleston, SC, USA: NOAA National Centers for Environmental Information).
34
Pondella D. Williams J. P. (2009). Fisheries inventory and utilization of San Diego Bay, San Diego California for surveys conducted in April and July 2008 (Los Angeles, CA: Vantuna Research Group).
35
Port of San Diego (PSD) (2022). Blue Economy Incubator Highlights, 3 ed. (San Diego, CA, USA: Port of San Diego).
36
Southern California Coastal Ocean Observing System (SCCOOS) (2021). SCCOOS Data Portal, HF Radar Hourly Surface Currents (2 km). (La Jolla, CA, USA: Southern California Coastal Ocean Observing System (SCCOOS)).
37
Stelzenmüller V. Gimpel A. Gopnik M. Gee K. (2017). Aquaculture site-selection and marine spatial planning: The roles of GIS-based tools and models (New York, NY, USA: Aquaculture Perspective of Multi-Use Sites in the Open Ocean), 131–148.
38
Stransky C. Sheredy C. Tait K. Isham B. Rudolph J. Schottle R. et al . (2016). Regional Harbor Monitoring Program 2013 Report (San Diego, California: Amec, Foster, Wheeler Environmental and Infrastructure, Inc), 258.
39
Theuerkauf S. J. Barrett L. T. Alleway H. K. Coasta-Pierce B. A. St. Gelais A. Jones. R. C. (2021). Habitat value of bivalve shellfish and seaweed aquaculture for fish and invertebrates: pathways, synthesis, and next steps. Rev. Aquaculture14 (1), 54–72. doi: 10.1111/raq.12584
40
Theuerkauf S. J. Morris J. A. Jr Waters T. J. Wickliffe L. C. Alleway H. K. Jones R. C. (2019). A global spatial analysis reveals where marine aquaculture can benefit nature and people. PloS One14 (10), e0222282. doi: 10.1371/journal.pone.0222282
41
Ventura Port District . (2023). Sustainable Aquaculture – Ventura Shellfish Enterprise. (Ventura, CA, USA: Ventura Port District), Vol. 10, 2023.
42
Voyer M. van Leeuwen J. (2019). ‘Social license to operate’ in the Blue Economy. Resour. Policy62, 102–113. doi: 10.1016/j.resourpol.2019.02.020
43
Wasson K. Zabin C. Bible J. Ceballos E. Chang A. Cheng B. et al . (2014). A Guide to Olympia Oyster Restoration and Conservation: Environmental conditions and sites that support sustainable populations in Central California. (San Rafael, CA: San Francisco Bay National Estuarine Research Reserve).
44
Wever L. Krause G. Buck B. H. (2015). Lessons from stakeholder dialogues on marine aquaculture in offshore wind farms: Perceived potentials, constraints and research gaps. Mar. Policy51, 251–259. doi: 10.1016/j.marpol.2014.08.015
Summary
Keywords
aquaculture, marine spatial planning, culture systems analysis, shellfish, macroalgae, seaweed, blue economy
Citation
Wickliffe LC, Jossart JA, Theuerkauf SJ, Jensen BM, King JB, Henry T, Sylvia PC, Morris JA Jr. and Riley KL (2024) Balancing conflict and opportunity - spatial planning of shellfish and macroalgae culture systems in a heavily trafficked maritime port. Front. Mar. Sci. 10:1294501. doi: 10.3389/fmars.2023.1294501
Received
14 September 2023
Accepted
07 December 2023
Published
05 January 2024
Volume
10 - 2023
Edited by
Francois Bastardie, Technical University of Denmark, Denmark
Reviewed by
Ibon Galparsoro, Technological Center Expert in Marine and Food Innovation (AZTI), Spain
Andrew M. Fischer, University of Tasmania, Australia
Updates
Copyright
© 2024 Wickliffe, Jossart, Theuerkauf, Jensen, King, Henry, Sylvia, Morris and Riley.
This is an open-access article distributed under the terms of the Creative Commons Attribution License (CC BY). The use, distribution or reproduction in other forums is permitted, provided the original author(s) and the copyright owner(s) are credited and that the original publication in this journal is cited, in accordance with accepted academic practice. No use, distribution or reproduction is permitted which does not comply with these terms.
*Correspondence: Kenneth L. Riley, ken.riley@noaa.gov; Lisa C. Wickliffe, lwickliffe.8481@gmail.com
Disclaimer
All claims expressed in this article are solely those of the authors and do not necessarily represent those of their affiliated organizations, or those of the publisher, the editors and the reviewers. Any product that may be evaluated in this article or claim that may be made by its manufacturer is not guaranteed or endorsed by the publisher.