 Qi Wu
Qi Wu En-ci Zhu
 Xing Xiao
 Yuan-xi Li2
- 1Institute of Geotechnical Engineering, Nanjing Tech University, Nanjing, Jiangsu, China
- 2China Energy Engineering Group Guangdong Electric Power Design Institute Co., Ltd., Guangzhou, Guangdong, China
The offshore wind farm industry has recently experienced significant global growth. This study presents a thorough site investigation and analysis of the cyclic resistance of marine clay for offshore foundation design, using the Shaba wind farm in southern China as a case study. In-situ cone penetrometer (CPTu) tests and borehole sampling are conducted to explore the geotechnical characteristics of the soils. However, the soil conditions are characterized by multiple layers and complex sedimentary components. The classification and mechanical properties, such as water content and cyclic resistances, are compared through CPTu interpretation and laboratory tests. The findings indicated that a single physical indicator cannot determine cyclic resistance. In addition, the well-established method in existing literature proved unsuitable for marine clay. Consequently, multiple regression analysis shows that a linear relationship exist between cyclic resistance and depth-corrected CPTu index [EXP(qE/fs)0.3/H], hence a new evaluation method is developed to predict the cyclic resistance of marine clay based on CPTu data. This research aims to provide more reliable guidance for geotechnical investigations, supporting the rapid expansion of offshore wind farms.
1 Introduction
Wind energy, a sustainable and environmentally friendly energy source, offers an innovative path for global efforts in addressing energy shortages. The installed capacity of offshore wind turbines has shown consistent annual growth. These turbines are typically anchored to the seabed, often involving marine clay layers. Foundation costs, comprising approximately 25%–35% of total costs (Bhattacharya, 2014), necessitate various marine clay parameters for the geotechnical design of diverse foundation solutions. Under complex marine environmental loads, such as wind, waves, storms, and earthquakes, marine clay demonstrates notable stiffness degradation characteristics (Yang et al., 2018; Pan et al., 2021; Xiao et al., 2023) and can even lose strength entirely. Thus, understanding the cyclic resistance of marine clay is crucial for foundation design. However, its precise determination and rational design pose significant challenges in engineering construction (Lunne et al., 2006; Berre et al., 2022; Gao et al., 2024).
The predominant method to determine marine clay’s cyclic resistance involves laboratory cyclic tests, including cyclic triaxial tests, cyclic torsional shear tests, and cyclic direct simple shear tests. These tests demand high-quality soil samples and skilled testers. Nevertheless, soil sample disturbance during drilling and transport can compromise the accuracy of these tests in representing marine clay’s in-situ cyclic resistance. In addition, the requirement for a large volume of soil samples substantially increases the cost. Consequently, the engineering community urgently seeks effective methods to ascertain marine clay’s cyclic resistance with fewer tests.
Comprehensive in-situ and laboratory tests are indispensable in acquiring site geotechnical properties and soil parameters. Cone penetrometer (CPTu) tests are preferred for in-situ testing due to their high accuracy, convenience, and speed (Cai et al., 2012; Cai et al., 2016; Duan et al., 2017; Meng and Pei, 2023). CPTu data comprehensively represent soil strength and deformation capacity under static and dynamic loading. Over the past decades, CPTu-based undrained shear strength evaluation methods for soils have been extensively developed (Sandven, 1990; Eslami, 1997). Subsequently, researchers began developing cyclic strength evaluation methods based on in-situ and laboratory tests (Olsen, 1994; Robertson and Wride, 1998; Robertson, 2009). Juang et al. (2008) developed a deterministic CPTu-based cyclic resistance evaluation method applicable to various soil types. Juang et al. (2012) and Ku and Juang (2012) refined this model. Notably, these models were formulated using CPTu data for terrestrial soils. However, marine clays, influenced by factors like high salt content, low-temperature seawater environments, unique cementitious materials, and complex hydrodynamics, develop flocculated structures distinct from terrestrial soils. Thus, terrestrial clay cyclic resistance models are not directly transferable to marine clays. Limited research focuses on evaluating marine clay cyclic resistance. He et al. (2021) and Wang et al. (2022) explored the cyclic behavior of marine soils using CPTu tests, but they did not develop predictive models. Therefore, creating and refining a cyclic resistance evaluation method for marine clay based on in-situ and laboratory tests is essential.
This study conducts a case study involving CPTu tests at the Shaba offshore wind farm in southern China to establish a cost-effective method to evaluate marine clay cyclic resistance. Soil stratigraphy is delineated, highlighting the soil’s multilayered and complex sedimentation. In addition, consolidated undrained cyclic triaxial tests on marine clay are conducted to assess cyclic resistance, a vital parameter for foundation design. The well-established CPTu-based cyclic resistance evaluation methods in existing literature are not fully applicable to marine clays. Ultimately, this research develops a CPTu-based cyclic resistance evaluation method for marine clay at the Shaba offshore wind farm. The study’s findings will offer assistance and guidance for constructing offshore wind farms in China.
2 Site description
The Yangjiang Shaba Offshore Wind Farm is situated in the southern sea area of Shaba Town, Yangxi County, Yangjiang City, Guangdong Province, as illustrated in Figure 1. This wind farm lies approximately 20 kilometers offshore. The area’s sea is expansive, lacks islands, and features relatively flat terrain. Water depths vary from 23 to 27 meters, with an average tidal range of around 2.73 meters. Summer months bring significant typhoon impacts, leading to maximum wave heights near 8 meters.
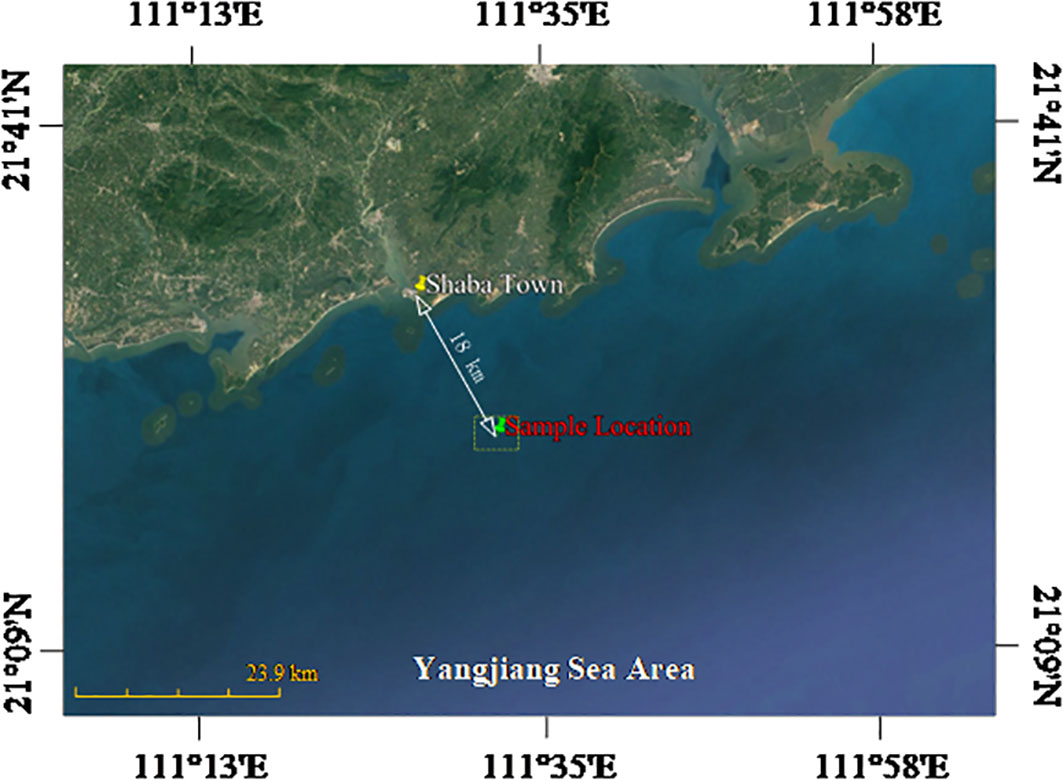
Figure 1 Site location (Base map data © 2023 Google).
The site is positioned at the Rudong River’s mouth, where the sedimentary environment is notably complex, shaped by the combined influences of river flow and ocean waves. Sediments primarily comprise marine, alluvial marine, and residual deposits, characterized by a swift sedimentation rate. Soil stratification will be elaborated upon based on CPTu and borehole sampling results. In addition, the sea area at this location is spacious, devoid of surrounding islands. The seafloor topography is predominantly gentle, showing a trend of higher elevation in the northwest and lower in the southeast. No potential submarine geological hazards, such as underwater landslides, have been identified.
3 CPTu tests and soil characteristic
3.1 CPTu test results
This project entailed offshore field investigations, encompassing 4 CPTu tests (CPTu1, CPTu2, CPTu3, and CPTu4) and four borehole samplings (Y1, Y2, Y3, and Y4), with each borehole sampling site situated about 1 meter from its corresponding CPTu test hole. The CPTu tests utilized the ROSON seabed digital CPT penetration equipment by Van Den Berg, Netherlands. This device operates at a penetration speed of 20 mm/s, boasts a maximum thrust of 50 kN, and can penetrate up to 40 meters deep. It can perform continuous CPTu tests in seabeds with water depths reaching 1500 meters. Borehole sampling employed hydrostatic pressure-driven methodology. Standard Shelby tube samplers were used for soft clay, while thick-walled tube samplers were applied for silty mud and sandy soil. The depths of CPTu1, CPTu2, Y1, and Y2 are 14 meters; CPTu3 and Y3 are 24 meters deep; and CPTu4 and Y4 are 28 meters.
Figure 2 displays the CPTu test results for the four boreholes. Notable fluctuations in qc (cone resistance), fs (sleeve friction), and u2 (pore water pressure) are evident with depth in each borehole, signifying multiple soil layers. Utilizing the CPTu data and laboratory test outcomes, the stratigraphic details of soil layers were determined following the ASTM D2487 (ASTM, 2017) standard. A simplified diagram representing this information accompanies the CPTu test results. Wu et al. (2023) comprehensively described soil stratification methods. The geological strata mainly consist of marine-terrestrial transitional sedimentary layers. The upper part includes Holocene marine deposits, encompassing sludge and medium sand mixed sludge. The lower part comprises the Holocene sea-land transitional sedimentary layer and the late Pleistocene sea-land alternating sedimentary layer, containing clay, silt, fine sand, medium sand, and coarse sand. This study focuses on clay; hence, emphasis is placed on CPTu data pertinent to clay layers. Compared to cohesionless soil and rock layers, the qc and fs values for clay layers are relatively low and show little depth dependence, while the u2 values are higher and typically increase with depth. In addition, an inverse relationship exists between u2 and qc, indicating that higher u2 values correspond to lower qc values. This aligns with the principles of effective stress.
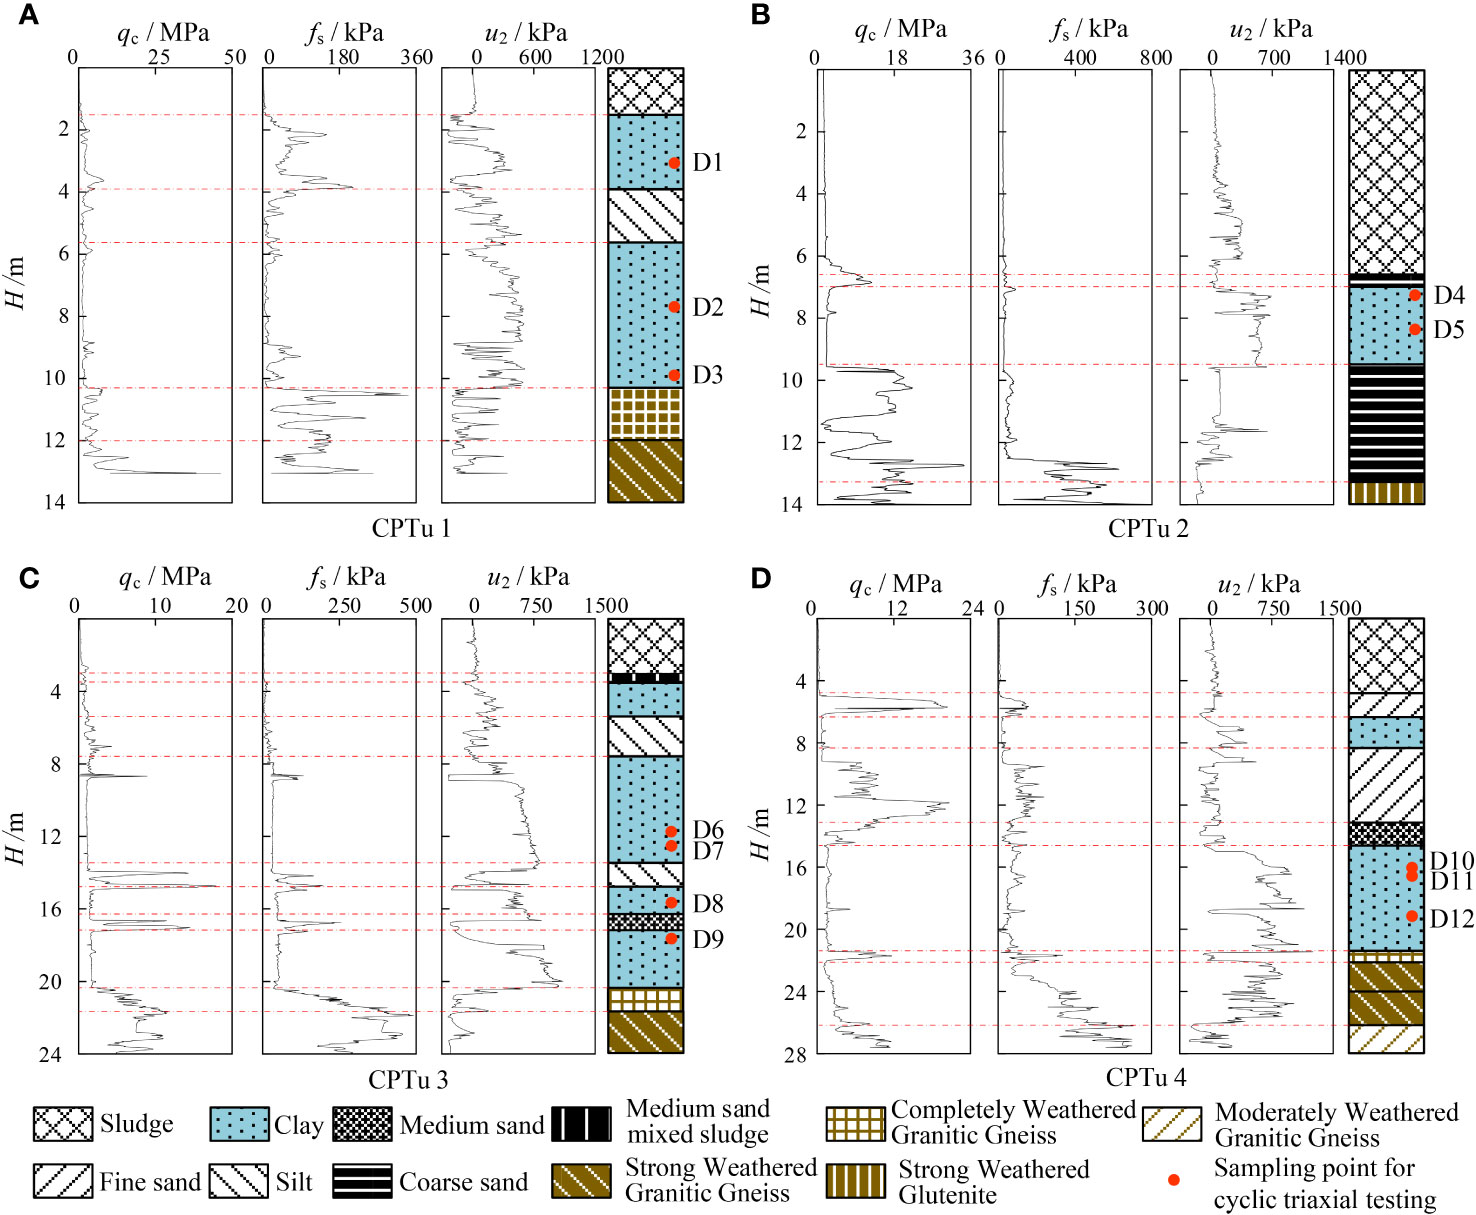
Figure 2 CPTu results and soil layer classifications. (A–D are four different boreholes).
3.2 Index properties of marine clay
The natural water content (w0), density (ρ), plasticity index (Ip), and initial void ratio (e0) of the clay samples (D1~D12, as shown in Figure 2) in the stratum were determined in accordance with ASTM D2216 (ASTM, 2019), D1556/D1556M (ASTM, 2015), and D4318 (ASTM, 2017), respectively. The results are depicted in Figure 3. The properties of the clay layers in the four boreholes exhibit considerable uniformity. The natural water content remains relatively consistent within each borehole, while Ip and ρ gradually increment with depth. Concurrently, e0 exhibits a steady decrease with increasing depth. The red points in Figure 3 symbolize the samples utilized for conducting undrained cyclic triaxial tests. Table 1 summarizes their fundamental physical properties, whereas Figure 4 depicts their positions on the plasticity chart. These clays are categorized as CH and CL based on ASTM D2487 (ASTM, 2017).
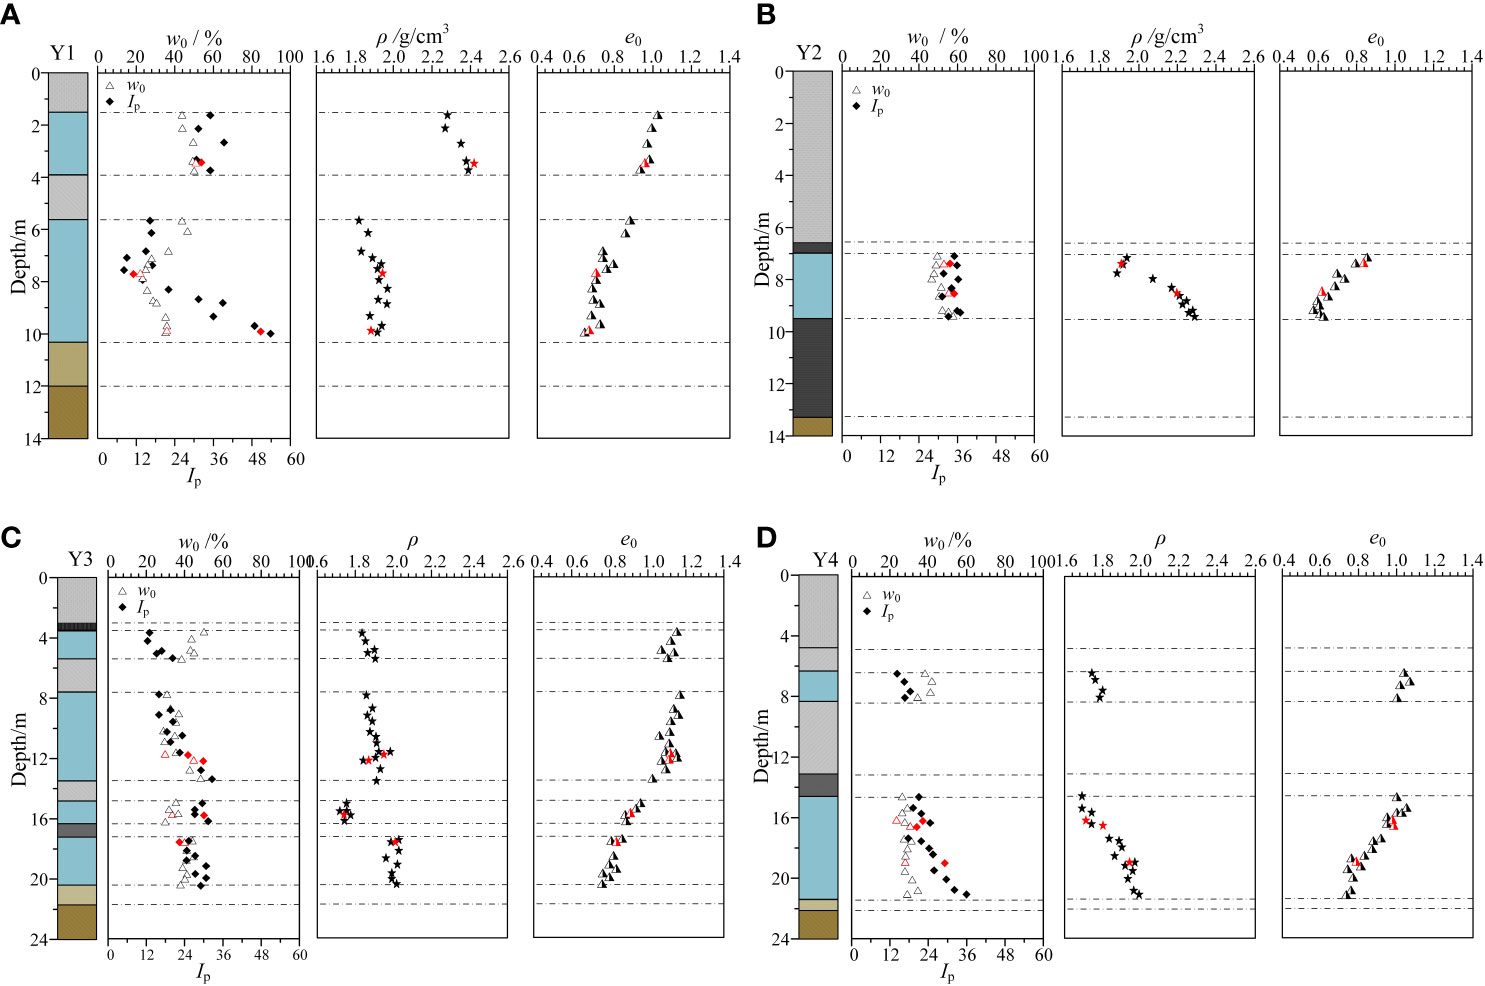
Figure 3 Index properties of marine clay versus depth. (A–D are four different boreholes).
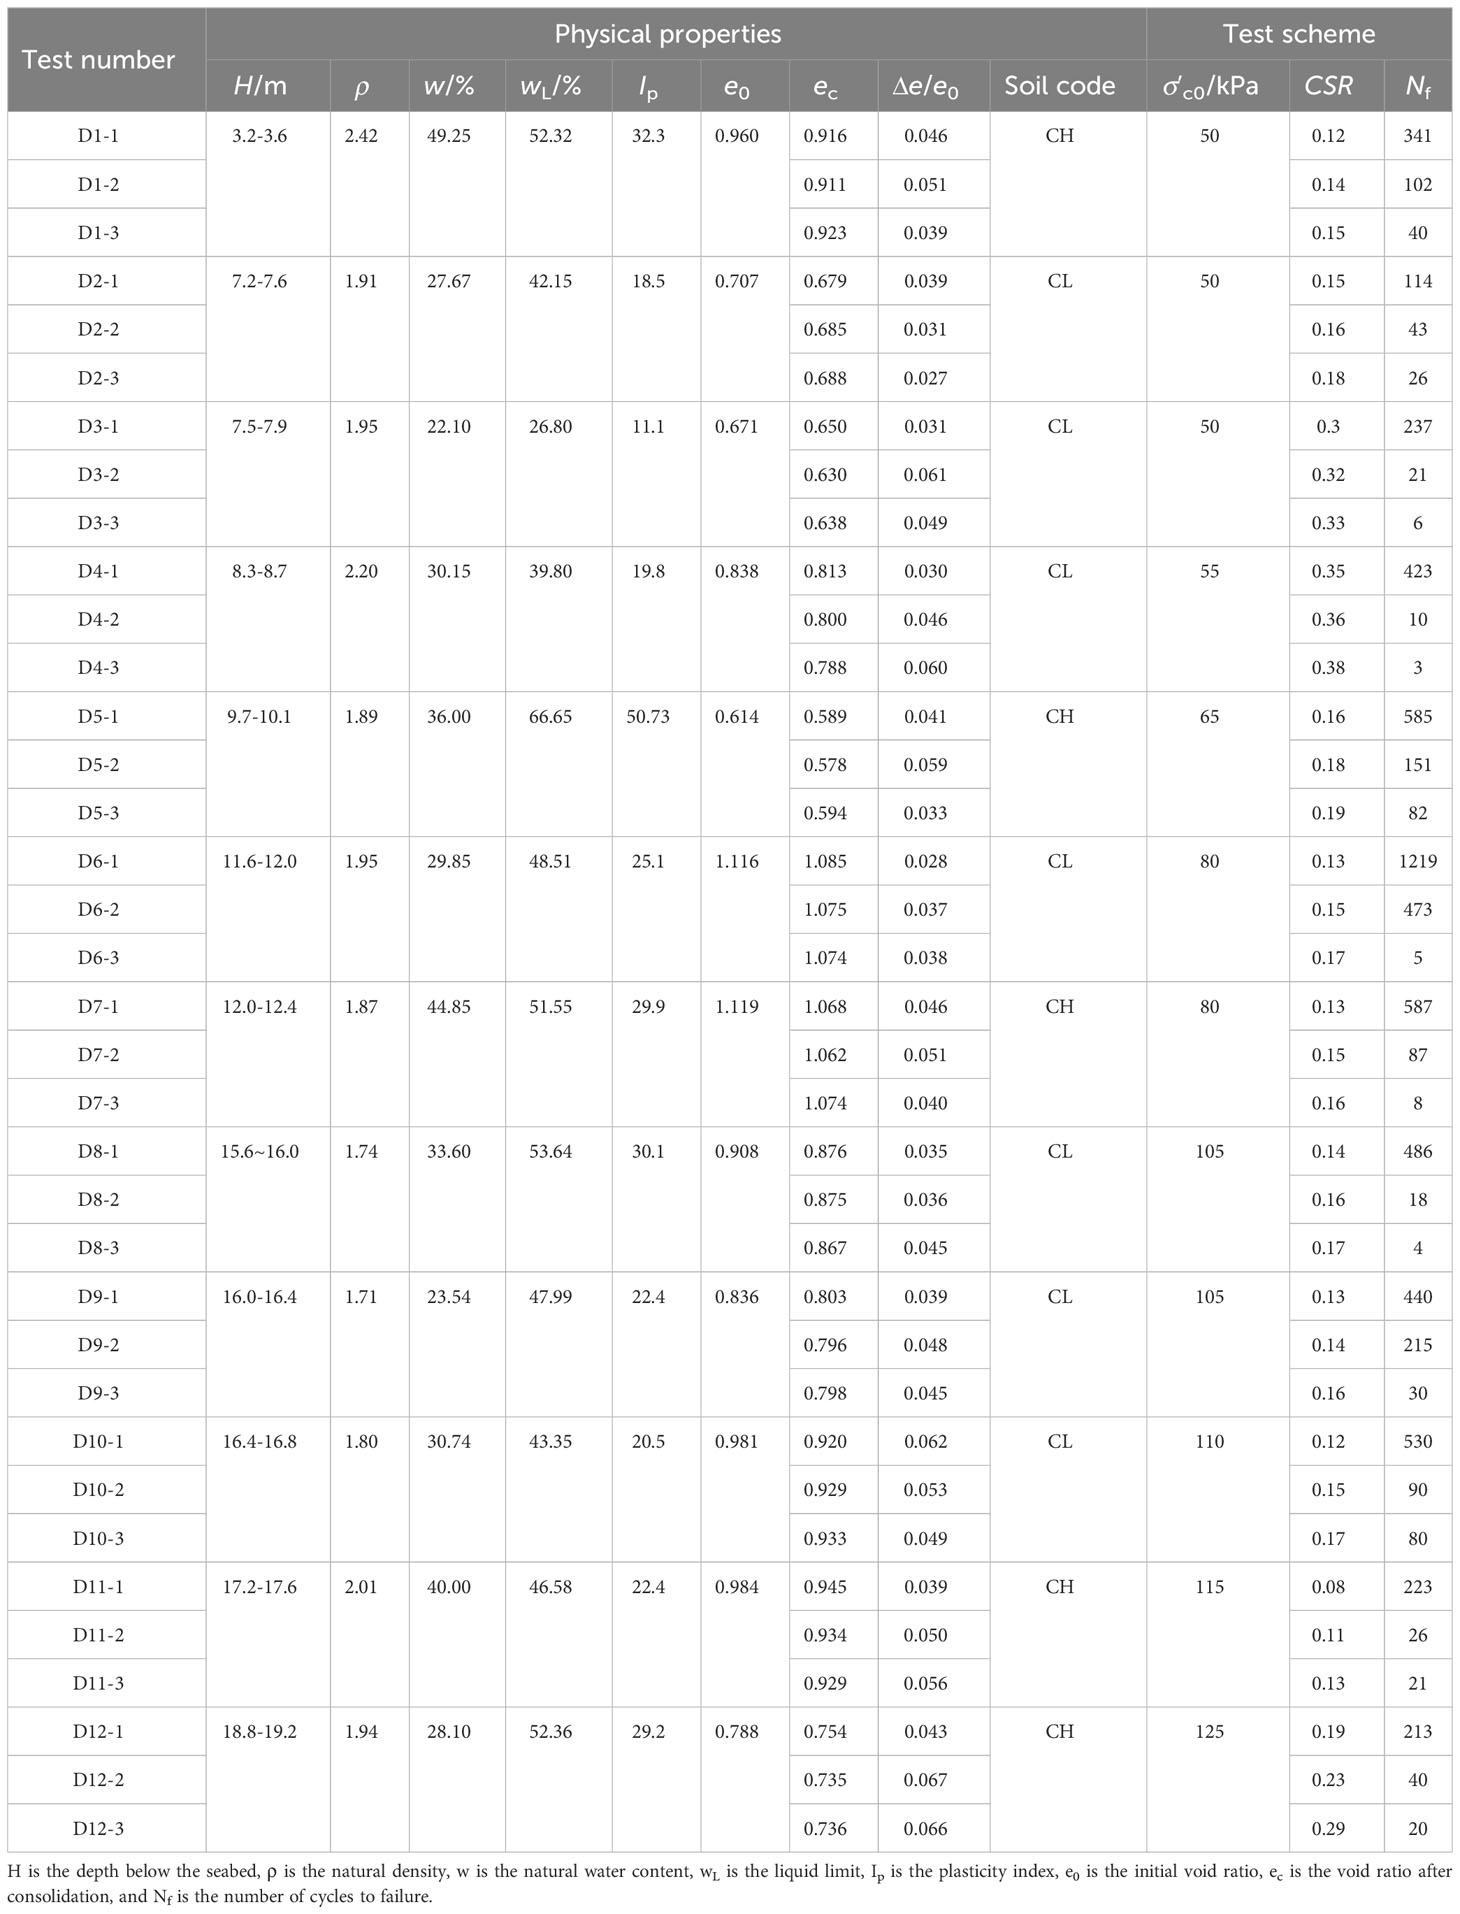
Table 1 Basic physic properties and scheme of undisturbed marine clay.
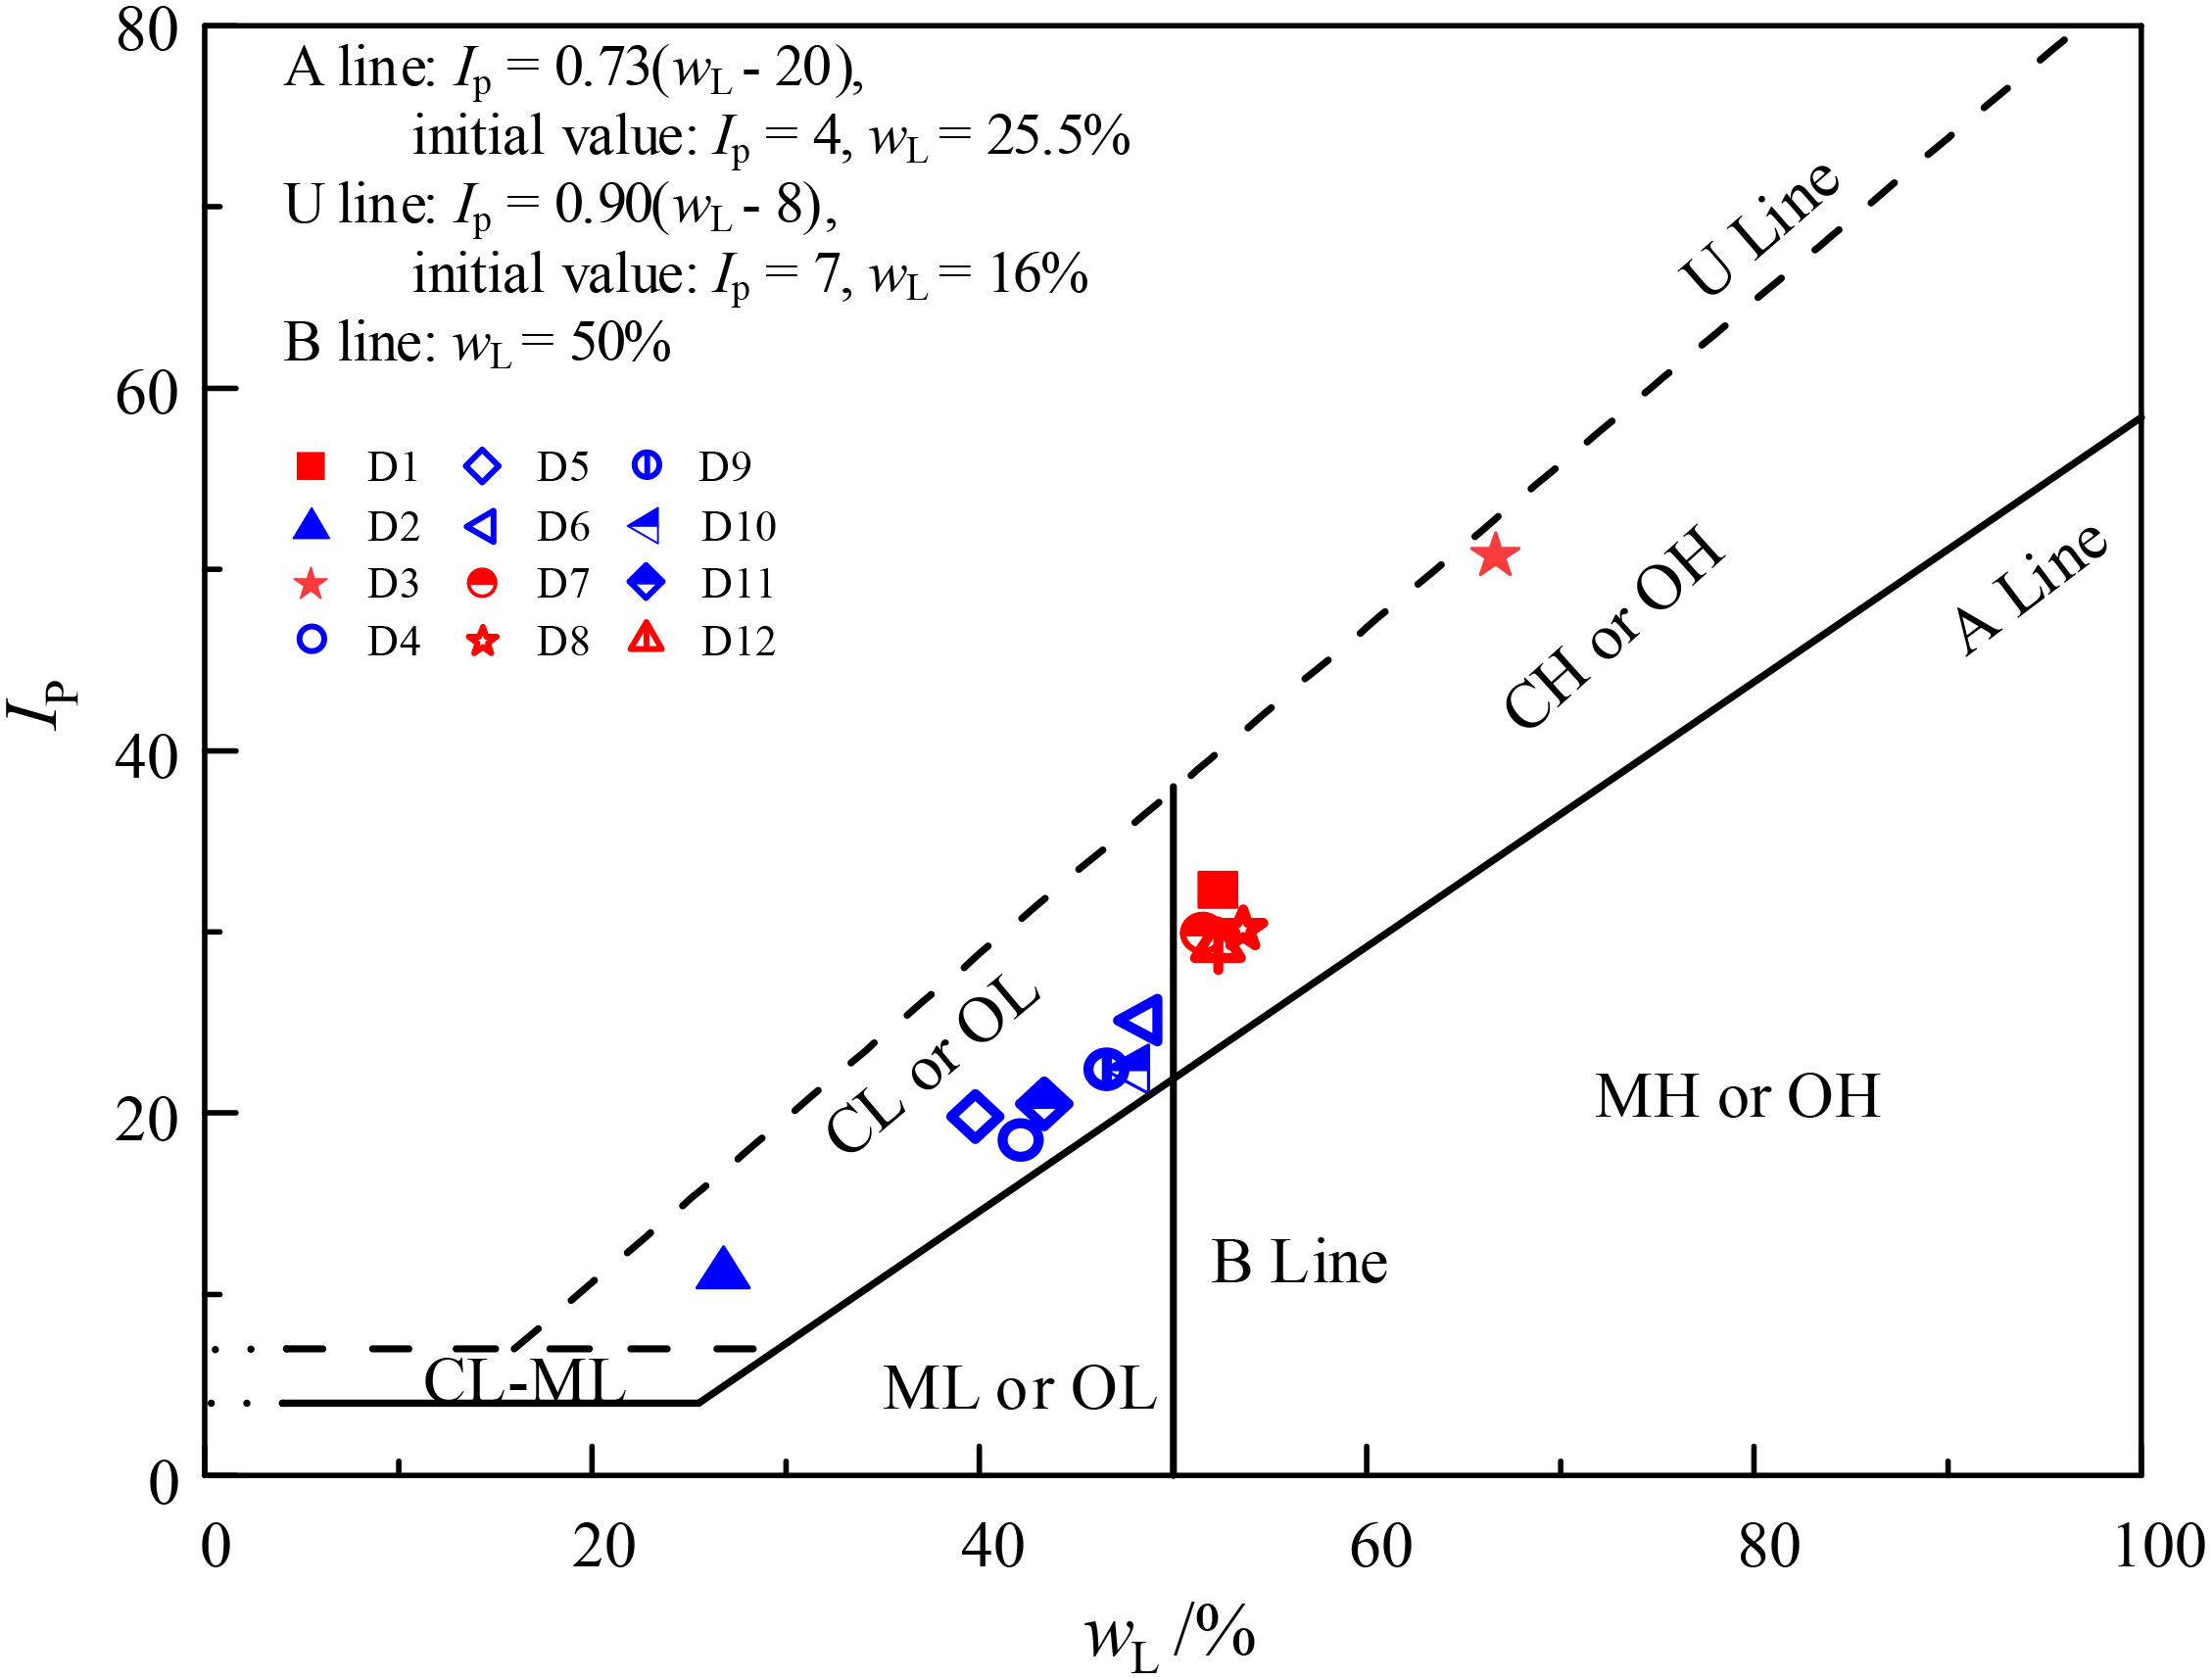
Figure 4 Soil classification lines.
4 Consolidated undrained triaxial test
4.1 Test program
The undrained cyclic triaxial tests were conducted using a dynamic triaxial system provided by GDS Instruments Ltd., UK. Chen et al. (2020) and Ma et al. (2023) offer more comprehensive details. Table 2 lists the primary technical specifications of the controller parameters, sensor range, accuracy, deviation, and other pertinent details. The following must be considered to conduct undisturbed marine clay cyclic triaxial tests following ASTM D5311 (ASTM, 2013): (1) Mold undisturbed marine clay samples into solid cylindrical specimens measuring 50 mm in diameter and 100 mm in height. (2) Situate the prepared specimens in a saturation vessel within a vacuum saturation chamber, initiating specimen saturation via the vacuum method (Lu et al., 2021). (3) Once vacuum saturation concludes, position the sample atop the pedestal in the dynamic triaxial system. (4) Implement backpressure saturation; after each stage, determine the B value, continuing until B exceeds 0.95, signifying complete saturation. (5) Apply uniform consolidation to the fully saturated specimen, selecting the confining pressure based on in-situ effective stresses. Based on ASTM D4767 (ASTM, 2020), consolidation is deemed complete when the average strain rate of the specimen falls below 1 × 10⁻³%/min. Assessing sample quality or disturbance degree prior to laboratory testing is crucial. Lunne et al. (1997) index, assessing sample quality based on void ratio alterations due to loading relative to in-situ effective stresses, was employed in this study, as indicated in Table 1. The findings categorize all examined samples as either “very good to excellent” or “good to fair,” with evaluation criteria detailed in Table 3.
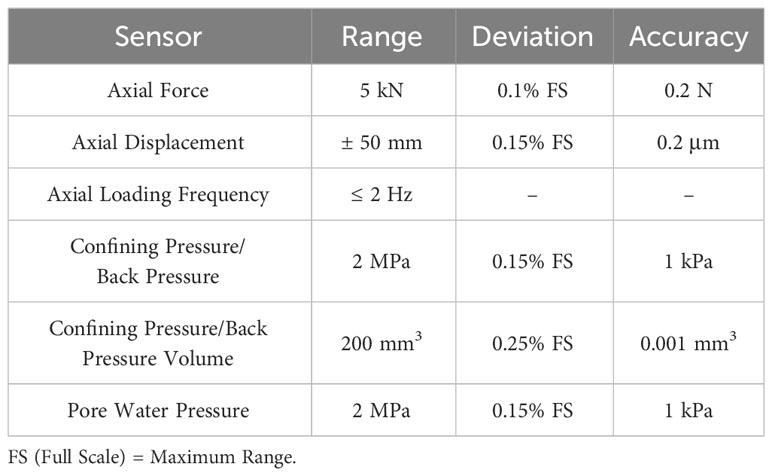
Table 2 The main technical specifications of the GDS dynamic triaxial test apparatus.
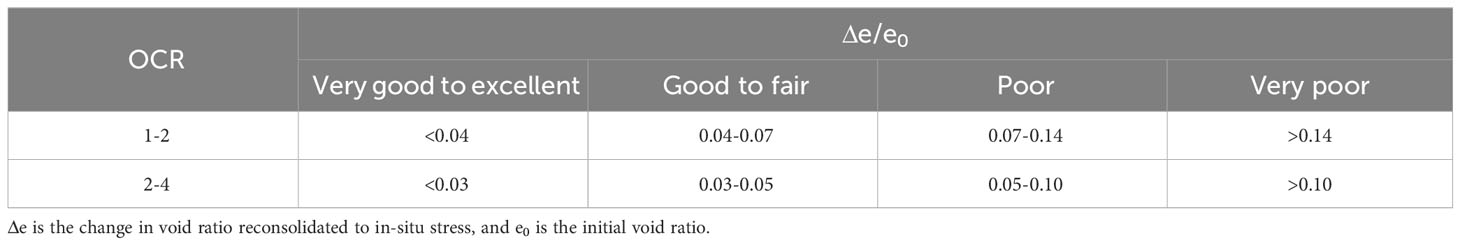
Table 3 Criteria for evaluation of soil sample quality (Lunne et al., 1997).
Post-consolidation, sinusoidal wave loading at a frequency of 0.1 Hz is applied to the specimen. The specific test plan is listed in Table 1. Several tests involving three distinct cyclic stress ratio (CSR) levels are conducted on specimens sharing the same identification. As shown in Equation (1), the CSR is defined as follows:
where σd is the dynamic Stress Amplitude, σ′c0 is the initial effective consolidation stress.
4.2 Representative cyclic responses
Figure 5 displays typical results for the excess pore water pressure ratio ru, axial strain (ϵ) curves, cyclic axial stress, deviator stress-axial strain curve, and effective stress path for D11-2. In these results, the excess pore water pressure ratio (ru) is the ratio of excess pore pressure to initial confining stress. The double amplitude axial strain (ϵDA) is the difference between the maximum and minimum axial strains in each cycle. Nf is the number of cycles needed for the specimen to meet the failure criterion, with this criterion being ϵDA reaching 15% in this test. Figure 5A indicates that the development of ϵ exhibits progressive characteristics during the cyclic loading process. Initially, ϵ increases slowly in a linear manner. As the number of cyclic loading cycles N increases, ϵ grows rapidly, reaching the failure criterion after a relatively small number of cycles. Figure 5B shows that under cyclic loading, the rise in excess water pore pressure in the clay specimen is gradual, and it is challenging for ru to increase to 1.0. At failure, ru is only 0.48, attributed to the lower permeability of marine clay and the ongoing disruption of its cohesive structure due to cyclic loading. Figure 5C shows the relationship between the number of cycles and the axial stress. Figure 5D demonstrates that as N increases, the inclination of the hysteresis loop gradually diminishes, indicating a progressive decrease in the specimen’s stiffness and strength. The shape evolves from “elliptical” to “Z” type. Concurrently, the vertical effective stress decreases, reflecting the development of pore water pressure during the cyclic process. The effective stress path shifts to the left with increasing cycle numbers, as shown in Figure 5E.
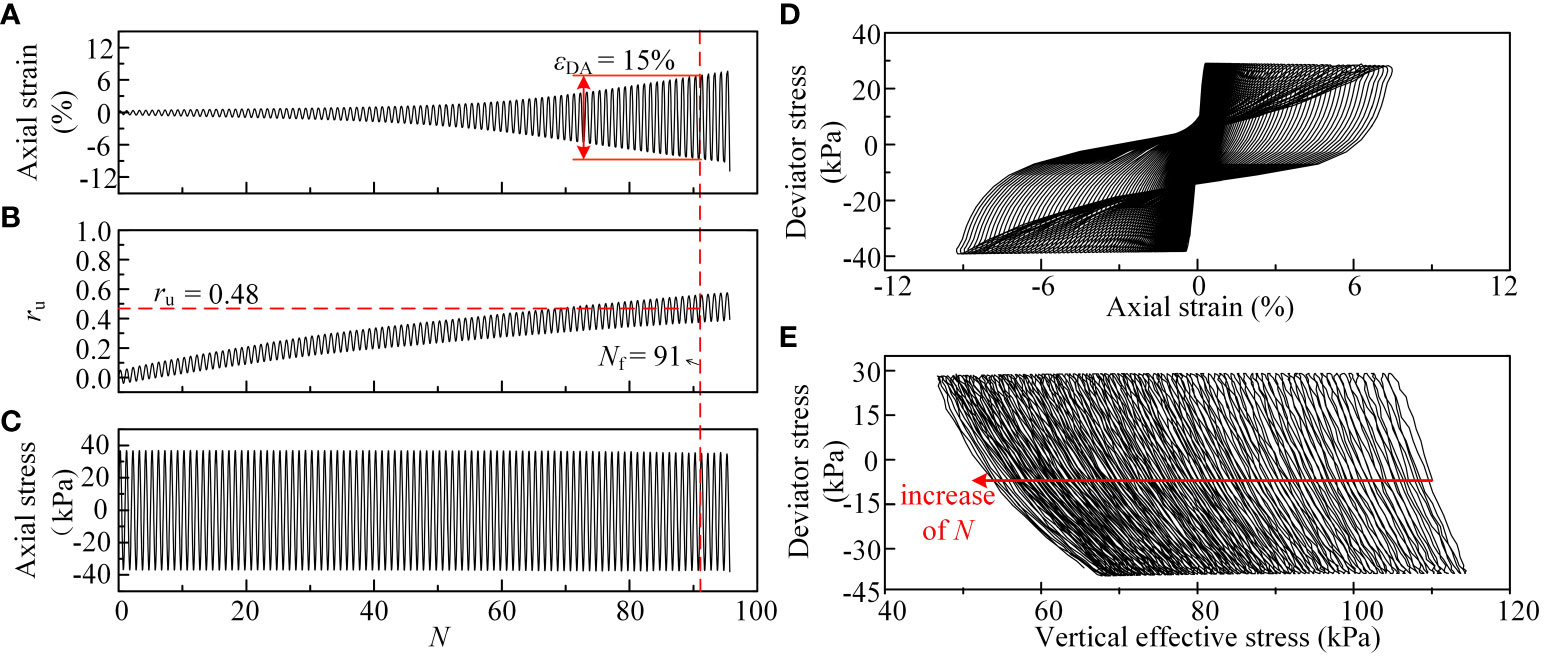
Figure 5 Undrained cyclic triaxial typical test results (A–E show five different typical test results).
4.3 Cyclic resistance in laboratory tests
Ishihara et al. (1980) proposed using a power function to describe the relationship between CSR and Nf. The relationship Equation (2) is as follows:
where a and b are the fitting parameters.
Figure 6 depicts the relationship curve between the CSR and Nf of the clay samples from the Shaba wind farm, with a dashed line representing the fitting curve. The results indicated that as CSR increases, Nf decreases, demonstrating that the marine clay is more prone to damage under high cyclic loading conditions. However, the change pattern in cyclic resistance for each specimen remains unclear.
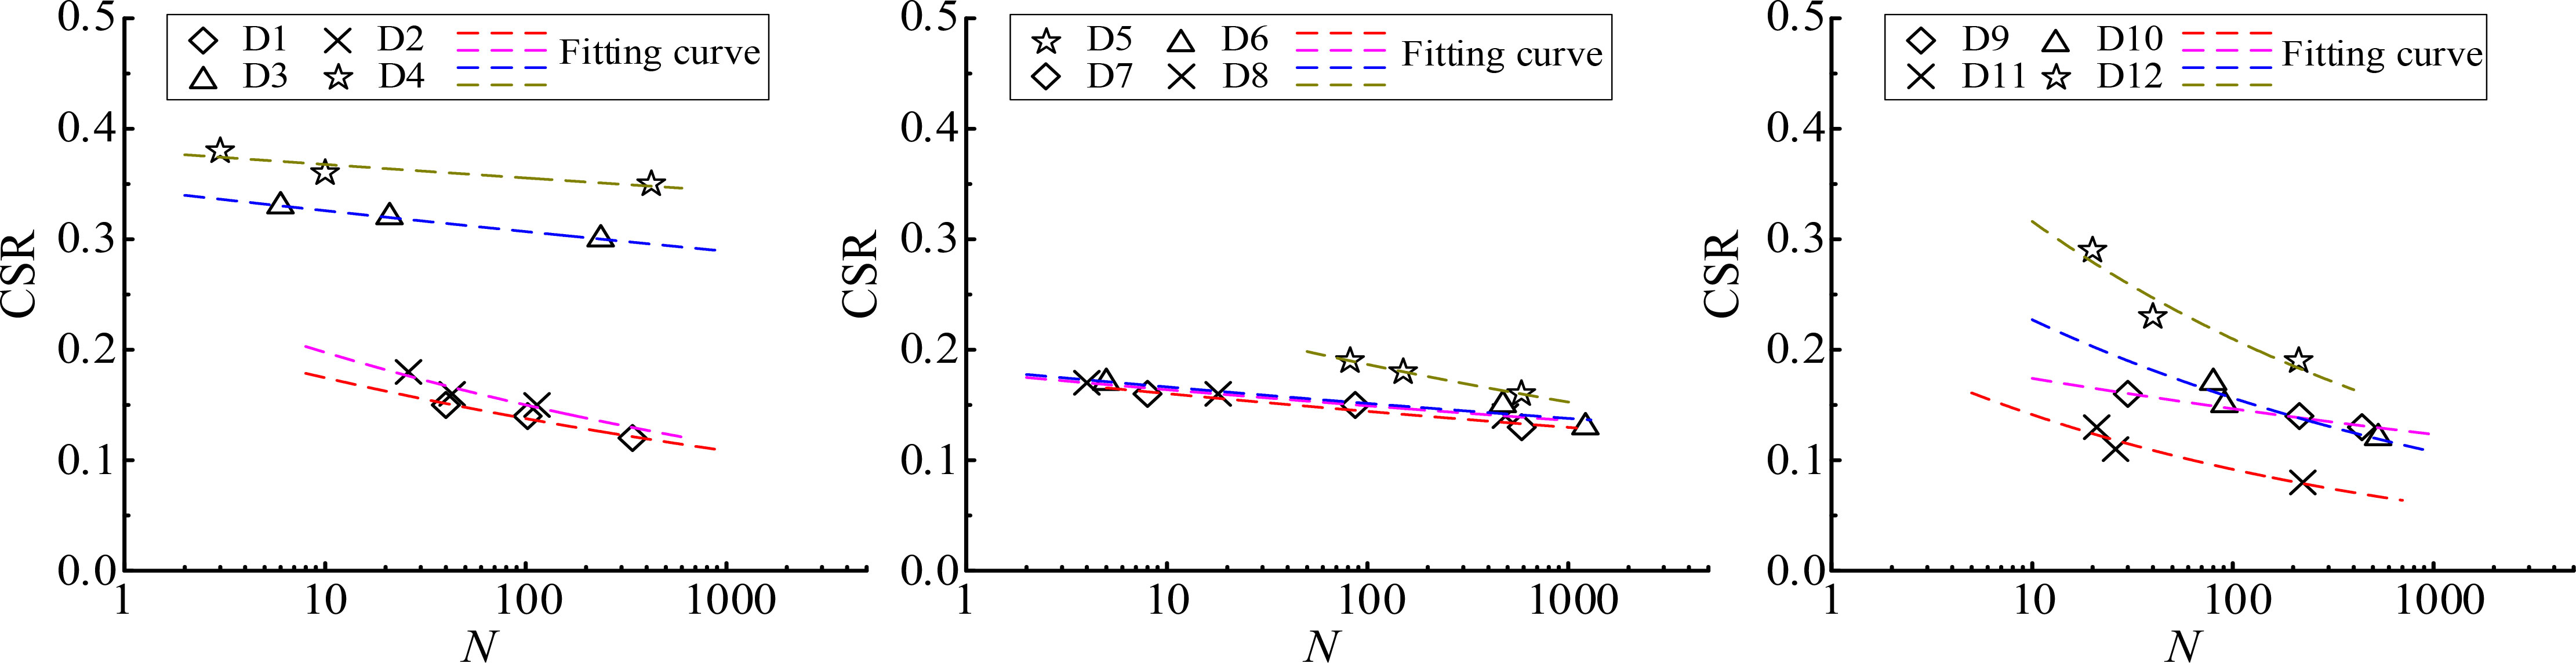
Figure 6 Dynamic strength curve of marine clay.
Nf directly correlates with the seismic moment. Based on Idriss and Boulanger (2008), an Nf of 15 typically corresponds to a seismic moment of 7.5. Hence, the CSR value corresponding to 15 cycles of uniform loading, extracted from the Nf vs. CSR correlation curve, represents its cyclic resistance (CRRlab), as displayed in Table 4. Figure 7 illustrates the correlations between H, ρ, w, Ip, and CRRlab of the tested sample. It indicates that CRRlab does not significantly correlate with H, ρ, w, and Ip. Thus, it cannot evaluate CRRlab by a single physical index of marine clay.

Table 4 Cyclic resistance of marine clay.
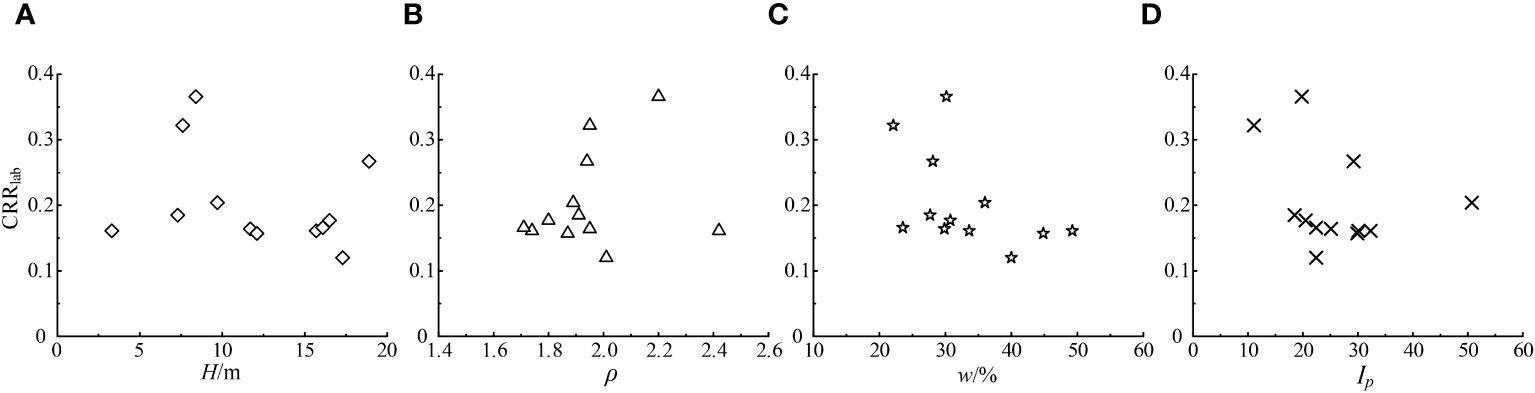
Figure 7 Correlation between H, ρ, w, Ip, and CRRlab. (A–D are four different factors).
5 CPTu-based evaluation method for cyclic resistance of marine clay
Considering cone resistance as an indicator of the failure strength of soils in situ (Yu, 2006) and sleeve friction fs as a measure of soil strength post-failure, Robertson and Wride (1998) proposed a complex cyclic resistance evaluation method. This approach considers in-situ vertical stress, soil behavior type index Ic, and modified cone resistance qt1N. Juang et al. (2008) simplified the parameters and developed a method using the soil behavior type index Ic,BJ and modified cone resistance qt1N. Compared to Robertson and Wride’s model, Juang et al.’s approach accounts for the influence of excess pore water pressure, offering insights into soil consolidation and permeability properties (Chai et al., 2011). In contrast, Olsen’s method (Olsen, 1994) does not consider soil type and excess pore water pressure. These three models, based on CPTu tests on terrestrial soils, are summarized in Table 5. Figure 8 presents the field cyclic resistance ratio (CRRfield) calculated using these three models for four borehole locations. It reveals generally consistent trends in results calculated by each model with depth, albeit with notable differences in numerical values. At borehole locations CPTu 1, CPTu 3, and CPTu 4, Olsen’s model yields the highest CRRfield, followed by the Robertson model, with Juang’s model providing the lowest values. In contrast, at borehole locations CPTu 2, Olsen’s model results in the lowest CRRfield, Juang’s model is intermediate, and the Robertson model calculates the highest values.
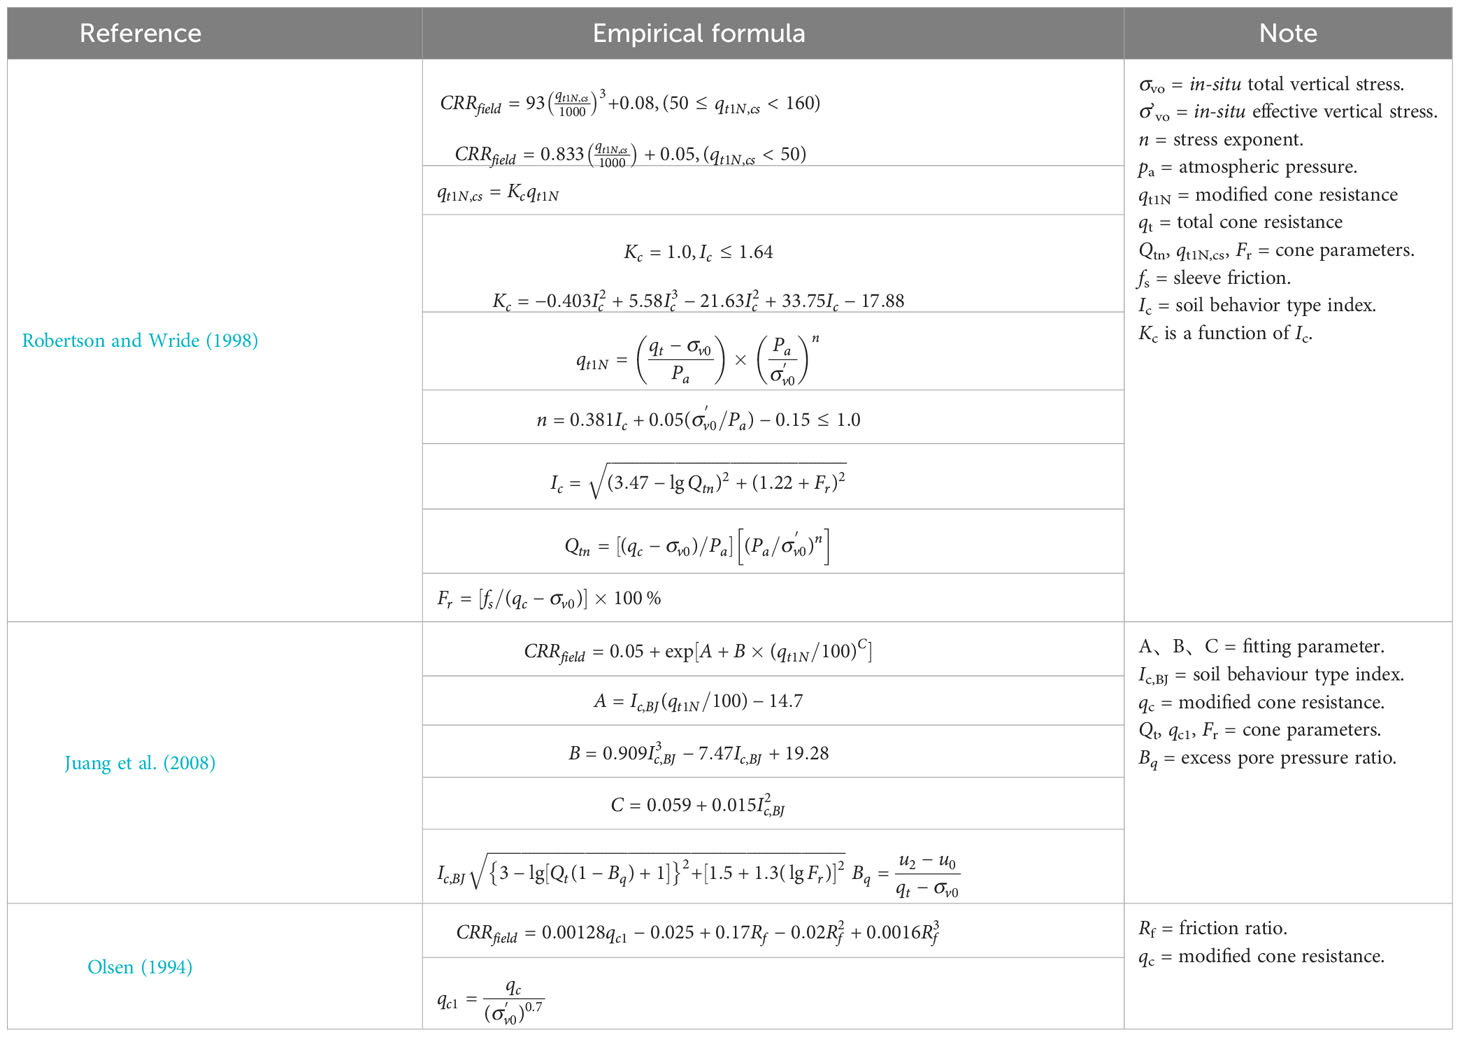
Table 5 CRRfield calculation model based on CPTu.
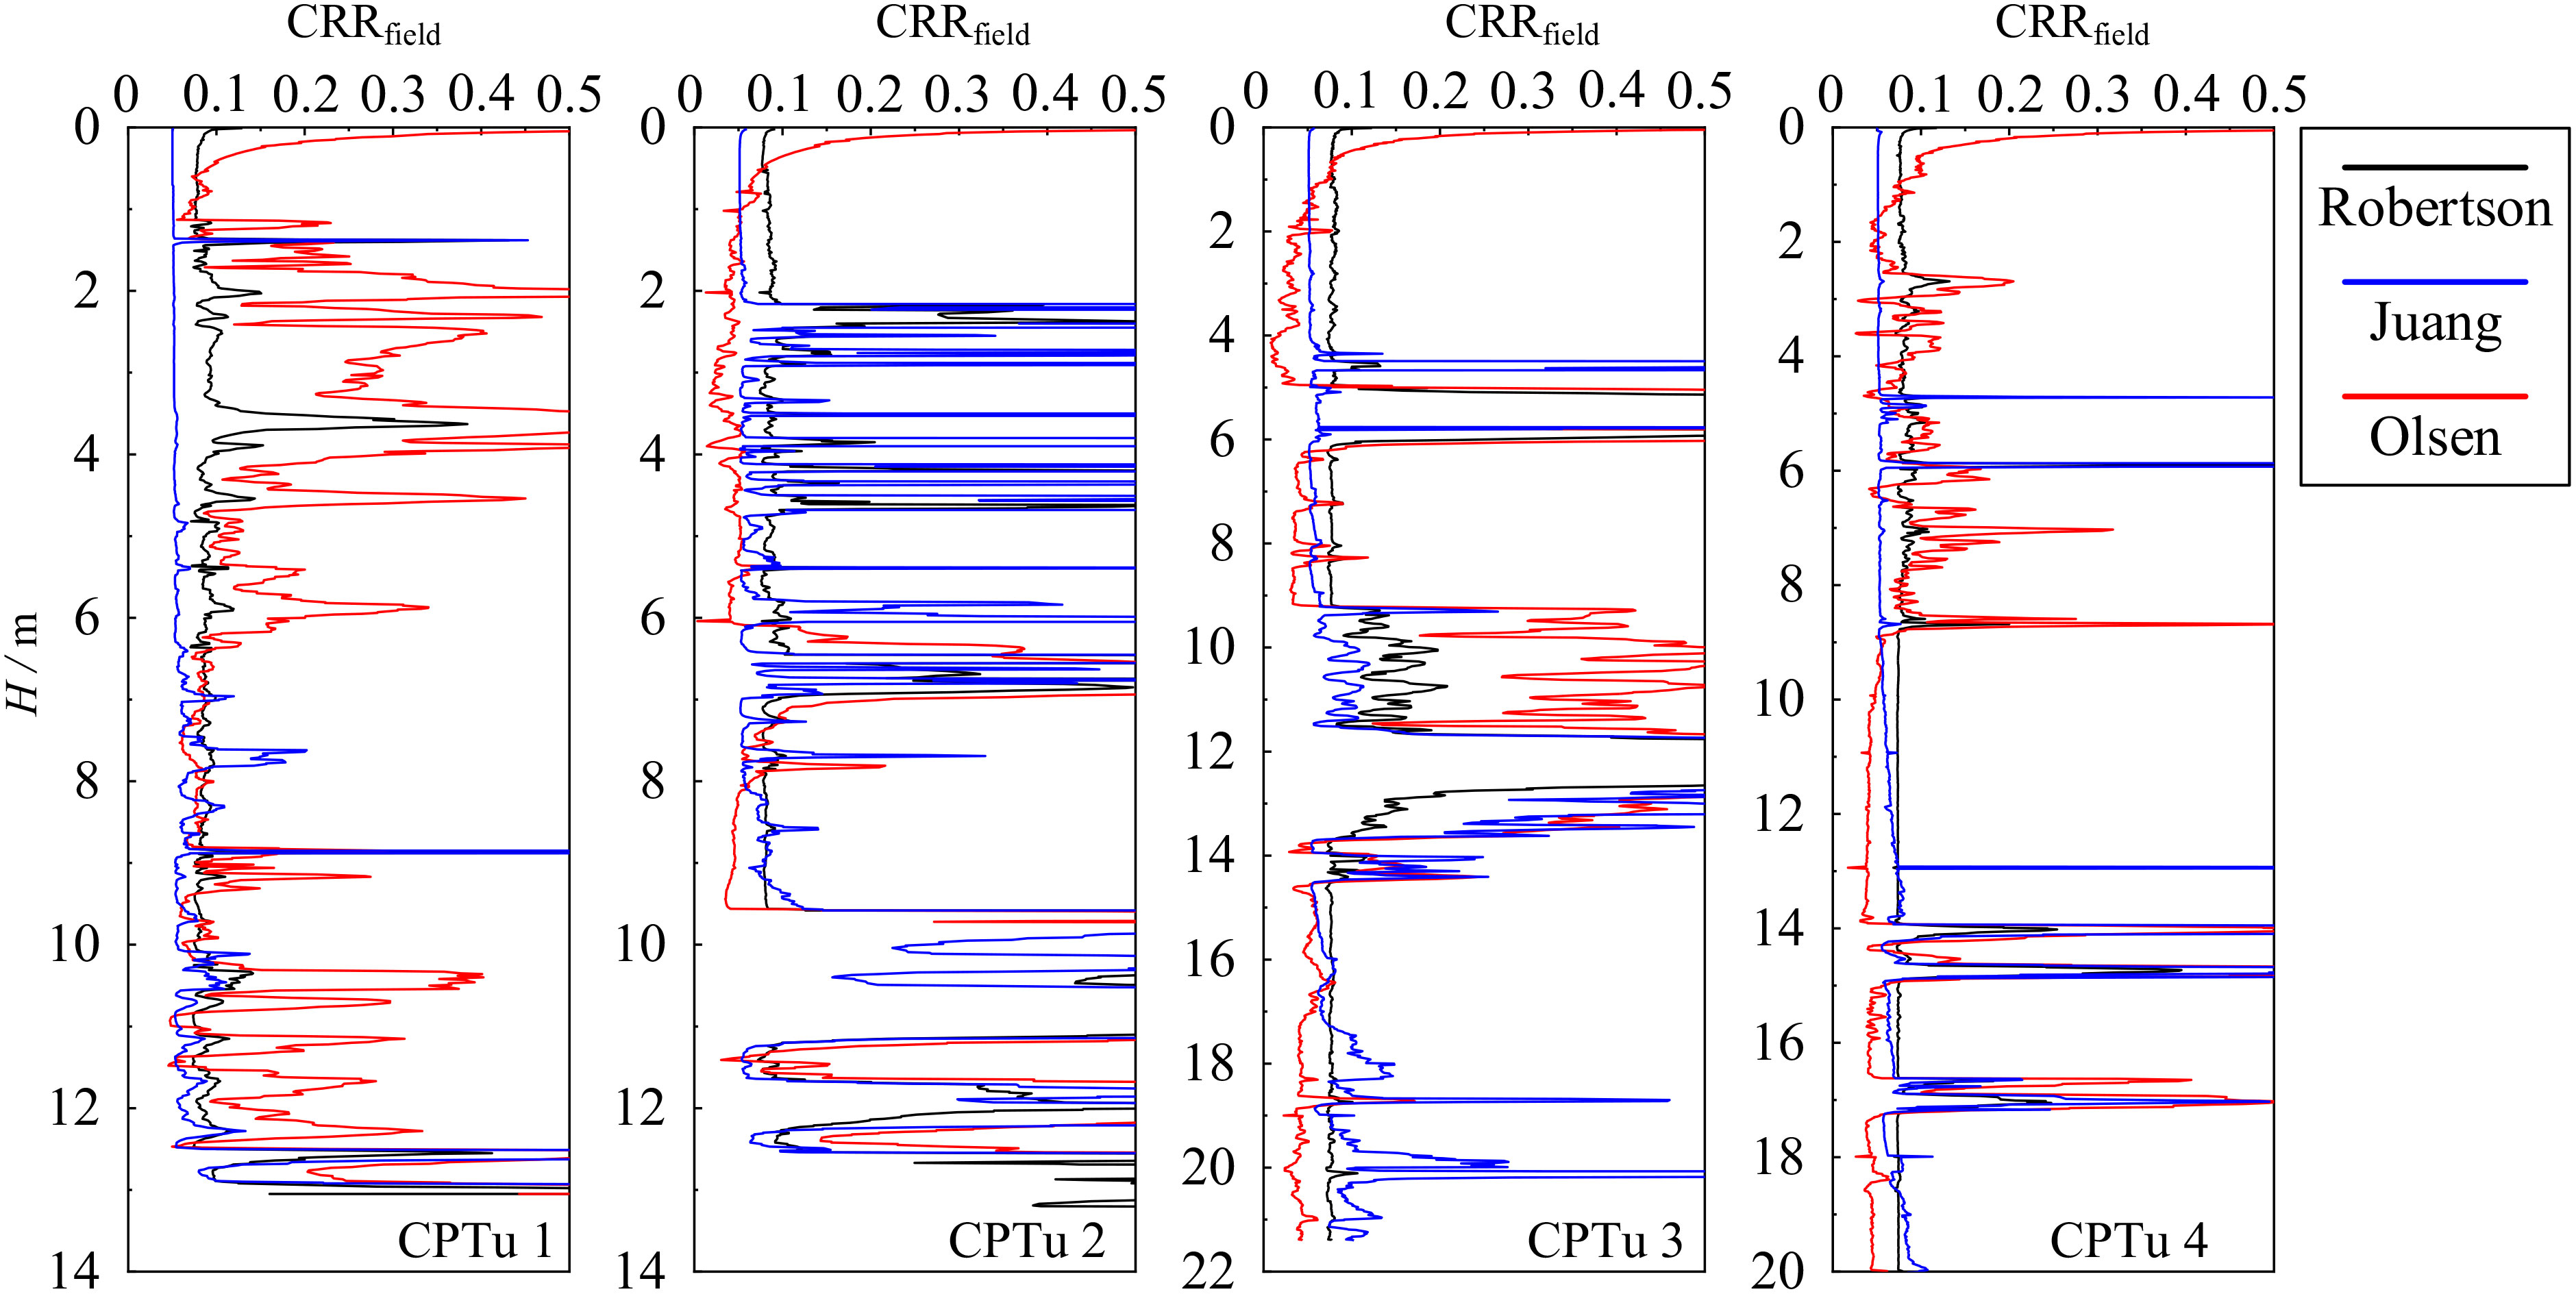
Figure 8 CRRfield calculation curve based on CPTu data.
The laboratory test conditions are a simplified representation of field conditions. Differences often arise when applying results from laboratory cyclic triaxial tests to field situations. Seed (1979) proposed a conversion factor, Cr, to modify CRRlab, yielding CRRfield, as demonstrated in the subsequent Equation (3):
where 0.9 is the correction factor for converting the laboratory cyclic resistance ratio under unidirectional loading to the cyclic resistance ratio under multiple-direction loading conditions in the field, Cr is taken as 0.7.
Comparisons of CRRfield, as calculated by various models at respective depths, with CRRfield-lab determined by the test results are depicted in Figure 9. This figure reveals that Robertson’s and Juang’s approaches exhibit comparable effectiveness, with most errors remaining under 30% relative to CRRfield-lab. However, Olsen’s method, which does not account for soil type and excess pore water pressure, shows the least accuracy, with errors surpassing 60%.
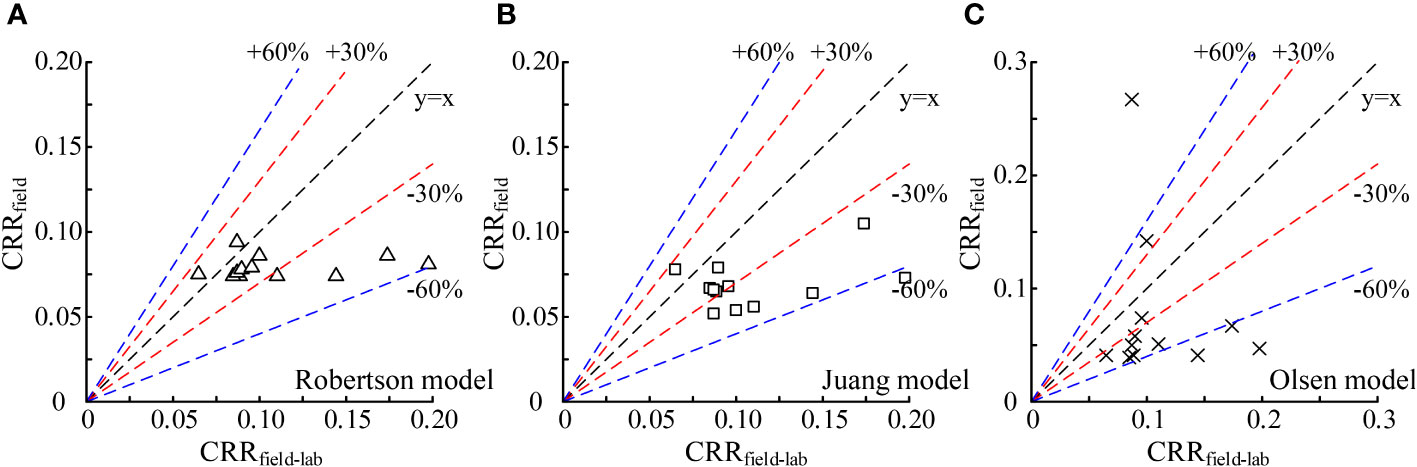
Figure 9 Comparison of CPTu-based CRRfield calculation results with indoor results CRRlab. (A–C are three different methods).
Accordingly, while CRRfield models derived from CPTu data show some applicability, the overall errors are significant. In addition, these models lack a clear functional relationship, potentially limiting their utility in practical engineering projects. As detailed in Section 3, the geotechnical properties of soil layers vary considerably at different depths. Incorporating soil characteristics indicated by qt, u2, and fs, and amalgamating laboratory test outcomes with CPTu data, a discernible functional relationship emerges among the effective cone tip resistance qE (= qt − u2), fs, and CRRfield-lab. Thus, an empirical model to predict CRRfield-lab for marine clay was formulated, using qE, fs, and H as independent variables, with CRRfield-lab as the dependent variable, as delineated in Equation 4. Notably, H accounts for the in-situ stress of soils. Through multiple regression analysis, a new CRRfield-lab evaluation method based on depth-corrected CPTu index [EXP(qE/fs)0.3/H] was developed, as Equation (4) shown, and its application to assess CRRfield-lab for marine clay in the Yangjiang Wind Farm offshore area has demonstrated a robust fit, as illustrated in Figure 10.
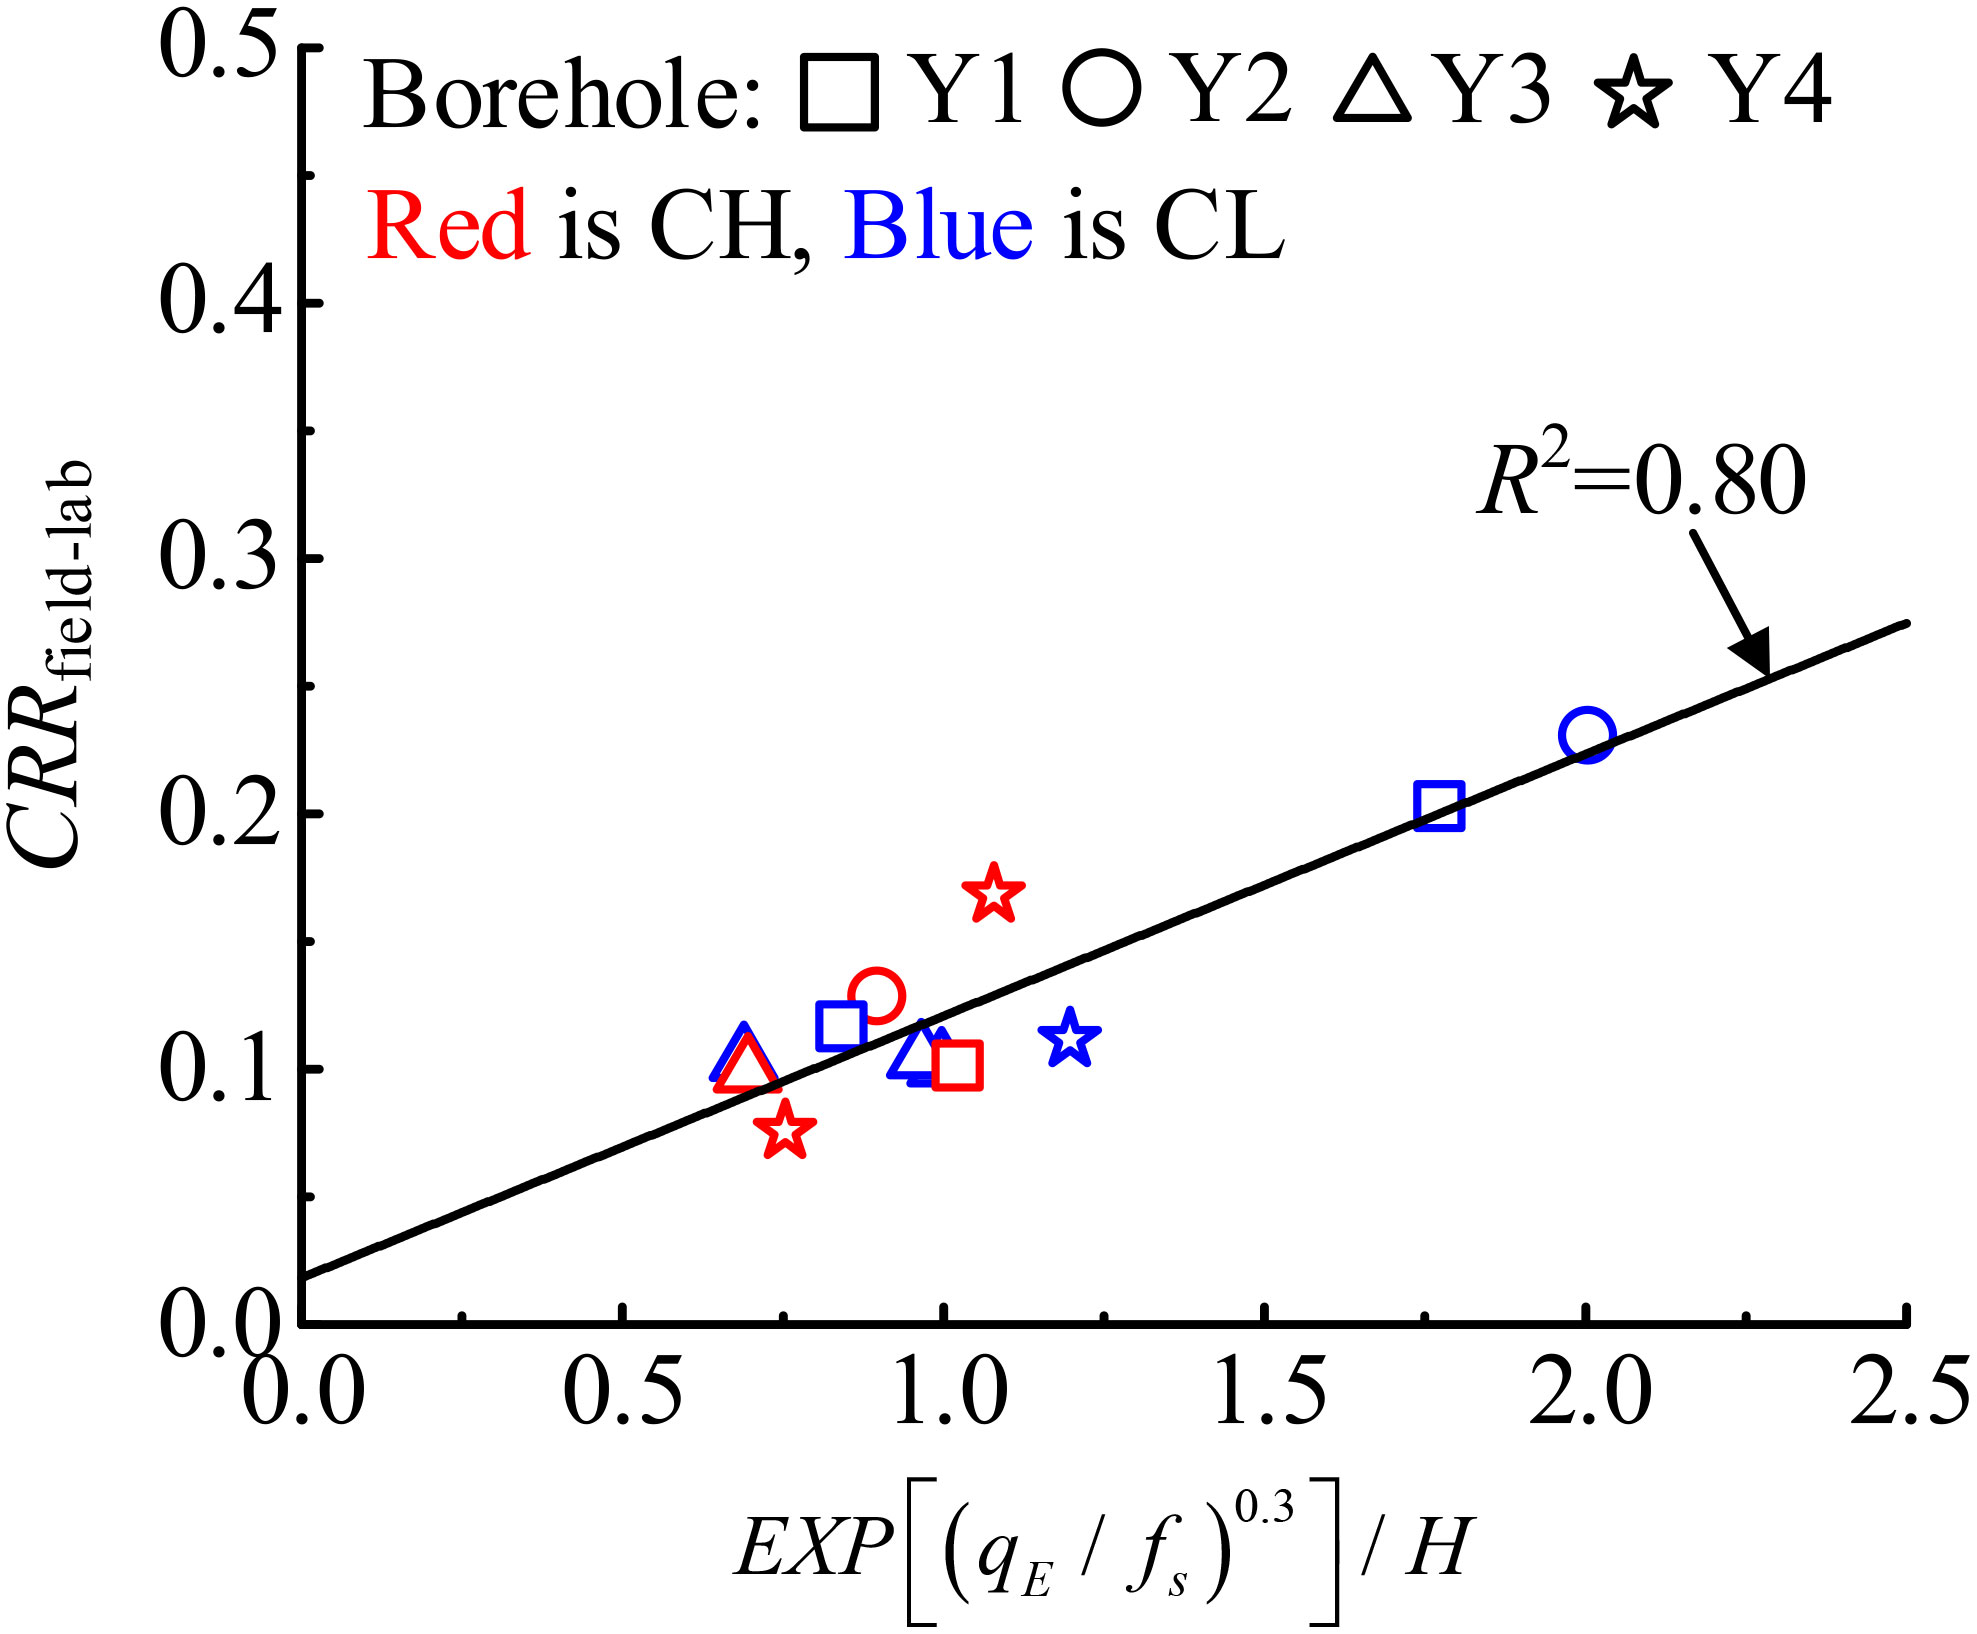
Figure 10 Dynamic strength evaluation method of marine clay based on CPTu data.
Noted that the CPTu-based CRRfield-lab prediction model proposed in this study can effectively predict the cyclic resistance of marine clay, which makes up for the difficulty of sampling and high testing costs in offshore engineering. Also, compared with the above three well-developed prediction models (Olsen, 1994; Robertson and Wride, 1998; Juang et al., 2008), the CRRfield-lab prediction model contains just only fewer basial physical parameters, i.e., if the depth H and CPTu data of marine clay are determined, then the CRRfield-lab can be evaluated quickly and efficiently, which provides a significant advantage in the evaluation of liquefaction triggering of marine soils in practice.
6 Conclusion
This study presents the site investigation and cyclic resistance of marine clay, utilizing CPTu tests and advanced laboratory tests, taking the Shaba wind farm in southern China as a case study. An evaluation method for the cyclic resistance of marine clay, grounded in CPTu data, is introduced. The key conclusions are as follows:
1. The interpretation of CPTU data and index parameter tests depict the site conditions as having a multilayered and intricate sedimentary structure. The initial void ratio of clay layers shows a gradual increase with depth.
2. Under cyclic loading, the marine clay’s hysteresis loop dip angle in the Yangjiang Sea region diminishes progressively, gradually reducing soil stiffness and strength. Concurrently, the maximum strain typically occurs post-peak stress, highlighting the delayed response between stress and strain in marine clay. In addition, the hysteresis curve’s expansion toward the stretching direction suggests an elevated risk of tensile failure in the sample.
3. The CRRlab, derived from consolidated undrained cyclic triaxial tests, was converted to an in-situ CRRfield-lab. Notable discrepancies were observed between the calculated results of the existing prediction methods based on CPTu data and the actual CRRfield-lab. Utilizing the CPTu data qE, fs, and depth H, a linear relationship existed between cyclic resistance and depth-corrected CPTu index [EXP(qE/fs)0.3/H]. Then an alternative evaluation method to determine the CRRfield-lab of marine clay was proposed. This method yielded prediction results that align well with engineering practice requirements.
Data availability statement
The raw data supporting the conclusions of this article will be made available by the authors, without undue reservation.
Author contributions
QW: Conceptualization, Data curation, Project administration, Resources, Validation, Visualization, Writing – original draft, Writing – review & editing. EZ: Data curation, Investigation, Methodology, Validation, Writing – original draft, Writing – review & editing. XX: Data curation, Investigation, Methodology, Validation, Visualization, Writing – review & editing. YL: Conceptualization, Methodology, Resources, Supervision, Validation, Visualization, Writing – review & editing. GC: Conceptualization, Data curation, Funding acquisition, Supervision, Validation, Visualization, Writing – review & editing.
Funding
The author(s) declare that no financial support was received for the research, authorship, and/or publication of this article.
Conflict of interest
Author YX-L was employed by China Energy Engineering Group Guangdong Electric Power Design Institute Co., Ltd.
The remaining authors declare that the research was conducted in the absence of any commercial or financial relationships that could be construed as a potential conflict of interest.
Publisher’s note
All claims expressed in this article are solely those of the authors and do not necessarily represent those of their affiliated organizations, or those of the publisher, the editors and the reviewers. Any product that may be evaluated in this article, or claim that may be made by its manufacturer, is not guaranteed or endorsed by the publisher.
Glossary
References
ASTM D1556/D1556M-15E01 (2015). Standard test method for density and unit weight of soil in place by sand-cone method (West Conshohocken, PA: ASTM International). doi: 10.1520/D1556_D1556M-15E01
ASTM D2216-19 (2019). Standard test method for laboratory determination of water (moisture) content of soil and rock by mass (West Conshohocken, PA: International). doi: 10.1520/D2216-19
ASTM D2487-17E01 (2017). Standard practice for classification of soils for engineering purposes (Unified Soil Classification System) (West Conshohocken, PA: ASTM International). doi: 10.1520/D2487-17E01
ASTM D4318-17E01 (2017). Standard test method for sand content by volume of bentonitic slurries (West Conshohocken, PA: ASTM International). doi: 10.1520/D4318-17E01
ASTM D4767-11 (2020). Standard Test Method for Consolidated Undrained Triaxial Compression Test for Cohesive Soils (West Conshohocken, PA: ASTM International). doi: 10.1520/D4767-11
ASTM D5311-13 (2013). Standard test method for load controlled cyclic triaxial strength of soil (West Conshohocken, PA: ASTM International). doi: 10.1520/D5311_D5311M-13
Berre T., Lunne T., L'Heureux J. S. (2022). Quantification of sample disturbance for soft, lightly overconsolidated, sensitive clay samples. Can. Geotechnical J. 2), 59. doi: 10.1139/cgj-2020-0551
Bhattacharya S. (2014). Challenges in design of foundations for offshore wind turbines. Eng. Technol. Ref. 0041 1 (1), 922. doi: 10.1049/etr.2014.0041
Cai G. J., Chu Y., Liu S. Y., Puppala A. J. (2016). Evaluation of subsurface spatial variability in site characterization based on RCPTU data. Bull. Eng. Geology Environ. 1), 1–12. doi: 10.1007/s10064-015-0727-8
Cai G. J., Liu S. Y., Puppala A. J. (2012). Reliability assessment of CPTU-based pile capacity predictions in soft clay deposits. Eng. Geology 141-142, 84–91. doi: 10.1016/j.enggeo.2012.05.006
Chai J. C., Agung P. M. A., Hino T., Igaya Y., Cater J. P. (2011). Estimating hydraulic conductivity from piezocone soundings. Géotechnique 61 (8), 699–708. doi: 10.1680/geot.10.P.009
Chen G. X., Wu Q., Zhao K., Shen Z. F. (2020). A binary packing material-based procedure for evaluating soil liquefaction triggering during earthquakes. J. Geotech Geoenviron. Eng. 146 (6), 04020040. doi: 10.1061/(ASCE)GT.1943-5606.0002263
Duan W., Liu S. Y., Cai G. J. (2017). Evaluation of engineering characteristics of Lian-Yan railway soft soil based on CPTU data-A case study. Proc. Eng. 189, 33–39. doi: 10.1016/j.proeng.2017.05.006
Eslami A. (1997). Bearing capacity of piles from cone penetration test data (Canada: University of Ottawa).
Gao H., Sun J., Stuedlein A. W., Li S., Wang Z., Liu L., et al. (2024). Flowability of saturated sands under cyclic loading and the viscous fluid flow failure criterion for liquefaction triggering. J. Geotech Geoenviron. Eng. 150 (1), 04023130. doi: 10.1061/JGGEFK.GTENG-11872
He B., Yang S. L., Andersen K. H. (2021). Soil parameters for offshore wind farm foundation design: A case study of Zhuanghe wind farm. Eng. Geology 285, 106055. doi: 10.1016/j.enggeo.2021.106055
Idriss I. M., Boulanger R. W. (2008). Soil liquefaction during earthquakes (Earthquake Engineering Research Institute).
Ishihara K., Troncoso J., Kawase Y., Takahashi Y. (1980). Cyclic strength characteristics of tailings materials. Soils Found. 20, 127–142. doi: 10.3208/sandf1972.20.4_127
Juang C. H., Ching J., Ku C. S., Hsieh Y. H. (2012). Unified CPTu-based probabilistic model for assessing probability of liquefaction of sand and clay. Géotechnique 62 (10), 877–892. doi: 10.1680/geot.9.P.025
Juang C. H., Chen C. H., Mayne P. W. (2008). CPTU simplified stress-based model for evaluation soil liquefaction potential. Soils Found 48 (6), 755–770. doi: 10.3208/sandf.48.755
Ku C. S., Juang C. H. (2012). “Liquefaction and cyclic softening potential of soils – a unified piezocone penetration testing-based approach,” in Géotechnique. 62 (5), 457–461. doi: 10.1680/geot.10.P.044
Lu X. F., Zhang F., Qin W. J., Zheng H., Feng D. C. (2021). Experimental investigation on frost heave characteristics of saturated clay soil under different stress levels and temperature gradients. Cold Reg. Sci. Tech 192, 103379. doi: 10.1016/j.coldregions.2021.103379
Lunne T., Berre T., Andersen K. H., Strandvik S., Sjursen M. (2006). Effects of sample disturbance and consolidation procedures on measured shear strength of soft marine Norwegian clay. Can. Geotech. J. 43 (7), 726–750. doi: 10.1139/t06-040
Lunne T., Berre T., Strandvik S. (1997). Sample disturbance effects in soft low plastic Norwegian clay[C]//Symposium on Recent Developments in Soil and Pavement MechanicsCAPES-Fundacao Coordenacao do Aperfeicoamento de Pessoal de Nivel Superior; CNPq-Conselho Nacional de Desenvolvimento Cientifico a Tecnologico; FAPERJ-Fundacao de Ampora a Pesquisa do Estado do Rio de Janeiro; FINEP-Financiadora de Estudos e Projetos. Balkema, Rotterdam. 81–102.
Ma W. J., Qin Y., Wu Q., Zhang G. K., Chen G. X. (2023). Cyclic failure mechanisms of saturated marine coral sand under various consolidations. Appl. Ocean Res. 131, 103450. doi: 10.1016/j.apor.2022.103450
Meng F. H., Pei H. F. (2023). Quasi-site-specific prediction of shear wave velocity from CPTu. Soil Dynamics Earthquake Eng. 172, 108005. doi: 10.1016/j.soildyn.2023.108005
Olsen R. S. (1994). Normalization and prediction of geotechnical properties using the cone penetrometer test (CPT) (Berkeley: University of California).
Pan K., Yuan Z. H., Zhao C. F., Tong J. H., Yang Z. X. (2021). Undrained shear and stiffness degradation of intact marine clay under monotonic and cyclic loading. Eng. Geol. 297, 106502. doi: 10.1016/j.enggeo.2021.106502
Robertson P. K., Wride C. E. (1998). Evaluating cyclic liquefaction potential using the cone penetration test. Can. geotechnical J. 35 (3), 442–459. doi: 10.1139/t98-017
Sandven R. B. (1990). Strength and deformation properties of fine-grained soils obtained from piezocone tests (Norway: Universitetet i Trondheim).
Seed H. B. (1979). Soil liquefaction and cyclic mobility evaluation for level ground during earthquakes. J. Geotechnical Eng. Division 105 (2), 201–255. doi: 10.1061/AJGEB6.0000768
Wang Y., Zhang S. X., Xu H., Zhang Y. H., Gaunt P., Ren B., et al. (2022). Site investigation and soil parameters for offshore suction bucket design: A case study of Houhu wind turbine. Ocean Eng. 255, 111458. doi: 10.1016/j.oceaneng.2022.111458
Wu Q., Zhu E. C., H. L., Y. L., H. W., Chen G. X. (2023). A new empirical model for the undrained shear strength of undisturbed marine fine-grained soil based on piezocone penetration tests. Appl. Ocean Res. 141, 103770. doi: 10.1016/j.apor.2023.103770
Xiao X., Hang T. Z., Cai Z. Y., Zhang L., Wu Q., Chen G. X. (2023). Cyclic threshold shear strain for pore water pressure generation and stiffness degradation in marine clays at Yangtze estuary. Front. Mar. Sci. 10. doi: 10.3389/fmars.2023.1184225
Yang Q., Ren Y. B., Niu J. L., Cheng K., Hu Y. X., Wang Y. (2018). Characteristics of soft marine clay under cyclic loading: a review. B. Eng. Geol. Environ. 77 (3), 1027–1046. doi: 10.1007/s10064-017-1078-4
Keywords: site investigation, CPTU, cyclic resistance, marine clay, offshore wind farms
Citation: Wu Q, Zhu E-c, Xiao X, Li Y-x and Chen G-x (2024) Cyclic resistance evaluation of marine clay based on CPTu data: a case study of Shaba Wind Farm. Front. Mar. Sci. 10:1300005. doi: 10.3389/fmars.2023.1300005
Received: 23 September 2023; Accepted: 05 December 2023;
Published: 04 January 2024.
Edited by:
Xingsen Guo, University College London, United KingdomReviewed by:
Xiaotong Yang, Tsinghua University, ChinaXianwei Zhang, Chinese Academy of Sciences (CAS), China
Zhongkun Ouyang, Tsinghua University, China
Xiaotong Yang, Tsinghua University, China in collaboration with reviewer ZO
Copyright © 2024 Wu, Zhu, Xiao, Li and Chen. This is an open-access article distributed under the terms of the Creative Commons Attribution License (CC BY). The use, distribution or reproduction in other forums is permitted, provided the original author(s) and the copyright owner(s) are credited and that the original publication in this journal is cited, in accordance with accepted academic practice. No use, distribution or reproduction is permitted which does not comply with these terms.
*Correspondence: Xing Xiao, eHhfMDUyNEAxMjYuY29t