 Tong Wu
 Jianrong Zhu
 Rui Ma1
 Rui Yuan
- 1State Key Laboratory of Estuarine and Coastal Research, East China Normal University, Shanghai, China
- 2River Research Department, Changjiang River Scientific Research Institute, Wuhan, China
- 3School of Marine Science and Engineering, Shanghai Maritime University, Shanghai, China
Reclaiming estuarine tidal flats is practiced to meet the growing demand for land. The reclaimed new land (RNL) on the Eastern Hengsha Shoal in the Changjiang Estuary is for agricultural production in Shanghai. Whether freshwater resources exist around the RNL has become a critical issue \caused by estuarine saltwater intrusion. In this study, the spatiotemporal saltwater intrusion and freshwater distribution around the RNL at different guarantee rates of river discharge using the improved 3D numerical model ECOM-si was investigated. Three water intakes on Hengsha Island and the northern edge of the RNL were set. The results showed that at different guarantee rates of river discharge during the dry season, there is a relatively sufficient suitable water intake time in the upper RNL. Nevertheless, there is a very limited suitable water intake time in the middle and lower RNL as the guarantee rate increases, especially in January and February. During the flood season, three water intakes can ensure sufficient suitable water intake time. The salinity around the RNL significantly increases under the combined effect of 50% and 95% guarantee rates with a 12 m/s northerly wind in February, resulting in a significant threat to the three water intakes. At the 50% guarantee rate, the suitable water intake times in February are 14.86, 9.78 and 3.53 days at three water intakes, respectively. At the 95% guarantee rate, the suitable water intake time in February is only 0.31 days in the upper RNL, and there is no freshwater in the middle and lower RNL. Overall, there is sufficient freshwater in the flood season and limited freshwater in the dry season for agriculture along the northern edge of the RNL.
1 Introduction
Estuaries have become densely populated and economically developed areas due to their geographical and resource advantages. Approximately two-thirds of the world’s major cities are in delta regions. With the rapid increase in population, there is a continuous demand for urban land, leading to extensive tidal flat reclamation in estuaries. The use of reclaimed land requires freshwater but suffers from estuarine saltwater intrusion.
Estuarine saltwater intrusion is a common phenomenon and significantly impacts circulation, sediment transport, and the ecological environment. The Shannon estuary lowlands have been extensively reclaimed, resulting in modification of the estuarine physical environment and its hydrodynamics and altering the characteristics of the wetland habitat in the estuary environs (Healy and Hickey, 2002). Numerical experiments by Manda and Matsuoka (2006) showed that reclamation projects in San Francisco Bay led to changes in local tidal current velocity, thereby affecting the balance of the ecosystem. Tomonari et al. (2011) used a numerical model to examine the effects of changes in the freshwater input and in the surface area of the bay on the seawater residence time. The results showed that the seawater residence time decreased by 35% from the period prior to 2002. Van Maren et al. (2016) investigated the effect of land reclamation and changes in other sediment sinks on SSC in the Ems Estuary. The results revealed that a decrease in accommodation space for fine-grained sediments by land reclamation or by reducing fine-grained sediment extraction would lead to an increase in suspended sediment concentrations. Over the past two centuries, reclamation and other human activities have greatly altered the hydrological and hydrodynamic conditions of the San Francisco estuary, resulting in increased saltwater intrusion (Andrews et al., 2017). Shen et al. (2018) used the FVCOM model to simulate and predict the impact of land reclamation on saltwater intrusion and storm surges in the Pearl River estuary in China. The results showed that reclamation projects hindered river discharge, increased salinity and significantly reduced wave heights in the nearby waters.
Changjiang, known as the Yangtze River, is the third largest river in the world in terms of river discharge. The river discharge varies significantly with the monsoon season, with an annual mean value (from 1950 to 2006) of 28,500 m³/s (Liu et al., 2008). The Changjiang Estuary, as a large estuary with multiple bifurcations, is not only affected by direct saltwater intrusion but also experiences a unique phenomenon of saltwater spilling over from the North Branch (NB) to the South Branch (SB). The saltwater intrusion in the Changjiang Estuary is mostly determined by tides and river discharge (Wu, 2006; Li et al., 2010; Qiu et al., 2012), as well as influenced by factors such as wind stress (Li et al., 2012; Li et al., 2020; Zhu et al., 2020), topography (Li et al., 2014; Li and Zhu, 2022), and sea level rise (Qiu and Zhu, 2015). In recent decades, saltwater intrusion in the Changjiang Estuary has undergone changes due to human activities. For example, the construction of the Deep Waterway Project has altered the water diversion ratio between the North and South Channels and the North and South Passages (Wu et al., 2006; Fan et al., 2012), thereby affecting the spatial and temporal distribution of saltwater intrusion in the Changjiang Estuary. Lyu et al. (2023) considered the completed construction of the four enclosure projects in the Changjiang Estuary and quantified the spatial and temporal variability of salinity at the estuary reservoir intakes.
The Eastern Hengsha Shoal is located on the east side of Hengsha Island at the river mouth of the Changjiang Estuary, the south side of the North Channel (NC) and the north side of the Deep Waterway Project (Figure 1). It is a valuable resource of tidal flats in Shanghai. The reclamation of the Eastern Hengsha Shoal and sedimentation promotion project started in 2003 and has formed a reclaimed new land (RNL) area of approximately 106 km2, protected by surrounding seawalls. According to the planning of Shanghai, the RNL is designated for agricultural production, including vegetable cultivation, aquaculture and animal husbandry, to meet the dietary needs of Shanghai. Agricultural production requires freshwater, and whether freshwater exists around the RNL has become a critical issue caused by estuarine saltwater intrusion. The salinity around the RNL varies greatly in space and is significantly influenced by tide, river discharge, wind and other factors. According to the plan, drinking water for the RNL is from Changxing Island transported by water pipelines, while agricultural water is taken from the water intakes along the northern edge of the RNL. The NC in the Changjiang Estuary is a tributary where saltwater intrusion is the weakest (Qiu and Zhu, 2015; Lyu and Zhu, 2019; Li and Zhu, 2022), with abundant freshwater resources during the flood season. Lin (2014) used a numerical model to simulate the saltwater intrusion and freshwater resources in the RNL with a 50% guarantee rate. The results showed that the high value of surface salinity occurred during the mid-tide after the neap tide, and the low value of surface salinity occurred during the mid-tide after the spring tide. The study only analyzed 18 days in February and did not show the suitable water intake time. It is worth exploring specific suitable water intake time under different guarantee rates of river discharge during dry and flood season, providing more application references for water intake.
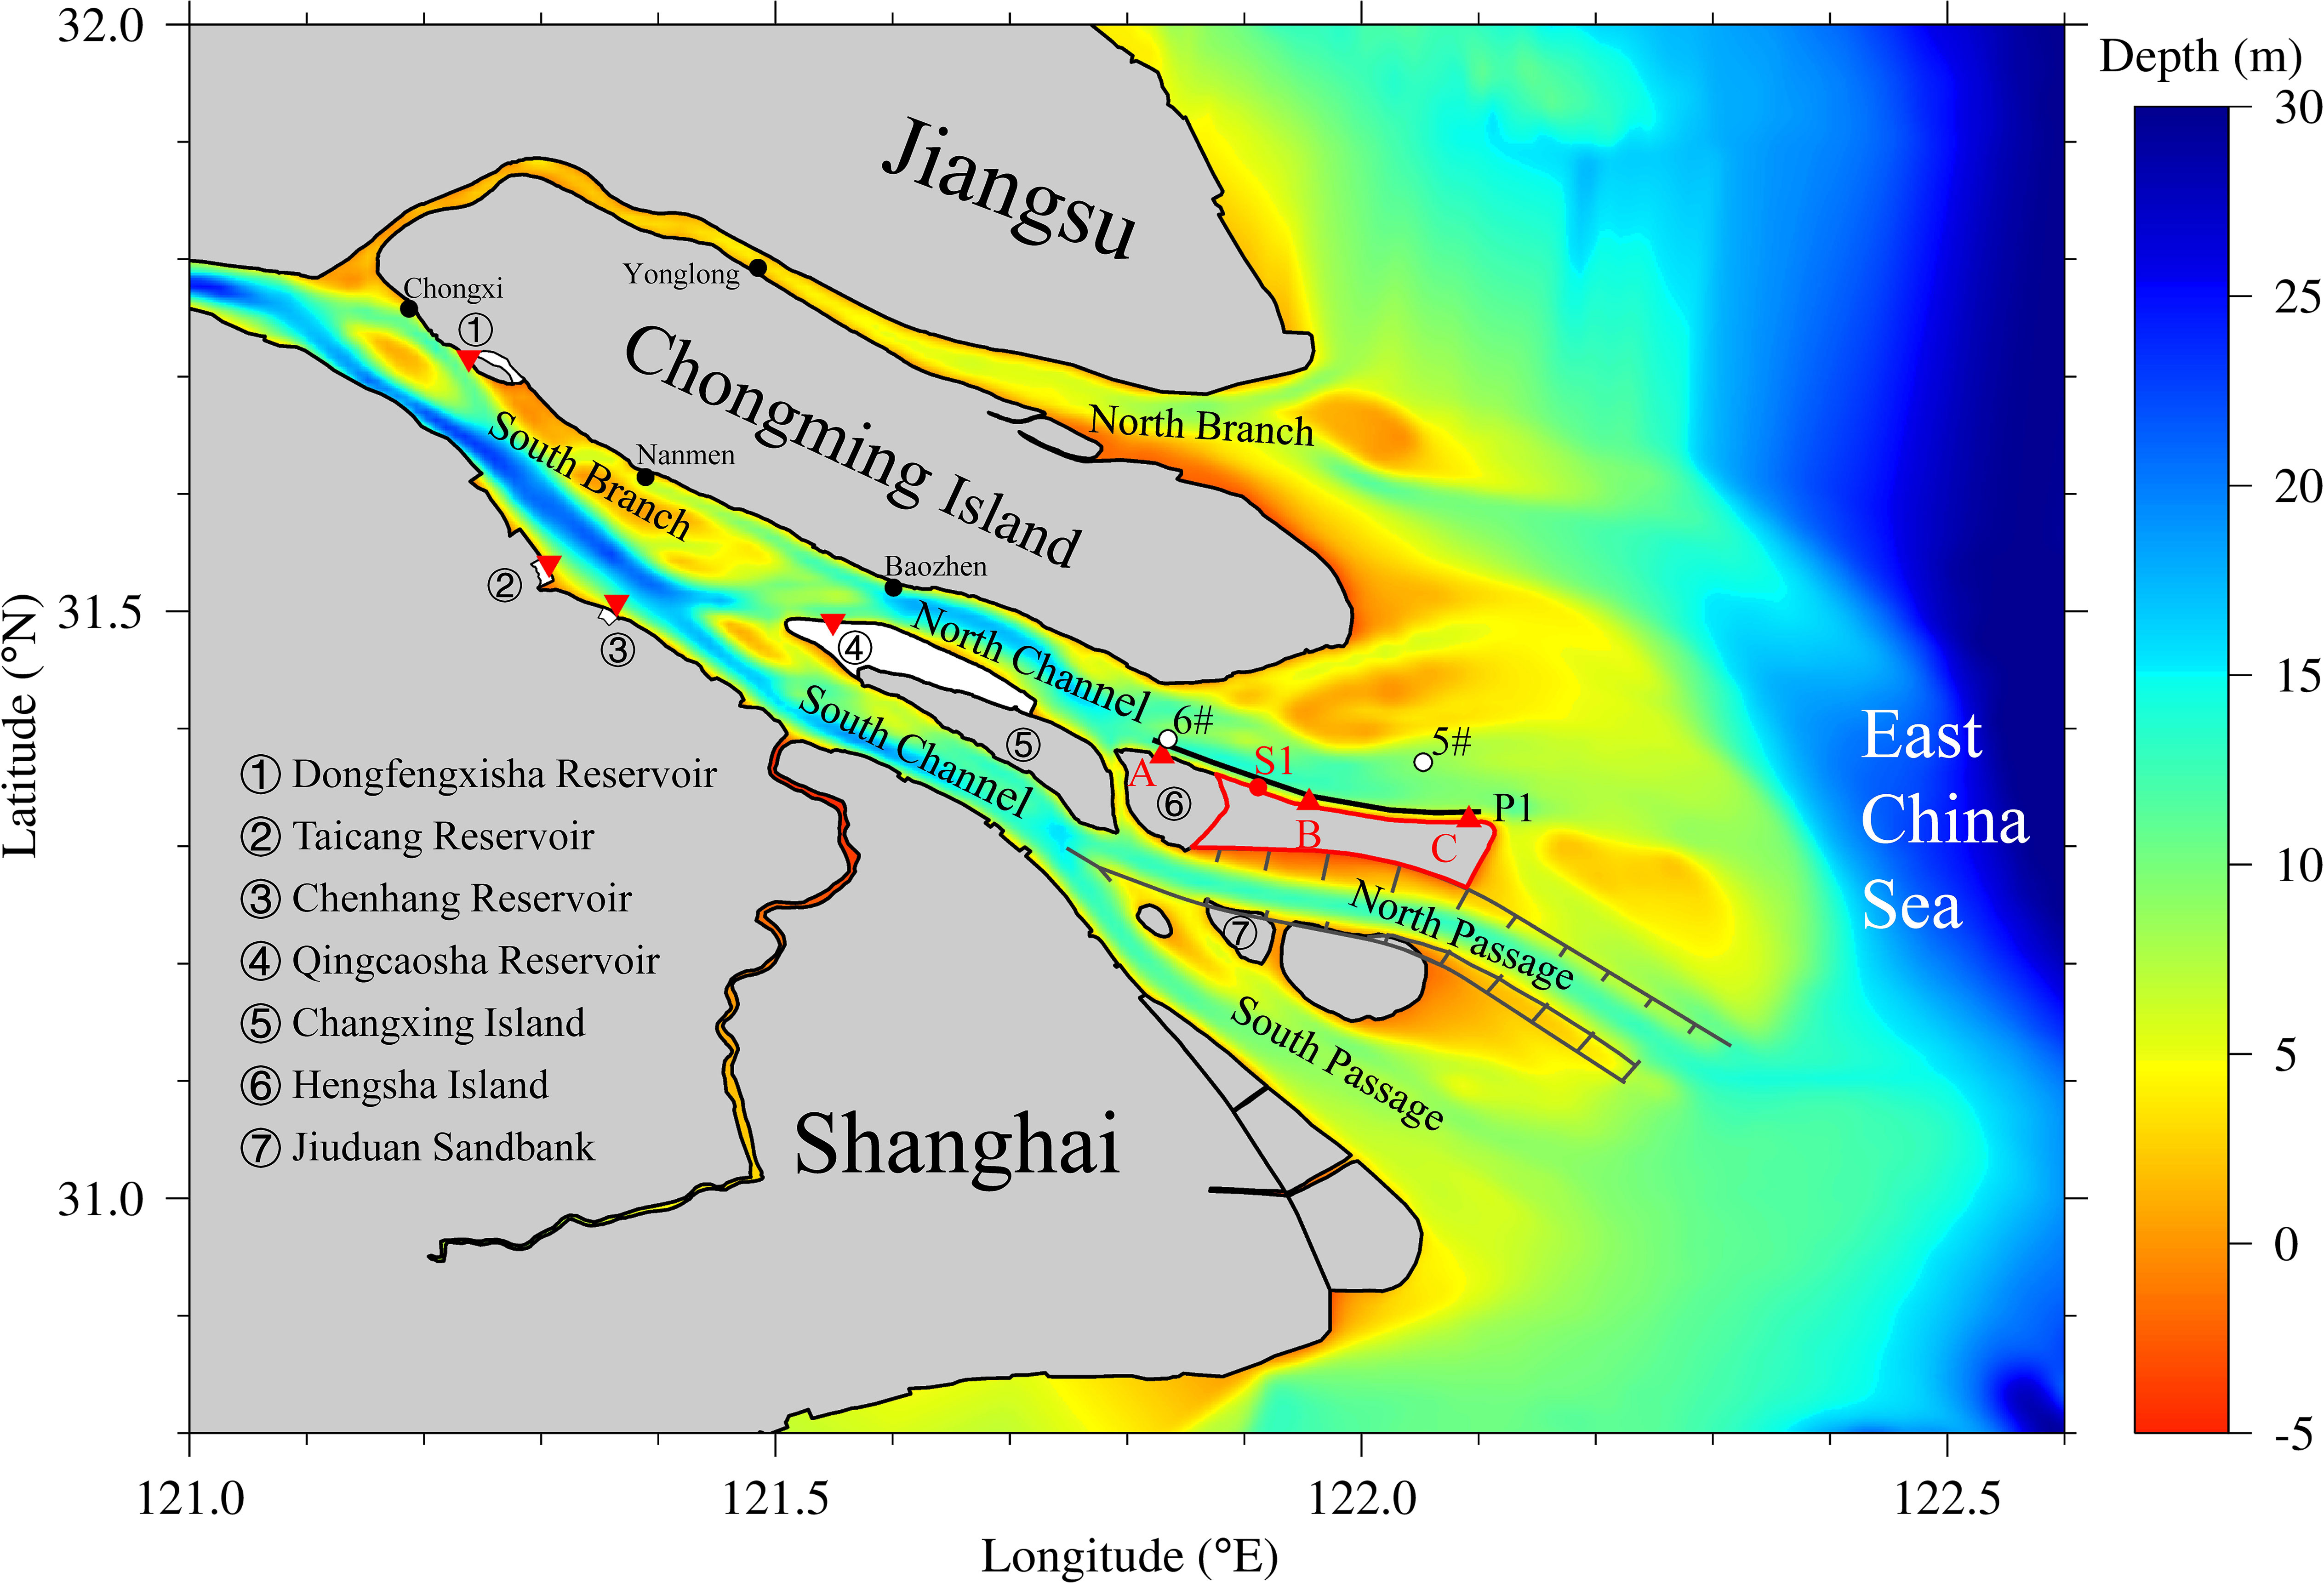
Figure 1 Topography of the Changjiang Estuary. The area enclosed by the red line represents the RNL on the Eastern Hengsha Shoal. P1 is the location of the along channel section around the RNL. A, B and C indicate the three water intakes; S1 is the measured station.
In this study, a high-resolution estuarine hydrodynamic and saltwater intrusion 3D numerical model was used to study the spatial and temporal variations in salinity and freshwater distribution around the RNL at different guarantee rates of river discharge in the dry and flood seasons. The combined effects of different guarantee rates of river discharge and strong northerly winds during dry season were also considered. The results can provide technological support for agricultural water use in the RNL.
2 Materials and methods
2.1 Numerical model
A 3D numerical model, ECOM-si (Blumberg, 1994), which has been long-term applied and improved in numerous studies of the Changjiang Estuary (Chen et al., 2001; Wu and Zhu, 2010), was used to study saltwater intrusion. The model domain covered the entire Changjiang Estuary and Hangzhou Bay, as well as the adjacent sea region (Figure 2A). The western boundary reached the Datong hydrological station, which is the tidal limit in the dry season and is 630 km away from the Changjiang River mouth. The estuary area had a high-resolution grid, with a maximum resolution of 50 m around the RNL, which has an area of approximately 1100×362 m2 (Figure 2B). Figure 2C showed the enlarged view of the model grids at the upper reaches of the river.. The model grid was composed of 307×210 cells horizontally and 10 uniform σ levels vertically. The maximum time step was set to 120 s. The Changjiang Estuary has numerous shoals, and the wetting and drying method was used to characterize the extensive intertidal zone. The open sea boundary was driven by total water levels, which were composed of tidal levels and residual water levels. The tidal level was composed of the harmonic constants of 15 constituents (M2, S2, N2, K2, K1, O1, P1, Q1, MF, MM, MN4, M4, MS4, S1, and 2N2) derived from the TPXO9 database (https://www.tpxo.net/global/tpxo9-atlas). The residual water level represents the circulation in the continental shelf and was simulated by a large domain model encompassing the Bohai Sea, Yellow Sea, and East China Sea (Zhu et al., 2020). The large domain numerical model was that of Changjiang River plume extension, which comprehensively considered tides, circulation, wind stress, and temperature-salinity-induced baroclinic pressure gradient forces. The simulated water level field varied with the tides, and the residual water level distribution and variation were obtained after filtering out the tidal component. The river boundary condition for the momentum equation was specified in the form of volume flux by data measured at the Datong hydrological station, which was used for model calibration and validation. Alternatively, different guarantee rates of river discharge were used to simulate and analyze the distribution of saltwater intrusion and freshwater around the RNL. The wind stress was considered the sea surface condition, which was calculated with the wind field provided by postprocessed data from the European Centre for Medium-Range Weather Forecasts (ECMWF). The initial salinity and temperature field outside the Changjiang Estuary was taken from the Ocean Atlas in Yellow Sea and East China Sea (Hydrology) (Ocean Atlas Commission, 1992), while the salinity and temperature data inside the estuary were obtained from measured data.
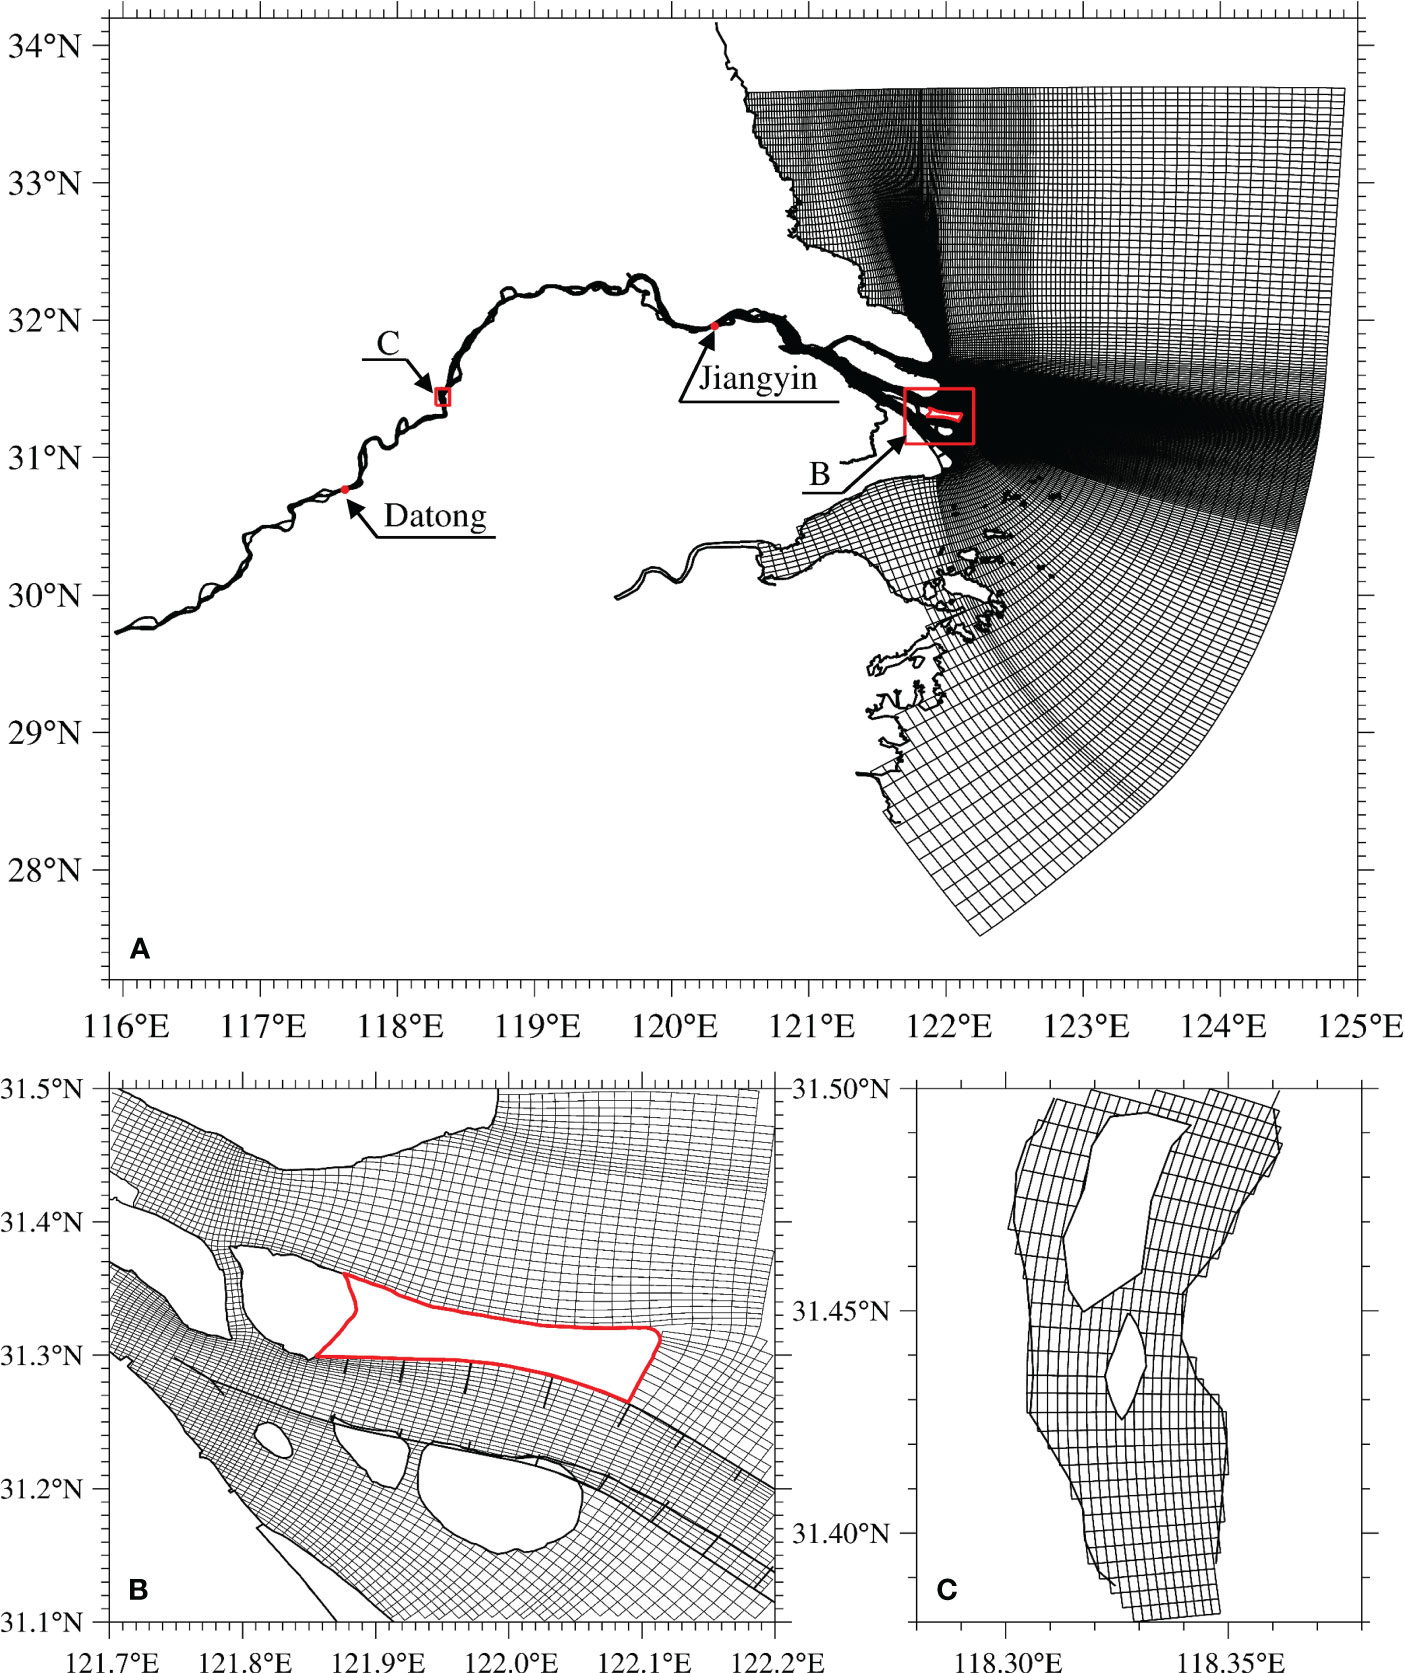
Figure 2 Model domain and grids (A); enlarged view of the model grids around the RNL (B); enlarged view of the model grids at the upper reaches of the river (C).
2.2 Model validation and dynamics analysis method
In this paper, elevation data were used to validate the model at the Baozhen, Chongxi, Nanmen and Yonglong hydrological stations from December 1 to 31, 2021. Additionally, current velocity and direction data at buoys 5# and 6# were used from June 1 to 30, 2022. Salinity data at measured station S1 along the northern edge of the RNL were used from January 9 to March 31, 2023 (hydrological stations, buoys and measured stations are shown in Figure 1). The model was run one month in advance to adjust the initial salinity field. The following three skill assessments were used to quantify the validations: correlation coefficient (CC) (Equation 1), root mean square error (RMSE) (Equation 2), and skill score (SS) (Equation 3) (Murphy, 1988):
where Xmod represents the simulated values of the model, Xobs represents the observed values, and represents the average value. CC indicates the correlation between the calculated values and the observed values. Even if there is a constant difference between the two, but their trends are consistent, a good CC evaluation result can still be obtained. It needs to be evaluated together with RMSE to obtain an objective evaluation result. SS is used to describe the degree of deviation between the simulated values and the observed values. When the simulated values and the observed values fit perfectly, SS equals 1; the worse the fit is, the closer it is to 0.
Richardson number (Ri) is the ratio of stratification (N2) to vertical shear (S2) and can characterize the dynamics of stratification. Ri can be defined as follows (Equation 4) (Turner, 1979):
N2 can be used to characterize the stability of water columns, and can be defined as follows (Equations 5, 6) (Brunt, 1927):
where u, v represent the values of the current velocity in the x and y directions, respectively, g represents the gravitational acceleration, ρ0 represents the background density value, ρ represents the density value, and z presents the water depth. The water column is well-stratified at Ri>0.25, and well-mixed at Ri<0.25.
Figure 3 presents the results of the elevation validation, the observed elevation in the hydrological stations showed a significant semi-diurnal tide type and varied obviously between spring and neap tide. The maximum tidal range occurred during spring tide on December 4, the maximum tidal range reached 329 cm at Baozhen (Figure 3A), the maximum tidal range reached 383 cm at Chongxi (Figure 3B), the maximum tidal range reached 351 cm at Nanmen (Figure 3C) and the maximum tidal range reached 453 cm at Yonglong (Figure 3D). There exit tidal daily inequalities that mainly occur during high tide levels and are significant during spring tides than neap tides in December. Figure 4 presents the temporal variations in the current velocity and direction at buoy 5# in June 2022. Supplementary Figure S1 presents the temporal variations in the current velocity and direction at buoy 6# in June 2022. The maximum value of the surface current velocity at station 5# was 2.25 m/s, and the difference between spring and neap tide was significant (Figure 4A), tidal currents were reciprocal current with a distinct semi-diurnal cycle (Figure 4B). The middle current velocity was below the surface current velocity, the maximum reached 2.20 m/s (Figure 4C), tidal currents were reciprocal current (Figure 4D). The bottom current velocity was the smallest than the other layers, the maximum current velocity was 1.69 m/s (Figure 4E), the tidal current also exhibited distinct reciprocating current characteristics (Figure 4F). The maximum value of the surface current velocity at station 6# was 1.90 m/s (Supplementary Figure S1A), the maximum value of the middle current velocity was 1.76 m/s (Supplementary Figure S1C), the maximum value of the bottom current velocity was 1.18 m/s (Supplementary Figure S1E), the surface, middle and bottom layers all exhibited distinct reciprocal current and flood and ebb tide characteristics (Supplementary Figures S1B, D, F). The simulated values were consistent with the observed values, reproducing more realistically the variations of current velocity and direction in the estuary at flood and ebb tide. Figure 5 presents the results of salinity validation for the period of January 9 to March 31, 2023.Salinity exhibited significant variations during spring and neap tide. The maximum salinity reached 13.49 in January (Figure 5A), 14.98 in February (Figure 5B) and 15.24 in March (Figure 5C). The assessment indicator scores of simulated elevation, water velocity and salinity are listed in Supplementary Table S1. The validation results indicated good agreement between the simulated values and observed values. The correlation coefficients for elevation at Baozhen, Chongxi, Nanmen, and Yonglong were all 0.97, with root mean square errors below 0.30 m and skill scores above 0.90. The correlation coefficients of the current velocity at stations 5# and 6# were both above 0.88, with root mean square errors below 0.20 m/s and skill scores above 0.91. The correlation coefficient for salinity at point S1 was 0.81, with a root mean square error of 1.59 and a skill score of 0.71. Comparing the simulated and observed data revealed that the model could successfully simulate the variation processes of elevation, current and salinity.
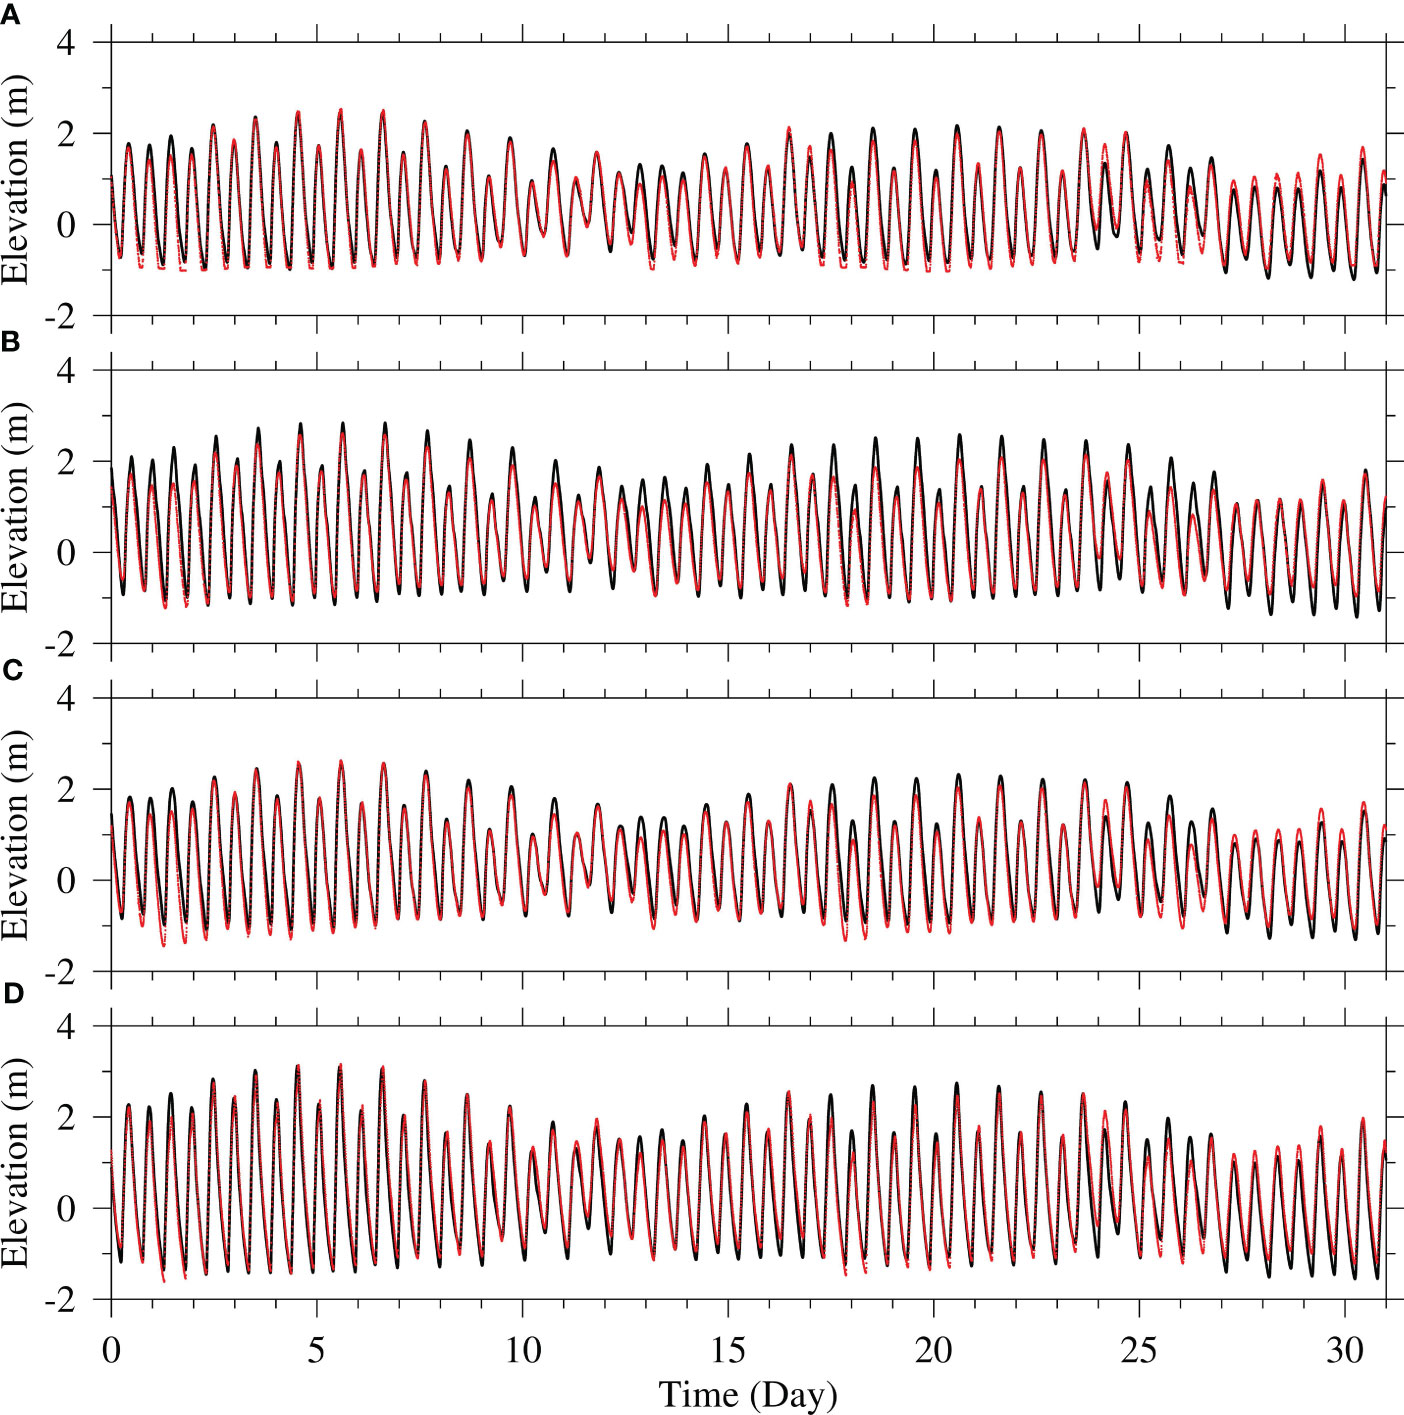
Figure 3 Temporal variation in elevation in December 2021. (A), Baozhen Station; (B), Chongxi Station; (C), Nanmen Station; (D), Yonglong Station. Red dots: observed values; black lines: simulated values.
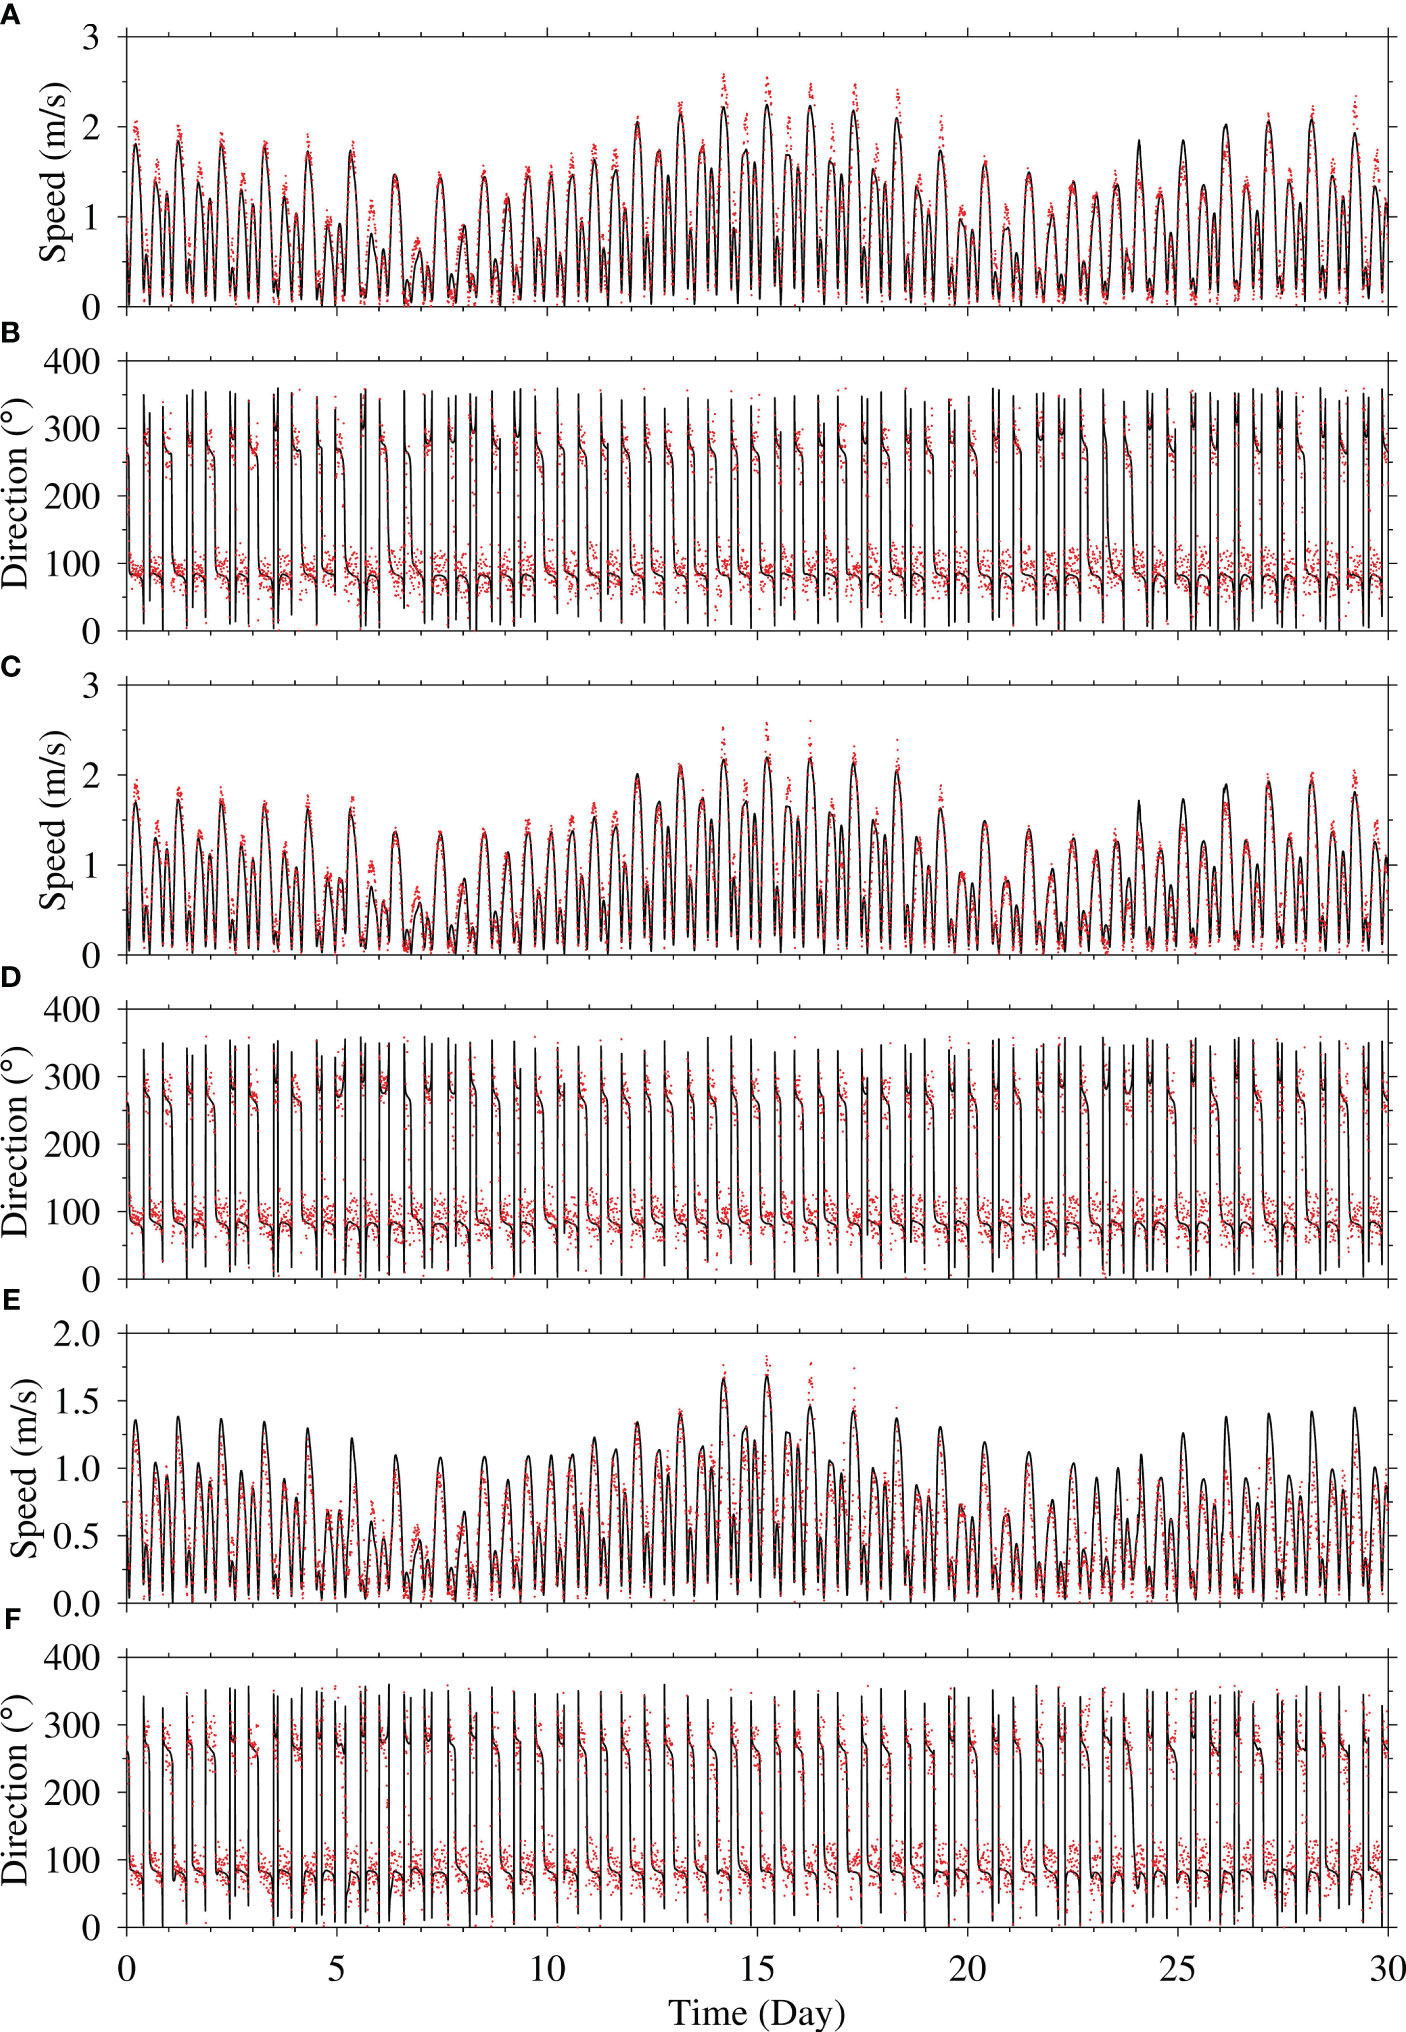
Figure 4 Temporal variations in current velocity and direction at the surface (A, B), middle (C, D), and bottom (E, F) layers at buoy 5# in June 2022. Red dots: observed values; black lines: simulated values.
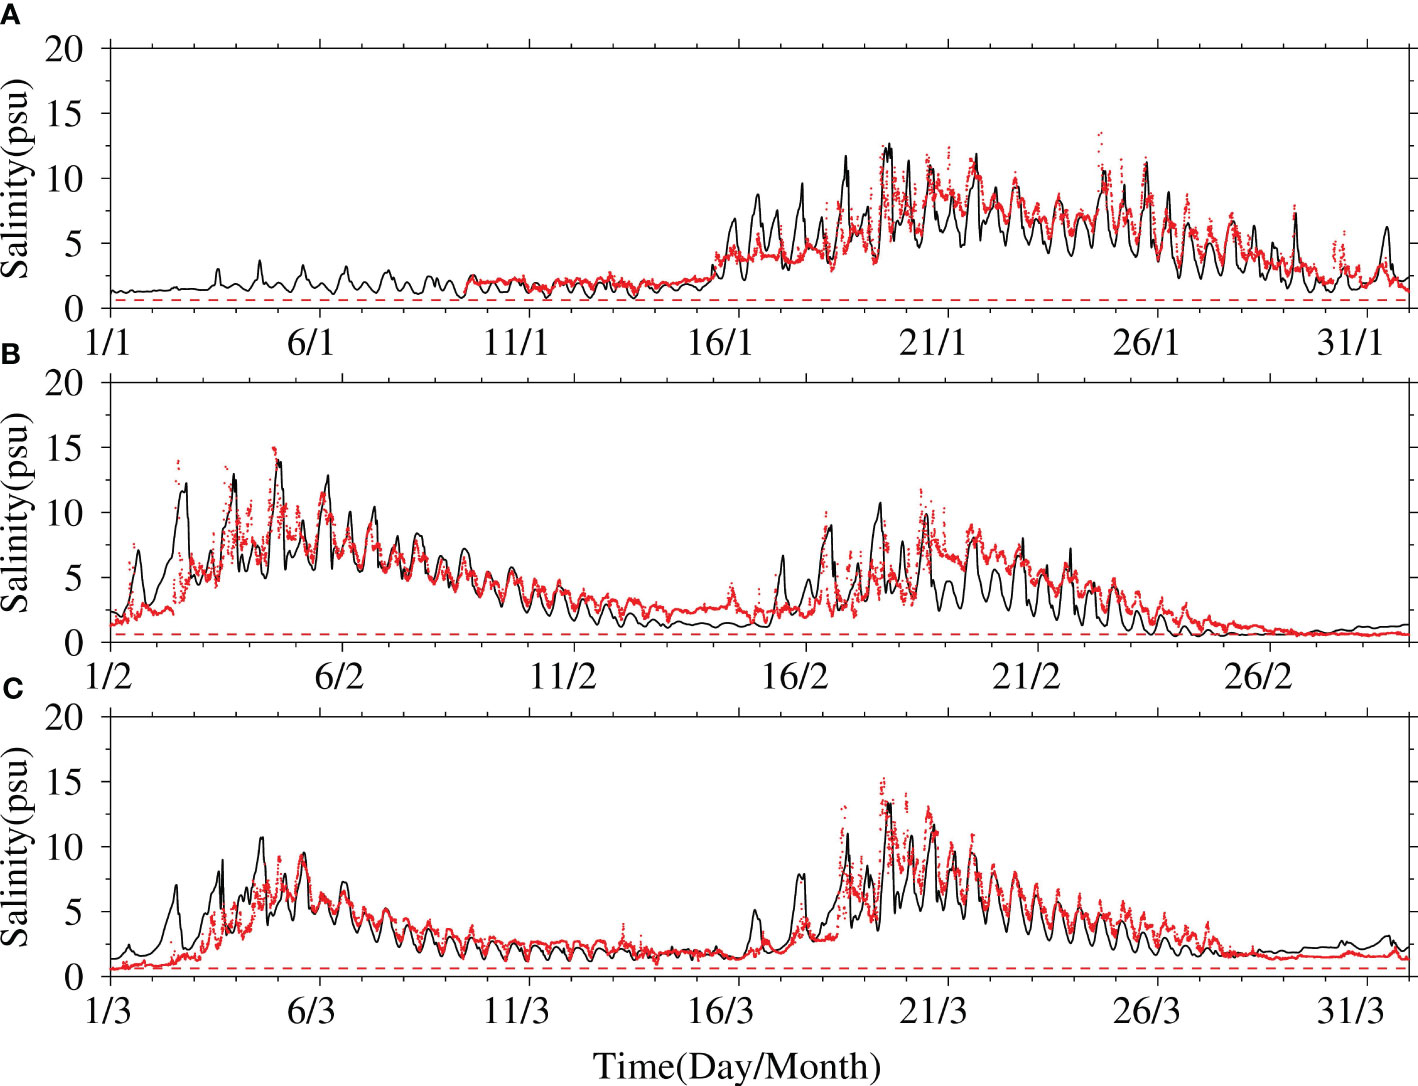
Figure 5 Temporal variations in salinity at measured point S1 from January to March 2023. (A), January; (B), February; (C), March. Red dots, observed values; black lines, simulated values; red dashed line, 0.63 psu salinity.
2.3 Experiment setup
The freshwater resources near the RNL are affected by saltwater intrusion in the Changjiang Estuary. Severe saltwater intrusion results in limited freshwater resources. The variation in river discharge exhibits significant seasonal characteristics, with much lower river discharge during the dry season. Considering the significant regulation effect of large-scale cascade reservoirs in the Changjiang River basin on the water flux discharging to the sea, the river discharge from 2003 (the year when the Three Gorges Dam was closed) to 2022 was taken. After frequency analysis of the 20 years, the seasonally average river discharge corresponding to the 50%, 75%, and 95% guarantee rates during the dry season (December to March) and flood season (May to September) of each hydrological year were selected (Figures 6, 7). Eight numerical experiments were set up (Table 1). EXP1, EXP2, and EXP3 simulated the hydrodynamics and salinity at 50%, 75%, and 95% guarantee rates of river discharge during the dry season with climatic wind. EXP4 and EXP5 considered a 12 m/s northerly wind lasting 7 days from February 1 to 7 during neap tide and took climatic wind at other times. EXP6, EXP7, and EXP8 were designed at 50%, 75%, and 95% guarantee rates of river discharge during the flood season. The wind also considered the climatic wind conditions. The model was run one month in advance.
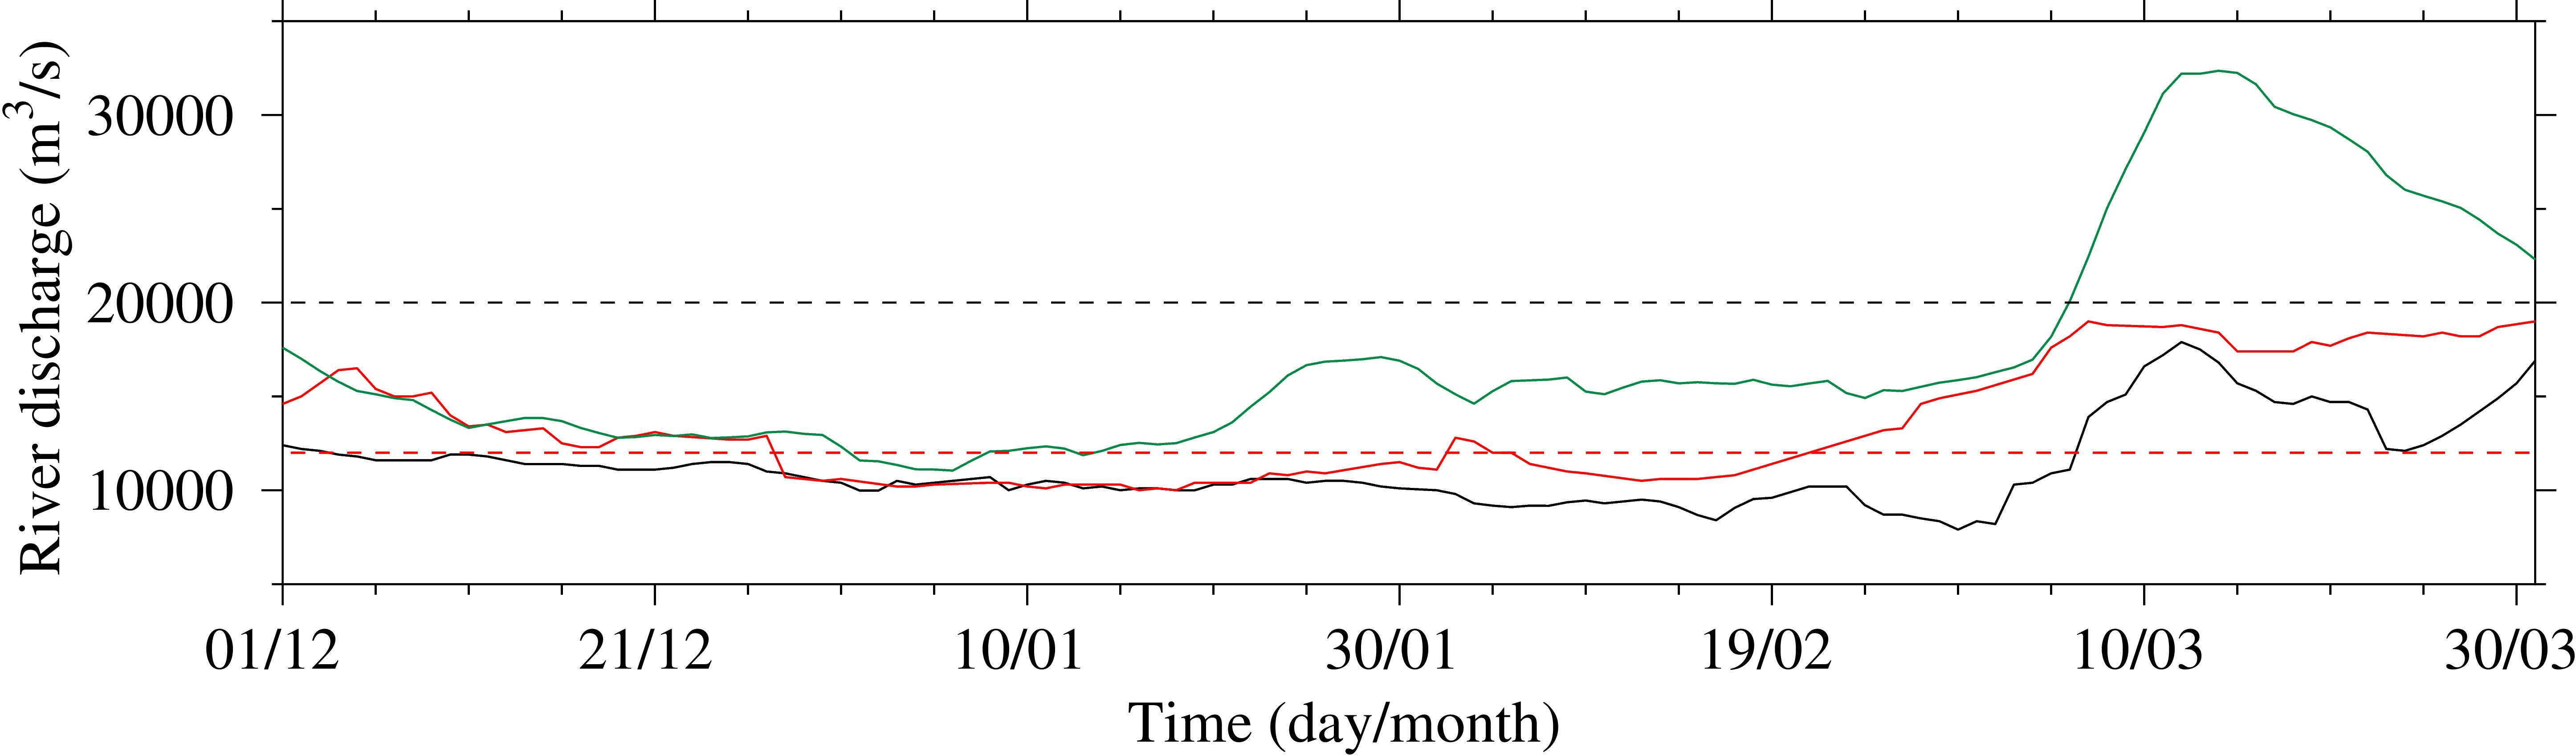
Figure 6 The river discharge at the Datong hydrological station from December 1 to March 31. Black solid line: 50% guarantee rate; red solid line: 75% guarantee rate; green solid line: 95% guarantee rate; black dashed line: 12,000 m3/s; red dashed line: 20,000 m3/s.
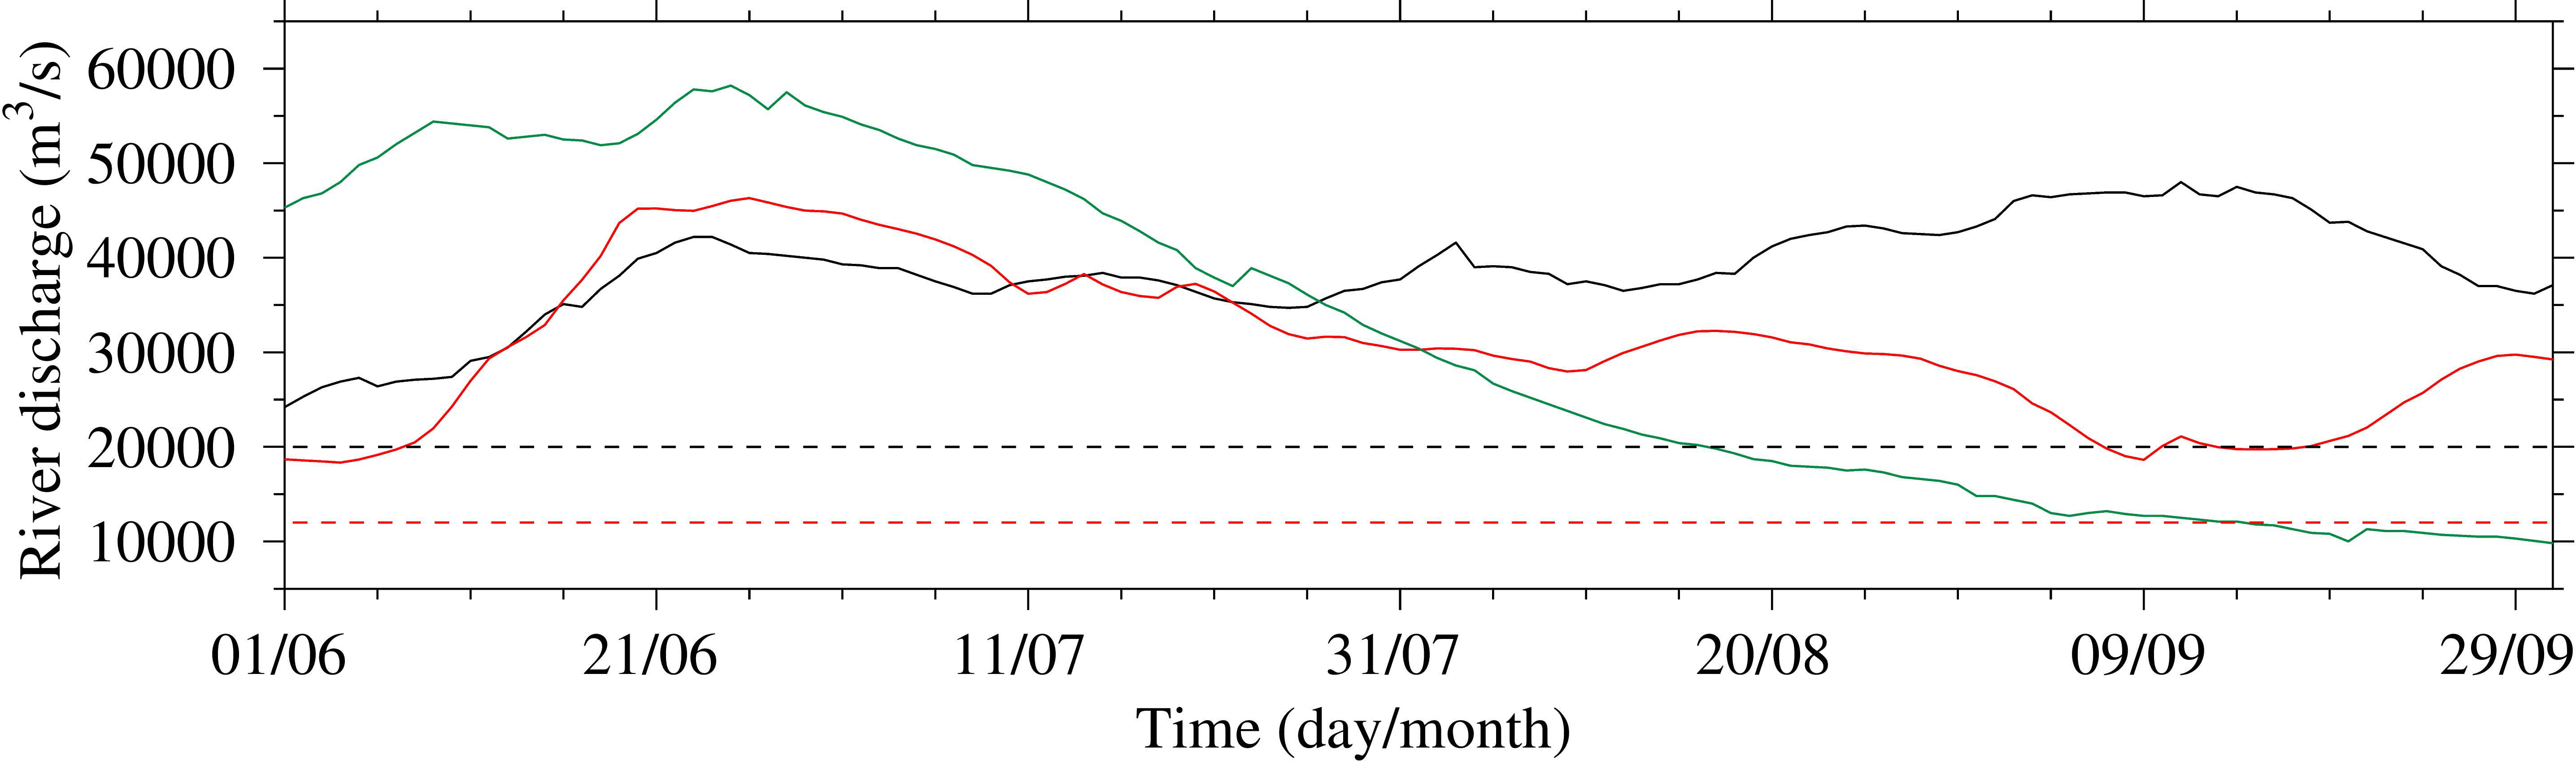
Figure 7 The river discharge at the Datong hydrological station from June 1 to September 30. The other legends are the same as in Figure 6.
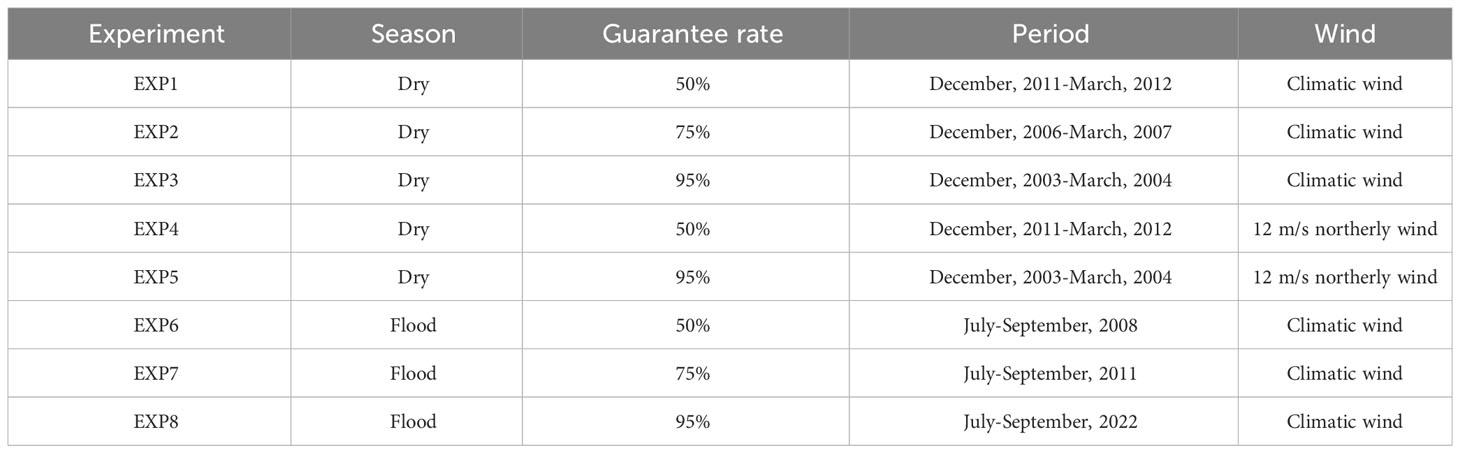
Table 1 Numerical experiment setting.
3 Results
3.1 Observed salinity variation
The observed data at S1 from January 9 to March 31, 2023, were selected to illustrate the freshwater resources in the spring and neap tides during the dry season. The average monthly river discharge recorded at the Datong hydrological station was 13700 m³/s, 12256 m3/s, and 10560 m3/s in January, February, and March, respectively. The river discharge between January and February was much lower than the multiyear average river discharge as a result of the persistent drought in the basin. Severe saltwater intrusion occurred, and from the measured data, it could be seen that the salinity was greater than 0.63 (the salinity standard for agricultural water; similarly hereinafter) for all of January (Figure 5A). From February 1 to 25, the salinity was significantly greater than 0.63 (Figure 5B), and there was no freshwater for agriculture. From February 26 to 28, the salinity was less than 0.63, and freshwater for agriculture occurred. This was because the river discharge reached 15,000 m3/s in the early period. The salinity approached 0.63 on March 1 (Figure 5C) and was greater than 0.63 at other times. Although the river discharge increased in March, March is one of the strongest months for tides, and enhanced tides can exacerbate saltwater intrusion. Based on the temporal variations in salinity, high values of salinity occurred during the mid-tide after the neap tide, and low values occurred during the mid-tide after the spring tide, which was consistent with previous studies (Lin, 2014). Observations showed that freshwater for agriculture rarely occurred in the northern edge of the RNL under low river discharge during the dry season.
3.2 Horizontal distributions of salinity
Figure 8 illustrates the horizontal distribution of surface salinity at different guarantee rates of river discharge at the flood slack during the mid-tide after the neap tide in February and July at water intake B (similarly hereinafter).
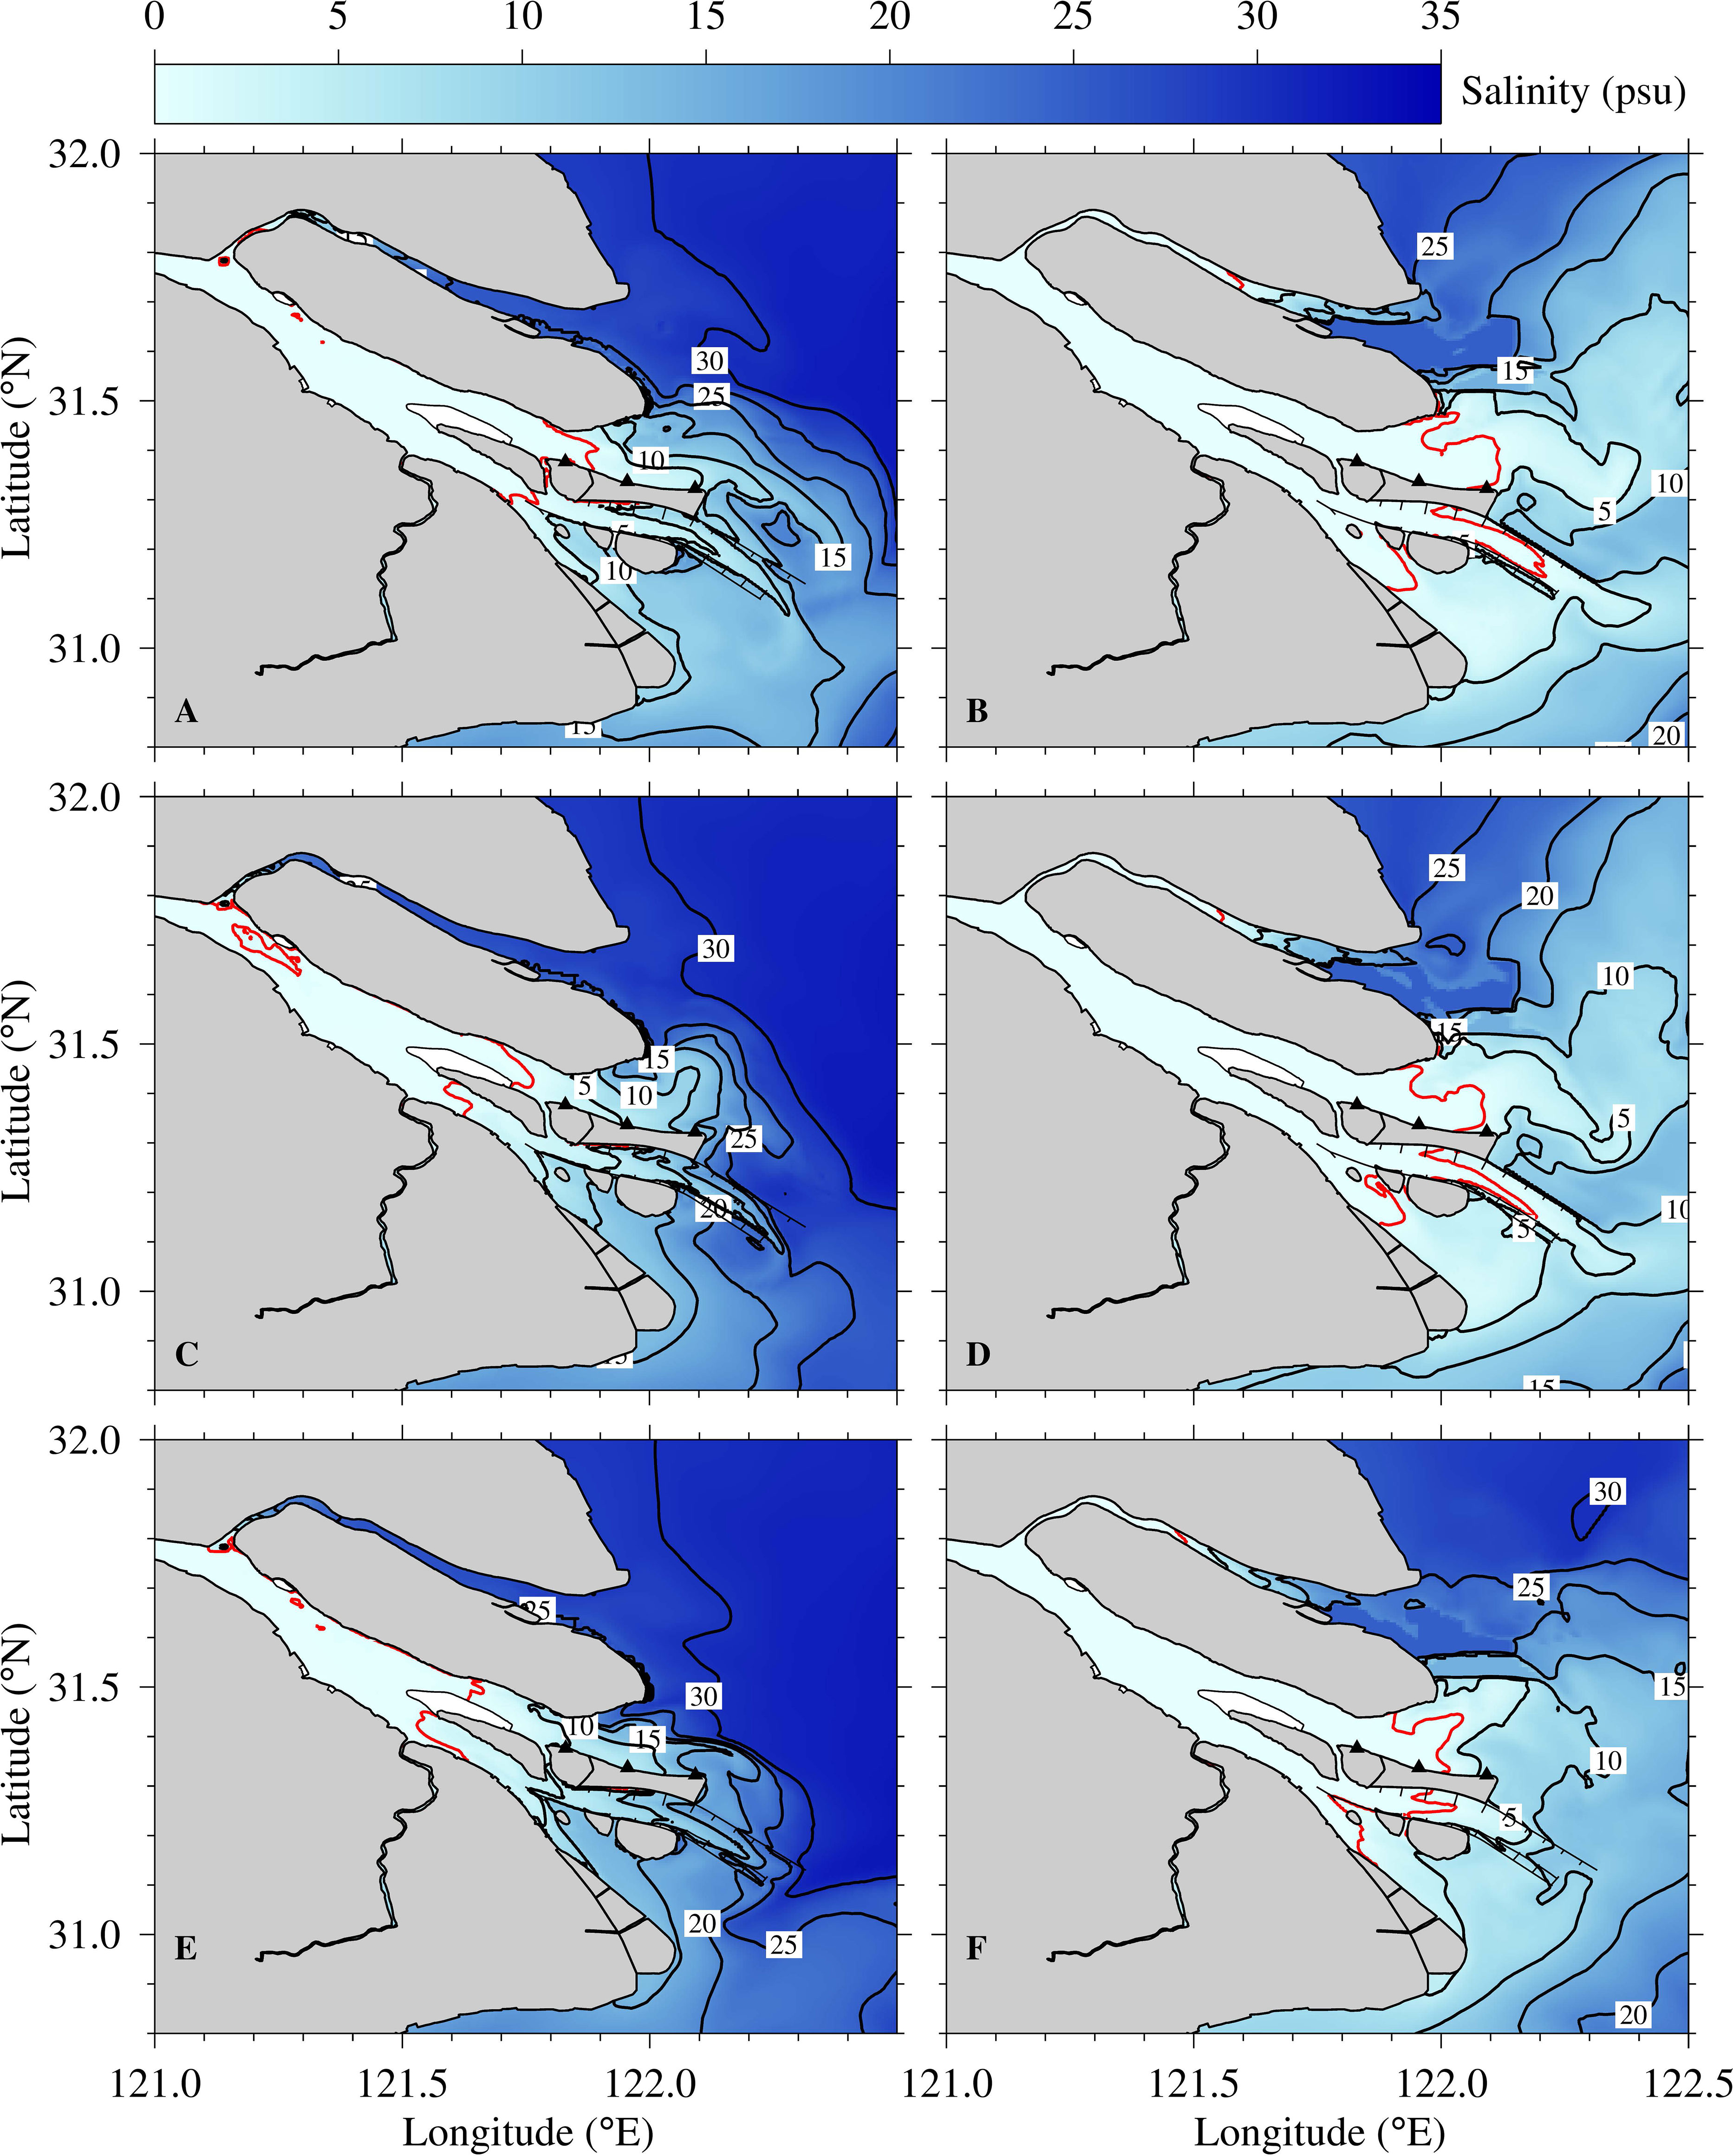
Figure 8 Distribution of surface salinity at the flood slack during mid-tide after neap tide in February (left panels) and July (right panels). (A, B), 50% guarantee rate; (C, D), 75% guarantee rate; (E, F), 95% guarantee rate. The red isohaline is 0.63, which is the standard salinity of agricultural water. Other isohalines are from 5 to 30, with an interval of 5. The black triangles indicate the positions of water intake (A–C) from left to right.
During the dry season, at the 50% guarantee rate (Figure 8A), saltwater intrusion was the most severe in the South Passage and weakest in the NC in the SB. The highly saline water approached the middle NC. The SB was occupied by freshwater due to larger river discharge, and the salinity was less than 0.63. The NC was the main channel for runoff discharging into the sea, and the water transport extended northward near the river mouth under the influence of horizontal circulation and then flowed further southeastward driven by the Coriolis force (Li and Zhu, 2016). The salinity front near the river mouth reached 25. Freshwater flowed along the northern edge of the RNL. The salinity along the coast of upper Hengsha Island was less than 0.63, meaning that there was an area of freshwater near water intake A. Freshwater was unavailable at water intakes B and C, both of which had salinities higher than 0.63. The river plume in the North Passage was transported out of the estuary and flowed southward driven by the Coriolis force. At the 75% guarantee rate (Figure 8C), affected by the reduced river discharge, the NB was occupied by highly saline water, and the saltwater spilled over from the NB to the SB (Wu and Zhu, 2007). The water in the NB spilled over the tidal flat into the SB and moved downstream along the channel, where a salinity core higher than 0.63 was detected near Dongfengxisha Reservoir. Freshwater carried by runoff was transported downstream along the south side of the SB because of the Coriolis force. The 0.63 isohaline in the NC moved upward along the lower coast of Changxing Island, and the salinity at water intake A was greater than 0.63. Water intake B was on the 5 isohaline, and the salinity at water intake C was between 10-15. There was no freshwater at the three water intakes. Saltwater intrusion in the North Passage was enhanced, with the salinity front in the lower Deep Waterway Project reaching 25. Saltwater intrusion in the South Passage was stronger near the Jiuduan Sanbank, which was the result of landward Stokes transport caused by the interaction between tide and shallow water depth (Wu et al., 2010). At the 95% guarantee rate (Figure 8E), the salinity front in the NB was similar to that at the 75% guarantee rate. The 0.63 isohaline in the NC moves upward to the middle Qingcaosha Reservoir, and water intake A was on the 5 isohaline. The salinity at water intake B was approximately 8, and water intake C was on the 15 isohaline. There was no freshwater at the three water intakes. Saltwater intrusion was enhanced in the North and South Passages, and the salinity front reached 10 in the upper South Passage. During the dry season, at the 50% guarantee rate, water intake A could take up freshwater, while water intakes B and C were unable to take up freshwater. At the 75% and 95% guarantee rates, freshwater was not suitable to take at any of the three water intakes.
During the flood season, the salinity in the Changjiang Estuary was low due to the large river discharge. At the 50% guarantee rate (Figure 8B), the highly saline water aggregated at the river mouth of the NB and flowed into the NB along the north side of Chongming Island. The salinity front reached 20 at the river mouth. The SB was occupied by freshwater. The river plume from the NC was transported northeastward after flowing out of the river mouth. The 0.63 isohaline was at the lower RNL. Water intakes A, B, and C could take the freshwater. The salinity in the North Passage was less than 5, with the 0.63 isohaline in the lower Deep Waterway Project. The salinity in the South Passage was below 5. At the 75% guarantee rate (Figure 8D), the distribution of salinity was similar to that at the 50% guarantee, with little change in the NB and SB. The salinity in the NC, North Passage, and South Passage increased, and the salinity on the north side increased more than that on the south side. The salinity at water intakes A and B was less than 0.63, and freshwater could be taken, while the salinity at water intake C was approximately 3, and freshwater could not be taken. At the 95% guarantee rate (Figure 8F), saltwater intrusion in the NB was enhanced, with the 0.63 isohaline moving upward to the middle NB. The salinity around the river mouth increased, and the salinity was less than 0.63 at water intakes A and B and greater than 5 at water intake C. There was sufficient freshwater at water intakes A and B and no freshwater at water intake C. The 0.63 isohaline was shifted upward in both the North Passage and South Passage. During the flood season, at the 50% guarantee rate, water intakes A, B, and C all could take freshwater. At the 75% and 95% guarantee rates, water intakes A and B could take freshwater, while water intake C was unable to take.
3.3 Salinity distribution along the longitudinal profile
Through the distribution of surface salinity, it could be seen that the three water intakes along the north edge of the RNL could almost take freshwater at different guarantee rates of river discharge during the flood season, especially water intakes A and B, while the suitable water intake time during the dry season was affected by persistent low river discharge and the inability to obtain freshwater. To better demonstrate the spatial distribution of salinity, Figure 9 was created to show the longitudinal salinity distribution along Sec. P1 (Figure 1) at flood slack during mid-tide after neap tide in February. Strong stratification was produced during neap tides and saline water was well-mixed in the spring tide (Li et al., 2021). Supplementary Figure S2 showed the temporal variations in elevation and gradient Richardson number at intake B in February. Values less than 0 in the Supplementary Figure S2 mean that the Richardson number was less than 0.25 and the water column was unstable.
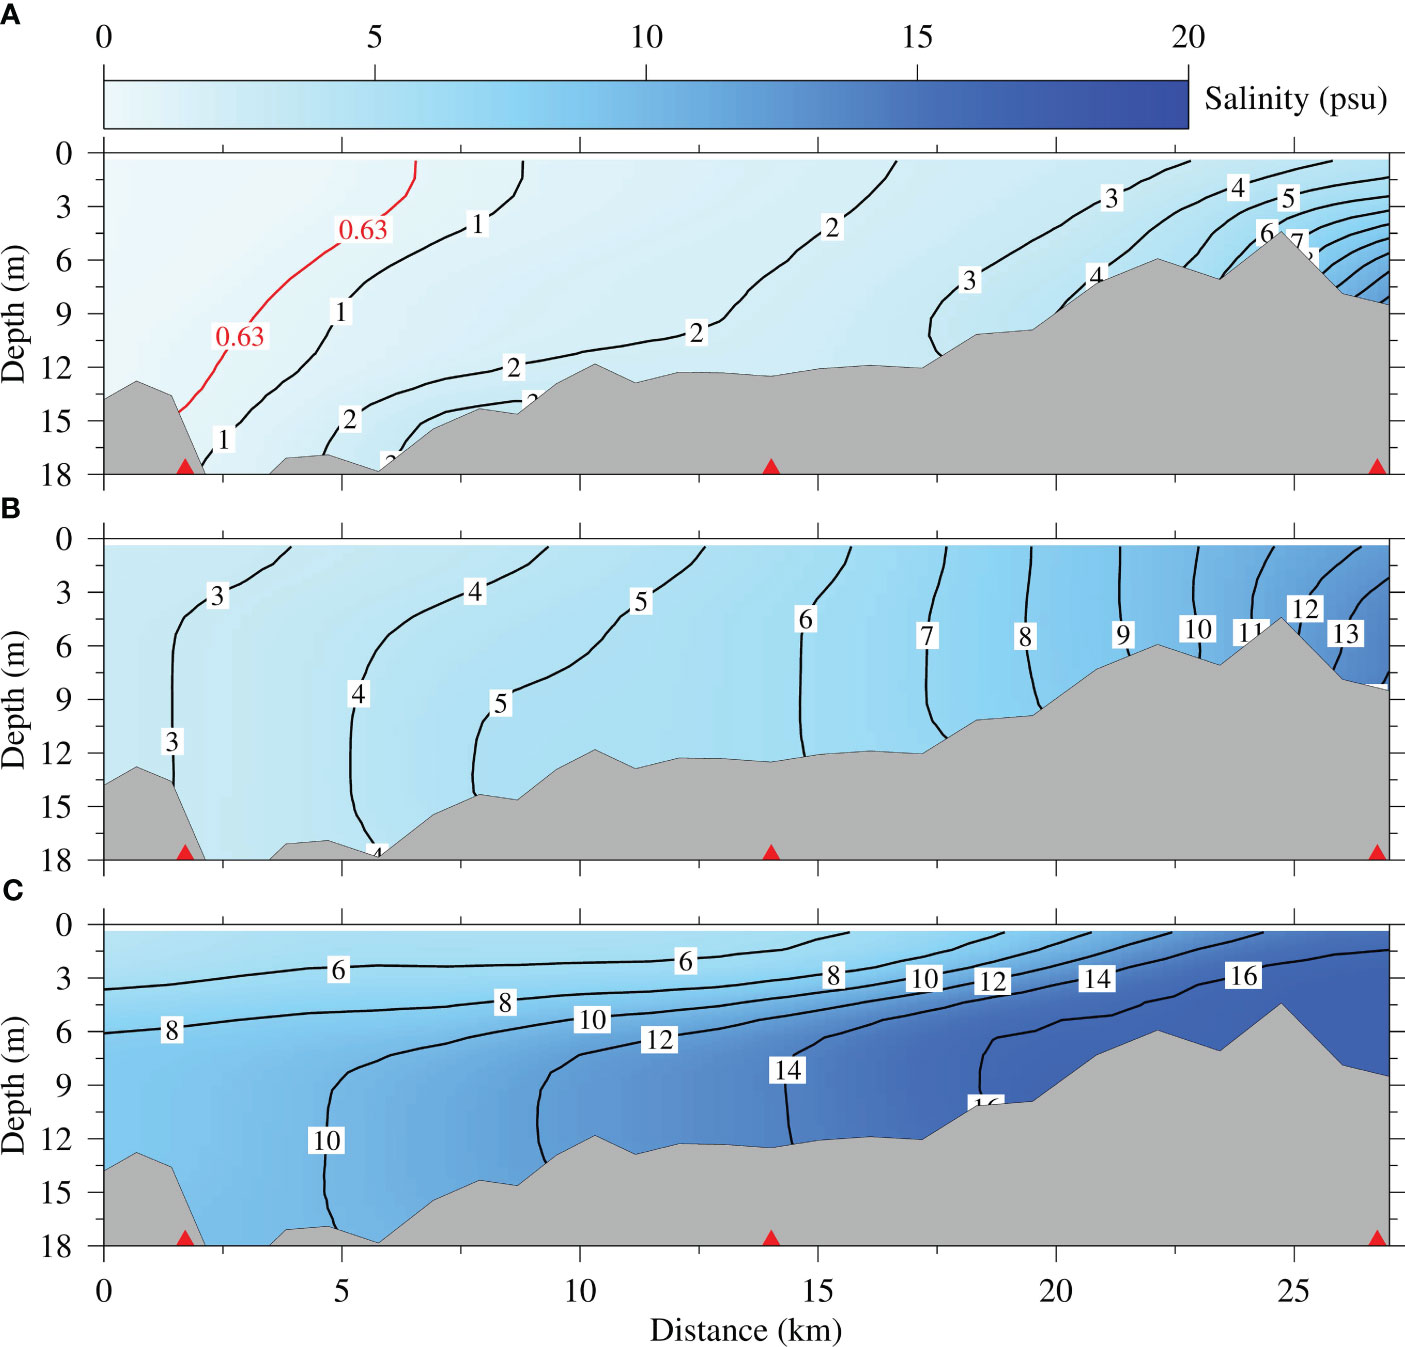
Figure 9 Longitudinal salinity profiles along Sec. P1 at flood slack during mid-tide after neap tide in February. (A): 50% guarantee rate; (B): 75% guarantee rate; (C): 95% guarantee rate. The red triangles in the figure indicate the positions of water intake (A–C) from left to right.
At the 50% guarantee rate, the spring-neap variation in straining and mixing was obvious, Ri was significantly smaller during spring tide than during neap tide. Surface mixing was inhibited at spring tide and enhanced at neap tide. Ri at both surface and bottom layers exceeded 0.25 at flood slack during mid-tide after neap tide (Supplementary Figures S2A, B). The water columns were highly stratified, forming a pronounced salt wedge (Figure 9A). The isohalines showed a skewed distribution of up-lower and bottom-higher values, and the salinity in the RNL was lower upstream than downstream. The 0.63 isohaline was approximately 6.5 km, the salinity of the surface and bottom at water intake A was less than 0.63, and freshwater existed. The surface salinities at water intakes B and C were greater than 1, and there was no freshwater. At the 75% guarantee rate, Ri increased especially during neap tide (Supplementary Figures S2C, D). The reduced river discharge resulted in higher salinity in the RNL and higher than 3 at all three water intakes (Figure 9B). At the 95% guarantee rate, Ri increased, especially at the surface layer, representing the water columns were well-stratified (Supplementary Figures S2E, F). The river discharge decreased further, and the salinity in the RNL significantly increased; there were great differences in salinity between the surface and bottom. The salinity at the three water intakes was greater than 8 and unable to take freshwater (Figure 9C).
3.4 Temporal variations in salinity at three intakes
The changes in river discharge had different influences on the salinity at the three water intakes in the RNL. In order to better view the changes in salinity, Figure 10 showed the temporal variations in surface salinity at different guarantee rates during the dry season. Supplementary Figure S3 showed the temporal variations in surface salinity during flood season. Salinity exhibited significant semidiurnal and spring and neap tidal variations. The maximum salinity and suitable water intake time for agriculture at the three water intakes in the dry and flood seasons are shown in Table 2 and Supplementary Table S2.
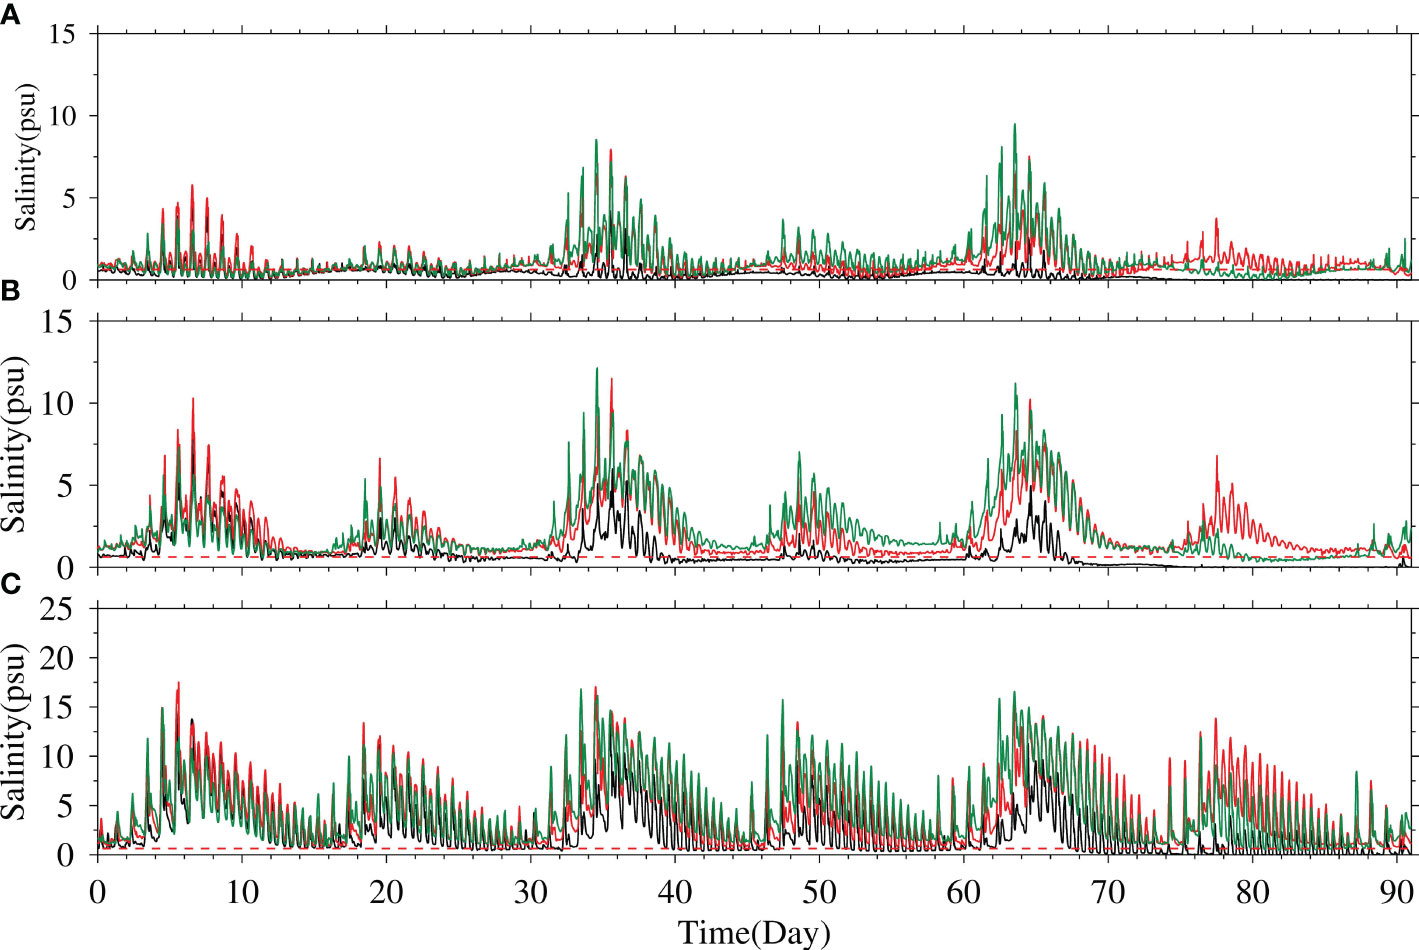
Figure 10 Temporal variations in simulated surface salinity from January to March at different guarantee rates at the three water intakes. (A), intake A; (B), intake B; (C), intake C Black line: 50% guarantee rate; red line: 75% guarantee rate; green line: 95% guarantee rate.
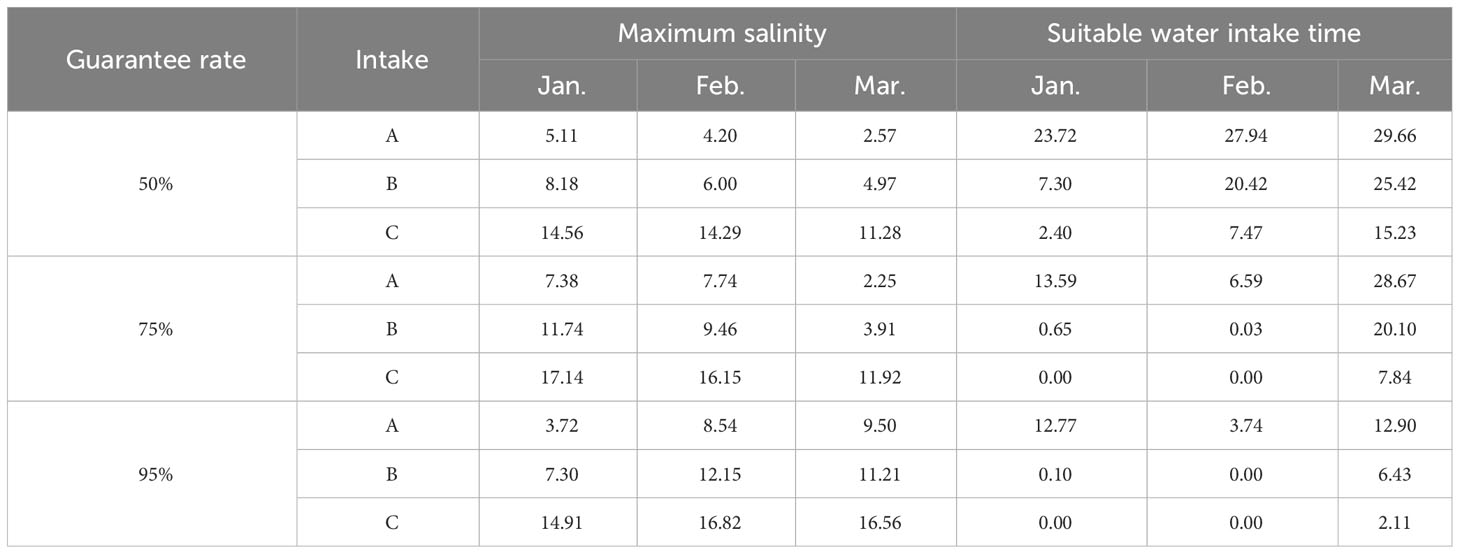
Table 2 Surface maximum salinity and suitable water intake time during the dry season at the three water intakes at 50%, 75%, and 95% guarantee rates (salinity in psu, time in days).
During the dry season, at the 50% guarantee rate, the maximum salinity of the surface layer at water intake A reached 5.11 (Figure 10A). The suitable water intake times were 23.72, 27.94, and 29.66 days in January, February, and March, respectively, indicating that there was a long time to take freshwater during the dry season in the upper RNL at the 50% guarantee rate. As the intake moved downstream, the maximum salinity increased. The maximum surface salinity at water intake B was 8.18 (Figure 10B). The suitable water intake times were 7.30, 20.42, and 25.42 days in January, February, and March, respectively. Water intake C was located east of the RNL, close to the East China Sea. The maximum salinity approached 14.56 (Figure 10C). The suitable water intake times were 2.40, 7.47, and 15.23 days in January, February, and March, respectively. Despite the suitable water intake time increases in March, the temporal variations in salinity showed that it was not continuous and was limited during the dry season.
At the 75% guarantee rate, the maximum salinity at water intake A increased, with a value of 7.74 (Figure 10A). The suitable water intake times were 13.59, 6.59, and 28.67 days in January, February, and March, respectively, which were significantly reduced in January and February compared to the 50% guarantee rate. The maximum salinity at water intake B was 11.74 (Figure 10B). The suitable water intake times were 0.65 and 0.03 days in January and February, respectively, indicating that water intake B was rarely able to take fresh water in January and February. The suitable water intake time in March decreased to 20.10 days. At water intake C, the salinity was also abnormally high, with a maximum of 17.14 (Figure 10C). It was unable to take freshwater in January and February, and the suitable intake time was 7.84 days in March.
At the 95% guarantee rate, the maximum salinity at intake A reached 9.50 (Figure 10A). The suitable water intake times were 12.77, 3.74, and 12.90 days in January, February, and March, respectively. The maximum salinity at water intake B reached 12.15 (Figure 10B). The suitable water intake times were 0.10 and 6.43 days in January and March, respectively. There was no freshwater in February. The maximum salinity at water intake C reached 16.82 (Figure 10C). Freshwater could not be taken in January and February, and only 2.11 days could take freshwater in March. The temporal variations and statistics showed that at the 95% guarantee rate, the suitable water intake time at the three water intakes decreased significantly, and both water intakes B and C could rarely take freshwater during the dry season.
During the flood season, the large river discharge weakened the saltwater intrusion in the Changjiang Estuary. At the 50% guarantee rate, the salinity at water intake A was less than 0.63 during the flood season, and freshwater could be taken from July to September (Figure S3A). The maximum salinity at water intake B was 0.77 (Figure S3B), and the suitable water intake times were 30.96, 31.00, and 31.00 days in July, August, and September, respectively. The maximum salinity at water intake C was 8.15 (Supplementary Figure S3C). The suitable water intake times were 22.82, 24.58, and 26.77 days in July, August, and September, respectively. At the 75% guarantee rate, the maximum salinity at water intake A was 0.04 (Supplementary Figure S3A). Freshwater could be taken throughout July, August and September. The maximum salinity at water intake B was 0.90 (Supplementary Figure S3B). The suitable water intake times were 30.92, 31.00, and 29.94 days in July, August, and September, respectively. The maximum salinity at water intake C was 7.12 (Supplementary Figure S3C). The suitable water intake times were 22.98, 20.67, and 17.30 days in July, August, and September, respectively. Although there was a reduction in the suitable water intake time at the three water intakes with the increase in the guarantee rate, freshwater was still sufficient for most of the time during the flood season. At the 95% guarantee rate, the maximum salinity at water intake A reached 14.16 (Supplementary Figure S3A). The suitable water intake times were 31.00, 28.15, and 11.69 days in July, August, and September, respectively. The maximum salinity was 16.95 at water intake B (Supplementary Figure S3B). The suitable water intake times were 31.00, 22.77, and 9.68 days in July, August, and September, respectively. The maximum salinity at water intake C reached 24.78 (Supplementary Figure S3C). The suitable water intake times were 24.66, 9.89, and 4.42 days in July, August, and September, respectively. There was an extreme drought in the Changjiang Estuary during the flood season in 2022. The river discharge recorded at the Datong hydrological station was persistently less than 12000 m3/s in September (Figure 7). When extreme drought occurred, the three water intakes had difficulty taking freshwater in the flood season.
4 Discussion
The Changjiang Estuary is in the East Asian monsoon zone and is often hit by frequent cold fronts in winter. Strong northerly winds during cold fronts can exacerbate saltwater intrusion in the Changjiang Estuary (Li et al., 2012; Zhu et al., 2020; Li and Zhu, 2021). The discussion considered the combined impacts of 50% and 95% guarantee rates of river discharge with strong northerly winds on saltwater intrusion and freshwater resources. EXP4 and EXP5 set a 12 m/s northerly wind lasting 7 days from February 1 to 7 during neap tide.
At the 50% guarantee rate (Figure 11A), the saltwater spilled over from the NB into the SB, with the 30 isohaline moving to the river mouth of the NB. The persistent and strong northerly wind produces a strong southward current along the coast and landward Ekman water transport, bringing highly saline water into the NC. The saltwater intrusion is severe in the NC, and the salt front extends to the middle NC. Some of the highly saline water in the NC enters the North Passage through the Hengsha Channel, and the others move upstream to the SB. The 0.63 isohaline approaches the water intake of the Qingcaosha Reservoir. The northern edge of the RNL is affected by severe saltwater intrusion, where the salinity was approximately 10, 15, and 25 at water intakes A, B, and C, respectively, which is much higher than 0.63. There is no freshwater that could be taken.
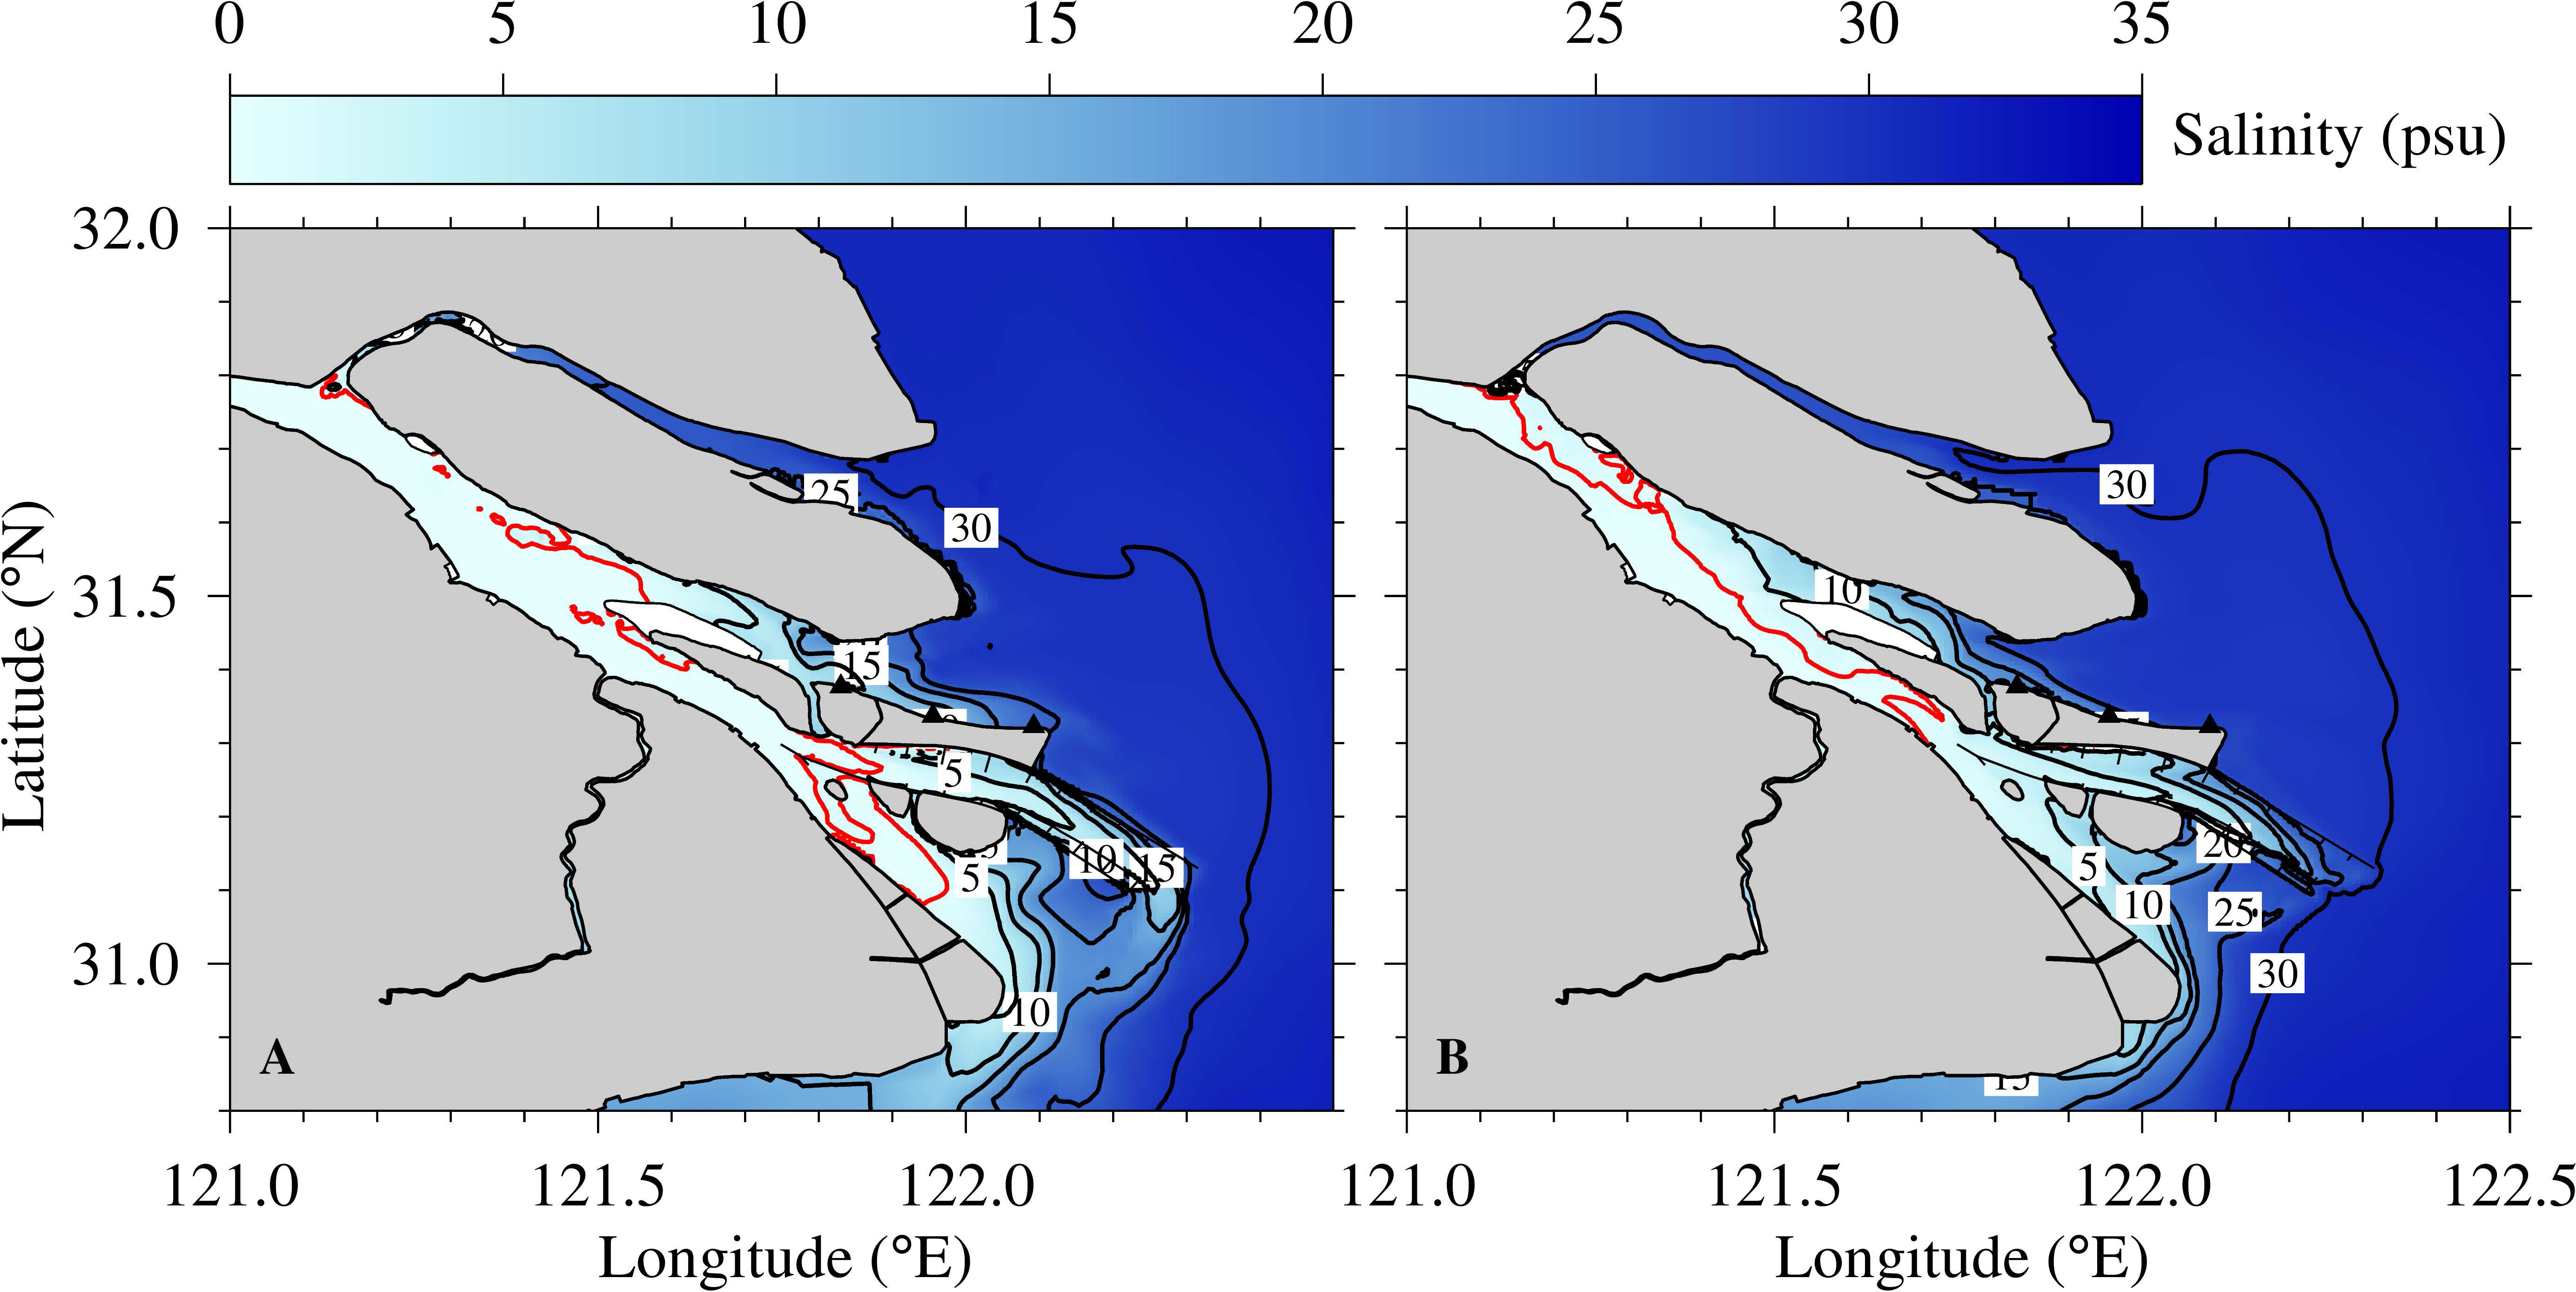
Figure 11 Distributions of surface salinity at flood slack during mid-tide after neap tide under combined impact of 50% (A), 95% (B) guarantee rate with 12 m/s strong northerly wind. The other legends are the same as in Figure 8.
At the 95% guarantee rate (Figure 11B), the saltwater spilled over from the NB into the SB much more severely. A tongue-shaped salt front intrudes into the upper NC and further extends to the SB, which significantly increases the salinity there. Freshwater is distributed only on the south side of the SB. Among the South Passage, North Passage, and NC, saltwater intrusion is the most severe in the NC. The salinity in the lower NC reached 25. The salinity in the upper SC is higher than that in the middle SC because some of the highly saline water from the NC crosses the bifurcation of the NC and SC and flows into the SC, generating horizontal circulation (Qiu, 2023). The salinity was approximately 14, 23, and 27 at water intakes A, B, and C, respectively. All three water intakes were unable to take freshwater.
To better compare the effects of strong northerly winds, Figure 12 was created to show the temporal variations in the simulated surface salinity, and Table 3 presents the maximum salinity and suitable water intake time in February. Affected by the 12 m/s northerly wind, the salinity at the three water intakes increased dramatically and remained high for 7 days after strong northerly winds stopped; until February 15, the salinity decreased to match the climatic wind conditions.
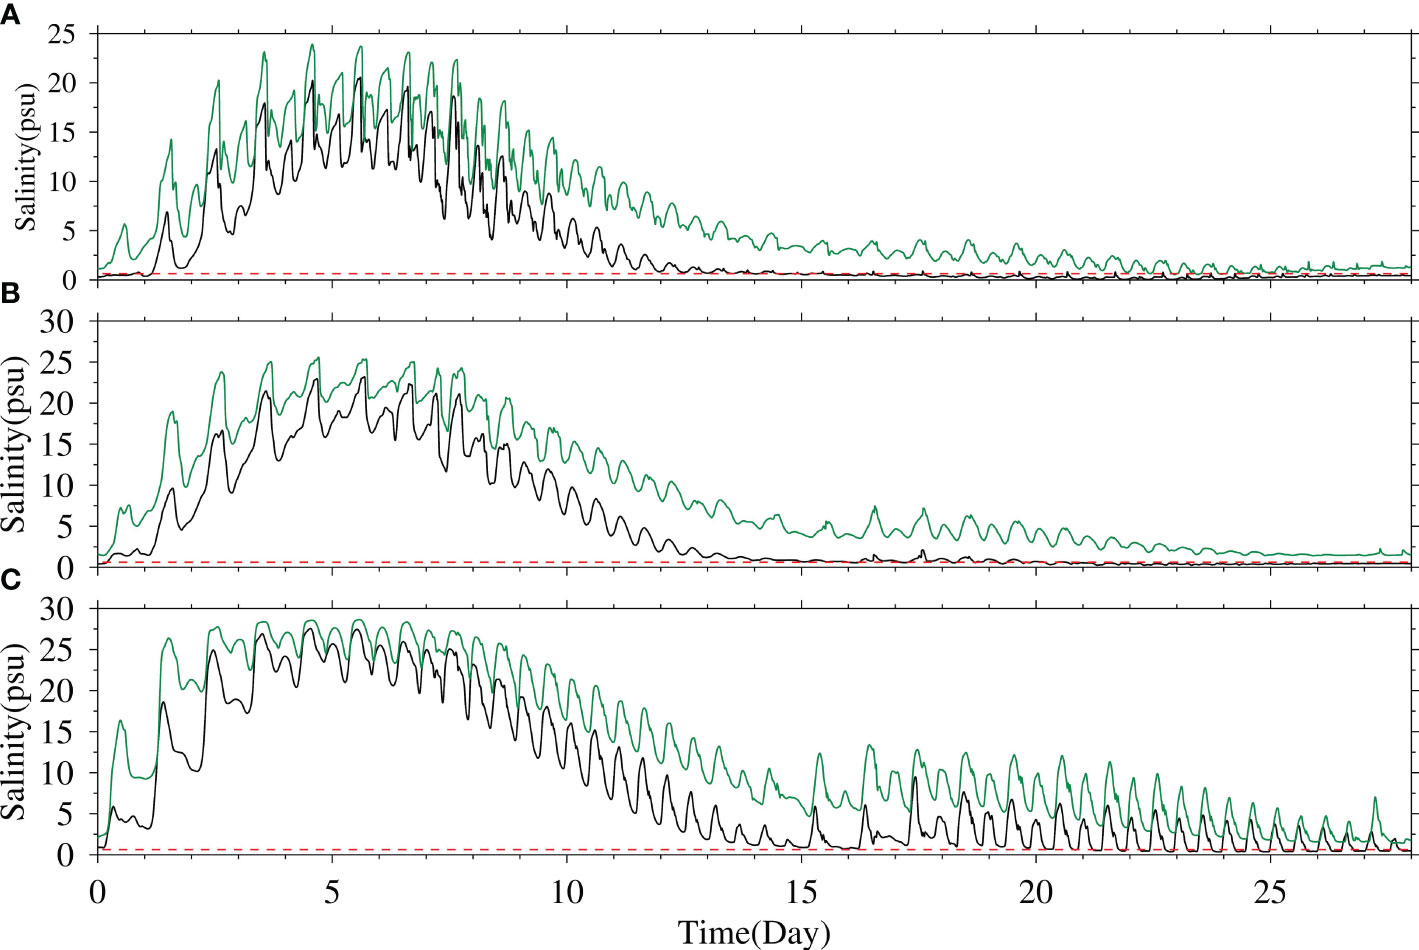
Figure 12 Temporal variations in the simulated surface salinity under the combined effect of 50% and 95% guarantee rates with a 12 m/s northerly wind in February. The other legends are the same as in Figure 10.
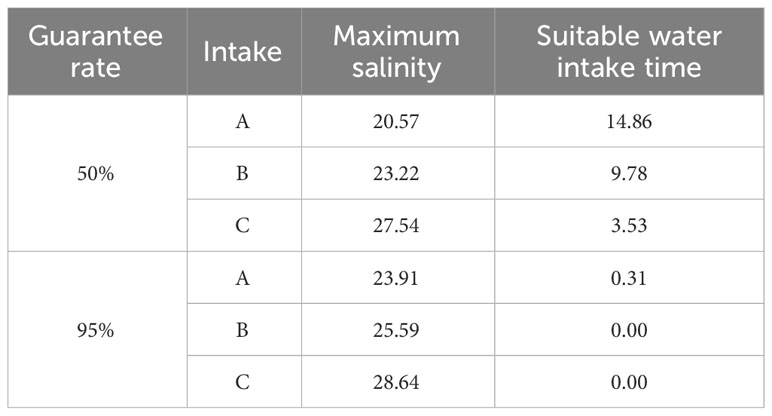
Table 3 Surface maximum salinity and suitable water intake time in February at the three water intakes at 50% and 95% guarantee rates.
EXP4 showed significant increases in salinity at the three intakes. At the 50% guarantee rate, the maximum surface salinity at water intake A was 20.57 (Figure 12A). The maximum salinity at water intake B was 23.22 (Figure 12B) and the maximum salinity at water intake C was 27.54 (Figure 12C). The suitable water intake times were 14.86, 9.78, and 3.53 days at water intakes A, B, and C, respectively. Under the influence of a 12 m/s northerly wind, the suitable water intake time at the three water intakes was halved compared to EXP1. EXP5 showed that at the 95% guarantee rate, the maximum surface salinity was 23.91, 25.59, and 28.64 at water intakes A, B, and C, respectively. The suitable water intake time was only 0.31 days at water intake A, which rarely contained freshwater. Water intakes B and C were unable to take freshwater.
5 Conclusions
The RNL is planned as agricultural land, and whether freshwater exists around the RNL becomes a critical issue caused by saltwater intrusion. In this paper, the 3D numerical model ECOM-si was used to simulate saltwater intrusion and freshwater distribution. The validation of elevation, current velocity, direction and salinity revealed that the model could successfully simulate the hydrodynamics and saltwater intrusion in the Changjiang Estuary. To investigate the spatial and temporal distribution of saltwater intrusion and the freshwater resources around the RNL, numerical experiments were set at 50%, 75%, and 95% guarantee rates of river discharge in the dry and flood seasons.
The results showed that as the guarantee rate increases, the lower river discharge results in enhanced saltwater intrusion, and the suitable water intake time at the three water intakes decreases. During the dry season, at the 50% guarantee rate, the suitable water intake times are 23.72, 27.94, and 29.66 days at water intake A, 7.30, 20.42, and 25.42 days at water intake B, and 2.40, 7.47, and 15.23 days at water intake C in January, February, and March, respectively. At the 75% guarantee rate, the suitable water intake times are 13.59, 6.59 and 28.67 days at water intake A and 0.65, 0.03 and 20.10 days at water intake B in January, February, and March, respectively. Only 7.84 days in March can take freshwater at water intake C. At the 95% guarantee rate, the suitable water intake times are 12.77, 3.74 and 12.90 days at water intake A and 0.10, 0.00 and 6.43 days at water intake B in January, February, and March, respectively. Only 2.11 days in March can take freshwater at water intake C. At different guarantee rates during the dry season, a suitable water intake time can be guaranteed at water intake A. As the guarantee rate increases, water intakes B and C are affected by the decrease in river discharge and have limited time to take water.
During the flood season, at the 50% guarantee rate, freshwater can be taken at all times from July to September at water intake A. The suitable water intake times are 30.96, 31.00 and 31.00 days at water intake B and 22.82, 24.58 and 26.77 days at water intake C in July, August, and September, respectively. At the 75% guarantee rate, freshwater can be taken at all times from July to September at water intake A. The suitable water intake times are 30.92, 31.00 and 29.94 days at water intake B and 22.98, 20.67 and 17.30 days at water intake C in July, August, and September, respectively. At the 95% guarantee rate, the suitable water intake times are 31.00, 28.15, and 11.69 days at water intake A, 31.00, 22.77, and 9.68 days at water intake B, and 24.66, 9.89, and 4.42 days at water intake C in July, August, and September, respectively. The three water intakes can ensure sufficient time to take freshwater at different guarantee rates of river discharge during the flood season. However, when extreme drought occurs, such as in 2022, the three water intakes in the RNL have difficulty taking freshwater and should be warned to ensure the safety of water taking.
Previous studies and observations have shown that strong northerly winds greatly threaten freshwater resources in the Changjiang Estuary. At the 50% guarantee rate, the suitable water intake times in February are 14.86 days, 9.78 days, and 3.53 days at water intakes A, B, and C, respectively. At the 95% guarantee rate, the suitable water intake time is 0.31 days at water intake A, and there is no freshwater at water intakes B and C. The results indicated that a 12 m/s northerly wind is an intense threat to the three water intakes along the northern edge of the RNL, and the suitable water intake time at the three water intakes is significantly reduced. The water intakes need to be warned and take more water before severe saltwater intrusion occurs to safeguard the water for agriculture in RNL.
When the guarantee rate of river discharge increases or when strong northerly wind occurs, the relevant management department need to take early warning, so as to take measures to take freshwater at the water intakes in advance. The rivers and lakes in the RNL can store and provide some freshwater to ensure the safety of agricultural water. This study is concentrated on the effect of different guarantee rate of river discharge on the freshwater resources in the RNL, and there are still a lot of work of effect of different wind speed and direction on the freshwater resources that are worth thoroughly investigation, that is under consideration of the authors’ next works.
Data availability statement
The raw data supporting the conclusions of this article will be made available by the authors, without undue reservation.
Author contributions
TW: Data curation, Writing – original draft, Writing – review & editing. JZ: Writing – review & editing, Methodology. RM: Software, Writing – original draft. WQ: Investigation, Writing – original draft. RY: Methodology, Writing – review & editing.
Funding
The author(s) declare financial support was received for the research, authorship, and/or publication of this article. This work was supported by the National Key Research and Development Program of China (No.2022YFA1004404), and the National Natural Science Foundation of China (No.42276174).
Acknowledgments
We also acknowledge the reviewers for their valuable comments and suggestions. The sea surface wind data obtained from ECMWF are available at http://apps.ecmwf.int/datasets/.Tidal constituents are obtained from the TPXO9 database (https://www.tpxo.net/global/tpxo9-atlas).
Conflict of interest
The authors declare that the research was conducted in the absence of any commercial or financial relationships that could be construed as a potential conflict of interest.
Publisher’s note
All claims expressed in this article are solely those of the authors and do not necessarily represent those of their affiliated organizations, or those of the publisher, the editors and the reviewers. Any product that may be evaluated in this article, or claim that may be made by its manufacturer, is not guaranteed or endorsed by the publisher.
Supplementary material
The Supplementary Material for this article can be found online at: https://www.frontiersin.org/articles/10.3389/fmars.2023.1302091/full#supplementary-material
Abbreviations
NB, North Branch; SB, South Branch; NC, North Channel; RNL, reclaimed new land; CC, coefficient; SS, skill score; RMSE, root mean square error; Ri, Richardson number.
References
Andrews S. W., Gross E. S., Hutton P. H. (2017). Modeling salt intrusion in the San Francisco Estuary prior to anthropogenic influence. Continental Shelf Res. 146, 58–81. doi: 10.1016/j.csr.2017.07.010
Blumberg A. F. (1994). A primer for ECOM-si,” in Technical report of HydroQual, vol. 66. (Mahwah, New Jersey).
Brunt D. (1927). The period of simple vertical oscillations in the atmosphere. Q. J. R. Meteorological Soc. 53 (221), 30–32. doi: 10.1002/qj.49705322103
Chen C., Zhu J., Ralph E., Green S. A., Budd J. W., Zhang F. Y. (2001). Prognostic modeling studies of the keweenaw current in lake superior. Part I: formation and evolution. J. Phys. Oceanography 31 (2), 379–395. doi: 10.1175/1520-0485(2001)031<0379:PMSOTK>2.0.CO;2
Fan Z., Ge J., Ding P., Pan L. (2012). Effect of deep waterway project on salinities in north passage of the changjiang estuary. J. East China Normal University(Natural Science) 2012 (4), 181–189. doi: 10.3969/j.issn.10005641.2012.04.02
Healy M., Hickey K. R. (2002). Historic land reclamation in the intertidal wetlands of the Shannon estuary, western Ireland. J. Coast. Res. 36), 365–373. doi: 10.2112/1551-5036-36.sp1.365
Li L., Zhu J. (2016). Dynamic mechanism of freshwater extension from the north channel to the north branch inthe Changjiang Estuary in dry seasons. Adv. Water Sci. 27 (1), 57–69. doi: 10.14042/j.cnki.32.1309.2016.01.007
Li L., Zhu J. (2021). The effects of north wind speed in winter on saltwater intrusion in the Changjiang Estuary. Haiyang Xuebao 43 (10), 10–22. doi: 10.12284/hyxb2021099
Li L., Zhu J., Chant R. J., Wang C., Pareja-Roman L. F. (2020). Effect of dikes on saltwater intrusion under various wind conditions in the changjiang estuary. J. Geophysical Research: Oceans 125 (7), e2019JC015685. doi: 10.1029/2019JC015685
Li L., Zhu J., Pareja-Roman L. F. (2021). Calculating salinity variance fluxes using isohaline coordinates, Estuarine. Coast. Shelf Sci. 254, 107311. doi: 10.1016/j.ecss.2021.107311
Li L., Zhu J., Wu H. (2012). Impacts of wind stress on saltwater intrusion in the Yangtze Estuary. Sci. China Earth Sci. 55, 1178–1192. doi: 10.1007/s11430-011-4311-1
Li L., Zhu J., Wu H., Guo Z. (2014). Lateral saltwater intrusion in the North Channel of the Changjiang Estuary. Estuaries Coasts 37, 36–55. doi: 10.1007/s12237-013-9669-1
Li L., Zhu J., Wu H., Wang B. (2010). A numerical study on water diversion ratio of the Changjiang (Yangtze) estuary in dry season. Chin. J. Oceanology Limnology 28 (3), 700–712. doi: 10.1007/s00343-010-9114-2
Li Z., Zhu J. (2022). Numerical simulation of the North Branch regime change impact on saltwater intrusion in the Yangtze River Estuary from 2007 to 2016. J. East China Normal Univ. (Natural Science) 223 (3), 109–124. doi: 10.3969/j.issn.1000-5641.2022.03.012
Lin T. (2014). Study on the freshwater resource near the eastern Hengsha shoal and the prediction model of saltwater intrusion in Changjiang river estuary (Shanghai: State Key Laboratory of Estuarine and Coastal Research).
Liu J., Chen J. Y., Xu Z. Y. (2008). River-bed evolution in the braided reach of the south and north passage after implementing Yangtze estuary deepwater navigational improvements. Adv. Water Sci. 19 (5), 605–612. doi: 1001-6791(2008)05-0605-08
Lyu H., Zhu J. (2019). Impacts of tidal flat reclamation on saltwater intrusion and freshwater resources in the Changjiang Estuary. J. Coast. Res. 35 (2), 314–321. doi: 10.2112/JCOASTRES-D-18-00077.1
Lyu H., Zhu J., Chen Q., Li M., Pan S., Chen S. (2023). Impact of estuarine reclamation projects on saltwater intrusion and freshwater resource. J. Oceanology Limnology 41 (1), 38–56. doi: 10.1007/s00343-021-1246-z
Manda A., Matsuoka K. (2006). Changes in tidal currents in the ariake sound due to reclamation. Estuaries Coasts 29 (4), 645–652. doi: 10.1007/BF02784289
Murphy A. H. (1988). Skill scores based on the mean square error and their relationships to the correlation coefficient. Mon. Weather Rev. 116 (12), 990–991. doi: 10.1175/1520-0493(1988)116<2417:SSBOTM>2.0.CO;2
Ocean Atlas Commission (1992). Bohai Sea, Ocean Atlas in Huanghai Sea and East China Sea (Hydrology) (Beijing, China: China Ocean Press), 13–168.
Qiu W. (2023). Application of a two-way nesting unstructured quadrilateral grid finite difference estuarine and coastal ocean model in saltwater intrusion of the Changjiang Estuary (Shanghai: Master, State Key Laboratory of Estuarine and Coastal Research).
Qiu C., Zhu J. (2015). Assessing the influence of sea level rise on salt transport processes and estuarine circulation in the Changjiang River estuary. J. Coast. Res. 31 (3), 661–670. doi: 10.2112/JCOASTRES-D-13-00138.1
Qiu C., Zhu J., Gu Y. (2012). Impact of seasonal tide variation on saltwater intrusion in the Changjiang River estuary. Chin. J. Oceanology Limnology 30 (2), 342–351. doi: 10.1007/s00343-012-1115-x
Shen Y., Jia H., Li C., Tang J. (2018). Numerical simulation of saltwater intrusion and storm surge effects of reclamation in Pearl River Estuary, China. Appl. Ocean Res. 79, 101–112. doi: 10.1016/j.apor.2018.07.013
Tomonari O., Keisuke N., Toshiyuki T., Keita F. (2011). Influence of freshwater input and bay reclamation on long-term changes in seawater residence times in Tokyo bay, Japan. Hydrological processes 25 (17), 2694–2702. doi: 10.1002/hyp.8010
Van Maren D. S., Oost A. P., Wang Z. B., Vos P. C. (2016). The effect of land reclamations and sediment extraction on the suspended sediment concentration in the Ems Estuary. Mar. Geology 376, 147–157. doi: 10.1016/j.margeo.2016.03.007
Wu H. (2006). Saltwater intrusion in the Changjiang estuary (Shanghai, China: State Key Laboratory of Estuarine and Coastal Research).
Wu H., Zhu J. (2007). Analysis of the transport mechanism of the saltwater spilling over from the North Branch in the Changjiang Estuary in China. Acta Oceanologica Sin. 29 (1), 17–25.
Wu H., Zhu J. (2010). Advection scheme with 3rd high-order spatial interpolation at the middle temporal level and its application to saltwater intrusion in the Changjiang Estuary. Ocean Model. 33 (1-2), 33–51. doi: 10.1016/j.ocemod.2009.12.001
Wu H., Zhu J., Chen B., Chen Y. (2006). Quantitative relationship of runoff and tide to saltwater spilling over from the North Branch in the Changjiang Estuary: A numerical study. Estuarine Coast. Shelf Sci. 69 (1), 125–132. doi: 10.1016/j.ecss.2006.04.009
Wu H., Zhu J., Choi B. H. (2010). Links between saltwater intrusion and subtidal circulation in the Changjiang Estuary: A model-guided study. Continental Shelf Res. 30 (17), 1891–1905. doi: 10.1016/j.csr.2010.09.001
Keywords: Changjiang Estuary, reclaimed new land, Eastern Hengsha Shoal, saltwater intrusion, freshwater resource
Citation: Wu T, Zhu J, Ma R, Qiu W and Yuan R (2023) Freshwater resources around the reclaimed new land on the Eastern Hengsha Shoal in the Changjiang estuary. Front. Mar. Sci. 10:1302091. doi: 10.3389/fmars.2023.1302091
Received: 26 September 2023; Accepted: 04 December 2023;
Published: 19 December 2023.
Edited by:
Nicoló Colombani, Colombani, Marche Polytechnic University, ItalyReviewed by:
Seyed Mostafa Siadatmousavi, Iran University of Science and Technology, IranDehai Song, Ocean University of China, China
Copyright © 2023 Wu, Zhu, Ma, Qiu and Yuan. This is an open-access article distributed under the terms of the Creative Commons Attribution License (CC BY). The use, distribution or reproduction in other forums is permitted, provided the original author(s) and the copyright owner(s) are credited and that the original publication in this journal is cited, in accordance with accepted academic practice. No use, distribution or reproduction is permitted which does not comply with these terms.
*Correspondence: Jianrong Zhu, anJ6aHVAc2tsZWMuZWNudS5lZHUuY24=