 Zhaohua Wang
 Yanzhao Pei
 Wenjie Yan
 Lv Lu4
 Bin Zhou
- 1First Institute of Oceanography, Ministry of Natural Resources (MNR), Qingdao, China
- 2College of Marine Life Sciences, Ocean University of China, Qingdao, China
- 3Key Laboratory of Mariculture, Ocean University of China, Qingdao, China
- 4Frontier Science Center for Deep Ocean Multispheres and Earth System (FDOMES) and Physical Oceanography Laboratory, Ocean University of China, Qingdao, China
Objective: To investigate the responses of Zostera marina seedlings to the individual and combined stresses of seasonal temperature increase and ocean acidification (OA) caused by global climate change and anthropogenic factors. This data will help in efforts to protect and restore seagrass beds in temperate coastal zones of China.
Methods: A mesoscale experimental system was utilized to analyze stress response mechanisms at multiple levels - phenotype, transcriptome, and metabolome - during the seedling stage of Z. marina, a dominant temperate seagrass species in China. The study monitored the seedlings under varying conditions: increased seasonal temperature, OA, and a combination of both.
Results: Findings revealed that under high-temperature conditions, carotenoid biosynthesis was stimulated through the upregulation of specific metabolites and enzymes. Similarly, the biosynthesis of certain alkaloids was promoted alongside modifications in starch, sucrose, and nitrogen metabolism, which improved the plant’s adaptation to OA. Unique metabolic pathways were activated under OA, including the degradation of certain amino acids and modifications in the citric acid cycle and pyruvate metabolism. When subjected to both temperature and OA stresses, seedlings actively mobilized various biosynthetic pathways to enhance adaptability and resilience, with distinct metabolic pathways enhancing the plant’s response under diversified stress conditions. In terms of growth, all treatment groups exhibited significant leaf length increase (p < 0.05), but the weakest growth index was observed under combined stress, followed by the thermal treatment group. Conversely, growth under OA treatment was better, showing a significant increase in wet weight, leaf length, and leaf width (p < 0.05).
Conclusion: Seasonal temperature increase was found to inhibit the growth of Z. marina seedlings to some extent, while OA facilitated their growth. However, the positive effects of OA did not mitigate the damage caused by increased seasonal temperature under combined stress due to seedlings’ sensitivity at this stage. Our findings elucidate differing plant coping strategies under varied stress conditions, contingent on the initial environment. This research anticipates providing significant data support for the adaptation of Z. marina seedlings to seasonal temperature fluctuations and global oceanic events like OA, propelling the effective conservation of seagrass beds.
1 Introduction
As marine angiosperms, seagrasses act as physical barriers to reduce waves impacts, such as turbulence (Granata et al., 2001; Koch et al., 2007). Seagrass beds are recognized as carbon sinks (Fourqurean et al., 2012), effective in accumulating subsurface carbon deposits (Mcleod et al., 2011; Fourqurean et al., 2012) and capturing carbon (Duarte et al., 2005; Barbier et al., 2011), and in addition, seagrass beds can recycle nutrients (Hemminga et al., 1991), provide habitat for many epiphytes and animals (Coll et al., 2011), are nurseries for many fish species, and have high primary productivity (Espino et al., 2011). Seagrass beds can also play a key role in biogeochemical cycling in nearshore waters with these characteristics (Hemminga and Duarte, 2000; Celia and Fernando, 2023). Therefore, seagrass beds with considerable conservation value deserve attention and protection (Barbier et al., 2011).
It has been found that some seagrasses grow rapidly with an annual reproduction pattern (Orth et al., 2006a). The vitality of these seagrasses has a distinct seasonal character (Marbà et al., 1996). Zostera marina, a common seagrass species in the temperate zone of the Northern Hemisphere (Olsen et al., 2016), is a typical dominant species of temperate seagrasses in China, forming a large number of Z. marina meadows along the coast of the Yellow Sea and Bohai Sea in China (Xu et al., 2019). Yan et al. (2023) found that the sea surface temperatures (SST) in the Yellow Sea and Bohai Sea in China over the past 20 years were highly seasonal. It was shown that such seasonal temperature variations affect the growth and productivity of vegetation in marine environments (Sand-Jensen, 1975; Orth and Moore, 1986; Watanabe et al., 2005). And the growth of coastal seagrasses is greatest in summer, with increases in biomass, shoot density and canopy height (Boström et al., 2003). As winter temperatures drop, seagrass leaves virtually disappear, reducing aboveground biomass and eventually leaving only belowground rhizomes to acclimatize to cold temperatures at the lowest of growth (Baden and Pihl, 1984; Burke et al., 1996).
Seasonal changes in the local environment of coastal areas imply not only SST changes but also in other abiotic variables. For example, SST, light, pH, and sediments can regulate seagrass growth (Hemminga and Duarte, 2000; Lee et al., 2005). Correlations exist between environmental variables (Celia and Fernando, 2023). Specifically, there are spatial pattern correlations across latitudinal gradients among seawater temperature, nutrients concentrations, and plants primary productivity (Parmesan and Yohe, 2003; Lemos and Pires, 2004; Tuya et al., 2012; Celia and Fernando, 2023). Notably, the impacts of those abiotic variable stressors vary by different seagrass species (Marbà et al., 1996; Lee et al., 2005; Celia and Fernando, 2023).
It is well known that atmospheric CO2 levels are increasing under human influence, which pose many problems for marine ecosystems (Wang et al., 2022). The oceans continue to absorb CO2 from the atmosphere and lead to a decline in ocean pH, changes in the carbonate system, and ocean acidification (OA) (Caldeira and Wickett, 2003), as a major disturbance in modern ocean events (Zhong et al., 2021). Environmental changes caused by OA will directly alter the function and structure of marine ecosystems, such as seagrasses (Gattuso et al., 2015; Zhong et al., 2021). By the end of the century, sea surface pCO2 are projected to exceed 1000 μatm (IPCC, 2013). Currently, many studies have shown the variation of CO2 concentration and temperature can produce a combined response in marine organisms (Nagelkerken and Munday, 2015; Watson et al., 2018; Brandenburg et al., 2019; Gao et al., 2019; Van Colen et al., 2020; Zhong et al., 2021). However, little is known about the adaptive responses of seagrasses to the OA and seasonal temperature fluctuations at different life stage. In recent decades, seagrass meadows due to human activities and climate change is a global concern, and their restoration has received much attention (Orth et al., 2006a). Seagrass seedling transplantation has been a useful tool for seagrass restoration (Pereda-Briones et al., 2018) due to its low damage on donor seagrass beds (Seddon, 2004; Orth et al., 2006b) and its ability to ensure the genetic diversity of seagrasses (Waycott et al., 2009). Therefore, it is important for seagrass conservation to explore the mechanisms by which seagrass seedlings respond to seasonal temperature increases and OA.
In the study, we studied the acclimatization response of Z. marina seedlings to OA and seasonal temperature changes. Under mesoscale experiments, this study investigated how Z. marina seedlings responded to (1) a large increase in seasonal temperature; (2) the occurrence of OA events; (3) OA events and seasonal temperature alternation, as assessed by growth, transcriptomics and metabolomics. This study aims to understand how seagrass seedlings adapt to seasonal temperature differences and global OA events in order to facilitate effective methods of seagrass conservation.
2 Materials and methods
2.1 Sample collection
A total of 120 Z. marina were collected in March 2022 at the sea area of Caofeidian (39.1131°N, 119.120°E), and 10 meters were spaced between each sample point to avoid collecting the same plants (Watanabe et al., 2005). All plants were in dark plastic boxes contaning in situ seawater to the laboratory within 1 h. The leaves, roots and stems of each plants were gently brushed and rinsed with tap water. Then, put them in a seawater recirculation tank for 7 days as a pre-culture stage. The transient condition was achieved in a recirculating seagrass culture system with a temperature of 14°C, a salinity of 32, a water flow rate of 800 mL min-1, a light intensity of 240 µmol photons m-2, and a 12:12 h light/dark ratio.
2.2 Experimental design
To setup temperature of each treatment, we used the data from the National Oceanic and Atmospheric Administration optimized interpolated sea surface temperature (OISST) (https://www.ncei.noaa.gov/metadata/geoportal/rest/metadata/item/gov.noaa.ncdc:C00844/html) (Richard et al., 2008), which spatial grid resolution is 0.25 degrees and temporal resolution is 1 day. The SST daily climatology of the Bohai Yellow Sea (34°N–42°N, 115°E–127°E) was extracted and calculated using the 20-year (2003–2022) SST mean values. All data were calculated in Ferret Version 7.6.0 and plotted in MATLAB software.
Four groups were set up with 30 well-grown, similarly growing plants in each group. Each group had a separate recirculation system consisting of a tank, a light system, a circulation system, a filtration system, a temperature control system and a monitoring system (more details in the Methods of Yan et al., 2023). Meanwhile, in situ seawater was used to maximize the simulation of the natural environment for Z. marina growth. The average SST of May is 14.03°C and the avarage SST of Jun is 19.02°C (Figure 1). To predict Z. marina response to OA, we choose the pCO2 of the end of the century (1000 μatm) was used as the future OA condition. The control group (CK) was with the seawater temperature in May (14 ± 1°C) represented the spring season (Figure 1A), and the CO2 concentration was that of the current atmospheric pCO2 (410 μatm); the second group (OA) was the acidification group, in which the seawater temperature was 14 ± 1°C, and the CO2 concentration was that of the future atmospheric pCO2 (1000 ± 50 μatm); the third group (OW) was the SST temperature with seasonal changes treatment group, which has a current CO2 concentration of 410 μatm and June temperature of 19 ± 1°C (Figure 1B); and the fourth group (AW) was the treatment group with composite stressors, i.e. extreme CO2 concentration of 1000 ± 50 μatm and early summer temperature of 19 ± 1°C. During the experiment, the CO2 flux of each group was controlled and monitored by a CO2 enricher (SFO-E, China), which can pass CO2 with a set concentration or air directly into the seawater tank (Yan et al., 2023). Water temperature, pH, and TDS were monitored in real-time using a temperature monitor (Caperplus Q2-PH/TDS, China) and a multiparameter water quality tester (ProQuatro; YSI, Yellow Springs, Ohio, USA) to make sure constant water quality. The whole treatment was 14 days.
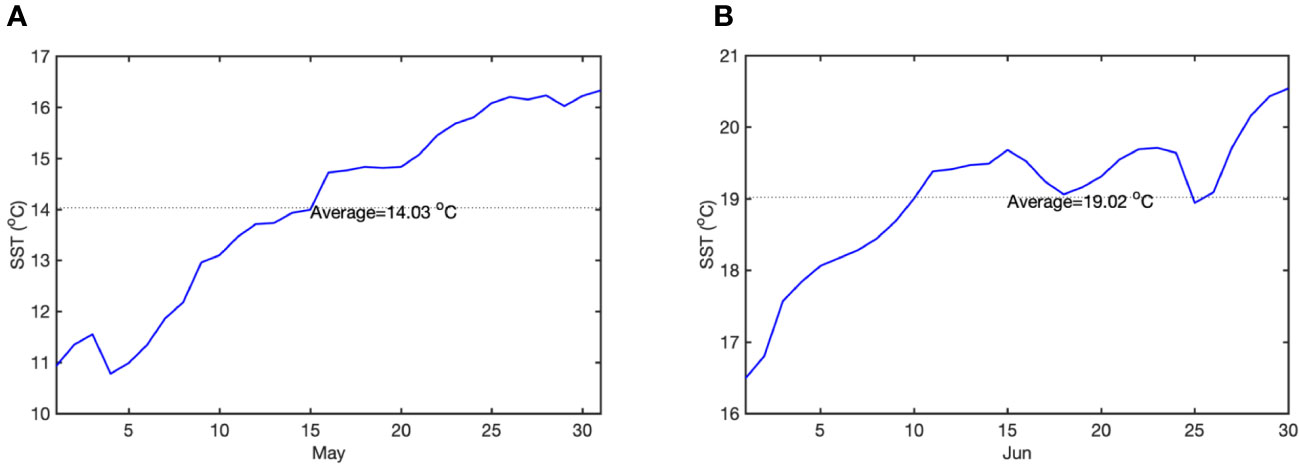
Figure 1 Sea surface temperature daily climatology of May and June. (A) daily SST of May; (B) daily SST of June. The dashed black line denotes the average SST (blue line).
2.3 Plant growth
Nine samples were selected from each group. Since the plants did not have a very long leaf length (10 cm on average), a uniform de-averaging of the leaf length was not done. Leaf length (cm) was measured from the base of the meristematic tissue, leaf width (cm) was from the middle part of the leaf, and wet weight (g) was of the whole plant at the day 0 and 14 of the experiment. Before measurement, tap water was used to gently washed each sample, and then three growth index were measured to analyze their changes.
2.4 RNA extraction and transcriptome analysis
Three samples per treatment group were selected for transcriptomics sequencing. First, total RNA was extracted using the Trizol kit (Invitrogen, Carlsbad, CA, USA) according to the method provided by the manufacturer. RNA quality was assessed on an Agilent 2100 Bioanalyzer (Agilent Technologies, Palo Alto, CA, USA) and assayed using an RNase-free RNA quality was assessed on an Agilent 2100 Bioanalyzer (Agilent Technologies Palo Alto, CA, USA) and detected using RNase-free agarose gel electrophoresis. After extraction of total RNA, mRNA was enriched with Oligo(dT) beads, purified, and amplified by polymerase chain reaction. The resulting cDNA library was sequenced at Illumina Novaseq6000 to obtain all the raw data. To obtain high-quality clean data, the reads were first filtered using fastp V. 0.18.0 (Chen et al., 2019). Next, the reads were mapped using Bowtie2 V. 2.2.8 (Langmead and Salzberg, 2012), followed by removing the rRNA-mapped reads. Then, the remaining clean data were mapped to the reference genome of Z. marina using HISAT2. The reference gene from ENSEMBL (http://www.ensembl.org/index.html) was sequenced in 2016 and renewed their genome annotation in 2017 (Olsen et al., 2016). Fragments per kilobase of transcript per million mapped reads (FPKM) values were calculated using the RSEM software (Li and Dewey, 2011) to compare gene expression differences among samples. Principal component analysis (PCA) was performed using the R package gmodels (http://www.rproject.org/) to reveal relationships between samples. Differential expression analysis (Love et al., 2014) was performed on RNAs between two different groups using DESeq2 software (Robinson et al., 2010). Genes with a false discovery rate (FDR) of less than 0.05 and an absolute fold change of ≥ 2 were considered differentially expressed genes (DEGs). All DEGs were mapped to GO terms in the Gene Ontology database (http://www.geneontology.org/) to identify the major biological functions performed by DEGs. Kyoto Encyclopedia of the Genome (KEGG) metabolic pathway enrichment analysis was performed to identify major metabolic pathways in which DEGs were involved (Kanehisa and Goto, 2000).
2.5 Metabolite extraction and metabolome analysis
Six samples from each group were selected for metabolomics analysis. Aliquots of samples were prepared as quality control (QC) (Want et al., 2013). For metabolite extraction, we first ground the leaves (100 mg) individually in liquid nitrogen and then resuspended the homogenate in 500 µl of precooled 80% methanol by vortexing thoroughly. The samples were incubated on ice for 5 min and then centrifuged at 15,000 g for 20 min at 4°C. The supernatant was analyzed by LC-MS grade. The supernatant was diluted with LC-MS grade water to a final concentration of 53% methanol. The sample was then transferred to a new Eppendorf tube and centrifuged at 15,000 g for 20 minutes at 4°C. The supernatant was injected into the LC-MS sample. Finally, the supernatant was injected into the LC-MS/MS system for analysis (Dunn et al., 2011).
The metabolites were detected in positive ion mode (POS) and negative ion mode (NEG). Positive and negative ion modes were subsequently analyzed separately. Data were z-score normalized (Kolde, 2015). Orthogonal projection to latent structures-discriminant analysis (OPLS-DA) was performed on six comparison groups (CK-vs-AW, CK-vs-OW, OA-vs-OW, CK-vs-OA, OW-vs-AW, OA-vs-AW) using R package models (http://www.r-project.org/) (Bylesjö et al., 2006). The OPLS-DA model was further validated by cross-validation and permutation tests (Saccenti et al., 2014). The variable importance (VIP) score was applied to rank the most distinguishable metabolites between the two groups. The p values were calculated using R (Rao et al., 2016), and correlation heatmaps were plotted by the R corrplot software package (Wei et al., 2017). In addition, a t-test was used to screen for differentially expressed metabolites (p value < 0.05 and VIP ≥ 1). The abundance of differentially expressed metabolites in the same group was normalized by z-value using R, and the VIP scores from OPLS-DA were used to map the volcano plots (Yoon et al., 2020). Finally, metabolites were mapped to KEGG metabolic pathways enrichment analyses (Kanehisa and Goto, 2000). The p values were corrected for false discovery rate (FDR), and metabolic pathways with an FDR of ≤ 0.05 were screened as metabolic pathways significantly enriched for differentially expressed metabolites.
2.6 Statistical analysis
The data of growth indexes of each treatment were expressed as mean ± standard deviation (SD) and statistically analyzed. One-way analysis of variance was performed using IBM SPSS Statistics 27.0 (IBM SPSS, Chicago, IL, USA). Data were visualized using Origin 2021 (Originlab, Northampton, MA, USA).
3 Results
3.1 Plant growth
After 14 days, CK and OA tended to increase in wet weight at 14°C, and the increase was higher in the OA group; at 19°C, there was no significant change in OW and AW (Figure 2A). In addition, leaf length increased in all four groups (p < 0.05, Figure 2B). The increase was smaller in OA, OW, and AW groups than in CK group. OW group had the longest leaf length, which showed the largest increase, while the AW group showed the smallest. Similarly, leaf width increased significantly in all four groups (Figure 2C, p < 0.05), with the largest increase in CK group, followed by OA group, and the samllest increase in AW group.
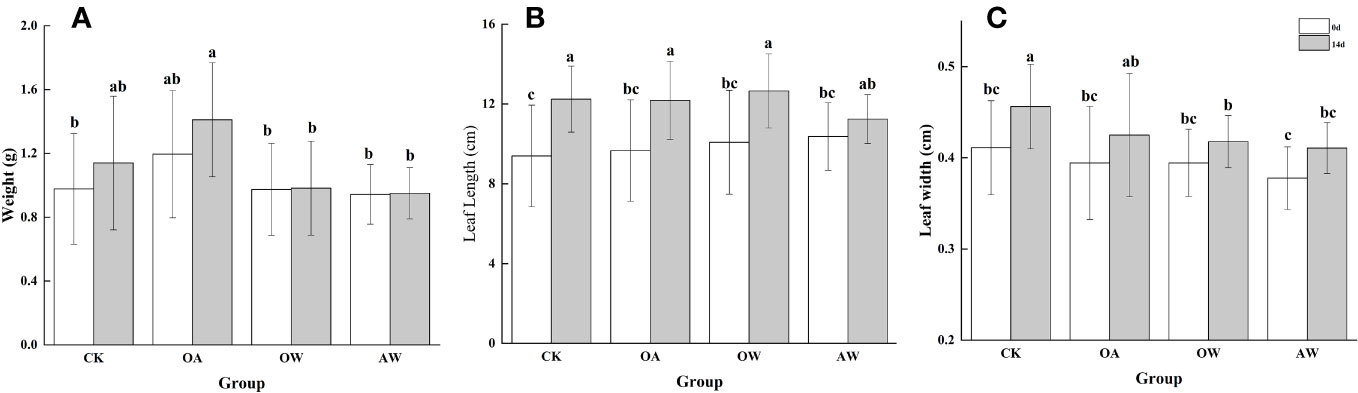
Figure 2 (A) Wet weight, (B) leaf length, and (C) leaf width for different groups at the beginning and end of the experiment. CK means the group control with 14°C, and current atmospheric pCO2 (410 μatm); OA is with seawater temperature of 14°C, and the future atmospheric pCO2 (1000 μatm); OW is with a current CO2 concentration (410 μatm) and June temperature of 19°C; AW is with an extreme CO2 concentration of 1000 μatm and early summer temperature of 19°C.
3.2 Transcriptome results
A total of 12 leaf tissue samples (three replicates from each group) were sequenced and got a 9.55 Gb high-quality reads with an average of 4.96 Gb. The percentage of bases filtered to Q30 in clean data ranged from 92.56% to 94.53%. The GC ratios of filtered sequence bases ranged from 44.79% to 45.63%. Comparison of the clean data with the Z. marina reference genome (Olsen et al., 2016) revealed a rate of 90.25–94.57%.
Based on transcriptome analysis, we found that the number of DEGs varied among different comparisons (Figure S1). The greatest number of DEGs were found between CK and AW. This was followed by CK-VS-OW, OA-VS-OW, CK-VS-OA, OW-VS-AW, and the least was OA-VS-AW.
A total of 1,290 DEGs were identified in AW compared to CK, of which 763 were upregulated genes (Figure 3A). GO enrichment analysis showed that DEGs were mainly enriched in biological process, cellular process, metabolic process, and so on. The top 10 terms in biological process were flavonoid biosynthetic process, asparagine biosynthetic process, asparagine metabolic process, flavonoid metabolic process, glutamine family amino acid metabolic process, single-organism process, hyperosmotic response, response to chemical (q < 0.01). These DEGs were involved in 107 KEGG pathways (Figure S2A). Among them, biosynthesis of secondary metabolites; flavonoid biosynthesis; alanine, aspartate and glutamate metabolism; glycine, serine and threonine metabolism; biosynthesis of amino acids, starch and sucrose metabolism; and galactose metabolism showed significant enrichment (p < 0.01, Figure S2A), with the following valine, leucine and isoleucine biosynthesis; arachidonic acid metabolism; DNA replication; plant-pathogen interaction; betalain biosynthesis; circadian rhythm-plant, 2-oxocarboxylic acid metabolism; and vitamin B6 metabolism (p < 0.05, Figure S2A).
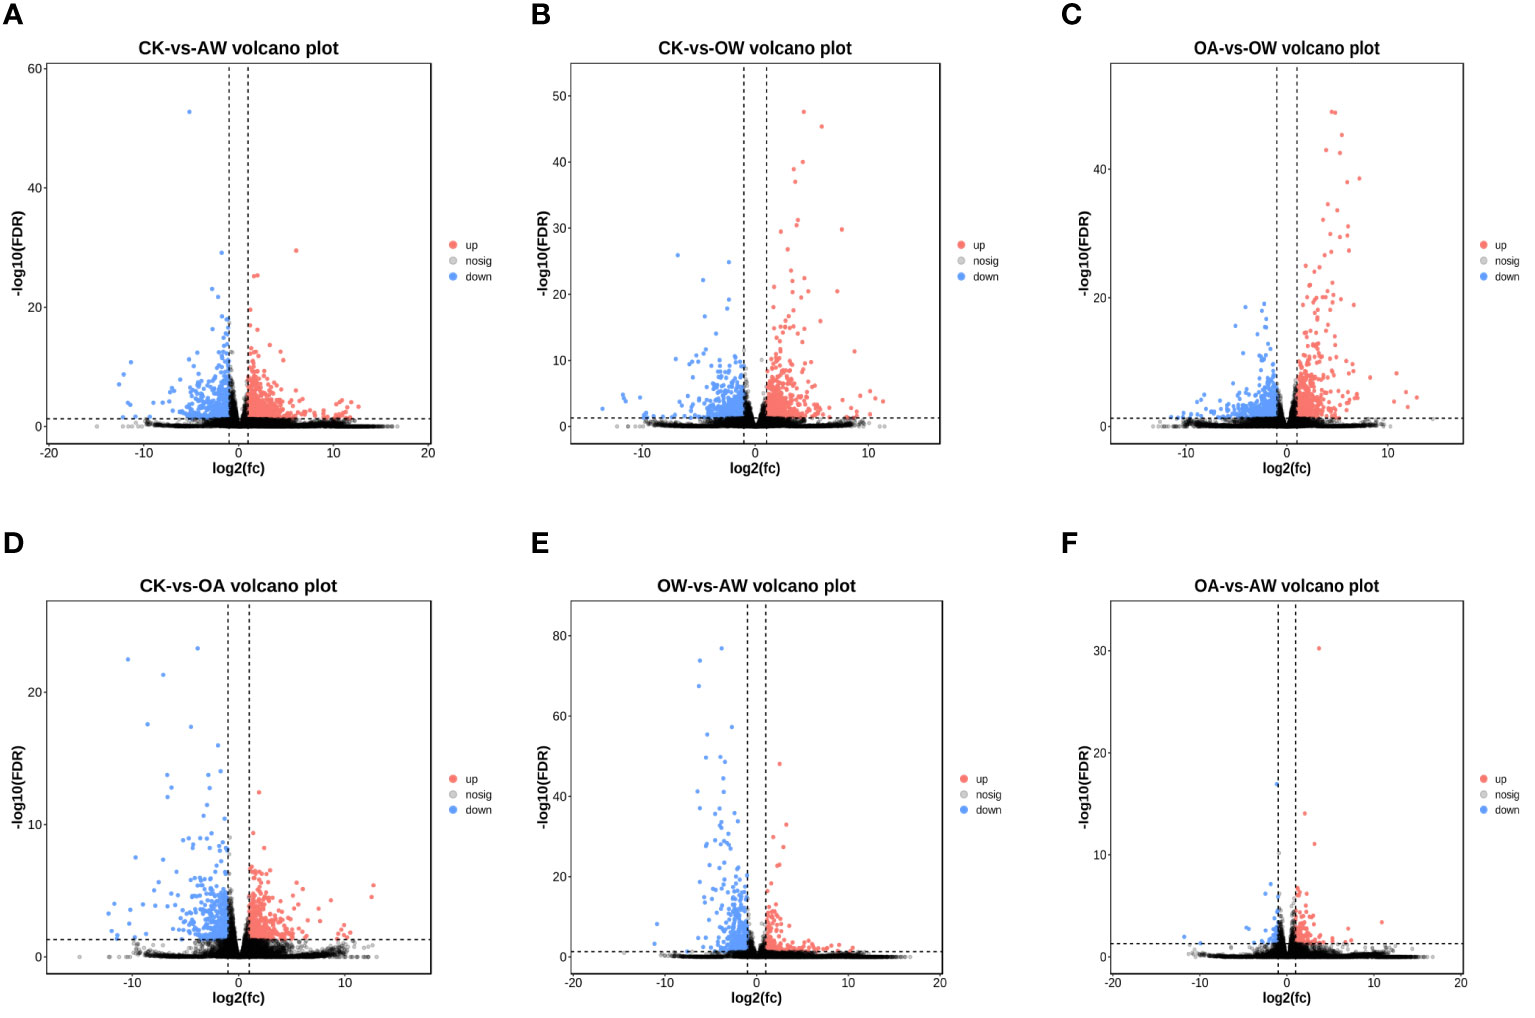
Figure 3 Volcano plot of differentially expressed genes (DEGs) in different treatments. DEGs in (A) CK-vs-AW, (B) CK-vs-OW, (C) OA-vs-OW, (D) CK-vs-OA, (E) OW-vs-AW, (F) OA-vs-AW. Each dot is a gene. The horizontal coordinate is log2 fold-change, and the vertical coordinates is -log10 q values. Red, significantly upregualted genes; blue, significantly downregualted genes; gray, no significant differences. All DEGs are with q < 0.05 and |log2 FC| > 1. The closer the genes are to the ends, the greater the degree of difference. CK means the group control with 14°C, and current atmospheric pCO2 (410 μatm); OA is with seawater temperature of 14°C, and the future atmospheric pCO2 (1000 μatm); OW is with a current CO2 concentration (410 μatm) and June temperature of 19°C; AW is with an extreme CO2 concentration of 1000 μatm and early summer temperature of 19°C.
In OW compared to CK, 1,220 DEGs were identified with 701 upregulated genes (Figure 3B). GO enrichment analysis showed that the DEGs significantly enriched in biological processes were response to stress, chemical, organic substance, cellular response to UV (q < 0.005), response to stimulus and acid chemical (q < 0.05). KEGG pathways revealed these DEGs were enriched in 103 pathways (Fugire S2b). The most significant pathways were metabolic pathways, amino sugar and nucleotide sugar metabolism, starch and sucrose metabolism, plant-pathogen interaction (p < 0.01, Figure S2B), followed by biosynthesis of secondary metabolites, arachidonic acid metabolism, photosynthesis-antenna proteins, galactose metabolism, nitrogen metabolism, flavonoid biosynthesis, DNA replication, fructose and mannose metabolism, ascorbate and aldarate metabolism, valine, leucine and isoleucine biosynthesis (p < 0.05, Figure S2B). In particular, NCED (9-cis-epoxycarotenoid dioxygen) was significantly upregulated in carotenoid biosynthesis.
A total of 1146 DEGs were identified in OW compared to OA, of which 555 were upregulated and 591 were downregulated (Figure 3C). GO enrichment analysis showed that response to organic substance, stimulus, acid chemical, chemical, endogenous stimulus, stress, generation of precursor metabolites and energy, response to organonitrogen compound, photosynthesis, light reaction, photosynthesis, response to hormone, asparagine biosynthetic process, cellular response to acid chemical, and immune system process were significantly enriched in biological processes (q < 0.005). There were 92 significant KEGG pathways (Figure S2C). Among them, metabolic pathways were the most significant (p < 0.01 and q < 0.005), followed by biosynthesis of secondary metabolites; photosynthesis-antenna proteins; glutathione metabolism; carbon fixation in photosynthetic organisms; pentose phosphate pathway; photosynthesis; MAPK signaling pathway-plants; alanine, aspartate and glutamate metabolism; and biosynthesis of amino acid (p < 0.01).
A total of 836 DEGs were identified in OA compared to CK, of which 442 were upregulated (Figure 3D). In biological processes, DEGs significantly enriched in, firstly, asparagine biosynthetic process, asparagine metabolic process, response to organonitrogen compound, aspartate family amino acid biosynthetic process, response to chemical, glutamine family amino acid metabolic process, response to stimulus, and acid chemical (q < 0.001), followed by response to stress, cell communication, response to light intensity, cellular response to starvation, response to starvation, cellular response to nutrient levels, hyperosmotic response, alpha-amino acid biosynthetic process, response to nutrient levels, cellular response to extracellular stimulus, cellular response to external stimulus, response to extracellular stimulus (q < 0.005). These DEGs were involve in 98 KEGG pathways (Figure S2D). Specifically speaking, biosynthesis of secondary metabolites; alanine, aspartate and glutamate metabolism; biosynthesis of amino acids; carbon metabolism; carbon fixation in photosynthetic organisms; arachidonic acid metabolism; glycine, serine and threonine metabolism; linoleic acid metabolism; and phenylalanine, tyrosine and tryptophan biosynthesis showed the significance (p < 0.01, Figure S2D), followed by starch and sucrose metabolism, glyoxylate and dicarboxylate metabolism, TCA cycle, cyanoamino acid metabolism, vitamin B6 metabolism, flavonoid biosynthesis, alpha-linolenic acid metabolism, and galactose metabolism (p < 0.05, Figure S2D). In tropane, piperidine and pyridine alkaloid biosynthesis, hisC (histidinol-phosphate aminotransferase) was significantly upregulated. In starch and sucrose metabolism, eight genes showed strong up or downregulation trends. For example, pgm (phosphoglucomutase) and glgA (starch synthase) showed upregulation, and INV, sacA (beta-fructofuranosidase), and SUS (sucrose synthase) were downregulated.
A total of 591 DEGs were identified in AW compared to OW, of which 380 were upregulated genes (Figure 3E).Top 15 GO terms in biological process were response to stimulus, chemical, organic substance, acid chemical, endogenous stimulus, organonitrogen compound, signal transduction, hormone, other organisms, biotic stimulus, external biotic stimulus, stress, cellular response to stimulus, signaling, and single-organism signaling (q < 0.001). KEGG results showed that DEGs were enriched in 78 metabolic pathways. Biosynthesis of secondary metabolites; amino sugar and nucleotide sugar metabolism; phenylpropanoid biosynthesis; flavonoid biosynthesis; phenylalanine, tyrosine and tryptophan biosynthesis; vitamin B6 metabolism; MAPK signaling pathway-plant, ascorbate and aldarate metabolism; glycine, serine and threonine metabolism; betalain biosynthesis; and tyrosine metabolism expressed significantly (p < 0.01, Figure S2E). Isoquinoline alkaloid biosynthesis; starch and sucrose metabolism; cutin, suberine and wax biosynthesis; linoleic acid metabolism; and biosynthesis of amino acids likewise showed a significance (p < 0.05, Figure S2E).
There were 172 DEGs in AW compared to OA, of which 132 were upregulated (Figure 3F). Protein complex subunit organization and protein oligomerization were significantly enriched in biological processes (p < 0.05). DEGs were enriched in 47 metabolic pathways. DNA replication, photosynthesis-antenna proteins, RNA degradation, sesquiterpenoid and triterpenoid biosynthesis, and carbon fixation in photosynthetic organisms showed significant enrichment (p < 0.05, Figure S2F).
3.3 Metabolomic results
We selected 24 samples (6 samples per group) for metabolomics analysis. Two ion modes, positive ion mode (POS) and negative ion mode (NEG), were combined, and all data were analyzed separately in each mode. A total of 25,871 metabolites were identified and 6,028 were named metabolites. Under POS mode, 3,723 named metabolites were identified, mainly including glycerolipids (15%), carboxylic acids and derivatives (9%), and organooxygen compounds (8%). A total of 2,305 named metabolites composed of glycerolipids (17%), glycerophospholipids (9%), and fatty acyls (8%)were identified under NEG mode. There were differences among different comparisons (Figure 4). The prediction rates of the OPLS-DA models were 0.413-0.794 (Table S2), which means models were reliable (Figure S3).
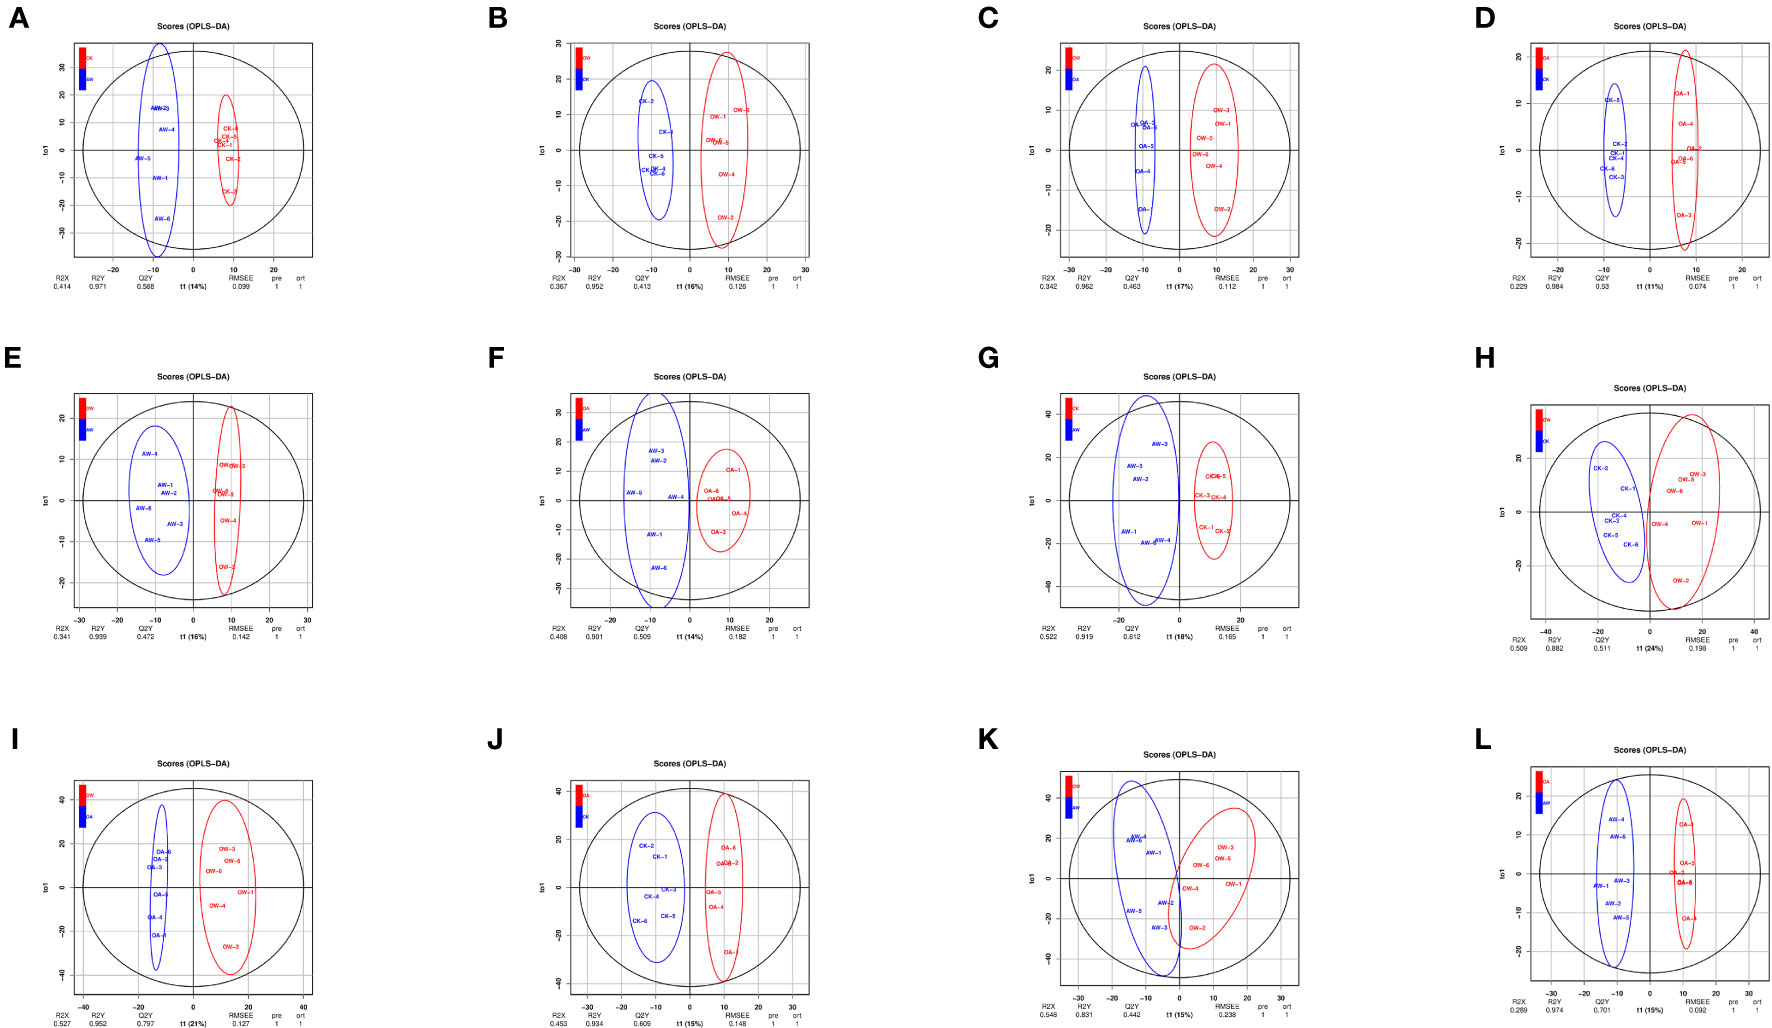
Figure 4 Score plot of orthogonal partial least-squares discriminant analysis (OPLS-DA). (A-F): POS mode; (G-L): NEG mode. (A, G): CK-vs-AW; (B, H): CK-vs-OW; (C, I): OA-vs-OW; (D, J): CK-vs-OA; (E, K): OW-vs-AW; (F, L): OA-vs-AW. The horizontal coordinate represents the predicted principal component (PC), which can be used to directly distinguish differences between different treatments; the vertical coordinate represents the orthogonal PC, which can reflect the variation within one group. CK means the group control with 14°C, and current atmospheric pCO2 (410 μatm); OA is with seawater temperature of 14°C, and the future atmospheric pCO2 (1000 μatm); OW is with a current CO2 concentration (410 μatm) and June temperature of 19°C; AW is with an extreme CO2 concentration of 1000 μatm and early summer temperature of 19°C.
There were differences in the differentially expressed metabolites between different comparisons (Figure S4). In AW compared with CK, 114 differentially expressed metabolites were identified in POS mode, 69 were upregulated, and the top five were kojibiose, D-maltose, 4-hydroxy-2-butenoic acid gamma-lactone, 1,2,3-trihydroxybenzene, and 3-hydroxyadipic acid 3,6-lactone (Figure 5). In NEG mode, 35 differentially expressed metabolites were identified, of which 28 were upregulated (Figure S4). Among them, 1-deoxy-a-(N6-lysino)-D-fructose, 2-Ethyl-2-hydroxybutyric acid, malonic acid, L-glutamic acid, and itaconic acid were the top five, and only N-acetylglutamic acid was downregulated (Figure 5). KEGG results revealed 67 pathways were significantly enriched (Figure 6A), of which biosynthesis of plant secondary metabolites and biosynthesis of terpenoids and steroids were the most highly enriched (p < 0.01), followed by the butanoate metabolism; catecholamine transferase inhibitors; propanoate metabolism; biosynthesis of alkaloids derived from ornithine, lysine and nicotinic acid; C5-Branched dibasic acid metabolism; sulfur metabolism; and biosynthesis of alkaloids derived from shikimate pathway (p < 0.05).
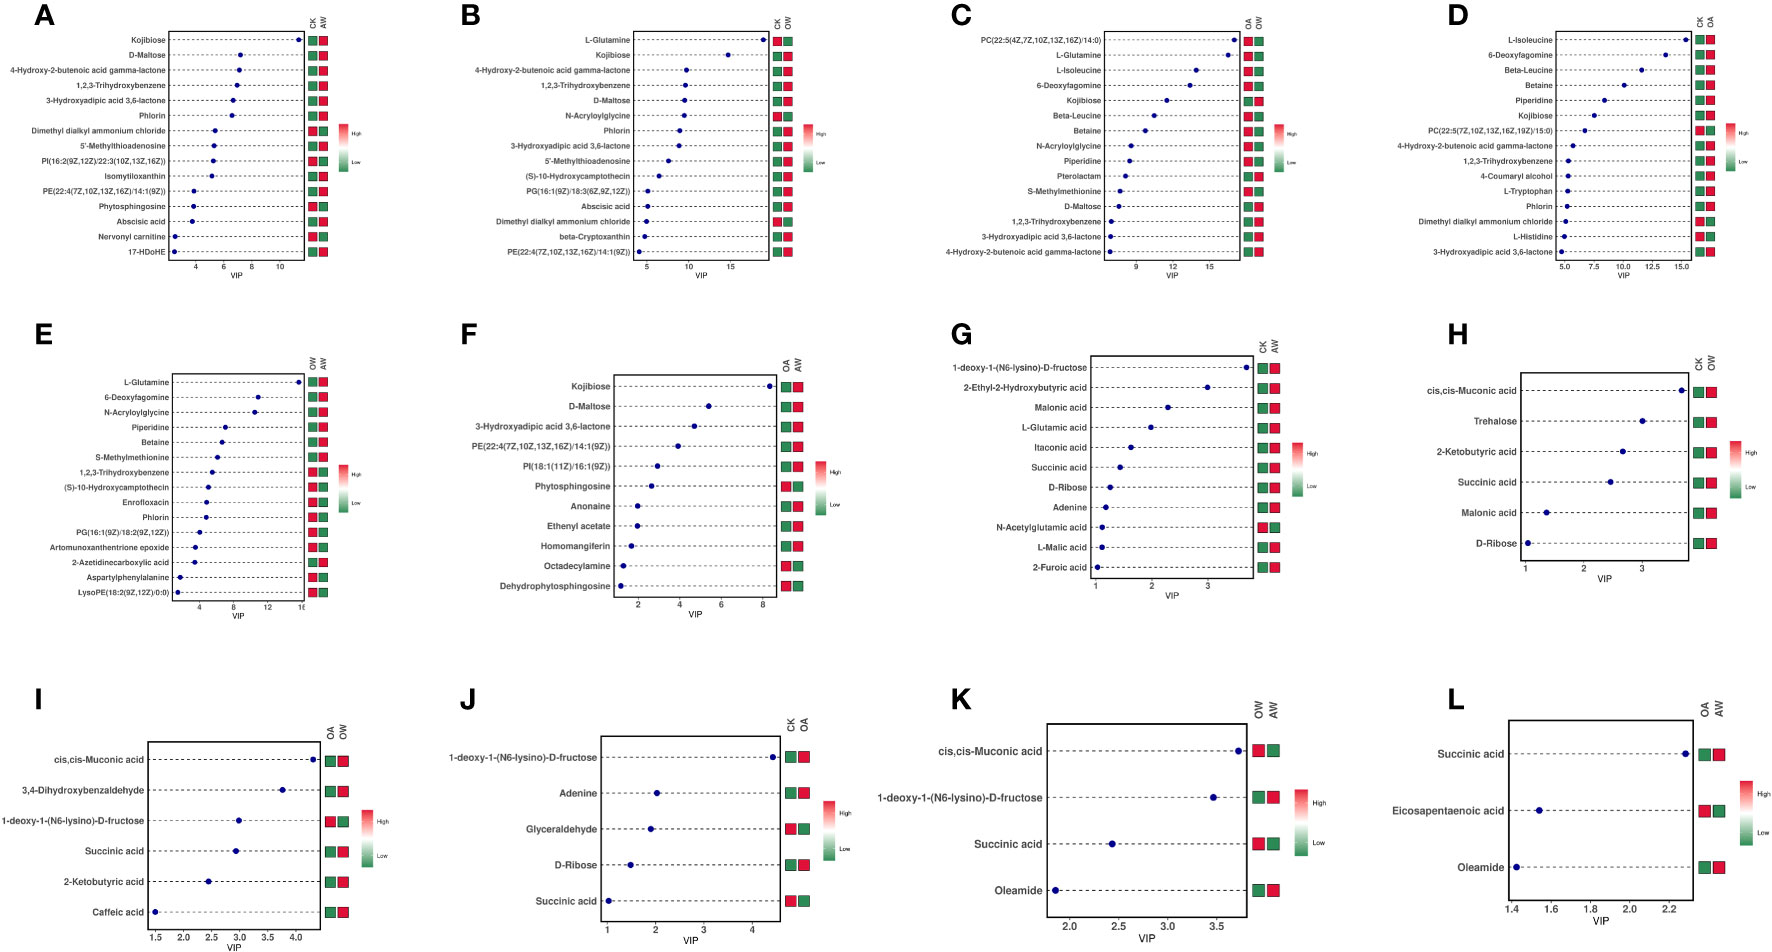
Figure 5 Variable importance in projection (VIP) plots of differentially expressed metabolites in different treatments. (A-F): POS mode; (G-L): NEG mode. (A, G): CK-vs-AW; (B, H): CK-vs-OW; (C, I): OA-vs-OW; (D, J): CK-vs-OA; (E, K): OW-vs-AW; (F, L): OA-vs-AW. The horizontal coordinate is the VIP value, and the vertical coordinate is the top 15 differentially expressed metabolites; the abundance of each metabolite in each group was averaged, and then z-score analysis was performed for each group. The colors on the right side indicated the abundance of the metabolite in different groups, red indicated upregulation, and green indicated downregulation. The higher the value of VIP, the greater their contribution to the differentiation of samples. The metabolites with default VIP greater than 1 had a significant difference. CK means the group control with 14°C, and current atmospheric pCO2 (410 μatm); OA is with seawater temperature of 14°C, and the future atmospheric pCO2 (1000 μatm); OW is with a current CO2 concentration (410 μatm) and June temperature of 19°C; AW is with an extreme CO2 concentration of 1000 μatm and early summer temperature of 19°C.
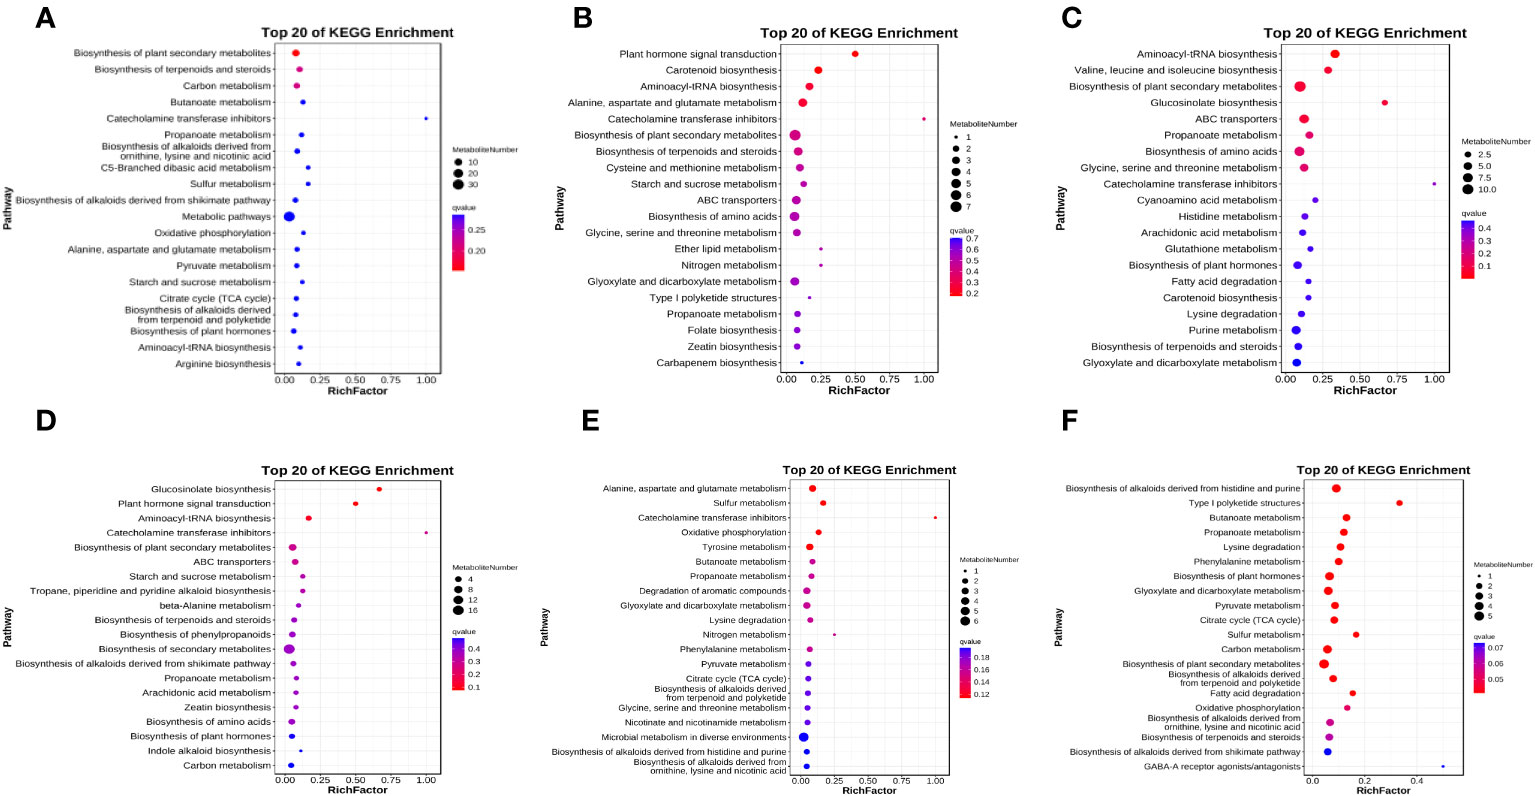
Figure 6 Bubble diagram of metabolic pathways. Top 20 pathways with the smallest q values were shown. The vertical coordinate is the pathway name, the horizontal coordinate is the enrichment factor, and the cicle size indicates how many metabolites in the pathway. The color shows the significance, and the redder the color, the smaller the q value. CK means the group control with 14°C, and current atmospheric pCO2 (410 μatm); OA is with seawater temperature of 14°C, and the future atmospheric pCO2 (1000 μatm); OW is with a current CO2 concentration (410 μatm) and June temperature of 19°C; AW is with an extreme CO2 concentration of 1000 μatm and early summer temperature of 19°C.
A total of 109 differentially expressed metabolites were identified in OW compared with CK under POS mode, including 71 upregulated. Among them, L-glutamine (downregulated), kojibiose, 4-hydroxy-2-butenoic acid gamma-lactone, 1,2,3-Trihydroxybenzene, and D-maltose were the top five (Figure 5). In NEG mode, there were 27 differentially expressed metabolites with 22 upregulated and five downregulated (Figure S4). And cis,cis-Muconic acid, trehalose, 2-ketobutyric acid, succinic acid, malonic acid, and D-ribose were differentially expressed metabolites, and all were upregulated (Figure 5). KEGG pathway enrichment analysis revealed 65 noteworthy signaling pathways (Figure 6B), among which plant hormone signal transduction carotenoid biosynthesis was most highly enriched (p < 0.01), followed by aminoacyl-tRNA biosynthesis; alanine, aspartate and glutamate metabolism; catecholamine transferase inhibitors; biosynthesis of plant secondary metabolites; and biosynthesis of terpenoids and steroids (p < 0.05). Beta-cryptoxanthin, zeaxanthin, and abscisate were significantly upregulated in carotenoid biosynthesis.
In OW compared with OA, 131 differentially expressed metabolites were identified in POS mode, of which 82 were upregulated (Figure S4), and L-glutamine, L-isoleucine, 6-deoxyfagomine, and kojibiose (downregualted) were the top five (Figure 5). In NEG mode, 48 were identified, of which 29 were upregulated (Figure S4), and cis,cis-Muconic acid; 3,4-Dihydroxybenzaldehyde;1-deoxy-1-(N6-lysino)-D-fructose (only downregulated); succinic acid; 2-ketobutyric acid; and caffeic acid were top five (Figure 5). KEGG analysis revealed 86 significant pathways (Figure 6C), of which aminoacyl-tRNA biosynthesis; valine, leucine, and isoleucine biosynthesis; biosynthesis of plant secondary metabolites; glucosinolate biosynthesis; ABC transporter (p < 0.01); propanoate metabolism; biosynthesis of amino acid; glycine, serine and threonine metabolism; and catecholamine transferase inhibitors (p < 0.05) were significantly enriched.
In OA compared with CK, 65 differentially expressed metabolites were identified in POS mode, of which 37 were upregulated (Figure S4). The top five were L-glutamine, 6-deoxyfagomine, beta-leucine, betaine, and piperidine and all of them showed upregulation (Figure 5). A total of 21 were identified in NEG mode, of which 12 were upregulated (Figure S4), and 1-deoxy-1-(N6-lysino)-D-fructose, adenine, glyceraldehyde (downregulated), D-ribose, succinic acid (downregulated) were the highly significant differentially expressed metabolites (Figure 5). KEGG pathway analysis of differentially expressed metabolites identified 61 significant pathways (Figure 6D), such as glucosinolate biosynthesis; plant hormone signal transduction; aminoacyl-tRNA biosynthesis; catecholamine transferase inhibitors (p < 0.01); biosynthesis of plant secondary metabolites; ABC transporters; starch and sucrose metabolism; tropane, piperidine and pyridine alkaloid biosynthesis (p < 0.05). Among them, L-isoleucine and azacyclohexane were significantly upregulated in tropane, piperidine, and pyridine alkaloid biosynthesis. In starch and sucrose metabolism, maltose showed upregulation, and trehalose 6-phosphate showed downregulation.
In AW compared with OW, 63 differentially expressed metabolites were identified in POS mode, of which 29 were upregulated metabolites; and 26 were identified in NEG mode, of which 14 were upregulated metabolites (Figure S4). In POS mode, L-glutamine, 6-deoxyfagomine, N-acryloylglycine, piperidine, and betaine were the top five, and all of them showed upregulation (Figure 5). In NEG mode, cis,cis-muconic acid (downregulated), 1-deoxy-1-(N6-lysino)-D-fructose, succinic acid (downregulated), and oleamide were highly significant (Figure 5). There were 41 significant KEGG pathways (Figure 6E), such as alanine, aspartate and glutamate metabolism; sulfur metabolism (p < 0.01); catecholamine transferase inhibitors, oxidative phosphorylation; tyrosine metabolism; butanoate metabolism; propanoate metabolism; degradation of aromatic compounds; glyoxylate and dicarboxylate metabolism; lysine degradation; nitrogen metabolism; and phenylalanine metabolism (p < 0.05). L-glutamine was significantly upregulated in nitrogen metabolism.
In AW compared with OA, 64 differentially expressed metabolites were identified in POS mode, of which 36 were upregulated, and 26 were identified in NEG mode, of which 14 were upregulated, (Figure S4). In POS mode, kojibiose, D-maltose, and 3-hydroxyadipic acid 3,6-lactone were the top three, and all of them showed upregulation (Figure 5). In NEG mode, succinic acid, eicosapentaenoic acid (downregulated), and oleamide were highly significant differentially expressed metabolites (Figure 5). KEGG results identified 59 noteworthy signaling pathways (Figure 6F), among which biosynthesis of alkaloids derived from histidine and purine, type I polyketide structures, butanoate metabolism, propanoate metabolism, lysine degradation, phenylalanine metabolism, biosynthesis of plant hormones, glyoxylate and dicarboxylate metabolism, pyruvate metabolism, TCA cycle, sulfur metabolism, carbon metabolism, and biosynthesis of plant secondary metabolites were the most enriched (p < 0.01), followed by biosynthesis of alkaloids derived from terpenoid and polyketide; fatty acid degradation; oxidative phosphorylation; biosynthesis of alkaloids derived from ornithine, lysine and nicotinic acid; biosynthesis of terpenoids and steroids; biosynthesis of alkaloids derived from shikimate pathway; GABA-A receptor agonists/antagonists; valine, leucine and isoleucine degradation; and degradation of aromatic compounds (p < 0.05). Significant upregulation of acetyl-CoA and succinate occurred in TCA cycle.
4 Discussion
It is well known that seagrass beds have important conservation values (Barbier et al., 2011). However, the response of Z. marina to the single and synergistic effects of seasonal warming and OA, especially at the seedling stage, is limited. In this study, we explored the mechanisms and response differences in different environmental combinations (OW, OA, AW) to Z. marina seedling growth (leaf length, leaf width, wet weight), RNAs and metabolites from multiple perspectives using phenomics, transcriptomics and metabolomics.
4.1 Seasonal temperature increase could limit the growth of Zostera marina seedlings
The results of metabolomics and transcriptomics showed that under suitable temperature, Z. marina seedlings activate the upregualtion of beta-cryptoxanthi, zeaxanthin, and abscisate upregualted by NCED and then ultimately promotes the biosynthesis of carotenoid biosynthesis to adapt to rapid seasonal temperature increases (Figure 7). Notably, this pathway was specific to such a condition (Figure 7). Previous studies have shown that several carotenoids at different depths exhibit stimulatory properties in Posidonia sinuos (Collier et al., 2008). The process of epoxidation of zeaxanthin requires oxygen and energy consumption (Janhs et al., 2009), which may lead to reduced photosynthetic efficiency and competition for energy with other metabolic processes (Silva et al., 2013). This is detrimental to Z. marina seedlings under seasonally rapid SST warming. Also, the results of the multiple-omics may correspond to the results of growth. After 14 days, there was no significant increase in wet weight in OW group. Although the leaf length and width increased, the growth in OW was not as good as that of CK (Figure 3). This also suggests that, for seedlings in group OW, although seasonal temperature increases over a short period are not fatal to individual plants, they can still limit the growth of Z. marina seedlings for a certain period. Although many studies have shown that summer is the peak growth season for Z. marina (Nguyen et al., 2021; Azcarate-Garcia et al., 2022), this is different from results of this study. This may be due to the fact that our study was the result of intense stress for a short period. Since temperature increase occurred over a longer period, Z. marina seedlings gradually adapted to the change in temperature. In addition, as Z. marina grow from seedlings to adults, their ability to adapt to temperature increases. At this point, the temperature of 19°C is no longer a stressor that inhibits the growth of Z. marina adult (Nguyen et al., 2021; Azcarate-Garcia et al., 2022; Yan et al., 2023).
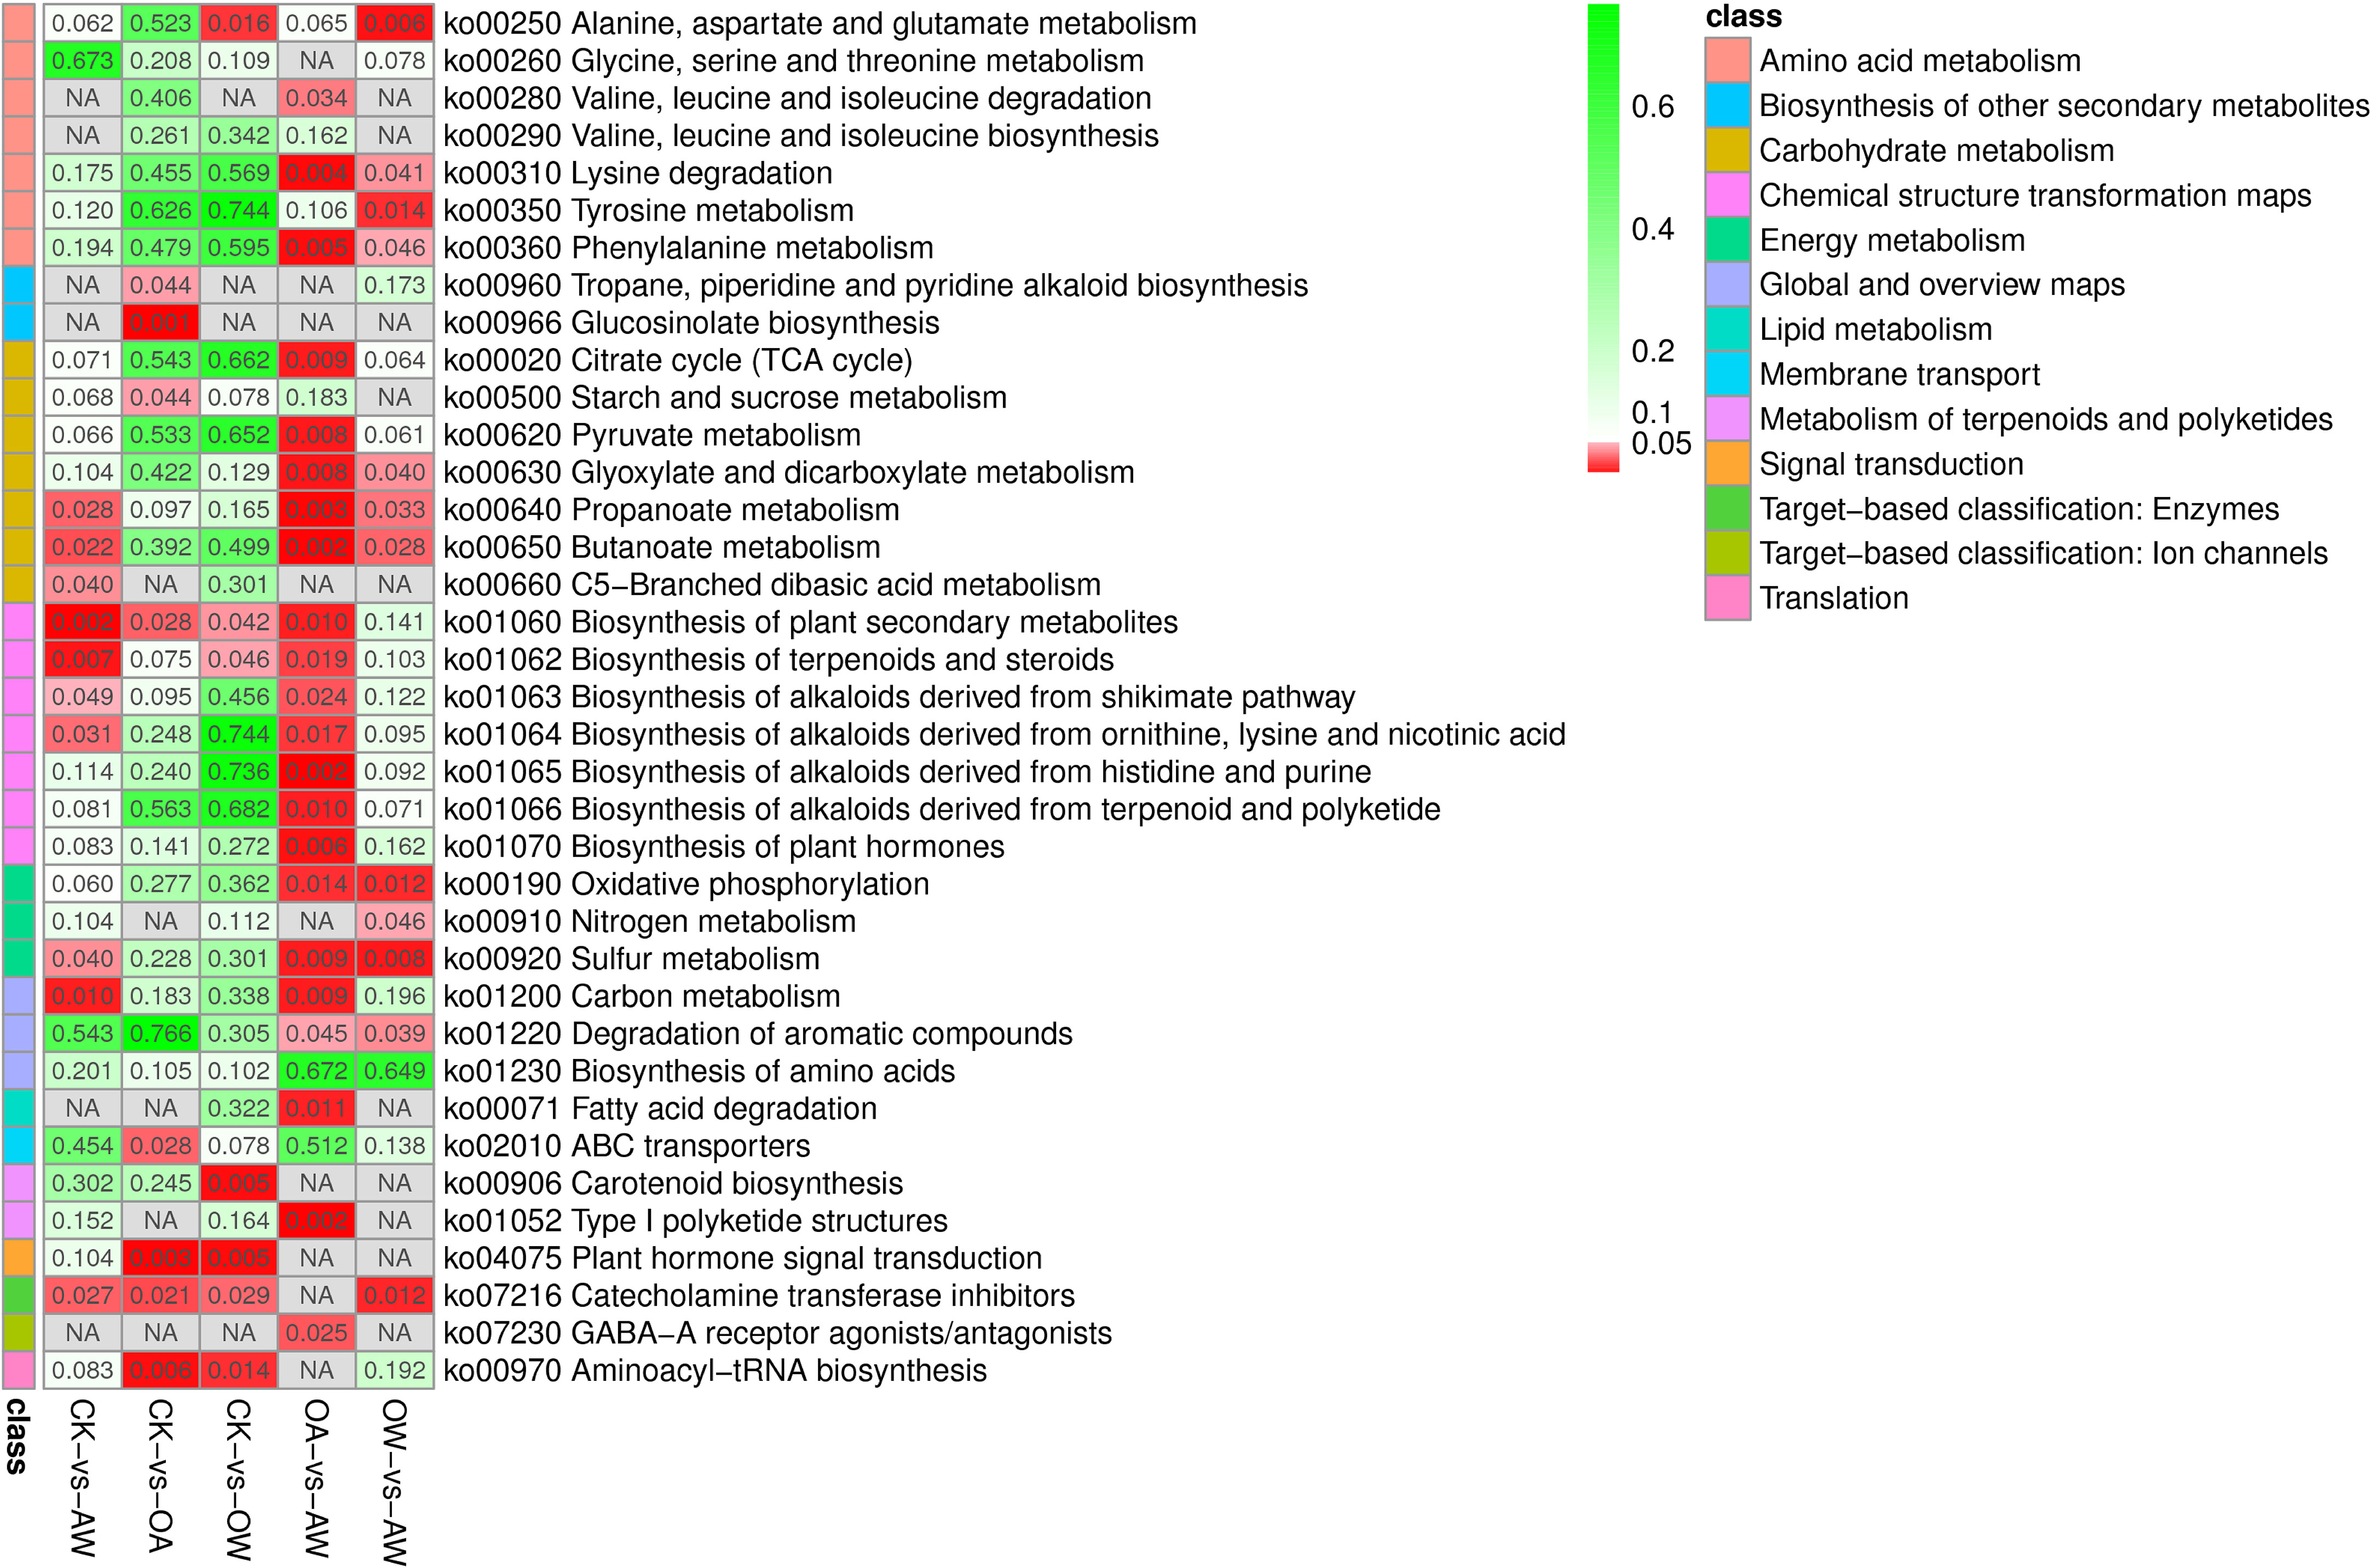
Figure 7 Kyoto encyclopedia of genes and genomes pathways based on p-value. Different classes are shown in different colors. The redder the color, the smaller the p-value. CK means the group control with 14°C, and current atmospheric pCO2 (410 μatm); OA is with seawater temperature of 14°C, and the future atmospheric pCO2 (1000 μatm); OW is with a current CO2 concentration (410 μatm) and June temperature of 19°C; AW is with an extreme CO2 concentration of 1000 μatm and early summer temperature of 19°C.
4.2 Ocean acidification may promote the growth of Zostera marina seedlings under suitable temperature
Under OA, by upregulating L-isoleucine and azacyclohexane, Z. marina seedlings promote the biosynthesis of tropane, piperidine, and pyridine alkaloids (TPPA). Meanwhile, starch and sucrose metabolism were promoted through the coordination of several genes, such as upregualtion of glgA and downregualtion of sucrose synthase, and through the regulation of some metabolites, such as the upregualtion of maltose and downregualtion of trehalose 6-phosphate (Figure 7). Finally, a different response mechanism from the other stress environments was realized (the two pathways mentioned above were not significant in the other groups) (Figure 7). During the growth of Z. marina seedlings, leaf length, leaf width and wet weight increased significantly, with the highest increase in wet weight compared to the other comparisons. This suggests that OA did not inhibit the growth of Z. marina seedlings at suitable temperatures and even played a role in promoting it (Invers et al., 2002; Jiang et al., 2010; Russell et al., 2013; Martínez-Crego et al., 2014; Campbell and Fourqurean, 2018; Guerrero-Meseguer et al., 2020). In many higher plants, low molecular weight chemicals such as alkaloids are produced, and these secondary metabolites provide immunity to the body against pathogens (Yamada and Sato, 2013). The TPPA biosynthetic pathway, which can be used to modulate alkaloids with pharmacological properties such as anti-inflammatory and antimicrobial properties, has been frequently reported in previous studies (Rischer et al., 2006; Huang et al., 2019). We hypothesized that biosynthesis of TPPA, as well as starch and sucrose metabolism, play distinct roles in metabolic capacity from the other comparisons (Figure 7), thereby increasing the resistance of Z. marina seedlings and enhancing their adaptation to OA.
In summary, under suitable temperatures, both in the face of increased temperature and OA, biosynthesis of plant secondary metabolites, plant hormone signal transduction, catecholamine transferase inhibitors, aminoacyl-tRNA biosynthesis, all of which enhanced the biosynthesis of plant secondary metabolites in Z. marina seedlings (Figure 7). Among them, plant hormone signal transduction and aminoacyl-tRNA biosynthesis were unique when Z. marina seedlings responded to temperature increases or OA (Figure 7).
4.3 Sequential or concurrent occurence of seasonal temperature increase and ocean acidification differentially affect Zostera marina seedlings
In OW-VS-AW, nitrogen metabolism showed unique significance compared with other metabolic pathways (Figure 7). That is, under high SST caused by seasonal change, Z. marina seedlings increase the ability to adapt to OA by upregulating L-glutamine to accelerate nitrogen metabolism in such a unique metabolic pathway. In OA-VS-AW, we also found significant enrichment of metabolic pathways different from the other treatments, including valine, leucine and isoleucine degradation; TCA; pyruvate metabolism; biosynthesis of alkaloids derived from histidine and purine; biosynthesis of alkaloids derived from terpenoid and polyketide; and biosynthesis of plant hormones (Figure 7). Notably, TCA cycle can link almost individual metabolic pathways (Akram, 2014; Lin et al., 2016; Zhang et al., 2017), which is an important central pathway can energize organisms and produce essential metabolites for energy production and biosynthetic reaction (Arnold et al., 2022). TCA cycle did not show a significant effect in CK-VS-OW, although they both increased the temperature (Figure 7). This suggests that the stress mechanisms of Z. marina seedlings are different even if they later encounter the same environmental stress. Under OA, Z. marina seedlings respond to seasonal temperature surges by a unique metabolic pathway that promotes TCA cycle through the upregualtion of acetyl-CoA and succinate (Arnold et al., 2022). In addition to these treatment-specific KEGG pathways, there are co-existing metabolic pathways that counteract high temperatures and OA, such as lysine degradation, phenylalanine metabolism, glyoxylate and dicarboxylate metabolism, oxidative phosphorylation, and degradation of aromatic compounds.
These results suggested Z. marina seedlings respond to environmental changes by accelerating common metabolic pathways when faced with SST increase by seasonal change and OA. However, it is worth noting that the sequencing of these two events had different effects on Z. marina seedlings. In addition, OW-VS-AW and CK-VS-OA, and OA-VS-AW and CK-VS-OW also shared the same metabolic pathways but with many differences, which means although Z. marina responds to the same oceanic events, their initial growth environment has some influence on their response mechanisms.
Metabolomics results showed that Z. marina seedlings responds to the dual stress conditions of seasonal SST increases and OA simultaneously by actively mobilizing nine KEGG pathways, such as the biosynthesis of plant secondary metabolites, biosynthesis of terpenoids and steroids, carbon metabolism, butanoate metabolism (Figure 7). Among them, propionate metabolism, butyrate metabolism, and sulfur metabolism showed enrichment under different stress conditions (CK-VS-AW, OA-VS-AW, and OW-VS-AW) (Figure 7). This suggests that, regardless of whether the increases in temperature and OA occurred sequentially or concurrently, Z. marina increased these three metabolisms in order to improve their adaptive capacity to environmental changes. In terms of growth of Z. marina seedlings, AW had the lowest growth rate compared with other treatments, and the wet weight did not increase basically. Compared with single stress, OA had the least effect on the growth, followed by OW; AW had the most inhibitory effect. This result is inconsistent with the results of Yan et al., who believed that the addition of OA would reduce the effect of temperature increase on the growth of Z. marina (Yan et al., 2023). We think the reason for this difference is that the materials selected for the two studies had different growth periods of Z. marina. We selected the period of seedling, during which the plants are more sensitive to changes in environmental factors (Gogna and Bhatla, 2020). Transcriptomics and metabolomics were combined to show that the sequence of environmental factors greatly affected the response mechanism and adaptive ability of seagrass plants.
5 Conclusion
In this study, we investigated the response of Z. marina seedlings to seasonal warming and OA using phenomics and multi-omics (transcriptomics and metabolomics). Different combination or occurance order of environmental changes prompted different responces for Z. marina seedlings. Leaf length, leaf width, and wet weight increased significantly under different stress, with overall plant growth reaching an optimum under OA, but OW and AW were lower than the control. This indicated that OA did not inhibit the growth of plant seedlings and even promoted their growth. The short-term seasonal temperature increase did not cause fatal damage but still limited their growth to some extent. Multi-omics results showed that at appropriate temperatures, Z. marina seedlings collectively promote carotenoid biosynthesis through the upregualtion of beta-cryptoxanthin, zeaxanthin, and the upregualtion of NCED, which in turn mobilizes the upregualtion of abscisate, ultimately differentiating the treatment from other treatments for resistance to the stress mechanisms against seasonal warming. Under the same conditions, the plants promoted tropane, piperidine and pyridine alkaloid biosynthesis through the upregualtion of L-isoleucine azacyclohexane. The different genes (upregualtion of glgA and downregualtion of sucrose synthase) and the differentially expressed metabolites (upregualtion of maltose and downregualtion of trehalose 6-phosphate) were used to promote starch and sucrose metabolism, and finally, the specific mechanism to respond to the stress factors was realized to enhance the adaptive capacity to OA. When Z. marina seedlings are already under some environmental stress, it responds differently to seasonal warming and OA. Under high temperatures, when Z. marina seedlings respond to OA, they accelerate nitrogen metabolism by upregulating L-glutamine. In OA, nine unique metabolic pathways, including TCA cycle and pyruvate metabolism, work together to respond to environmental changes when ambient temperatures rise again. In response to two stressors at the same time, plants mobilize biosynthesis of plant secondary metabolites, carbon metabolism, and other metabolic pathways to increase their resistance. Based on these results, we found that although plants face the same factors, their initial survival environment leads to different response mechanisms. In addition to the specific pathways described above for each treatment, there are common pathways that stimulate plant metabolism and sulfur metabolism in response to seasonal temperature rise or/and OA, such as propionate metabolism, butyrate metabolism, and sulfur metabolism.
Data availability statement
The transcriptome data can be found in Bioproject accession number: PRJNA1031782. Further inquiries can be directed to the corresponding authors.
Author contributions
ZW: Formal Analysis, Methodology, Writing – original draft, Writing – review & editing, Data curation, Visualization. YP: Formal Analysis, Methodology, Writing – original draft, Data curation. WY: Conceptualization, Supervision, Writing – review & editing, Writing – original draft. LL: Conceptualization, Methodology, Writing – original draft. BZ: Conceptualization, Funding acquisition, Supervision, Writing – review & editing.
Funding
The author(s) declare financial support was received for the research, authorship, and/or publication of this article. The study was supported by the National Natural Science Foundation of China (grant number: 42076147). The funder is the corresponding author BZ.
Acknowledgments
We thank editors and reviewers for very helpful comments on the manuscript. Thanks for the language-editing service provided by the Charlesworth Group.
Conflict of interest
The authors declare that the research was conducted in the absence of any commercial or financial relationships that could be construed as a potential conflict of interest.
Publisher’s note
All claims expressed in this article are solely those of the authors and do not necessarily represent those of their affiliated organizations, or those of the publisher, the editors and the reviewers. Any product that may be evaluated in this article, or claim that may be made by its manufacturer, is not guaranteed or endorsed by the publisher.
Supplementary material
The Supplementary Material for this article can be found online at: https://www.frontiersin.org/articles/10.3389/fmars.2023.1304132/full#supplementary-material
References
Akram M. (2014). Citric acid cycle and role of its intermediates in metabolism. Cell Biochem. Biophys. 68 (3), 475–478. doi: 10.1007/s12013-013-9750-1
Arnold P. K., Jackson B. T., Paras K. I., Brunner J. S., Hart M. L., Newsom O. J., et al. (2022). A non-canonical tricarboxylic acid cycle underlies cellular identity. Nature 603 (7901), 477–481. doi: 10.1038/s41586-022-04475-w
Azcarate-Garcia T., Beca-Carretero P., Cara C. L., Villamayor B., Cosnett E., Bermejo R., et al. (2022). Seasonal plant development and meadow structure of Irish and southern Spanish seagrass populations. Aquat. Botany 183, 4. doi: 10.1016/j.aquabot.2022.103569
Baden S. P., Pihl L. (1984). Abundance, biomass and production of mobile epibenthic fauna in Zostera marina (L.) meadows, western Sweden. Ophelia 23 (1), 65–90. doi: 10.1080/00785236.1984.10426605
Barbier E. B., Hacker S. D., Kennedy C., Koch E. W., Stier A. C., Silliman B. R. (2011). The value of estuarine and coastal ecosystem services. Ecol. Monographs. 81 (2), 169–193. doi: 10.1890/10-1510.1
Boström C., Baden S., Krause-Jensen D. (2003). “The seagrasses of Scandinavia and the Baltic sea,” in World Atlas of Seagrasses: Present Status and Future Conservation. Eds. Green E., Short F. T. (California: California Press), 27–37.
Brandenburg K. M., Velthuis M., Waal D. B. V. D. (2019). Meta-analysis reveals enhanced growth of marine harmful algae from temperate regions with warming and elevated CO2 levels. Glob Chang Biol. 25, 2607–2618. doi: 10.1111/gcb.14678
Burke M. K., Dennison W. C., Morre K. A. (1996). Non-structural carbohydrate reserves of eelgrass Zostera marina. Mar. Ecol. Prog. Series. 137, 195–201. doi: 10.3354/meps137195
Bylesjö M., Rantalainen M., Cloarec O., Nicholson J. K., Elaine Holmes E., Johan Trygg J. (2006). OPLS discriminant analysis: combining the strengths of PLS-DA and SIMCA classification. J. Chemometrics: A J. Chemometrics Soc. 20 (8-10), 341–351. doi: 10.1002/cem.1006
Caldeira K., Wickett M. K. (2003). Anthropogenic carbon and ocean pH. Nature 425, 365. doi: 10.1038/425365a
Campbell J. E., Fourqurean J. W. (2018). Does nutrient availability regulate seagrass response to elevated CO2? Ecosyst. Springer US. 21, 1269–1282. doi: 10.1007/s10021-017-0212-2
Celia D. S., Fernando T. (2023). Annual variation in leaf canopy across a seagrass distribution range is modulated by local environmental variation. Mar. Biol. Res. 19 (2-3), 132–140. doi: 10.1080/17451000.2023.2193898
Coll M., Schmidt A., Romanuk T., Lotze H. K. (2011). Food-Web structure of seagrass communities across different spatial scales and human impacts. PLoS One 6 (7), e22591–e22513. doi: 10.1371/journal.pone.0022591
Collier C. J., Lavery P. S., Ralph P. J., Masini R. J. (2008). Physiological characteristics of the seagrass Posidonia sinuosa along a depth-related gradient of light availability. Mar. Ecol. Prog. Ser. 353, 65–79. doi: 10.3354/meps07171
Duarte C. M., Middelburg J. J., Caraco N. (2005). Major role of marine vegetation on the oceanic carbon cycle. Biogeosciences (online). 2 (1), 1–8. doi: 10.5194/bg-2-1-2005
Dunn W. B., Broadhurst D., Begley P., Zelena E., Francis-McIntyre S., Anderson N., et al. (2011). Human Serum Metabolome (HUSERMET) Consortium. Procedures for large-scale metabolic profiling of serum and plasma using gas chromatography and liquid chromatography coupled to mass spectrometry. Nat. Protoc. 6 (7), 1060–1083. doi: 10.1038/nprot.2011.335
Espino F., Tuya F., Brito A., Haroun R. J. (2011). Ichthyofauna associated with Cymodocea nodosa meadows in the Canarian Archipelago (central eastern Atlantic): Community structure and nursery role. Cienc. Marinas. 37 (2), 157–174. doi: 10.7773/cm.v37i2.1720
Fourqurean J. W., Duarte C. M., Kennedy H., Marbà N., Holmer M., Mateo M. A., et al. (2012). Seagrass ecosystems as a globally significant carbon stock. Nat. Geoscience. 5 (7), 505–509. doi: 10.1038/ngeo1477
Gao K., Beardall J., Häder D. P., Hall-Spencer J. M., Gao G., Hutchins D. A. (2019). Effects of ocean acidification on marine photosynthetic organisms under the concurrent influences of warming, UV radiation, and deoxygenation. Front. Mar. Sci. 6, 322. doi: 10.3389/fmars.2019.00322
Gattuso J. P., Magnan A., Billé R., Cheung W., Howes E., Joos F., et al. (2015). Contrasting futures for ocean and society from different anthropogenic CO2 emissions scenarios. Science 349, aac4722. doi: 10.1126/science.aac4722
Gogna M., Bhatla S. C. (2020). Salt-tolerant and -sensitive seedlings exhibit noteworthy differences in lipolytic events in response to salt stress. Plant Signal Behav. 15 (4), 1737451. doi: 10.1080/15592324.2020.1737451
Granata T. C., Serra T., Colomer J., Casamitjana X., Duarte C. M., Gacia E. (2001). Flow and particle distributions in a nearshore seagrass meadow before and after a storm. Mar. Ecol. Prog. Series. 218, 95–106. doi: 10.3354/meps218095
Guerrero-Meseguer L., Cox T. E., Sanz-Lázaro C., Schmid S., Enzor L. A., Major K., et al. (2020). Does ocean acidification benefit seagrasses in a mesohaline environment? A mesocosm experiment in the Northern Gulf of Mexico. Estuaries Coasts. 43, 1377–1393. doi: 10.1007/s12237-020-00720-5
Hemminga M., Harrison P. G., Lent F. V. (1991). The balance of nutrient losses and gains in seagrass meadows. Mar. Ecol. Prog. Series. 71, 85–96. doi: 10.3354/meps071085
Huang J. P., Fang C., Ma X., Wang L., Yang J., Luo J., et al. (2019). Tropane alkaloids biosynthesis involves an unusual type III polyketide synthase and non-enzymatic condensation. Nat. Commun. 10, 4036. doi: 10.1038/s41467-019-11987-z
Invers O., Pérez M., Romero J. (2002). Seasonal nitrogen speciation in temperate seagrass Posidonia oceanica (L.) Delile. J. Exp. Mar. Biol. Ecol. 273, 219–240. doi: 10.1016/S0022-0981(02)00167-3
IPCC. (2013). “Summary for policymakers,” in Climate Change. 2013: The Physical Science Basis. Contribution of Working Group I to the Fifth Assessment Report of the Intergovernmental Panel on Climate Change. Eds. Stocker T. F., Qin D., Plattner G.-K., Tignor M., Allen S. K., Boschung J., Nauels A., Xia Y., Bex V., Midgley P. M. (Cambridge, UK and New York, NY: Cambridge University Press), 1–32.
Janhs P., Latowski D., Strzalka K. (2009). Mechanism and regulation of the violaxanthin cycle: The role of antenna proteins and membrane lipids. Biochim. Biophys. Acta 1787, 3–14. doi: 10.1016/j.bbabio.2008.09.013
Jiang Z. J., Huang X. P., Zhang J. P. (2010). Effects of CO2 enrichment on photosynthesis, growth, and biochemical composition of seagrass Thalassia hemprichii (Ehrenb.) Aschers. J. Integr. Plant Biol. 52 (10), 904–913. doi: 10.1111/j.1744-7909.2010.00991.x
Kanehisa M., Goto S. (2000). KEGG: kyoto encyclopedia of genes and genomes. Nucleic Acids Res. 28 (1), 27–30. doi: 10.1093/nar/28.1.27
Koch E. W., Ackerman J., Verduin J., Keulen M. v. (2007). “Fluid dynamics in seagrass ecology-from molecules to ecosystems,” in Seagrasses: Biology, Ecology and Conservation. (Dordecht: Springer), 193–225. doi: 10.1007/978-1-4020-2983-7_8
Lee S. Y., Oh J. H., Choi C. I., Suh Y., Mukai H. (2005). Leaf growth and population dynamics of intertidal Zostera japonica on the western coast of Korea. Aquat. Botany. 83, 263–280. doi: 10.1016/j.aquabot.2005.07.004
Lemos R. T., Pires H. E. (2004). The upwelling regime off the west Portuguese coast 1941-2000. Int. J. Climatology. 24, 511–524. doi: 10.1002/joc.1009
Li B., Dewey C. N. (2011). RSEM: accurate transcript quantification from RNA-Seq data with or without a reference genome. BMC Bioinformatics 12, 323. doi: 10.1186/1471-2105-12-323
Lin Y. X., Lin Y. F., Chen Y. H., Wang H., Shi J., Lin H. T. (2016). Hydrogen peroxide induced changes in energy status and respiration metabolism of harvested longan fruit in relation to pericarp browning. J. Agric. Food Chem. 64 (22), 4627–4632. doi: 10.1021/acs.jafc.6b01430
Love M. I., Huber W., Anders S. (2014). Moderated estimation of fold change and dispersion for RNA-seq data with DESeq2. Genome Biol. 15 (12), 550. doi: 10.1186/s13059-014-0550-8
Marbà N., Cebrián J., Enríquez S., Duarte C. M. (1996). Growth patterns of western Mediterranean seagrasses: speciesspecific responses to seasonal forcing. Mar. Ecol. Prog. Series. 133 (1-3), 203–215. doi: 10.3354/meps133203
Martínez-Crego B., Olivé I., Santos R. (2014). CO2 and nutrient driven changes across multiple levels of organization in Zostera noltii ecosystems. Biogeosciences 11, 7237–7249. doi: 10.5194/bg-11-7237-2014
Mcleod E., Chmura G. L., Bouillon S., Salm R., Björk M., Duarte C. M., et al. (2011). A blueprint for blue carbon: Toward an improved understanding of the role of vegetated coastal habitats in sequestering CO2. Front. Ecol. Environ. 9 (10), 552–560. doi: 10.1890/110004
Nagelkerken I., Munday P. (2015). Animal behaviour shapes the ecological effects of ocean acidification and warming: moving from individual to community-level responses. Glob Chang Biol. 22, 974–989. doi: 10.1111/gcb.13167
Nguyen H. M., Ralph P. J., Marín-Guirao L., Pernice M., Procaccini G. (2021). Seagrasses in an era of ocean warming: a review. Biol. Rev. Camb Philos. Soc 96 (5), 2009–2030. doi: 10.1111/brv.12736
Olsen J., Rouzé P., Verhelst B., Lin Y. C., Bayer T., Collen J., et al. (2016). The genome of the seagrass Zostera marina reveals angiosperm adaptation to the sea. Nature 530, 331–335. doi: 10.1038/nature16548
Orth R. J., Carruthers T. J. B., Dennison W. C., Duarte C. M., Fourqurean J. W., Heck K. L., et al. (2006a). A global crisis for seagrass ecosystems. BioScience 56 (12), 987–996. doi: 10.1641/0006-3568(2006)56[987:AGCFSE]2.0.CO;2
Orth R. J., Harwell M. C., Inglis G. J. (2006b). “Chapter 5 ecology of seagrass seeds and seagrass dispersal processes,” in Seagrasses: Biology, Ecology and Conservation (Dordrecht: Springer), 111–133.
Orth R. J. W., Moore K. A. (1986). Seasonal and year-to-year variation in the growth of Zostera marina L. (eelgrass) in the lower Chesapeake Bay. Aquat. Botany. 24, 335–341. doi: 10.1016/0304-3770(86)90100-2
Parmesan C., Yohe G. (2003). A globally coherent fingerprint of climate change impacts across natural systems. Nature 421, 37–42. doi: 10.1038/nature01286
Pereda-Briones L., Tomas F., Terrados J. (2018). Field transplantation of seagrass (Posidonia oceanica) seedlings: Effects of invasive algae and nutrients. Mar. pollut. Bull. 134, 160–165. doi: 10.1016/j.marpolbul.2017.09.034
Rao G., Sui J., Zhang J. (2016). Metabolomics reveals significant variations in metabolites and correlations regarding the maturation of walnuts (Juglans regia L. ). Biol. Open 5 (6), 829–836. doi: 10.1242/bio.017863
Richard W. R., Viva F. B., NOAA CDR Program. (2008). NOAA Optimum Interpolation 1/4 Degree Daily Sea Surface Temperature (OISST) Analysis, Version 2. [indicate subset used]. (NOAA National Centers for Environmental Information). doi: 10.7289/V5SQ8XB5
Rischer H., Orešič M., Seppänen-Laakso T., Katajamaa M., Lammertyn F., Ardiles-Diaz W., et al. (2006). Gene-to-metabolite networks for terpenoid indole alkaloid biosynthesis in Catharanthus roseus cells. Proc. Natl. Acad. Sci. 103, 5614–5619. doi: 10.1073/pnas.0601027103
Robinson M. D., McCarthy D. J., Smyth G. K. (2010). edgeR: a Bioconductor package for differential expression analysis of digital gene expression data. Bioinformatics 26 (1), 139–140. doi: 10.1093/bioinformatics/btp616
Russell B. D., Connell S. D., Uthicke S., Muehllehner N., Fabricius K. E., Hall-Spencer J. M. (2013). Future seagrass beds: Can increased productivity lead to increased carbon storage? Mar. pollut. Bulletin. 73, 463–469. doi: 10.1016/j.marpolbul.2013.01.031
Saccenti E., Hoefsloot H. C. J., Smilde A. K., Westerhuis J. A., Hendriks M. W. B. (2014). Reflections on univariate and multivariate analysis of metabolomics data. Metabolomics 10, 361–374. doi: 10.1007/s11306-013-0598-6
Sand-Jensen K. (1975). Biomass, net production and growth dynamics in an eelgrass (Zostera marina L.) population in vellerup vig, Denmark. Ophelia 14 (1-2), 185–201. doi: 10.1080/00785236.1975.10422501
Seddon S. (2004). Going with the flow: facilitating seagrass rehabilitation. Ecol. Manage. Restor. 5, 167–176. doi: 10.1111/j.1442-8903.2004.00205.x
Silva J., Barrote I., Costa M. M., Albano S., Santos R. (2013). Physiological responses of Zostera marina and Cymodocea nodosa to light-limitation stress. PLoS One 8 (11), e81058. doi: 10.1371/journal.pone.0081058
Tuya F., Cacabelos E., Duarte P., Jacinto D., Castro J. J., Silva T., et al. (2012). Patterns of landscape and assemblage structure along a latitudinal gradient in ocean climate. Mar. Ecol. Prog. Series. 466, 9–19. doi: 10.3354/meps09941
Van Colen C., Ong E. Z., Briffa M., Wethey D. S., Abatih E., Moens T., et al. (2020). Clam feeding plasticity reduces herbivore vulnerability to ocean warming and acidification. Nat. Clim Change 10, 162–166. doi: 10.1038/s41558-019-0679-2
Wang P., Laws E., Wang Y., Chen J., Song X., Huang R., et al. (2022). Elevated pCO2 changes community structure and function by affecting phytoplankton group-specific mortality. Mar. pollut. Bull. 175, 113362. doi: 10.1016/j.marpolbul.2022.113362
Want E. J., Masson P., Michopoulos F., Wilson I. D., Theodoridis G., Plumb R. S., et al. (2013). Global metabolic profiling of animal and human tissues via UPLC-MS. Nat. Protoc. 8 (1), 17–32. doi: 10.1038/nprot.2012.135
Watanabe M., Nakaoka M., Mukai H. (2005). Seasonal variation in vegetative growth and production of the endemic Japanese seagrass Zostera asiatica: A comparison with sympatric Zostera marina. Botanica Marina. 48 (4), 266–273. doi: 10.1515/BOT.2005.036
Watson S. A., Allan B. J. M., Mcqueen D. E., Nicol S., Parsons D. M., Pether S. M. J., et al. (2018). Ocean warming has a greater effect than acidification on the early life history development and swimming performance of a large circumglobal pelagic fish. Glob Chang Biol. 24, 4368–4385. doi: 10.1111/gcb.14290
Waycott M., Duarte C. M., Carruthers T. J. B., Orth R. J. (2009). Accelerating loss of seagrasses across the globe threatens coastal ecosystems. Proc. Natl. Acad. Sci. U.S.A. 106, 12377–12381. doi: 10.1073/pnas.0905620106
Wei T., Simko V., Levy M., Xie Y., Jin Y., Zemla J. (2017). Package ‘corrplot’. Statistician 56, 316–324.
Xu M., Zhou Y., Song X., Zhang Y., Zhang H. (2019). The distribution of large floating seagrass (Zostera marina) aggregations in northern temperate zones of Bohai Bay in the Bohai Sea, China. PLoS One 14 (3), e0201574. doi: 10.1371/journal.pone.0201574
Yamada Y., Sato F. (2013). Transcription factors in alkaloid biosynthesis. Int. Rev. Cell Mol. Biol. 305, 339–382. doi: 10.1016/B978-0-12-407695-2.00008-1
Yan W., Wang Z., Pei Y., Zhou B. (2023). How does ocean acidification affect Zostera marina during a marine heatwave? Mar. Pollut. Bull. 194 (Pt B), 115394.
Yoon D., Kim Y. J., Lee W. K., Choi B. R., Oh S. M., Lee Y. S., et al. (2020). Metabolic changes in serum metabolome of beagle dogs fed black ginseng. Metabolites 10 (12), 517. doi: 10.3390/metabo10120517
Zhang S., Lin H., Lin Y., Lin Y., Hung Y. C., Chen Y., et al. (2017). Energy status regulates disease development and respiratory metabolism of Lasiodiplodia theobromae (Pat.) Griff. & Maubl.-infected longan fruit. Food Chem. 231, 238–246. doi: 10.1016/j.foodchem.2017.03.132
Keywords: seagrass beds, Zostera marina seedling, ocean acidification, seasonal temperature variation, growth, restoration
Citation: Wang Z, Pei Y, Yan W, Lu L and Zhou B (2023) Seasonal temperature variation in Zostera marina seedlings under ocean acidification. Front. Mar. Sci. 10:1304132. doi: 10.3389/fmars.2023.1304132
Received: 29 September 2023; Accepted: 27 October 2023;
Published: 13 November 2023.
Edited by:
Shaochun Xu, Chinese Academy of Sciences (CAS), ChinaReviewed by:
Yi Zhou, Chinese Academy of Sciences (CAS), ChinaXiaoping Huang, Chinese Academy of Sciences (CAS), China
Copyright © 2023 Wang, Pei, Yan, Lu and Zhou. This is an open-access article distributed under the terms of the Creative Commons Attribution License (CC BY). The use, distribution or reproduction in other forums is permitted, provided the original author(s) and the copyright owner(s) are credited and that the original publication in this journal is cited, in accordance with accepted academic practice. No use, distribution or reproduction is permitted which does not comply with these terms.
*Correspondence: Bin Zhou, emhvdWJpbkBvdWMuZWR1LmNu; Wenjie Yan, eWFud2VuamllQG91Yy5lZHUuY24=
†These authors have contributed equally to this work