Abstract
Knowledge on spatial distribution, provenance and delivery mode of surface sediment aids in interpretation of nearby sediment records for paleoenvironmental reconstruction. Such knowledge, however, remains largely unknown for the modern Ross Sea, Antarctica: a key region for understanding the dynamical behavior of Antarctic Ice Sheet over geological past. In this study, we address this gap by analyzing the grain-size distribution, coarse fraction (>250 μm) lithology, and clay mineralogy of a set of surface sediment samples covering the whole Ross Sea continental shelf. Our data reveals that the sediments were mostly delivered by icebergs and bottom currents. Iceberg delivery was significantly controlled by factors such as water depth, proximity to the iceberg sources, and invasion of the Modified Circumpolar Deep Water. Bottom current activity was stronger in the Western Ross Sea (WRS) than in the Eastern Ross Sea (ERS), controlled by the formation and transport of Dense Shelf Water. Three major sorts of coarse fraction were identified, including the quartz-rich Iceberg Rafted Detritus (IRD) originating from West Antarctic glaciers and primarily distributed in the ERS, the mafic rocks-rich IRD from the Ferrar Group as well as the McMurdo Volcanic Group and mainly found in the WRS, and deformed silt traced back to the grounding zone of the David Glacier-Dragalski Ice Tongue system. The distribution of clay minerals is dominated by a distinct binary mixing pattern. Smectite and kaolinite are mainly present in the ERS, derived from beneath the West Antarctic Ice Sheet. Higher illite and chlorite contents were found offshore of the Southern Victoria Land, derived from the East Antarctic craton. Overall, these results demonstrate that the glaciers draining into Ross Sea from both the East and West Antarctic Ice Sheets are highly dynamical in the context of modern climate conditions, with implications for potential contribution to future sea level rise.
1 Introduction
Antarctica hosts the hugest ice sheet on earth, representing a sea level equivalent of approximately 60 m (Fretwell et al., 2013). The potential for partial melting of the Antarctic Ice Sheet to contribute significantly to global sea level rise has garnered increasing attention in the context of ongoing global climate warming (Blackburn et al., 2020; Ge et al., 2022). Ross Sea is one of the largest marginal seas around Antarctica. It serves as a major drainage basin for glaciers derived from both the East Antarctic Ice Sheet (EAIS) and the West Antarctic Ice Sheet (WAIS) (Naish et al., 2001; Naish et al., 2009). Sediment records from the continental shelf of the Ross Sea hold invaluable clues about the dynamical behavior of the glaciers derived from these ice sheets (Anderson et al., 1984; Ehrmann, 1998; Naish et al., 2001; Anderson et al., 2018; Marschalek et al., 2021), which are crucial for deepening our understanding of the global climate system as well as for projections on future climate and sea level change (DeConto and Pollard, 2016; Edwards et al., 2019).
Understanding sediment provenance and delivery modes is paramount in deciphering the signals of paleo-environmental changes embedded in sediment sequences (Junttila et al., 2005; Cowan et al., 2008; Wilson et al., 2018; Wu et al., 2021). Analysis of the spatial distribution of sediments offers valuable insights for acquiring such knowledge (Borchers et al., 2011; Shao et al., 2022). In the region of the Ross Sea, these analyses have primarily focused on sediments from the last glacial period (Licht et al., 1999; Licht et al., 2005; Farmer et al., 2006; Halberstadt et al., 2018). For instance, Licht et al. (1999) examined the spatial distribution of tills in the Western Ross Sea (WRS) deposited during the last glacial period. Their findings suggest that even during the Last Glacial Maximum (LGM), the Ross Ice Shelf (RIS) did not extend to the shelf break in the WRS. In another study, Licht et al. (2005) investigated tills deposited across the entire continental shelf of the Ross Sea during the last glacial period and observed that tills in the Eastern Ross Sea (ERS) were rich in quartz and exhibited a finer mean grain-size. In contrast, tills from the WRS contained abundant mafic igneous rock detritus and displayed a coarser mean grain-size. Farmer et al. (2006) conducted further geochemical and isotopic analyses of these tills and identified similarities between tills from the ERS and terrestrial tills from West Antarctica, while tills from the WRS exhibited characteristics akin to rocks from the McMurdo Volcanic Group. Collectively, these findings provide evidence of significant expansion of both the West Antarctic Ice Sheet (WAIS) and East Antarctic Ice Sheet (EAIS) during the last glacial period (Licht et al., 2005; Farmer et al., 2006).
The first preliminary description of the shelf surface sediments in Ross Sea was provided by Anderson et al. (1984). Subsequent studies on such sediments focus primarily on distributions of their biogenic components, including the composition of carbon isotopes (14C and 13C) (Andrews et al., 1999), biological silica/carbonates (Burckle, 2001; Hauck et al., 2012), and diatom assemblages (Cunningham and Leventer, 1998). Distributions of the detrital fractions of these sediments, however, remains largely uninvestigated (Anderson et al., 1984), despite the existence of a few studies regarding the geochemical and isotopic compositions of the surface sediments from Ross Sea involving limited sampling sites (Shao et al., 2022; Wang et al., 2022).
Here, we provide a novel dataset comprising grain-size distribution, coarse fraction (>250 um) lithology, and clay mineralogy measured on a set of surface sediment samples obtained from the Ross Sea continental shelf. This study aims to determine the provenances, distribution patterns, and delivery modes of these sediments which may aid in interpretation of sedimentary records collected from this area.
2 Environmental setting and geological background
Ross Sea is the second largest marginal sea around Antarctica, facing the Pacific Ocean. It is bounded by Marie Byrd Land on the east and the Transantarctic Mountains on the west and south (Figure 1A), serving as outlets of many glaciers derived from both the EAIS and WAIS (Farmer et al., 2006; Rignot et al., 2008).
Figure 1

(A) Location map displaying the sampling locations and relevant features of the Ross Sea embayment for this study. The abbreviations used are as follows: WAIS (West Antarctic Ice Sheet), EAIS (East Antarctic Ice Sheet), RIS (Ross Ice Shelf), R.I (Ross Island), M.S (McMurdo Sound), RSP (Ross Sea Polynya), MSP (McMurdo Sound Polynya), TNBP (Terra Nova Bay Polynya), David G. (David Glacier), Nimrod G. (Nimrod Glacier), Beardmore G. (Beardmore Glacier), Echelmeyer I. S. (Echelmeyer Ice Stream), MacAyeal I. S. (MacAyeal Ice Stream), Bindschalder I. S. (Bindschalder Ice Stream), Kamb I. S. (Kamb Ice Stream), Whillam I. S. (Whillam Ice Stream), Mercer I. S. (Mercer Ice Stream), DT (Drygalski Trough), JB (Joides Basin), JT (Joides Trough), GCB (Glomar Challenger Basin), PT (Pennell Trough), WD (Whales Deep), LAB (Little American Basin), ASC (Antarctic Slope Current), CoC (Antarctic Coastal Current), RG (Ross Gyre), ACC (Antarctic Circumpolar Current), MCDW (Modified Circumpolar Deep Water), SSI (Summer Sea Ice limit). It should be noted that the Ross Sea is divided into three areas: ERS (eastern Ross Sea), WRS (western Ross Sea), and CRS (central Ross Sea). CRS specifically refers to the area around the PT. ERS and WRS correspond to the eastern and western regions of the PT, respectively, in this study. The oceanic current system is based on Smith et al. (2014). The position of the SSI is determined from modern observations (https://earthdata.nasa.gov). The glacier distributions around the Ross Sea embayment are according to Drewry (1983). The map was generated using Ocean Data View software (R. Schlitzer, 2014; https://odv.awi.de). The inset show the location of the study area in Antarctica. The black lines indicate catchment divides. The blue lines represent glacier flow directions. (B) Generalized geologic map illustrating the major bedrock groups in the Ross Sea Embayment, including the Transantarctic Mountains, Victoria Land, and Western Marie Byrd Land. The approximate locations of glaciers and ice streams mentioned in the text are shown as dashed black lines. WA represents West Antarctica, EA represents East Antarctica, and RISP represents core sites of the Ross Ice Shelf Drilling Project. The figure is modified after Licht et al. (2005).
Currently, the Ross Sea continental shelf south of 78°S is covered by the RIS. It stands as the largest ice shelf on earth with an average ice thickness of ~600 m and an area of 5×10⁵ km2 (Figure 1A) (McKay et al., 2018). The Ross Sea floor north of 78°S deepens landward (southward) with water depth ranging from 200-1000 m and an average of ~500 m. It is featured by several SW/NE-oriented trough-ridge systems that traverse the continental shelf and deep-water basins in front of the RIS.
In the Ross Sea region, the oceanic circulation system comprises four distinct branches (Figure 1A; Smith et al., 2014). The westward-propagating Antarctic Coastal/Slope Currents, under the influence of easterly winds, transport frigid water masses from the eastern sector into the embayment. Adjacent to these currents lies the cyclonic Ross Gyre, a result of shear stress induced by the Easterly and Westerly Winds. Further offshore, the Antarctic Circumpolar Current flows eastward driven by the Westerly Winds.
Sea ice predominates over the entire Ross Sea region during the austral winter, gradually retreating in the austral spring (https://www.earthdata.nasa.gov). Nevertheless, only the Western Ross Shelf (WRS) experiences complete sea ice melt in the austral summer. Katabatic winds prevail along the southwestern coast of the Ross Sea throughout the winter season, propelling newly formed sea ice towards the north (Mezgec et al., 2017). Consequently, a succession of polynya, encompassing the McMurdo Sound Polynya, Ross Polynya, and Terra Nova Bay Polynya, emerge along the southwestern coast and endure until thawing of the sea ice during the austral spring (Mezgec et al., 2017).
The lithologies of bedrocks surrounding the Ross Sea have been inferred based on scattered outcrops (Figure 1B). The study area encompasses a diverse range of rock units, representing seven primary rock groups spanning from the Precambrian to the Quaternary, as illustrated in Figure 1B. The Nimrod Group, originating from the Archean and Early Proterozoic era, constitutes a heterogeneous metamorphic complex comprising both mafic and felsic rock types (Goodge and Fanning, 1999). Overlying the Nimrod Group is the Beardmore Group, predominantly consisting of metasedimentary rocks of upper Precambrian ages (Goodge et al., 2002). The Byrd Group is situated above the Beardmore Group, composed of sedimentary and metasedimentary rocks of Cambrian ages (Myrow et al., 2002). The Beacon Supergroup overlies the Byrd Group and is primarily comprised of sedimentary rocks with ages from the Devonian to the Middle Triassic (Barrett, 1991). The Ferrar Group lies above the Beacon Supergroup, primarily composed of mafic igneous rocks. Lastly, the McMurdo Volcanic Group is situated above the Ferrar Group and is associated with a diverse array of Cenozoic extrusive rock types, including rhyolites and basalts (Kyle, 1990).
3 Materials
This study utilize 42 surface sediment samples obtained from the Ross Sea continental shelf in 2014-2019 on R/V Xuelong during the 31st-35th Chinese Antarctic Research Expedition. Various sampling techniques, including box corers, multi-corers, and gravity corers were employed to collect these sediments. The samples were the top 0-2 cm from the collected sediments in most cases, with a few exceptions where depths reached 0-5 cm. The sampling locations cover the entire continental shelf, with a focus on the basin and trough area and water depths ranging from 46 to 1174 m (Figure 1; Table 1). The sediment color changes between greenish grey and greyish black, and their composition varies from clayey silt to gravel sands. Biogenic silica is common in most of the sediments in the form of diatoms, sponge spicules, and radiolarians, while carbonates were detected in only a few samples and comprise <10 wt.%.
Table 1
| Sector | Sample | longitude | latitude | Sampling device | Water Depth (m) |
|---|---|---|---|---|---|
| WRS | ANT31R18 | 163°45.900′E | 74°54.780′S | BC | 46.0 |
| ANT31R14 | 164°48′17″E | 74°56′06″S | BC | 901.1 | |
| ANT31R08 | 165°0′43″E | 75°0′11″S | BC | 691.8 | |
| ANT33I5 | 165°2′53″E | 75°5′13″S | BC | 1174.0 | |
| ANT31R02 | 165°7′59″E | 74°47′6″S | BC | 719.2 | |
| ANT31JB01 | 165°34′10″E | 77°35′18″S | BC | 774.0 | |
| ANT33A1-20 | 165°53′6″E | 77°39′58″S | BC | 590.1 | |
| ANT31R09 | 165°59′53″E | 75°0′12″S | BC | 1032.1 | |
| ANT31R20 | 166°50′52″E | 75°30′16″S | MC | 425.6 | |
| ANT31R16 | 166°59′50″E | 75°15′15″S | MC | 486.7 | |
| ANT31R10 | 167°00′07″E | 74°59′68″S | BC | 636.0 | |
| ANT33A1-18 | 167°43′26″E | 76°25′16″S | BC | 742.8 | |
| ANT31R05 | 167°46′39″E | 74°46′36″S | BC | 585.6 | |
| ANT31R11 | 167°48′20″E | 74°56′57″S | BC | 449.4 | |
| ANT31R17 | 167°54′33″E | 75°13′49″S | BC | 374.4 | |
| ANT35R1-03 | 168°21′28″E | 74°59′43″S | BC | 348.6 | |
| ANT32RB15C | 168°47′19″E | 77°12′7″S | GC | 939.8 | |
| ANT33A1-17 | 169°23′46″E | 76°38′10″S | BC | 604.5 | |
| ANT33A2-02 | 170°7′5″E | 74°12′22″S | BC | 654.0 | |
| ANT31R19 | 170°23′40″E | 72°15′16″S | BC | 516.3 | |
| ANT33A2-03 | 170°58′44″E | 73°42′4″S | BC | 588.0 | |
| ANT31JB04 | 172°22′21″E | 75°18′04″S | BC | 510.8 | |
| ANT33A2-05 | 172°26′13″E | 72°36′18″S | BC | 546.2 | |
| ANT31JB05 | 173°11′17″E | 74°45′19″S | BC | 496.8 | |
| ANT31JB06 | 173°54′24″E | 74°28′22″S | GC | 567.5 | |
| ANT32RB11B | 174°35′59″E | 77°16′10″S | BC | 494.9 | |
| ANT33A1-15 | 174°57′50″E | 77°7′37″S | BC | 399.9 | |
| ANT32RB16B | 175°07′18″E | 74°30′49″S | BC | 478.0 | |
| CRS | ANT32RB08B | 179°51′09″E | 77°18′32″S | BC | 669.7 |
| ANT32RB07B | 178°54′01″W | 77°02′59″S | BC | 628.3 | |
| ANT32RB06B | 178°14′25″W | 76°42′48″S | BC | 619.0 | |
| ANT33A1-13 | 178°1′16″W | 77°32′42″S | BC | 663.8 | |
| ANT32RB05B | 177°43′10″W | 76°24′19″S | BC | 606.0 | |
| ANT32RB03B | 176°52′11″W | 75°44′48″S | BC | 610.0 | |
| ANT32RB02B | 176°29′9″W | 75°25′24″S | BC | 574.0 | |
| ERS | ANT33A1-11 | 173°47′17″W | 77°49′34″S | BC | 530.4 |
| ANT33A1-10 | 171°22′23″W | 77°58′5″S | BC | 514.9 | |
| ANT33A1-09 | 168°57′7″W | 78°5′2″S | BC | 586.0 | |
| ANT33A1-08 | 165°47′17″W | 78°10′19″S | BC | 497.6 | |
| ANT33RS78 | 163°40′1″W | 78°41′38″S | BC | 331.1 | |
| ANT33A1-07 | 163°2′20″W | 78°10′5″S | BC | 678.8 | |
| ANT33A1-05 | 162°40′41″W | 77°23′46″S | BC | 658.3 |
Information of the Ross Sea surface sediment samples used in this study.
WRS, Western Ross Sea; CRS, Central Ross Sea; ERS, Eastern Ross Sea; BC, Box corer; MC, Multt-corer; GC, Gravity corer.
4 Methods
To carry out this study, we employed various experimental techniques, including measurements of the grain-size distribution, clay mineralogy and abundance and lithology of the coarse fraction of the sediments.
To analyze the sediment grain-size, a series of treatments were carried out. Specifically, 0.13-0.22 g of dry bulk sediment underwent sequential treatments starting with 10% H2O2, followed by 1.0 N HCl and finally 2.0 N Na2CO3, to successively eliminate organic carbon, carbonates, and biogenic silica. The samples were then dispersed using an ultrasonic bath for 2 minutes following immersion in 25 mL of distilled water. The grain-size measurements were performed using a Laser particle sizer (Malvern Mastersizer 3000), which can analyze grain-sizes ranging from 0.1 µm to 3,500 µm, satisfying our test demand. Duplicate measurements of 10 randomly selected samples showed that reproducibility was better than 5%. This experiment was done at Laboratory for Coastal Ocean Variation and Disaster Prediction, College of Ocean and Meteorology, Guangdong Ocean University.
End Member Modeling Algorithm (EMMA) was employed to deconstruct the grain-size distribution data set. EMMA is designed as an inversion algorithm which posits the input grain-size distributions as combinations of a finite number of end-members (EMs) that possess realistic compositions (Weltje, 1997). Extensive studies have demonstrated the effectiveness of this algorithm in analyzing grain-size distributions across diverse environmental contexts (Prins and Weltje, 1999; Jonkers et al., 2015; Wu et al., 2018).
The fraction with a size smaller than 2 μm was utilized for the analysis of clay minerals, after the removal of carbonates through treatment with 0.5 N HCl (e.g., Wu et al., 2021). Analysis was conducted using a PANalytical X’Pert PRO diffractometer equipped with a Ni filter and CuKa radiation at an intensity of 40 mA and voltage of 45 kV. Oriented mounts were prepared for three XRD runs including one following air-drying, one after saturation with ethylene-glycol for 1 day, and one after heating at approximately 490°C for around 120 minutes. Multiple X-ray diffractograms obtained under the above mentioned measurement conditions were compared to identify and interpret clay minerals species (Liu et al., 2003). Peak parameters were semi-quantitatively calculated using the MacDiff software (Petschick, 2000) based on the glycolated curve. The relative abundance of each clay mineral species was primarily estimated by analyzing the area of the (001) series of basal reflections (Holtzapffel, 1985). The distinction between chlorite and kaolinite was made using a peak area ratio at 3.54 Å and 3.57 Å (Holtzapffel, 1985).
The coarse fraction was determined using the procedures outlined by Wang et al. (2013). In brief, approximately 10-15g of dry sediment samples were submerged in deionized water for a period of 2 days. If needed, H2O2 was added to facilitate the disaggregation of the sediment. Subsequently, the sediment was rinsed with clean water through a 63 μm mesh, and the residue with particle size >63 μm was subjected to drying at 55°C. The dried residue was then sieved through a 250 μm mesh. The weight percentage of the >250 μm fraction was calculated based on the weight of the original dry sediment.
The lithology of the coarse fraction grains was determined and quantified using a binocular microscope for all samples, focusing on the fraction with a size greater than 250 μm (Wang et al., 2013). In cases where grains larger than 250 μm were scarce, the fraction >154 μm was utilized. A total of more than 400 non-biogenic grains were counted for each sample. Within the coarse fraction, we identified and counted various types of grains, including angular quartz, rounded quartz, plagioclase, K-feldspar, sedimentary rocks, garnet, chert, mafic igneous rocks, mica, hornblende, metamorphic rock, deformed silt, and volcanic ash. Additionally, any encountered lithic grains with unknown lithology were also included in the count, although this specific data is not presented here.
The clay mineralogy and coarse fraction abundance and lithology identification experiments were done at State Key Laboratory for Marine Geology, Tongji University.
5 Results
5.1 Grain-size
The studied sediments consist of clay (5%-30%), silt (30%-82%), and sand (0%-62%), with a mean grain-size ranging from 12 μm to 143 μm. The grain-size distribution patterns of the samples are highly variable, without any universal grain-size mode (Figure 2A). The EMMA analysis was performed to identify the primary factors governing the grain-size distributions of the sediments. Figures 2B, C present the coefficients of determination (R2) plotted versus the grain-size and number of end-members, respectively. As the number of end-members increases, the mean R2 (R2mean) also increases (Figure 2C). Amongst the two and three end-member models (R2mean=0.59 and R2mean=0.84, respectively), lower R2 (<0.6) was observed for the grain-size intervals <2 μm, 30–60 μm, and >200 μm (Figure 2B). The four-end-member model (R2mean=0.9), however, displayed lower R2 only for the grain-size interval >500 μm. Models containing six or more end-members are better suited to reproduce this coarse fraction. However, for determining the appropriate number of end-members, the coarse end (>500 μm) could be disregarded, as it consists of only a small volume fraction (<2 vol.%) of the samples (Figure 2A; e.g., Stuut et al., 2002), and measurement precision for laser particle sizing in the coarse end is inferior to that of the fine fraction (Jonkers et al., 2015). On the contrary, the mixing model should effectively reproduce the grain-size range between 2 and 500 μm, as it constitutes the majority of the sediment mass (Figure 2A). Thus, the four-end-member model represents the best compromise between R2 and the number of end-members.
Figure 2
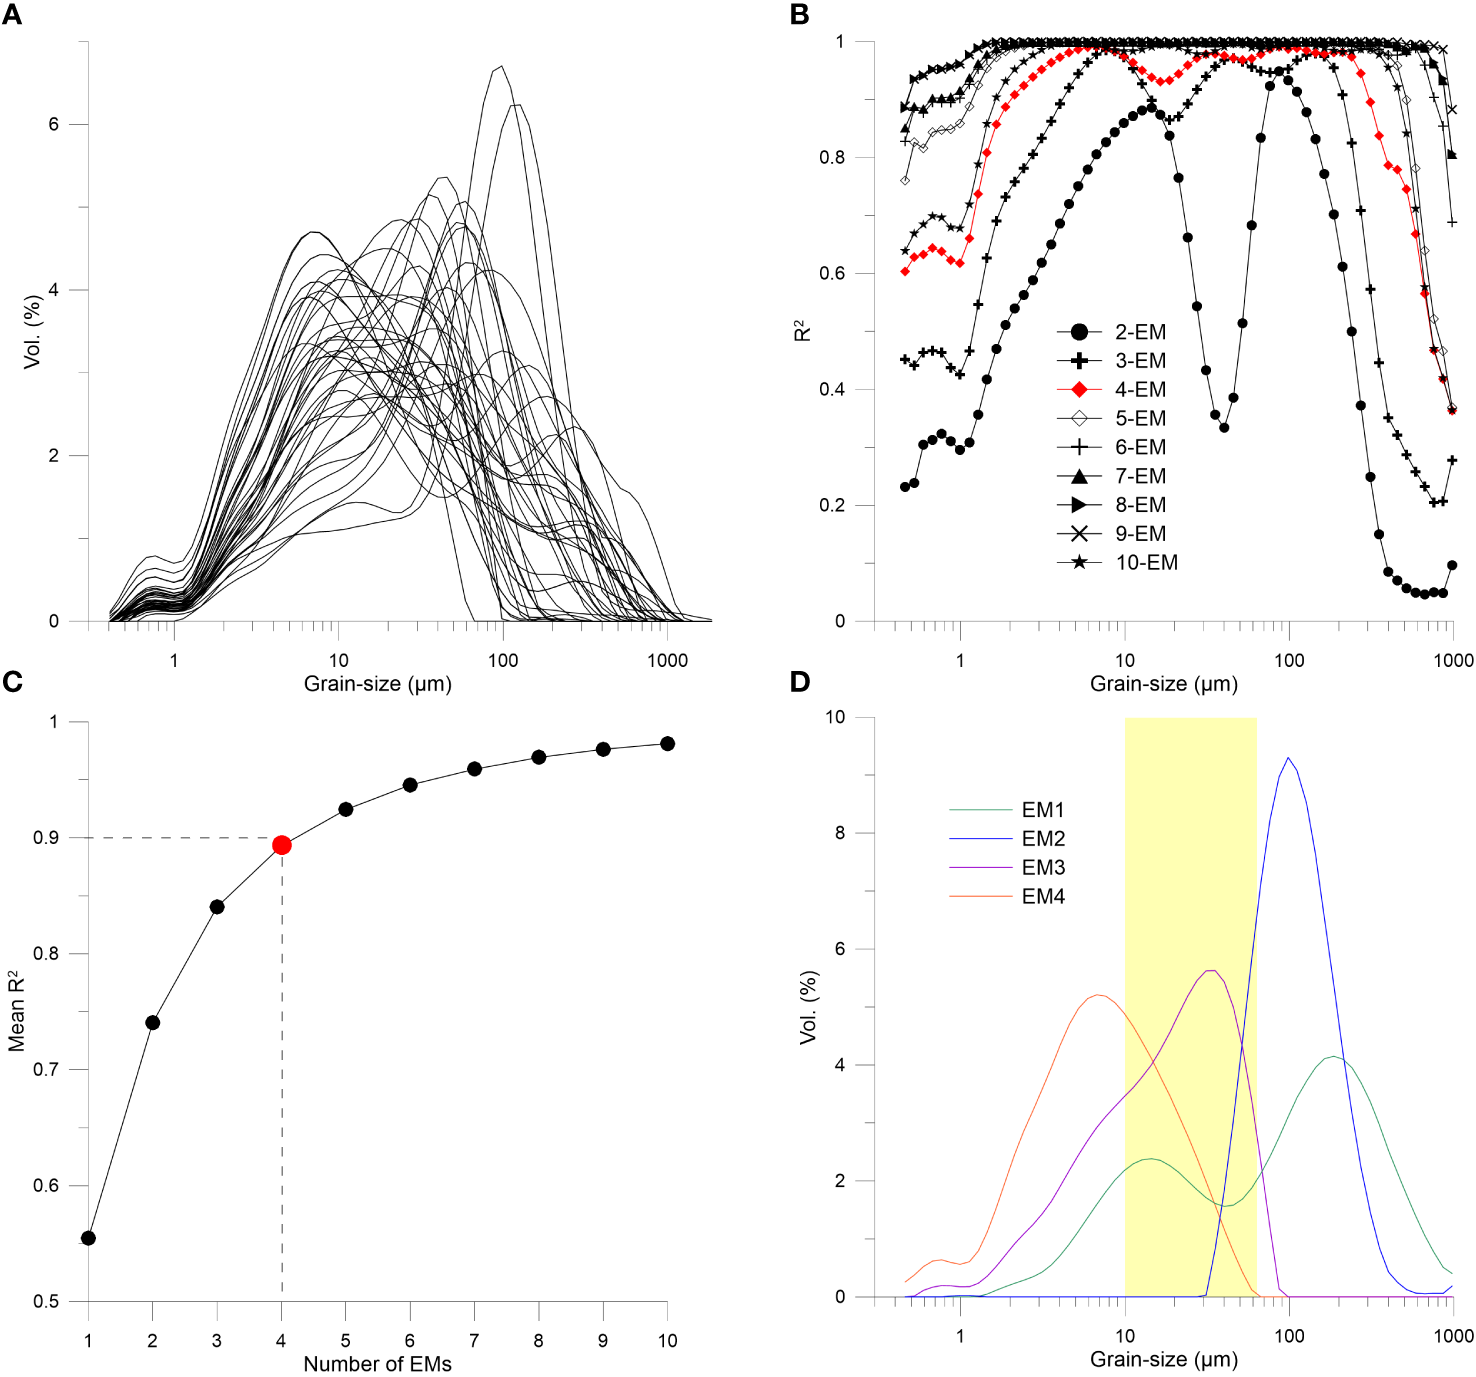
Results of end-member modeling for the grain-size dataset of the studied sediments. (A) Grain-size distributions of the studied sediments. (B) Coefficients of determination (R2) for each size class of models with 2-10 end members. (C) Mean coefficient of determination (R2mean) for all size classes in each end-member model. (D) Grain-size distributions of the modeled end members of the studied sediments. A four-end-member (Four-EM) model was selected to explain the dataset and is depicted in red in (B, C). The sortable silt interval (10-63 μm) is shaded in yellow in (D).
Figure 2D shows the grain-size distributions of the four end-members derived from the Four-EM model. EM1 is characterized by a flat two-modal pattern, with modal sizes at 200 μm and 15 μm, respectively. It has the poorest sorting (2.16). EM2 to EM4 are uni-modal. EM2 has a modal size at 150 μm, and has the best sorting (0.77). EM3 and EM4 peak at 30 μm and 8 μm, with moderate sorting of 1.38 and 1.42, respectively.
The spatial distributions of the four end-members are illustrated in Figure 3. A greater abundance of EM1 (>0.4) is primarily found in the outer shelf region, particularly near the northernmost coast of Victoria Land and the coast of Marie Byrd Land in the WRS and ERS, respectively (Figure 3A). Higher EM2 proportions (>0.2) is predominantly present in the outer shelf of the WRS, extending to some extent in the McMurdo Sound and near the Drygalski Ice Tongue, while being scarce near Marie Byrd Land (Figure 3B). The relatively high concentration of EM3 (>0.3) is exclusively observed in the WRS (<180°E), specifically in the Joides Basin, Drygalski Trough, and Joides Trough (Figure 3C). Higher proportions of EM4 proportions (>0.3) is mainly distributed in the central and eastern regions of the inner continental shelf area, encompassing Whales Deep and Little American Basin located in front of the RIS (Figure 3D).
Figure 3
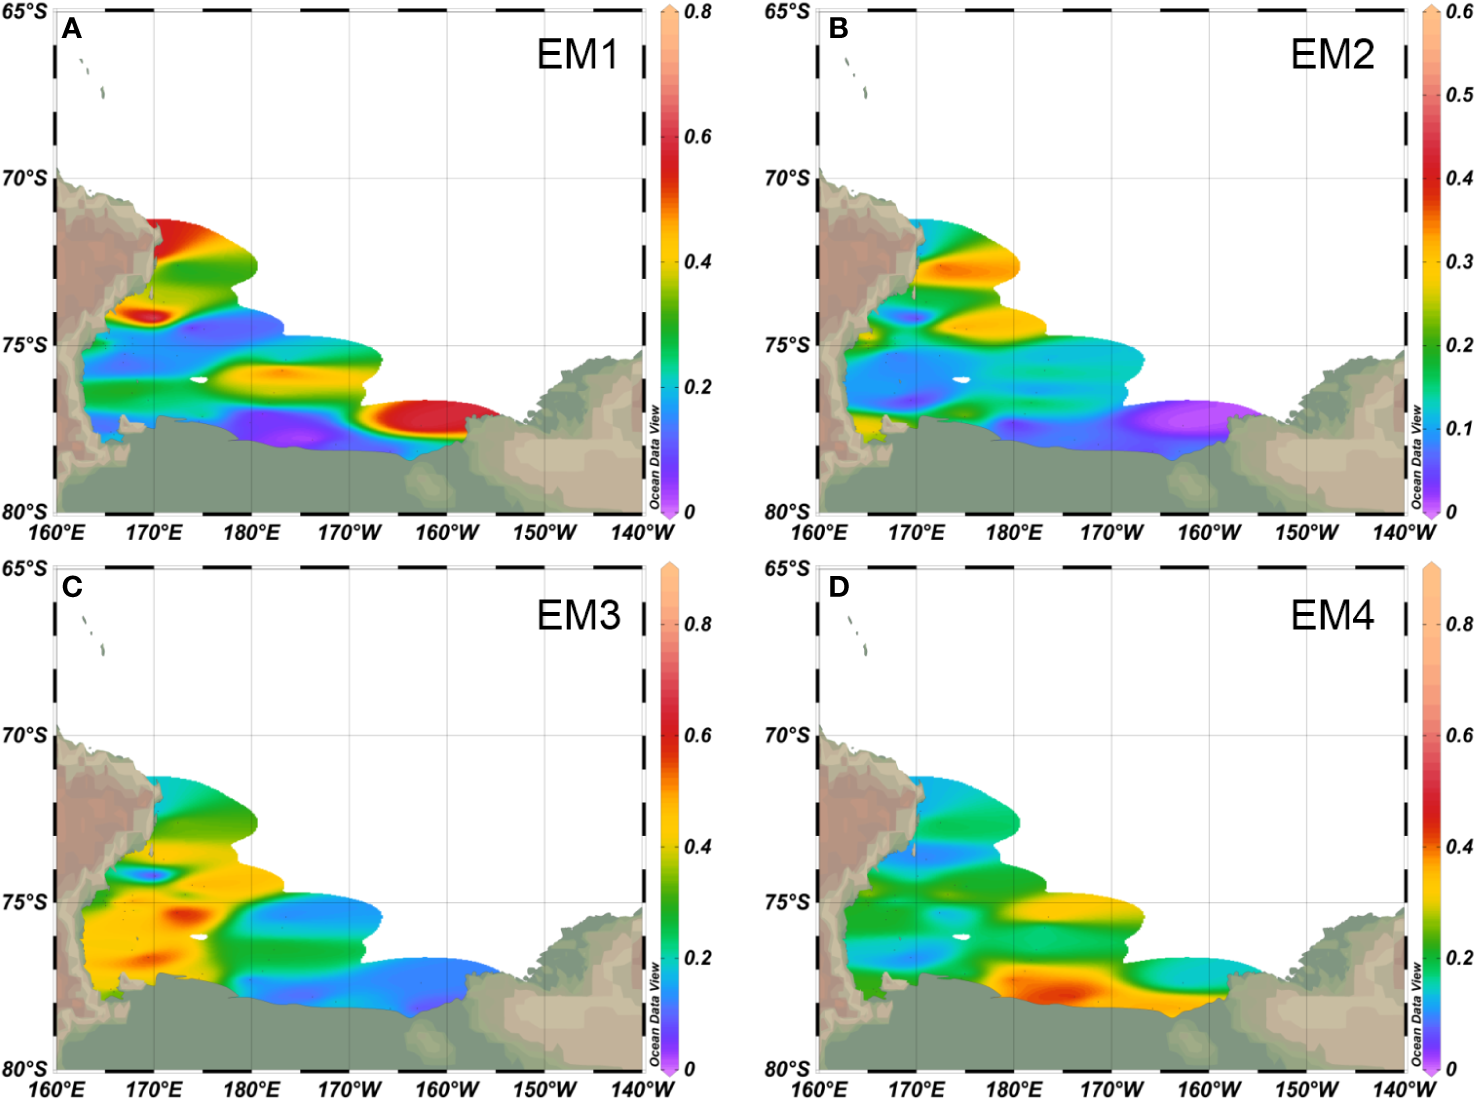
Spatial distributions of (A) EM1, (B) EM2, (C) EM3, and (D) EM4 derived from EMMA analysis of the grain-size distributions in the studied surface sediment samples.
5.2 Clay mineralogy
The clay minerals in the investigated sediments are mainly composed of illite (15%-73%), smectite (5%-64%), chlorite (9%-36%), and trace amount of kaolinite (0-23%). Illite and smectite are the most abundant species in the study area, and their spatial distribution patterns exhibit an interesting contrast (Figure 4). Illite content is relatively higher in the WRS (Figure 4A), whereas smectite content shows a relatively higher concentration mainly in the ERS (Figure 4B). The spatial distribution pattern of chlorite follows a similar trend to that of illite (Figure 4C), while that of kaolinite mirrors that of smectite (Figure 4D).
Figure 4
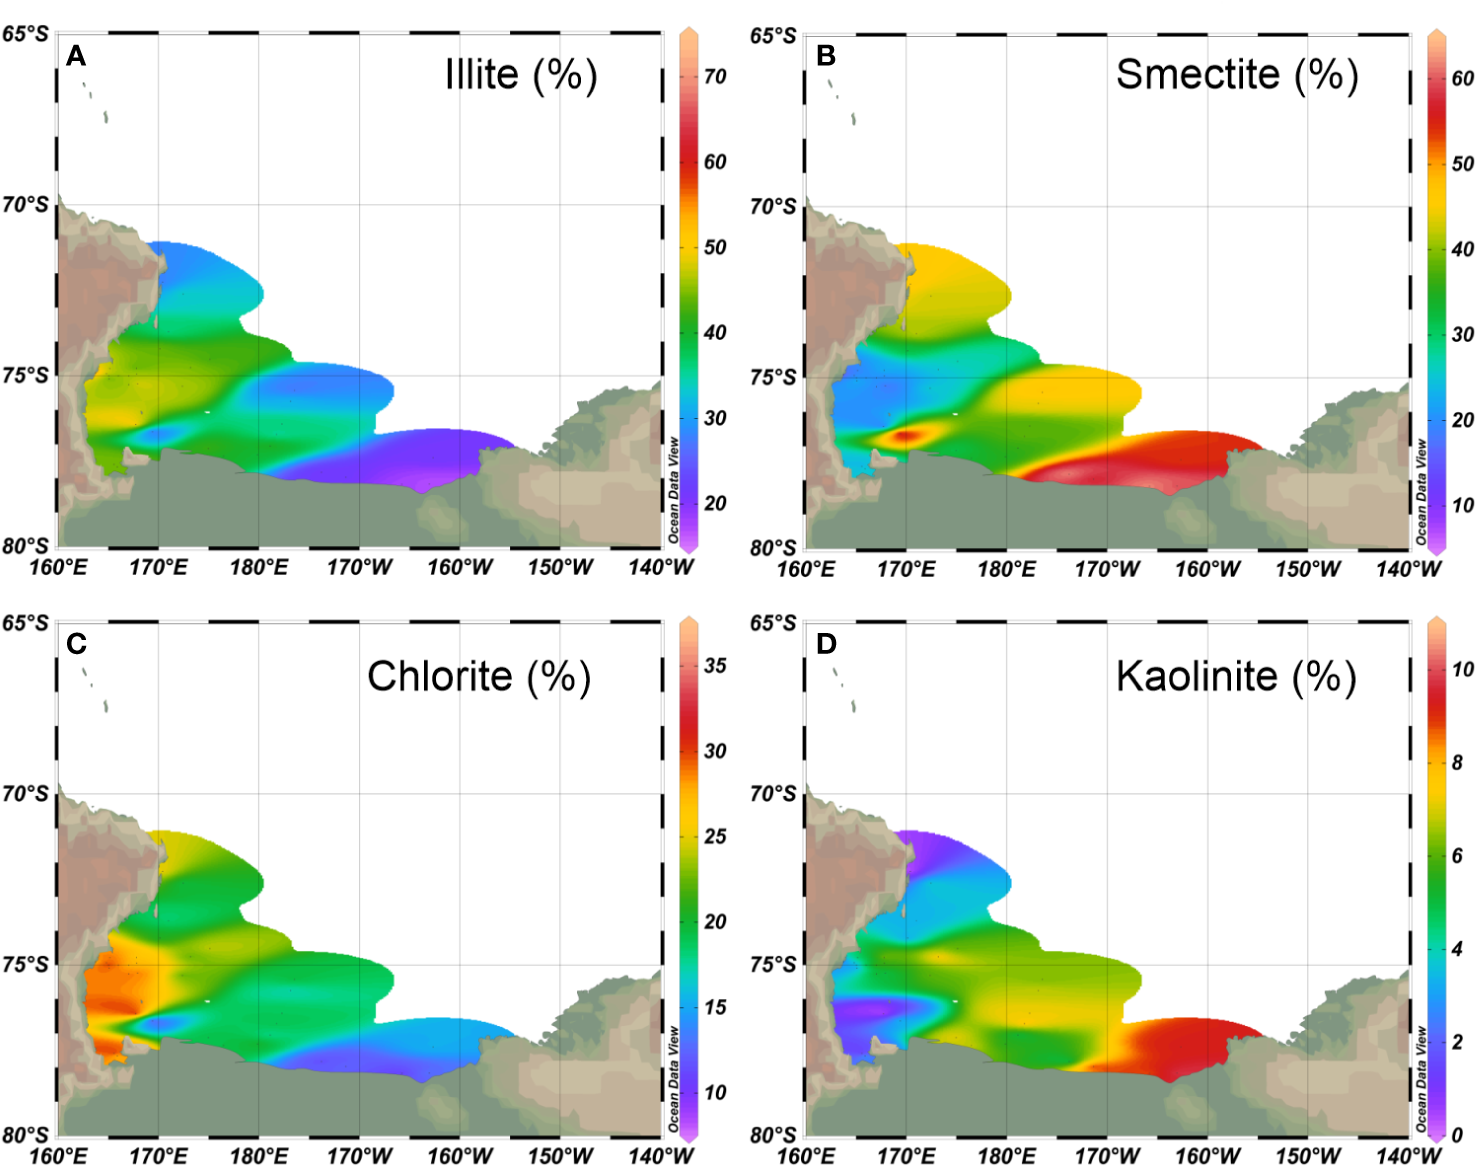
Spatial distributions of (A) illite, (B) smectite, (C) chlorite, and (D) kaolinite in the studied sediment samples.
5.3 Coarse fraction
The abundance of the coarse fraction (>250 μm) obtained through sieving ranges from 0 to 85 wt.% with an average of 17 wt.%. Higher contents are predominantly found in the outer shelf and along the coast of the WRS, while lower contents are observed in front of the RIS, as well as in the Joides Basin and Joides Trough (Figure 5A). The major constituents of the coarse fraction, with a mean content exceeding 10%, include angular quartz, rounded quartz, mafic rocks, and deformed silt (Figure 6A). In order to elucidate the primary factors influencing the spatial distribution of the coarse fraction, a Q-mode Factor Analysis (Klovan and Miesch, 1976) was performed on the dataset representing the lithological composition of the coarse fraction. The analysis yielded a three-Factor model that accounts for over 93% of the data variance (Figure 6B). Each of these three Factors possesses eigenvalues greater than 1, indicating that they explain more variance than any individual raw variable in the dataset (Wu et al., 2019). These three Factors consistently emerge across multiple runs of the Factor Analysis algorithms utilizing different Factor extraction methods. In contrast, the fourth Factor displays instability, with changing factor loadings and scores during these runs. Furthermore, inclusion of the fourth Factor does not significantly enhance the explained variance (Figure 6B), but may introduce additional errors in the results (e.g., Weltje, 1997). Therefore, the three-Factor model represents the optimal compromise between the explained variance and the factor number.
Figure 5
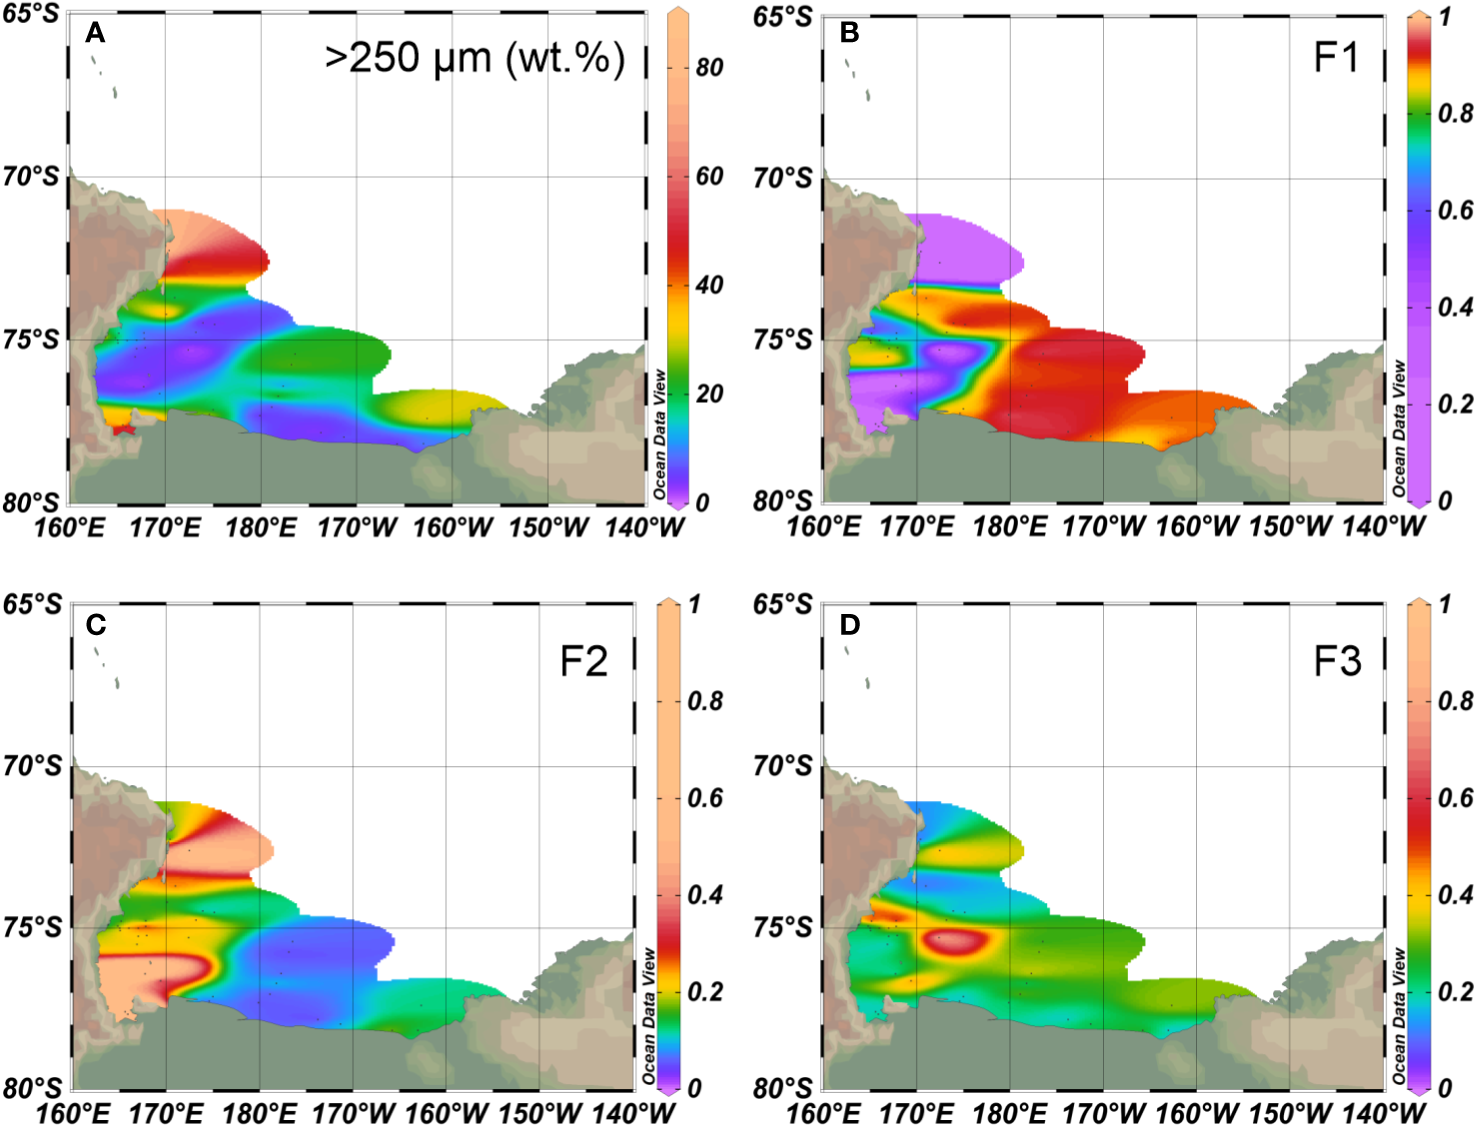
Spatial distributions of (A) weight percent of the >250 μm fraction derived from wet sieving, and factor scores of Factor 1 (F1), Factor 2 (F2), and Factor 3 (F3) in panels (B–D), respectively, derived from factor analysis of the >250 μm coarse fraction dataset.
Figure 6
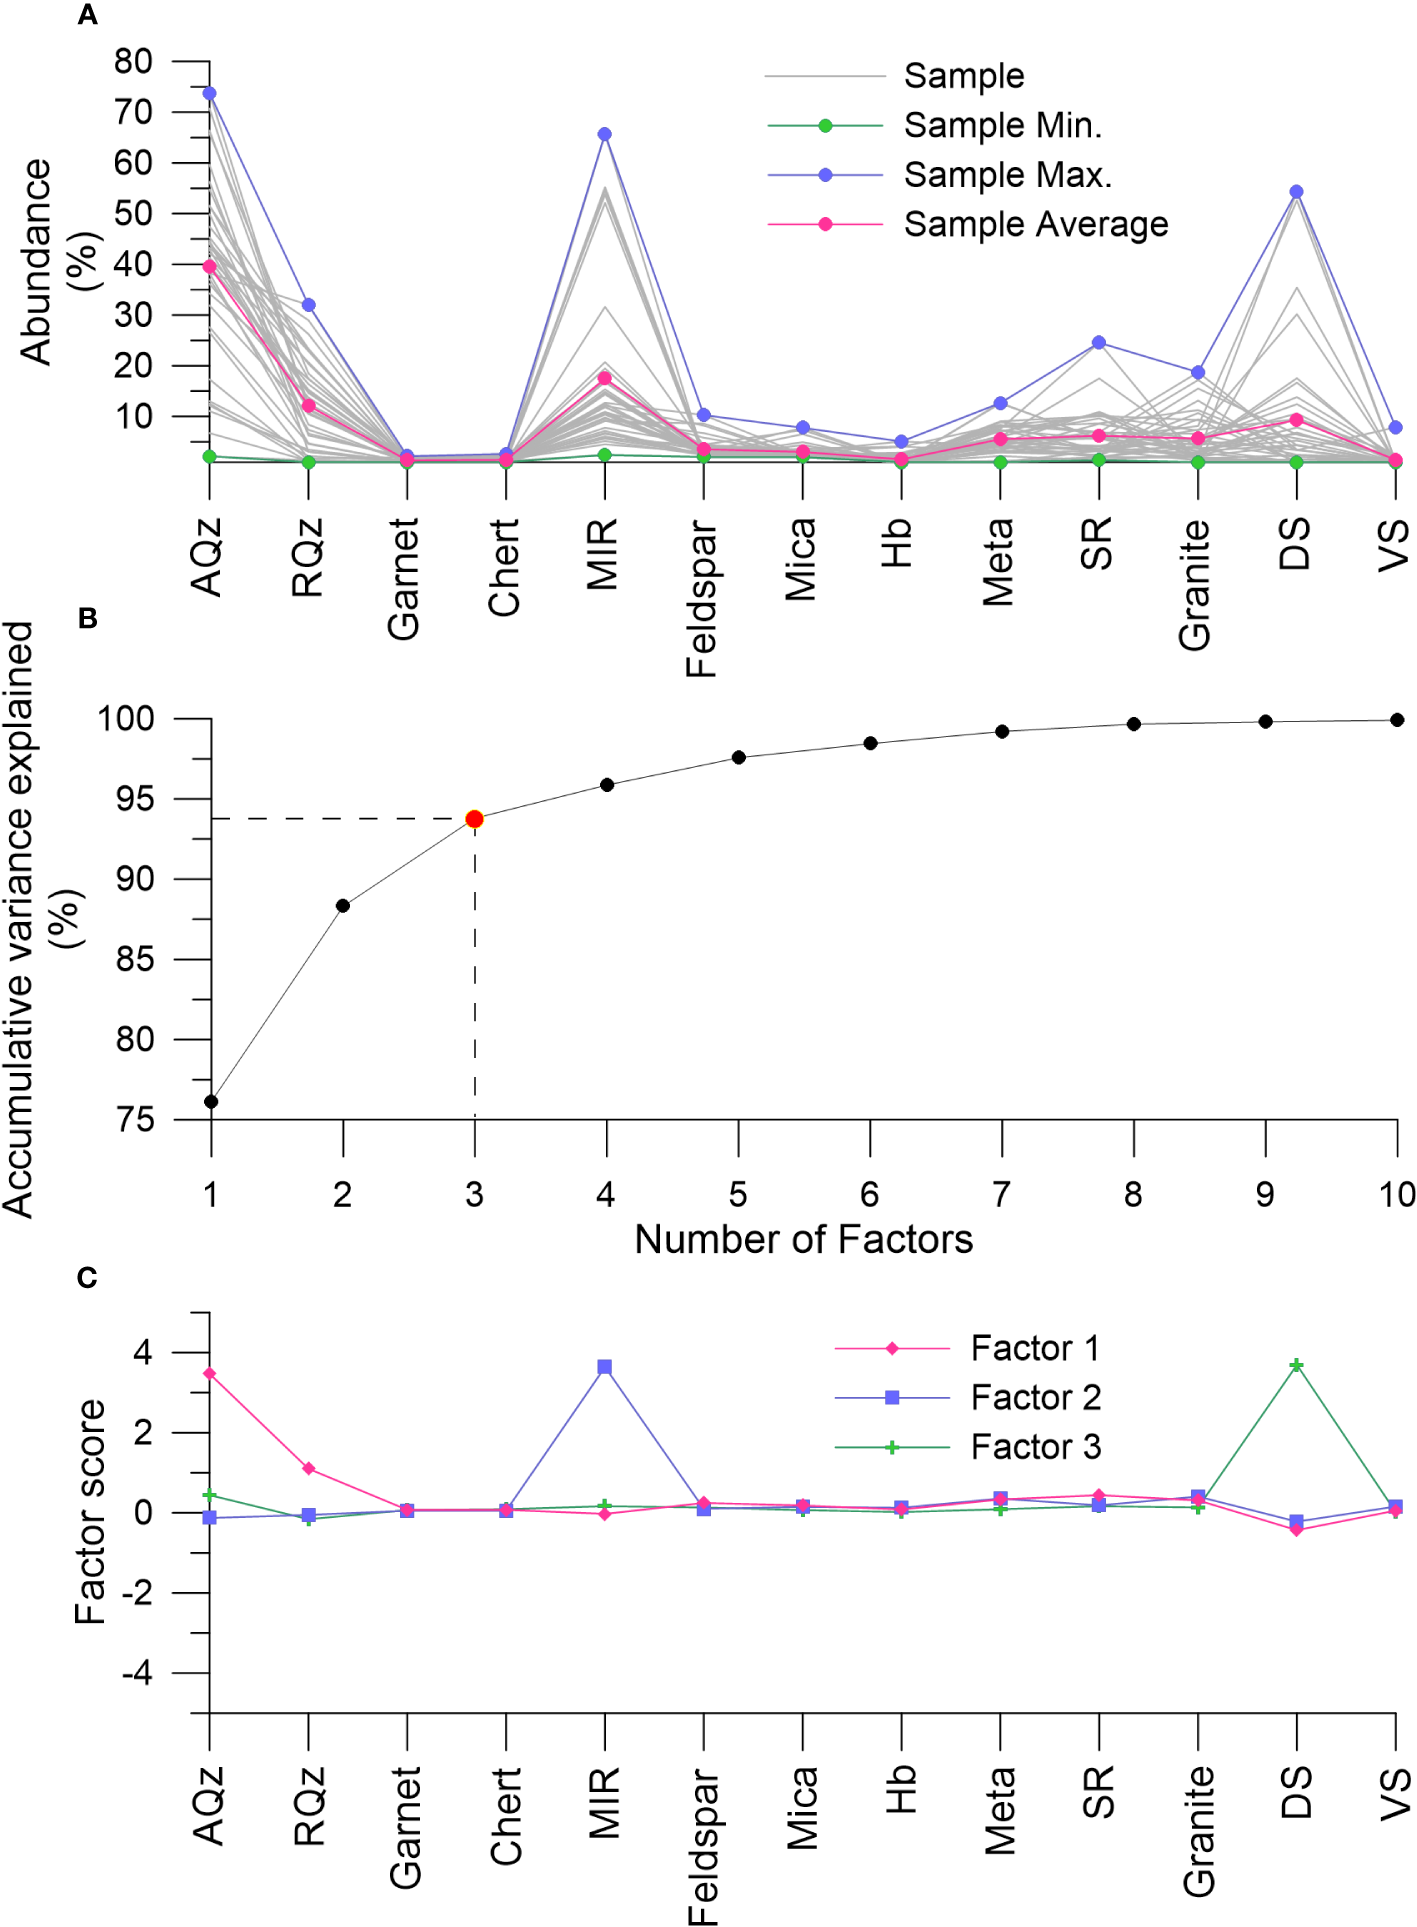
Factor analyses of the >250 μm fraction derived from wet sieving. (A) Summary of the lithologic composition of the >250 μm fraction. (B) Cumulative variance explained by increasing factors (2-10). (C) Distribution of factor loadings for the selected three-Factor model. AQz represents angular quartz, RQz represents rounded quartz, MIR represents mafic igneous rock, Hb represents hornblende, Meta represents metamorphic rock, SR represents sedimentary rock, DS represents deformed silt, and VS represents volcanic shards.
The three identified Factors account for 76.14%, 12.17%, and 5.49% of the data variance, respectively (Figure 6B). Factor 1 is characterized by high loadings of angular quartz and rounded quartz (Figure 6C). Factor 2 displays significant loadings on mafic igneous rocks (Figure 6C). Factor 3 is associated with deformed silt (Figure 6C). With regards to their spatial distribution, higher scores of Factor 1 (>0.9) are mainly observed in the ERS and Central Ross Sea (CRS), extending to the central Victoria Land coast (Figure 5B). In contrast, Factor 2 exhibits higher scores (>0.1) in both the WRS, particularly near the McMurdo Sound and the northernmost part of Victoria Land, and low scores (<0.1) in the CRS (Figure 5C). High scores of Factor 3 (>0.5) predominantly occur in the nearby region of the David Glacier-Drygalski Ice Tongue system in the WRS (Figure 5D).
6 Discussion
6.1 Sediment delivery mode
6.1.1 Linking grain-size end-members to sediment delivery modes
End-members of sediment grain-size obtained from EMMA analyses have been frequently associated with sediment transport and/or deposition mechanisms in various environmental settings. Previous studies suggest that in the Southern Ocean, oceanic currents, icebergs, sea ice and wind could be potential media that deliver terrestrial sediments to the seas (Pudsey, 1992; Gilbert et al., 1998; McCave et al., 2014; Wu et al., 2018; Wu et al., 2021). Sea ice, however, forms in deep water continental shelf (~500 m) in Ross Sea, with little sediment encased. Earlier studies indicate that the WRS coast could be a possible source area for wind-blown dust (Delmonte et al., 2010). Nonetheless, none of the four end-members displays a spatial distribution pattern decreasing seaward from the WRS coast, excluding wind-blown dust as a major contributor to the sediments. Therefore, we associate the grain-size end-members with sediment delivery primarily by icebergs and bottom currents.
In polar oceans, icebergs can carry sediments with a broad range of grain-size compositions. Therefore, the grain-size distribution of IRD is typically described as poorly sorted, even though coarse sediment fractions such as the >150 μm and/or >250 μm fractions from polar oceans are often considered as IRD. This is because sediment of such diameters cannot be moved and sorted by typical oceanic currents (Lamy et al., 2015; Wu et al., 2020). The grain-size distribution of EM1 (Figure 2D) displays poor sorting and bears a resemblance to the previously published grain-size distribution of IRD (Prins et al., 2002; Wu et al., 2018). Moreover, there is a robust correlation between EM1 and the >250 μm component obtained from wet sieving (R=0.63, p<0.01). We thus interpret EM1 as IRD.
EM2 has the best sorting and a relatively coarse mean grain-size (Figure 2D). This grain-size distribution is likely produced by strong current winnowing (e.g., Abuodha, 2003). However, there is a weak positive correlation between EM2 and the sorting parameter of the <150 μm fraction (r=0.31, n = 41), implying that higher EM2 content does not correspond to better sorting of the finer fraction of the sediments. Modern observations indicate that the bottom current velocity of the Ross Sea continental shelf generally remains below 15 cm/s (Jacobs et al., 1970), which is insufficient to transport particles >63 μm (McCave and Hall, 2006). Thus, the good sorting of the relatively coarse EM2 cannot be interpreted as bottom current winnowing lags. Instead, previous studies have identified well-sorted IRD in other ocean areas (Prins et al., 2002; Wang et al., 2023). It is postulated that this IRD may originate from the transport of icebergs in regions with intense hydrodynamics, such as coastal sand beaches (Prins et al., 2002; Wang et al., 2023). In such environments, the sediment itself is sorted well before being entrained in icebergs. Indeed, paleo-beaches forming during Middle Holocene Climate Optimum have been frequently found situating above the modern sea level along the western coast of Ross Sea (Colhoun et al., 1992). EM2 is thus interpreted as IRD delivered by icebergs derived from coastal beaches in the Western coast of Ross Sea.
The grain-size distributions of EM3 and EM4 exhibit significant overlap with the sortable silt interval (10-63 μm) (Figure 2D). This indicates that they can be transported and/or altered by bottom currents in deep-sea environments (McCave and Hall, 2006; McCave et al., 2017). The presence of a larger modal grain-size combined with relatively better sorting suggests that EM3 would likely accumulate in an environment with stronger bottom currents. Conversely, the finer grain-size and slightly poorer sorting of EM4 are indicative of deposition in an environment with weaker hydrodynamics (Jonkers et al., 2015; Wu et al., 2018).
6.1.2 Delivery of IRD
The Ross Sea region has been identified as a significant source of icebergs in the Southern Ocean, and extensive presence of icebergs has been observed in this area (Turnbull, 2006). Indeed, the contents of EM1, EM2 and the wet sieving-based >250 μm fraction in most samples are above zero, suggesting widespread iceberg unloading throughout the sampling area. Iceberg unloading is primarily associated with dynamics of the ice shelf/glacier that produces the iceberg, but might be further influenced by a range of factors such as the sea water temperatures, ocean current pathways, debris type and amount in icebergs, distance from iceberg sources, and geomorphology of the seafloor (Teitler et al., 2010; Cook et al., 2013; Cook et al., 2014; Weber et al., 2014; Wu et al., 2021).
Antarctic ice shelves as large as the RIS, are typically devoid of basal debris as most of the debris have been unloaded near their grounding zone prior to calving (Patterson et al., 2014; Smith et al., 2019). This accounts for the extremely low content of IRD immediately in front of the RIS to the east of 178°E (Figures 5A, 7A). The presence of the RIS provides protection against wave and tidal action, whereas the ice shelf-free coastlines of the WRS have experienced intense wave, tide, and storm activity since the Mid-Late Holocene, after the retreat of the RIS to its current position (McKay et al., 2008), favoring the development of beaches (e.g., Colhoun et al., 1992). We noted that the maximum value of EM2 decreased significantly with increasing longitude (Figure 8B), suggesting that EM2 originated from the ice shelf-free western coast of Ross Sea (See Section 6.1.1). Conversely, there was no observable trend in the spatial distribution of EM1 or the wet sieving-based >250 μm fraction across longitudes (Figures 8A, C), in combination with the fact that EM1 and EM2 display dissimilar grain-size distribution patterns (Figure 2D), suggesting that the source regions of EM1 and EM2 are distinct.
Figure 7
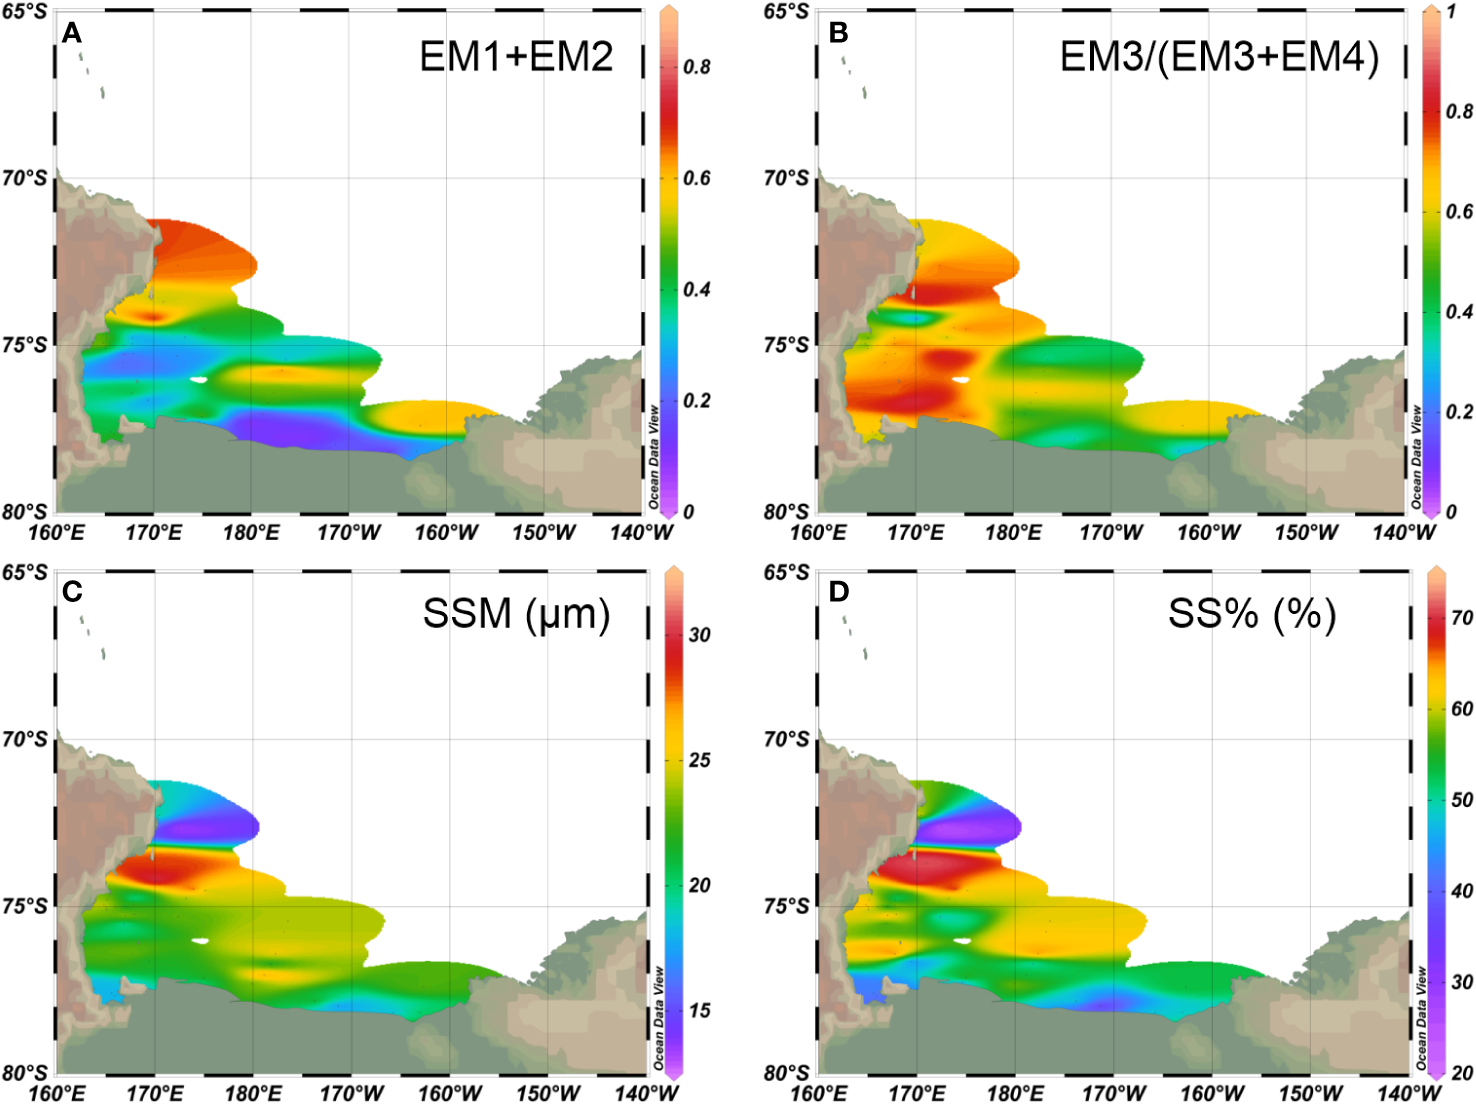
Spatial distributions of (A) EM1+EM2 and (B) EM3/(EM3+EM4) resulting from grain-size EMMA analysis, and (C) Sortable Silt mean grain-size (SSM) and (D) Sortable Silt percent (SS%) in the studied sediments.
Figure 8
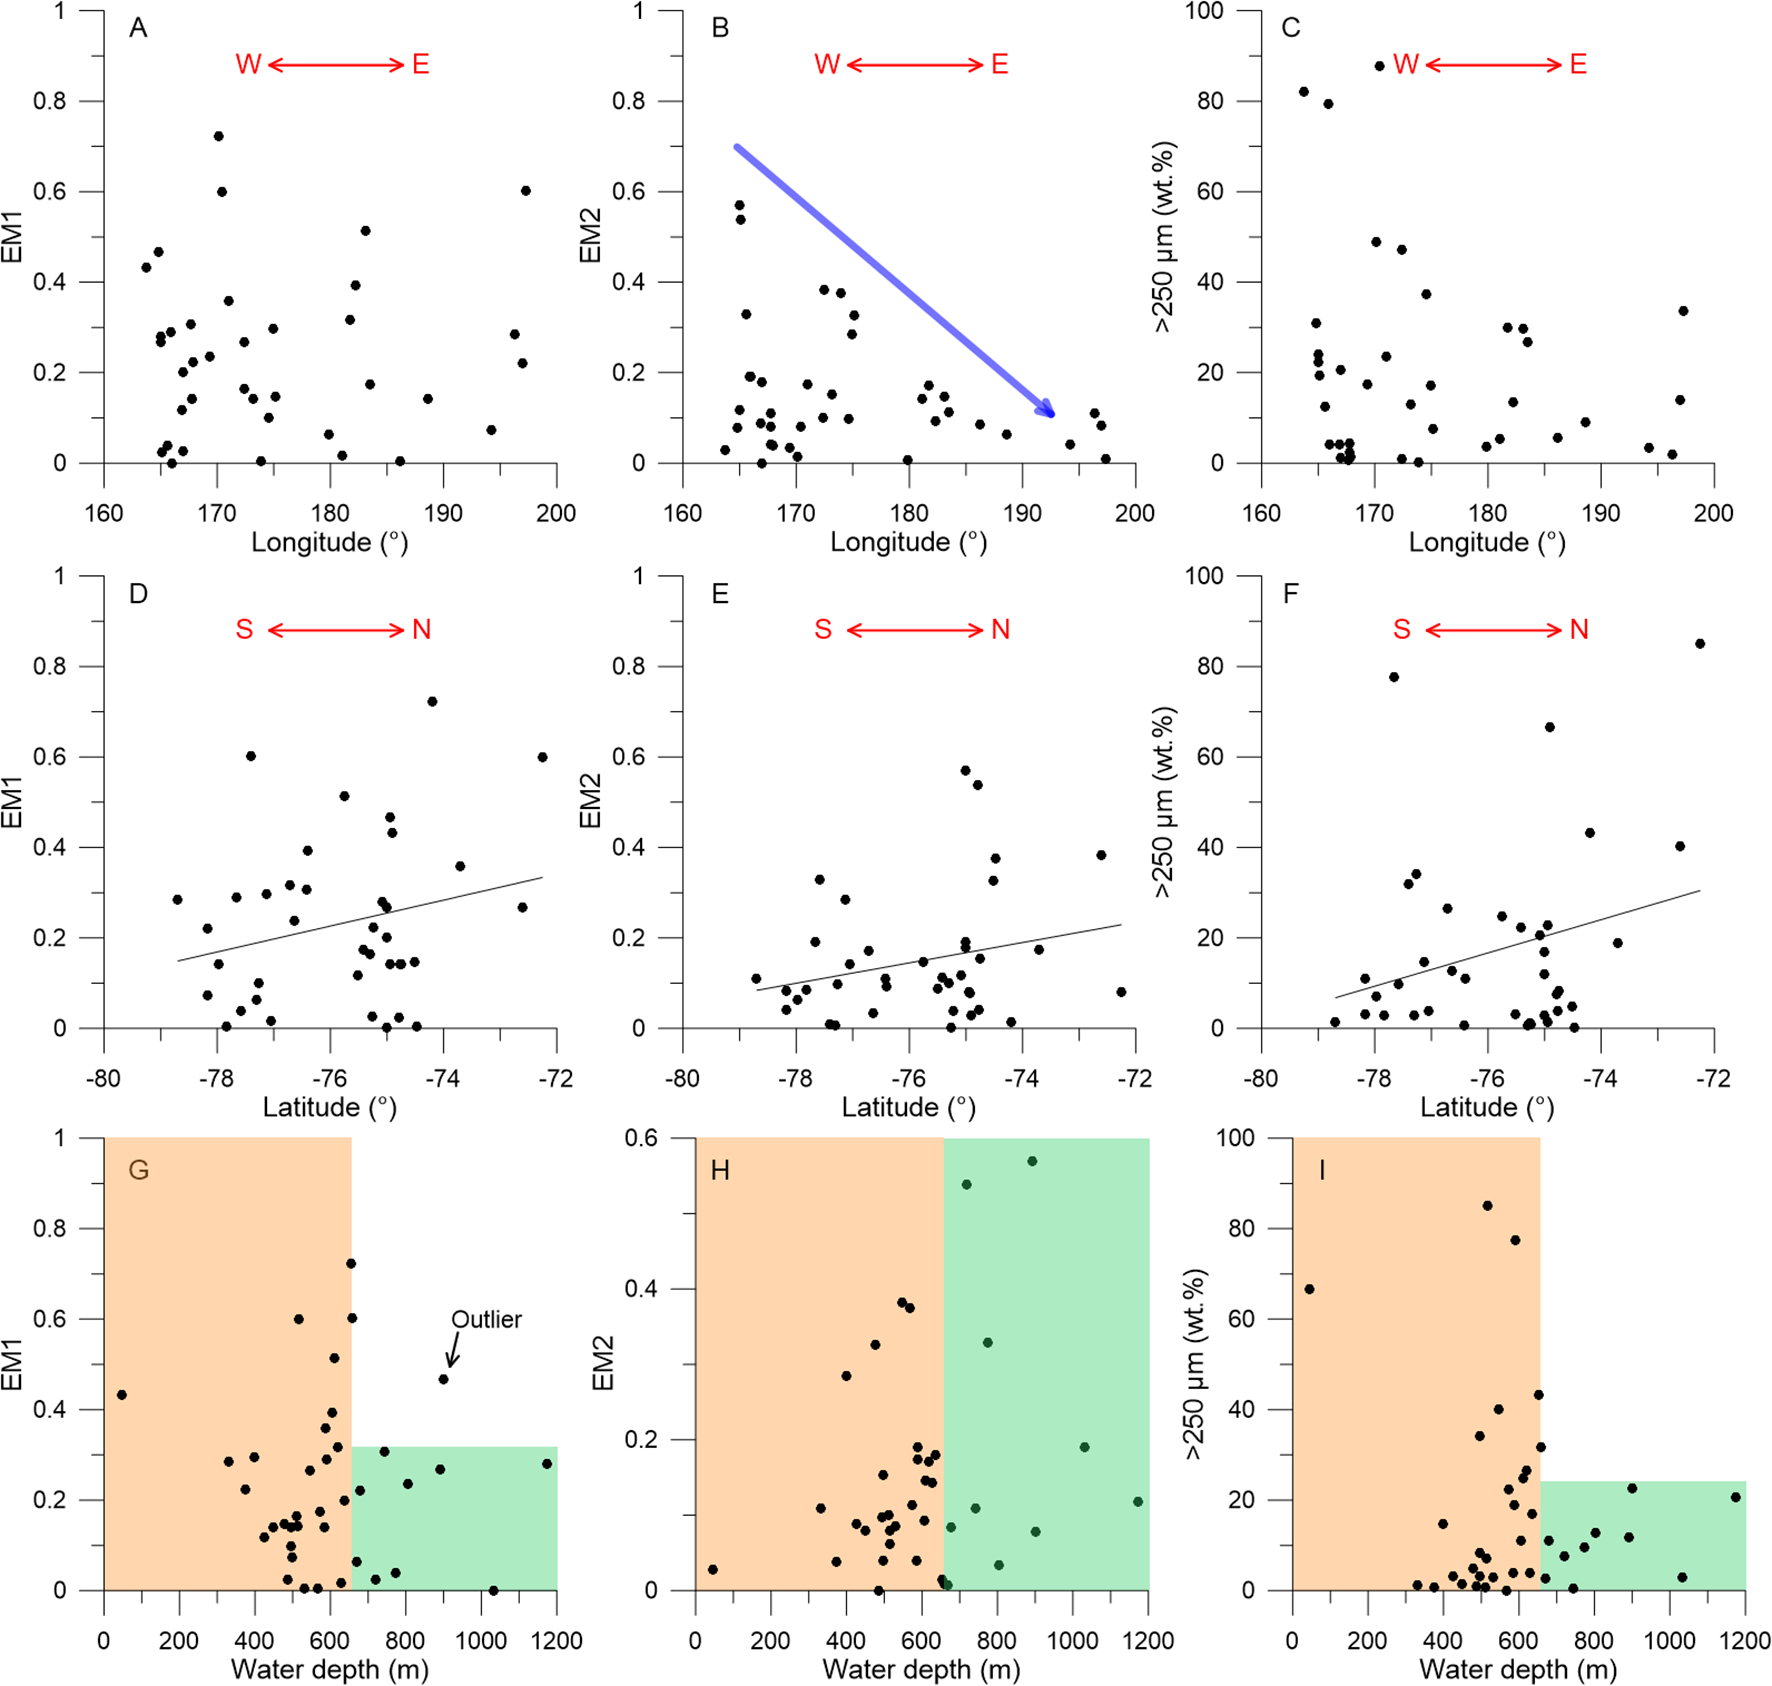
Plots of grain-size end-members from EMMA analysis of the studied sediment samples against sampling longitude, latitude, and water depth, respectively. (A) EM1 versus longitude. (B) EM2 versus longitude. (C) Longitude versus the >250 μm fraction derived from wet sieving. (D) EM1 versus latitude. (E) EM2 versus latitude. (F) Latitude versus the >250 μm fraction derived from wet sieving. (G) EM1 versus water depth. (H) EM2 versus water depth. (I) Water depth versus the >250 μm fraction derived from wet sieving. The red double arrows in (A) to (C) represent west (W) and east (E) directions. The red double arrows in (D) to (F) represent south (S) and north (N) directions. The light orange and light green shades in (G) to (I) indicate samples deposited in areas with water depth <660 m and >660 m, respectively. The blue arrow in (B) indicates a decrease in EM2 proportions with longitude. The black lines in (D) to (F) represent regression lines.
On the other hand, we observed a complex relationship between IRD and water depth. When the water depth is below ~660 meters, there is significant variation in the proportion of EM1 and the weight percent of the wet sieving-based >250 μm fraction among different stations, ranging from 0 to 72% and from 0 to 85 wt.%, respectively (Figures 8G, I). However, when the water depth exceeds ~660 meters, this variation range abruptly narrows to between 0 and 30%, and between 0 and 22 wt.%, respectively. Notably, there is no such relationship between EM2 and water depth (Figure 8H).
The RIS has an average thickness approximately 600 meters (McKay et al., 2018), implying that large icebergs calved from the RIS are more likely to remain grounded for extended periods when the water depth on the continental shelf is close to this value. This may lead to extended unloading of basal and englacial detritus of the icebergs there and even disturbance of previously deposited sediments, as described by O'Brien and Leitchenkov (1997) for the scenario in Prydz Bay, East Antarctica. In contrast, smaller icebergs could unload their detritus at any water depth deeper than the thickness of their marine portion. This mechanism could explain the complex relationship between water depth and EM1 as well as the >250 μm fraction (Figures 8G, I). The presence of different patterns between EM1 and water depth (Figure 8G), and between EM2 and water depth (Figure 8H), thus may indicate that at least part of EM1 was released from larger icebergs, while EM2 was released from smaller ones.
Additionally, significant positive correlations were observed between all the indicators of IRD and latitude (Figures 8D-F), indicating a tendency for IRD deposition towards the outer shelf, coinciding with the intrusion of MCDW onto the continental shelf (Whitworth and Orsi, 2006). The warmer MCDW that enters the Ross Sea compared to other water masses can enhance the basal melting of icebergs, promoting the release of IRD. Consequently, the overall increase in IRD towards the north suggests that variations in sea water temperature, influenced by the intrusion of MCDW, play a significant role in governing delivery of IRD onto the Ross Sea continental shelf.
6.1.3 Bottom currents
The analysis of sediment grain-size offers valuable insights into the dynamics of sediment transport. In the deep-sea setting, the duration of sediment settling from the water column to the seafloor is relatively brief in comparison to its residence time near the sediment-water interface, particularly in areas characterized by low sedimentation rates. Consequently, when establishing a connection between sediment grain-size and ocean currents, the primary focus lies on discerning variations in the intensity of bottom currents (McCave and Hall, 2006; McCave and Andrews, 2019).
McCave and Hall (2006) proposed using the geometric mean grain-size of the 10-63 μm fraction, which is known as the sortable silt mean (SSM), as a proxy for changes in bottom current strength, provided that it correlates well with the percentage of the sortable silt (SS%). The presence of IRD in high-latitude oceans, however, can complicate this relationship, particularly when bottom current strength is weak (Jonkers et al., 2015; Stevenard et al., 2023). In such cases, coarser components in IRD are not effectively sorted by the bottom current, resulting in an increase in SSM with the addition of coarse component content (Jonkers et al., 2015; Stevenard et al., 2023). In our samples, we found a significant correlation between SSM and SS% (Figures 7C, D, 9A), but an insignificant correlation between SSM and the IRD end-member EM1 (Figure 9B). Interestingly, there was a significant correlation between SSM and EM2 (Figure 9C), and the spatial distribution pattern of SSM overlapped with that of EM2 as well (Figures 3B, 7C), leading to suspicions that the SSM here could be used as a proxies for bottom current strength change (Figure 2D). In view of this, we propose a new index, EM3/(EM3+EM4) (Figure 7B), to evaluate the relative change of local bottom current strength. This index utilizes indicators that reflect transport by relatively strong and weak bottom currents in EMMA end-members, which are unaffected by IRD (e.g., Prins et al., 2002; Jonkers et al., 2015; Wu et al., 2018; Wang et al., 2023).
Figure 9
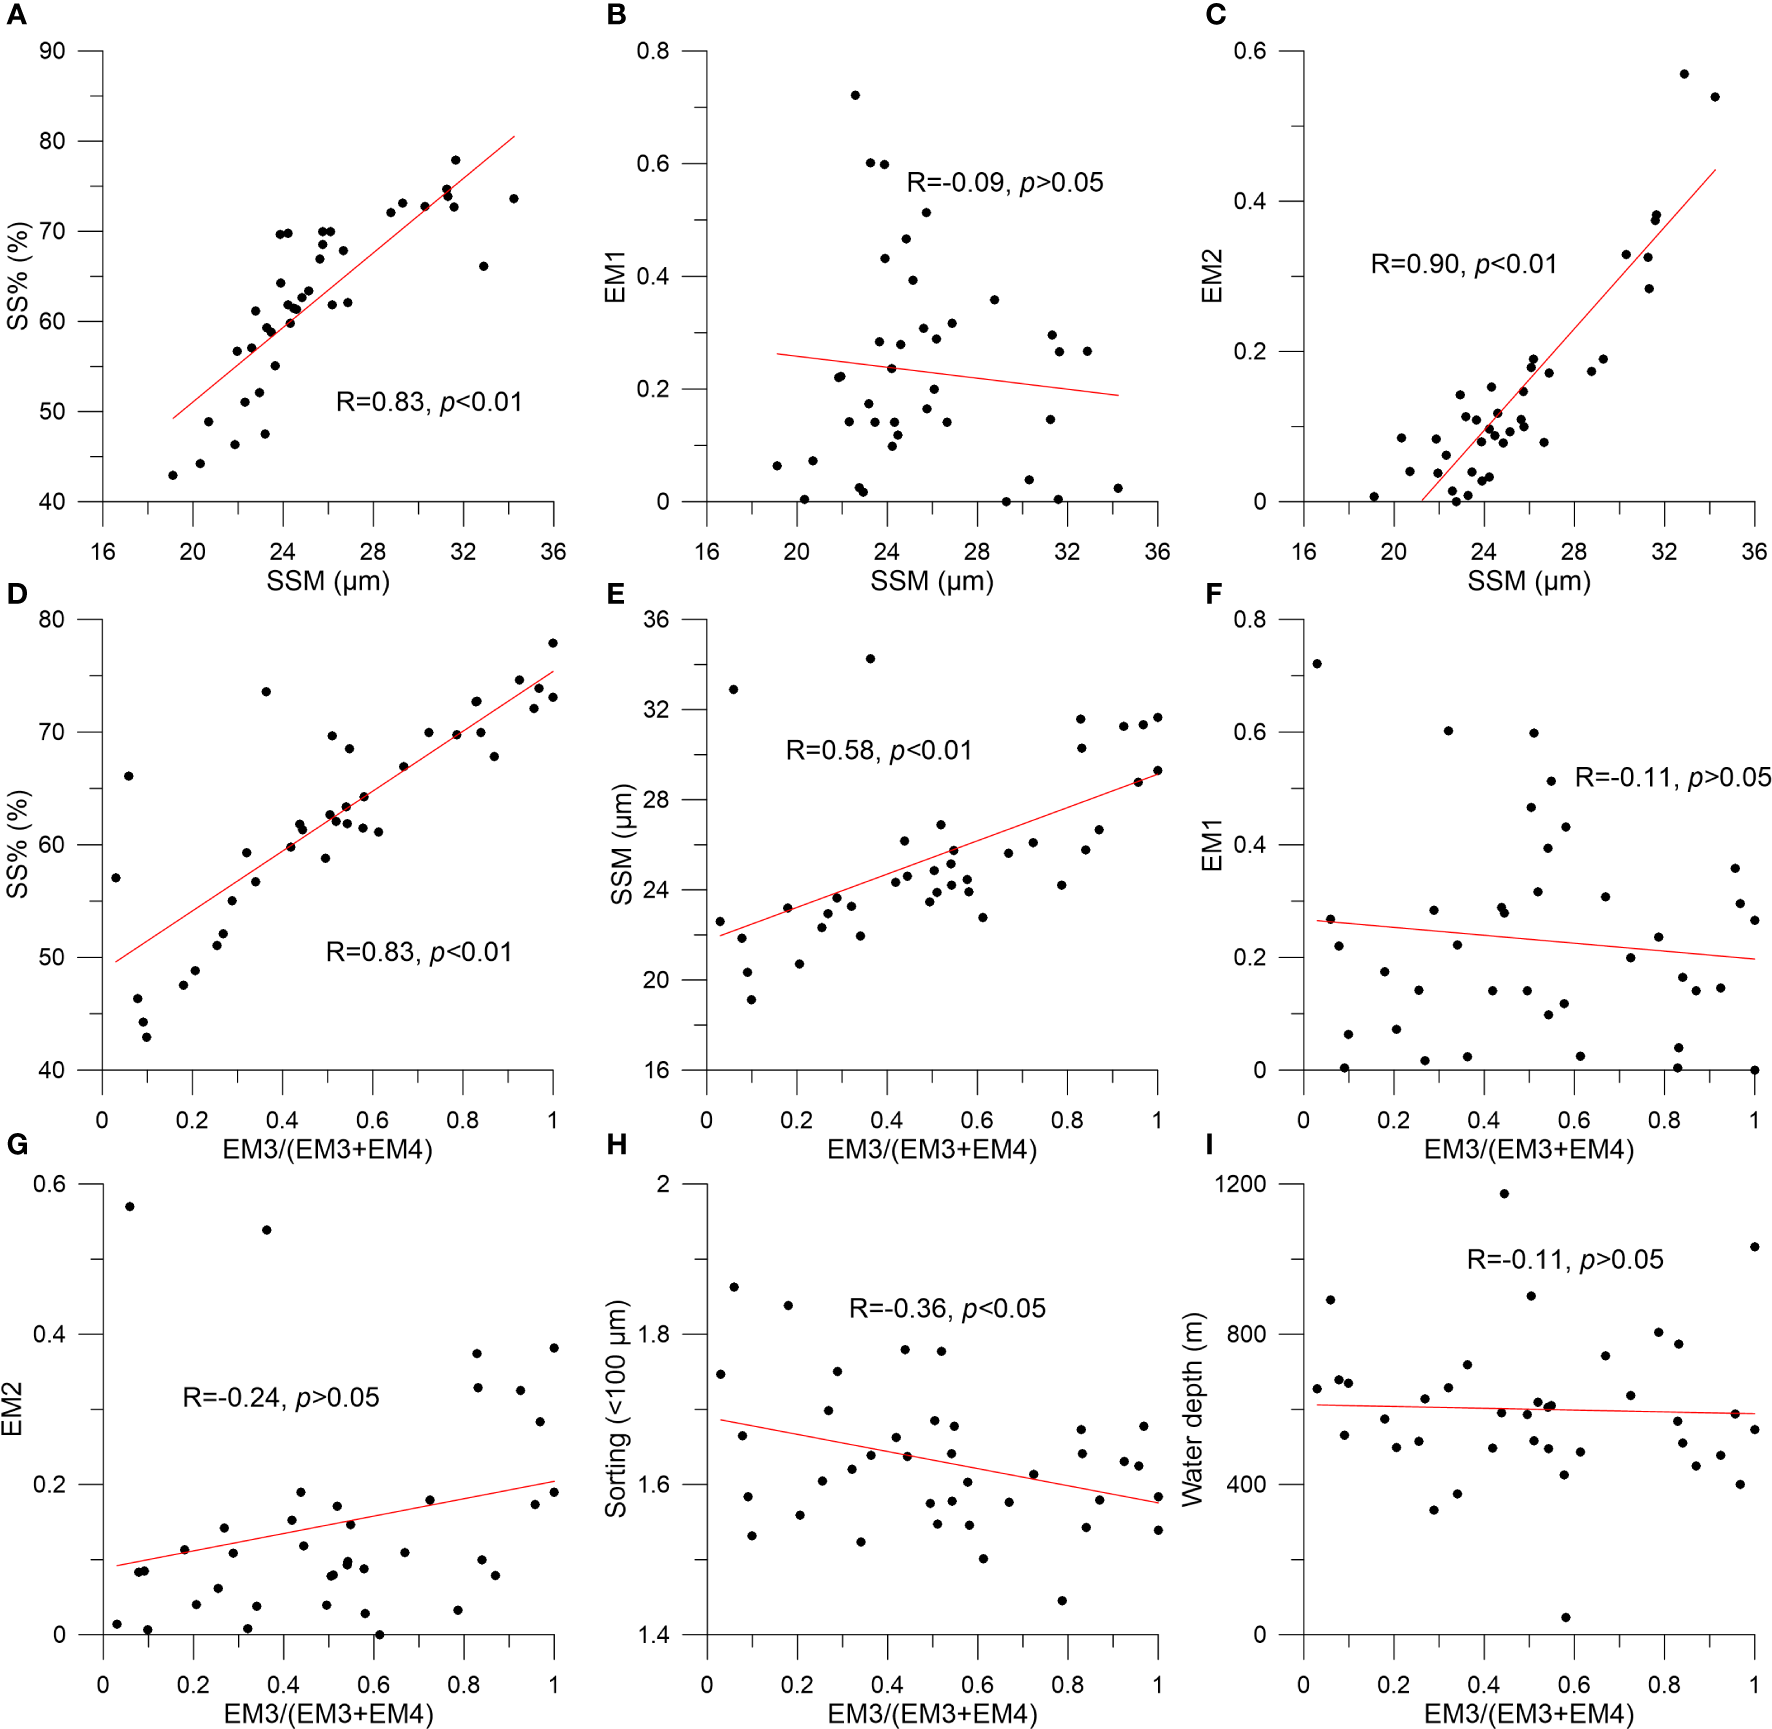
Plots of (A) SSM versus SS%, (B) EM1 versus SSM, (C) EM2 versus SSM, (D) EM3/(EM3+EM4) versus SS%, (E) EM3/(EM3+EM4) versus SSM, (F) EM3/(EM3+EM4) versus EM1, (G) EM3/(EM3+EM4) versus EM2, (H) EM3/(EM3+EM4) versus sorting of the <100 μm fraction, and (I) EM3/(EM3+EM4) versus water depth. Red regression lines are shown in these plots.
The EM3/(EM3+EM4) ratio exhibits a significant correlation with both SSM and SS% (Figures 9D, E). However, no significant correlation was observed between the EM3/(EM3+EM4) ratio and any IRD indicator (Figures 9F, G), and the spatial distribution of EM3/(EM3+EM4) (Figure 7B) also differs from that of the IRD indicators (Figures 3A, B). Moreover, a significant negative correlation was found between the EM3/(EM3+EM4) ratio and the sorting of the <100 μm fraction (Figure 9H). This suggests that higher values of EM3/(EM3+EM4) correspond to better sorting of the fine fractions (e.g., Passchier, 2011; Patterson et al., 2014; Wu et al., 2021), thus supporting its validity as an indicator for relative changes of the bottom current strength in our study. Higher EM3/(EM3+EM4) values indicate stronger bottom current activities, and vice versa.
Spatially, elevated values of EM3/(EM3+EM4) are predominantly observed in the WRS, particularly in the Joides basin, Joides trough, and the northernmost region of Victoria Land (Figure 7B). This spatial distribution indicates that these specific areas underwent notable activities of relatively strong bottom currents.
In the Southern Ocean, wind stress curl is a crucial factor that influences the oceanic current activities across the water column. Furthermore, the energy derived from the wind stress curl is regulated by sea ice cover (e.g., Toggweiler et al., 2006; McCave et al., 2014). However, we found no correlation between the EM3/(EM3+EM4) ratio and water depth in our samples (Figure 9I). This suggests that the energy that prompts bottom current activity does not originate from the sea surface. Otherwise, shallower sampling stations would display higher bottom current strength due to greater energy gain, resulting in a higher EM3/(EM3+EM4) ratio. Therefore, we propose that bottom current strength in our study is not related to wind stress curl, and other factor(s) must be involved to explain its spatial distribution and variability.
It is well know that the WRS serves as a significant source region for the generation of Antarctic Bottom Water (AABW), accounting approximately for 25% of its overall production (Orsi et al., 2002; Orsi and Wiederwohl, 2009). Formation of AABW in the WRS is closely linked to the rejection of brine resulting from sea ice production within the polynya (Tamura et al., 2008; Gordon et al., 2015). The influx of warm and saline MCDW from the WRS leads to raised salinity within the local water mass. Concurrently, continuous sea ice formation in the polynya further elevates the salinity of the expelled brine. As a result, highly saline brine descends and accumulates in deep water basins on the continental shelf, giving rise to Dense Shelf Water (DSW). Subsequently, the DSW moves northward through submarine canyons and, driven by tidal activity, passes the sills on the outer continental shelf. Eventually, it descends the continental slope, thereby culminating in the formation of AABW (Tamura et al., 2008; Gordon et al., 2015).
Recent observations indicate that the Joides Basin and Joides Trough in the WRS play a pivotal role in the northward advection of DSW generated within the region. Conversely, the Glomar Challenger Basin and areas east of Pennell Trough do not exhibit the presence of this water mass (Gordon et al., 2015). Interestingly, this spatial distribution pattern of DSW closely aligns with the EM3/(EM3+EM4) ratio depicted in our findings (Figure 7B). Hence, we deduce that the stronger activity of bottom currents in the WRS is primarily governed by the formation and transport of DSW.
6.2 Sediment provenances
6.2.1 Clay minerals
Clay minerals in marine sediment serve as valuable indicators of sediment origin due to their small grain-size, enabling easy transportation and distribution through various media (Hillenbrand et al., 2003; Liu et al., 2003; Liu et al., 2007). Illite and chlorite are commonly found in high-latitudes of the Southern Ocean as a result of physical weathering and glacial erosion of basement rocks in Antarctica (Chamley, 1989; Ehrmann, 1991; Ehrmann, 1998). Illite originates from acidic rocks including granulites, gneisses, and granites. Chlorite is derived from igneous and metamorphic rocks that contain chlorite (Chamley, 1989; Hillenbrand et al., 2003). In contrast, smectite and kaolinite form by chemical weathering. Smectite forms through hydrolysis in environments with slow water movement and is often associated with volcanic regions in the Southern Ocean (Petschick et al., 1996). Kaolinite develops through extensive hydrolysis of feldspars in humid and warm environments (Chamley, 1989). The occurrence of kaolinite around Antarctica is usually related to recycling of ancient sediment (Junttila et al., 2005; Borchers et al., 2011).
To identify the source areas of the clay minerals in our samples, we utilized S-IC-K and S-I-C ternary diagrams to analyze our surface sediment data alongside a compilation of previously published data (Figures 10A, B). In the S-IC-K diagram, we observed that surface sediments from the WRS were closer to the IC apex, while those from the Eastern and CRS were closer to the S apex. All samples followed a line adjacent to the IC-S edge (Figure 10A). In the I-S-C diagram, we found that the WRS samples were nearer the I-C edge, while the ERS and CRS samples were closer to the S vertex. Additionally, all samples fell along a line perpendicular to the I-C edge roughly in the middle of the diagram (Figure 10B). These diagrams indicate that the studied sediments were the result of binary mixing between two end-members: an illite- and chlorite-rich end-member, and a smectite-rich end-member. Notably, neither of the end-members overlaps with the clay mineral composition of the surface sediments from the continental shelf north of Marie Byrd Land (Figures 10A, B), suggesting a minimal contribution from the Amundsen Sea via the westward flowing Antarctic Coastal and Slope Currents. Additionally, the contribution of the clay fraction by impinging MCDW from the north could be ruled out as well since the outer shelf samples are located between the two identified end-members in the diagrams. Thus, we conclude that both the illite- and chlorite-rich end-member and the smectite-rich end-member were primarily originated from the Ross Sea Embayment itself, which is consistent with the results of Nd and Sr isotopic analyses conducted on the clay-sized fractions of the surface sediments within the investigated region by Shao et al. (2022).
Figure 10
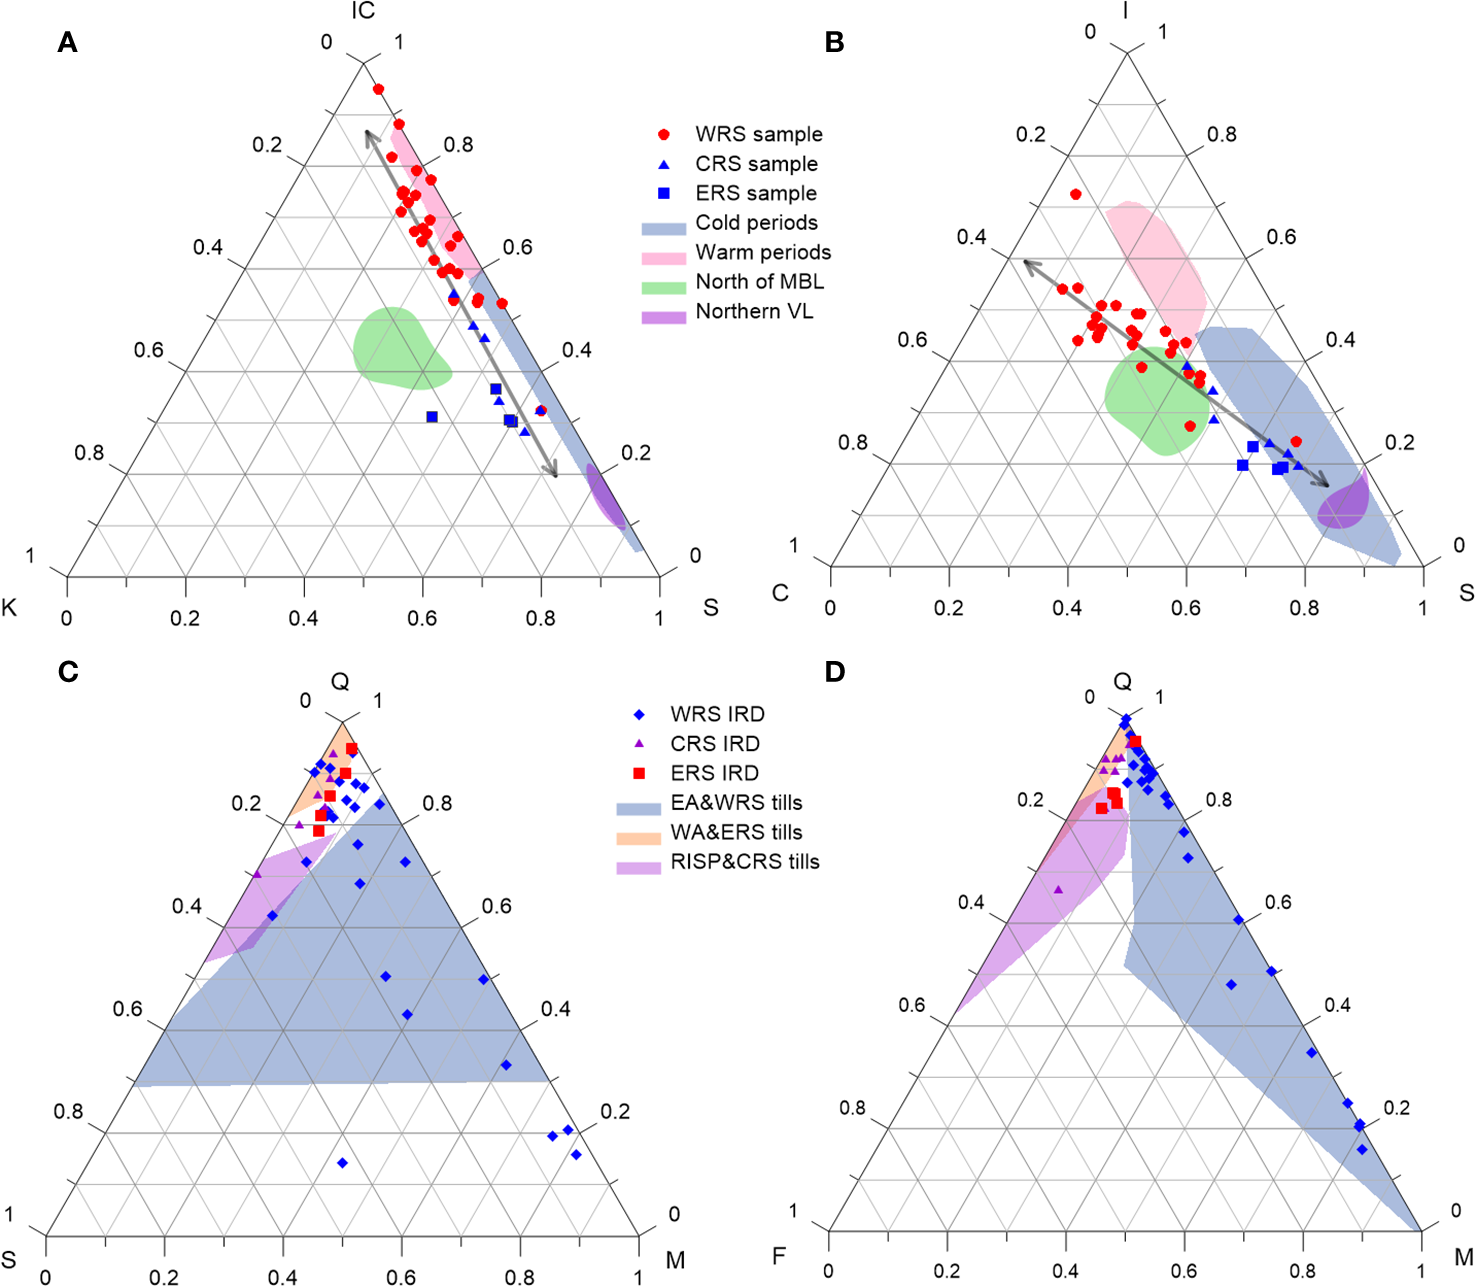
Ternary diagrams depicting (A) S-IC-K, (B) S-I-C, (C) Q-M-S, and (D) Q-M-F compositions. S, IC, K, and C in (A, B) represent smectite, illite plus chlorite, kaolinite, and chlorite, respectively. Q, S, M, and F in (C, D) represent quartz, sedimentary rocks, mafic rock grains, and feldspars, respectively. The light green shades in (A, B) represent clay mineral compositions of shelf sediments north of MBL (Marie Byrd Land) (Hillenbrand et al., 2003), while the light pink, light blue, and purple shades indicate clay mineral compositions of Cenozoic sediments from the McMurdo Sound (Ehrmann et al., 2003) and sediments from the northernmost coast of Victoria Land (Orombelli et al., 1990). The double arrows in these diagrams depict the binary mixing trends of clay mineral compositions. In (C, D), the light orange, light purple, and light blue shades represent compositions of tills from West Antarctica & ERS (ERS), RISP sites and CRS (CRS), and East Antarctica & WRS (WRS) according to Licht et al. (2005).
The examination of Cenozoic sediment sequences from McMurdo Sound, as documented in previous studies, reveals a correlation between warmer climate conditions and higher concentrations of illite and chlorite, while colder climate conditions are associated with higher concentrations of smectite (Figures 10A, B; Ehrmann et al., 2003). The illite and chlorite components are believed to originate from the Beacon Supergroup on the Southern Victoria Land coast, whereas the smectite component is thought to derive from areas where the McMurdo Volcanic Group outcrops. Our findings support an East Antarctic craton origin for the significant abundance of illite and chlorite in our samples from the WRS, particularly in close proximity to the Southern Victoria Land (Figures 4A, C). However, the overall declining trend of smectite from east to west (Figure 4B) contradicts the notion of a potential origin from the McMurdo Volcanic Group which is located in the WRS (Figure 1B). Instead, it is more reasonable to interpret the spatial distribution of smectite as originating from beneath the glaciers of West Antarctica. This is supported by the presence of Cenozoic mafic volcanic structures beneath the glacier systems that drain into the Ross Sea from the WAIS (Behrendt et al., 1995; Behrendt et al., 2004), as well as the elevated levels of smectite found in tills derived from the Bindschadler Ice Stream and MachAyeal Ice Stream (Figure 1A; Balshaw, 1981). Nevertheless, the sporadic occurrence of high smectite levels in front of Ross Island and near the northernmost coast of Victoria Land likely originates locally due to their proximity to the McMurdo Volcanic Group (Figure 1B). Our study thus highlights the need for caution when considering the origin of smectite in sedimentary records from the Ross Sea, given its potential multiple sources.
The consistency between kaolinite and smectite in terms of spatial distributions in the ERS (Figures 4B, D) may suggest that they were derived from spatially adjacent sources beneath the WAIS. This is supported by the occurrence of kaolinite in sediments from the Amundsen Sea continental shelf where clay minerals were mainly derived from beneath the WAIS as well (Hillenbrand et al., 2003), and the absence of kaolinite from sedimentary records in the WRS (Figure 10A). The lower kaolinite abundance in our samples compared to the sediments from Amundsen Sea indicates less entrainment of ancient chemically weathered sediments filled in the West Antarctica basin (Rooney et al., 1988) by glaciers draining into Ross Sea from the WAIS.
The congruity in spatial distributions between kaolinite and smectite within the ERS (Figures 4B, D) implies that they were likely originated from neighboring sources beneath the WAIS. This is reinforced by the presence of kaolinite in sediments collected from the Amundsen Sea continental shelf, where clay minerals are predominantly derived from beneath the WAIS as well (Hillenbrand et al., 2003), and the absence of kaolinite in sedimentary records within the WRS (Figure 10A; Ehrmann et al., 2003). The lower abundance of kaolinite in our samples, in comparison to the sediments from the Amundsen Sea, suggests a reduced incorporation of ancient chemically weathered sediments, which fill the basin of West Antarctica (Rooney et al., 1988), by glaciers draining into the Ross Sea from the WAIS.
6.2.2 Coarse fractions
The region surrounding the Ross Sea is predominantly covered by thick ice sheets, but exposed outcrops reveal the intricate lithologies of the bedrock. The uneven distribution of rock outcrops presents an opportunity to follow the origin of the coarse-grained IRD through an analysis of its lithological composition (Licht et al., 2005). Despite the intricate and diverse composition within the coarse fraction, Factor Analyses indicate the presence of only three primary components (Figure 6), characterized by high levels of angular and rounded quartz, mafic rock grains, and deformed silt, respectively. These components are likely associated with three main sources that dominate the coarse fraction, enabling the provenance analyses of the coarse fraction to be simplified as based on them.
Factor 1, as evidenced by high loadings of both angular and rounded quartz (Figure 6C), is likely derived from acidic source rocks. In the Antarctic region, quartz is commonly enriched in the IRD fractions compared to other minerals due to its high mechanical hardness, rendering it resistant to breakage during glacial grinding and retains a larger particle size (Wu et al., 2020). Licht et al. (2005) observed that tills beneath the Kamb Ice Stream and Whillans Ice Stream (Figure 1A) contained a high abundance of both angular and rounded quartz but almost an absence of mafic volcanic rocks, despite Cenezoic volcanoes being scattered beneath these glaciers. Furthermore, quartz was the most abundant mineral species in till samples across the ERS and CRS during the Last glacial periods (Figures 10C, D), possibly eroded from the Granite Harbor Intrusives, as well as the granodiorite and granite of Marie Byrd Land (Figure 1B; Licht et al., 2005). In our samples, Factor 1 is predominantly present in the ERS and CRS regions and extends to the central Victoria Land coast. Additionally, in the Q-M-S and Q-M-F diagrams, our ERS and CRS samples mostly occupy the domains of the West Antarctic & ERS tills and the RISP (RIS Drilling Project; Licht et al., 2005) tills, supporting that the quartz-enriched Factor 1 represents a source of icebergs originating from West Antarctica.
Factor 2, characterized by a significant presence of mafic igneous rock grains, is likely indicative of materials primarily derived from a basic volcanic region. Tills in East Antarctica exhibit varying lithologies in comparison to those in West Antarctica (Figures 10C, D), reflecting the diverse composition of bedrock throughout the Transantarctic Mountains (Figure 1B). However, a substantial mafic component is consistently found in most East Antarctic tills, which is believed to originate from the Ferrar Group (Licht et al., 2005). In the Q-M-F ternary diagram, our samples from the WRS align well with the East Antarctic & WRS tills (Figure 10D). In the Q-M-S diagram, however, these samples disperse over a broader range than the East Antarctic & WRS tills (Figure 10C). Some WRS samples display higher quartz content compared to the remaining samples from the WRS, and their distribution tends to overlap with the West Antarctic & ERS tills, indicating a mixture of materials transported by icebergs from both West and East Antarctica. These particular samples are located between 74°S and 75°S in the WRS (Figure 5B). In contrast, certain WRS samples contain a significantly higher proportion of mafic rock grains than the tills from East Antarctica and the WRS, suggesting an additional source of mafic igneous rocks. These samples are situated between 72°S and 73°S, as well as between 76°S and 78°S (Figure 5C), close to areas where the McMurdo Volcanic Group is exposed (Figure 1). This suggests that the McMurdo Volcanic Group may contribute significantly to the modern IRD found in the WRS.
The moderate scores (0.1-0.2) observed in Factor 2 within the ERS area likely correspond to the presence of Cenozoic mafic volcanic structures underlying the glacier systems that drain into the Ross Sea from the WAIS. However, an apparent discrepancy arises when considering that there is a high abundance of smectite in the clay fraction but a disproportionately low amount of mafic rock grains in the ERS. It has been proposed by Behrendt et al. (1995); Behrendt et al. (2004) that (ancient) glacial erosion likely planed off the mafic volcanic structures in West Antarctica before the development of the current ice streams. Rooney et al. (1988) suggest that the West Antarctic basin, which lies beneath the WAIS, is filled with glacial and marine sediments up to a kilometer thick, masking the volcanic structures. Consequently, the coarse mafic rock grains may be more commonly found in older successions beneath West Antarctica (Licht et al., 2005), making it less accessible to the present glaciers.
Factor 3 exhibits a prominent abundance of deformed silt, which comprises coarse-grained materials that form during the stabilization of a glacier at its grounding zone (Cowan et al., 2012). The prevalence of these materials within the sediment indicates the proximity of the sediment location to a glacier grounding zone (Cowan et al., 2012). Geospatially, the highest score in Factor 3 is primarily observed in the David Glacier-Drygalski Ice Tongue (DG-DIT) area, providing strong evidence for its derivation from beneath this specific glacier system.
The DG-DIT system represents the largest outlet glacier within the Victoria Land section of the EAIS (Frezzotti and Mabin, 1994). Over the past century, this system has undergone numerous calving events (Frezzotti and Mabin, 1994). Consequently, as glaciers detach from this ice tongue, they have a propensity to incorporate deformed silt as basal debris and subsequently disperse it along their drifting trajectories.
To summarize, the clay minerals and coarse fraction (IRD) found in the surface sediments of Ross Sea were sourced from both the West Antarctica and East Antarctica. Provenance analysis exhibits a complementary spatial distribution pattern for these two sediment components. Considering that approximately 50% of the mass loss of the Antarctic Ice Sheet is through iceberg calving (Depoorter et al., 2013), these findings collectively indicate that both the WAIS and the EAIS, which discharge into the Ross Sea Embayment, have maintained a high level of dynamism under the modern climatic conditions.
7 Conclusions and summary
In this investigation, we carried out a series of measurements and analysis on sediment samples collected from the Ross Sea continental shelf to examine the provenance and delivery mode of sediments in the modern Ross Sea environment. We focused on grain-size distribution, lithology of the coarse fraction (>250 μm), and clay mineral composition. Based on our findings, we have made the following main conclusions:
(1) The grain-size distributions of the studied sediments display significant variations. Through EMMA analysis, we identified four distinct sediment types associated with different delivery mechanisms: poorly sorted IRD, well-sorted IRD, and sediments transported by relatively strong and weak bottom currents.
(2) The transport and deposition of IRD in Ross Sea are influenced by factors such as water depth, proximity to the iceberg source area, and seawater temperature resulting from MCDW intrusion. Well-sorted IRD (EM2) originates from sandy beaches in the WRS and is delivered by relatively small icebergs, whereas at least some of the poorly sorted IRD (EM1) originates from large icebergs calved from the RIS.
(3) The EMMA-derived index EM3/(EM3+EM4) reflects relative changes in bottom current strength in the investigated area. It reveals that the WRS experiences stronger bottom current activity compared to the ERS, particularly in the Joides Basin, Joides Trough, and near the northernmost Victoria Land. These findings reflect formation and northward transport of DSW.
(4) The studied sediments contain a high proportion of illite and smectite, a moderate level of chlorite, and a small quantity of kaolinite. These clay minerals primarily originate from the Ross Sea Embayment itself through a binary mixing process. Illite and chlorite predominantly came from the East Antarctic craton, whereas smectite and kaolinite were mainly originated from beneath the WAIS. Additionally, smectite can also be contributed by the McMurdo Volcanic Group.
(5) Factor Analysis on the lithology of the coarse fraction identified three major sources characterized by a high abundance of quartz-rich grains, mafic igneous rock-rich grains, and deformed silt, respectively. The quartz-rich and mafic igneous rock-rich components are predominantly distributed in the ERS and WRS, originating from West Antarctica and East Antarctica, respectively. The deformed silt is mainly found near the David Glacier-Dragalski Ice Tongue system, highlighting the dynamic nature of this system.
In summary, our findings support the notion that the WRS plays a crucial role as a source area for the formation of AABW. Moreover, our study reveals the dynamic nature of the glaciers draining into the Ross Sea from both the EAIS and WAIS, underscoring their potential contribution to future sea level rise under ongoing climate warming conditions.
Statements
Data availability statement
The original contributions presented in the study are included in the article/Supplementary Material. Further inquiries can be directed to the corresponding author.
Author contributions
LW: Conceptualization, Data curation, Formal Analysis, Funding acquisition, Investigation, Methodology, Project administration, Visualization, Writing – original draft. LL: Data curation, Methodology, Software, Visualization, Writing – review & editing. RW: Data curation, Funding acquisition, Resources, Supervision, Validation, Writing – review & editing. HS: Software, Validation, Visualization, Writing – review & editing. YC: Data curation, Methodology, Visualization, Writing – review & editing. ZL: Data curation, Methodology, Software, Visualization, Writing – review & editing. YL: Data curation, Methodology, Software, Validation, Visualization, Writing – review & editing. WX: Data curation, Resources, Supervision, Validation, Writing – review & editing. RX: Data curation, Methodology, Validation, Visualization, Writing – review & editing.
Funding
The author(s) declare financial support was received for the research, authorship, and/or publication of this article. We declare that all sources of funding received for this research have been submitted. LW acknowledges the support from the Chinese National Natural Science Foundation (Grant No. 42276077) and the Open Fund of State Key Laboratory of Marine Geology, Tongji University (Grant No. MGK202207). RW is grateful for the financial support provided by the Chinese National Natural Science Foundation (Grant No. 42030401).
Acknowledgments
We express our deep gratitude to the participants of the 31st-35th Chinese Antarctic Expedition cruise for their assistance in sample retrieval. We also sincerely thank the two reviewers for their constructive comments and suggestions that helped to improve the manuscript and Editor Dr. Qi Di for efficiently handling our manuscript.
Conflict of interest
The authors declare that the research was conducted in the absence of any commercial or financial relationships that could be construed as a potential conflict of interest.
Publisher’s note
All claims expressed in this article are solely those of the authors and do not necessarily represent those of their affiliated organizations, or those of the publisher, the editors and the reviewers. Any product that may be evaluated in this article, or claim that may be made by its manufacturer, is not guaranteed or endorsed by the publisher.
Supplementary material
The Supplementary Material for this article can be found online at: https://www.frontiersin.org/articles/10.3389/fmars.2023.1324391/full#supplementary-material
References
1
AbuodhaJ. O. Z. (2003). grain-size distribution and composition of modern dune and beach sediments, Malindi Bay coast, Kenya. J. Afr. Earth Sci.36, 41–54. doi: 10.1016/S0899-5362(03)00016-2
2
AndersonJ.BrakeC.MyersN. (1984). Sedimentation on the ross sea continental shelf, Antarctica. Mar. Geol.57, 295–333. doi: 10.1016/0025-3227(84)90203-2
3
AndersonJ.SimkinsL.BartP.SantisL.HalberstadtA. R.OlivoE.et al. (2018). Seismic and geomorphic records of Antarctic Ice Sheet evolution in the Ross Sea and controlling factors in its behaviour. Geological Society London Special Publications475, 223–240. doi: 10.1144/SP475.5
4
AndrewsJ.DomackE.CunninghamW.LeventerA.LichtK.JullA. J.et al. (1999). Problems and possible solutions concerning radiocarbon dating of surface marine sediments, Ross Sea, Antarctica. Quaternary Res.52, 206–216. doi: 10.1006/qres.1999.2047
5
BalshawK. (1981). Antarctic glacial chronology reflected in the Oligocene through Pliocene sedimentary section in the Ross Sea (Houston (IL: Rice University).
6
BarrettP. J. (1991). The Devonian to Jurassic Beacon Supergroup of the Transantarctic Mountains and correlatives in other parts of Antarctica. In: Tingey, R.J. (Ed.), The Geology of Antarctica. Oxford University Press, New York, pp. 120–152.
7
BehrendtJ.BlankenshipD.DamaskeD.CooperA. (1995). Glacial removal of late Cenozoic subglacially emplaced volcanic edifices by the West Antarctic ice sheet. Geology23, 1111–1114. doi: 10.1130/0091-7613(1995)023<1111:GROLCS>2.3.CO;2
8
BehrendtJ.BlankenshipD.MorseD.BellR. (2004). Shallow-source aeromagnetic anomalies observed over the West Antarctic Ice Sheet compared with coincident bed topography from radar ice sounding - New evidence for glacial "removal" of subglacially erupted late Cenozoic rift-related volcanic edifices. Global Planetary Change42, 177–193. doi: 10.1016/j.gloplacha.2003.10.006
9
BlackburnT.EdwardsG.TulaczykS.ScudderM.PiccioneG.HalletB.et al. (2020). Ice retreat in Wilkes Basin of East Antarctica during a warm interglacial. Nature583, 554–559. doi: 10.1038/s41586-020-2484-5
10
BorchersA.VoigtI.KuhnG.DiekmannB. (2011). Mineralogy of glaciomarine sediments from the Prydz Bay–Kerguelen region: relation to modern depositional environments. Antarctic Sci.23, 164–179. doi: 10.1017/S0954102010000830
11
BurckleL. H. (2001). Distribution of opal in surface sediments, compiled from different sources (PANGAEA). doi: 10.1594/PANGAEA.58365
12
ChamleyH. (1989). Clay sedimentology (Berlin: Springer), 623.
13
ColhounE. A.MabinM. C. G.AdamsonD. A.KirkR. M. (1992). Antarctic ice volume and contribution to sea-level fall at 20,000 yr BP from raised beaches. Nature358, 316–319. doi: 10.1038/358316a0
14
CookC.FlierdtT.WilliamsT.R HemmingS.IwaiM.KobayashiM.et al. (2013). Dynamic behaviour of the East Antarctic ice sheet during Pliocene warmth. Nat. Geosci.6, 765–769. doi: 10.1038/ngeo1889
15
CookC. P.HillD. J.van de FlierdtT.WilliamsT.HemmingS. R.DolanA. M.et al. (2014). Sea surface temperature control on the distribution of far-traveled Southern Ocean ice-rafted detritus during the Pliocene. Paleoceanography29, 533–548. doi: 10.1002/2014PA002625
16
CowanE.ChristoffersenP.PowellR. (2012). Sedimentological signature of A deformable bed preserved beneath an ice stream in A late pleistocene glacial sequence, Ross Sea, Antarctica. J. Sedimentary Res.82, 270–282. doi: 10.2110/jsr.2012.25
17
CowanE. A.HillenbrandC.-D.HasslerL. E.AkeM. T. (2008). Coarse-grained terrigenous sediment deposition on continental rise drifts: A record of Plio-Pleistocene glaciation on the Antarctic Peninsula. Palaeogeogr. Palaeoclimatol. Palaeoecol.265, 275–291. doi: 10.1016/j.palaeo.2008.03.010
18
CunninghamW. L.LeventerA. (1998). Diatom assemblages in surface sediments of the Ross Sea: relationship to present oceanographic conditions. Antarctic Sci.10, 134–146. doi: 10.1017/S0954102098000182
19
DeContoR. M.PollardD. (2016). Contribution of Antarctica to past and future sea-level rise. Nature531, 591–597. doi: 10.1038/nature17145
20
DelmonteB.BaroniC.AnderssonP. S.SchobergH.HanssonM.AciegoS.et al. (2010). Aeolian dust in the Talos Dome ice core (East Antarctica, Pacific/Ross Sea sector): Victoria Land versus remote sources over the last two climate cycles. J. Quaternary Sci.25, 1327–1337. doi: 10.1002/jqs.1418
21
DepoorterM. A.BamberJ. L.GriggsJ. A.LenaertsJ. T. M.LigtenbergS. R. M.van den BroekeM. R.et al. (2013). Calving fluxes and basal melt rates of Antarctic ice shelves. Nature502, 89–92. doi: 10.1038/nature12567
22
DrewryD. J. (1983). Antarctica: glaciological and geophysical folio (Cambridge University Press, Cambridge Scoot Polar Research Institute).
23
EdwardsT. L.BrandonM. A.DurandG.EdwardsN. R.GolledgeN. R.HoldenP. B.et al. (2019). Revisiting Antarctic ice loss due to marine ice-cliff instability. Nature566, 58–64. doi: 10.1038/s41586-019-0901-4
24
EhrmannW. U. (1991). Implications of sediment composition on the southern Kerguelen Plateau for paleoclimate and depositional environment. Proc. ODP Sci. Results119, 185–210. doi: 10.2973/odp.proc.sr.119.121.1991
25
EhrmannW. (1998). Implications of late Eocene to early Miocene clay mineral assemblages in McMurdo Sound (Ross Sea, Antarctica) on paleoclimate and ice dynamics. Palaeogeogr. Palaeoclimatol. Palaeoecol.139, 213–231. doi: 10.1016/S0031-0182(97)00138-7
26
EhrmannW.BloemendalJ.HambreyM. J.McKelveyB.WhiteheadJ. (2003). Variations in the composition of the clay fraction of the Cenozoic Pagodroma Group, East Antarctica: implications for determining provenance. Sedimentary Geol.161, 131–152. doi: 10.1016/S0037-0738(03)00069-1
27
FarmerL.LichtK.SwopeR.AndrewsJ. (2006). Isotopic constraints on the provenance of fine-grained sediment in LGM tills from the Ross Embayment, Antarctica. Earth Planetary Sci. Letters249, 90–107. doi: 10.1016/j.epsl.2006.06.044
28
FretwellP.PritchardH. D.VaughanD. G.BamberJ.BarrandN.BellR.et al. (2013). Bedmap2: improved ice bed, surface and thickness datasets for Antarctica. Cryosphere7, 375–393. doi: 10.5194/tc-7-375-2013
29
FrezzottiM.MabinM. (1994). 20th century behaviour of Drygalski Ice Tongue, Ross Sea, Antarctica. Ann. Glaciol.20, 397–400. doi: 10.3189/1994AoG20-1-397-400
30
GeS.ChenZ.LiuQ.WuL.ZhongY.LiuH.et al. (2022). Dynamic response of East Antarctic ice sheet to Late Pleistocene glacial–interglacial climatic forcing. Quaternary Sci. Rev.277, 107299. doi: 10.1016/j.quascirev.2021.107299
31
GilbertI. M.PudseyC. J.MurrayJ. W. (1998). A sediment record of cyclic bottom-current variability from the northwest Weddell Sea. Sedimentary Geol.115, 185–214. doi: 10.1016/S0037-0738(97)00093-6
32
GoodgeJ.FanningC. (1999). 2.5 b.y. of punctuated Earth history as recorded in a single rock. Geology27, 1007–1010. doi: 10.1130/0091-7613(1999)027<1007:BYOPEH>2.3.CO;2
33
GoodgeJ.MyrowP.WilliamsI.BowringS. A. (2002). Age and provenance of the beardmore group, Antarctica: constraints on rodinia supercontinent breakup. J. Geol.110, 393–406. doi: 10.1086/340629
34
GordonA.HuberB.BuseckeJ. (2015). Bottom water export from the WRS 2007 through 2010. Geophys. Res. Letters42, 5387–5394. doi: 10.1002/2015GL064457
35
HalberstadtA. R.SimkinsL.AndersonJ.ProthroL.BartP. (2018). Characteristics of the deforming bed: Till properties on the deglaciated Antarctic continental shelf. J. Glaciol.64, 1014–1027. doi: 10.1017/jog.2018.92
36
HauckJ.GerdesD.HillenbrandC.-D.HoppemaM.KuhnG.NehrkeG.et al. (2012). Distribution and mineralogy of carbonate sediments on Antarctic shelves. J. Mar. Systems90, 77–87. doi: 10.1016/j.jmarsys.2011.09.005
37
HillenbrandC.-D.GrobeH.DiekmannB.KuhnG.FüttererD. K. (2003). Distribution of clay minerals and proxies for productivity in surface sediments of the Bellingshausen and Amundsen seas (West Antarctica)–Relation to modern environmental conditions. Mar. Geol.193, 253–271. doi: 10.1016/S0025-3227(02)00659-X
38
HoltzapffelT. (1985). Les, minéraux argileux: préparation, analyse diffractométrique et determination. Société géologique du Nord.12, 1–36.
39
JacobsS. S.AmosA. F.BruchhausenP. M. (1970). Ross sea oceanography and antarctic bottom water formation. Deep Sea Res. Oceanographic Abstracts17, 935–962. doi: 10.1016/0011-7471(70)90046-X
40
JonkersL.BarkerS.HallI. R.PrinsM. A. (2015). Correcting for the influence of ice-rafted detritus on grain-size-based paleocurrent speed estimates. Paleoceanography30, 1347–1357. doi: 10.1002/2015PA002830
41
JunttilaJ.RuikkaM.StrandK. (2005). Clay-mineral assemblages in high-resolution Plio-Pleistocene interval at ODP Site 1165, Prydz Bay, Antarctica. Global Planetary Change45, 151–163. doi: 10.1016/j.gloplacha.2004.09.007
42
KlovanJ. E.MieschA. T. (1976). Extended CABFAC and QMODEL computer programs for Q-mode factor analysis of compositional data. Comput. Geosci.1, 161–178. doi: 10.1016/0098-3004(76)90004-2
43
KyleP. R. (1990). “McMurdo volcanic group western Ross Embayment,” in Volcanoes of the antarctic plate and Southern oceans. Eds. Le MasurierW. E.ThomsonJ. W. (Washington, DC: American Geophysical Union), 48–80.
44
LamyF.ArzH. W.KiliancR.LangeC. B.Lembke-JeneL.WenglerM.et al. (2015). Glacial reduction and millennial-scale variations in Drake Passage throughflow. Proc. Natl. Acad. Sci. United States America112, 13496–13501. doi: 10.1073/pnas.1509203112
45
LichtK. J.DunbarN. W.AndrewsJ. T.JenningsA. E. (1999). Distinguishing subglacial till and glacial marine diamictons in the WRS, Antarctica: Implications for a last glacial maximum grounding line. Geological Soc. America Bulletin111, 91–103. doi: 10.1130/0016-7606(1999)111<0091:DSTAGM>2.3.CO;2
46
LichtK. J.LedererJ. R.Jeffrey SwopeR. (2005). Provenance of LGM glacial till (sand fraction) across the Ross embayment, Antarctica. Quaternary Sci. Rev.24, 1499–1520. doi: 10.1016/j.quascirev.2004.10.017
47
LiuZ.TrentesauxA.ClemensS. C.ColinC.WangP.HuangB.et al. (2003). Clay mineral assemblages in the northern South China Sea: implications for East Asian monsoon evolution over the past 2 million years. Mar. Geol.201, 133–146. doi: 10.1016/S0025-3227(03)00213-5
48
LiuZ.ZhaoY.LiJ.ColinC. (2007). Late Quaternary clay minerals off Middle Vietnam in the western South China Sea: Implications for source analysis and East Asian monsoon evolution. Sci. China Ser. D: Earth Sci.50, 1674–1684. doi: 10.1007/s11430-007-0115-8
49
MarschalekJ.ZurliL.TalaricoF.FlierdtT.VermeeschP.CarterA.et al. (2021). A large West Antarctic ice sheet explains early neogene sea-level amplitude. Nature600, 450–455. doi: 10.1038/s41586-021-04148-0
50
McCaveI.AndrewsJ. (2019). Distinguishing current effects in sediments delivered to the ocean by ice. I. Principles, methods and examples. Quaternary Sci. Rev.212, 92–107. doi: 10.1016/j.quascirev.2019.03.031
51
McCaveI.CrowhurstS.KuhnG.HillenbrandC.MeredithM. (2014). Minimal change in Antarctic Circumpolar Current flow speed between the last glacial and Holocene. Nat. Geosci.7, 113–116. doi: 10.1038/ngeo2037
52
McCaveI.HallI. (2006). Size sorting in marine muds: Processes, pitfalls, and prospects for paleoflow-speed proxies. Geochem. Geophys. Geosystems7, 1–37. doi: 10.1029/2006GC001284
53
McCaveI. N.ThornalleyD. J. R.HallI. R. (2017). Relation of sortable silt grain-size to deep-sea current speeds: Calibration of the ‘Mud Current Meter. Deep Sea Res. Part I: Oceanographic Res. Pap.127, 1–12. doi: 10.1016/j.dsr.2017.07.003
54
McKayR.DunbarG.NaishT.BarrettP.CarterL.HarperM. (2008). Retreat history of the Ross Ice Sheet (Shelf) since the Last Glacial Maximum from deep-basin sediment cores around Ross Island. Palaeogeogr. Palaeoclimatol. Palaeoecol. - PALAEOGEOGR PALAEOCLIMATOL260, 245–261. doi: 10.1016/j.palaeo.2007.08.015
55
McKayR.SantisL.KulhanekD.AshJ.BenyF.BrowneI.et al. (2018). International Ocean Discovery Program: Expedition 374 Preliminary Report: Ross Sea West Antarctic Ice Sheet History: Ocean-ice sheet interactions and West Antarctic Ice Sheet vulnerability: clues from the Neogene and Quaternary record of the outer Ross Sea continental margin. Int. Ocean Discovery Program, 1–63. doi: 10.14379/iodp.pr.374.2018
56
MezgecK.StenniB.CrostaX.Masson-DelmotteV.BaroniC.BraidaM.et al. (2017). Holocene sea ice variability driven by wind and polynya efficiency in the Ross Sea. Nat. Commun.8, 1334. doi: 10.1038/s41467-017-01455-x
57
MyrowP. M.PopeM. C.GoodgeJ. W.FischerW.PalmerA. R. (2002). Depositional history of pre-Devonian strata and timing of Ross orogenic tectonism in the central TransantarcticMountains, Antarctica. GSA Bulletin 114 (9):1070–1088. doi: 10.1130/0016-7606(2002)114<1070:DHOPDS>2.0.CO;2
58
NaishT.PowellR.LevyR.WilsonG.SchererR.TalaricoF.et al. (2009). Obliquity-paced Pliocene West Antarctic ice sheet oscillations. Nature458, 322–328. doi: 10.1038/nature07867
59
NaishT. R.WoolfeK. J.BarrettP. J.WilsonG. S.AtkinsC.BohatyS. M.et al. (2001). Orbitally induced oscillations in the East Antarctic ice sheet at the Oligocene/Miocene boundary. Nature413, 719–723. doi: 10.1038/35099534
60
O'BrienP. E.LeitchenkovG. (1997). “Deglaciation of Prydz Bay, East Antarctica, based on echo sounding and topographic features,” in Geology and seismic stratigraphy of the Antarctic margin, 2, vol. 71 . Eds. BarkerP. F.CooperA. K. (American Geophysical Union), 109–126. doi: 10.1029/AR071p0109
61
OrombelliG.BaroniC.DentonG. H. (1990). Late cenozoic glacial history of the terra nova bay region, northern Victoria land, Antarctica. Geografia Fisica e Dinamica Quaternaria13, 139–163.
62
OrsiA.SmethieW.BullisterJ. (2002). On the total input of Antarctic Waters to the deep ocean: A preliminary estimate from chlorofluorocarbon measurements. J. Geophys. Res. (Oceans)107, 1–14. doi: 10.1029/2001JC000976
63
OrsiA.WiederwohlC. (2009). A recount of Ross Sea water. Deep Sea Res. Part II: Topical Stud. Oceanogr.56, 778–795. doi: 10.1016/j.dsr2.2008.10.033
64
PasschierS. (2011). Linkages between East Antarctic Ice Sheet extent and Southern Ocean temperatures based on a Pliocene high-resolution record of ice-rafted debris off Prydz Bay, East Antarctica. Paleoceanography26, PA4204. doi: 10.1029/2010PA002061
65
PattersonM. O.McKayR.NaishT.EscutiaC.Jimenez-EspejoF. J.RaymoM. E.et al. (2014). Orbital forcing of the East Antarctic ice sheet during the Pliocene and Early Pleistocene. Nat. Geosci.7, 841–847. doi: 10.1038/ngeo2273
66
PetschickR. (2000) MacDiff 4.2.2. Available at: http://servermac.geologie.un-frankfurt.de/Rainer.html.
67
PetschickR.KuhnG.GingeleF. (1996). Clay mineral distribution in surface sediments of the South Atlantic: sources, transport, and relation to oceanography. Mar. Geol.130, 203–229. doi: 10.1016/0025-3227(95)00148-4
68
PrinsM. A.BouwerL. M.BeetsC. J.TroelstraS. R.WeltjeG. J.KrukR. W.et al. (2002). Ocean circulation and iceberg discharge in the glacial North Atlantic: Inferences from unmixing of sediment size distributions. Geology30, 555–558. doi: 10.1130/0091-7613(2002)030<0555:OCAIDI>2.0.CO;2
69
PrinsM. A.WeltjeG. (1999). “End-member modeling of siliciclastic grain-size distributions: The late Quaternary record of aeolian and fluvial sediment supply to the Arabian Sea and its paleoclimatic significance,” in Numerical experiments in stratigraphy: Recent advances in stratigraphic and sedimentologic computer simulations, vol. 62. (SEPM (Society for Sedimentary Geology) Special Publication), 91–111. doi: 10.2110/pec.99.62.0091
70
PudseyC. J. (1992). Late quaternary changes in Antarctic bottom water velocity inferred from sediment grain size in the northern Weddell Sea. Mar. Geol.107, 9–33. doi: 10.1016/0025-3227(92)90066-Q
71
R.Schlitzer. (2014). Available at: https://odv.awi.de.
72
RignotE.BamberJ.MrV. D. B.DavisC.LiY.WjV. D. B.et al. (2008). Recent Antarctic ice mass loss from radar interferometry and regional climate modelling. Nat. Geosci.1, 106–110. doi: 10.1038/ngeo102
73
RooneyS.BlankenshipD.AlleyR.BentleyC. (1988). Seismic-reflection profiling of a widespread till beneath Ice Stream B, West Antarctica (Abstract). Ann. Glaciol.11, 210–210. doi: 10.3189/S0260305500006704
74
ShaoH.HeJ.WuL.WeiL. (2022). Elemental and Sr–Nd isotopic compositions of surface clay-size sediments in the front end of major ice shelves around Antarctica and indications for provenance. Deep Sea Res. Part II: Topical Stud. Oceanogr.195, 105011. doi: 10.1016/j.dsr2.2021.105011
75
SmithW. O.AinleyD. G.ArrigoK. R.DinnimanM. S. (2014). The oceanography and ecology of the Ross Sea. Annu. Rev. Mar. Sci.6, 469–487. doi: 10.1146/annurev-marine-010213-135114
76
SmithJ.GrahamA.PostA.HillenbrandC.-D.BartP.PowellR.et al. (2019). The marine geological imprint of Antarctic ice shelves. Nat. Commun.10, 5635. doi: 10.1038/s41467-019-13496-5
77
StevenardN.GovinA.KisselC.Van ToerA. (2023). Correction of the IRD influence for paleo-current flow speed reconstructions in hemipelagic sediments. Paleoceanogr. Paleoclimatol.38, e2022PA004500. doi: 10.1029/2022PA004500
78
StuutJ.-B. W.PrinsM. A.SchneiderR. R.WeltjeG. J.JansenJ.PostmaG. (2002). A 300-kyr record of aridity and wind strength in southwestern Africa: inferences from grain-size distributions of sediments on Walvis Ridge, SE Atlantic. Mar. Geol.180, 221–233. doi: 10.1016/S0025-3227(01)00215-8
79
TamuraT.OhshimaK. I.NihashiS. (2008). Mapping of sea ice production for Antarctic coastal polynyas. Geophys. Res. Letters35, L07606. doi: 10.1029/2007GL032903
80
TeitlerL.WarnkeD. A.VenzK. A.HodellD. A.BecqueyS.GersondeR.et al. (2010). Determination of Antarctic Ice Sheet stability over the last~500 ka through a study of iceberg-rafted debris. Paleoceanography25, PA1202. doi: 10.1029/2008PA001691
81
ToggweilerJ. R.RussellJ. L.CarsonS. R. (2006). Midlatitude westerlies, atmospheric CO2, and climate change during the ice ages. Paleoceanography21, PA2005. doi: 10.1029/2005PA001154
82
TurnbullI. (2006). Impact of the inverse barometer effect on iceberg drift in the Ross Sea Region, Antarctica. AGU Fall Meeting Abstracts.
83
WangJ.LiT.TangZ.XiongZ.LiuY.ChenZ.et al. (2022). Relating the composition of continental margin surface sediments from the Ross Sea to the Amundsen Sea, West Antarctica, to modern environmental conditions. Adv. Polar Sci.33, 55–70. doi: 10.13679/j.advps.2021.0005
84
WangR.PolyakL.XiaoW.WuL.LiW. (2023). Middle to Late Quaternary changes in ice rafting and deep current transport on the Alpha Ridge, central Arctic Ocean and their responses to climatic cyclicities. Global Planetary Change220, 104019. doi: 10.1016/j.gloplacha.2022.104019
85
WangR.XiaoW.MärzC.LiQ. (2013). Late Quaternary paleoenvironmental changes revealed by multi-proxy records from the Chukchi Abyssal Plain, western Arctic Ocean. Global Planetary Change108, 100–118. doi: 10.1016/j.gloplacha.2013.05.017
86
WeberM. E.ClarkP. U.KuhnG.TimmermannA.SprenkD.GladstoneR.et al. (2014). Millennial-scale variability in Antarctic ice-sheet discharge during the last deglaciation. Nature510, 134–138. doi: 10.1038/nature13397
87
WeltjeG. J. (1997). End-member modeling of compositional data: numerical-statistical algorithms for solving the explicit mixing problem. Math. Geol.29, 503–549. doi: 10.1007/BF02775085
88
WhitworthT.OrsiA. H. (2006). Antarctic Bottom Water production and export by tides in the Ross Sea. Geophys. Res. Letters33, L12609. doi: 10.1029/2006GL026357
89
WilsonD.BertramA.R.F.NeedhamE.FlierdtT.WelshK. J.et al. (2018). Ice loss from the East Antarctic Ice Sheet during late Pleistocene interglacials. Nature561, 383–386. doi: 10.1038/s41586-018-0501-8
90
WuS.Lembke-JeneL.LamyF.ArzH.NowaczykN.XiaoW.et al. (2021). Orbital- and millennial-scale Antarctic Circumpolar Current variability in Drake Passage over the past 140,000 years. Nat. Commun.12, 3948. doi: 10.1038/s41467-021-24264-9
91
WuL.WangR.KrijgsmanW.ChenZ.XiaoW.GeS.et al. (2019). Deciphering color reflectance data of a 520-kyr sediment core from the Southern ocean: method application and paleoenvironmental implications. Geochem. Geophys. Geosystems20, 2808–2826. doi: 10.1029/2019GC008212
92
WuL.WangR.XiaoW.KrijgsmanW.LiQ.GeS.et al. (2018). Late quaternary deep stratification-climate coupling in the Southern ocean: implications for changes in abyssal carbon storage. Geochem. Geophys. Geosystems19, 379–395. doi: 10.1002/2017GC007250
93
WuL.WilsonD. J.WangR.PasschierS.KrijgsmanW.YuX.et al. (2021). Late Quaternary dynamics of the Lambert Glacier-Amery Ice Shelf system, East Antarctica. Quaternary Sci. Rev.252, 106738. doi: 10.1016/j.quascirev.2020.106738
94
WuL.WilsonD. J.WangR.YinX.ChenZ.XiaoW.et al. (2020). Evaluating zr/rb ratio from XRF scanning as an indicator of grain-size variations of glaciomarine sediments in the Southern ocean. Geochem. Geophys. Geosystems21, e2020GC009350. doi: 10.1029/2020GC009350
Summary
Keywords
surface sediment, ross sea, grain-size, iceberg rafted debris, clay mineralogy
Citation
Wu L, Li L, Wang R, Shao H, Chen Y, Lin Z, Liu Y, Xiao W and Xu R (2024) Grain-size, coarse fraction lithology and clay mineral compositions of surface sediments from Ross Sea, Antarctica: implications for their provenance and delivery mode. Front. Mar. Sci. 10:1324391. doi: 10.3389/fmars.2023.1324391
Received
09 November 2023
Accepted
21 December 2023
Published
11 January 2024
Volume
10 - 2023
Edited by
Di Qi, Jimei University, China
Reviewed by
Liang Gao, China University of Geosciences, China
Jingteng Guo, Ministry of Natural Resources, China
Updates
Copyright
© 2024 Wu, Li, Wang, Shao, Chen, Lin, Liu, Xiao and Xu.
This is an open-access article distributed under the terms of the Creative Commons Attribution License (CC BY). The use, distribution or reproduction in other forums is permitted, provided the original author(s) and the copyright owner(s) are credited and that the original publication in this journal is cited, in accordance with accepted academic practice. No use, distribution or reproduction is permitted which does not comply with these terms.
*Correspondence: Rujian Wang, rjwang@tongji.edu.cn
Disclaimer
All claims expressed in this article are solely those of the authors and do not necessarily represent those of their affiliated organizations, or those of the publisher, the editors and the reviewers. Any product that may be evaluated in this article or claim that may be made by its manufacturer is not guaranteed or endorsed by the publisher.