 Xiang Zhao
 Tianlun Zheng2
 Na Song
 Yinquan Qu
 Tianxiang Gao
- 1The Key Laboratory of Mariculture, Ocean University of China, Ministry of Education, Qingdao, China
- 2Zhejiang Fisheries Technical Extension Center, Hangzhou, Zhejiang, China
- 3Fishery College, Zhejiang Ocean University, Zhoushan, Zhejiang, China
Pampus belongs to the Perciformes, Stromateoidei, and Stromateidae and are widely distributed throughout the Indian Ocean and the Western Pacific. In this study, we employed next-generation sequencing to generate comprehensive genomic data for Pampus punctatissimus and Pampus echinogaster and subsequently compared the obtained genomic information with the published data of Pampus argenteus. P. echinogaster was identified to be the largest genome size (602 Mb), heterozygosity (1.38%), and repetitive sequence ratio (33.06%), while similar genome sizes between P. punctatissimus (540 Mb) and P. argenteus (550 Mb) were observed. A total of 402,921 and 628,298 SSRs were identified for P. punctatissimus and P. echinogaster, respectively. Additionally, 1,876, 638, and 394 single-copy homologous genes were identified from P. punctatissimus, P. echinogaster, and P. argenteus, respectively. The KEGG enrichment results of the unique single-copy genes to the three species were significantly different in genetic information processing, protein processing, and metabolic functions. The complete mitochondrial genomes of P. punctatissimus and P. echinogaster were successfully assembled, and the resulting phylogenetic relationships align with the currently reported taxonomic status of species in the Stromateoidei. Additionally, population size analysis using PSMC revealed that P. punctatissimus experienced one bottleneck effect, while P. echinogaster underwent two bottleneck events during the Pleistocene Glacial Epoch.
1 Introduction
The Pampus fishes, classified under Perciformes, Stromateoidei, and Stromateidae, exhibit a wide distribution across the Indian Ocean and Western Pacific (Cui et al., 2011). All fishes of Pampus were economically important species and were found along the coast of China. The classification of Pampus fishes was further complicated due to their significant morphological similarity. Most fish taxonomists agree that Pampus included six species, namely, Pampus argenteus, Pampus punctatissimus, Pampus echinogaster, Pampus cinereus, Pampus chinensis, and Pampus minor (Cui et al., 2010; Karim et al., 2020). In 2013, Liu and Li (2013a) discovered a new species in the Pampus by comparison of morphological characteristics, named Pampus liuorum, and noted that this species had been previously misidentified as P. cinereus. Additionally, P. argenteus and P. echinogaster exhibit remarkable morphological similarities, prompting Liu and Li (2013b) to meticulously delineate the distinguishing characteristics of the former species. Recently published studies have predominantly focused on P. argenteus, encompassing investigations into its early developmental characteristics, biological properties, and gene functionality, among other aspects (Gao et al., 2020; Al-Abdul-Elah et al., 2021; Wang et al., 2021; Yang et al., 2021a; Yang et al., 2021b). Researchers have employed diverse molecular markers to investigate disparities among Pampus species. Yin et al. (2019) utilized 17,292 single-copy nuclear-encoded loci and cytochrome c oxidase subunit I (COI) sequences to investigate the phylogenetic relationships of Pampus, providing a valuable reference for Pampus classification. Wei et al. (2021) employed sequences of COI and cytochrome b (CYTB) to discriminate among seven Pampus species and authenticate their taxonomic validity. However, a single molecular marker has certain limitations in species identification (Li et al., 2013).
Recently developed rapidly high-throughput sequencing and bioinformatics analysis technology provide a practical approach to uncovering the species’ whole-genome information (Chen et al., 2020; Xu et al., 2020). Whole-genome data not only enable a fundamental genomic characterization of species (Lu et al., 2016; Bi et al., 2019) but also can be used to mine mitochondrial genomes, microsatellite markers, and single-copy homologous genes (Koprek et al., 2001; Gilbert et al., 2015; Ziya Motalebipour et al., 2016; Song et al., 2018; Van Dam et al., 2021). Furthermore, the utilization of whole-genome data from a single species can also facilitate the prediction of historical population dynamics. These data provided a new perspective for resolving differences between species.
In this study, whole-genome data of P. punctatissimus and P. echinogaster were obtained by using the Illumina sequencing technique. Meanwhile, we downloaded published whole-genome data of P. argenteus for comparative analysis (AlMomin et al., 2016). The aims of this study were (1) to compare the whole-genome features of the three species, (2) to utilize whole-genome data for the compilation of the mitochondrial genome and analysis of phylogenetic relationships among selected species within Stromateoidei, (3) to compare the number and distribution patterns of Simple Sequence Repeats (SSRs), (4) to extract single-copy homologous genes and resolve functional differences between species, and (5) to predict species historical dynamics. Our works uncover the differences among three Pampus species at the genome-wide level, which greatly enriches the genomic information of Pampus and provides a new case on the evolutionary biology and taxonomy.
2 Materials and methods
2.1 Ethics statement
This study does not involve the use of endangered or live animals. The P. punctatissimus and P. echinogaster samples utilized in this study were obtained from fishery production and were deceased at the time of collection. All animal experiments adhered to the guidelines and received approval from the Animal Research and Ethics Committees of the Ocean University of China.
2.2 Sample collection and genome survey sequencing
Samples of P. punctatissimus and P. echinogaster were collected in June and August 2021, respectively, in Zhoushan City, Zhejiang Province, China. The muscle tissues were preserved in 95% ethanol at -80°C, and the total genomic DNA was extracted using the standard phenol-chloroform method. The purity and concentration of DNA were detected by NanoDrop8000 microspectrophotometer and Qubit fluorometer, respectively. The high-quality DNA samples were randomly broken into fragments by Covaris ultrasonic crusher, and the whole library preparation was completed by end repair, the addition of A-tail, the addition of sequencing junction, purification, and PCR amplification. The constructed libraries were sequenced by Illumina Hiseq Nova for PE 150 (paired-end). The library construction and sequencing were performed at Wuhan Onemore-tech Co., Ltd., Wuhan, Hubei, China. The complete genomic sequencing data have been submitted to the Short Read Archive (SRA) database at the National Center for Biotechnology Information (NCBI) with accession number PRJNA853896.
2.3 Data analysis methods
In this study, raw sequencing data were processed using FASTP software to cut adaptor sequences and filter out sequences with a quality score <30 (Chen et al., 2018). After filtering out low-quality reads, we randomly selected 10,000 pairs of high-quality reads and aligned them to the NCBI nucleotide (NT) database, displaying the top 80% of identified species. All high-quality reads were utilized for K-mer analysis. K-mer calculations were performed using Jellyfish software, and K-mer frequency statistics tables were created (Marçais and Kingsford, 2011). Genome ploidy analysis was performed using Smudgeplot software (Ranallo-Benavidez et al., 2020). Genome heterozygosity and repeat ratios were calculated using GCE software (Liu et al., 2013). The estimation of genome size was performed by analyzing the K-mer distribution curve and identifying the peaks. The case with a K-mer depth of 1 is considered an error scenario, and the obtained error rate can be utilized for genome size correction. Revised genome size can be calculated as follows: Gsize = Nkmer/Ckmer × (1 – Error Rate), where Gsize represents the genome size, Nkmer denotes the total number of K-mer, and Ckmer signifies the peak depth.
Mitochondrial genomes were assembled from all clean sequencing reads using Mitofinder software (Allio et al., 2020) with the reference sequences downloaded from NCBI. The reference sequence accession numbers for P. punctatissimus and P. echinogaster were KF534725.1 and NC_023258.1, respectively. Assembled mitochondrial genomes were annotated using the MitoAnnotator of the Mitofish (http://mitofish.aori.u-tokyo.ac.jp/annotation/input.html). The mitochondrial genomes of 23 species belonging to 11 genera of Stromateoidei were retrieved from the NCBI database, encompassing a total of 13 protein-coding genes for subsequent phylogenetic analysis. Sequences were aligned using Clustal W, and a maximum likelihood tree (1,000 replicates) was constructed using MEGA X software (Kumar et al., 2018). SOAPdenovo2 software was used to assemble all clean reads into contigs and scaffolds (Luo et al., 2012). The Perl script “misa.pl” from the MISA software was utilized to identify microsatellite motifs in the de novo draft genome (Beier et al., 2017). The search parameters were configured to detect di-, tri-, tetra-, penta-, and hexanucleotide microsatellite motifs, requiring a minimum of 6, 5, 5, 5, and 5 repeats, respectively. Busco5 software was used to search single-copy homologous genes of P. argenteus, P. punctatissimus, and P. echinogaster (Simão et al., 2015). Single-copy homologous genes of each species were functionally annotated using eggNOG-Mapper based on Gene Ontology (GO) and Kyoto Encyclopedia of Genes and Genomes (KEGG) databases (Cantalapiedra et al., 2021). Subsequently, we calculated the single-copy genes specific to each species and performed KEGG enrichment analysis using the OmicShare tool (https://www.omicshare.com/tools/). Analysis of population size dynamics of P. punctatissimus and P. echinogaster was done using the Pairwise Sequentially Markovian Coalescent (PSMC) model, as implemented in the PSMC software (Li and Durbin, 2011). The “fq2psmcfa” and “splitfa” tools from the PSMC software were used to create the input file for the PSMC modeling. The reconstructed population history was plotted using “psmc_plot.pl” script using the substitution rate “-u 2.5e-8” and a generation time of 3 years.
3 Results
3.1 Whole-genome sequencing, k-mer analysis, and genome assembly
The indexes of the whole-genome sequencing data of the two species were shown in Table 1. The results of the NT database mapping revealed that randomly selected reads were successfully aligned with marine fish DNA, thereby demonstrating the absence of significant exogenous contamination in the data analyzed in this study (Figure 1). The 17-mer frequency distribution plot showed that P. echinogaster has an extremely obvious heterozygous peak (Figure 2). Both genomes of P. punctatissimus and P. echinogaster are diploid (Figure 3). The data on genome size, heterozygosity, and ratio of repetitive sequences were shown in Table 2. By comparison, P. echinogaster has a larger genome size, heterozygosity, and repetitive sequence ratio than the other two species, and P. argenteus has the lowest proportion of repetitive sequences. The measurements of total length, total number of sequences, maximum sequence length, N50 length, and N90 length for both contig and scaffold level genomes are presented in Table 3. By comparison, the total length, the total number of sequences, and the max length of sequences of P. echinogaster genome were larger than those of the genomes of the other two species, yet the N50 of P. echinogaster genome was relatively shorter than that of the other two species, especially for the length of scaffold N50.

Table 1 The indexes of the whole-genome sequencing data of the two species.
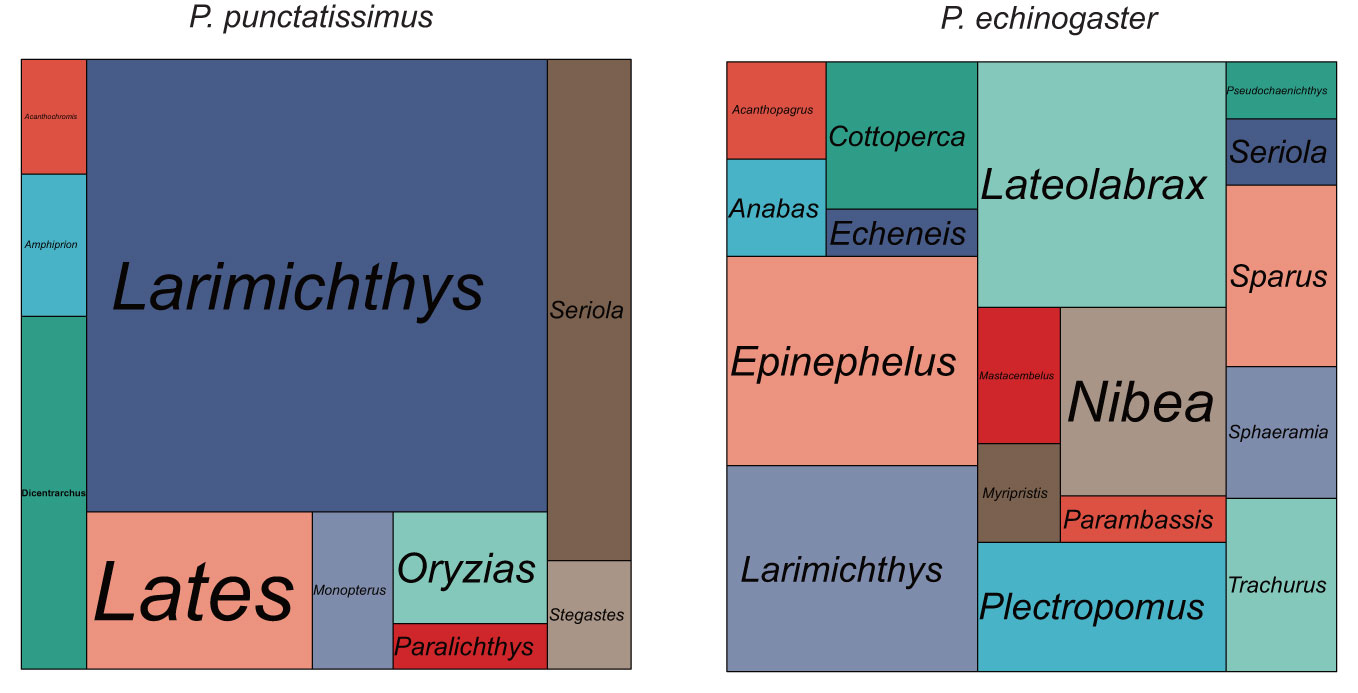
Figure 1 The size of each area in the mapping statistics corresponds to the number of reads that have been successfully aligned to the respective species.
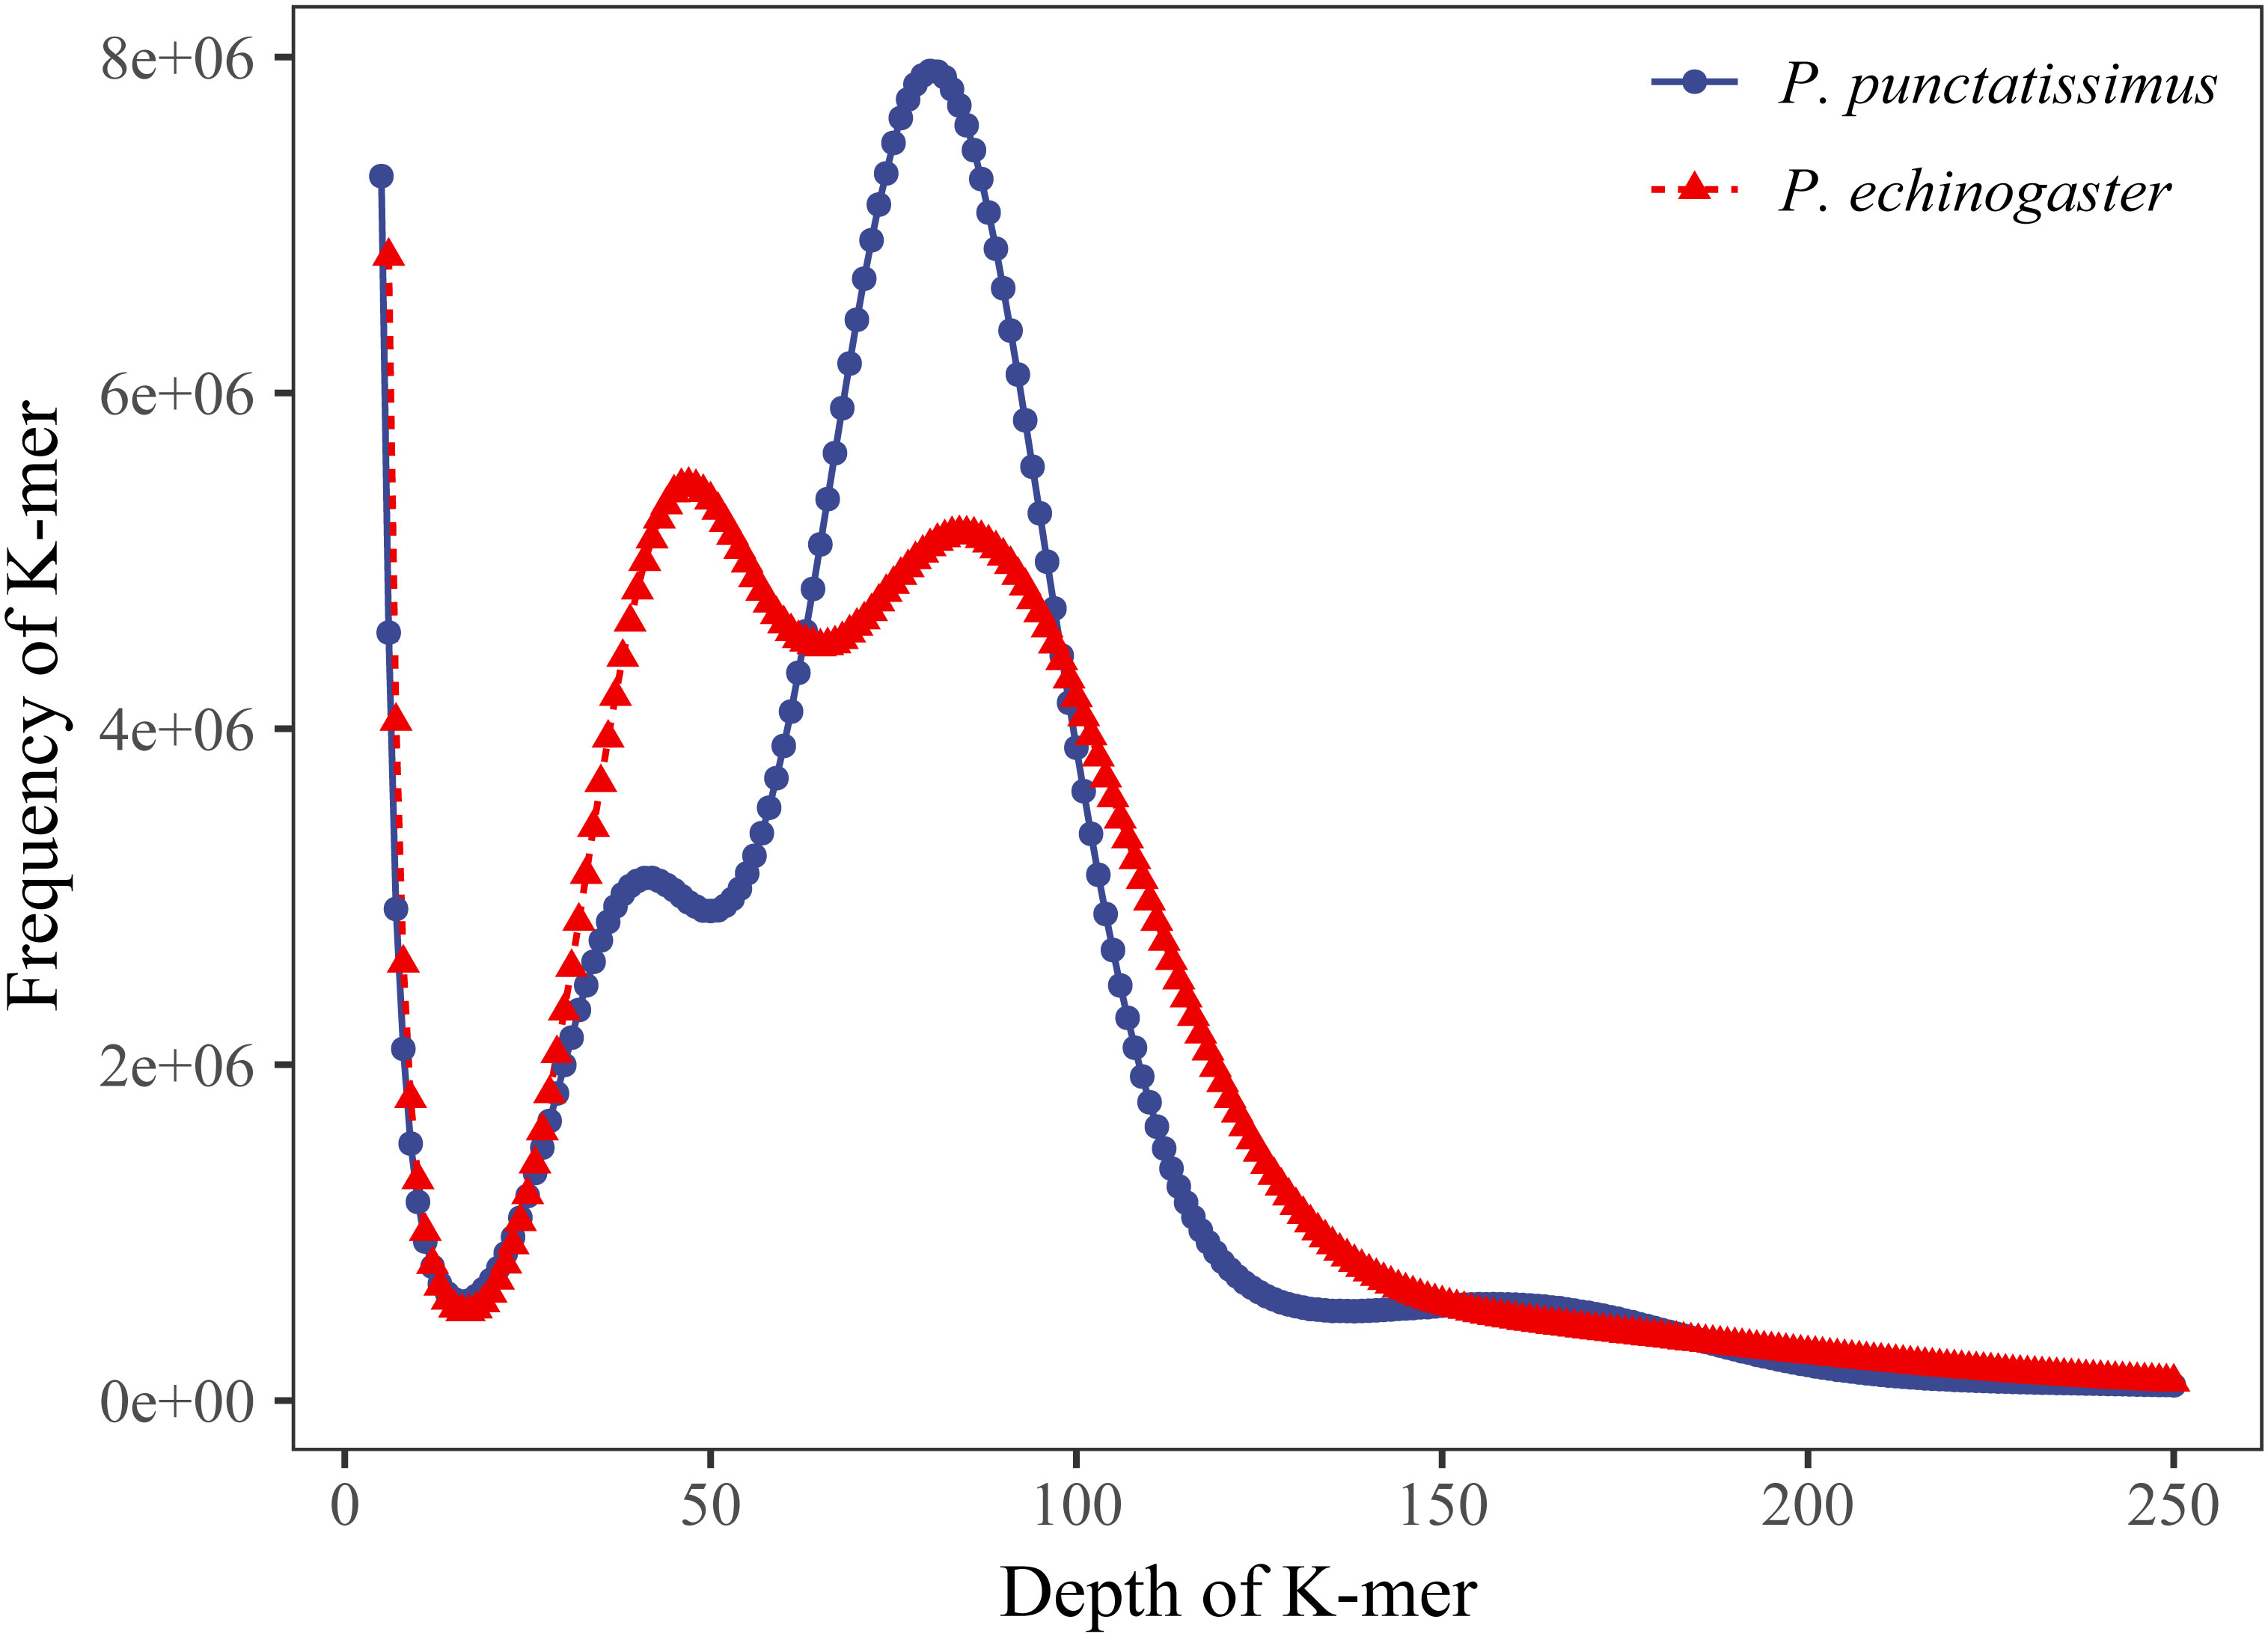
Figure 2 K-mer (17-mer) analysis for estimating the genome size of P. punctatissimus and P. echinogaster.
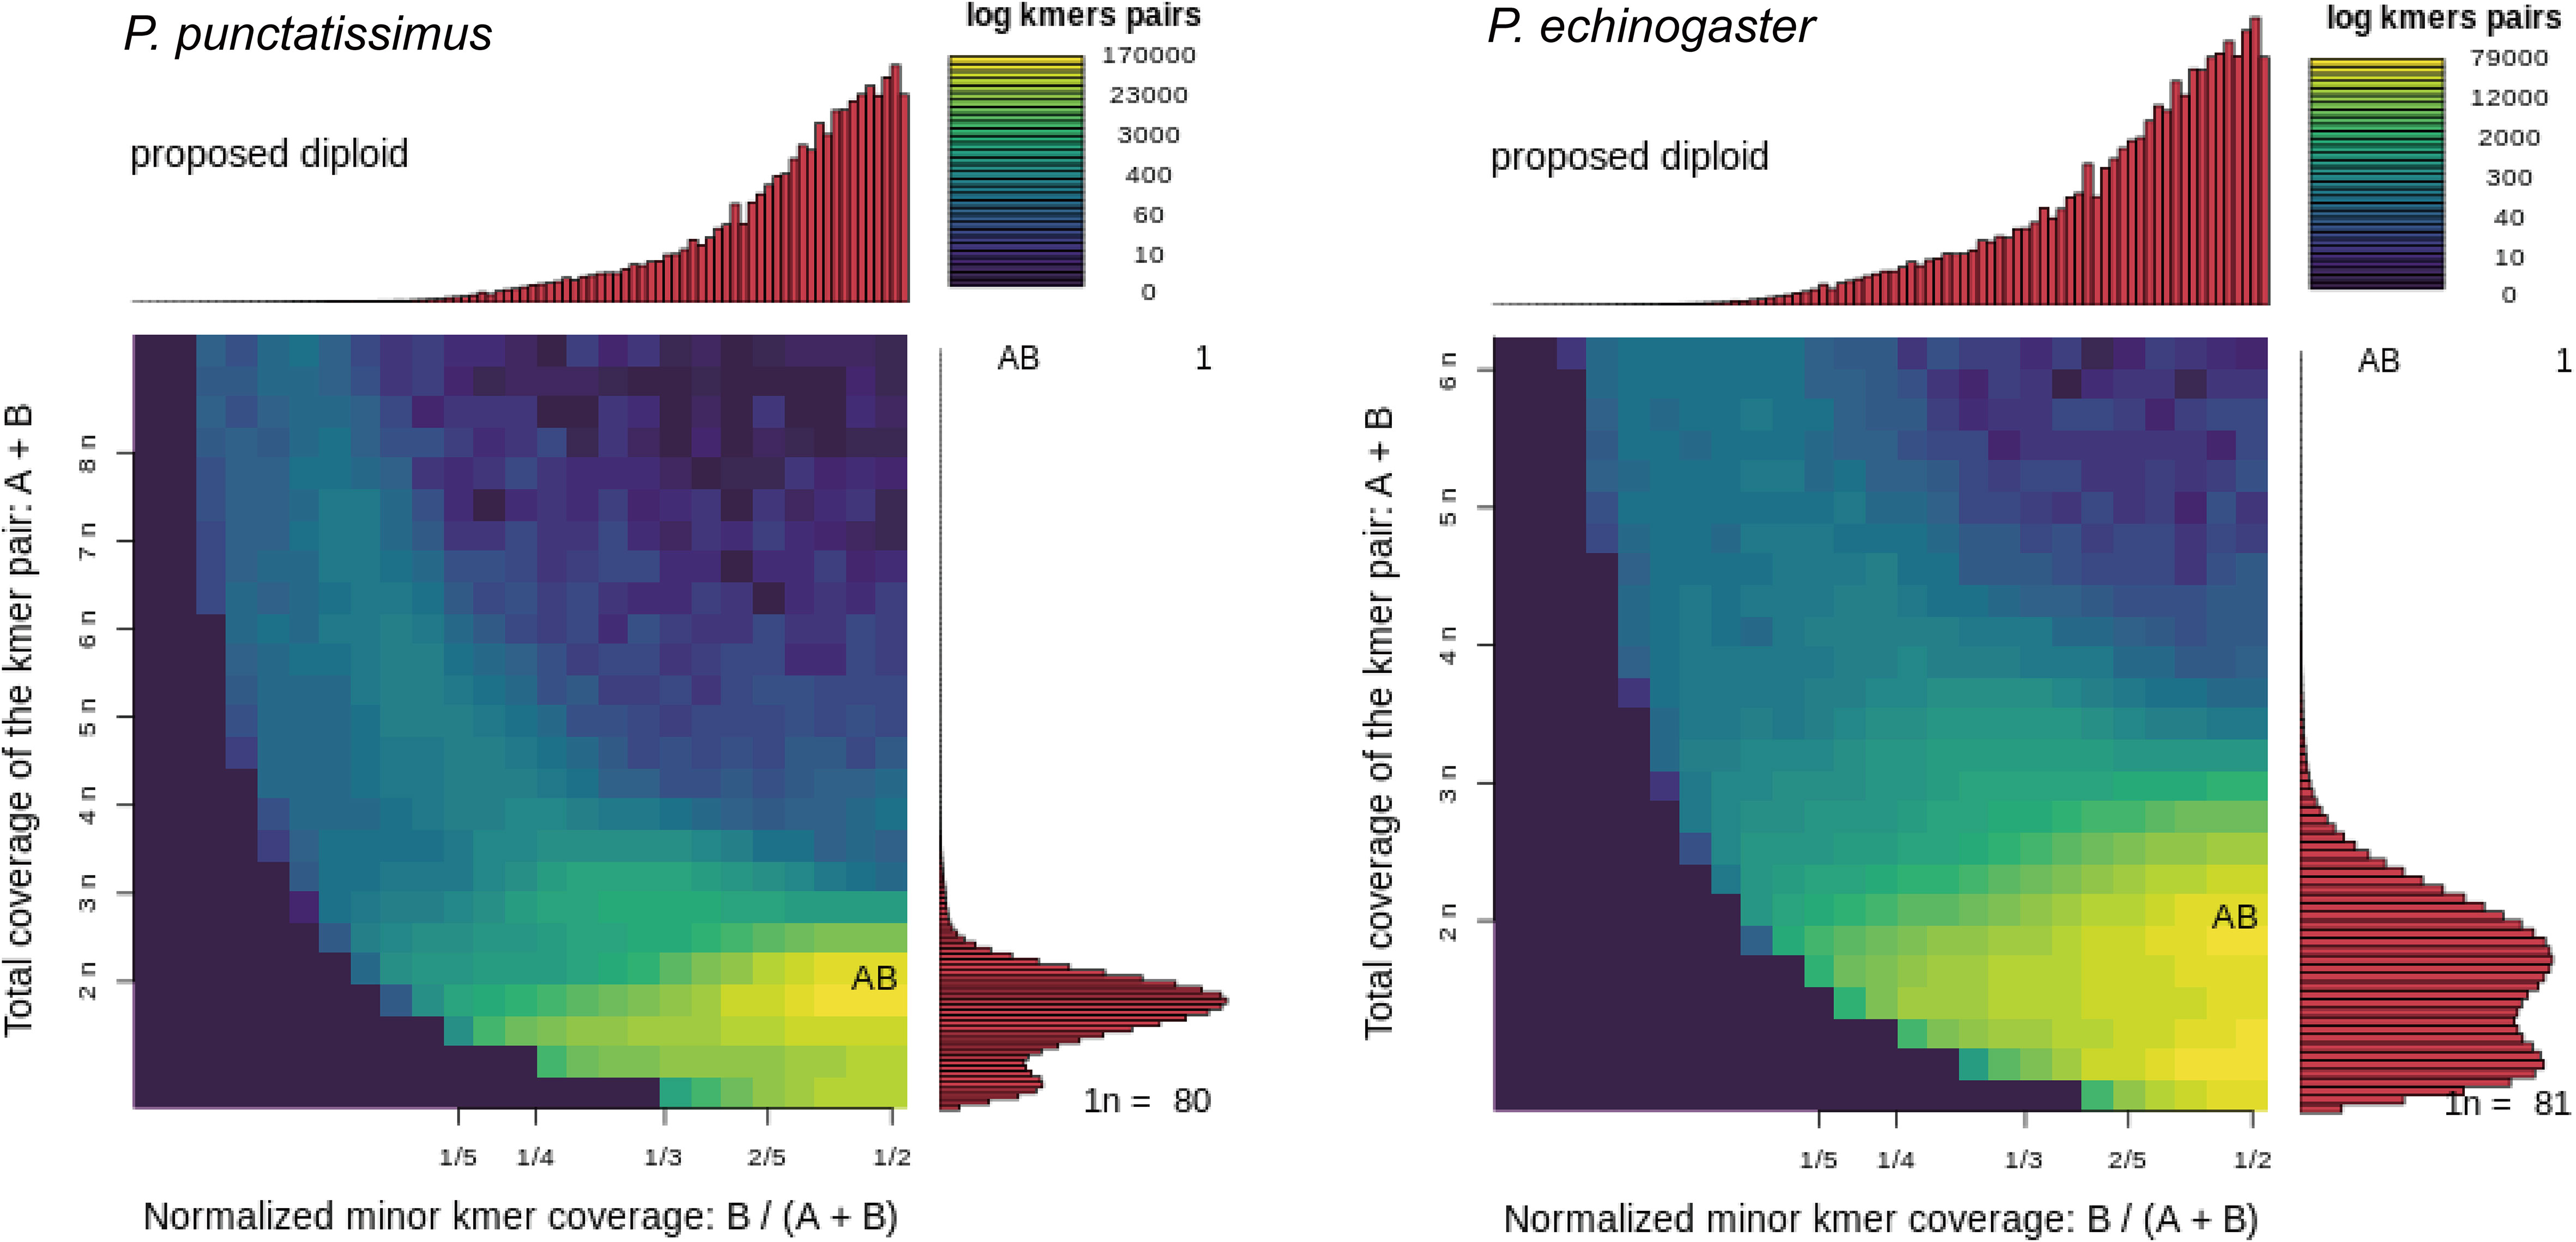
Figure 3 Genome ploidy level analysis of P. punctatissimus and P. echinogaster.
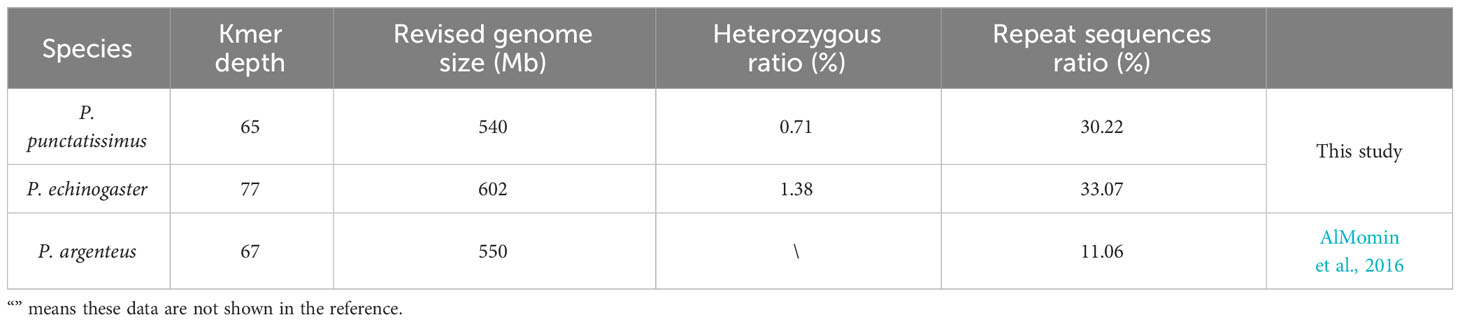
Table 2 The genome size, heterozygosity, and ratio of repetitive sequences of the three species.
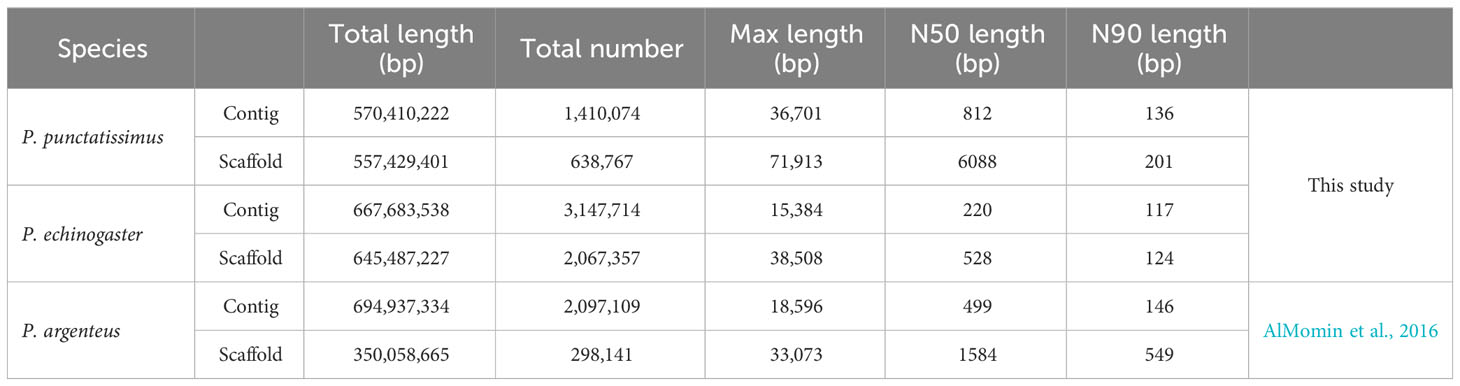
Table 3 The genome result of assembly in P. punctatissimus, P. echinogaster, and P. argenteus.
3.2 Identification and statistics of SSR molecular markers
Based on the assembled draft genome sequences, a total of 402,921 and 628,298 SSRs were identified for P. punctatissimus and P. echinogaster, respectively. Published data showed that the 172,938 SSRs were identified in the P. argenteus genome (Table 4). Therefore, the frequency of SSR distribution in the genomes of P. punctatissimus, P. echinogaster, and P. argenteus genomes was estimated to be approximately 714.75, 956.14, and 494.03 SSRs per Mb, respectively. The SSR motif types in the genome of P. punctatissimus comprised 81.61% dinucleotide, 12.62% trinucleotide, 4.10% tetranucleotide, 1.48% pentanucleotide, and 0.18% hexanucleotide repeats, while their respective frequencies were 80.01%, 13.45%, 5.04%, 1.34%, and 0.16% for di-, tri-, tetra-, penta-, and hexanucleotide repeats in P. echinogaster genome (Figure 4).

Table 4 Statistics of microsatellite recognition results.
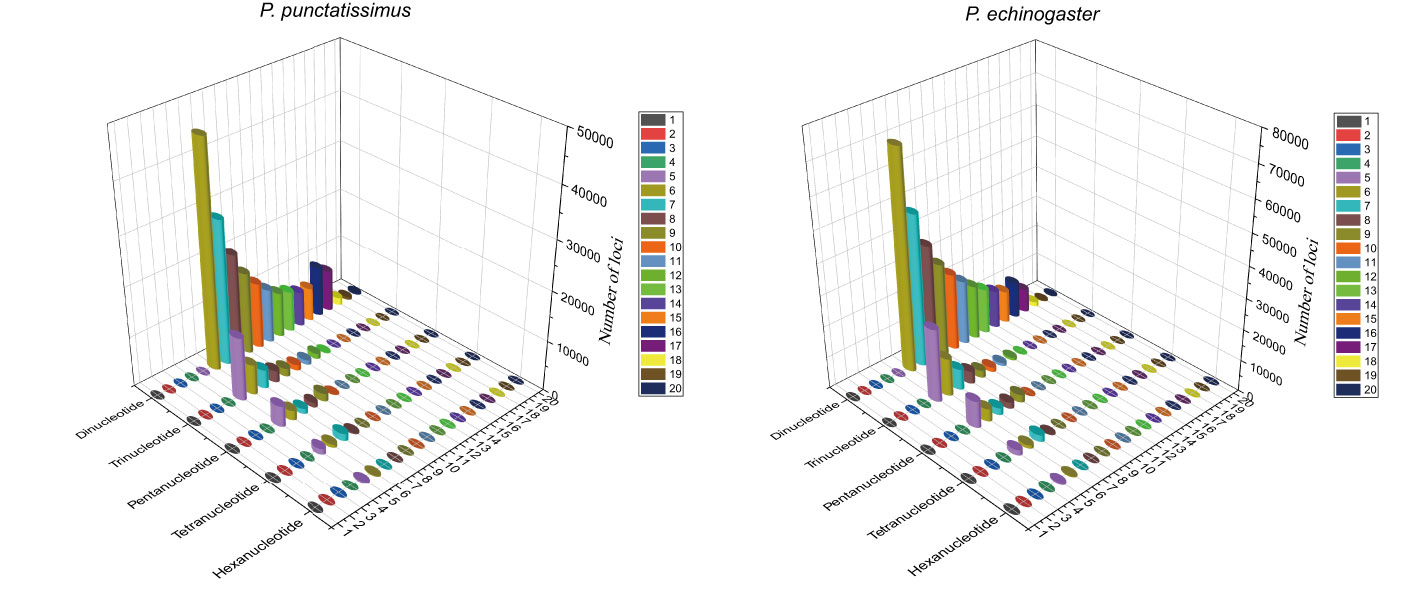
Figure 4 The distribution and frequency of microsatellite motifs in P. punctatissimus and P. echinogaster.
3.3 Screening and functional annotation of single-copy homologous genes
Based on the draft genomes assembled in this study and published genomic data of P. argenteus, a total of 1,876, 638, and 394 single-copy homologous genes were identified for P. punctatissimus, P. echinogaster, and P. argenteus, respectively. The GO annotation results revealed that the primary terms associated with single-copy homologous genes included cellular process, single-organism process, cell, cell part, binding, and catalytic activity (Figure 5; Supplementary Table 1). KEGG annotation results indicated that single-copy homologous genes of the three species were mainly involved in the immune system, endocrine system, nervous system, glycan biosynthesis and metabolism, translation, signal transduction, transport and catabolism, etc. (Figure 6). Interestingly, single-copy homologous genes of P. punctatissimus and P. echinogaster were also involved in environmental adaptation processes. However, very few genes in P. argenteus were engaged in these processes (Figure 6). A total of 1,392, 253, and 150 unique single-copy genes were screened in P. punctatissimus, P. echinogaster, and P. argenteus, respectively (Figure 7A). The KEGG enrichment results showed that the unique single-copy genes of P. argenteus did not show significant enrichment in any pathway, and the top 3 pathways containing the largest number of genes were spliceosome, protein processing in endoplasmic reticulum, and mTOR signaling pathway (Figure 7B). The unique single-copy genes of P. punctatissimus were significantly enriched in biosynthesis of secondary metabolites and purine metabolism (Figure 7C). The unique single-copy genes of P. echinogaster were significantly enriched in carbon metabolism (Figure 7D).
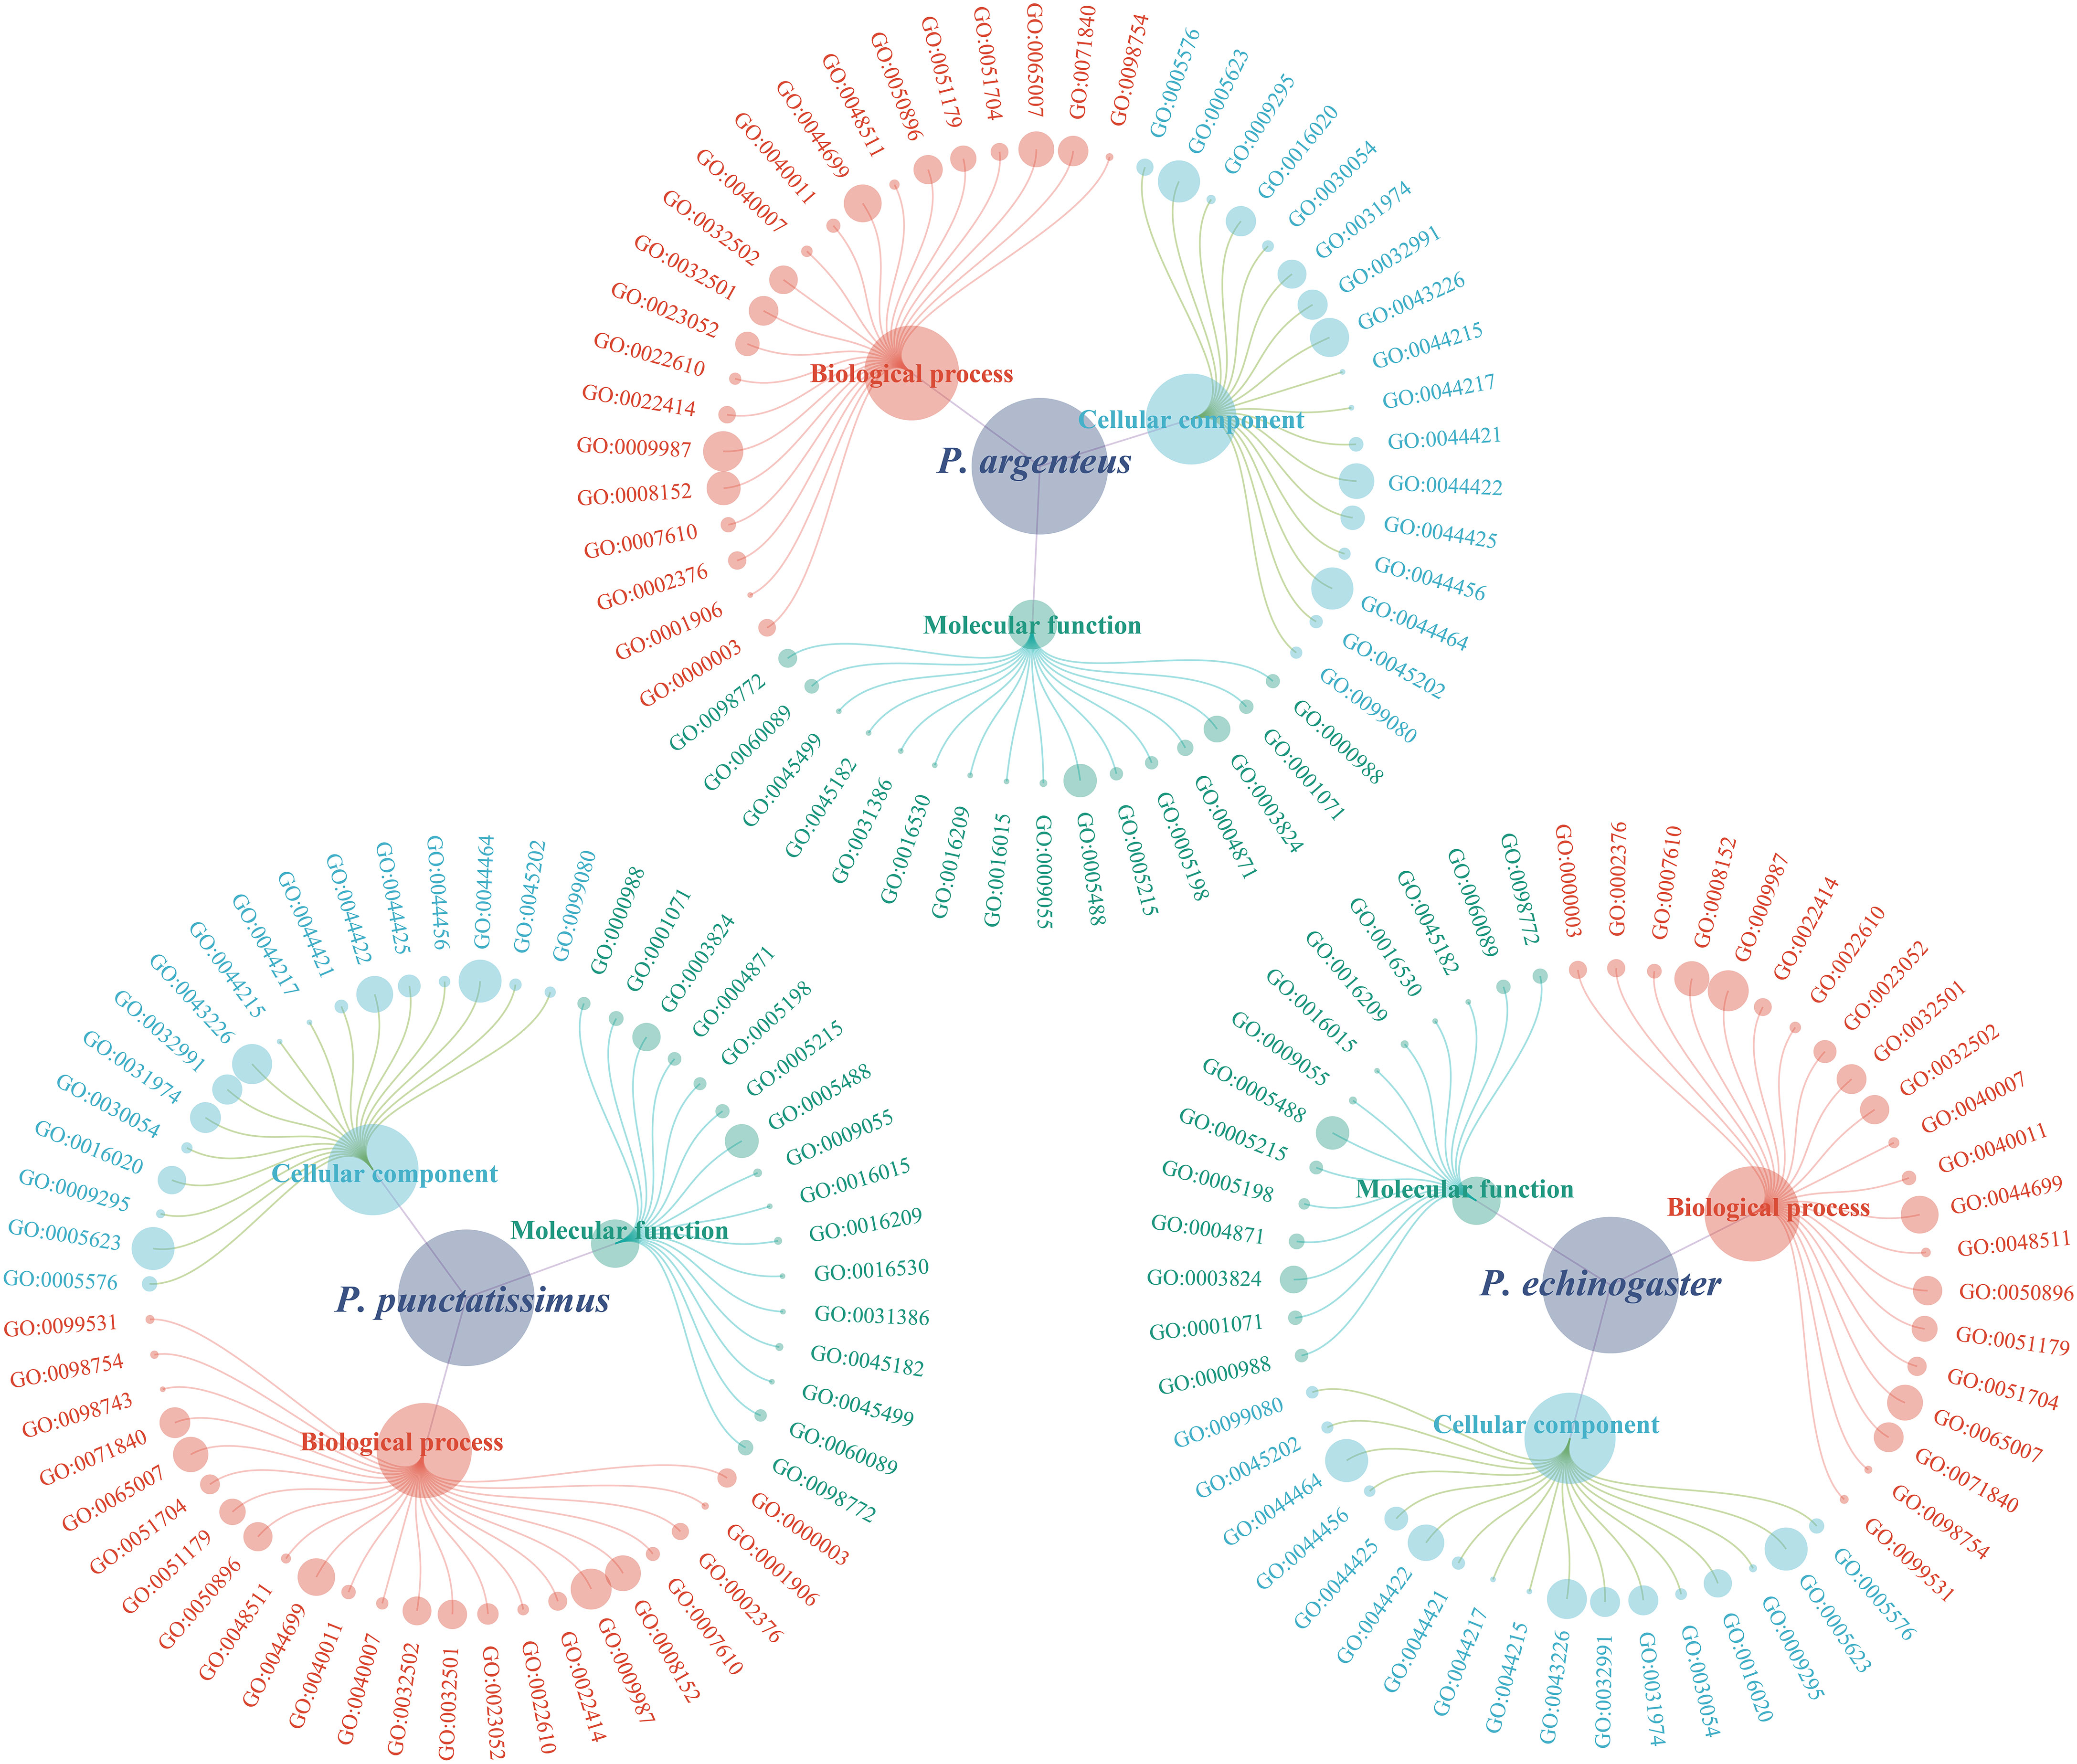
Figure 5 Gene Ontology (GO) classification of all single-copy homologous genes in P. punctatissimus, P. echinogaster, and P. argenteus genomes.
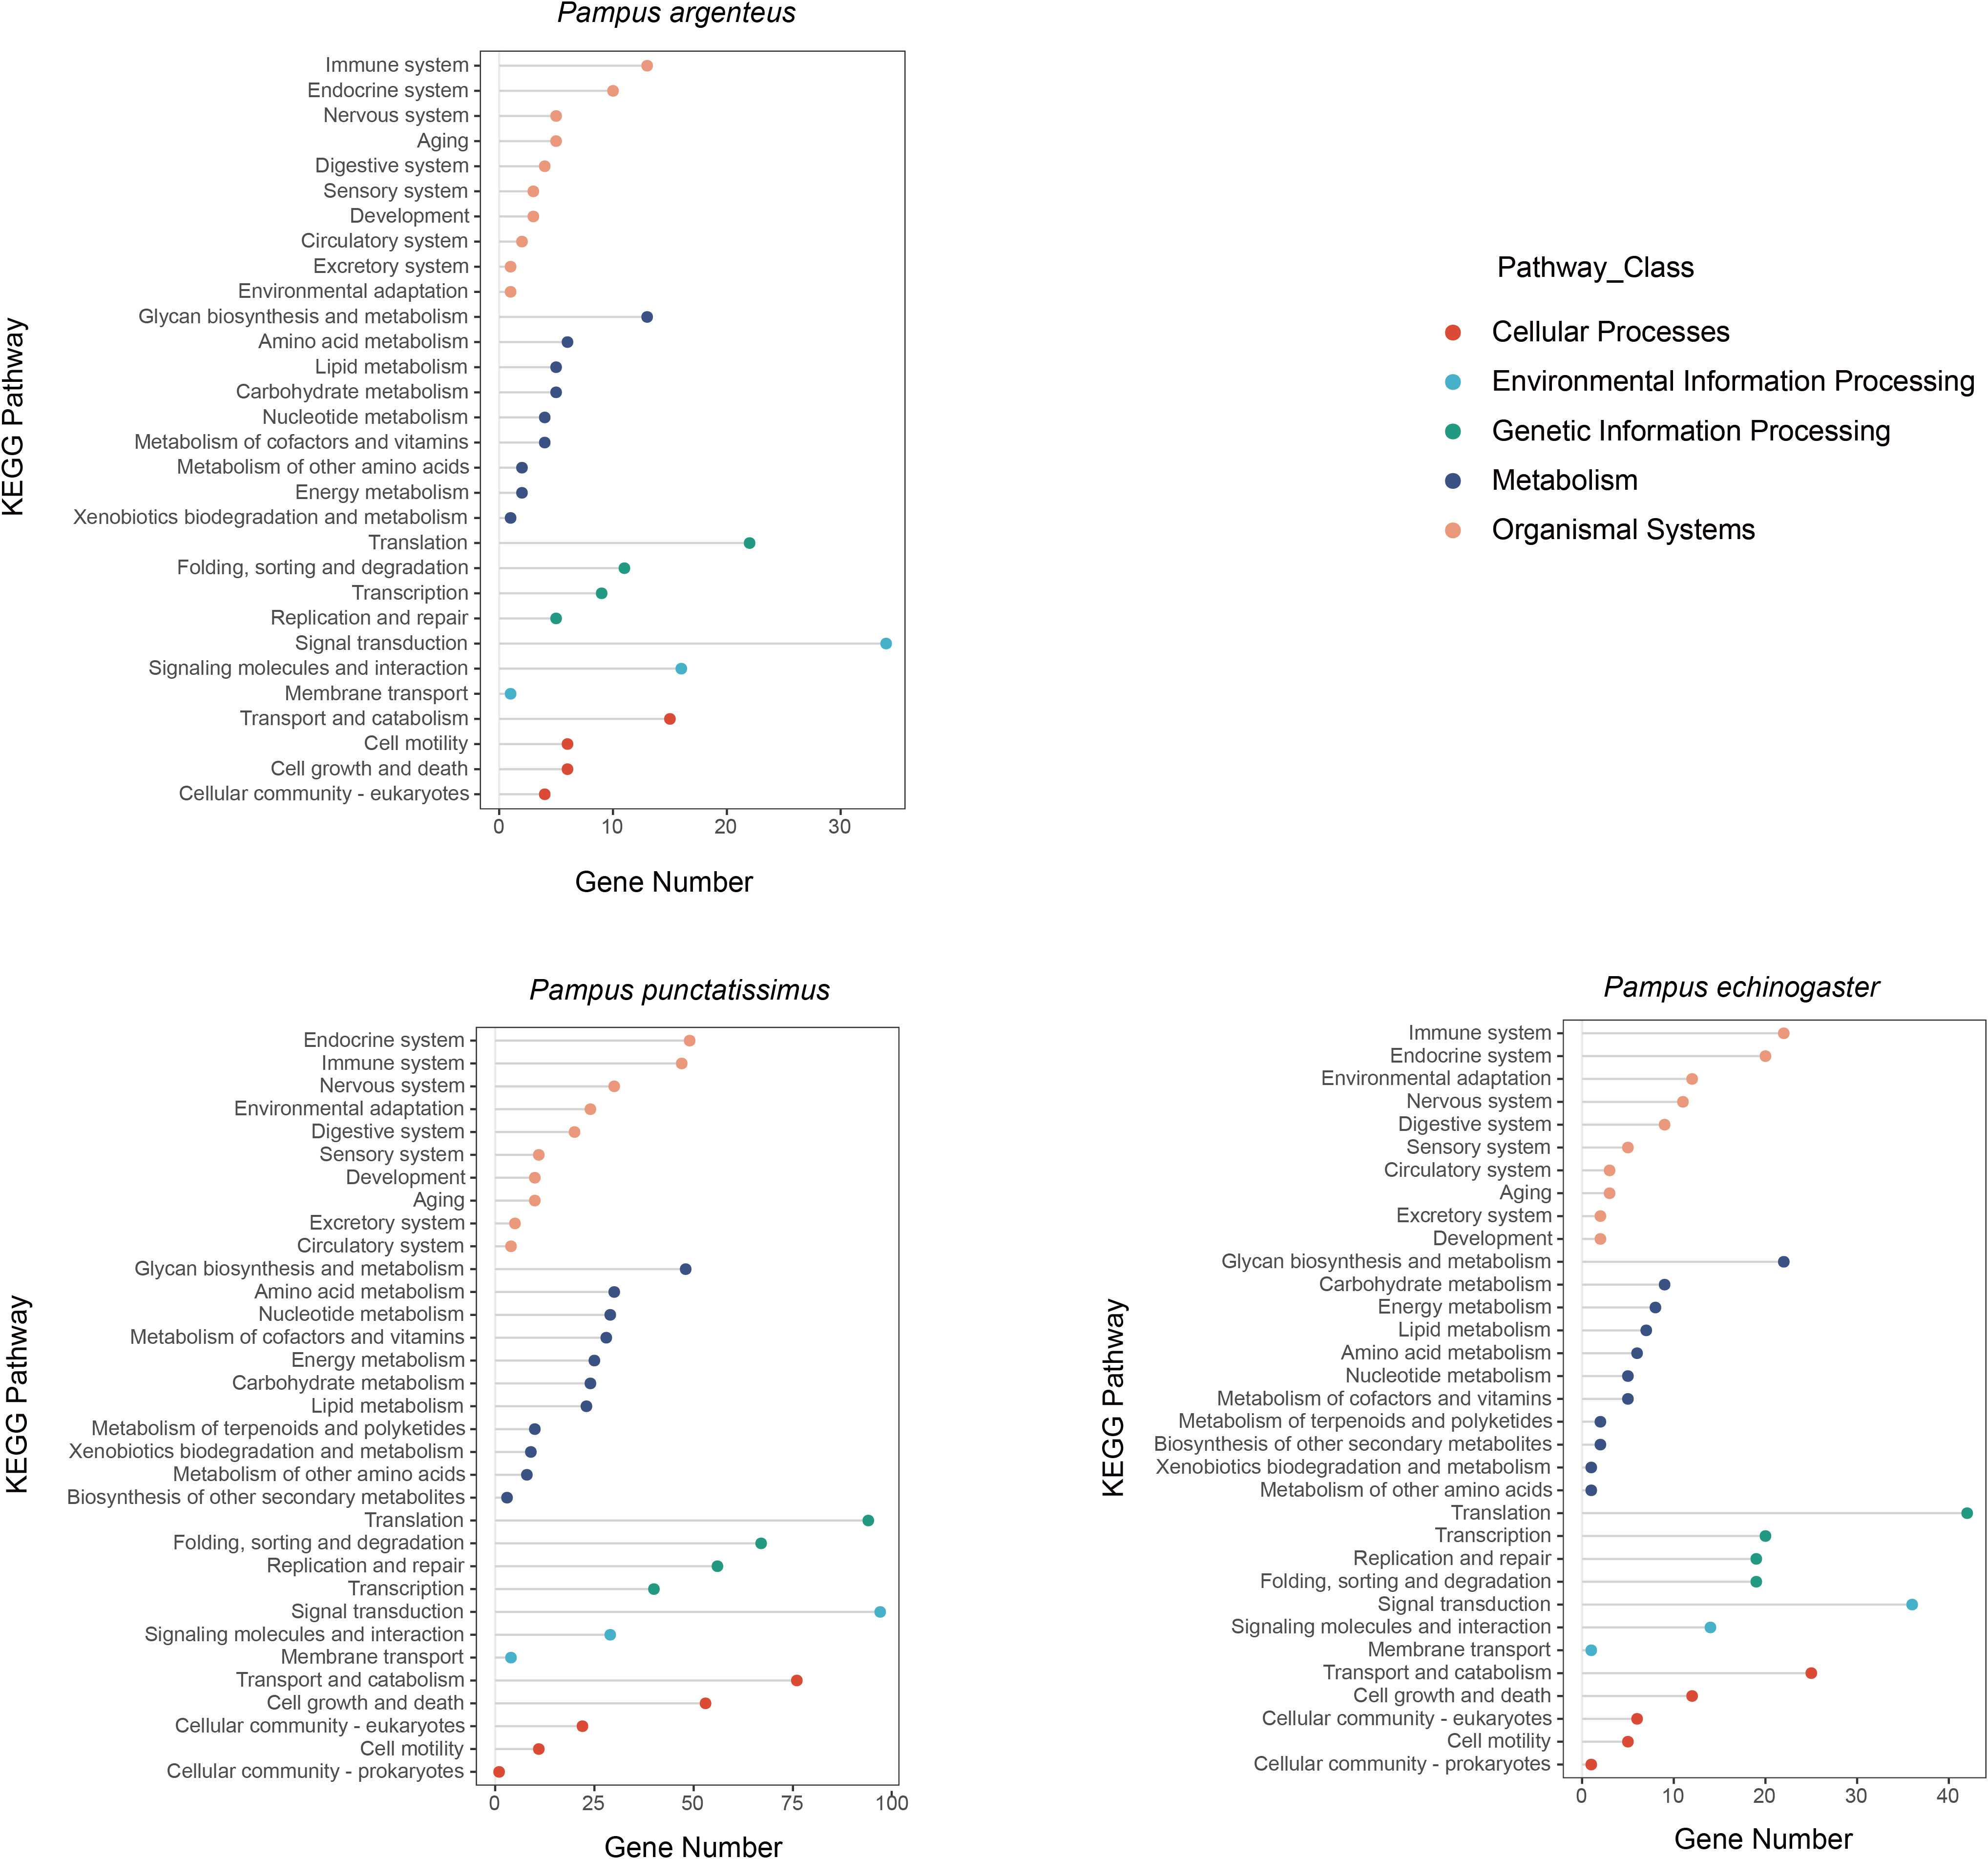
Figure 6 Kyoto Encyclopedia of Genes and Genomes (KEGG) annotation results of all single-copy homologous genes in P. punctatissimus, P. echinogaster, and P. argenteus genomes.
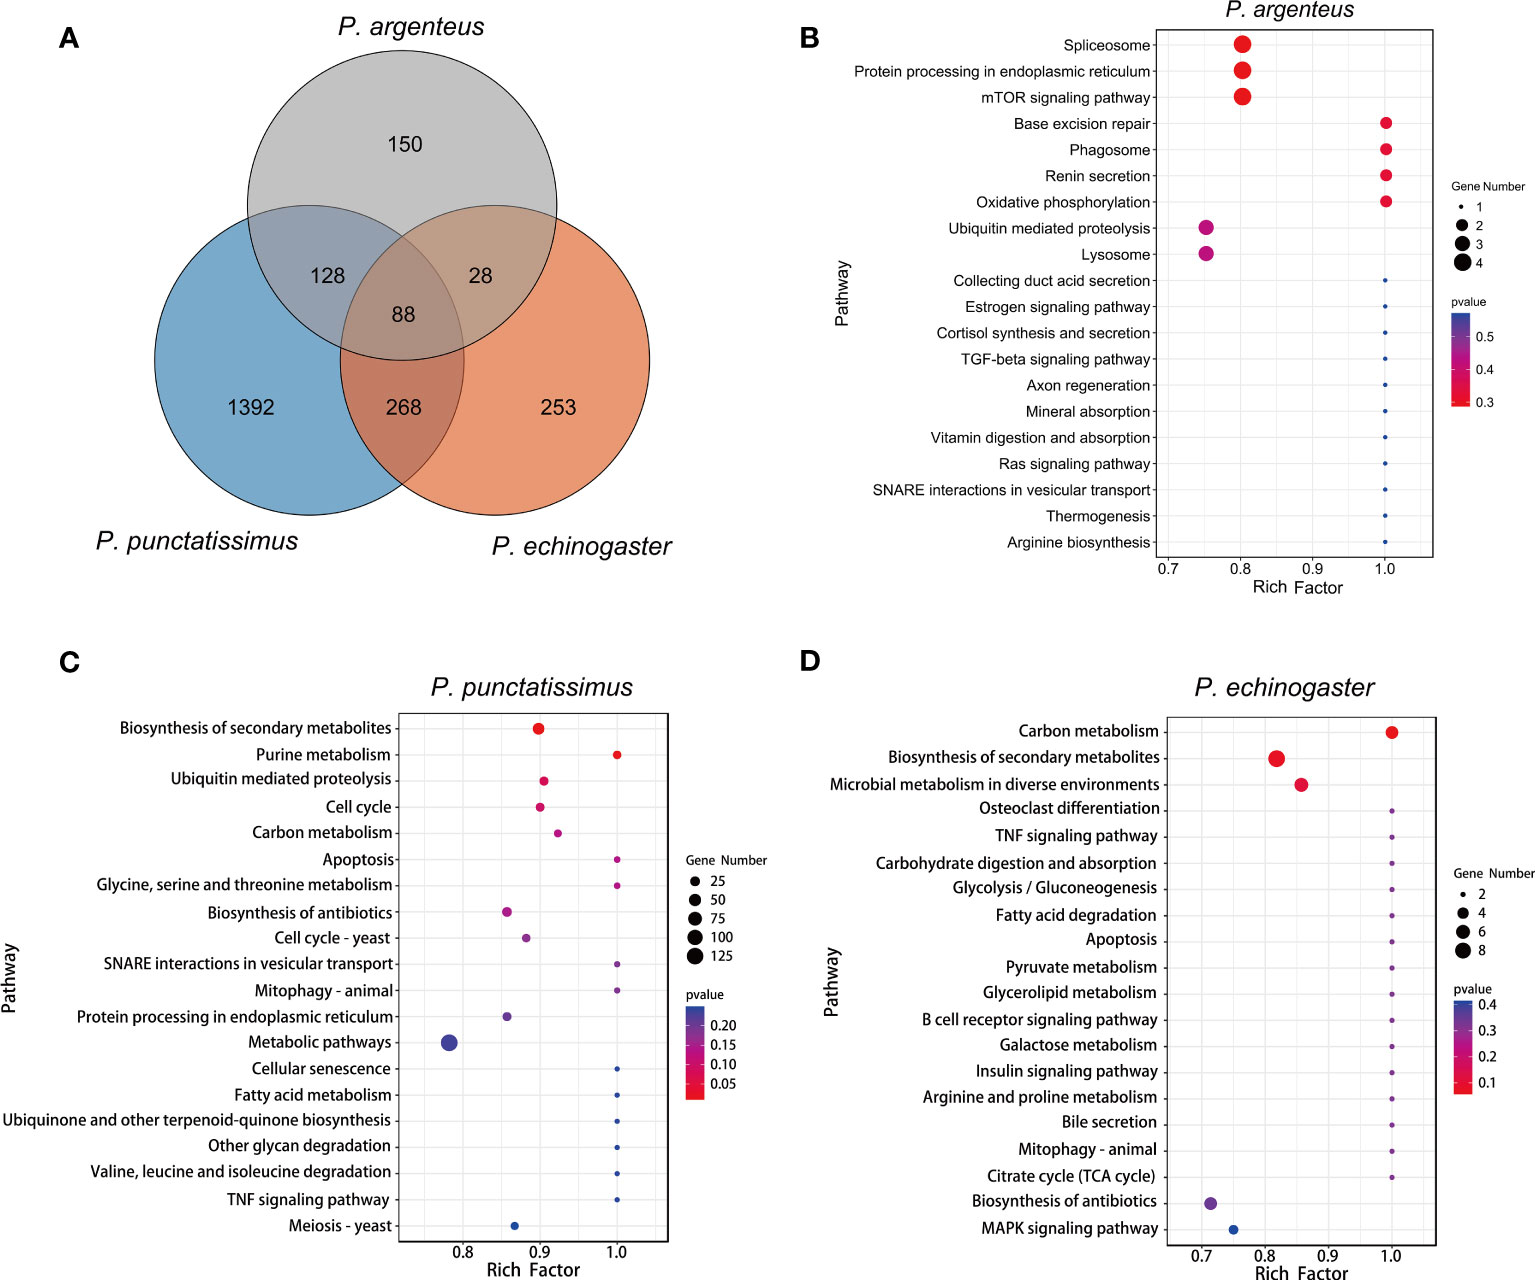
Figure 7 (A) represents an overview of single-copy genes in three Pampus species based on Venn diagrams. (B-D) represent the Kyoto Encyclopedia of Genes and Genomes (KEGG) enrichment results of the unique single-copy genes of the P. argenteus, P. punctatissimus, and P. echinogaster genomes, respectively.
3.4 Mitochondrial genome assembly and phylogenetic analysis
The complete mitochondrial genomes of P. punctatissimus and P. echinogaster both formed closed circular molecules with lengths of 16,695 bp and 16,977 bp, respectively. The complete mitochondrial genome of both species contains 13 protein-coding genes, 22 tRNA genes, 2 rRNA genes, and 1 control region or “d-loop” (Figure 8). Except for ND6 and eight tRNA genes (tRNA-Gln, tRNA-Ala, tRNA-Asn, tRNA-Cys, tRNA-Tyr, tRNA-Ser, tRNA-Glu, tRNA-Pro), distributed on the light strand, the remaining mitochondrial genes were on the heavy strand. The initiation codons of P. punctatissimus, P. echinogaster, and the published P. argenteus mitochondrial protein-coding genes are identical. All coding genes start with ATG except for COI, ND4, and ND6 that start with GTG. Some differences exist in the stop codons among the three species. Both P. argenteus and P. echinogaster possess eight stop codons in 13 protein-coding genes, whereas P. punctatissimus has only six (Figure 9). The phylogenetic tree based on 13 protein-coding genes showed that the sequences of P. punctatissimus and P. echinogaster from this study clustered with those downloaded from NCBI. The ML tree showed three major branches. As expected, all Stomateidae fishes clustered into one group, and Pampus and Peprilus fishes were the most closely related. Tetragonuridae, Amarsipidae, Ariommatidae, and Nomeidae fishes clustered into one group, and all Centrolophidae clustered into another group (Figure 10). The phylogenetic relationships were consistent with the currently reported taxonomic status of species in the Stromateoidei.
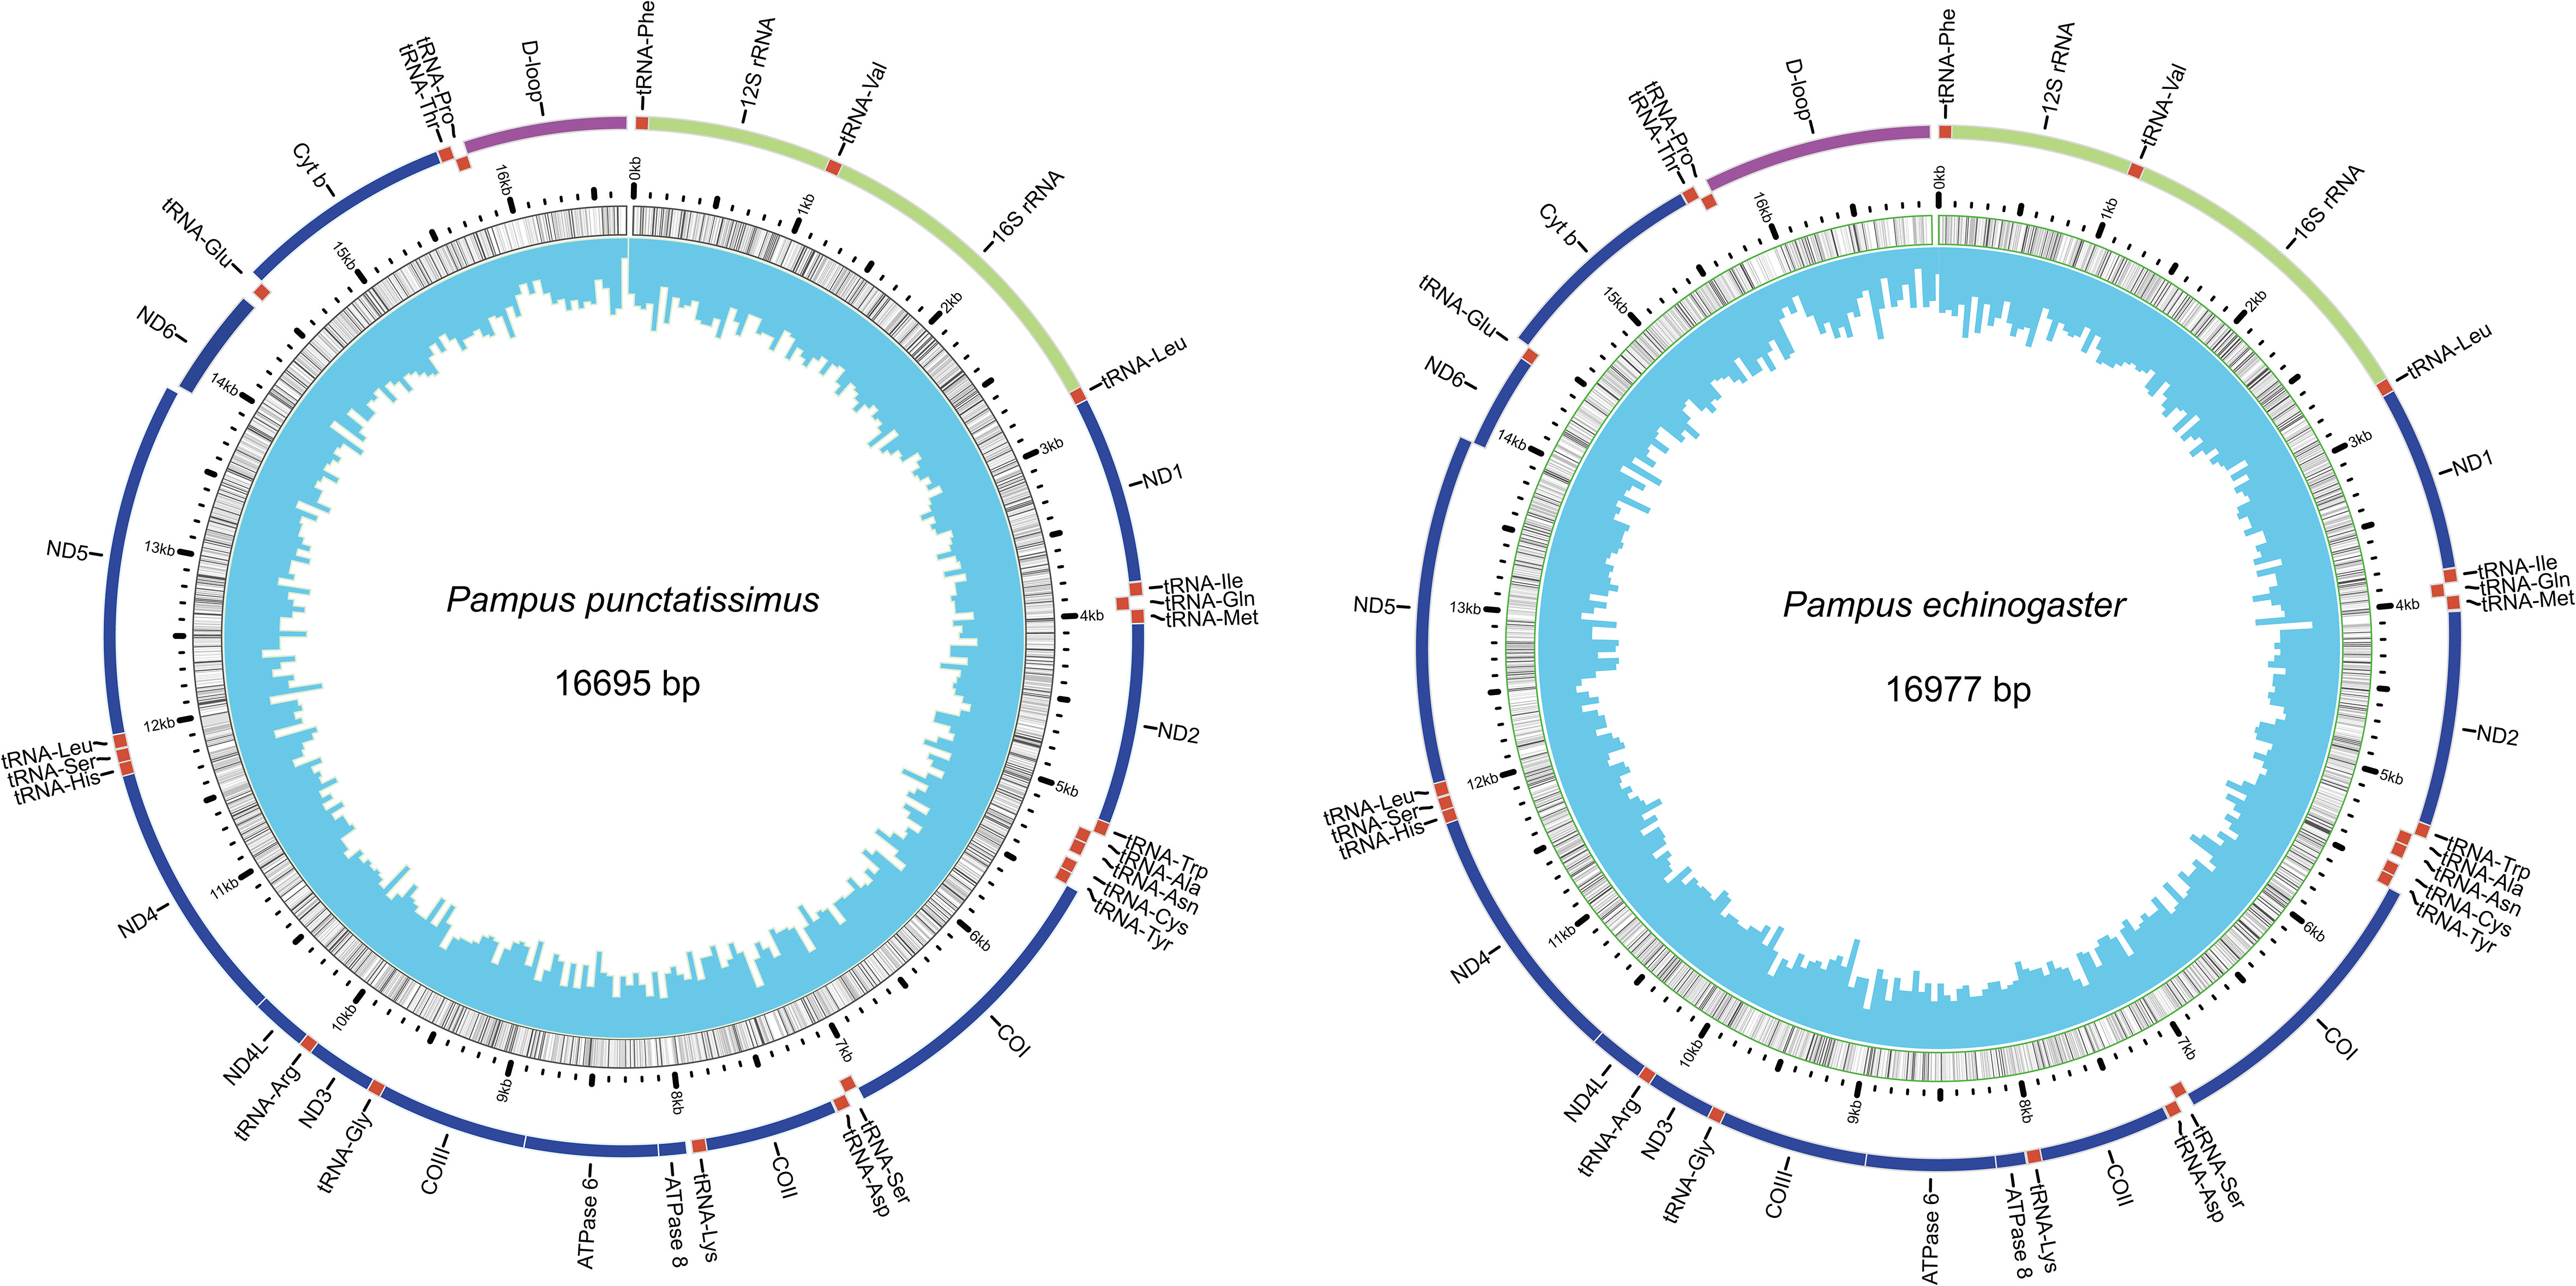
Figure 8 Mitochondrial genome organization of P. punctatissimus and P. echinogaster.
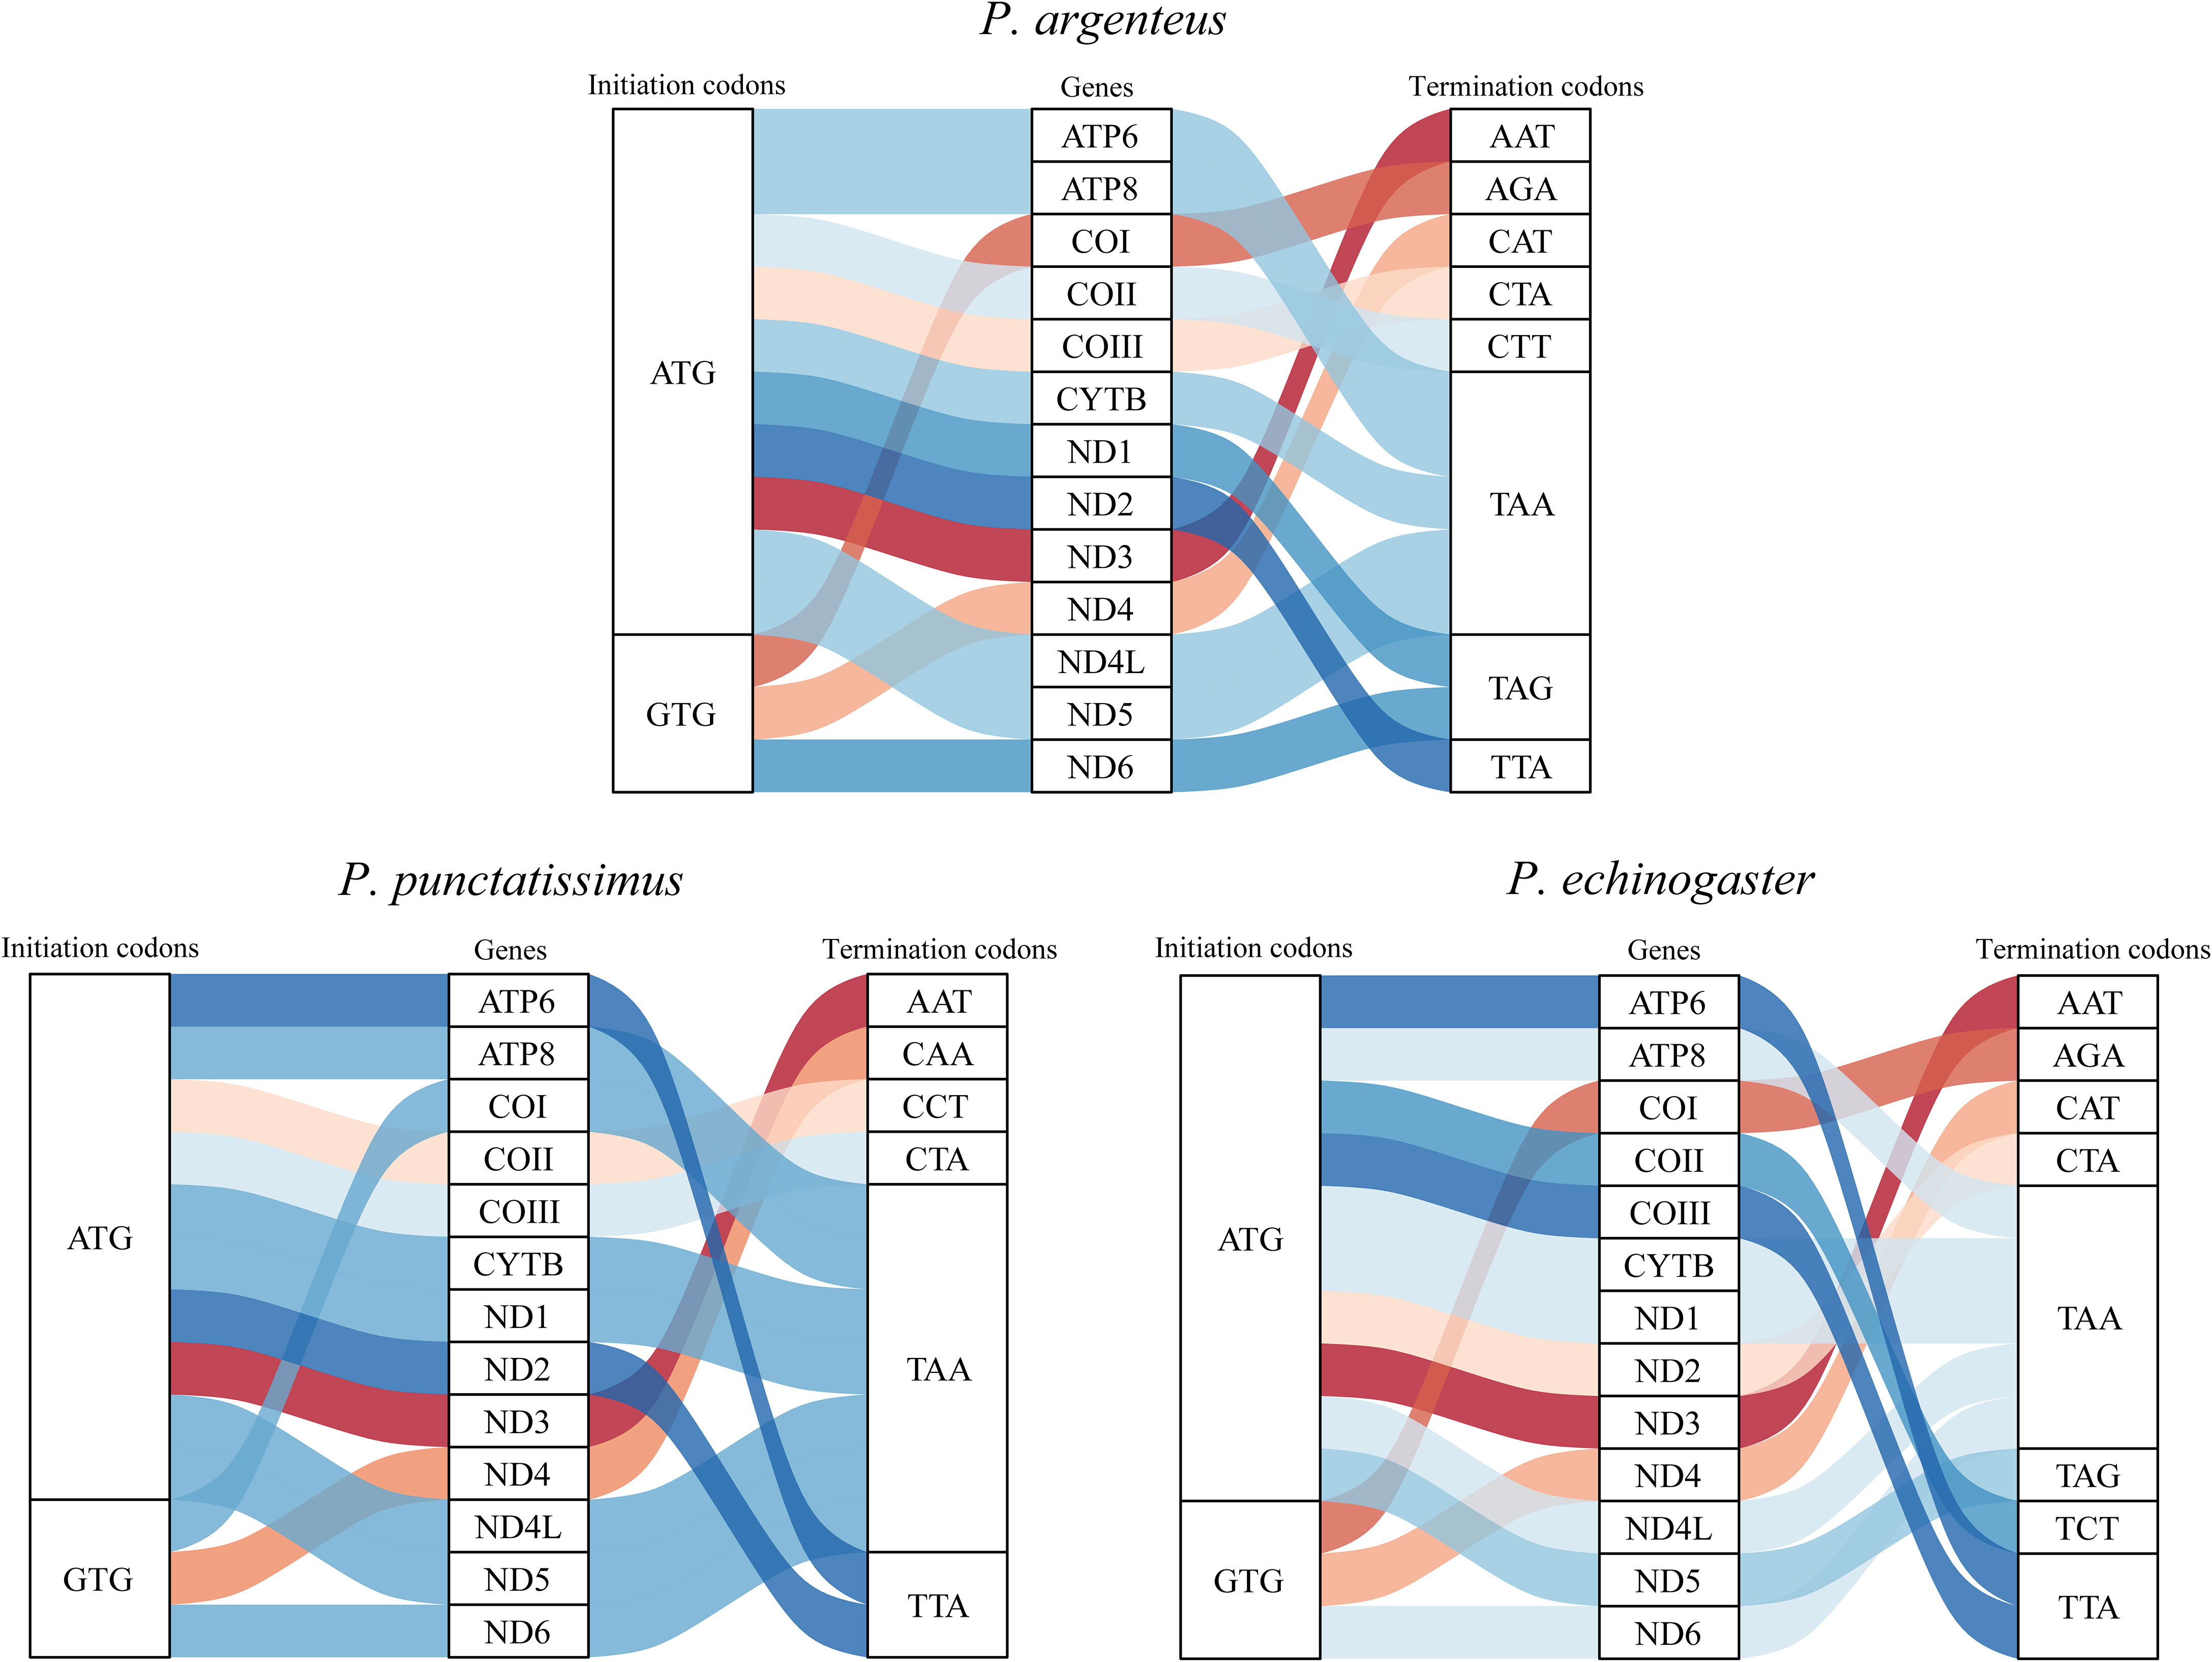
Figure 9 The initiation and termination codons of 13 protein-coding genes of P. argenteus, P. punctatissimus, and P. echinogaster.
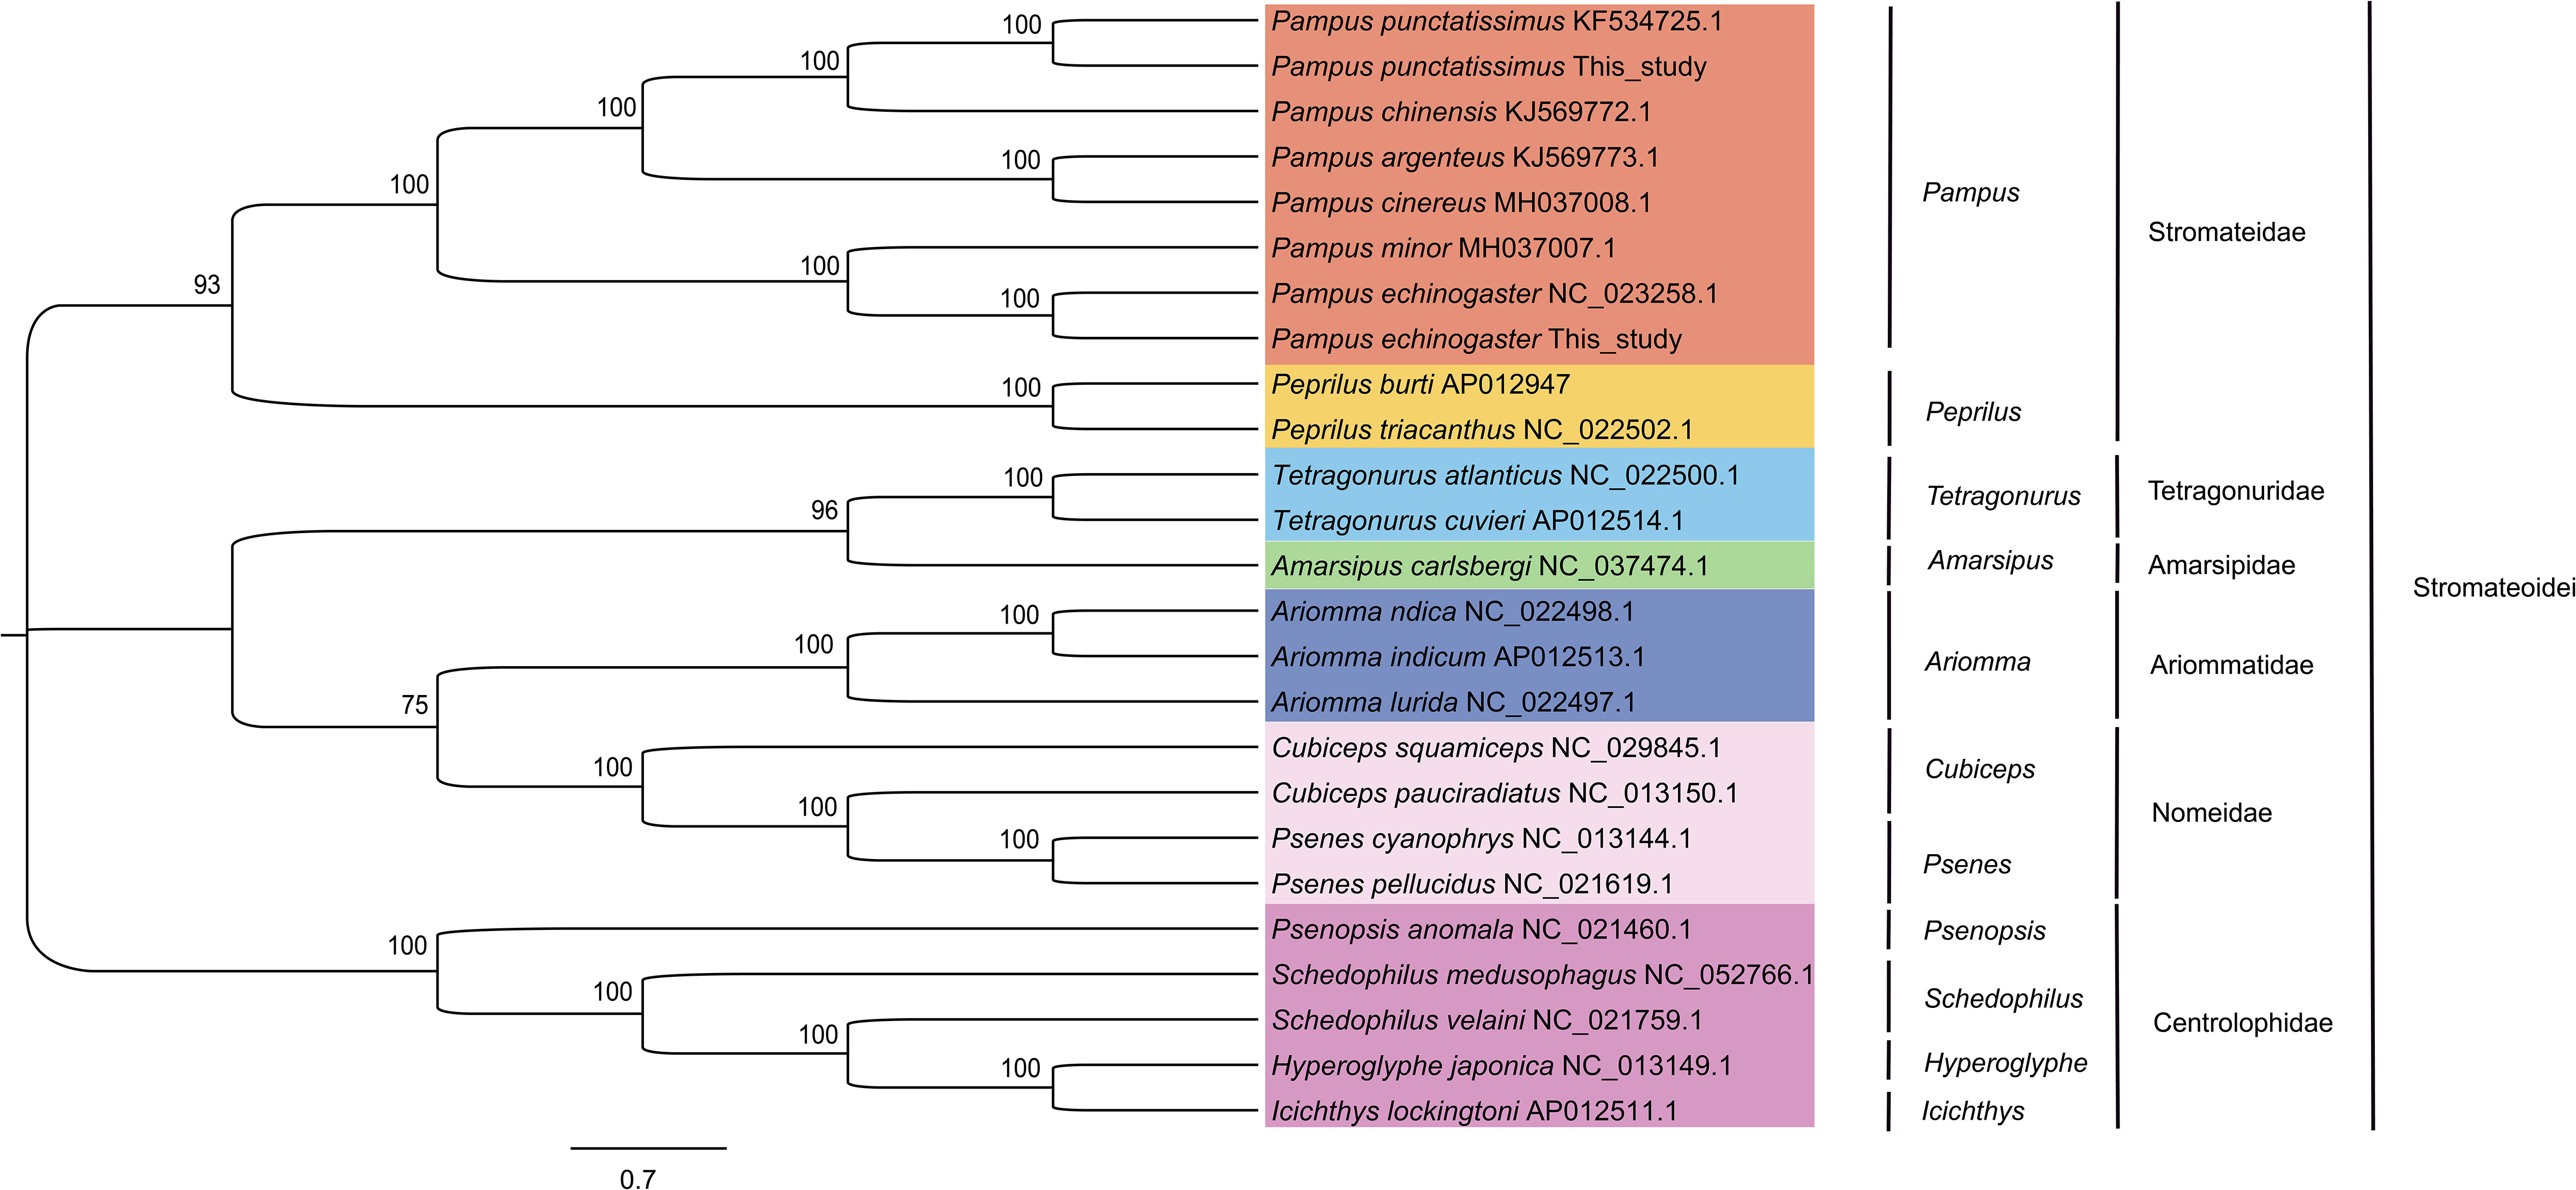
Figure 10 Phylogenetic trees based on 13 protein-coding genes from mitochondrial genomes of Stromateoidei species were inferred using the maximum likelihood method.
3.5 Population size dynamics of P. punctatissimus and P. echinogaster
The PSMC model was employed to infer the historical fluctuations in the effective population size (Ne) of P. punctatissimus and P. echinogaster (Figure 11). The PSMC results showed that P. punctatissimus and P. echinogaster experienced multiple bottleneck effects over the past million years, with their effective population size fluctuating periodically. The effective population size of P. punctatissimus peaked approximately 4 × 10⁴ years ago and subsequently started to decline. The decline accelerated after the last glacial maximum (2.1 × 10⁴ years ago), an extremely cold geological period. Interestingly, two peaks in the effective population size of P. echinogaster occurred over the past million years. The effective population size of P. echinogaster peaked during the last interglacial period (1.1~1.3 × 10⁵ years ago), a relatively warm geological period, and then started to decline. When the last glacial period started (7 × 10⁴ years ago), the effective population size of P. echinogaster began to rise, reaching the second peak approximately 4 × 10⁴ years ago. Close to the last glacial maximum, there was a significant decrease in the effective population size of P. echinogaster.
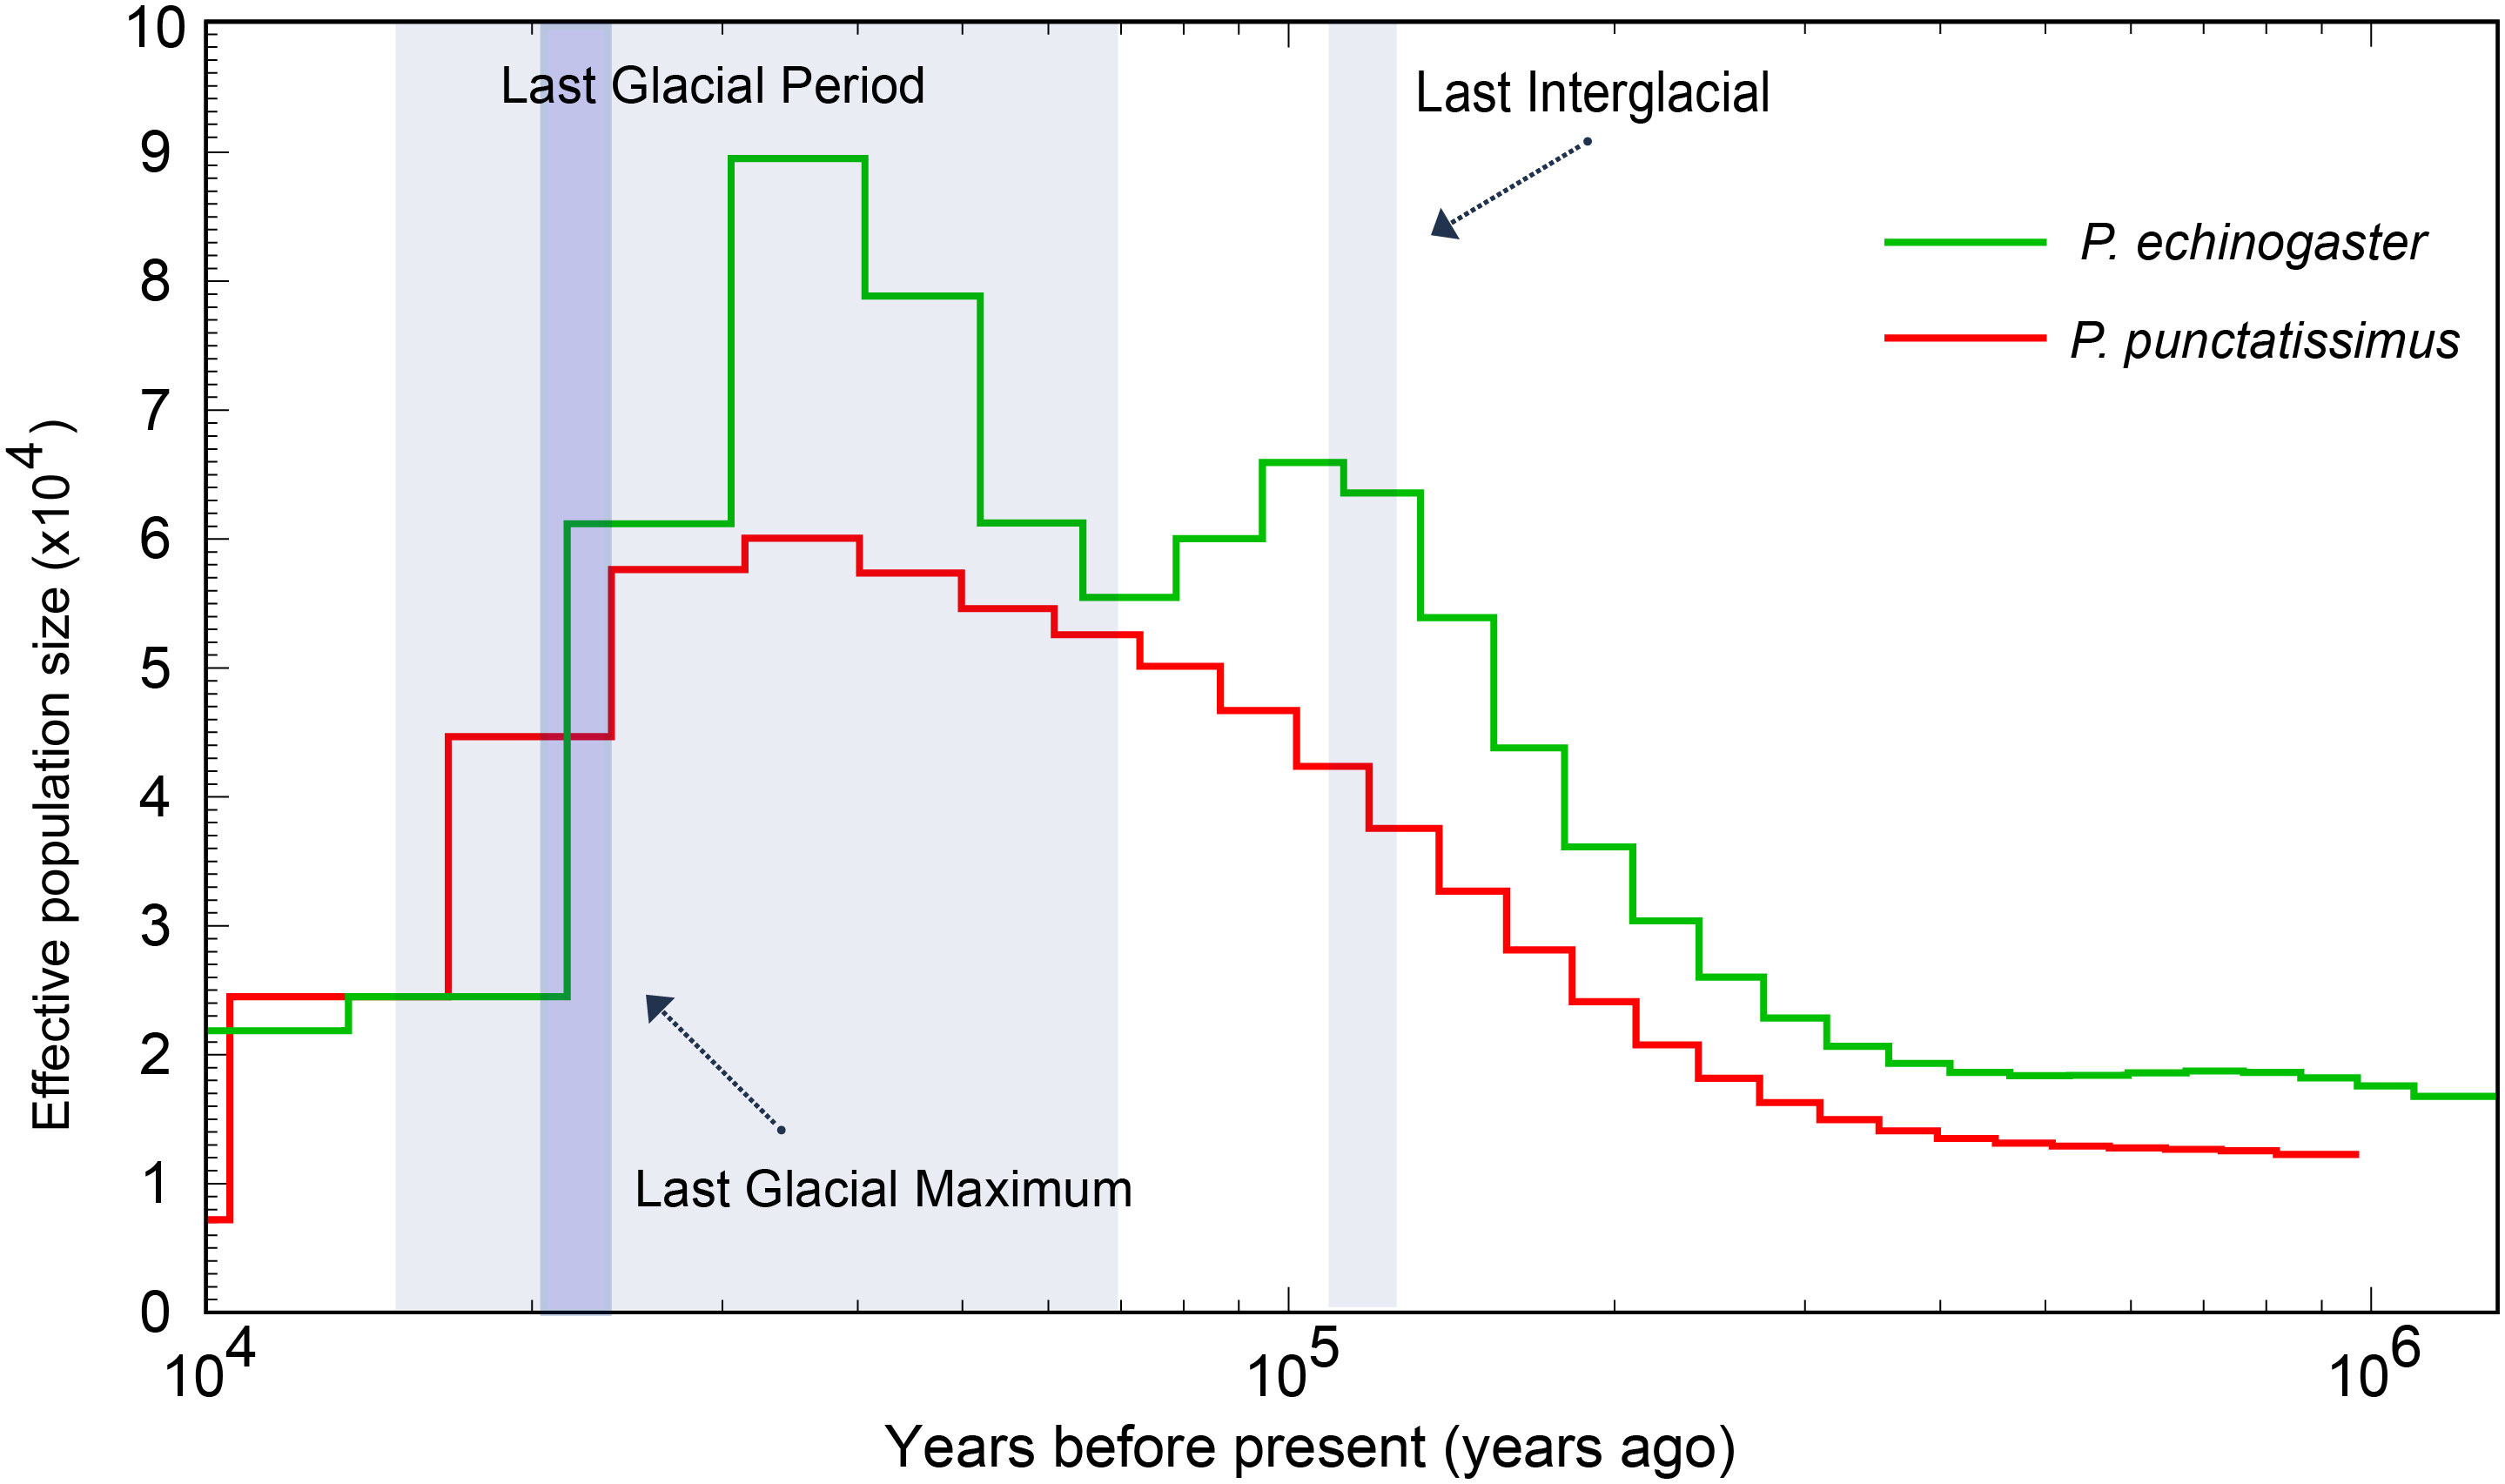
Figure 11 Demographic history of P. punctatissimus and P. echinogaster in this study.
4 Discussion
The genomic resources of Pampus fishes are extremely scarce, and only the P. argenteus genome has been published. Whole-genome survey sequencing has emerged as a rapid and cost-effective technology for acquiring complete genomes of various species (Jo et al., 2021; Zhao et al., 2022). The whole-genome data of P. punctatissimus and P. echinogaster were obtained using whole-genome survey sequencing technology in this study. The raw data exhibited high quality, with an effective rate, Q20, and Q30 all exceeding 90%, indicating their suitability for subsequent analysis. The randomly selected sequencing reads were all mapped to sequences of closely related species, indicating that there is no exogenous contamination of sequencing data. The heterozygosity ratio and repeat sequences ratio in the P. punctatissimus genome were 0.71% (between 0.5% and 0.8%) and 30.22% (<50%), respectively. Therefore, the P. punctatissimus genome belongs to the micro heterozygous genome (Simpson, 2014). However, the heterozygosity of the P. echinogaster genome was 1.38% (>0.8%), and we considered it to be a highly heterozygous genome. The three Pampus species differ in genome size, and the observed discrepancy may be attributed to variations in the composition of repetitive sequences and occurrences of transposon insertions (Shao et al., 2019). Repeated sequences and high heterozygous regions can affect genome integrity during assembly (Jia et al., 2021). Therefore, the sequencing depth should be increased in the future assembly of the P. echinogaster and P. punctatissimus genomes.
This study was the first to assemble the draft genomes of P. punctatissimus and P. echinogaster. Due to the limitations of using only Illumina sequencing data, the draft scaffold genomes of the three Pampus species had lower N50 and N90 lengths compared to other published complete fish genomes (Fan et al., 2018; Bian et al., 2020; Prost et al., 2020). P. echinogaster genome has the lowest N50 and N90 indices possibly due to its higher heterozygosity and repeat sequence ratio. The scaffold draft genomes were used to identify SSRs. The large difference in SSR distribution frequencies between P. punctatissimus and P. echinogaster may be one of the potential reasons for the difference in genome size between the two species. The scaffold assembly data for the published P. argenteus genome were poor, with only 63.7% of the complete genome in sequence length, and therefore has the lowest number of SSRs. Similar to other studies, the motif types of SSRs in P. punctatissimus, P. echinogaster, and published P. argenteus genomes were dinucleotide (Choi et al., 2021; Huang et al., 2022). These SSR data will be crucial for developing molecular markers in Pampus fishes, but further validation studies with diverse populations are necessary.
Single-copy genes refer to genes that have a small number of copies in the genome, one or a few, and most are housekeeping genes belonging to the organism (Huang et al., 2019). The regulation of normal life activities in organisms relies on these essential genes. Single-copy homologous genes are highly conserved during speciation, and their divergence directly leads to the formation of new species (Fitch, 1970). Dissecting the functions of single-copy homologous genes helps us to understand the differences between species. In this study, single-copy homologous gene datasets of P. punctatissimus, P. echinogaster, and P. argenteus were generated based on whole-genome data, and functional annotation and enrichment analysis were performed. The number of single-copy homologous genes varied greatly among the three species, with the largest number of single-copy genes in P. punctatissimus and the smallest number in P. argenteus. However, the GO terms and KEGG pathways annotated to single-copy genes of the three species were similar and involved various aspects of life activities. Interestingly, the number of single-copy genes involved in environmental adaptation processes in P. argenteus was very low. Several studies have identified several functional genes of P. argenteus that adapt to changes in seawater temperature and salinity (Li et al., 2020; Zhang et al., 2022). Most of these genes are not in our single-copy gene dataset. Therefore, we hypothesized that P. argenteus may have different regulatory mechanisms for environmental adaptation from other Pampus fishes. We look forward to future studies on environmental adaptations in Pampus fishes to verify our speculations. In addition, this study constructed single-copy homologous gene datasets unique to the three species. The unique single-copy genes of P. argenteus were not significantly enriched in any pathway, but the top 3 pathways containing the largest number of genes were spliceosome, protein processing in endoplasmic reticulum, and mTOR signaling pathway. Both spliceosome and protein processing in endoplasmic reticulum were associated with gene expression processes (Will and Lührmann, 2011; Braakman and Hebert, 2013). The mTOR signaling pathway serves as a master regulator of cell metabolism, growth, proliferation, and survival, and the mTOR complex 1 (mTORC1) plays a key role in protein synthesis (Chaturantabut et al., 2019). We proposed the conjecture that the gene expression process may differ between P. argenteus and other Pampus fishes. The unique single-copy genes of P. punctatissimus and P. echinogaster were enriched in different metabolic pathways, suggesting that there may be some differences in the processes of substance metabolism between the two species. Dissecting the functions of single-copy homologous genes helps us to understand the differences between species.
The abundance of mitochondria in animal cells results in a higher sequencing depth for mitochondrial genomes compared to nuclear genes, enabling us to assemble a complete mitochondrial genome with ample data. Currently, the whole mitochondrial genomes of P. punctatissimus and P. echinogaster assembled based on the primer-walking method have been published (Liu et al., 2015; Li et al., 2016). The mitochondrial genomes of P. punctatissimus and P. echinogaster were assembled for the first time in this study using whole-genome sequencing data, which is consistent with the structure of previously published mitochondrial genomes. However, we found that the sequence of the mitochondrial D-loop region assembled in this study was longer and less accurate than the published sequences by sequence comparison. This may be due to the large individual variation in the D-loop region and the shorter fragment of the Illumina sequencing data. Although the method of assembling mitochondrial genome based on Illumina sequencing data has some limitations, it is more efficient and less costly than traditional methods. The phylogenetic tree based on 13 protein-coding genes indicated that the assembly of protein-coding genes of P. punctatissimus and P. echinogaster in this study was accurate. The phylogenetic relationships were consistent with the currently reported taxonomic status of species in the Stromateoidei (Cui et al., 2011).
Population dynamics in the genetic and evolutionary biology have long been a prominent area of research. We employed the PSMC model to infer historical fluctuations in the effective population size of P. punctatissimus and P. echinogaster. Our results suggested that P. punctatissimus and P. echinogaster experienced one and two bottleneck effects during the Pleistocene Glacial Epoch, respectively. We hypothesized that the habitats of P. punctatissimus and P. echinogaster differed significantly during the Pleistocene Glacial Epoch. The unstable climate of the last interglacial period had a large impact on P. echinogaster, resulting in a small decline in its population size. P. echinogaster may be forced to migrate to more suitable sea areas, and subsequently, population size increases again. The accumulation of new mutations, however, occurs at a remarkably slow pace within a species (Latta et al., 2010). Therefore, we hypothesized that the loss of genetic diversity due to the bottleneck effect may not recover rapidly with increasing population size. A study suggests that lower genetic diversity may lead to a reduced ability of species to adapt to climate change (Foo and Byrne, 2016). So, the population size of P. echinogaster declined sharply during the Last Glacial Maximum due to dramatic climate change. Unlike P. echinogaster, climate change during the Last Interglacial did not have a large impact on P. punctatissimus, and its population size continued to increase. Until the Last Glacial Maximum, sea level dropped nearly approximately 100 meters and offshore fish habitat was lost extensively, the population size of P. punctatissimus decreased dramatically (Hoareau et al., 2012). There was still no trend of recovery in the population size of both P. punctatissimus and P. echinogaster by 10,000 years ago.
5 Conclusions
In this study, genomic survey analysis of P. punctatissimus and P. echinogaster were performed by high-throughput sequencing. Published P. argenteus genomic data were also used for comparative analysis. The P. punctatissimus genome belongs to the micro heterozygous genome, and the P. echinogaster genome was highly heterozygous. Genomic characteristics, SSR types and numbers, single-copy gene numbers, and functions of the three Pampus fishes were significantly different. The inclusion of the assembled mitochondrial genome not only enhances the genetic resources available for Pampus fishes but also provides further evidence supporting their taxonomic classification. A large number of SSR loci, shared single-copy homologous genes, and 13 mitochondrial protein-coding genes can be used as potential markers to differentiate the three Pampus fish species. The PSMC analysis revealed that P. punctatissimus and P. echinogaster underwent one and two bottleneck events, respectively, during the Pleistocene Glacial Epoch. This study provides a valuable data reference for the complete genome assembly of P. punctatissimus and P. echinogaster, offering novel insights to resolve interspecific differences among Pampus fishes.
Data availability statement
‘The original contributions presented in the study are publicly available. This data can be found here: https://www.ncbi.nlm.nih.gov/genbank/, PRJNA853896.
Ethics statement
The animal studies were approved by Guidelines for Experimental Animals of the Ministry of Science and Technology. The studies were conducted in accordance with the local legislation and institutional requirements. Written informed consent was obtained from the owners for the participation of their animals in this study.
Author contributions
XZ: Data curation, Formal analysis, Methodology, Visualization, Writing – original draft, Writing – review & editing. TZ: Conceptualization, Formal analysis, Investigation, Writing – review & editing. NS: Conceptualization, Methodology, Writing – review & editing, Formal analysis. YQ: Data curation, Formal analysis, Methodology, Writing – review & editing. TG: Conceptualization, Data curation, Funding acquisition, Methodology, Project administration, Writing – review & editing.
Funding
The author(s) declare financial support was received for the research, authorship, and/or publication of this article. This work was supported by the National Key Research and Development Program of China (2023YFD2401900).
Conflict of interest
The authors declare that the research was conducted in the absence of any commercial or financial relationships that could be construed as a potential conflict of interest.
Publisher’s note
All claims expressed in this article are solely those of the authors and do not necessarily represent those of their affiliated organizations, or those of the publisher, the editors and the reviewers. Any product that may be evaluated in this article, or claim that may be made by its manufacturer, is not guaranteed or endorsed by the publisher.
Supplementary material
The Supplementary Material for this article can be found online at: https://www.frontiersin.org/articles/10.3389/fmars.2023.1332250/full#supplementary-material
References
Al-Abdul-Elah K., Hossain M. A., Akatsu S. (2021). Recent advances in artificial breeding and larval rearing of silver pomfret Pampus argenteus (Euphrasen 1788) in Kuwait. Saudi. J. Biol. Sci. 28 (10), 5808–5815. doi: 10.1016/j.sjbs.2021.06.026
Allio R., Schomaker-Bastos A., Romiguier J., Prosdocimi F., Nabholz B., Delsuc F. (2020). MitoFinder: Efficient automated large-scale extraction of mitogenomic data in target enrichment phylogenomics. Mol. Ecol. Res. 20 (4), 892–905. doi: 10.1111/1755-0998.13160
AlMomin S., Kumar V., Al-Amad S., Al-Hussaini M., Dashti T., Al-Enezi K., et al. (2016). Draft genome sequence of the silver pomfret fish, Pampus argenteus. Genome 59 (1), 51–58. doi: 10.1139/gen-2015-0056
Beier S., Thiel T., Münch T., Scholz U., Mascher M. (2017). MISA-web: a web server for microsatellite prediction. Bioinformatics 33, 2583–2585. doi: 10.1093/bioinformatics/btx198
Bi Q., Zhao Y., Cui Y., Wang L. (2019). Genome survey sequencing and genetic background characterization of yellow horn based on next-generation sequencing. Mol. Biol. Rep. 46 (4), 4303–4312. doi: 10.1007/s11033-019-04884-7
Bian L., Li F., Ge J., Wang P., Chang Q., Zhang S., et al. (2020). Chromosome-level genome assembly of the greenfin horse-faced filefish (Thamnaconus septentrionalis) using Oxford Nanopore PromethION sequencing and Hi-C technology. Mol. Ecol. Resour. 20 (4), 1069–1079. doi: 10.1111/1755-0998.13183
Braakman I., Hebert D. N. (2013). Protein folding in the endoplasmic reticulum. CSH. Perspect. Biol. 5 (5), a013201. doi: 10.1101/cshperspect.a013201
Cantalapiedra C. P., Hernández-Plaza A., Letunic I., Bork P., Huerta-Cepas J. (2021). eggNOG-mapper v2: functional annotation orthology assignments and domain prediction at the metagenomic scale. Mol. Biol. Evol. 38 (12), 5825–5829. doi: 10.1093/molbev/msab293
Chaturantabut S., Shwartz A., Evason K. J., Cox A. G., Labella K., Schepers A. G., et al. (2019). Estrogen activation of G-protein-coupled estrogen receptor 1 regulates phosphoinositide 3-kinase and mTOR signaling to promote liver growth in zebrafish and proliferation of human hepatocytes. Gastroenterology 156 (6), 1788–1804e13. doi: 10.1053/j.gastro.2019.01.010
Chen B., Sun Z., Lou F., Gao T., Song N. (2020). Genomic characteristics and profile of microsatellite primers for Acanthogobius ommaturus by genome survey sequencing. Biosci. Rep. 40 (11), BSR20201295. doi: 10.1042/BSR20201295
Chen S., Zhou Y., Chen Y., Gu J. (2018). fastp: an ultra-fast all-in-one FASTQ preprocessor. Bioinformatics 34 (17), i884–i890. doi: 10.1093/bioinformatics/bty560
Choi E., Kim S. H., Lee S. J., Jo E., Kim J., Kim J. H., et al. (2021). A first genome survey and genomic SSR marker analysis of Trematomus loennbergii Regan 1913. Anim. (Basel) 11 (11), 3186. doi: 10.3390/ani11113186
Cui Z., Liu Y., Li C. P., Chu K. H. (2011). Species delineation in Pampus (perciformes) and the phylogenetic status of the stromateoidei based on mitogenomics. Mol. Biol. Rep. 38 (2), 1103–1114. doi: 10.1007/s11033-010-0207-y
Cui Z., Yuan L., Jing L., Luan W. (2010). Molecular identification of Pampus fishes (Perciformes Stromateidae). Ichthyol. Res. 57 (1), 32–39. doi: 10.1007/s10228-009-0119-9
Fan G., Chan J., Ma K., Yang B, Zhang H, Yang X, et al. (2018). Chromosome-level reference genome of the Siamese fighting fish Betta splendens a model species for the study of aggression. GigaScience 7 (11), giy087. doi: 10.1093/gigascience/giy087
Fitch W. M. (1970). Distinguishing homologous from analogous proteins. Syst. Zool. 19, 99–113. doi: 10.2307/2412448
Foo S. A., Byrne M. (2016). Acclimatization and adaptive capacity of marine species in a changing ocean. Adv. Mar. Biol. 74, 69–116. doi: 10.1016/bs.amb.2016.06.001
Gao Q., Tang Q., Zhao M., Min M., Wang Q., Peng S., et al. (2020). Molecular characterization of TLR3 and TRIL in silvery pomfret (Pampus argenteus) and their expression profiles in response to bacterial components. Int. J. Biol. Macromol. 155, 805–813. doi: 10.1016/j.ijbiomac.2020.03.246
Gilbert P. S., Chang J., Pan C., Sobel E. M., Sinsheimer J. S., Faircloth B. C., et al. (2015). Genome-wide ultraconserved elements exhibit higher phylogenetic informativeness than traditional gene markers in percomorph fishes. Mol. Phylogenet. Evol. 92, 140–146. doi: 10.1016/j.ympev.2015.05.027
Hoareau T. B., Boissin E., Berrebi P. (2012). Evolutionary history of a widespread Indo-Pacific goby: the role of Pleistocene sea-level changes on demographic contraction/expansion dynamics. Mol. Phylogenet. Evol. 62 (1), 566–572. doi: 10.1016/j.ympev.2011.10.004
Huang G., Cao J., Chen C., Wang M., Liu Z., Gao F., et al. (2022). Genome survey of Misgurnus anguillicaudatus to identify genomic information simple sequence repeat (SSR) markers and mitochondrial genome. Mol. Biol. Rep. 49 (3), 2185–2196. doi: 10.1007/s11033-021-07037-x
Huang Y., Feulner P., Eizaguirre C., Lenz T. L., Bornberg-Bauer E., Milinski M., et al. (2019). Genome-wide genotype-expression relationships reveal both copy number and single nucleotide differentiation contribute to differential gene expression between stickleback ecotypes. Genome. Biol. Evol. 11 (8), 2344–2359. doi: 10.1093/gbe/evz148
Jia C., Yang T., Yanagimoto T., Gao T. (2021). Comprehensive draft genome analyses of three rockfishes (Scorpaeniformes Sebastiscus) via genome survey sequencing. Curr. Issues. Mol. Biol. 43 (3), 2048–2058. doi: 10.3390/cimb43030141
Jo E., Lee S. J., Choi E., Kim J., Lee S. G., Lee J. H., et al. (2021). Whole genome survey and microsatellite motif identification of Artemia franciscana. Biosci. Rep. 41 (3), BSR20203868. doi: 10.1042/BSR20203868
Karim E., Liu Q., Mahmud Y., Shamsuzzaman M. M., Khatun M. H. (2020). Comparative assessment of population biology of three popular pomfrets species Pampus argenteus Pampus chinensis and parastromateus Niger of the bay of Bengal Bangladesh. Iran. J. Fish. Sci. 19 (2), 793–813. doi: 10.22092/ijfs.2018.119873
Koprek T., Rangel S., McElroy D., Louwerse J. D., Williams-Carrier R. E., Lemaux P. G. (2001). Transposon-mediated single-copy gene delivery leads to increased transgene expression stability in barley. Plant Physiol. 125 (3), 1354–1362. doi: 10.1104/pp.125.3.1354
Kumar S., Stecher G., Li M., Knyaz C., Tamura K. (2018). MEGA X: Molecular evolutionary genetics analysis across computing platforms. Mol. Biol. Evol. 35 (6), 1547–1549. doi: 10.1093/molbev/msy096
Latta L. C., Fisk D. L., Knapp R. A., Pfrender M. E. (2010). Genetic resilience of daphnia populations following experimental removal of introduced fish. Conserv. Genet. 11 (5), 1737–1745. doi: 10.1007/s10592-010-0067-y
Li H., Durbin R. (2011). Inference of human population history from individual whole-genome sequences. Nature 475, 493–496. doi: 10.1038/nature10231
Li Y., Song N., Khan F. S., Yanagimoto T., Gao T. (2013). New evidence of morphological characters and DNA barcoding of Pampus argenteus (Euphrasen 1788). J. Fish. China 37, 11. doi: 10.3724/SP.J.1231.2013.38824
Li Y., Song N., Lin L., Gao T. (2016). The complete mitochondrial genome of Pampus echinogaster (Perciformes: Stromateidae). Mitochondrial. DNA. A. DNA. Mapp. Seq. Anal. 27 (1), 289–290. doi: 10.3109/19401736.2014.892081
Li J., Xue L., Cao M., Zhang Y., Wang Y., Xu S., et al. (2020). Gill transcriptomes reveal expression changes of genes related with immune and ion transport under salinity stress in silvery pomfret (Pampus argenteus). Fish. Physiol. Biochem. 46 (4), 1255–1277. doi: 10.1007/s10695-020-00786-9
Liu J., Li C. S. (2013a). A new species of the genus Pampus (Perciformes, Stromateidae) from China. Acta Zootaxonomica Sinica 38 (4), 885–890.
Liu J., Li C. S. (2013b). Identity of silver pomfret Pampus argenteus (Euphrasen1788) based on specimens from its type localitywith aneotype designation(Teleostei Stromateidae). Acta Zootaxonomica Sinica 38 (1), 171–177.
Liu C., Li Y., Chen S., Song N., Gao T. (2015). The complete mitochondrial genome of Pampus punctatissimus (Perciformes: Stromateidae). Mitochondr. DNA. 26 (4), 649–650. doi: 10.3109/19401736.2013.836518
Liu B., Shi Y., Yuan J., Hu X., Zhang H., Li N., et al. (2013). Estimation of genomic characteristics by analyzing k-mer frequency in de novo genome projects. Quant. Biol. 35 (s 1–3), 62–67. doi: 10.48550/arXiv.1308.2012
Lu M., An H., Li L. (2016). Genome survey sequencing for the characterization of the genetic background of Rosa roxburghii tratt and leaf ascorbate metabolism genes. PloS One 11 (2), e0147530. doi: 10.1371/journal.pone.0147530
Luo R., Liu B., Xie Y., Li Z., Huang W., Yuan J., et al. (2012). SOAPdenovo2: an empirically improved memory-efficient short-read de novo assembler. GigaScience 1 (1), 18. doi: 10.1186/2047-217X-1-18
Marçais G., Kingsford C. (2011). A fast lock-free approach for efficient parallel counting of occurrences of k-mers. Bioinformatics 27 (6), 764–770. doi: 10.1093/bioinformatics/btr011
Prost S., Petersen M., Grethlein M., Hahn S. J., Kuschik-Maczollek N., Olesiuk M. E., et al. (2020). Improving the chromosome-level genome assembly of the siamese fighting fish (Betta splendens) in a university master’s course. G3 Genes Genom. Genet. 10 (7), 2179–2183. doi: 10.1534/g3.120.401205
Ranallo-Benavidez T. R., Jaron K. S., Schatz M. C. (2020). GenomeScope 20 and Smudgeplot for reference-free profiling of polyploid genomes. Nat. Commun. 11, 1432. doi: 10.1038/s41467-020-14998-3
Shao F., Han M., Peng Z. (2019). Evolution and diversity of transposable elements in fish genomes. Sci. Rep. 9 (1), 15399. doi: 10.1038/s41598-019-51888-1
Simão F. A., Waterhouse R. M., Ioannidis P., Kriventseva E. V., Zdobnov E. M. (2015). BUSCO: assessing genome assembly and annotation completeness with single-copy orthologs. Bioinformatics 31 (19), 3210–3212. doi: 10.1093/bioinformatics/btv351
Simpson J. T. (2014). Exploring genome characteristics and sequence quality without a reference. Bioinformatics 30 (9), 1228–1235. doi: 10.1093/bioinformatics/btu023
Song H., Zhang Y. X., Yang M. J., Sun J. C., Zhang T., Wang H. Y. (2018). Genome survey on invasive veined rapa whelk (Rapana venosa) and development of microsatellite loci on large scale. J. Genet. 97 (4), e79–e86. doi: 10.1007/s12041-018-0975-z
Van Dam M. H., Henderson J. B., Esposito L., Trautwein M. (2021). Genomic characterization and curation of UCEs improves species tree reconstruction. Syst. Biol. 70 (2), 307–321. doi: 10.1093/sysbio/syaa063
Wang Q., Zeng J., Wang Y., Zhao J., Ma L., Shi Z., et al. (2021). Alternations in the liver metabolome skin and serum antioxidant function of silver pomfret (Pampus Argenteus) is induced by jellyfish feeding. 3. Biotech. 11 (4), 192. doi: 10.1007/s13205-021-02702-1
Wei J., Wu R., Xiao Y., Zhang H., Jawad L. A., Wang Y., et al. (2021). Validity of Pampus liuorum Liu & Li 2013, revealed by the DNA barcoding of Pampus fishes (Perciformes Stromateidae). Diversity 13, 618. doi: 10.3390/d13120618
Will C. L., Lührmann R. (2011). Spliceosome structure and function. CSH. Perspect. Biol. 3 (7), a003707. doi: 10.1101/cshperspect.a003707
Xu S., Zhang H., Gao T. (2020). Comprehensive whole genome survey analyses of male and female brown-spotted flathead fish Platycephalus sp1. Genomics 112 (6), 4742–4748. doi: 10.1016/j.ygeno.2020.08.030
Yang Y., Li Y., Wang Y., Hu J., Zhang M., Sun Y., et al. (2021a). The ultrastructure of spermatogenic cells and morphological evaluation of testicular development in the silver pomfret (Pampus argenteus). Anat. Histol. Embryol. 50 (6), 1034–1042. doi: 10.1111/ahe.12747
Yang Y., Ning C., Li Y., Wang Y., Hu J., Liu Y., et al. (2021b). Dynamic changes in mitochondrial DNA morphology and fission during oogenesis of a seasonal-breeding teleost Pampus argenteus. Tissue. Cell 72, 101558. doi: 10.1016/j.tice.2021.101558
Yin G., Pan Y., Sarker A., Baki M. A., Kim J. K., Wu H., et al. (2019). Molecular systematics of Pampus (Perciformes: Stromateidae) based on thousands of nuclear loci using target-gene enrichment. Mol. Phylogenet. Evol. 140, 106595. doi: 10.1016/j.ympev.2019.106595
Zhang M., Hu J., Zhu J., Wang Y., Zhang Y., Li Y., et al. (2022). Transcriptome antioxidant enzymes and histological analysis reveal molecular mechanisms responsive to long-term cold stress in silver pomfret (Pampus argenteus). Fish. Shellfish. Immunol. 121, 351–361. doi: 10.1016/j.fsi.2022.01.017
Zhao X., Liu Y., Du X., Ma S., Song N., Zhao L. (2022). Whole-genome survey analyses provide a new perspective for the evolutionary biology of shimofuri goby Tridentiger bifasciatus. Animals 12 (15), 1914. doi: 10.3390/ani12151914
Keywords: Pampus, whole genome survey, single-copy genes, genomic characteristics, evolution, PSMC
Citation: Zhao X, Zheng T, Song N, Qu Y and Gao T (2024) Whole-genome survey reveals interspecific differences in genomic characteristics and evolution of Pampus fish. Front. Mar. Sci. 10:1332250. doi: 10.3389/fmars.2023.1332250
Received: 02 November 2023; Accepted: 22 December 2023;
Published: 11 January 2024.
Edited by:
Sérgio P. Ávila, University of the Azores, PortugalReviewed by:
Francisco Jose Roig, Universidad San Jorge, SpainAparna Chaudhari, Central Institute of Fisheries Education (ICAR), India
Copyright © 2024 Zhao, Zheng, Song, Qu and Gao. This is an open-access article distributed under the terms of the Creative Commons Attribution License (CC BY). The use, distribution or reproduction in other forums is permitted, provided the original author(s) and the copyright owner(s) are credited and that the original publication in this journal is cited, in accordance with accepted academic practice. No use, distribution or reproduction is permitted which does not comply with these terms.
*Correspondence: Tianxiang Gao, Z2FvdGlhbnhpYW5nMDYxMUAxNjMuY29t