 Philippe Bouchet
 Wim Decock2
 Britt Lonneville
 Leen Vandepitte
- 1Muséum National d’Histoire Naturelle, Institut Systématique Evolution Biodiversité (ISYEB), CNRS, Sorbonne Université, EPHE, Université des Antilles, Paris, France
- 2Flanders Marine Institute (VLIZ), Ostend, Belgium
Based on the World Register of Marine Species (WoRMS), there are currently c. 242,000 known valid marine species living in the world's oceans and marine biota continue to be discovered and named steadily at a current average of 2,332 new species per year. The “average” newly described marine species is a benthic crustacean, annelid, or mollusc between 2 and 10 mm in size, living in the tropics at depths of 0–60 m, and represented in the description by 7–19 specimens. It is described after a shelf life of 13.5 years in an article with two to three authors in a journal with an IF <1, published by an academic institution or society or a small commercial publisher. It is highly likely that the description is not accompanied by molecular data and that its authors do not work in an institution in a region of the world where the new species comes from. At the current pace of discovery and characterization, it will take several hundred years to describe the remaining 1–2 million unknown marine species. With increased facilitation of access to literature, marine taxonomy will increasingly rely on retired professionals and citizen scientists. The barriers to new marine species descriptions are in part technological (access to habitats that are difficult to sample) and educational (training to generate and use molecular barcodes), but mostly institutional (funding of taxonomic work) and regulatory (restrictions imposed by access and benefit sharing legislation).
1 Introduction
Since Erwin’s seminal paper on the number of arthropod species in tropical forests (Erwin, 1982), scientists have speculated on the magnitude of biodiversity of the planet, with projections ranging from 8.7 ± 1.3 (Mora et al., 2011) to 390 million (Larsen et al., 2017) eukaryotic species. Simultaneously, there is undisputed evidence that we have entered into a Sixth Mass Extinction (Cowie et al., 2022), generating debates on how to accelerate species descriptions before many species will actually become extinct (e.g., Marshall and Evenhuis, 2015; Sharkey et al., 2021; Naggs, 2022; Zamani et al., 2022).
Whether or not the call for accelerating the exploration of marine biodiversity (e.g., Anonymous, 2022; Rogers et al., 2022) will actually have tangible effects in the next decade in terms of species descriptions will at best remain an expert opinion unless we have a baseline to measure current marine species discovery. There are currently c. 242,000 valid marine species known to live in the world oceans (WoRMS, 2023; Table 1). Figure 1A demonstrates a dip in species descriptions during the World Wars and two clear peak years—1758, when Linnaeus published the 10th edition of his Systema Naturae, and 1977, when a single publication described over 1,700 new species of marine Foraminifera (McCulloch, 1977)—and there is no sign that species discovery is reaching an asymptote (Figure 1B): biota continue to be discovered and named steadily at a current average of 2,332 new species per year (see further down), with total number of known and unknown projected to be anywhere from 0.3 million (Costello et al., 2012; Costello, 2014) to 2.2 million species (Mora et al., 2011). However, there does not currently exist detailed metrics of marine species discovery and their taxonomic descriptions in the scientific literature.
Table 1 Partitioning by Kingdom-Phylum of the 241,521 valid marine species known to live in the world oceans according to the World Register of Marine Species, January 2023.
Figure 1 Discovery rate of valid marine species. (A) Number of valid marine species described per year; (B) Cumulative number of valid marine species. Data extracted from WoRMS January 2023. Numbers for 2021-2022-2023 are an underestimate of the actual situation, as marine species descriptions of these years are not yet fully entered into WoRMS.
In order to provide this metric, and assuming that they are representative of the taxonomic effort of the late 2010s, we focus on taxa described in 2013–2017 and we examine in particular:
(1) What is the nature of the new species being discovered? Where in the world ocean do the new species come from in terms of geography and bathymetry?
(2) Who are the authors describing the new species? Where are the new species descriptions being published?
(3) How do the newly described species stand the test of time, and how many will be relegated to synonymy?
We conclude by examining the barriers to the discovery and description of marine species.
2 Materials and methods
There is a time lag between the moment a species is newly described in the scientific literature and its indexing in WoRMS (Supplementary Material S1). For this reason, we targeted new marine species described in 2013–2017, amounting to 11,662 species. We have considered all species originally described as new, irrespective of whether they have subsequently been synonymized; however, 157 nominal taxa originally described at a rank lower than species (i.e., subspecies and/or, in the case of taxa under the Code of Botanical Nomenclature, variety) are not included. Prokaryotes and viruses were not included. We then randomly selected 600 from these 11,662 species (Supplementary Material S2), consulted the original publication containing their descriptions, and documented (Table 2) attributes of the species and its ecological/geographical origin, the context of its discovery, and the scientific publication and its authorship. To analyze the Impact Factor (IF) of publications with new marine species descriptions, we used the IF value for 2018.
Table 2 Attributes of the new species and new species descriptions that have been analyzed.
The random selection of 600 marine species was done directly on the Aphia infrastructure (Vandepitte et al., 2015) through a RANDOM SQL-query on the whole database, taking into account the following parameters: marine and/or brackish extant species only, excluding prokaryotes and viruses and being described in the time period 2013–2017. This random selection was then made available in an Excel file, which formed the basis for all added information retrieved from the original publication, as listed in Table 2.
3 Results
3.1 The nature of newly discovered species
The random 600 new species dataset included species across 23 out of 65 eukaryotic phyla (Figure 2). Phyla not represented in the dataset are taxa with a very small total number of species (e.g., Cycliophora, Nematomorpha) or a very small number of species described in 2013–2017 (e.g., Chaetognatha, Brachiopoda) and that were inherently sensitive to the random selection of 600 species; in a few cases (Euglenophyta, Chromista–Ciliophora, Ascomycota), however, this may also reflect the weakness of the WoRMS database, which does not currently have an active editor for these phyla.
Figure 2 Number of species per phylum from among the 600 new species dataset. ‘Other’ contains single species for the following phyla: Nemertea, Phoronida, Entoprocta, Acanthocephala, Gnathostomulida, and Microsporidia.
The vast majority (74%) of the newly described species are macrobiota (2–200 mm in size), with 17.7% meiobiota (0.2–2 mm), and a much smaller percentage (respectively 4.6% and 3.8%) of microbiota (below 0.2 mm), and megabiota (above 200 mm) (Figure 3). The largest size class (36%) corresponds to the “small macrobiota” (2–10 mm). At 833 mm, the largest species described during the study period was the deep-sea fish Haptenchelys parviocularis (Tashiro and Shinohara, 2014); at the other end of the size spectrum, were several new species of Ochrophyta (Bacillariophyceae and Pelagophyceae) measuring less than 20 µm.
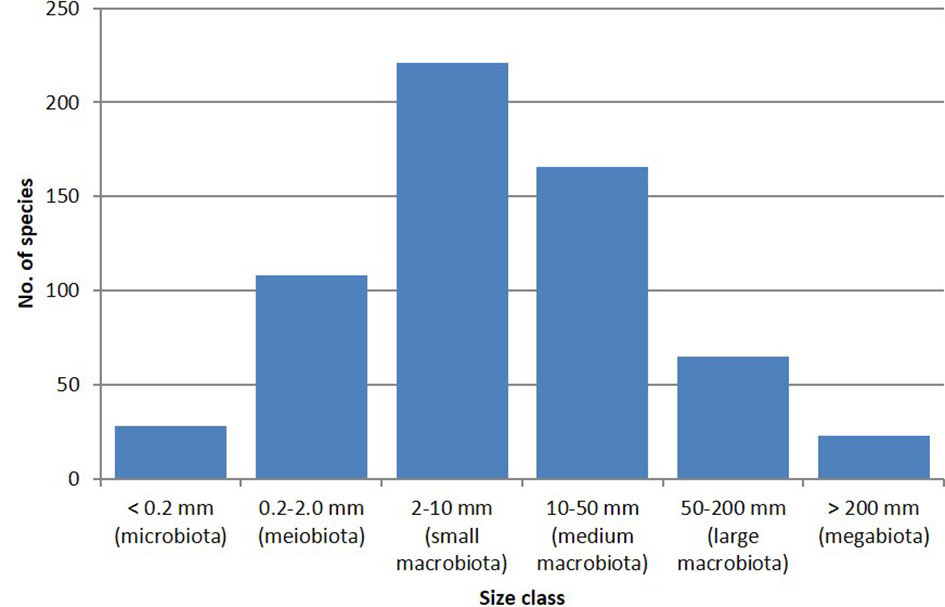
Figure 3 Number of species per size class in the 600 new species dataset. The total amounts to more than 600, as some species are documented to cover more than a single size class.
On average, the new species descriptions are based on 10.8 specimens, ranging from 5 (Echinodermata) to 19 specimens (Crustacea) in major phyla (see Supplementary Table). Interestingly, descriptions of new nematodes, annelids, molluscs, and fishes are all based on a very similar number (7 or 8) of specimens. There were 101 species (16.8%) described based on a single specimen or a single colony.
Of the 600 species in the dataset, 526 (87.7%) are benthic, 42 (7%) nektonic, and 32 (5.3%) planktonic (Figure 3). Parasites are categorized with their host, i.e., a monogene parasitic on a nektonic fish is classified as nektonic. The benthic species range in depth from the intertidal to as deep as 10,800 m; however, the majority of them (287% or 47.8%) live in the 0–60-m interval, and only 42 (7.0%) come from deeper than 1,000 m (Figure 4).
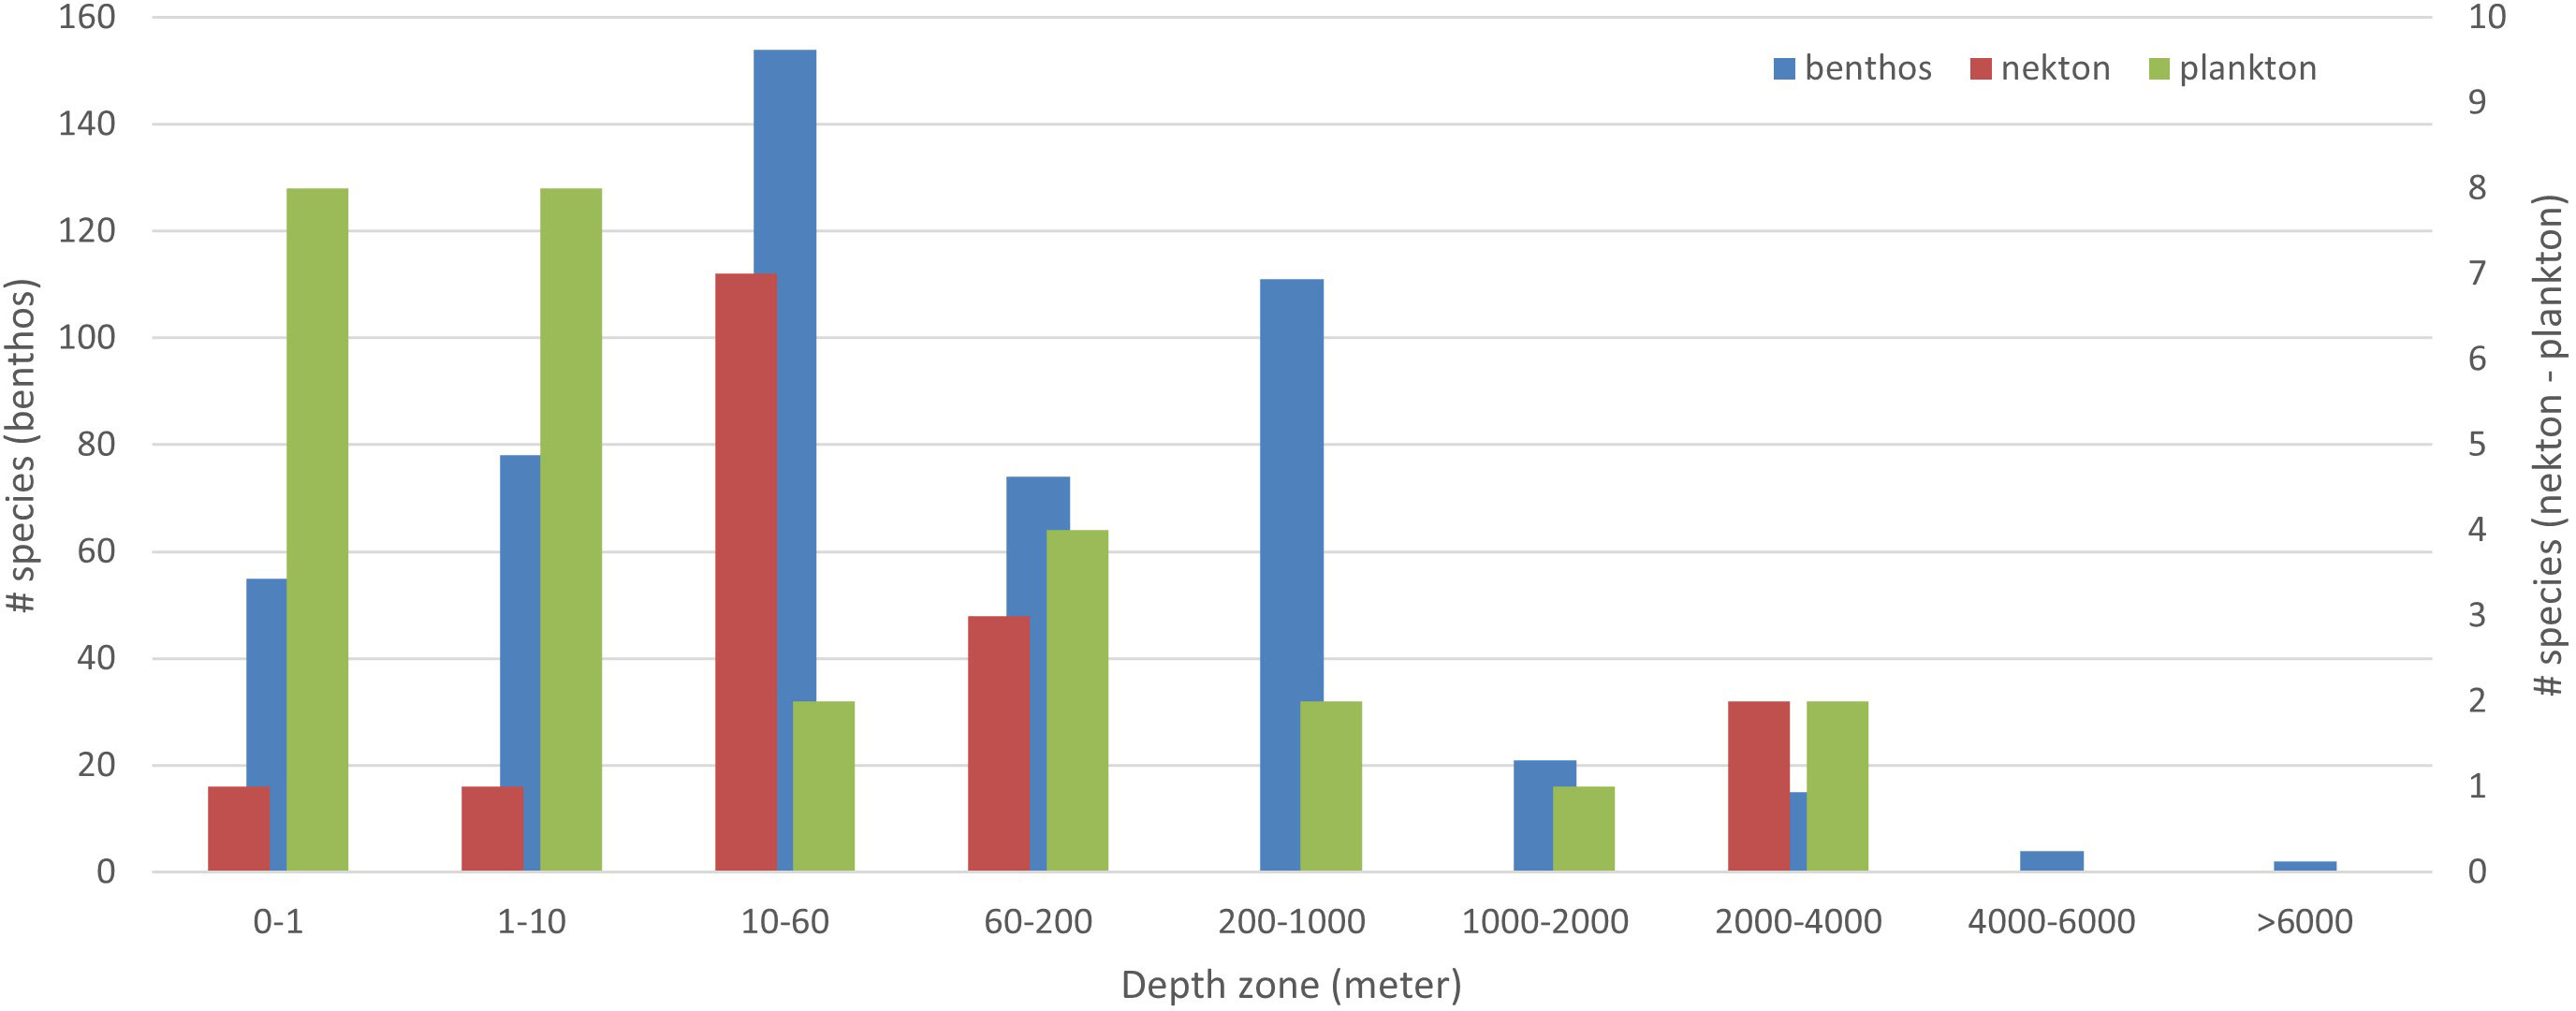
Figure 4 Species per depth-zone: benthos, plankton, nekton. Depth information was missing in the original description of 90 species; total is higher than 510 because species may be allocated to more than one depth interval.
Regarding how the specimens were collected, a little over half (319: 53.2%) of the new species descriptions refer to a research vessel (including submersible) or cruise (see Supplementary Material). Almost half (270, or 45%) do not mention a method of capture or gear. When one is mentioned, it can be a dredge or trawl (101 species), a grab or corer (34), or a net or line (31); the descriptions of 85 species refer to sampling by SCUBA, whereas 9 refer to a manned submersible or ROV.
The type localities of the new species are scattered throughout the world’s oceans (Figures 5A–E); however, the density of type localities varies among oceans, reflecting both the bank of unknown species in each ocean and the research pressure. The Arctic Ocean is especially empty, and this reflects the very small reservoir of new species in that ocean; conversely, 359 (59.8%) of the type localities are located in the tropics. As stated above, only 7.0% of the new species come from deeper than 1,000 m, and this is reflected in the map that essentially shows empty high seas (Figure 5B).
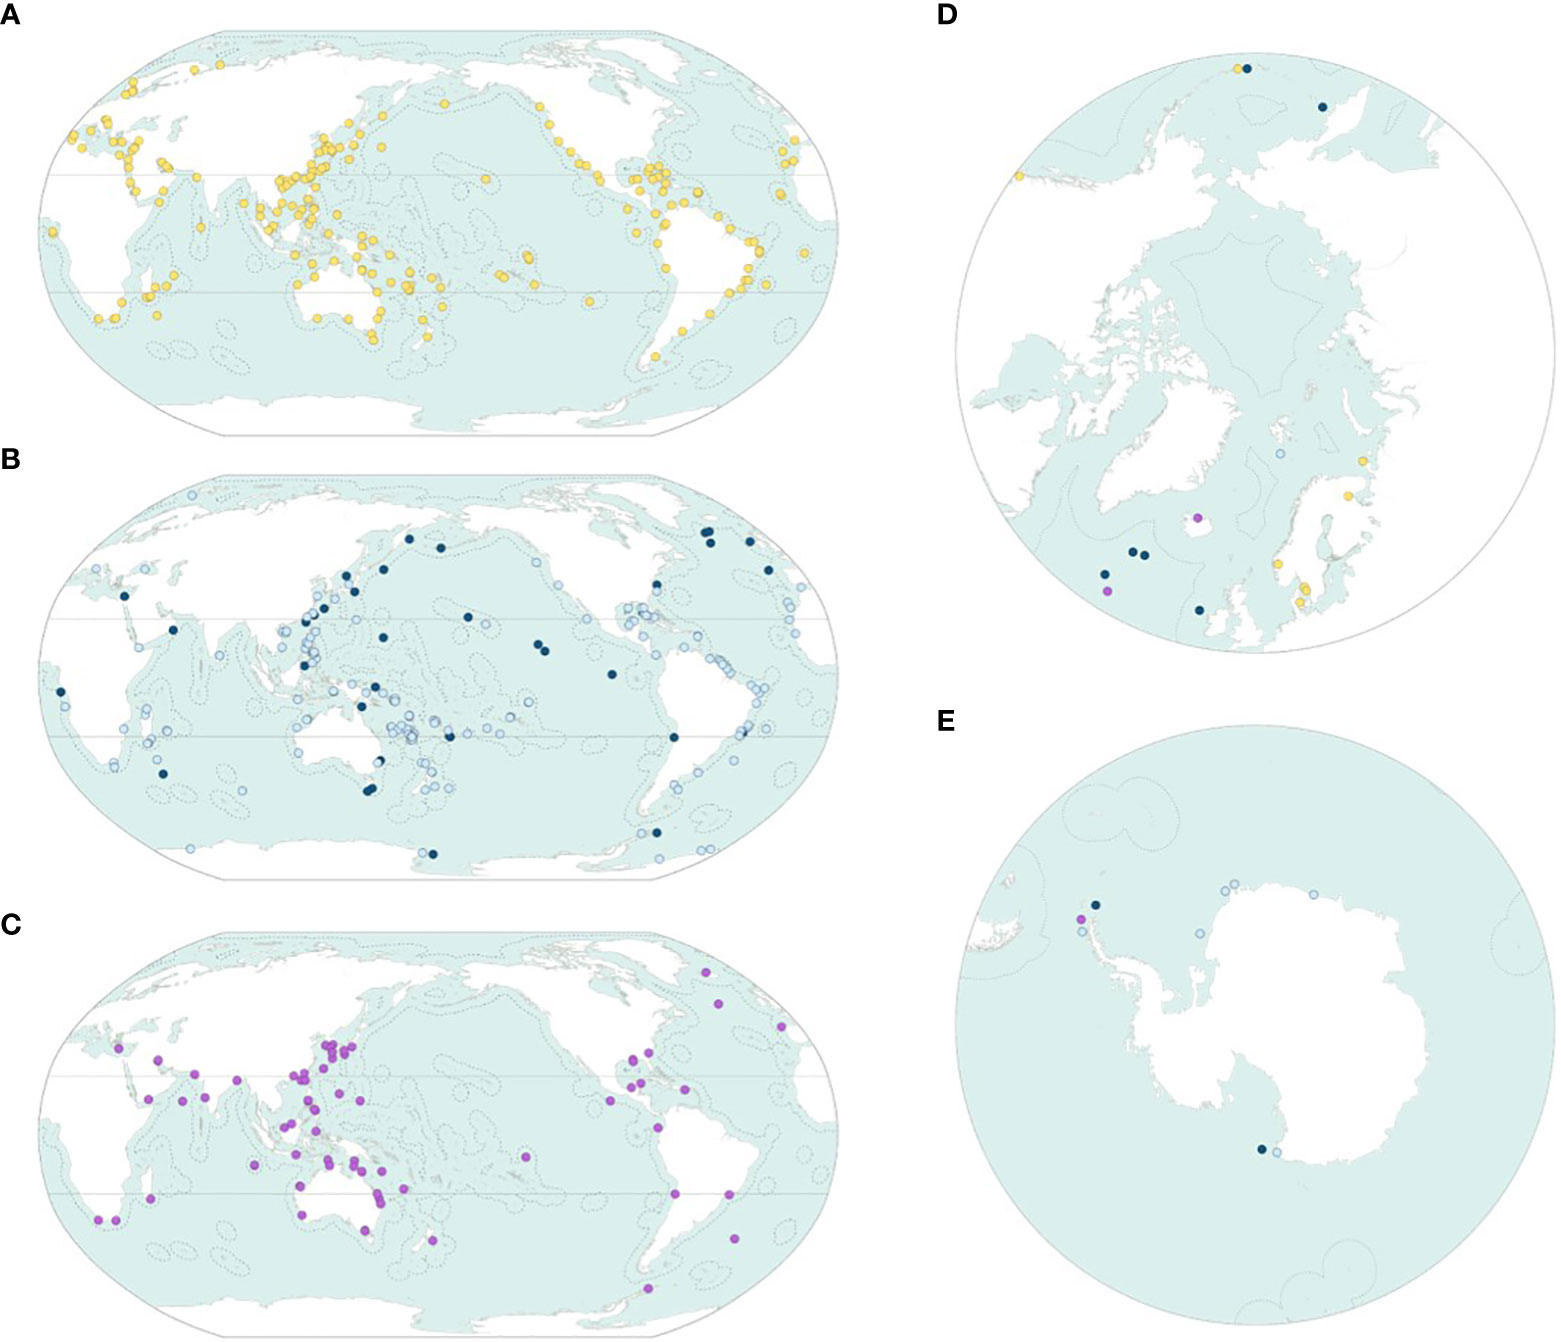
Figure 5 The geographical origin of the new species in the randomly selected dataset. (A) Shallow-water benthic species in the 0–60-m interval (yellow). (B) Deep-water benthic species in the 60–1,000-m (light blue) and deeper than 1,000-m (dark blue) intervals. (C) Planktonic and nektonic species (purple). (D, E) North Pole and South Pole projections. Symbols as on Figures 5A–C.
3.2 How and where are the new species descriptions published?
The 600 new species in the dataset were described in a total of 493 papers/works authored by 753 authors and co-authors—of which 366 had different first authors. Of these 600, 554 were described in articles published in 116 journals, and 46 in books or series published at irregular intervals.
The number one journal in terms of number of new species descriptions is Zootaxa (192), followed far behind by ZooKeys (25). There were 37 journals (or 32% of all journals in the dataset) that contain a single new species description (Figure 6).
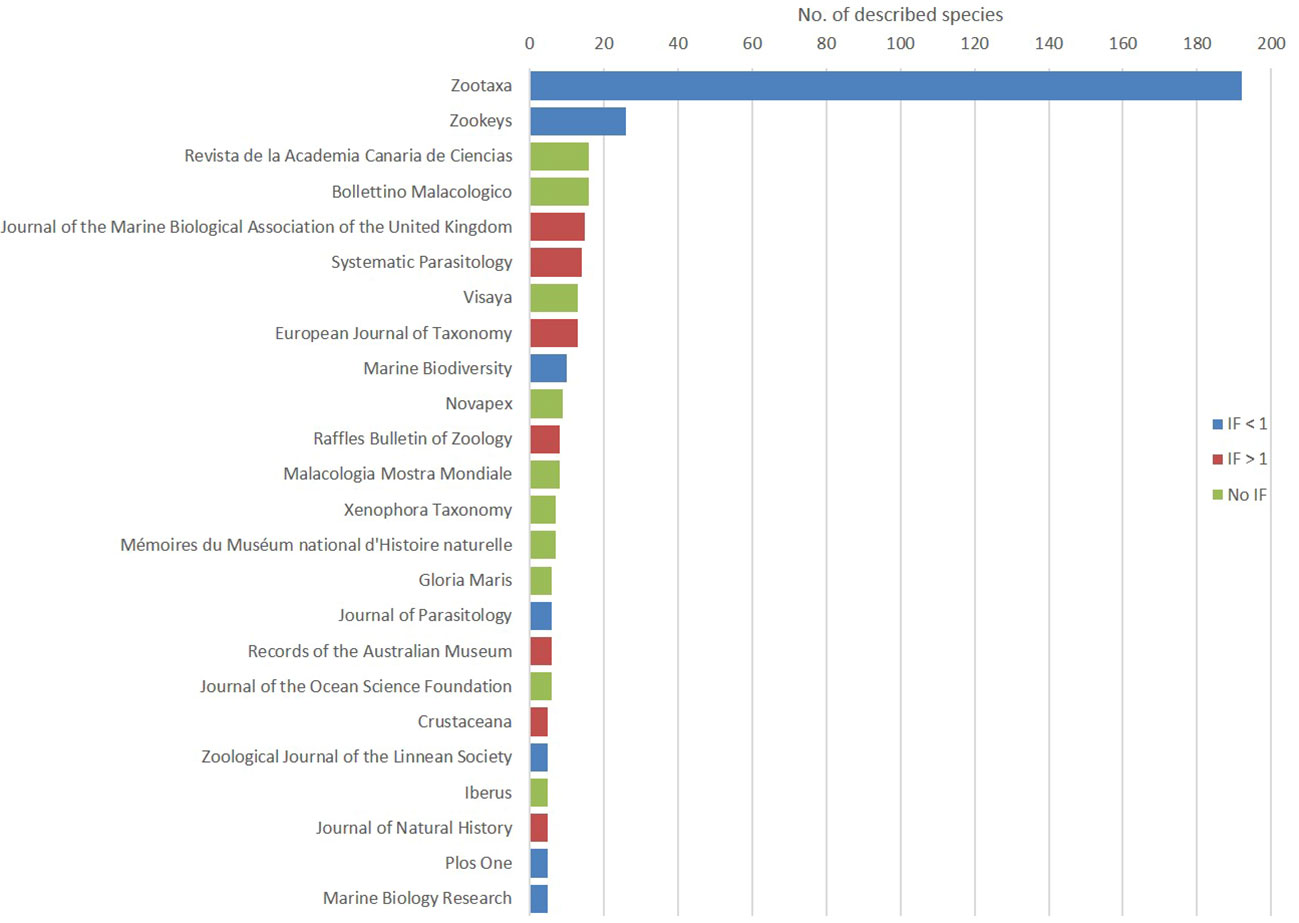
Figure 6 The journals containing the description of five new marine species or more, ranked by number of descriptions in our dataset; color code reflects the Impact Factor (IF).
Marine-focused journals account for 46 new species only (7.7%); the vast majority of new species descriptions (426, i.e., 71%) were published in taxonomic or taxonomically focused journals. Only 77 of the new species (12.8%) were published in books or journals owned by one of the big commercial publishers (Brill, Elsevier, De Gruyter, Schweizerbart, Springer, Taylor and Francis, Wiley-Blackwell), whereas many more (219, or 36.5%) were published by not-for-profit academic institutions and learned societies. The rest of the species (total 304 species, 50.7%) were published by smaller commercial publishers (Magnolia Press [publisher of Zootaxa] 195, Pensoft 30, ConchBooks 21).
Of the 600 new species descriptions, 464 (77.3%) were accessible online, of which 186 (31%) are open access. Altogether, 400 species were described in a journal with an impact factor (IF), of which 164 (27.3%) in a journal with an IF ≥ 1.
Of the 600 new species in the dataset, 164 (27.3%) were described in articles containing a single new species [36 with no impact factor, 60 IF ≥ 1], but one work contained the description of 212 new species—of which 13 are in the 600 species dataset. The median number of new species in an article was 3; however, works published in journals with IF ≥ 1 contained a median of two new species, in journals with IF < 1 a median of three new species, and works without an impact factor contained a median of nine new species.
Articles describing new species were on average coauthored by 2.4 authors, and there was no significant difference between papers describing a single new species—co-authored on average by 2.56 authors [who, however, may not all be co-authors of the name of the new species], and works with 10 species or more—co-authored by 2.6 authors.
Of the 600 new species descriptions, 110 (18.3%) included molecular data, with a GenBank entry referred to in the publication. Two species were even entirely diagnosed based on molecular characters.
The 366 first authors have institutional affiliation or a contact address in 53 different countries (Figure 7). Authors with affiliation in the United States account for 77 species (12.8%) and those with affiliation in the first five countries (USA, Spain, Brazil, Australia, Italy) account together for 276 (46%).

Figure 7 Country of institutional affiliation of first authors.
Authors described new species originating or not from their part of the world (Figure 8). For the purpose of this analysis, we have divided the world according to the continents: Asia, Africa, North America, South America, Europe, Oceania, and Antarctica. Species with a type locality in the high seas or Areas Beyond National Jurisdiction (ABNJ) (35 out of 600) have been allocated to the nearest land area. Note that only first authors are considered in this analysis. What is immediately apparent is that:
(A) Authors from Africa, Oceania, and South America account for respectively 8, 58, and 59 new species (representing respectively 1.3%, 9.7%, and 9.8% of the total number of new species), whereas authors from North America and Asia each both account for 111 new species (18.5%) and authors from Europe account for 253 (42.2%).
(B) Authors from Asia, North America, South America, and Oceania tend to describe new species predominantly from their part of the world, but authors from Europe describe new species from all over the world.
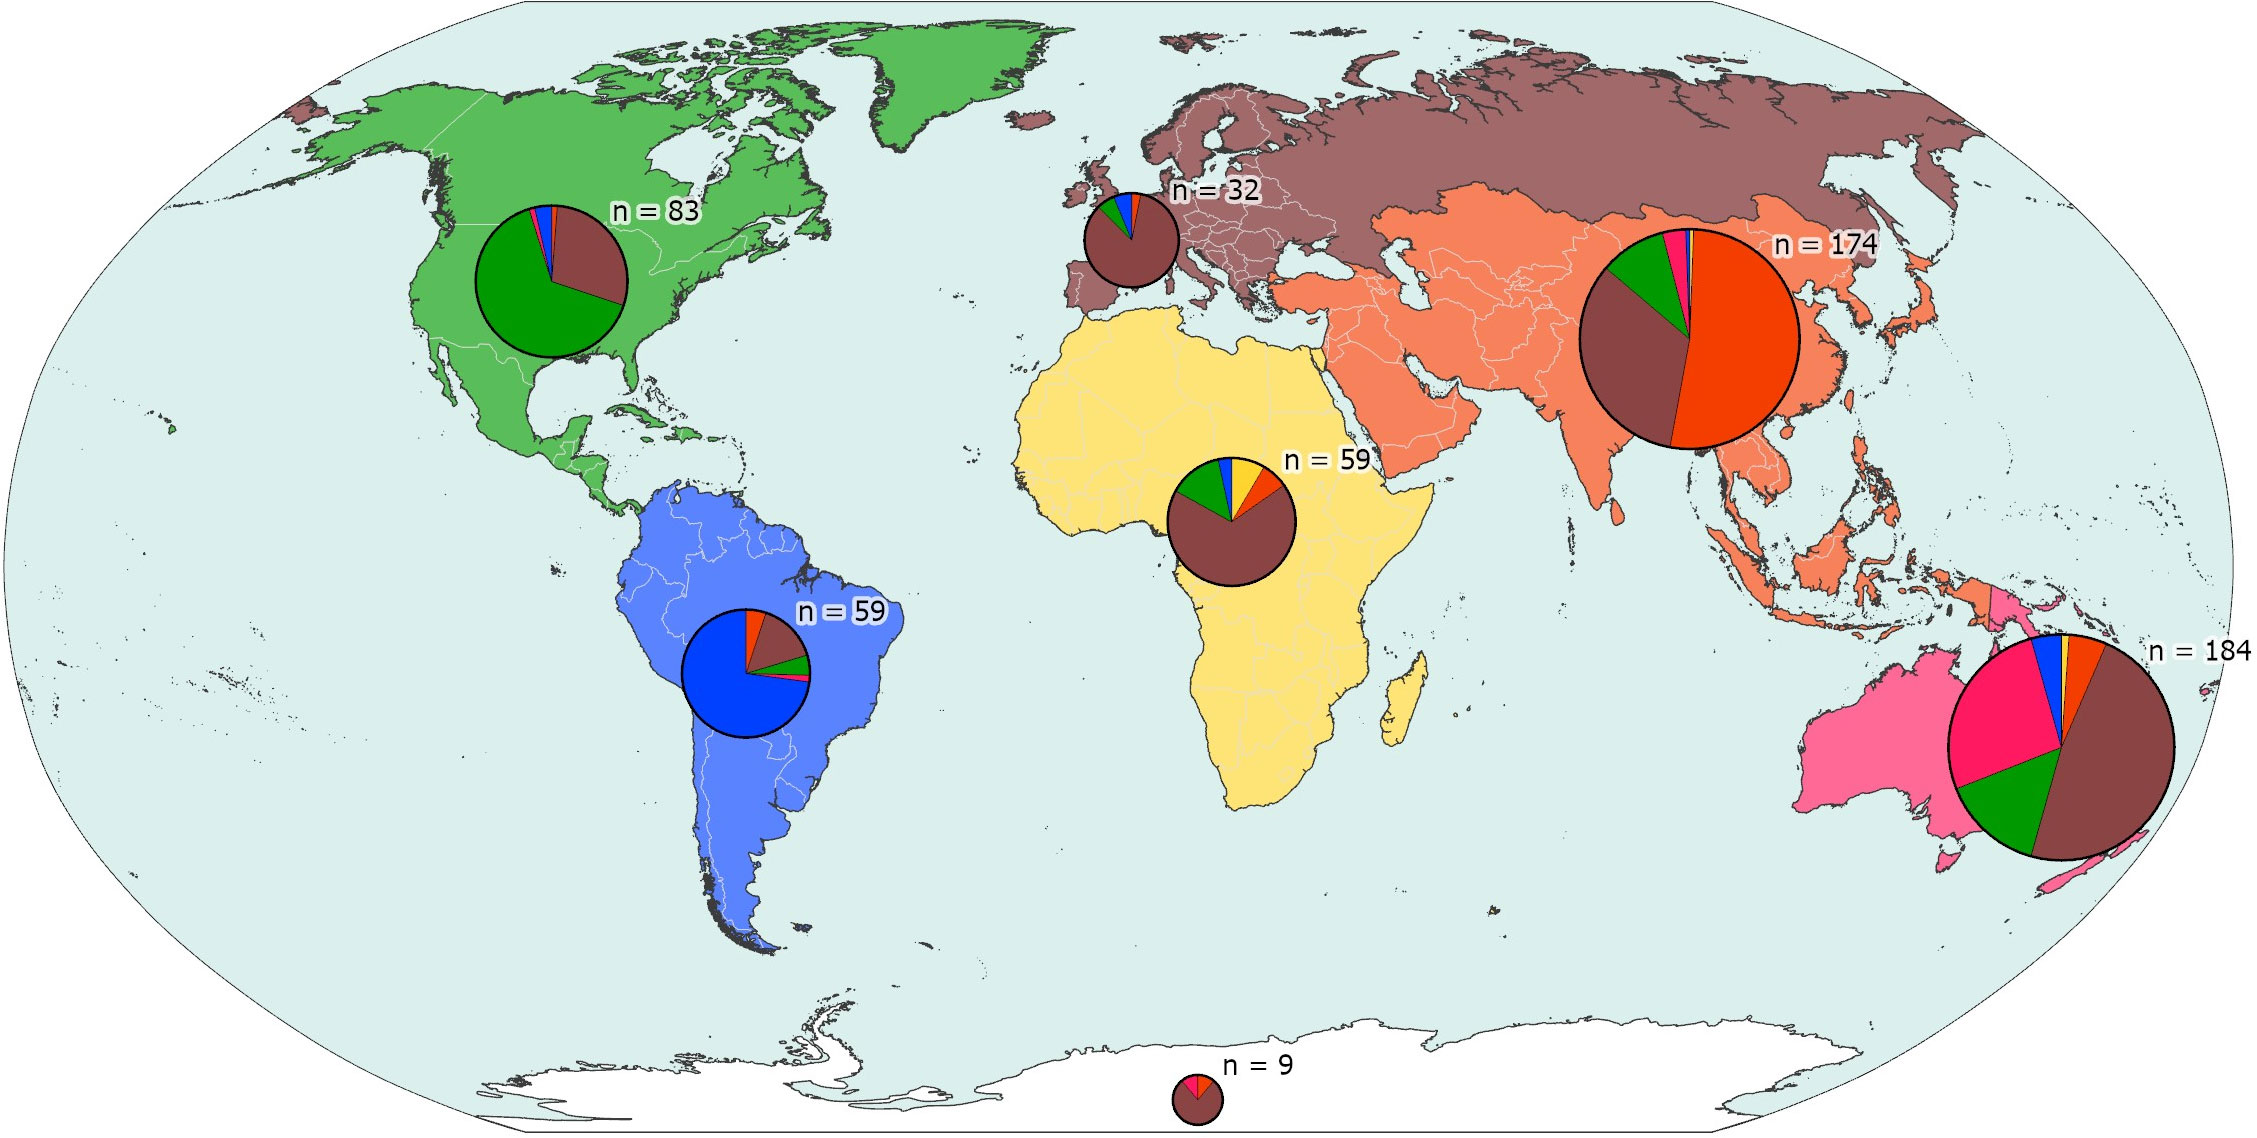
Figure 8 Focus of biogeographical activity of first authors in different continents/parts of the world. Each pie represents the new species from discrete parts of the world, with n representing the number of species involved, and segments of the pie proportional to the geographical origin of the authors of the species descriptions.
The average shelf life (time between the collection of the first specimen of a new species and its description; Fontaine et al., 2012b) was 13.5 years, and the median 7, with an average per group scattering from 25 (Porifera) to 5–7 (Nematoda, Platyhelminthes, Echinodermata), with 12–18 for Cnidaria, Mollusca, Annelida, Arthropoda, and Chordata (Figure 9). The longest shelf life was 119 years for the crab Munidopsis alcocki Ahyong, 2014, the holotype of which had been collected in 1895 by the Investigator expedition and subsequently misidentified with other galatheid species. At the other end of the spectrum, eight species had a shelf life shorter than 1 year.

Figure 9 Average shelf life of selected groups, including the average shelf life of all the species in the dataset (“biota”). The shelf life of 102 species could not be retrieved from the original publication. “Macro-algae” includes Chlorophyta, Rhodophyta, and Ochrophyta.
Mention of some form of funding/grant is made in 364 of the new species descriptions (see Supplementary Material), but it is difficult to see whether this refers to funding that made the sampling of the new species possible or to funding for the taxonomic research leading to the recognition and description of the new species. However, examination of the papers containing the descriptions of the other 236 species shows a variety of situations, from institutional authors working up specimens from an oceanographic cruise to individual (non-professional) authors describing self-collected specimens.
3.3 Standing the test of time
The description of a new species is the result of a hypothesis that a specimen or group of specimens differ enough from known species and should be designated by a separate name. Like all hypotheses in science, such a hypothesis can be falsified, i.e., a species described as new by author A can be treated as a synonym of another by author B. However, because there are rarely two or more taxonomists specializing simultaneously on the same group of organisms (genus, or family, or even phylum) synonymization is not a result that occurs quickly after the original description: synonymization results from the accumulation of new evidence, essentially the examination of new characters (e.g., molecular) based on a new technique, or examination of additional specimens newly sampled from new localities, or the realization that the same species had been previously described in a publication unknown to author A. Synonymization is thus a decision process that usually extends over many years (and can be reversed).
We have analyzed a time series of all the new marine species described in 1910–2020 and examined their status (accepted/unaccepted) as recorded in January 2023 in WoRMS. As anticipated, the synonymy ratio climbs from 1.3% for species described in 2013—which have barely had the chance to be confronted to the test of time—to 25% for species described before 1950—which have been testable hypotheses for over 70–110 years (Figure 10). Assuming that the synonymy ratio for newly described species can be extrapolated from this time series, it is thus possible that up to 25% of the species described in modern times will ultimately end up as synonyms, i.e., roughly, only 1,750 of the 2,332 new marine species described annually represent valid discoveries.
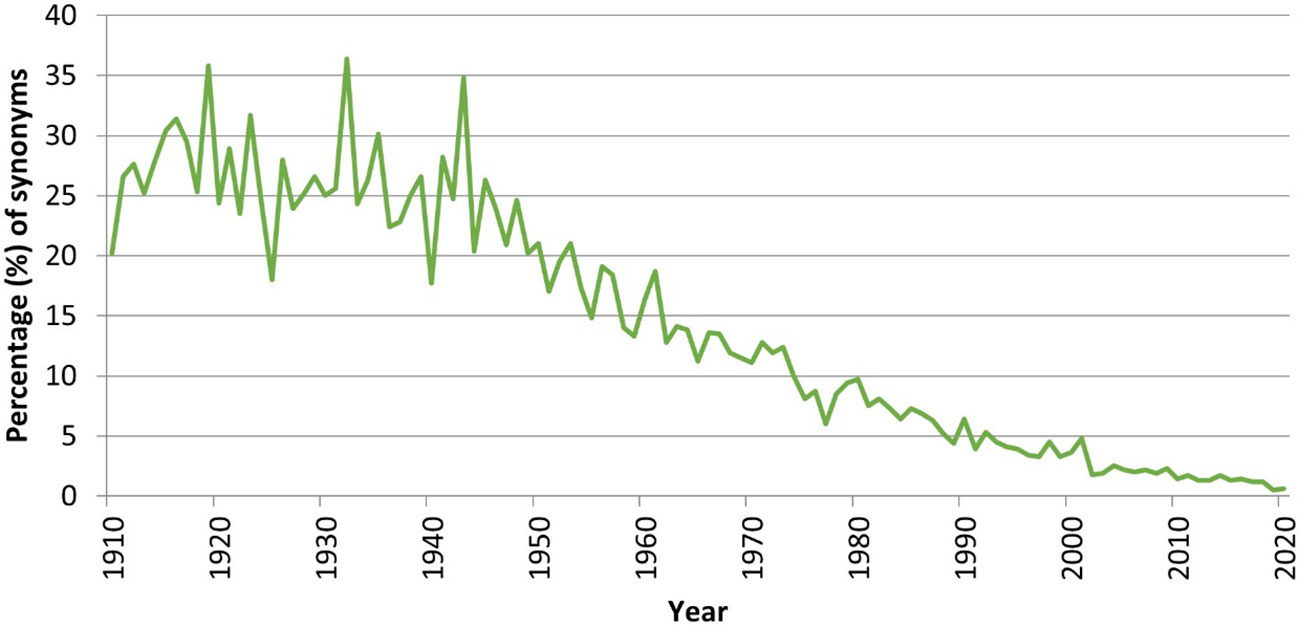
Figure 10 Ratio (%) of synonyms versus accepted names for the time period 1910–2017, based on available information in January 2023.
4 Discussion
The description of a new species in a scientific publication involves a number of successive conditions, which can form direct or indirect barriers to new species discovery:
4.1 Specimens have to be collected in the field and/or be available in a repository
For many decades of scientific discovery of marine biodiversity, the sampling of specimens of potentially new species in the field used to be limited by the difficulty of travelling to what were then remote parts of the globe. Although insecurity issues still limit access to certain coastlines or open seas, travel is of course infinitely easier/faster today than it was a century, or even 50 years ago. However, there are still limitations to sampling new species in the world’s oceans. Access to the deep sea has been possible for 150 years from specially equipped vessels, but the discovery and exploration of vent ecosystems only started 50 years ago at the onset of manned research submersibles (e.g. Amon et al., 2017; Thaler and Amon, 2019: Robertson et al., 2022). Deep-sea exploration remains limited by the availability of research vessels in many parts of the world. For instance, East Africa and many island states (e.g., Seychelles, French Polynesia, Barbados) do not have research vessels permanently operating in their EEZs. As noted above, only 7.0% of the new species come from deeper than 1,000 m, and this is reflected in the map (Figure 5B) that essentially shows empty high seas. Microscopic organisms (e.g., mesopsammon, parasites, picophytoplankton) require special laboratory techniques for isolation, preparation, sometimes also cultivation, and study. Although many of these techniques do not require exceptionally high skills or funding, they are best learnt from a mentor; these are few in numbers, and their know-how may be lost altogether when they retire. Finally, access to certain habitats still rests on technologies that are not readily available to taxonomists, e.g., sampling the mesophotic zone (e.g., Loya et al., 2019; Albano et al., 2020) that requires the use of trimix gases and rebreathers, or the sampling of gelatinous plankton (e.g., Haddock et al., 2017) that requires ROVs.
4.2 A scientist has to be available to examine them critically
Although taxonomy and taxonomists are often portrayed as endangered species (Pearson et al., 2011; Wägele et al., 2011), there have never been so many authors responsible for new species descriptions. A significant part of the taxonomic workforce in fact comprises retired professionals and citizen scientists. A citizen scientist is not necessarily someone without training in science but, like a retired professional, he/she is someone who is not paid to do research and publish scientific papers. In the case of marine molluscs, 57% of the 6,656 species described in 2000–2014 were described by “amateurs” (Bouchet et al., 2016). Some would argue that molluscs represent a special case, with a long tradition of amateur taxonomists, but Fontaine et al. (2012a) likewise documented that over 60% of the new land and freshwater animals described from Europe in 1998–2007 had been described by non-professionals. Amateurs are recognized as an essential part of the workforce in ecology and astronomy, but the magnitude of non-professional taxonomists’ contributions to alpha-taxonomy has not been fully realized until now. Fontaine et al. (2012a) stressed the importance of developing a system that better supports and guides this extraordinary workforce, as we seek to overcome the Taxonomic Impediment and speed up the process of describing planetary biodiversity.
4.3 A scientist needs to be aware of previously named species in the same genus or family
Until c. 20 years ago, a barrier to new marine species description was access to knowledge of the already known species and their descriptions. This essentially limited the practice of taxonomy to professional scientists working in academic institutions in first-world countries, with access to Zoological Record and a library with physical copies of journals/books. Although the imbalance in favor of first-world countries is still strong, the development of two publicly accessible online resources is facilitating access to knowledge on the already known species by a much broader public of professional and non-professional scientists from throughout the world. One is the World Register of Marine Species (WoRMS Editorial Board, 2023: https://www.marinespecies.org/) founded in 2007, which is accessed yearly by ± 2 million unique users that in 2022 accessed 60 million pages. (Incidentally, of the 568 animal species in our dataset, 34% are missing in Zoological Record and 71% are missing in ZooBank). The second is the Biodiversity Heritage Library (BHL: https://www.biodiversitylibrary.org) founded in 2005, which is giving access to literature published prior to 1923 (and to a lesser extent to more modern literature). Ironically, access to modern literature is now the remaining bottleneck for knowledge of the already known species and their descriptions: our study found that only 31% of the new species descriptions in our 2013–2017 dataset are available online in open access. Naturally, researchers use the services of online networks (e.g., AcademiaEdu, ResearchGate; many may also use the pirate site SciHub) and/or their institutions pay subscriptions to commercial publishers, and when all these resources are combined we found that altogether 77% of the current new species descriptions are accessible online. This still leaves 23% that are not—mainly because of copyright restrictions—and this constitutes a self-imposed barrier to the work of taxonomists. Costs of institutional subscriptions to journals are variable, but the online purchase of single articles has a fixed price, and we found that, based on analysis of the VLIZ library (Flanders Marine Institute, the institution that hosts WoRMS), the 77 non-open access descriptions in our 600 species pool cost on average 25.5 € per species, with a range from 5€–180€.
4.4 The specimens under study and the known species have to differ sufficiently for the case for a new species to be made
Traditionally, new species were recognized and described based on a suite of morphological characters, the examination and interpretation of which require considerable training and experience. In the early-mid 2000s, the advent of molecular techniques, notably “DNA barcoding,” was seen as a revolutionary new approach to taxonomical decision-making (e.g., Tautz et al., 2003; Blaxter, 2004), a measure of distance between specimens. However, after 20 years of DNA barcoding, only 8.9% (BOLD) and 18.3% (GenBank) of newly described marine species include molecular data in their attributes. Remarkably, this is a similar proportion as for the already known marine species (GenBank=19.3%; BOLD=18.9%), although with very different values in different phyla, from 51.7% (GenBank) to 57.1% (BOLD) in fishes and 47.9% (GenBank) to 48.0% (BOLD) in Cephalopoda, to 13%–25% (GenBank & BOLD) in most phyla of the macrobenthos, and even less for nematodes, bryozoans, and Foraminifera (Figure 11). Leaving aside the issue of the quality of sequences, identifications and lack of vouchers for many of the data in GenBank (e.g., Harris, 2003; Meyer and Paulay, 2005; Meiklejohn et al., 2019) and thus indirectly in BOLD, this implies that we are not closing the gap between known species with and without a sequence, which in turn implies that a solid experience of morphological characters is still a requisite for the evaluation and description of new marine species.
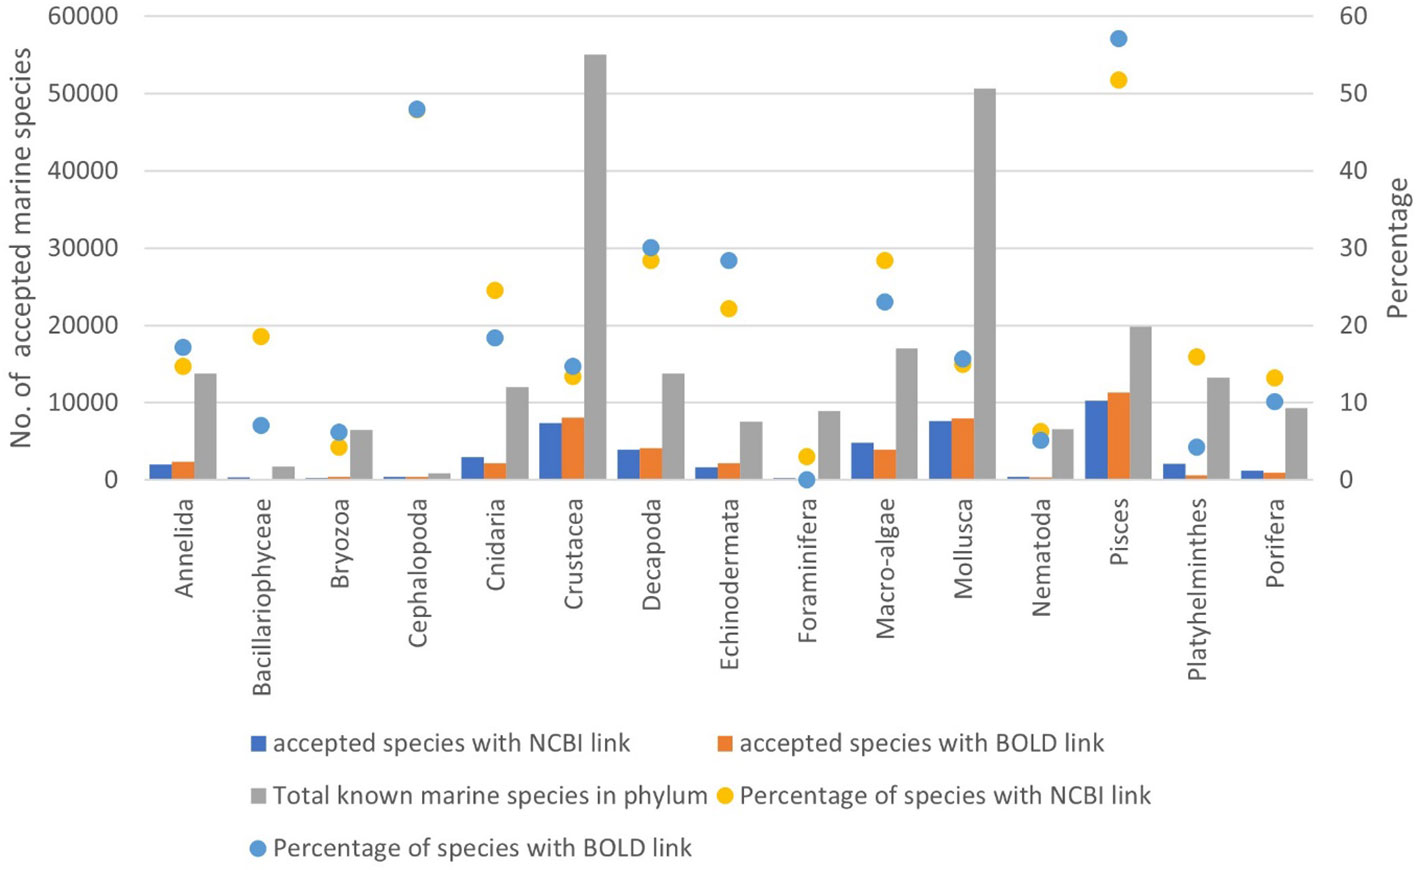
Figure 11 Ratio (raw numbers) of the total number of accepted marine species in WoRMS versus the number of accepted species in WoRMS that have an NCBI-link (GenBank) or a BOLD link documented in WoRMS, for selected phyla and groups. “Macro-algae” includes Chlorophyta, Rhodophyta, and Ochrophyta.
4.5 The description has to be published in a scientific publication
Once a new species has been circumscribed and described based on morphological and/or molecular characters, its description must be made open in a publication. In selecting a journal to which to submit their work for publication, professional scientists will probably choose a journal with the highest possible Impact Factor, as this will have a positive effect on their careers, promotions, and grant applications. However, it is well known that taxonomic papers have a very long cited life but a very low immediacy, and the publication of large taxonomic papers or monographs in journals with high IF is actively discouraged by such journals. The issue of cost is also an important one in selecting a journal for publication, as journals with high IF (many of them owned by commercial publishers) charge publication costs. Without grant funds one cannot publish in such a journal, and amateurs or retired professionals do not have those funds. As a result, our study has demonstrated that only articles with a small number of new species make it to journals with an IF ≥ 1 whereas works containing the description of many new species are confined to journals or books without an impact factor. The publication of large monographs is acceptable to authors who do not care about the Impact Factor, and there is a good chance that such authors will be retired professionals or citizen scientists.
4.6 On a final note
Through a combination of improved access to existing knowledge, improved communication among taxonomists, technological advances, and the development of new communities of authors (emerging countries, citizen scientists), taxonomy is definitely not a dying branch of marine sciences: there has never been so many authors worldwide describing so many new marine species. However, if the number of unknown marine species is anywhere between 60,000 (Costello et al., 2012) and 1,950,000 (Mora et al., 2011), then at the current pace of new species description it will take 30–1,000 years before all marine species are described. The lower end of this range would be optimistic enough but, although this paper is not the place to discuss the size of the reservoir of unknown species in the world oceans, it is obvious that Costello’s estimate was far too conservative, and it is more likely that we are still many decades away from an appropriate inventory of the species that live on this planet.
Whereas there is no arguing about the barriers that new technology can open, we want here to highlight lack of connection between what technology can do and how it is actually used by the scientists who describe new marine species. New marine species description is still very much a cottage industry that relies on basic sampling techniques and the observation of morphological characters. In our age of environmental anxiety, there is a tendency for high-tech oceanography to promote “non-invasive” observation/measurements cruises. Although these generate exciting images that are shared—often live—on the internet, such non-invasive observation programmes in little-known parts of the world ocean are, in our eyes, lost opportunities to discover unknown marine species.
Whereas the technical and technological barriers to new species exploration are being lifted, it must be stressed, however, that the regulatory barriers to this exploration are mounting. The Convention on Biological Diversity (CBD; https://www.cbd.int/convention/) has been ratified by 196 countries—not including, notably, the USA - and of these 135 are party to the Nagoya Protocol (https://www.cbd.int/abs/). Compliance with regulations on “Access and Benefit Sharing” and “Prior Informed Consent” is a formidable obstacle on the road to the discovery of new species (Bouchet et al., 2016). Even the high seas (Areas Beyond National Jurisdictions - ABNJs), which traditionally have been free for all, are the subject of international discussions (Tiller et al., 2019; Abegón-Novella, 2022). The pressure to include digital sequence data (DSI) in the Nagoya Protocol, whereas seen by some as a step in the right direction (Ambler et al., 2021), is causing much concern in academia (Scholz et al., 2022). The regulations introduced by the CBD and the Nagoya Protocol are seen by many academics as limiting biodiversity discovery, when they were supposed to boost it (Neumann et al., 2018; Prathapan et al., 2018), and we would like to see more countries creating the “conditions to promote and encourage research [ … ] through simplified measures on access for non-commercial research purposes”, as included in Article 8a of the Nagoya Protocol.
We have provided the metrics to judge whether the next decade will witness an acceleration of new marine species discovery and description, as advocated by several programs and networks. Some of the barriers to this acceleration are clearly manmade. However, discussions in international governmental forums are not heading in the direction of simplifying access to biodiversity, and academics should not expect the regulatory scene to change significantly in the next decade. Conversely, we advocate for a better recognition of the role of “amateur” taxonomists (citizen scientists and retired academics) and supporting their research through publicly and privately funded programs.
Data availability statement
The datasets presented in this study can be found in online repositories. The names of the repository/repositories and accession number(s) can be found in the article/Supplementary Material.
Author contributions
The first author initiated the idea and concept of this manuscript. All authors have contributed equally to the data quality control and analysis. Manuscript writing was mainly done by the first and last author (PB and LV), with contributions on fine-tuning by all authors. BL created all the maps. All authors contributed to the article and approved the submitted version.
Acknowledgments
The authors are grateful to Thomas Lanssens and Justin Defever (formerly at VLIZ, currently at ILVO) for assistance in the data collection, Sophie Bary (formerly at MNHN) for the analysis leading to Figure 8, Zohra Bouchti (VLIZ) for library analysis, and Virginie Heros (MNHN) for the analysis of coverage by Zoological Record. Robert Cowie provided linguistic and other editorial advice; Karen Osborne, Richard Pyle, and Carole Baldwin pointed us to recently published research. This work makes use of data and/or infrastructure provided by VLIZ and INBO and funded by Research Foundation - Flanders (FWO) as part of the Belgian contribution to LifeWatch. The work of WD, BL, BV, and LV is funded by Research Foundation - Flanders (FWO) as part of the Belgian contribution to LifeWatch.
Conflict of interest
The authors declare that the research was conducted in the absence of any commercial or financial relationships that could be construed as a potential conflict of interest.
Publisher’s note
All claims expressed in this article are solely those of the authors and do not necessarily represent those of their affiliated organizations, or those of the publisher, the editors and the reviewers. Any product that may be evaluated in this article, or claim that may be made by its manufacturer, is not guaranteed or endorsed by the publisher.
Supplementary material
The Supplementary Material for this article can be found online at: https://www.frontiersin.org/articles/10.3389/fmars.2023.929989/full#supplementary-material
Supplementary Material S1 | The year of description of species catalogued in WoRMS during any given calendar year, 2013-2021. The graph shows that species described in any given n year are mostly captured during n, n+1 and n+2, with marginally more in n+3 and n+4, and residually few more in n+5 and later.
Supplementary Material S2 | Dataset. WoRMS Data Management Team; (2023): 600 randomly selected marine species from WoRMS, described between 2013 and 2017 with metrics extracted from their original descriptions. Marine Data Archive. https://doi.org/10.14284/591.
References
Abegón-Novella M. (2022). Negotiating an international legal instrument on biodiversity beyond national jurisdiction: a look ahead. Env. Policy Law 52, 21–37. doi: 10.3233/EPL-210082
Albano P. G., Azzarone M., Amati B., Bogi C., Sabelli B., Rilov G. (2020). Low diversity or poorly explored? mesophotic molluscs highlight undersampling in the Eastern Mediterranean. Biodivers Conserv. 29, 4059–4072. doi: 10.1007/s10531-020-02063-w
Ambler J., Diallo A. A., Dearden P. K., Wilcox P., Hudson M., Tiffin N. (2021). Including digital sequence data in the Nagoya protocol can promote data sharing. Trends Biotechnol. 39, 116–125. doi: 10.1016/j.tibtech.2020.06.009
Amon D. J., Fryer P., Glickson D., Pomponi S., Lobecker E., Cantwell K., et al. (2017). Deepwater exploration of the Marianas [in special issue: new frontiers in ocean exploration: the E/V nautilus, NOAA ship okeanos explorer and R/V falkor field season. Oceanography 30 (1), 60–65. doi: 10.5670/oceanog.2017.supplement.01#sthash.usB6fq8O.dpuf
Anonymous (2022) ISA sustainable seabed knowledge initiative roadmap to 2025 establishes an inclusive collaborative partners network to unlock biodiversity knowledge in the area. Available at: https://www.isa.org.jm/news/.
Convention on biological diversity. Available at: https://www.cbd.int/convention/.
Blaxter M. (2004). The promise of a DNA taxonomy. Philos. Trans. R. Soc B Biol. Sci. 359 (1444), 669–679. doi: 10.1098/rstb.2003.1447
Bouchet P., Bary S., Heros V., Marani G. (2016). How many species of molluscs are there in the world’s oceans, and who is going to describe them? mém. Mus. Nat. Hist. Nat. 208 [Tropical Deep-Sea Benthos 29], 9–24.
Costello M. J. (2014). Further evidence of more taxonomists discovering new species, and that most species have been named: response to bebber et al., (2014). New Phytol. 202, 739–740. doi: 10.1111/nph.12689
Costello M. J., Wilson S., Houlding B. (2012). Predicting total global species richness using rates of species description and estimates of taxonomic effort. Syst. Biol. 61, 871–883. doi: 10.1093/sysbio/syr080
Cowie R. H., Bouchet P., Fontaine B. (2022). The sixth extinction: fact, fiction, or speculation? Biol. Rev. 97, 640–663. doi: 10.1111/brv.12816
Erwin T. L. (1982). Tropical forests: their richness in Coleoptera and other Arthropod species. Coleopterists Bull. 36 (1), 74–75.
Fontaine B., Perrard A., Bouchet P. (2012b). 21 years between discovery and description of new species. Curr. Biol. 22, R943–R944. doi: 10.1016/j.cub.2012.10.029
Fontaine B., van Achterberg K., Alonso-Zarazaga M. A., Araujo R., Asche M., Aspöck H., et al. (2012a). New species in the old world: Europe as a frontier in biodiversity exploration, a test bed for 21st century taxonomy. PloS One 7 (5), e36881. doi: 10.1371/journal.pone.0036881
Haddock S. H. D., Christianson L. M., Francis W. R., Martini S., Dunn C. W., Pugh P. R., et al. (2017). Insights into the biodiversity, behavior, and bioluminescence of deep-sea organisms using molecular and maritime technology. Oceanography 30 (4), 38–47. doi: 10.5670/oceanog.2017.422
Harris D. J. (2003). Can you bank on GenBank? Trends Ecol. Evol. 18, 317–319. doi: 10.1016/S0169-5347(03)00150-2
Larsen B. B., Miller E. C., Rhodes M. K., Wiens J. J. (2017). Inordinate fondness multiplied and redistributed: the number of species on earth and the new pie of life. Q. Rev. Biol. 92, 229–265. doi: 10.1086/693564
Loya Y, Puglise K., Bridge T. (2019). Mesophotic coral ecosystems In: Coral Reefs of the World (Springer), 12.
Marshall S. A., Evenhuis N. L. (2015). New species without dead bodies: a case for photo-based descriptions, illustrated by a striking new species of marleyimyia hesse (Diptera, bombyliidae) from south Africa. ZooKeys 525, 117–127. doi: 10.3897/zookeys.525.6143
McCulloch I. (1977). Qualitative observations on recent foraminiferal tests with emphasis on the eastern pacific (Los Angeles: University of Southern California).
Meiklejohn K. A., Damaso N., Robertson J. M. (2019). Assessment of BOLD and GenBank – their accuracy and reliability for the identification of biological materials. PloS One 14 (6), e0217084. doi: 10.1371/journal.pone.0217084
Meyer C. P., Paulay G. (2005). DNA Barcoding: error rates based on comprehensive sampling. PloS Biol. 3 (12), e422. doi: 10.1371/journal.pbio.0030422
Mora C., Tittensor D. P., Adl S., Simpson A. G. B., Worm B. (2011). How many species are there on earth and in the ocean? PloS Biol. 9 (8), e1001127. doi: 10.1371/journal.pbio.1001127
Naggs F. (2022). The tragedy of the natural history museum, London. Megataxa 7 (1), 85–112. doi: 10.11646/megataxa.7.1.2
Neumann D., Borisenko A. V., Coddington J. A., Häuser C. L., Butler C. R., Casino A., et al. (2018). Global biodiversity research tied up by juridical interpretations of access and benefit sharing. Org. Divers. Evol. 18, 1–12. doi: 10.1007/s13127-017-0347-1
Pearson D. L., Hamilton A. L., Erwin T. L. (2011). Recovery plan for the endangered taxonomy profession. BioScience 61, 58–63. doi: 10.1525/bio.2011.61.1.11
Prathapan K. D., Pethiyagoda R., Bawa K. S., Raven P. H., Dharma Rajan P. (2018). When the cure kills–CBD limits biodiversity research. Science 360, 1405–1406. doi: 10.1126/science.aat9844
Robertson D. R., Tornabene L., Lardizabal C. C., Baldwin C. C. (2022). Submersibles greatly enhance research on the diversity of deep-reef fishes in the greater Caribbean. Front. Mar. Sci. 8, 800250. doi: 10.3389/fmars.2021.800250
Rogers A. D., Appeltans W., Assis J., Ballance L. T., Cury P., Duarte C., et al. (2022). Discovering marine biodiversity in the 21st century. Adv. Mar. Biol. 93, 23–115. doi: 10.1016/bs.amb.2022.09.002
Scholz A. H., Freitag J., Lyal C. H. C., Sara R., Cepeda M. L, Cancio I., et al. (2022). Multilateral benefit-sharing from digital sequence information will support both science and biodiversity conservation. Nat. Commun. 13, 1086. doi: 10.1038/s41467-022-28594-0
Sharkey M. J., Janzen D. H., Hallwachs W., Chapman E. G., Smith M. A., Dapkey T., et al. (2021). Minimalist revision and description of 403 new species in 11 subfamilies of Costa Rican braconid parasitoid wasps, including host records for 219 species. Zookeys 1013, 1–665. doi: 10.3897/zookeys.1013.55600
Tashiro F., Shinohara G. (2014). A new species of deep-sea synaphobranchid eel, Haptenchelys parviocularis (Anguilliformes: Synaphobranchidae), from Japan. Ichthyological Res. 62 (2), 115–121. doi: 10.1007/s10228-014-0410-2
Tautz D., Arctander P., Minelli A., Thomas R. H., Vogler A. P. (2003). A plea for DNA taxonomy. Trends Ecol. Evol. 18, 70–74. doi: 10.1016/S0169-5347(02)00041-1
Thaler A. D., Amon D. (2019). 262 voyages beneath the sea: a global assessment of macro- and megafaunal biodiversity and research effort at deep-sea hydrothermal vents. PeerJ 7, e7397. doi: 10.7717/peerj.7397
Tiller R., De Santo E., Mendenhall E., Nyman E. (2019). The once and future treaty: towards a new regime for biodiversity in areas beyond national jurisdiction. Mar. Policy 99, 239–242. doi: 10.1016/j.marpol.2018.10.046
Vandepitte L., Vanhoorne B., Decock W., Dekeyzer S., Trias Verbeeck A., Bovit L., et al. (2015). How aphia - the platform behind several online and taxonomically oriented databases - can serve both the taxonomic community and the field of biodiversity informatics. J. Mar. Sci. Eng. 3 (4), 1448–1473. doi: 10.3390/jmse3041448
Wägele H., Klussmann-Kolb A., Kuhlmann M., Haszprunar G., Lindberg D., Koch A., et al. (2011). The taxonomist - an endangered race. A Pract. proposal its survival. Front. Zoo. 8, 25. doi: 10.1186/1742-9994-8-25
WoRMS Editorial Board (2023) World register of marine species. Available at: https://www.marinespecies.org (Accessed 2023-02-10).
Keywords: taxonomy, marine biodiversity, World Register of Marine Species, impact factor, Nagoya protocol, citizen scientists
Citation: Bouchet P, Decock W, Lonneville B, Vanhoorne B and Vandepitte L (2023) Marine biodiversity discovery: the metrics of new species descriptions. Front. Mar. Sci. 10:929989. doi: 10.3389/fmars.2023.929989
Received: 27 April 2022; Accepted: 02 June 2023;
Published: 27 June 2023.
Edited by:
Les Watling, University of Hawaii at Manoa, United StatesReviewed by:
Jan Pawlowski, University of Geneva, SwitzerlandKatrin Linse, British Antarctic Survey (BAS), United Kingdom
Copyright © 2023 Bouchet, Decock, Lonneville, Vanhoorne and Vandepitte. This is an open-access article distributed under the terms of the Creative Commons Attribution License (CC BY). The use, distribution or reproduction in other forums is permitted, provided the original author(s) and the copyright owner(s) are credited and that the original publication in this journal is cited, in accordance with accepted academic practice. No use, distribution or reproduction is permitted which does not comply with these terms.
*Correspondence: Philippe Bouchet, cGhpbGlwcGUuYm91Y2hldEBtbmhuLmZy; Leen Vandepitte, bGVlbi52YW5kZXBpdHRlQHZsaXouYmU=