 Karen Stamieszkin1*
 Nicole C. Millette2
 Jessica Y. Luo3,4
 Elizabeth Follett5
 Nicholas R. Record1
 David G. Johns6
- 1Bigelow Laboratory for Ocean Sciences, East Boothbay, ME, United States
- 2Virginia Institute of Marine Science, College of William & Mary, Gloucester Point, VA, United States
- 3Climate and Global Dynamics, National Center for Atmospheric Research, Boulder, CO, United States
- 4Geophysical Fluid Dynamics Laboratory, National Oceanic and Atmospheric Administration, Princeton, NJ, United States
- 5Department of Civil and Environmental Engineering University of Liverpool, Liverpool, United Kingdom
- 6Continuous Plankton Recorder Survey, Marine Biological Association, Plymouth, United Kingdom
Aquatic ecologists are integrating mixotrophic plankton – here defined as microorganisms with photosynthetic and phagotrophic capacity – into their understanding of marine food webs and biogeochemical cycles. Understanding mixotroph temporal and spatial distributions, as well as the environmental conditions under which they flourish, is imperative to understanding their impact on trophic transfer and biogeochemical cycling. Mixotrophs are hypothesized to outcompete strict photoautotrophs and heterotrophs when either light or nutrients are limiting, but testing this hypothesis has been hindered by the challenge of identifying and quantifying mixotrophs in the field. Using field observations from a multi-decadal northern North Atlantic dataset, we calculated the proportion of organisms that are considered mixotrophs within individual microplankton samples. We also calculated a “trophic index” that represents the relative proportions of photoautotrophs (phytoplankton), mixotrophs, and heterotrophs (microzooplankton) in each sample. We found that the proportion of mixotrophs was positively correlated with temperature, and negatively with either light or inorganic nutrient concentration. This proportion was highest during summertime thermal stratification and nutrient limitation, and lowest during the North Atlantic spring bloom period. Between 1958 and 2015, changes in the proportion of mixotrophs coincided with changes in the Atlantic Multi-decadal Oscillation (AMO), was highest when the AMO was positive, and showed a significant uninterrupted increase in offshore regions from 1992-2015. This study provides an empirical foundation for future experimental, time series, and modeling studies of aquatic mixotrophs.
1 Introduction
Planktonic food webs are sometimes simplified with a dichotomy between strict photoautotrophs and heterotrophs. However, a growing body of evidence has demonstrated that a large fraction of plankton, known as mixotrophs or mixoplankton, are able to utilize both trophic strategies (Flynn et al., 2013; Mitra et al., 2014; Stoecker et al., 2017). Currently most large-scale marine ecosystem models do not explicitly include mixotrophs (Rohr et al., 2023), but targeted model studies suggest that mixotrophs can increase the flow of energy in marine food webs, and alter biogeochemical cycling (Hartmann et al., 2013; Mitra et al., 2014; Ward and Follows, 2016; Dutkiewicz et al., 2020). In one global model, the addition of dinoflagellate mixotroph classes increased biomass trophic transfer and mean organism size, increasing carbon export from the surface ocean by 35% (Ward and Follows, 2016). However, without an understanding of the proportion of the plankton community composed of mixotrophs, it is hard to assess the robustness of these model results.
Based on the hypothesis that mixotrophs have lower maximum growth rates compared to strict photoauto- and heterotrophs, Stoecker (1998) proposed that protists utilizing a singular trophic strategy (photoauto- or heterotrophy) can outcompete mixotrophs of a similar size when the necessary resources are scarce. Specifically, photoautotrophs can outcompete mixotrophs when light and nutrients are sufficient but prey is scarce (Litchman et al., 2007); and heterotrophs can outcompete mixotrophs when light and nutrients are growth-limiting, but prey is sufficient (e.g., Rothhaupt, 1996; Jeong et al., 2010). In other words, mixotrophs are able to dominate when one growth-limiting factor is inadequate – light or inorganic nutrients or prey – but not more than one (Stoecker, 1998; Bergström et al., 2003; Mitra et al., 2014).
These dynamics have been demonstrated with mixotrophic and heterotrophic flagellates, and photoautotrophic phytoplankton in Swedish lakes (Bergström et al., 2003). During summer, when nitrogen was growth-limiting but light levels were sufficient, mixotrophic flagellates were more abundant than photoautotrophic phytoplankton and heterotrophic flagellates. However, once light also became limiting, heterotrophic flagellate abundance increased and mixotrophic flagellate abundance declined, suggesting that heterotrophy became a more competitive trophic strategy than mixotrophy. Numerical models support these findings. Mixotrophs can outcompete photoautotrophs in highly stratified or low nutrient systems, where phagotrophy can be used to overcome diffusion limited nutrient acquisition (Ward et al., 2011; Berge et al., 2017; Edwards, 2019).
While experiments and models have demonstrated the competitive advantages of mixotrophy under select conditions (Bergström et al., 2003; Våge et al., 2013; Chakraborty et al., 2017), there has been limited research to determine the environmental conditions that favor mixotrophs on a regional to global scale, because it is prohibitively challenging to detect mixotrophy in the field. Understanding the biogeographical distribution of mixotrophs and their associated ecological determinants has been suggested as a major priority in the field of mixotrophic research (Millette et al., 2023). Estimating the relative abundance of organisms that are capable of mixotrophy within the plankton community is an alternative to direct measurements of mixotrophic behavior that could be used to rapidly expand our understanding of mixotrophs’ biogeographical distribution. Recent studies have compiled global observations of mixotrophic organisms to examine their biogeography (Leles et al., 2017; Faure et al., 2019; Schneider et al., 2020; Mitra et al., 2023). However, investigations linking environmental conditions to mixotroph abundance, which would test the mechanistic underpinnings of their distribution, are limited on a regional to global scale.
We focus our work on the well-studied northern North Atlantic Ocean ecosystem, which is dominated by strong seasonal cycles in water column structure, nutrient availability and primary producer community composition. Our goal is to test the Stoecker (1998) hypothesis, that mixotrophs will dominate when either light or nutrients are limiting, using nearly six decades of large protist community composition data collected by the Continuous Plankton Recorder program. We calculate two metrics with which to explore spatial and temporal patterns in microplankton trophic strategy across the subpolar North Atlantic: 1) the relative abundance of plankton taxa known to be mixotrophic – in this case those capable of photoautotrophy and phagotrophy, and 2) a trophic index that shows the mean trophic position of the large protist community, from strict photoautotroph to mixotroph to strict heterotroph. The proportion of mixotrophs is used to generate empirical relationships with average temperature, light and nutrient conditions. While empirical in nature, these relationships offer new hypotheses to guide future studies of trophic strategy in plankton, and enable more accurate representations of mixotrophs within marine food web models. Finally, we examine the temporal trends in mixotroph relative abundance averaged across the shelf and offshore portions of the study region.
2 Materials and methods
2.1 Data
This analysis necessitated a dataset with high count and taxonomic resolution collected over large spatial and longtime scales. We used the North Atlantic Continuous Plankton Recorder (CPR) data archive (https://doi.mba.ac.uk/data/3167/1; doi: 10.17031/659d75b6c8009.1), which has documented plankton in North Atlantic surface waters (upper 25 m) for over six decades. The CPR dataset can be broken into 41 standard CPR regions, which are based upon bathymetry and oceanographic features (Richardson et al., 2006); we used data from 36 that were adequately sampled (Figure 1). Samples are collected on the CPR instrument towed behind ships of opportunity, on a silk mesh that is progressively rolled and preserved. Each sample equates to approximately three cubic meters of seawater sampled; taxa are recorded as present and absent and counts are estimated categorically (see Richardson et al., 2006 for methodological details). Phytoplankton taxa caught in the CPR device range from small coccolithophores (approx. 10 micron), to large dinoflagellates (approx. 1 mm), demonstrating that despite the relatively coarse mesh-size (270 μm), the method captures a large proportion of the phytoplankton community.
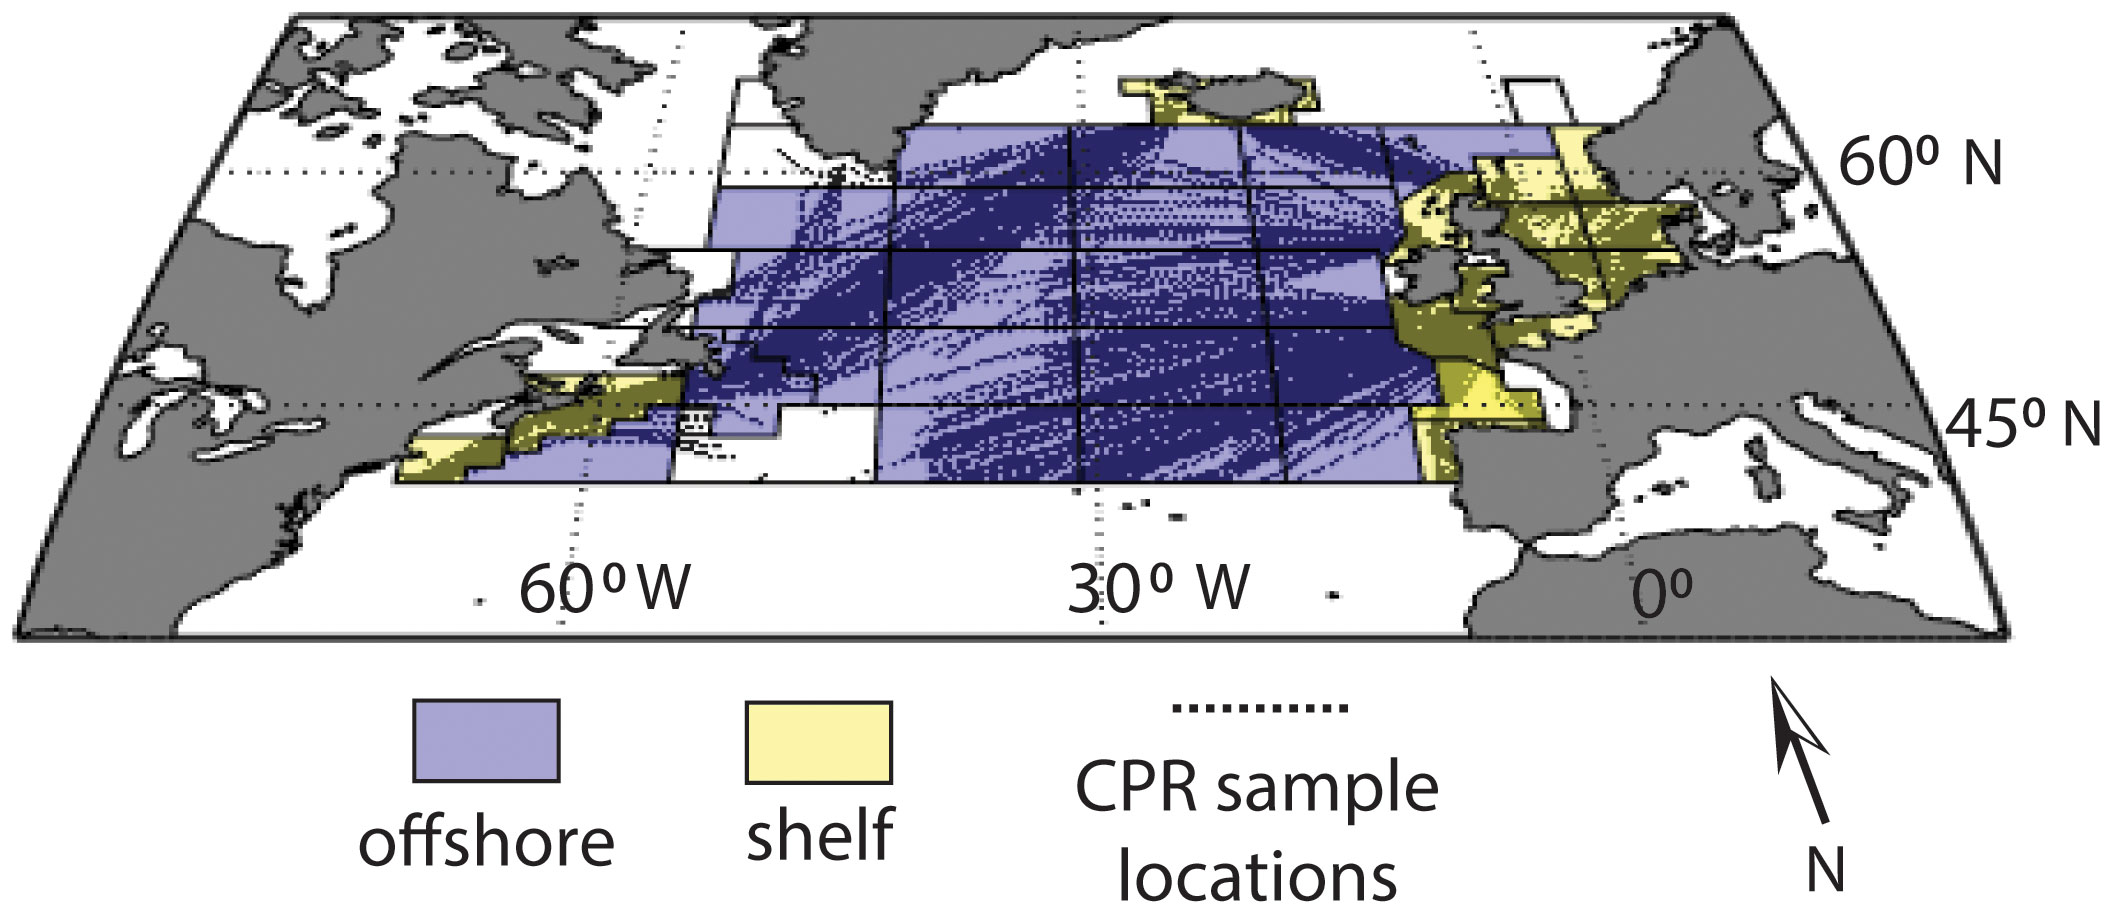
Figure 1 Map of the North Atlantic Continuous Plankton Recorder (CPR) study region and sample locations (black dots), with standard CPR regions outlined. Regions designated as “offshore” are light blue, regions designated as “shelf” are yellow and regions with insufficient sampling coverage are not colored.
To assess empirical relationships between mixotrophs and environmental conditions, we analyzed a subset of the database, including 244 phytoplankton and microzooplankton taxa, both by CPR region and 1° spatial grid cells, from January 1996 through December 2015. This portion of the dataset consistently includes autotrophs, heterotrophs (microzooplankton ciliates), and mixotrophs. Specifically, 99 diatom, 92 dinoflagellate, 23 ciliate, 12 prasinophyte, 10 prymnesiophyte, five radiolarian taxa, and one acantharian taxon were included. The level of taxonomic identification for these groups ranges from species to order (Supplementary Data). For the interannual time series analysis, we included samples dating back to 1958 to give a decadal perspective, though due to a change in protocol in 1996, these data do not include heterotrophs. CPR data collection techniques have remained consistent since 1958. This gives a robust time-series that is suitable for both temporally and spatially extensive studies, and that has been used to address large-scale scientific questions (e.g., Edwards & Richardson, 2004; Barton et al., 2013, 2015; Edwards et al., 2022). We are therefore able to use the relative proportion of organisms in the CPR samples to investigate the seasonal cycle, spatial variability, and interannual trend of phytoplankton and microzooplankton in the dataset.
2.2 Estimating mixotroph abundance and community trophic strategy
We classified protist species as photoautotrophic, mixotrophic or heterotrophic based on existing literature (Supplementary Data). From this we calculated the proportion of organisms that use each of the three trophic strategies in every sample (See Supplementary Figure 1 for histogram of estimated cell abundances per sample). We then multiplied the trophic value (-1 for photoautotrophs, 0 for mixotrophs, or +1 for heterotrophs) of each species by its concentration in each sample, and divided by the sample’s total organism concentration (Equation 1). Thus we calculated the index on a scale of -1, meaning the sample contained only photoautotrophic plankton, to 0, meaning the sample was composed only of species capable of mixotrophy, to +1, meaning the sample included only heterotrophs. The trophic index is an interesting way to encapsulate mean trophic activity by the large protist community with one variable. However, if a community is dominated by photoautotrophs (trophic index of -1) and heterotrophs (trophic index of +1), the trophic index value would be 0, the same as if the community were composed only of mixotrophs. Therefore, we present the proportion of each group along with the trophic index to demonstrate the relative contribution of each, and find that the trophic index is still a useful concept, despite its computational quirks.
where TI is the trophic index; Ai is the abundance of the ith autotroph; Hj is the abundance of the jth heterotroph; and Mk is the abundance of the kth mixotroph.
Mixotrophy is a flexible trophic strategy thought to be used when conditions are unfavorable for photoautotrophy or heterotrophy alone. Therefore, the estimated proportion of mixotrophs and the trophic index represent a maximum potential for mixotrophic capabilities in the sample, rather than an explicit in situ measurement of mixotrophic activity. We thus highlight conditions when known mixotrophs are more likely to accumulate biomass, and what environmental factors favor species that can utilize this strategy.
2.3 Statistical analyses
We analyzed patterns in the mixotroph proportion along spatial, seasonal, and interannual scales. We computed an empirical orthogonal function (Climate Data Toolbox, EOF, Matlab R2014b, Greene et al., 2019) on monthly climatologies of the trophic index in each CPR region. Based on the results of the EOF analysis, we identified these regions as either “shelf” or “offshore”. Since the EOF analysis indicated that proximity from shore was a primary determinant of trophic index climatology, we used bathymetry to assign 1° cells as “shelf” (mean depth ≤ 300 m) or “offshore” (mean depth > 300 m) locations. Trophic index values were averaged at different spatial resolutions (1° grids and by CPR region) to examine the sensitivity of our results to averaging on different spatial scales.
The mean monthly trophic index value was calculated in shelf and offshore regions separately to examine its annual cycle, using data from 1996 to 2015. Alongside these values, we also calculated the monthly relative proportion of photoautotrophs, heterotrophs and mixotrophs for comparison to the trophic index. For a more detailed spatial perspective of seasonal differences in the trophic index, we averaged and plotted mean index values in 1° cells for winter (January through March), spring (April through June), summer (July through September), and autumn (October through December); data from 1996 to 2015 were included.
To test the hypothesis that light and nutrients are the primary drivers of optimal trophic strategy, we used monthly climatologies (1996-2015) within CPR regions, examining which environmental parameters were associated with the proportion of mixotrophs in the plankton community. We tested the mixotroph proportion climatologies for normal distributions with a Kolmogorov-Smirnov goodness-of-fit hypothesis test, with normality being the null hypothesis (p > 0.05; kstest, Matlab R2023b). Stepwise linear regression (stepwiselm, Matlab R2023b) with interaction terms, and sum of square error as the selection term was used to examine which of the following environmental parameters were most tightly linked to the relative proportion of mixotrophs in the study area: sea surface temperature (°C), sea surface photosynthetically available radiation (PAR, Einsteins m-2 d-1), and dissolved nitrate (µmol L-1), phosphate (µmol L-1) and silicate (µmol L-1). Sea surface temperature and dissolved nitrate, phosphate, and silicate were retrieved from the World Ocean Atlas (2013, v2) as 1°, objectively analyzed mean monthly climatologies spanning 1955-2012 (Garcia et al., 2013; Locarnini et al., 2013). Satellite-derived mean monthly climatologies (spanning 2002-2017) of sea surface PAR were retrieved from NASA’s MODIS Aqua satellite (NASA OBPG, 2017) as 9-km mapped data, then regridded into 1° standard grids. Mixed layer PAR fluxes would be more relevant to in situ mixotrophs, but surface PAR is available at the scale of this study.
Annual mixotroph proportions and trends were analyzed for the entire study region, using the 1958-2015 time series. Due to a change in the CPR analysis methods in 1996 pertaining to tintinnid ciliates (heterotrophs), we calculated this proportion relative to photoautotrophs only. Given the relatively small heterotroph contribution to the dataset, we deemed this an appropriate way to present the longest, most consistent time series. The data were first averaged over the offshore and shelf portions of the study region, and then by year, giving an annual time series for shelf and offshore sections. The slope of trends punctuated by changepoints were evaluated with a simple linear regression (regress, Matlab R2022a). The same process was used to generate time series of seasonal mixotroph proportion (i.e., winter, January-March; spring, April-June; summer, July-September; and autumn, October-December). These datasets were analyzed using a Bayesian changepoint detection and time series decomposition, called “BEAST” (Zhao et al., 2019), to determine key points in time when the trend in the annual times series changed, and whether those changes were driven by shifts in the mixotroph proportion in particular seasons. Finally, we calculated a monthly mixotroph proportion anomaly for the 1958-2015 period, to visualize changes and trends in the time series.
3 Results
3.1 Seasonal and spatial variability
We examined the trophic index over spatial, seasonal and interannual scales. The strongest spatial pattern in the index was a contrast between shelf and offshore regions (Figure 1). EOF analysis of annual trophic index cycles in each standard CPR region showed that, in general, estimated levels of mixotrophs in shelf regions covaried in space and time, while offshore regions covaried independently of shelf areas (Supplementary Figure 2). Maps of the trophic index averaged seasonally and across the time series reveal a seasonal progression of low values in coastal regions in winter (Figure 2A), spreading throughout the offshore northwestern North Atlantic in spring (Figure 2B), followed by higher values moving from the southern portion of the study region in summer (Figure 2C), to the majority of sampled offshore waters in autumn (Figure 2D), and then contracting to the southern portion of the region in winter (Figure 2A).
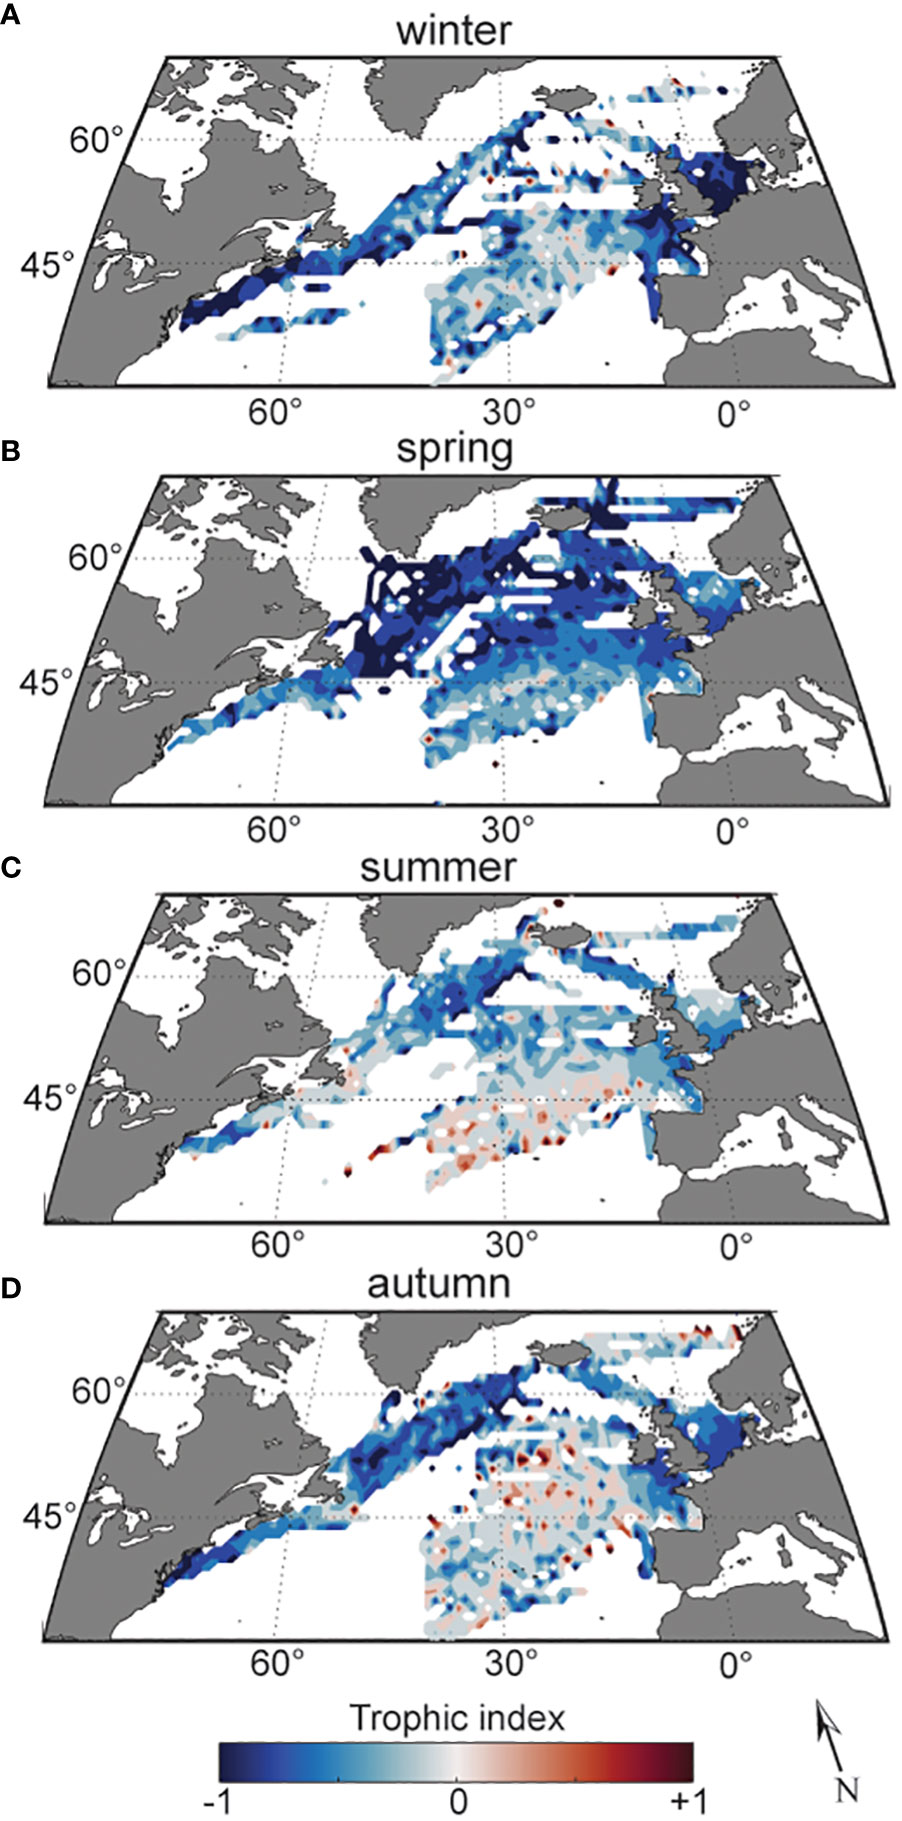
Figure 2 Trophic index over the study region (1996-2015), averaged and smoothed over 1° cells, in winter (A), spring (B), summer (C), and autumn (D). Red indicates more heterotrophs, gray mixotrophs, and blue autotrophs.
We evaluated the climatological means of the relative composition of photoautotrophs, heterotrophs, and mixotrophs for shelf and offshore regions with standard deviation (± SD) representing the spatial variability around the mean. In shelf regions, photoautotrophs (solid black line, Figure 3A) varied between a minimum of 40.4% ± 22.9 of the community in August, and a maximum of 76.7% ± 20.0 in February. In comparison, mixotroph proportion (dotted black line, Figure 3A) was lowest in shelf regions in February at 22.0% ± 19.5, and highest in September at 51.7% ± 22.1. Heterotrophs in shelf regions (dashed black line, Figure 3A) consistently accounted for the lowest proportion of the community. They reached a climatological maximum in June when they made up 8.2% ± 12.0 of the community, and a minimum of 0.8% ± 3.9 in March. These values are not significantly different from 0, indicating that heterotrophs are less common in the size range sampled by the CPR, and that this dataset is not ideal for capturing their variability. Overall, photoautotrophs dominated the shelf community in all seasons, except late summer and early autumn (July-September).
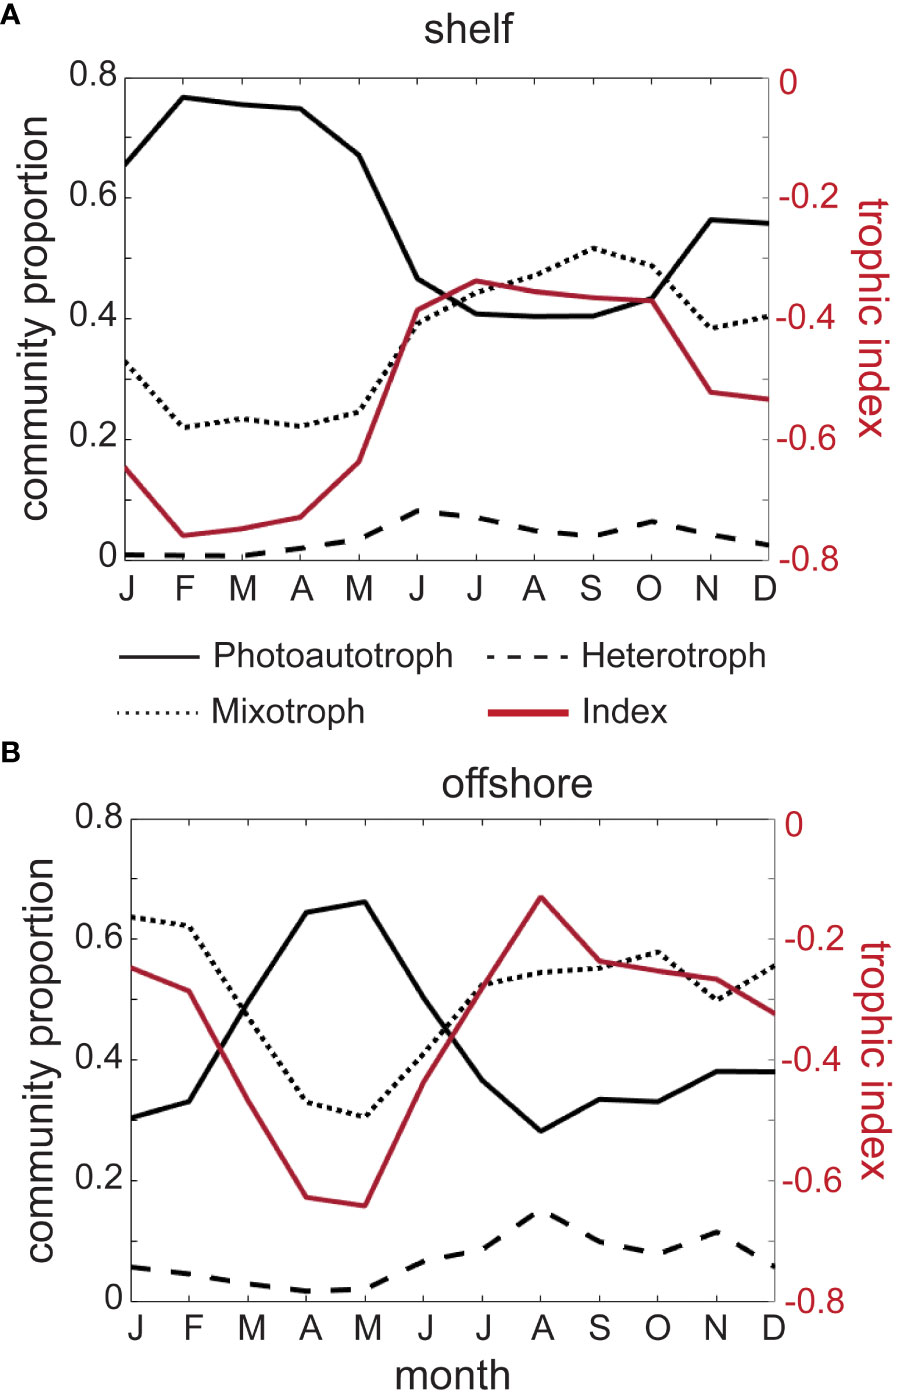
Figure 3 Mean seasonal climatology of the proportions of photoautotrophs (solid black line), heterotrophs (dashed black line), mixotrophs (dotted black line), and trophic index (red solid line) in shelf (A) and offshore (B) portions of the study region, averaged over 1996-2015.
Throughout the climatological annual cycle, photoautotrophs in offshore areas (solid black line, Figure 3B) represented a smaller mean proportion of the community compared to shelf observations, with a maximum of 66.2% ± 28.2 in May, and a minimum of 28.2% ± 26.6 in August. Mixotrophs made up the highest proportion of the community in January at 63.7% ± 34.6 and lowest in May at 30.6% ± 26.5, but unlike the shelf regions, the mixotroph proportion remained relatively consistent and dominated the community between July and February (dotted black line, Figure 3B). Again, heterotrophs comprised the lowest proportion of the community (dashed black line, Figure 3B), with a peak of 15.3% ± 20.2 in August, and as little as 2.7% ± 6.7 in April.
With the exception of the plankton community during summertime in offshore regions, the relatively low proportion of heterotrophs throughout the year resulted in a trophic index that mainly represented the interplay between photoautotrophs and mixotrophs. In the shelf regions, the monthly minimum of -0.76 ± 0.21 occurred in February (solid red line and right hand y-axis, Figure 3A), and in offshore regions the monthly minimum of -0.64 ± 0.32 occurred two months later, in May (solid red line and right-hand axis, Figure 3B). In both the shelf and offshore regions, the index increased in late spring and summer, reaching annual monthly maxima of -0.34 ± 0.25 and -0.13 ± 0.39 in July and August, respectively (solid red lines and right-hand axes, Figure 3).
3.2 Environmental covariates
We assessed the seasonal cycle of the proportion of mixotrophs found in the present study as a metabolic response to changing environmental conditions. Stepwise linear regressions with climatologies of sea surface temperature (°C), photosynthetically available radiation (PAR), total nitrate (µmol L-1), phosphate (µmol L-1) and silicate (µmol L-1) from each CPR region and month as independent variables, and the proportion of mixotrophs from each region and month as dependent variables, revealed relationships between estimates of mixotrophs and the environment. Both shelf and offshore mixotroph proportions were normally distributed (shelf: p = 0.20 and offshore: p = 0.80; cannot reject the null hypothesis of normality). The proportion of mixotrophs in shelf waters, when averaged over the standard CPR regions, were positively correlated with temperature, and negatively correlated with the interaction between PAR and nitrate concentrations; however PAR and nitrate alone were not significant predictors (p > 0.05). The mixotroph proportion in offshore waters was positively correlated with temperature, and negatively correlated with the interaction between PAR and phosphate concentration; PAR and phosphate alone were not significant predictors (p< 0.05). Both models were statistically significant (shelf: R2 = 0.52, p< 0.001; offshore: R2 = 0.51, p<0.001) (Table 1; full model results in Supplementary Table 1). In addition to stepwise regressions, we also assessed the relationship between mixotroph proportion and each independent variable separately (Supplementary Figure 3).
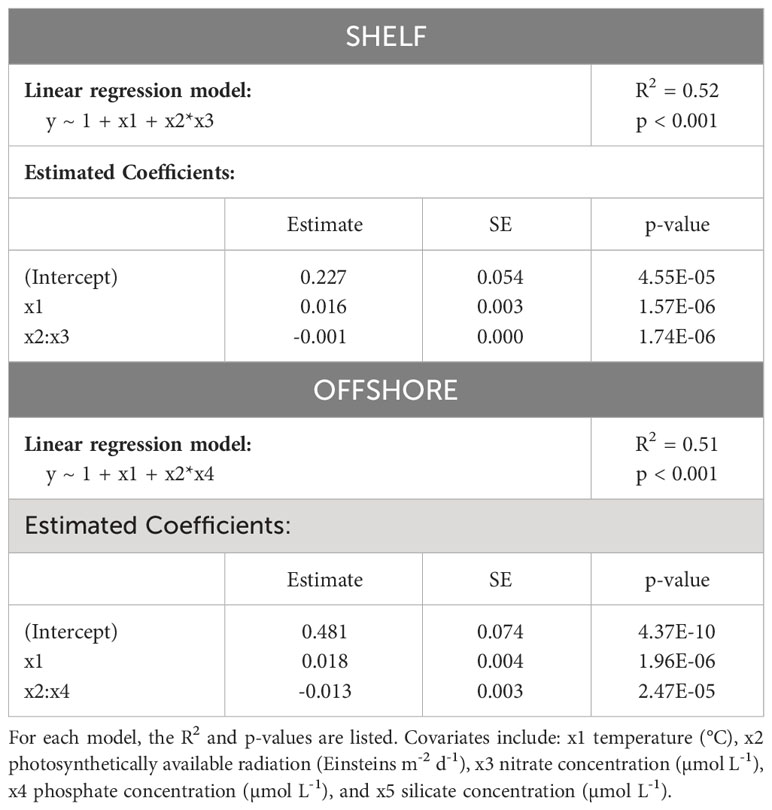
Table 1 Model covariates for mixotroph proportion in shelf and offshore waters at two resolutions (1° and within the 35 standard CPR regions).
Using scatter plots of monthly mixotroph proportion data from each CPR region to visualize the stepwise regression results described above, mixotroph proportion was highest in shelf waters at a range of PAR fluxes when nitrate concentration was low; it was lowest when both variables were high (Figure 4A). In offshore regions, mixotroph proportions were highest at a range of PAR levels and low phosphate concentration and at a range of phosphate concentrations when PAR was low. Similar to shelf regions, mixotroph proportion in offshore regions was lowest when both phosphate and PAR were highest (Figure 4B). With respect to temperature and nutrient conditions, mixotroph proportion was highest in shelf and offshore waters when temperature was higher, and nutrient concentration was lower. Lower mixotroph proportion values in shelf and offshore regions occurred when temperature was lower, over a range of nutrient concentrations (Figures 4C, D). Note that due to lack of appropriate data, we could not directly explore the role of prey availability on the proportion of mixotrophs.
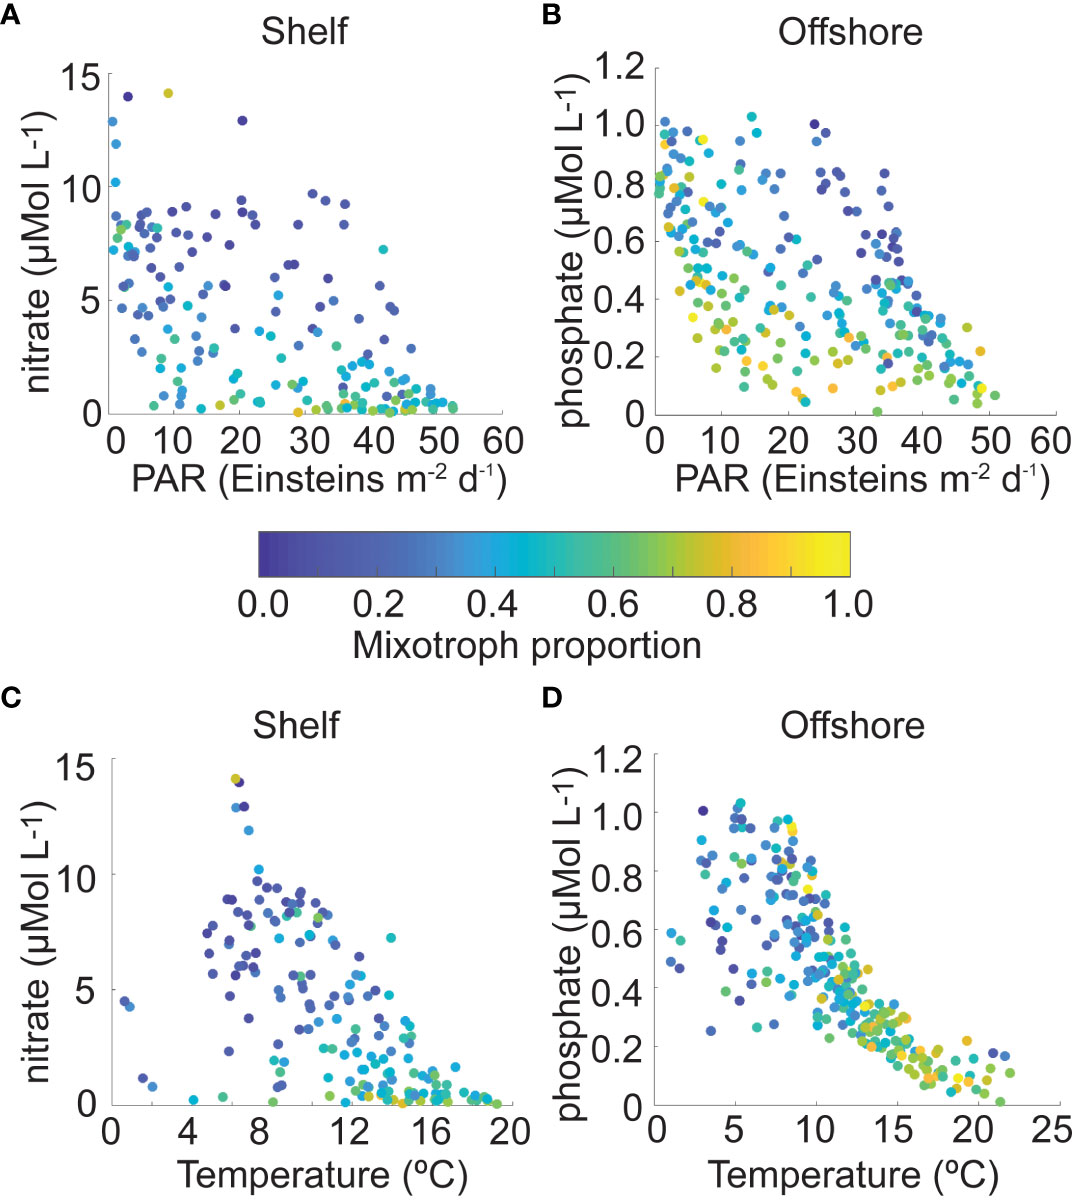
Figure 4 Mixotroph proportion in shelf Continuous Plankton Recorder (CPR) regions as a function of (A) surface photosynthetically available radiation (PAR, Einsteins m-2 d-1) and nitrate concentration (μMol L-1), and (C) surface temperature (°C) and nitrate concentration (μMol L-1); mixotroph proportion in offshore CPR regions as a function of (B) PAR (Einsteins m-2 d-1) and phosphate concentration (μMol L-1), and (D) surface temperature (°C) and phosphate concentration (μMol L-1). Each data point represents mean mixotroph proportion in one region and one climatological month, with the color indicating that proportion on a scale from 0 to 1.
3.3 Time series trends
Trends over the full time series and CPR spatial domain were explored using a Bayesian changepoint analysis. The anomaly from the mean mixotroph proportion (relative to photoautotrophs only), alongside the changepoint analysis, revealed a major shift in the trajectory of mixotroph proportion in the offshore waters of the study region (solid yellow lines, Figure 5A), but not in shelf waters (Figure 5B). Unless otherwise noted, the probability of the number of changepoints within a time series presented here is ≥ 50%. Summary figures of all BEAST results can be found in the Supplementary Material (Supplementary Figure 4). In offshore waters, there were two major shifts in the trajectory of annual mixotroph proportion relative to photoautotrophs between 1958 and 2015, with 75.1% and 95.8% probabilities of significant shifts in 1966 and 1992 (Figure 5A). The first period (1958-1966), and second period (1967-1992) were characterized by no trend (57.0% and 76.0% probabilities of no trend, respectively), while the third period (1993-2015) showed a significant positive trend (98.6% probability of being positive) with the mixotroph proportion increasing by 0.009 per year (R2 = 0.79, p<<0.001).
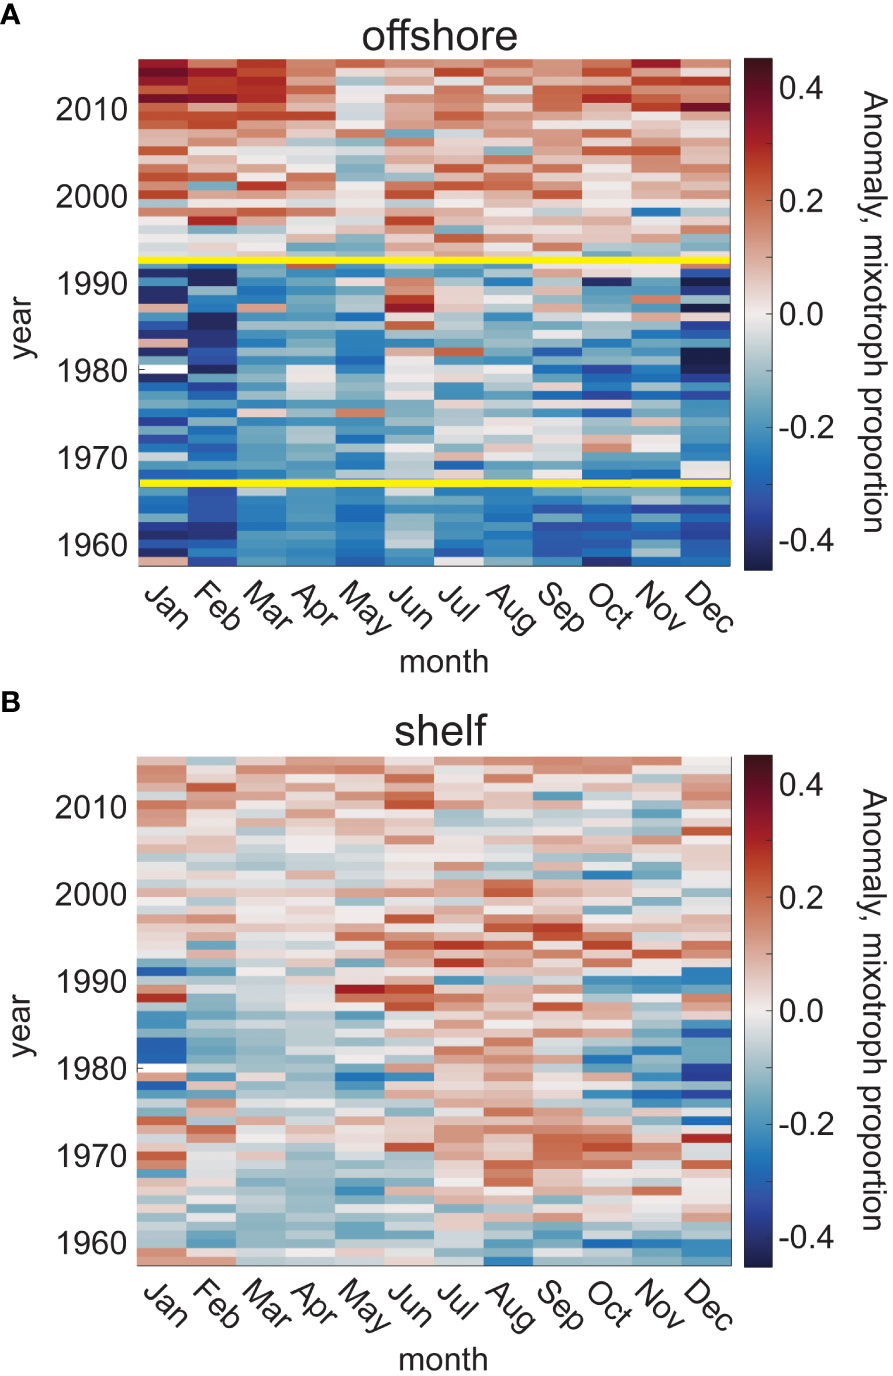
Figure 5 Anomaly of mixotroph proportion from the climatological mean, relative to photoautotrophs, for each month and through the time series (1958-2015), in the offshore (A) and shelf (B) waters of the CPR study region. Yellow lines represent significant changepoints in the trend of mixotroph proportion, based upon a Bayesian changepoint analysis; the number of significant changepoints is determined based upon a ≥50% likelihood.
The changepoints found for the full offshore time series varied when examined at the seasonal scale. Spring showed no significant changepoints but had a very high probability (98.9%) of a positive trend (0.005 y-1) throughout the time series (R2 = 0.72, p<< 0.001). No time periods in any season showed a strong probability of a negative trend (range = 0% in spring, 1958-2015 to 10.1% in summer, 1958-1967). Winter and summer both shared a changepoint in 1993, which coincides ( ± 1 y) with the 1992 changepoint in the annual time series. There was also a summer changepoint in 1967, which coincides ( ± 1 y) with the 1966 changepoint in the annual time series; however, the maximum probability of two changepoints in the offshore summer time series was only 34.3%. In autumn, one changepoint in 1977 punctuated two periods of positive trends in mixotroph proportions, with a sudden and short-lived (1975-1977) negative slope in the annual autumn mixotroph proportion. Of all seasonal changepoints in offshore waters, the most probable was the 1993 winter shift (99.7% probability). In shelf waters of the study region, the probability of any number of changepoints in the mixotroph proportion was<50% for the annual and all seasonal time series.
4 Discussion
We used the North Atlantic Ocean’s spatial and seasonal variability to test, at the basin scale, the theoretical framework presented by Stoecker (1998), which posits that mixotrophs should dominate the plankton community when light or nutrient concentration limits photoautotrophic production. Thus, the relative abundance of mixotrophs in the protist community should ebb and flow complementary to photoautotrophic phytoplankton bloom cycles. We were also able to examine changes in these relative proportions over 57 years.
4.1 Spatial patterns
Within our study region, the estimated proportion of mixotrophs showed spatial patterns that varied from the shelf to the open ocean, and latitudinal gradients that supported Stoecker’s hypothesized relationships with environmental conditions (Stoecker, 1998). Shallower and tidal coastal zones have higher levels of primary production than offshore waters due to more consistent nutrient supply in the mixed water column (Longhurst, 1995), which can maintain photoautotrophic production when light is adequate. Thus, mixotrophs may be less competitive on the continental shelves for most of the year, such as only being a prevalent part of the plankton community during summer (Figure 2). In offshore regions, nutrient availability and mixed layer depth are stronger drivers of bloom timing than light levels (Sverdrup, 1953; Townesend et al., 1994) in contrast to shelf regions (Longhurst, 1995). Our analysis further demonstrated that the phenology of mixotrophs in shelf regions was statistically distinct from offshore regions sampled by the CPR, and that offshore regions were associated with higher proportions of mixotrophs (Figure 2).
The latitudinal gradient of the proportion of mixotrophs across the offshore CPR areas (Figure 2) reflects the general circulation and surface wind patterns of the subtropical and subpolar North Atlantic Gyres. Predominant surface wind patterns drive Ekman upwelling north of the North Atlantic Current (NAC), whereas to the south, wind patterns drive Ekman downwelling. This results in a shallower nutricline in the northwestern portion of our study region, compared to the southeastern portion (Barton et al., 2015). This pattern of nutrient availability may explain why the proportion of mixotrophs was generally higher toward the southern portion of the study area, and fits Stoecker’s hypothesis that mixotrophs should outcompete photoautotrophs when they are limited by nutrient concentration, but not light (Stoecker, 1998). An alternative explanation is based on how light changes along a latitudinal gradient. As light becomes less limiting at lower latitudes, this allows mixotrophs to outcompete heterotrophs, who are carbon (prey) limited, and outcompete photoautotrophs, who are nutrient limited (Edwards, 2019).
4.2 Seasonal patterns and environmental variables
The seasonal proportion of mixotroph climatology fits well within the canonical photoautotrophic bloom-based view of the northern North Atlantic Ocean. The cycles of light availability (lowest in winter, highest in summer) and nutrient limitation via water column stratification (lowest concentrations in late summer/early fall, highest in early spring) were reflected in the annual cycle of the proportion of mixotrophs, especially in offshore waters (Figure 2). The lowest proportion of mixotrophs in both shelf and offshore regions coincided with the photoautotrophic spring diatom bloom (Figure 2B), which is associated with increased springtime light levels and high mixed layer nutrient concentrations (c.f. Sverdrup, 1953; Siegel et al., 2002). The transition from an photoautotroph-dominated spring community to mixotroph-dominated summer and winter communities as seen in the trophic index (Figures 2B, C), was also observed on Georges Bank, in the Gulf of Maine, USA: as nutrients were depleted in June-July, ingested cells were observed inside photosynthetic dinoflagellate species, providing a direct observation of mixotrophy following the spring diatom bloom (Gettings et al., 2014). Transcriptomes expressed by bottle incubated mixotrophic prymnesiophytes collected in the low nutrient North Pacific subtropical gyre demonstrated an increase in transcriptional response for genes associated with photosynthesis following addition of nitrogen and phosphorus, and reduction in transcription for genes associated with phagotrophy (Lambert et al., 2022). Similar to observations of mixotrophic response to variable gyre conditions, mixotrophs’ ability to vary feeding strategy with changing conditions may confer a long-term advantage over the full seasonal cycle examined here, preventing full displacement by photoautotrophs.
The present study showed that temperature was the most important variable in predicting the proportion of mixotrophs in shelf and offshore models and was positively related to mixotroph proportion (Table 1). Temperature’s impact may be indirect via an ecosystem-level relationship between light, temperature and stratification in the upper ocean, or it may be direct via physiological function. The North Atlantic seasonal cycle is driven by changes in light and subsequent heat flux. In the present study, temperature was negatively correlated with nitrate and phosphate concentrations, positively correlated with PAR (Supplementary Table 2), and positively correlated with mixotroph proportion in both offshore and shelf regions (Table 1; Figures 4C, D). This pattern reflects a niche within the seasonal temperature/light/nutrient regimes of the North Atlantic Ocean, where mixotrophs can be most successful. A trait-based modelling study that implemented trophic strategy through cellular allocation of energy to key trophic functions found that temperature’s forcing on water column structure was the main driver of latitudinal and seasonal patterns in mixotroph abundance, rather than direct impacts of temperature on physiology (Chakraborty et al., 2020). In the southern North Sea, an analysis of the proportion of mixotrophs showed that mixotrophs are more dominant when inorganic nutrients are depleted and the system is seasonally stratified (Schneider et al., 2020), similar to our finding in the larger northern North Atlantic. Another observational study using the CPR dataset reported a positive correlation of seasonal dinoflagellate abundance (high likelihood of mixotrophy) with sea surface temperature and stratification across the region, while diatom abundance (zero likelihood of mixotrophy, excluding osmotrophy) was positively correlated with these variables within the subpolar gyre, but negatively correlated in the subtropical gyre (Barton et al., 2015). Our results provide further observational evidence suggesting that broad-scale seasonal patterns of mixotrophs are correlated with specific environmental conditions that align with the annual oceanographic succession in the North Atlantic Ocean.
The second explanation for the positive relationship between the proportion of mixotrophs and temperature is physiological because temperature is an important variable regulating physiological function, including nutrient uptake, growth, and grazing rates. As temperature increases, heterotrophic activity increases faster than photoautotrophic activity due to higher heterotrophic activation energy, or the amount of energy required to catalyze metabolic processes (Lopez-Urrutia et al., 2006). Laboratory experiments have demonstrated more heterotrophic activity in mixotrophs with increasing temperature over shorter timeframes of hours, up to 20 h (Wilken et al., 2013), and longer adaptive timeframes of up to three years (Lepori-Bui et al., 2022). Further, in a mixotrophic food web model where protists could switch from phagotrophy to photoautotrophy and metabolic rates were temperature-dependent, environmental warming led to alternate stable states that were characterized as phototrophy-dominant carbon sinks vs. phagotrophy-dominant carbon sources; and warming always resulted in a phagotrophic carbon source system, even under stable nutrient conditions (Wieczynski et al., 2023). These results, alongside our findings, point to the theory that whole ecosystems may become net heterotrophic with increasing temperatures (Lopez-Urrutia et al., 2006; Wieczynski et al., 2023). This is an active and important current area of research.
4.3 Decadal trends and climate change
The CPR dataset offers a unique multi-decade look at the relative prevalence of mixotrophs within the larger-sized protist community. When compared to photoautotrophs from 1958 to 2015, we found a remarkable increase in the proportion of the community classified as mixotrophs, in the offshore part of the region, with significant changes in the trend over time (Figure 5A). We found no clear trends in the shelf waters as a whole (Figure 5B). While it is difficult to attribute causality to the changes in mixotroph proportion, the significant changepoints identified in offshore waters in this study (1966/67 and 1992/93) generally correspond to shifts in the Atlantic Multi-decadal Oscillation (AMO) phase: positive to negative in 1962-63 and negative to positive in 1997-98. Positive AMO phases represent times of positive sea surface temperature anomalies in the northern North Atlantic, aligning with our finding that temperature is positively correlated with mixotroph proportion and the trophic index in this study. Others have also noted the AMO phase transition in the 1990s as punctuating changes in biological time series (e.g., Beagrand and Reid, 2012; Alheit et al., 2014; Edwards et al., 2022). The North Atlantic oscillation, or NAO, has a shorter phase than the AMO (interannual rather than multi-decadal) and it has been suggested that the two are inversely linked (Gastineau and Frankignoul, 2012; Trenberth and Zhang, 2023). Henson et al. (2012) suggested that the deeper mixed layers of the positive phase of the NAO favors diatoms (photoautotrophs), whereas the increased stratification of the NAO negative phases favors dinoflagellates (majority mixotrophs).
While we found no clear trends in shelf waters over time, the mixotroph proportion does show that the winter-spring period has shifted from weak negative to weak positive anomalies, beginning around 1992 (Figure 5B). A recent study using the CPR dataset found that diatoms in the North Sea region have significantly increased over a similar period, with a marked change in trajectory during the mid-1990s (Edwards et al., 2022). Coastal regions have specific dynamics tied to local factors including bathymetry, terrestrial influences, and tides. Therefore, it is likely that long-term patterns in the shelf portion of our study region are obscured by large-scale spatial averaging. The precise mechanisms driving the relationship of climate oscillations with phytoplankton community composition and metabolism ought to be investigated further, with a focus on individual regions and seasons, given the incongruous inter-annual patterns that we found in shelf versus offshore areas, and at different times of year.
Previous studies using the CPR dataset have shown that there are already observed changes in the seasonal phenology of individual species in the North Atlantic (Edwards and Richardson, 2004), and projected anthropogenic warming is further expected to cause north- and eastward shifts of idealized species niches (Barton et al., 2016). Under the high emissions scenario (e.g., Shared Socioeconomic Pathway 5-8.5), climate change is projected to increase sea surface temperatures and increase stratification, which leads to decreased surface nutrients to fuel the plankton community, with some of the largest and most immediate changes in the North Atlantic (Kwiatkowski et al., 2020). Additionally, work by Dutkiewicz et al. (2019) also suggested that climate-associated changes in marine ecosystems may result in ocean color changes that could increase the light penetration to depth. Thus, one implication of our work is that climate-driven changes to marine ecosystems – decreased surface nutrients alongside increased light penetration and therefore availability – would favor mixotrophs as dominant portions of the plankton community over photoautotrophs and possibly heterotrophs.
5 Conclusion
This study provides a novel basin-scale view of the annual cycle of large mixotroph relative abundance, and the coinciding environmental conditions over space and time. Our results largely support the hypothesis that mixotrophs dominate over photoautotrophs and heterotrophs when one of their growth-limiting factors is too low. The effects of mixotroph prey abundance and the feeding physiology of different mixotrophs is an area of study that, while critical to fully understanding primary producer community dynamics, cannot be addressed with the CPR dataset itself; and environmental data that include prey information does not exist on compatible scales. A majority of current mixotroph predator-prey research focuses on the grazing impact of particular species or groups of plankton (Li et al., 2000; Seong et al., 2006; McKie-Krisberg et al., 2015; Millette et al., 2017), leaving the question of how the presence/absence of mixotrophs impacts the broader food-web unanswered. Theoretical modeling has begun to address how changes in the presence of mixotrophs alters the flow of carbon (Hartmann et al., 2013; Mitra et al., 2014; Ward and Follows, 2016; Wieczynski et al., 2023), but in situ measurements of mixotrophic activity are lacking. Our analysis emphasizes that there is seasonal and spatial variability in the proportion of the community composed of large (> 10 μm) mixotrophs, and that this variability is connected to basic environmental conditions. Given that the proportion of mixotrophic plankton can be over 50% of the community sampled by the CPR, and that this proportion is increasing in the offshore waters of the northern North Atlantic, it is imperative to begin collecting data on the activity of mixotrophs of a broader size range including smaller organisms, their impacts on marine food webs and biogeochemical cycles, and associated environmental drivers including the prey community. This study is meant to serve as a hypothesis-generating platform for this future research.
Data availability statement
The original contributions presented in the study are included in the article/Supplementary Material. Further inquiries can be directed to the corresponding author.
Ethics statement
The manuscript presents research on animals that do not require ethical approval for their study.
Author contributions
KS: Conceptualization, Data curation, Formal analysis, Investigation, Methodology, Visualization, Writing – original draft, Writing – review & editing. NM: Conceptualization, Formal Analysis, Investigation, Methodology, Writing – original draft, Writing – review & editing. JL: Conceptualization, Data curation, Investigation, Writing – original draft, Writing – review & editing. EF: Conceptualization, Writing – original draft, Writing – review & editing. NR: Investigation, Resources, Writing – review & editing. DJ: Data curation, Writing – review & editing.
Funding
The author(s) declare that financial support was received for the research, authorship, and/or publication of this article. KS, NM, JL and EF attended the 2016 Ecological Dissertations in the Aquatic Sciences (Eco-DAS) workshop with funds from NSF, OCE-1356192; publication of this manuscript was paid for through the Eco-DAS program by NSF, OCE-1925796, both grants were awarded to Paul Kemp. KS and NR received support from NASA Award NNX16AG59G to NR. NM received support from NSF OCE-2230102 to NM, and KS received support from NSF OCE-2230103 to Nicole Poulton. EF has received funding through the Royal Academy of Engineering’s Research Fellowships programme. Funding that supports DJ and the running of the Continuous Plankton Recorder survey currently includes the following grants: the UK Natural Environment Research Council, Grant/Award Number: NE/R015953/1 Climate Linked Atlantic Sector Science, DEFRA UK ECM_64770 and mNCEA, NSF USAA101507, A101565 and WHOI 82314100, NERACOOS Subaward N21A013032, Ireland Marine Institute SERV-22-FEAS-090, DFO CA F5955- 150026/001/HAL, Horizon 2020: 862428 Atlantic Mission and AtlantECO 862923 and IMR Norway.
Acknowledgments
KS, NM, JL and EF acknowledge the Eco-DAS symposium for opportunities and support.
Conflict of interest
The authors declare that the research was conducted in the absence of any commercial or financial relationships that could be construed as a potential conflict of interest.
Publisher’s note
All claims expressed in this article are solely those of the authors and do not necessarily represent those of their affiliated organizations, or those of the publisher, the editors and the reviewers. Any product that may be evaluated in this article, or claim that may be made by its manufacturer, is not guaranteed or endorsed by the publisher.
Supplementary material
The Supplementary Material for this article can be found online at: https://www.frontiersin.org/articles/10.3389/fmars.2024.1320046/full#supplementary-material
References
Alheit J., Licandro P., Coombs S., Garcia A., Giráldez A., Santamaría M. T. G., et al. (2014). Reprint of “Atlantic Multidecadal Oscillation (AMO) modulates dynamics of small pelagic fishes and ecosystem regime shifts in the eastern North and Central Atlantic”. J. Mar. Syst. 133, 88–102. doi: 10.1016/j.jmarsys.2014.02.005
Barton A. D., Finkel Z. V., Ward B. A., Johns D. G., Follows M. J. (2013). On the roles of cell size and trophic strategy in North Atlantic diatom and dinoflagellate communities. Limnol. Oceanogr. 58, 254–266. doi: 10.4319/lo.2013.58.1.0254
Barton A. D., Irwin A. J., Finkel Z. V., Stock C. A. (2016). Anthropogenic climate change drives shift and shuffle in North Atlantic phytoplankton communities. Proc. Natl. Acad. Sci. 113, 2964–2969. doi: 10.1073/pnas.1519080113
Barton A. D., Lozier M. S., Williams R. G. (2015). Physical controls of variability in north Atlantic phytoplankton communities. Limnol. Oceanogr. 60, 181–197. doi: 10.1002/lno.10011
Beagrand G., Reid P. C. (2012). Relationships between North Atlantic salmon, plankton, and hydroclimatic change in the Northeast Atlantic. ICES J. Mar. Sci. 69, 1549–1562. doi: 10.1093/icesjms/fss153
Berge T., Chakraborty S., Hansen P. J., Andersen K. H. (2017). Modeling succession of key resource-harvesting traits of mixotrophic plankton. ISME J. 11, 212–223. doi: 10.1038/ismej.2016.92
Bergström A. K., Jansson M., Drakare S., Blomqvist P. (2003). Occurrence of mixotrophic flagellates in relation to bacterioplankton production, light regime and availability of inorganic nutrients in unproductive lakes with differing humic contents. Freshw. Biol. 48, 868–877. doi: 10.1046/j.1365-2427.2003.01061.x
Chakraborty S., Cadier M., Visser A. W., Bruggeman J., Andersen K. H. (2020). Latitudinal variation in plankton traits and ecosystem function. Global Biogeochem. Cycles 34, 1–25. doi: 10.1029/2020GB006564
Chakraborty S., Nielsen L. T., Andersen K. H. (2017). Trophic strategies of unicellular plankton. Am. Nat. 189, E77–E90. doi: 10.1086/690764
Dutkiewicz S., Cermeno P., Jahn O., Follows M. J., Hickman A. E., Taniguchi D. A., et al. (2020). Dimensions of marine phytoplankton diversity. Biogeosciences 17, 609–634. doi: 10.5194/bg-17-609-2020
Dutkiewicz S., Hickman A. E., Jahn O., Henson S., Beaulieu C., Monier E. (2019). Ocean color signature of climate change. Nat. Commun. 10, 609–634. doi: 10.1038/s41467-019-08457-x
Edwards K. F. (2019). Mixotrophy in nanoflagellates across environmental gradients in the ocean. Proc. Natl. Acad. Sci. U. S. A 116 (13), 6211–6220. doi: 10.1073/pnas.1814860116
Edwards M., Beaugrand G., Kléparski L., Hélaouët P., Reid P. C. (2022). Climate variability and multi-decadal diatom abundance in the Northeast Atlantic. Commun. Earth Environ. 3, 1–8. doi: 10.1038/s43247-022-00492-9
Edwards M., Richardson J. (2004). Impact of climate change on marine pelagic phenology and trophic mismatch. Nature 430, 881–884. doi: 10.1038/nature02808
Faure E., Not F., Benoiston A. S., Labadie K., Bittner L., Ayata S. D. (2019). Mixotrophic protists display contrasted biogeographies in the global ocean. ISME J 13 (4), 1072–1083. doi: 10.1038/s41396-018-0340-5
Flynn K. J., Stoecker D. K., Mitra A., Raven J. A., Glibert P. M., Hansen P. J., et al. (2013). Misuse of the phytoplankton-zooplankton dichotomy: The need to assign organisms as mixotrophs within plankton functional types. J. Plankton Res. 35, 3–11. doi: 10.1093/plankt/fbs062
Garcia H. E., Locarnini R. A., Boyer T. P., Antonov J. I., Baranova O. K., Zweng M. M., et al. (2013). “Volume 4: Dissolved inorganic nutrients (phosphate, nitrate, silicate),” in World ocean atlas, 25.
Gastineau G., Frankignoul C. (2012). Cold-season atmospheric response to the natural variability of the Atlantic meridional overturning circulation. Clim. Dyn. 39, 37–57. doi: 10.1007/s00382-011-1109-y
Gettings R. M., Townsend D. W., Thomas M. A., Karp-Boss L. (2014). Dynamics of late spring and summer phytoplankton communities on Georges Bank, with emphasis on diatoms, Alexandrium spp., and other dinoflagellates. Deep. Res. Part II Top. Stud. Oceanogr. 103, 120–138. doi: 10.1016/j.dsr2.2013.05.012
Greene C. A., Thirumalai K., Kearney K. A., Delgado J. M., Schwanghart W., Wolfenbarger N. S., et al. (2019). The climate data toolbox for MATLAB. Geochem. Geophys. Geosystems 20, 3774–3781. doi: 10.1029/2019GC008392
Hartmann M., Zubkov M. V., Scanlan D. J., Lepère C. (2013). In situ interactions between photosynthetic picoeukaryotes and bacterioplankton in the Atlantic Ocean: Evidence for mixotrophy. Environ. Microbiol. Rep. 5, 835–840. doi: 10.1111/1758-2229.12084
Henson S., Lampitt R., Johns D. (2012). Variability in phytoplankton community structure in response to the North Atlantic Oscillation and implications for organic carbon flux. Limnol. Oceanogr. 57 (6), 1591–1601.
Jeong H. J., du Yoo Y., Kim J. S., Seong K. A., Kang N. S., Kim T. H. (2010). Growth, feeding and ecological roles of the mixotrophic and heterotrophic dinoflagellates in marine planktonic food webs. Ocean Sci. J. 45, 65–91. doi: 10.1007/s12601-010-0007-2
Kwiatkowski L., Torres O., Bopp L., Aumont O., Chamberlain M., Christian J. R., et al. (2020). Twenty-first century ocean warming, acidification, deoxygenation, and upper-ocean nutrient and primary production decline from CMIP6 model projections. Biogeosci. 17, 3439–3470. doi: 10.5194/bg-17-3439-2020
Lambert B. S., Groussman R. D., Schatz M. J., Coesel S. N., Durham B. P., Alverson A. J., et al. (2022). The dynamic trophic architecture of open-ocean protist communities revealed through machine-guided metatranscriptomics. Proc. Nat. Acad. Sci. 119, e2100916119. doi: 10.1073/pnas.2100916119
Leles S. G., Mitra A., Flynn K. J., Stoecker D. K., Hansen P. J., Calbet A., et al. (2017). Oceanic protists with different forms of acquired phototrophy display contrasting biogeographies and abundance. Proc. R. Soc B Biol. Sci. 284, 20170664. doi: 10.1098/rspb.2017.0664
Lepori-Bui M., Paight C., Eberhard E., Mertz C. M., Moeller H. V. (2022). Evidence for evolutionary adaptation of mixotrophic nanoflagellates to warmer temperatures. Glob. Change Biol. 28, 7094–7107. doi: 10.1111/gcb.16431
Li A., Stoecker D. K., Coats D. W. (2000). Mixotrophy in Gyrodinium galatheanum (Dinophyceae): grazing responses to light intensity and inorganic nutrients. J. Phycology 36 (1), 33–45.
Litchman E., Klausmeier C. A., Schofield O. M., Falkowski P. G. (2007). The role of functional traits and trade-offs in structuring phytoplankton communities: Scaling from cellular to ecosystem level. Ecol. Lett. 10, 1170–1181. doi: 10.1111/j.1461-0248.2007.01117.x
Locarnini O. K., Mishonov A. V., Baranova O. K., Boyer T. P., Zweng M. M., Garcia H. E., et al. (2013). “Volume 1: temperature,” in World ocean atlas, 40.
Longhurst A. (1995). Seasonal cucles of pelagic production and consumption. Prog. Ocean. 36, 77–167. doi: 10.1016/0079-6611(95)00015-1
Lopez-Urrutia A., San Martin E., Harris R. P., Irigoien X. (2006). Scaling the metabolic balance of the oceans. Proc. Natl. Acad. Sci. 103, 8739–8744. doi: 10.1073/pnas.0601137103
McKie-Krisberg Z. M., Gast R. J., Sanders R. W. (2015). Physiological responses of three species of Antarctic mixotrophic phytoflagellates to changes in light and dissolved nutrients. Microbial Ecol. 70, 21–29.
Millette N. C., Pierson J. J., Aceves A., Stoecker D. K. (2017). Mixotrophy in Heterocapsa rotundata: a mechanism for dominating the winter phytoplankton. Limnol. Oceanogr. 62 (2), 836–845.
Millette N. C., Gast R. J., Luo J. Y., Moeller H. V., Stamieszkin K., Andersen K. H., et al. (2023). Mixoplankton and mixotrophy: future research priorities. J. Plankton Res. 45, 1–21. doi: 10.1093/plankt/fbad020
Mitra A., Caron D. A., Faure E., Flynn K. J., Leles S. G., Hansen P. J., et al. (2023). The Mixoplankton Database (MDB): Diversity of photo-phago-trophic plankton in form, function, and distribution across the global ocean. J. Eukaryot. Microbiol., 1–25. doi: 10.1111/jeu.12972
Mitra A., Flynn K. J., Burkholder J. M., Berge T., Calbet A., Raven J. A., et al. (2014). The role of mixotrophic protists in the biological carbon pump. Biogeosciences 11, 995–1005. doi: 10.5194/bg-11-995-2014
NASA Ocean Biology Processing Group. (2017). Photosynthetically available radiation (PAR). Moderate-Resolution Imaging Spectroradiometer (MODIS). Level-3 Ocean Color Data. (NASA Ocean Biology Distributed Active Archive Center). Available at: https://oceancolor.gsfc.nasa.gov/l3/ (Accessed 2017/07/31).
Richardson A. J., Walne A. W., John A. W. G., Jonas T. D., Lindley J. A., Sims D. W., et al. (2006). Using continuous plankton recorder data. Prog. Oceanogr. 68, 27–74. doi: 10.1016/j.pocean.2005.09.011
Rohr T., Richardson A. J., Lenton A., Chamberlain M. A., Shadwick E. H. (2023). Zooplankton grazing is the largest source of uncertainty for marine carbon cycling in CMIP6 models. Commun. Earth Environment. 4, 212. doi: 10.1038/s43247-023-00871-w
Rothhaupt K. O. (1996). Laboratory experiments with a mixotrophic chrysophyte and obligately phagotrophic and photographic competitors. Ecology 77, 716–724. doi: 10.2307/2265496
Schneider L. K., Flynn K. J., Herman P. M. J., Troost T. A., Stolte W. (2020). Exploring the trophic spectrum: placing mixoplankton into marine protist communities of the southern north sea. Front. Mar. Sci 7. doi: 10.3389/fmars.2020.586915
Seong K. A., Jeong H. J., Kim S., Kim G. H., Kang J. H. (2006). Bacterivory by co-occurring red-tide algae, heterotrophic nanoflagellates, and ciliates. Mar. Ecol. Prog. Ser. 322, 85–97.
Siegel D. A., Doney S. C., Yoder J. A. (2002). The North Atlantic spring phytoplankton bloom and Sverdrup’s critical depth hypothesis. Sci. (80-. ). 296, 730–733. doi: 10.1126/science.1069174
Stoecker D. K. (1998). Conceptual models of mixotrophy in planktonic protists and some ecological and evolutionary implications. Eur. J. Protistol. 34, 281–290. doi: 10.1016/S0932-4739(98)80055-2
Stoecker D. K., Hansen P. J., Caron D. A., Mitra A. (2017). Mixotrophy in the marine plankton. Annu. Rev. Mar. Sci. 9, 311–335.
Sverdrup H. (1953). On conditions for the vernal blooming of phytoplankton. Cons. Int. pour l’Exploration la Mer 18, 287–295. doi: 10.1093/icesjms/18.3.287
Townesend D. W., Cammen L. M., Holligan P. M., Campbell D. E., Pettigrew N. R. (1994). Causes and consequences of variability in the timing of phytoplankton blooms. Deep. Res. Part I 41, 747–765. doi: 10.1016/0967-0637(94)90075-2
Trenberth K., Zhang R. (2023). The climate data guide: atlantic multi-decadal oscillation (AMO). Available online at: https://climatedataguide.ucar.edu/climate-data/atlantic-multi-decadal-oscillation-amo.
Våge S., Castellani M., Giske J., Thingstad T. F. (2013). Successful strategies in size structured mixotrophic food webs. Aquat. Ecol. 47, 329–347. doi: 10.1007/s10452-013-9447-y
Ward B. A., Dutkiewicz S., Barton A. D., Follows M. J. (2011). Biophysical aspects of resource acquisition and competition in algal mixotrophs. Am. Nat. 178, 98–112. doi: 10.1086/660284
Ward B. A., Follows M. J. (2016). Marine mixotrophy increases trophic transfer efficiency, mean organism size, and vertical carbon flux. Proc. Natl. Acad. Sci. 113, 2958–2963. doi: 10.1073/pnas.1517118113
Wieczynski D. J., Moeller H. V., Gibert J. P. (2023). Mixotrophic microbes create carbon tipping points under warming. Funct. Ecol. doi: 10.1111/1365-2435.14350
Wilken S., Huisman J., Naus-Wiezer S., Van Donk E. (2013). Mixotrophic organisms become more heterotrophic with rising temperature. Ecol. Lett. 16, 225–233. doi: 10.1111/ele.12033
Keywords: mixotroph, continuous plankton recorder, North Atlantic, AMO, stratification, nutrient limitation
Citation: Stamieszkin K, Millette NC, Luo JY, Follett E, Record NR and Johns DG (2024) Large protistan mixotrophs in the North Atlantic Continuous Plankton Recorder time series: associated environmental conditions and trends. Front. Mar. Sci. 11:1320046. doi: 10.3389/fmars.2024.1320046
Received: 11 October 2023; Accepted: 21 February 2024;
Published: 13 March 2024.
Edited by:
Kyle Edwards, University of Hawaii at Manoa, United StatesReviewed by:
Qian Li, Shanghai Jiao Tong University, ChinaMargaret Mars Brisbin, University of South Florida, United States
Copyright © 2024 Stamieszkin, Millette, Luo, Follett, Record and Johns. This is an open-access article distributed under the terms of the Creative Commons Attribution License (CC BY). The use, distribution or reproduction in other forums is permitted, provided the original author(s) and the copyright owner(s) are credited and that the original publication in this journal is cited, in accordance with accepted academic practice. No use, distribution or reproduction is permitted which does not comply with these terms.
*Correspondence: Karen Stamieszkin, a3N0YW1pZXN6a2luQGJpZ2Vsb3cub3Jn