 Alejandra Mora-Soto1*
 Sarah Schroeder1
 Lianna Gendall1,2Alena Wachmann1
 Gita R. Narayan1,3
 Silven Read1Isobel Pearsall4
 Emily Rubidge5Joanne Lessard6Kathryn Martell7Peter Wills8
 Maycira Costa1
- 1Spectral Lab, University of Victoria, Victoria, BC, Canada
- 2School of Biological Sciences and Oceans Institute, University of Western Australia, Crawley, WA, Australia
- 3Fisheries and Aquaculture Department, Vancouver Island University, Nanaimo, BC, Canada
- 4Marine Science Program, Pacific Salmon Foundation, Vancouver, BC, Canada
- 5Fisheries and Oceans Canada, Institute of Ocean Sciences, Sidney, BC, Canada
- 6Fisheries and Oceans Canada, Pacific Biological Station, Nanaimo, BC, Canada
- 7Islands Trust Conservancy, Victoria, BC, Canada
- 8Canadian Hydrographic Service, Institute of Ocean Sciences, Sidney, BC, Canada
The impacts of local-scale temperatures and winds on bull kelp (Nereocystis luetkeana) vary along a coastal gradient, while also being influenced by corresponding global-scale oceanic conditions. Around Vancouver Island and the Gulf Islands, BC, Canada, bull kelp floating canopies were mapped using high-resolution imagery from 2005 to 2022, whereas the largest kelp bed of the area was mapped with medium-resolution imagery spanning from 1972 to 2022. In order to understand spatial patterns of kelp resilience, the abiotic characteristics were used to organize the coastline into four clusters, ranging from the coldest and most exposed coast to a more sheltered and warmer location. Additionally, local-scale sea surface temperatures, winds, and marine heatwaves were categorized by global-scale temporal conditions defined by the positive/negative oceanic oscillations of the Oceanic Niño Index (ONI) and Pacific Decadal Oscillation (PDO). Comparing spatial and temporal categories, we observed that years with positive ONI and PDO, in particular the 2014–2019 period, concentrated most of the marine heatwaves and the spring temperature peaks. However, there are some indications of an underlying long-term trend. During the period 2020–2022, when ONI and PDO were negative, summer temperatures kept increasing and wind displayed a higher frequency of extreme events. Mapped kelp showed different trends to these stressors: the coldest and most exposed area showed a constant presence of kelp during the entire period, even dating back to 1972. Warmer and semi-sheltered coasts increased in kelp percentage cover after the positive ONI+PDO period of 2014–2019, and the coasts facing the Strait of Georgia displayed a lower kelp percentage cover than the other clusters. In summary, bull kelp was resilient in the study area, but for different reasons: colder and more exposed coasts had the most favorable conditions for kelp, but warmer and more sheltered coastal kelp beds may have benefited from wind-wave forcing.
1 Introduction
A long-standing topic in natural history is the categorization of patterns in marine communities (Paine, 1994), acknowledging that they are permanently dynamic under the presence of abiotic stressors (Pelletier et al., 2020). On the seascape, kelp forests stand out as a diverse biogenic system where varied abiotic factors, many of which are temperature-related, can influence their distribution and growth (Dayton, 1985; Jayathilake and Costello, 2020). There is an overall consensus that kelp forests will be increasingly affected by stressors like marine heatwaves (MHWs) (Arafeh-Dalmau et al., 2019; Wernberg et al., 2019; Smale, 2020). However, environmental stressors do not always have the same impact at a local level, even at almost equal latitudes (Cavanaugh et al., 2019). Temperature, exposure, and nutrient and light availability can impact kelp communities with divergent outcomes, from no change to increased grazing, ecological shifts, or even extinction of local ecosystems (Straub et al., 2019). The diversity in ocean conditions and the paucity of long-term data on kelp have shown highly variable trends at the ecoregional and global levels (Krumhansl et al., 2016).
The Oregon, Washington, Vancouver Coast and Shelf Marine Ecoregion (sensu Spalding et al., 2007) is home to at least 28 kelp species (Druehl, 1970), including the canopy-forming bull kelp (Nereocystis luetkeana) and giant kelp (Macrocystis pyrifera). Considered foundation species for marine communities (Springer et al., 2010; Trebilco et al., 2015), bull and giant kelp are part of the living landscape for the coastal First Nations who have stewarded these waters since time immemorial (Ames, 1998; Erlandson et al., 2007). In this paper, we focus on Nereocystis forests and use the term ‘kelp’ to identify its floating canopy area on the sea surface. Current research on Nereocystis status in this ecoregion describe their persistence in Oregon (Hamilton et al., 2020), Washington (Pfister et al., 2018), and the western coast of Vancouver Island (Starko et al., 2022). In sheltered areas in the Salish Sea, trends are highly variable, ranging from persistent areas (Pfister et al., 2018; Schroeder et al., 2020) to local extinction in the central areas of southern Puget Sound (Berry et al., 2021). Persistence and losses have been reported on the eastern coast of Haida Gwaii (Gendall et al., in prep). Further south, in California, Nereocystis forests have decreased dramatically (McPherson et al., 2021; Bell et al., 2023; Cavanaugh et al., 2023). These different scenarios indicate that the scale and spatial context are important to explain kelp trends.
From a regional perspective, the literature on kelp forests of the northeastern Pacific suggests that the combined effect of a positive Oceanic Niño Index (ONI) and positive Pacific Decadal Oscillation (PDO) usually leads to a combination of unusual storm activity, higher local temperatures, and greater frequency of MHWs (Di Lorenzo and Mantua, 2016). These effects, combined with dampened nutrient levels, reduce kelp tissue growth and lead to a shift from kelp forests to urchin barrens or dominance of understory kelp (Dayton and Tegner, 1984; Zimmerman and Kremer, 1986; Tegner et al., 1997; Rogers-Bennett and Catton, 2019; Rogers-Bennett & Catton, 2022). Furthermore, the North Pacific experienced anomalously warm temperatures from 2014–2019, starting with a period widely known as the ‘Blob’. This Blob was an unusual combination of positive temperature anomalies and high pressure, which weakened the cold advection in the open ocean from 2014 to 2016 (Bond et al., 2015). Analogous warming events occurred in the North Pacific in the following years (Chen et al., 2021). The combination of increased sea surface temperatures (SSTs) and frequency of MHWs caused devastating effects in some benthic ecosystems of this region (Arafeh-Dalmau et al., 2019; McPherson et al., 2021). The effects of the Blob in the southern Vancouver Island and the Gulf Islands kelp beds have been uncertain.
At a local scale, temperature, nutrients, and wave exposure can also play a role on kelp dynamics (Graham et al., 1997). For instance, previous laboratory experiments showed that thermal plasticity and tolerance of Nereocystis increase at high flow conditions, expressed as increased blade and canopy growth at high temperatures (Supratya et al., 2020). In contrast, low-flow conditions are associated with wider and more undulated blades but reduced phenotypic plasticity at stressing temperatures, reducing tissue growth and ultimately leading to local loss (Supratya et al., 2020). Physical removal of macroalgal competitors by storms can improve Nereocystis settlement (Dayton et al., 1984; Maxell and Miller, 1996; Springer et al., 2010; Dobkowski et al., 2019). Additionally, winter storms can transport enormous amounts of spore-releasing sori until they settle on the sea floor, contributing to genetic dispersal (Amsler and Neushul, 1989; Springer et al., 2010), forming a microscopic seed bank (Hoffmann and Santelices, 1991). Local-level variations of temperature, nutrients, and exposure may help identify kelp ecotypes and trends, depending on the spatial and temporal coverage of data that is available. Some examples of this data availability range from periodic in-situ observations (Starko et al., 2019; Starko et al., 2022) to multidecadal time series derived from satellites (Cavanaugh et al., 2011; Bell et al., 2015; Bell et al., 2020; Gendall et al., in prep), and historical archives derived from nautical charts and aerial photography (Pfister et al., 2018; Berry et al., 2021; Gendall et al., in prep).
Satellite imagery can aid in defining a consistent long-term time series of kelp, although it is important to consider the limitations of this technology. Medium-spatial-resolution imagery (~30–10 m), successfully used to determine area and biomass changes in wide canopies (Cavanaugh et al., 2010; Cavanaugh et al., 2011; Nijland et al., 2019; Bell et al., 2020; Hamilton et al., 2020; Mora-Soto et al., 2020; Gendall et al., 2023), may not be adequate for narrow beds adjacent to the steep coastlines that distinguish the post-glacial coastal geomorphology of British Columbia (Thomson, 1981; Schroeder et al., 2019; Starko et al., 2022; Gendall et al., 2023). For these kelp areas, high- to very high-resolution (<6 m) imagery becomes necessary, albeit costly and limited in spatial and temporal range, as it is not always acquired under the ideal conditions for kelp mapping (Britton-Simmons et al., 2008); nevertheless, satellite imagery has the potential to identify changes in floating kelp canopy area, along with detecting patterns in space and time (Schroeder et al., 2019; Cavanaugh et al., 2021; Gendall et al., 2023).
This study uses satellite imagery to identify Nereocystis changes in percentage cover and resilience trends in southern Vancouver Island and the Gulf Islands in the Salish Sea of British Columbia in Canada, from a global to a local scale, along different coastal conditions. Here, resilience is defined as the inherent ability of a system to absorb changes and return to a reference state (or dynamic) after a temporary disturbance (Holling, 1973; Grimm and Wissel, 1997). Global-scale oscillations such as the Oceanic Niño Index and the Pacific Decadal Oscillation were organized into optimal (negative ONI or PDO) and suboptimal (positive ONI or PDO) periods. Local-scale coastal gradients were represented by clusters of similar environmental conditions. Local dynamics were represented by nearshore sea surface temperatures, marine heatwaves, and wind conditions. Specifically, our objectives are twofold: a) to identify how kelp cover was associated with environmental variables, global-scale periods, and local clusters; and b) to define resilience trends during and after an intense warming anomaly period in 2014–2019. The primary kelp data used in this study were derived from high-resolution satellite imagery available for the last two decades (2005–2022). A secondary source is the mapped area of the largest floating kelp forest in our study area, derived from a range of medium- and high-resolution satellite imagery to extend the time series back to 1972. This framework integrates geographical gradients, time periods, and multiple data sources to define the variability of kelp forests in space and time.
2 Materials and methods
2.1 Study area
The study area (Figure 1) covers from the southern Strait of Georgia at latitude 49°N to the south of Vancouver Island, in the Canadian part of the Salish Sea. This region is framed by a complex geomorphology of islands and channels encompassing a dynamic oceanography driven by river discharge, semidiurnal tides, winds, and strong currents (Thomson, 1981). From fall to winter, the upper layer is cooled by storms; while in spring and summer, calmer conditions allow the surface layer to warm up, particularly on sheltered coasts (Thomson, 1981; Suchy et al., 2022). Spring and summer runoff from the Fraser River forms a brackish layer that meets the oceanic, nitrate-charged waters of the Strait of Juan de Fuca, forming a strong vertical tidal mixing in Haro Strait (Mackas and Harrison, 1997; Li et al., 2000), generating high levels of primary productivity in springtime (Peña et al., 2016; Marchese et al., 2022; Suchy et al., 2022). Photosynthetically active radiation values range from ~5 to 60 Ein/m per day in the northern and central regions of the Salish Sea, with peaks in summer and minimum values in winter (Suchy et al., 2019). This body of water has shown a summer warming trend over the last four decades (Amos et al., 2014).
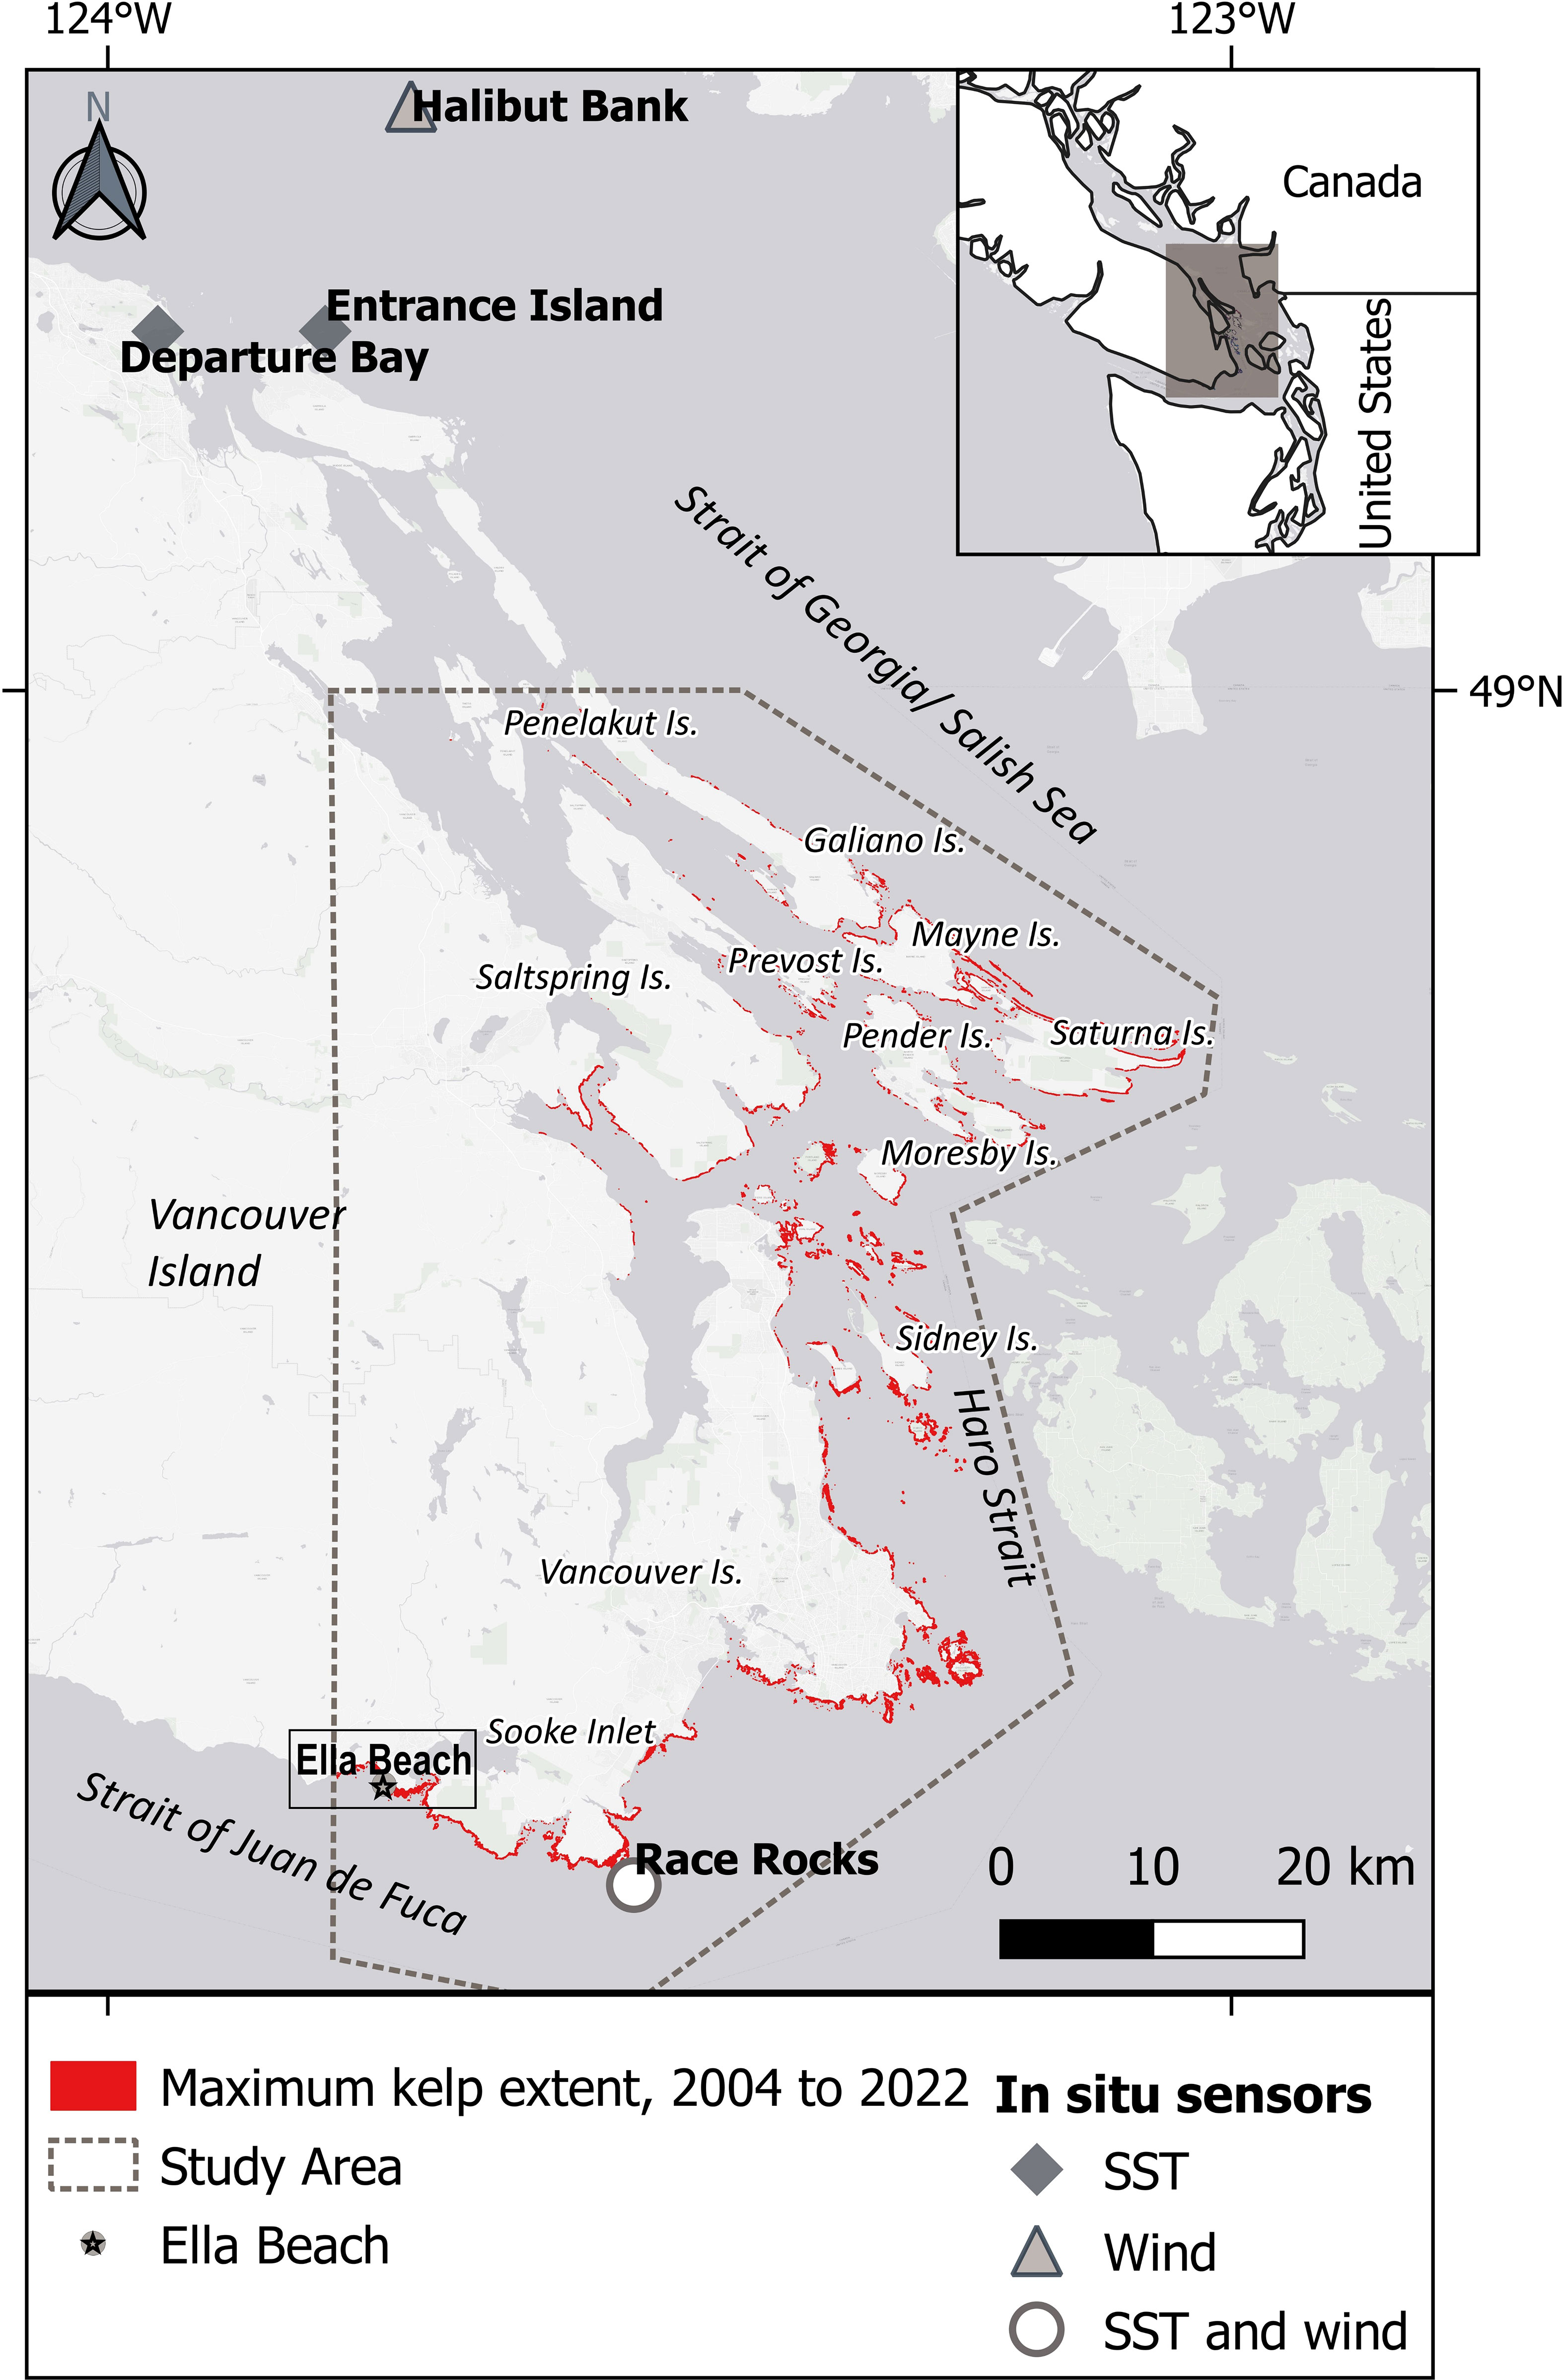
Figure 1 Study area: Southern Vancouver Island and the Gulf Islands south of latitude 49°N, in the Canadian part of the Salish Sea. The maximum kelp extent observed using high-resolution imagery is highlighted in red. Ella Beach data spans from 1972 to 2022.
2.2 Spatial and temporal dimensions
2.2.1 Spatial dimension: clusters
The study area was classified into environmental clusters (clusters hereafter), based on previous literature on kelp environments (Tegner and Dayton, 1987; Bekkby et al., 2009; Young et al., 2016; Smale and Moore, 2017; Gregr et al., 2019; Young et al., 2023). The clusters were defined by the integration of the climatology of sea surface temperature (SST in °C) for spring and summer from Landsat imagery (courtesy of the U.S. Geological Survey), fetch (m; Gregr et al., 2019), modelled tidal amplitude current (m/s; Foreman et al., 2004), wind density (W/m2; Davis et al., 2023), and total suspended matter (TSM) in spring and summer (mg/L; Giannini et al., 2021) (Table 1). These variables were compiled through a multipoint layer along the coastline, with each point located 1000 m apart and 300 m off the coast to avoid adjacency from land temperatures derived from the Landsat SST product (Wachmann et al., in review). Mean values falling within a radius of 100 m around the points were used to summarize the variables. This dataset was evaluated to define an optimal number of clusters using within the sum of squares, average silhouette width, and gap statistics to execute a K-means clustering in R (R Core Team, 2023). This process classifies each variable value into a cluster value, minimizing the within-cluster sum of squares to the cluster centers (Hartigan and Wong, 1979).
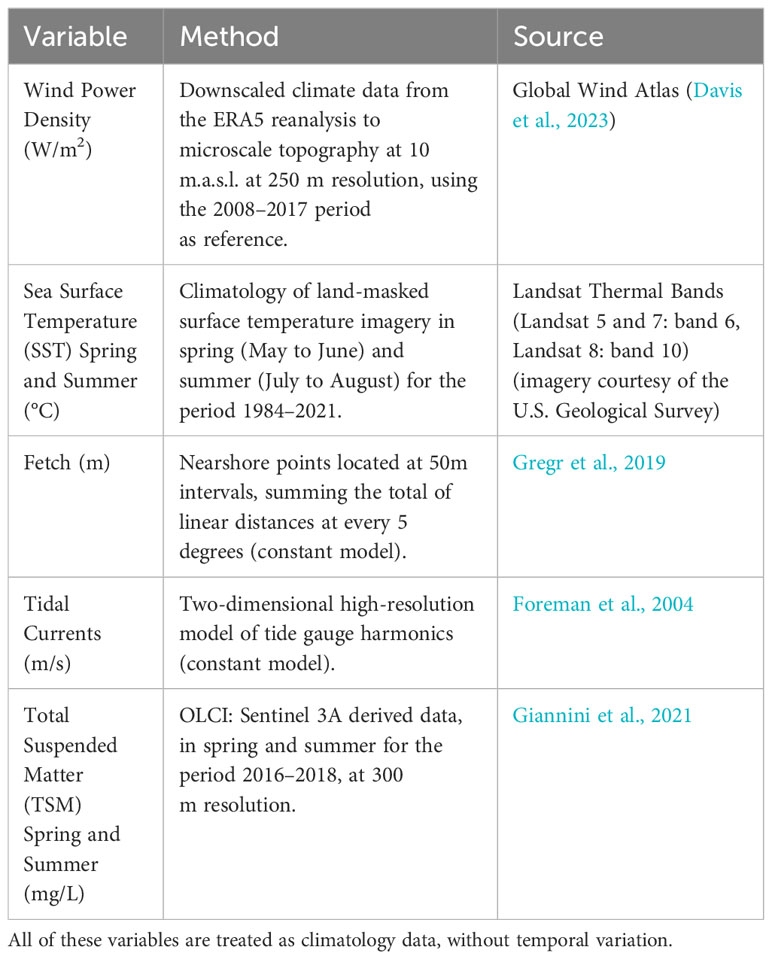
Table 1 Spatially-explicit variables utilized for the cluster definition.
Four characteristically distinct clusters were found along the coastline (Figures 2, 3A). Cluster 1 represents the coldest areas, with average temperatures ranging from 9.8°C in spring to 12.0°C in summer. It is also the most wave-exposed area with the highest average of wind density (133.8 W/m2), fetch (549 km), and tidal amplitude (0.3 m/s). Cluster 2 represents a semi-sheltered coast (fetch 195 km; tidal current amplitude 0.2 m/s) with slightly warmer SSTs (11.3°C in spring and 14.4°C in summer). Cluster 3 represents warmer coastal areas (12.8°C in spring, 17.4°C in summer) and subject to the highest amount of sediment from the Fraser River plume (1.4 mg/l in spring, 2.5 mg/l in summer) compared to the other clusters. Lastly, Cluster 4 corresponds to the most protected coastlines (average fetch 132 km) with the warmest temperatures (mean spring SST 13.2°C and 16.8°C in summer). Finally, total mapped kelp per cluster from satellite imagery follows a decreasing pattern from Cluster 1 (1116.4 ha) to 2 (444.5 ha), 3 (83.6 ha), and 4 (10.5 ha) (Supplementary Table S1).
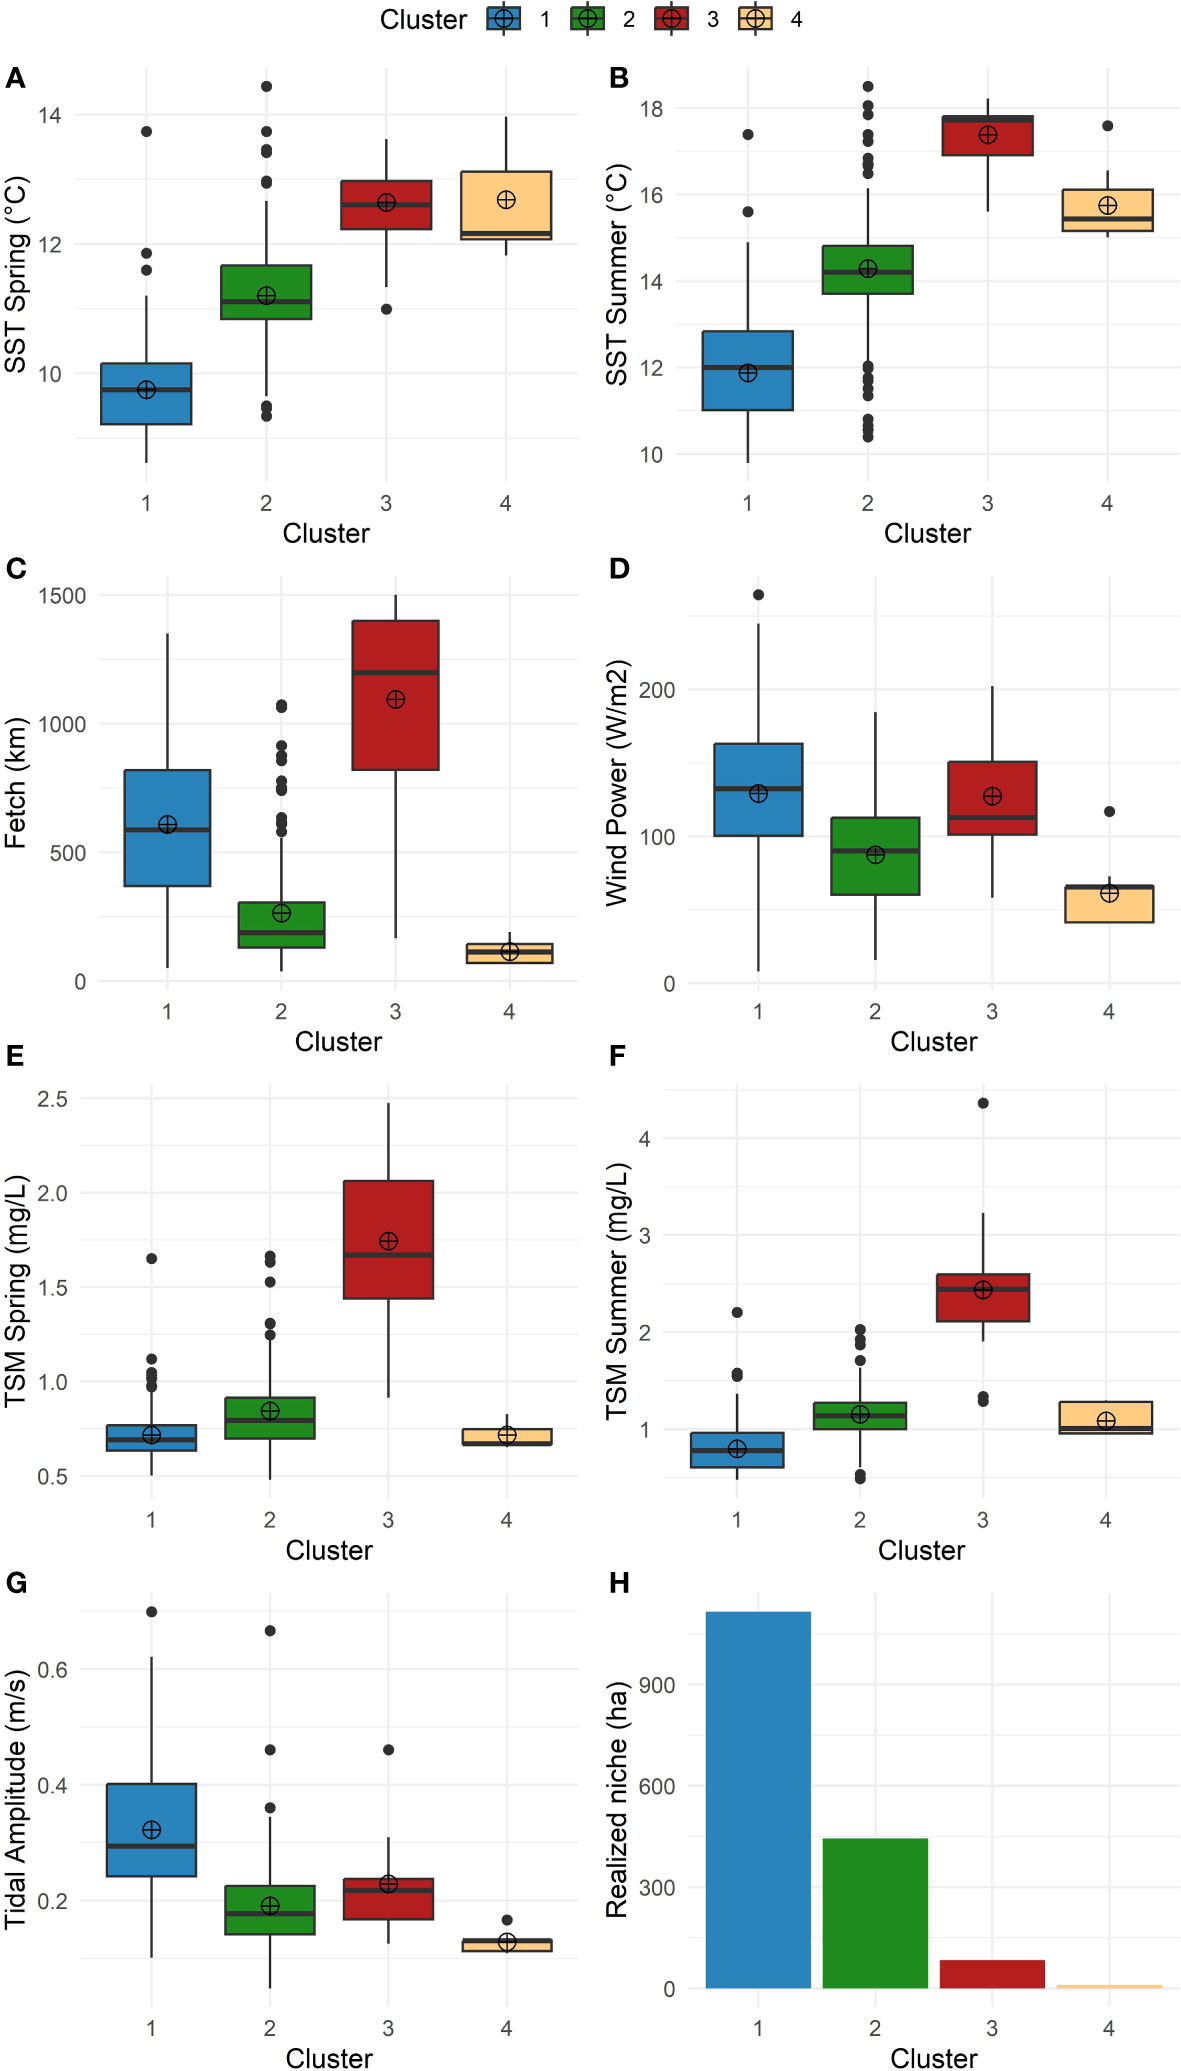
Figure 2 Box and whisker plots characterizing the clusters by variables; the box summarizes the upper and lower quartiles while the central line indicates the median and the dot indicates the mean. (A) SST climatology in spring (°C). (B) SST climatology in summer (°C). (C) Fetch (km). (D) Wind power (W/m2). (E) TSM spring (mg/L). (F) TSM summer (mg/L). (G) Tidal amplitude (m/s). (H) Total mapped kelp (realized niche) (ha).
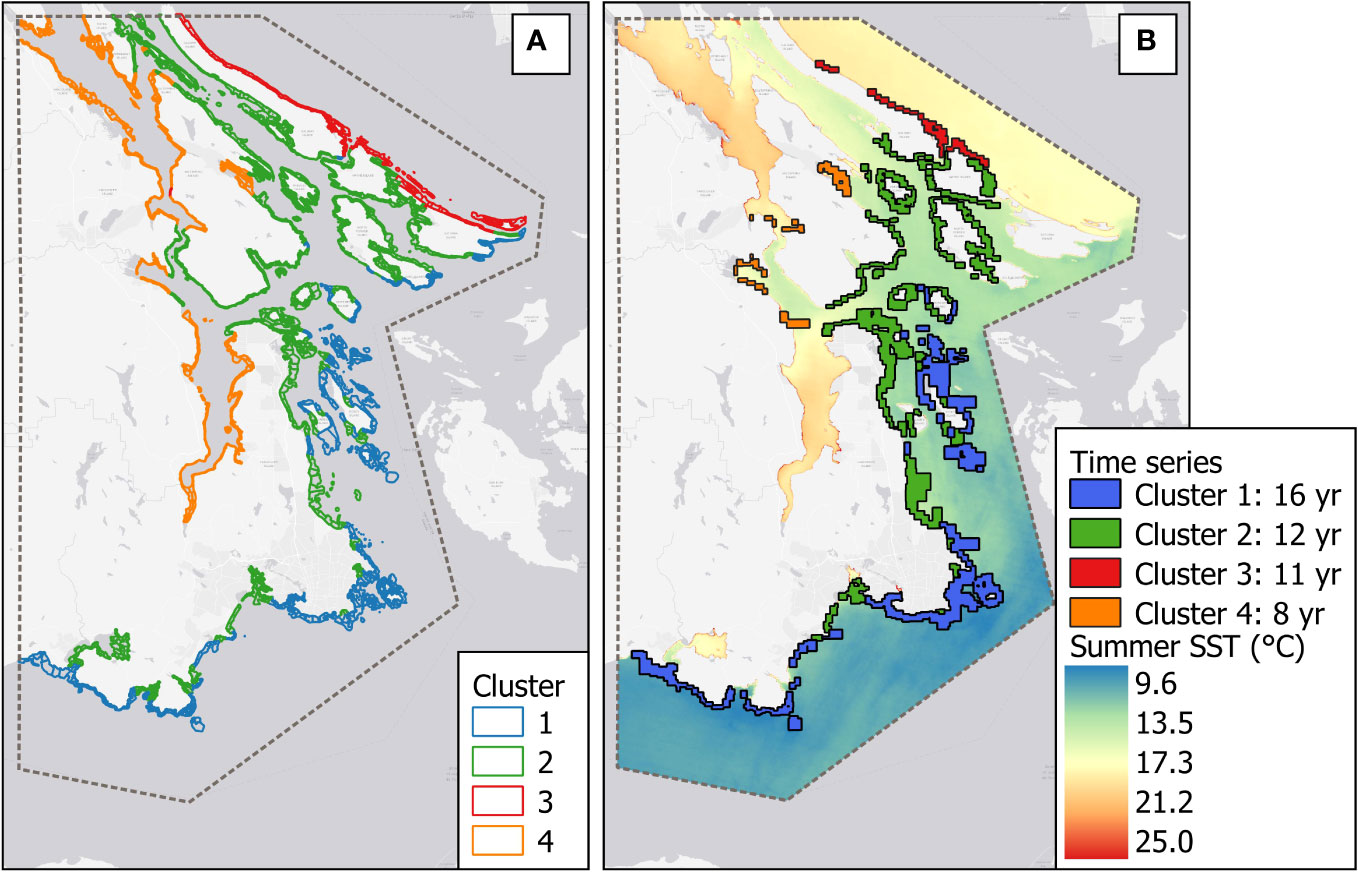
Figure 3 (A) Cluster distribution map. (B) Time series of kelp per cluster and the climatological mean of the summer SST (°C) from 1984 to 2022 retrieved from the Landsat series.
2.2.2 Temporal dimension: global-scale periods and local drivers
The temporal dimension was organized in periods representing global conditions. The period frame was chosen because mapped kelp is temporally and spatially variable and can show lagged fluctuations for one to two years (Tegner et al., 1997; Dayton et al., 1999; Bell et al., 2015; Pfister et al., 2018; Cavanaugh et al., 2019; Bell et al., 2020; Schroeder et al., 2020; Cavanaugh et al., 2021; McPherson et al., 2021; Gendall et al., in prep). The global scale was represented by ONI (NOAA, 2023a) and PDO (NOAA, 2023b). In general, we consider that optimal periods for kelp were when the PDO or ONI was negative, while positive PDO or ONI were classified as suboptimal periods (Dayton et al., 1999; Bell et al., 2015; Pfister et al., 2018; Cavanaugh et al., 2019; Gendall, et al., in prep). To implement this classification, ONI and PDO values from spring (May to June) and summer (July to August) 2002 to 2022 were rescaled using z-scores. The median value of z-scored ONI (-0.05) and PDO (-0.26) were the parameters to distinguish optimal versus suboptimal periods. The Kruskal-Wallis test (Kruskal and Wallis, 1952) was used to identify if the difference among the periods was statistically significant, whereas the Dunn test (Dunn, 1961) was used as a post hoc analysis to define the groups that were statistically different.
Following this method, four periods were defined from 2002 to 2022: a positive ONI+PDO period (also called Suboptimal 1) from 2002 to 2006, a negative ONI+PDO period (Optimal 1) from 2007 to 2013, a positive ONI+PDO period (Suboptimal 2) from 2014 to 2019, characterized by the Blob. Finally, a negative ONI+PDO period (Optimal 2) grouped 2020 to 2022 (Figure 4A). The difference among the periods was statistically significant (Kruskal-Wallis and Dunn p-values<0.05; Supplementary Figure S1).
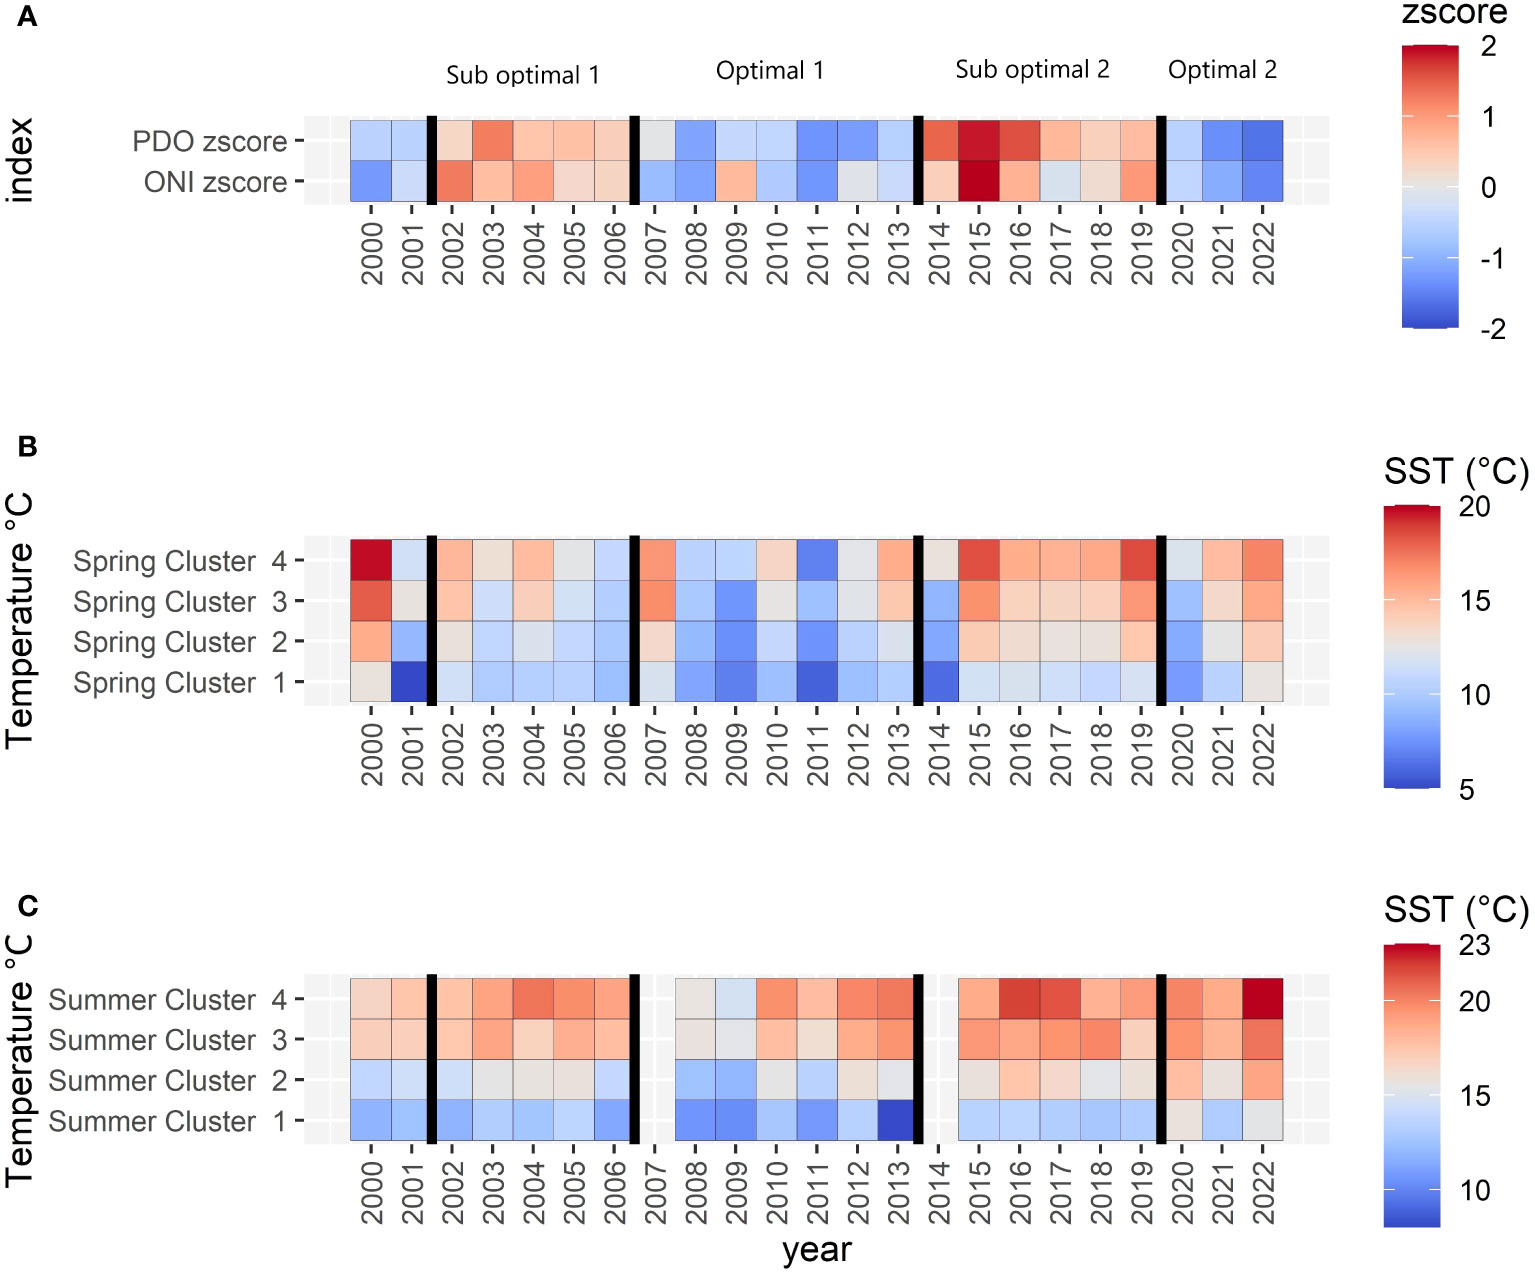
Figure 4 (A) Oceanic oscillations (z-scored): red to blue color ramp follows positive to negative values, while the vertical lines divide the periods indicated above (A, B) Landsat SST spring temperatures at the cluster level. (C) Landsat SST summer temperatures at the cluster level. Notice that the color ramps represent z-scores in A and different temperature ranges in (B, C).
In a second step, local-scale variables including sea surface temperature, wind speed, and marine heatwaves were compared by those periods. SST is a reliable indicator of kelp physiology and Nereocystis has a broad range of thermal tolerance (Springer et al., 2010) that can be lower in sheltered or low-energy areas, as observed by Starko et al. (2019) and Supratya et al. (2020). Local nearshore SST derived from Landsat SST data (Landsat 5, 7, and 8) was defined from a single clear sky image representing spring (May–June) and summer (July–August) from 1984 to 2022, although summer 2007 and 2014 were missing in this dataset (dates in Supplementary Table S2). Landsat-derived SST (hereafter Landsat SST) was averaged per cluster using zonal statistics in a polygon buffer 300 m from the shoreline to reduce land-adjacency effects (Wachmann et al., in review). To confirm the effectiveness of using a single image to represent spring and summer for each year, Landsat SST data were compared with daily in-situ surface water temperature from the Entrance Island, Departure Bay, and Race Rocks lighthouses (PCIC, 2023) (Figure 1), selecting their respective spring and summer temperatures and calculating their seasonal mean and standard deviation (StDev). Then, the difference between the Landsat SST day and the range of mean ±2 StDev in-situ seasonal SST was calculated. For spring, out-of-range dates beyond 2 StDev had differences of less than 0.60°C with the in-situ measurement (except for one record with 1.73°C difference at Entrance Island). For summer, the out-of-range temperature differences beyond 2 StDev were less than 0.15°C. As the dates selected from Landsat SST were representative of their respective seasons, they are considered valid to represent local temperature conditions at the cluster level. Consecutively, spring and summer Landsat SST were summarized by descriptive statistics per period.
To complement the temperature data, the study also included marine heatwaves, or anomalously warm events on the sea surface lasting at least 5 consecutive days (Hobday et al., 2016). MHWs are known to pose a growing risk to kelp survival worldwide (Wernberg et al., 2019). Daily water temperature data from the aforementioned lighthouses were compiled using methods by Hobday et al. (2016) and Hobday et al. (2018) to calculate the frequency and intensity of MHWs in this region, considering a baseline between 1983–2022. This method (facilitated by the heatwaveR package in R; Schlegel and Smit, 2018) uses a time series for at least 30 years to identify SST anomalies for any date in an 11-day window. If the maximum observed day intensity surpasses the day’s seasonal climatology and the 90th percentile threshold for more than 5 days, the event is classified as a MHW. Consecutively, the number of times the maximum intensity surpasses the distance between the seasonal climatology and the threshold (1 to 4 times) is associated to the MWH categories Moderate (Category I), Strong (Category II), Severe (Category III), and Extreme (Category IV), respectively.
Another abiotic variable considered in this study was wind, as an indicator of wave activity (Young et al., 2016; Yang et al., 2019). Wave-exposed sites positively correlate with kelp abundance and tolerance to warming trends (Starko et al., 2019; Starko et al., 2022). However, this correlation is limited when extreme storms remove large canopy areas, leading to competitive understory recruitment (Dayton and Tegner, 1984). Wind data (speed and direction) were obtained from a buoy located in the center of the Salish Sea (Halibut Bank; location: 49°20’24”N 123°43’48”W; date range: 2002 to 2022; PCIC, 2023) (Figure 1) and a station at the southern tip of Vancouver Island (Race Rocks; location: 49°17’54’’N 123°31’54’’W; date range: 2012 to 2022; PCIC, 2023) (Figure 1). Extreme wind events were summarized to identify if their frequency changed across periods. Extreme wind events were defined as days when the maximum wind speed surpassed 2 StDev or the 95th percentile of the time series. Extreme wind per period (Nextreme) was normalized by the following equation:
where Ni is the number of days with extreme wind per month, and Mp the number of months per period. We referred to the Beaufort wind scale (Thomson, 1981) to indicate the intensity of the wind.
2.2.3 Mapped floating kelp extent
Floating kelp extent was derived from high-resolution imagery data spanning from 2005 to 2022. This dataset represents the maximum imagery coverage for the study area (Supplementary Table S3; Supplementary Figure S2). The mapping approach for this complex coastline prioritized the use of the highest resolution (<3 m) available imagery to map small nearshore kelp beds, >3 to <10 m resolutions for medium-sized nearshore kelp, and any resolution, including medium-resolution (>10 m) imagery for offshore and larger kelp beds. The selected images were collected at low tide in summer (July to August) to match the peak growth of the year (Springer et al., 2010), resulting in an annual record of the maximum observed kelp extent, following methods by Schroeder et al. (2019); Schroeder et al. (2020) and Gendall et al. (2023). In this study, 0.1 m (aerial photos), 2.5 m Quickbird and WorldView, 3.2 m Ikonos, 4.0 m PlanetScope, 4.4 m Kompsat, and 5.0 m RapidEye comprised the used imagery for a total of 57 images. The exception for this was 2006, mapped with a 20 m resolution image (Spot 5) due to the lack of higher resolution data, but this only covered the southern part of the study area where the larger kelp beds are observed. To support our observations within a longer temporal range, the largest floating kelp bed in our study area (Ella Beach, 48°21’44.34”N, 123°45’29.18”W, Figure 1) was mapped as a ‘sentinel’ or reference area from 1972 to 2022 with Landsat (medium-resolution) imagery (Figure 1; Supplementary Table S4), as the size of the bed allowed an accurate detection using this data (Jensen et al., 1980; Cavanaugh et al., 2011; Hamilton et al., 2020; Gendall et al., 2023). The overall accuracy of this method is >70%. The mapping protocol is explained and discussed in detail in the Supplementary Material.
Following the classification, the mapped kelp was organized within clusters that were subdivided into segments. The segments were based on the potential niche (sensu Soberón and Nakamura, 2009), selecting rocky and mixed substrate areas (Gregr et al., 2021), while excluding the land above the low-water mark and bathymetry below 40 m (Springer et al., 2010). The potential niche was split by polygons of ~1000 m alongshore length, with some smoothing adjustments on complex reef areas, using previous methods developed by Pfister et al. (2018) and Schroeder et al. (2020). In addition, the total annual mapped floating kelp beds were spatially summed together, and the resultant layer was considered as the extent of the realized niche (kelp niche hereafter), or the areas of existing populations (Soberón and Nakamura, 2009). Floating kelp per year was calculated as the percentage cover of the kelp niche per segment, summarized by period and environmental cluster. Considering the semi-stochastic nature of dispersion and settlement of Nereocystis (Springer et al., 2010), not finding floating canopies in a particular year cannot be taken as a complete loss, unless documented absence of kelp remains persistent over time. For this reason, we considered segments with the highest temporal imagery coverage and at least one year of mapped kelp for the analysis.
2.2.4 Data analysis
Kelp-per-cluster data were analyzed by optimal and suboptimal periods from 2005 to 2022 through descriptive statistics (mean, StDev) of percentage cover, by period and cluster. The sentinel site in Cluster 1 (Ella Beach; Figure 1) was monitored to identify long-term trends from 1972 to 2022. As the extent of this floating kelp bed is larger than the size of the segments, the percentage cover was normalized to the total site area. The optimal and suboptimal periods were defined with the same methods as the 2005–2022 analysis, followed by Kruskal-Wallis and Dunn tests to identify if those periods were significantly different. Finally, the Mann-Kendall test for non-parametric data (Kendall package in R; McLeod, 2022) was used to identify temporal trends.
To evaluate the impact of the Blob and consecutive warming events on local floating kelp beds, the mean and the StDev of the percentage kelp cover from the previous period (Optimal 1; 2007–2013) were considered the reference bounds for a stable kelp population. Resilience was evaluated as the difference between the mean and StDev of the subsequent years (2014 to 2022, the Blob and post- Blob years) with the reference value from the Optimal 1 period. If the kelp percentage remained within the reference bounds, the kelp presence per cluster was considered resilient for that year and period.
3 Results
3.1 Local SST
Landsat SST showed an increasing pattern along the four periods in both spring and summer (Figures 4B, C), with generally lower temperatures during the first negative ONI+PDO Optimal 1 period of 2007–2013, whereas spring temperatures reached a maximum in the positive ONI+PDO Suboptimal 2 period of 2014–2019 for the four clusters (Table 2; Supplementary Figure 3 and Supplementary Table S5 for more details). Summer temperatures, on the other hand, gradually increased to reach their maximum average values in the negative ONI+PDO Optimal 2 period of 2020–2022, with a mean of 14.8°C, 17.5°C, 19.4°C, and 20.5°C in Clusters 1 (coldest and most exposed), 2 (medium exposed and slightly warmer), 3 (exposed to the Strait of Georgia), and 4 (warmest and most protected), respectively.
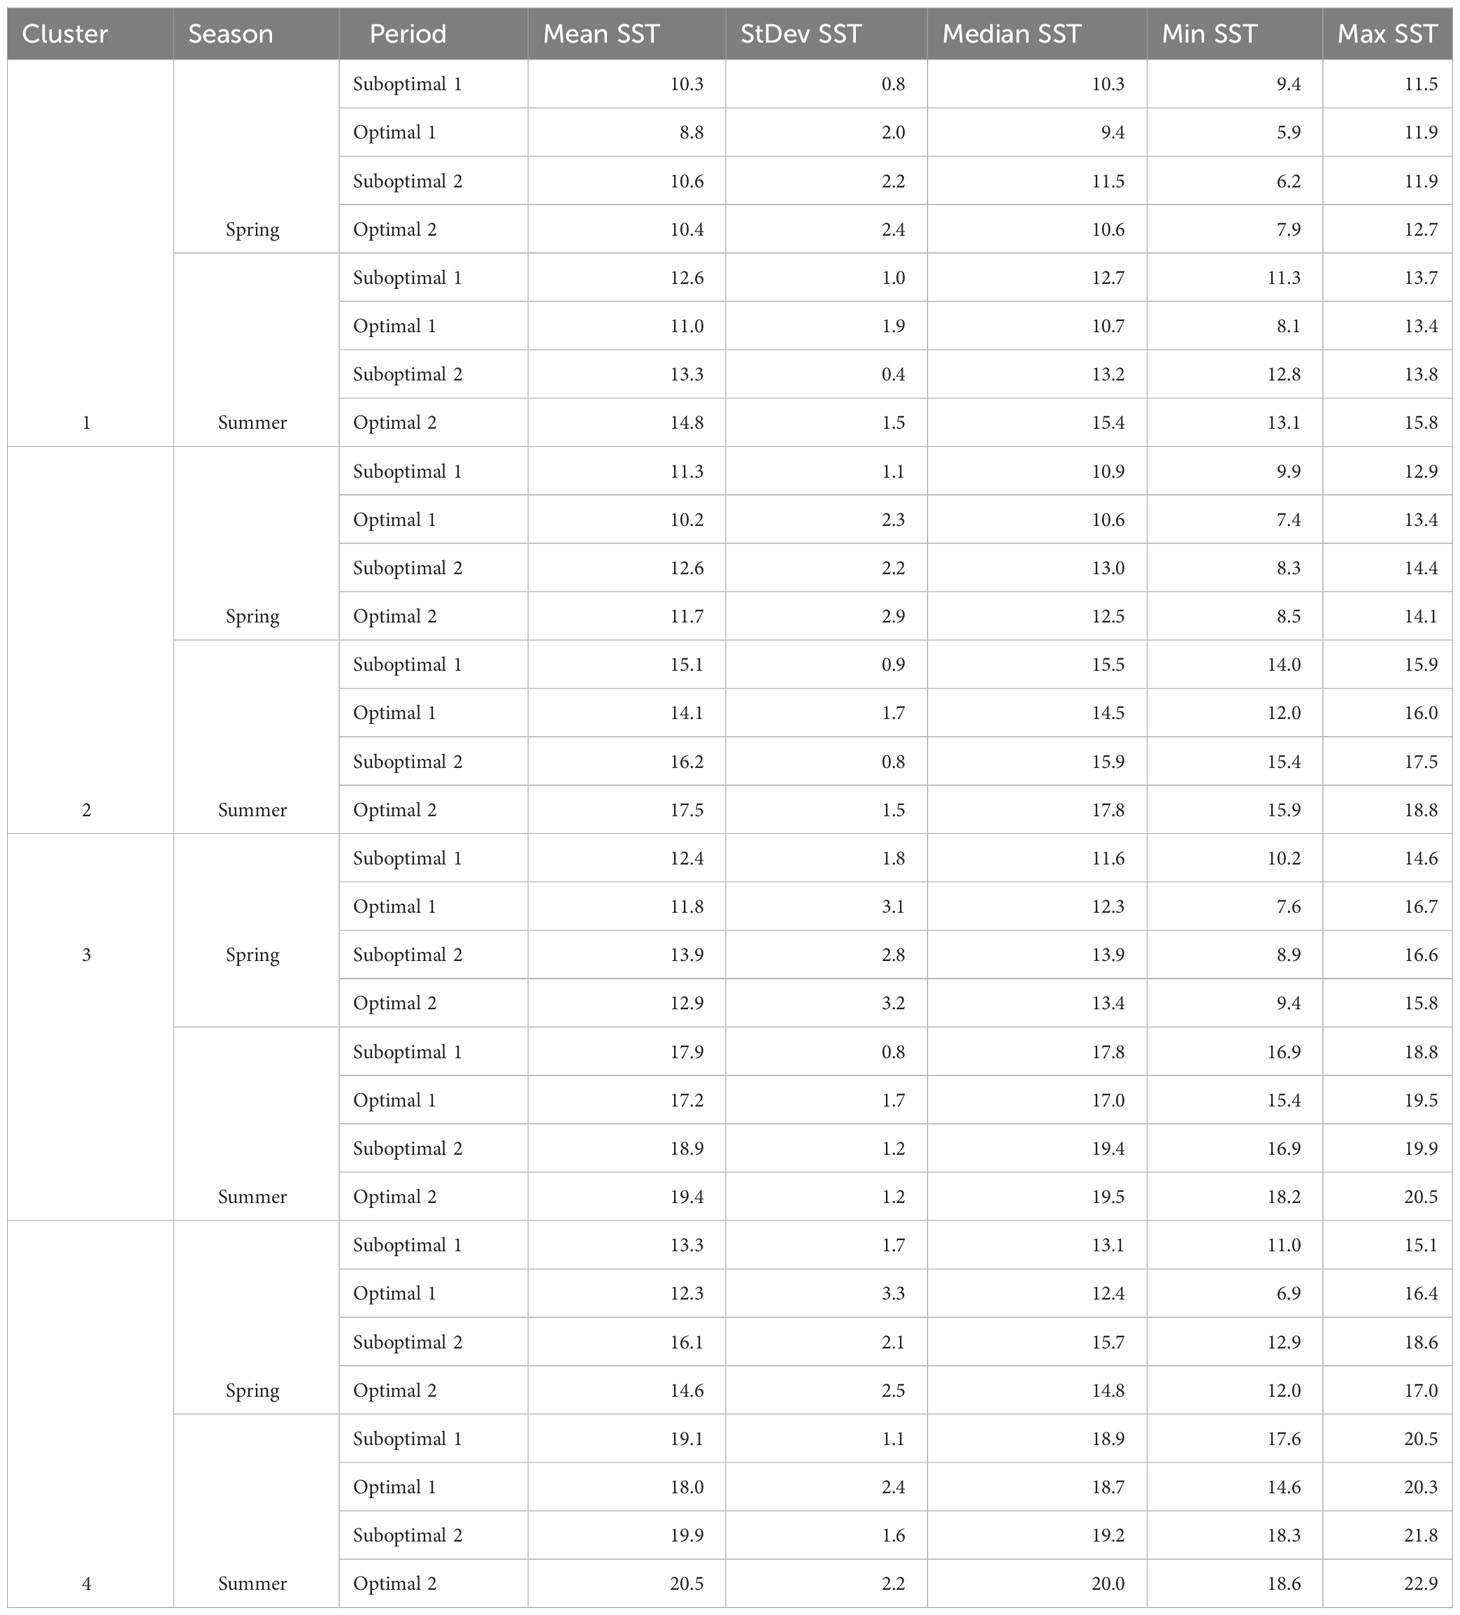
Table 2 Spring and summer Landsat-derived SST (°C), Mean, StDev, Median, Min, and Max temperatures per cluster and period (illustrated in Figures 4B, C).
3.2 Marine heatwaves
The number of MHWs from 2002 to 2022 was 41 in Departure Bay, 42 in Entrance Island, and 32 in Race Rocks, totaling 115 MHW for the three lighthouses (Figure 5A). The highest frequency of MHWs was observed during the positive ONI+PDO periods, with 38 events during Suboptimal 1 (2002–2006) and 58 in Suboptimal 2 (2014–2019, the Blob years). In contrast, negative ONI+PDO periods had fewer events (Optimal 1 of 2007–2013 had 11, and Optimal 2 of 2020–2022 had 8). In terms of intensity categories, 65 (57%) events were classified as Category I, 44 (38%) as Category II, 5 (4%) as Category III, and 1 (0.9%) as Category IV. The only Category IV heatwave occurred in Race Rocks, which lasted 22 days with a maximum temperature of 12.7°C (2.8°C above the normal record) on 24 October 2014. The longest heatwave of the period was observed in Departure Bay, which lasted 39 days with a maximum temperature of 11.1°C, which was 4.2°C above the average record for the winter on 24 January 2015 (Supplementary Tables S6–S12).
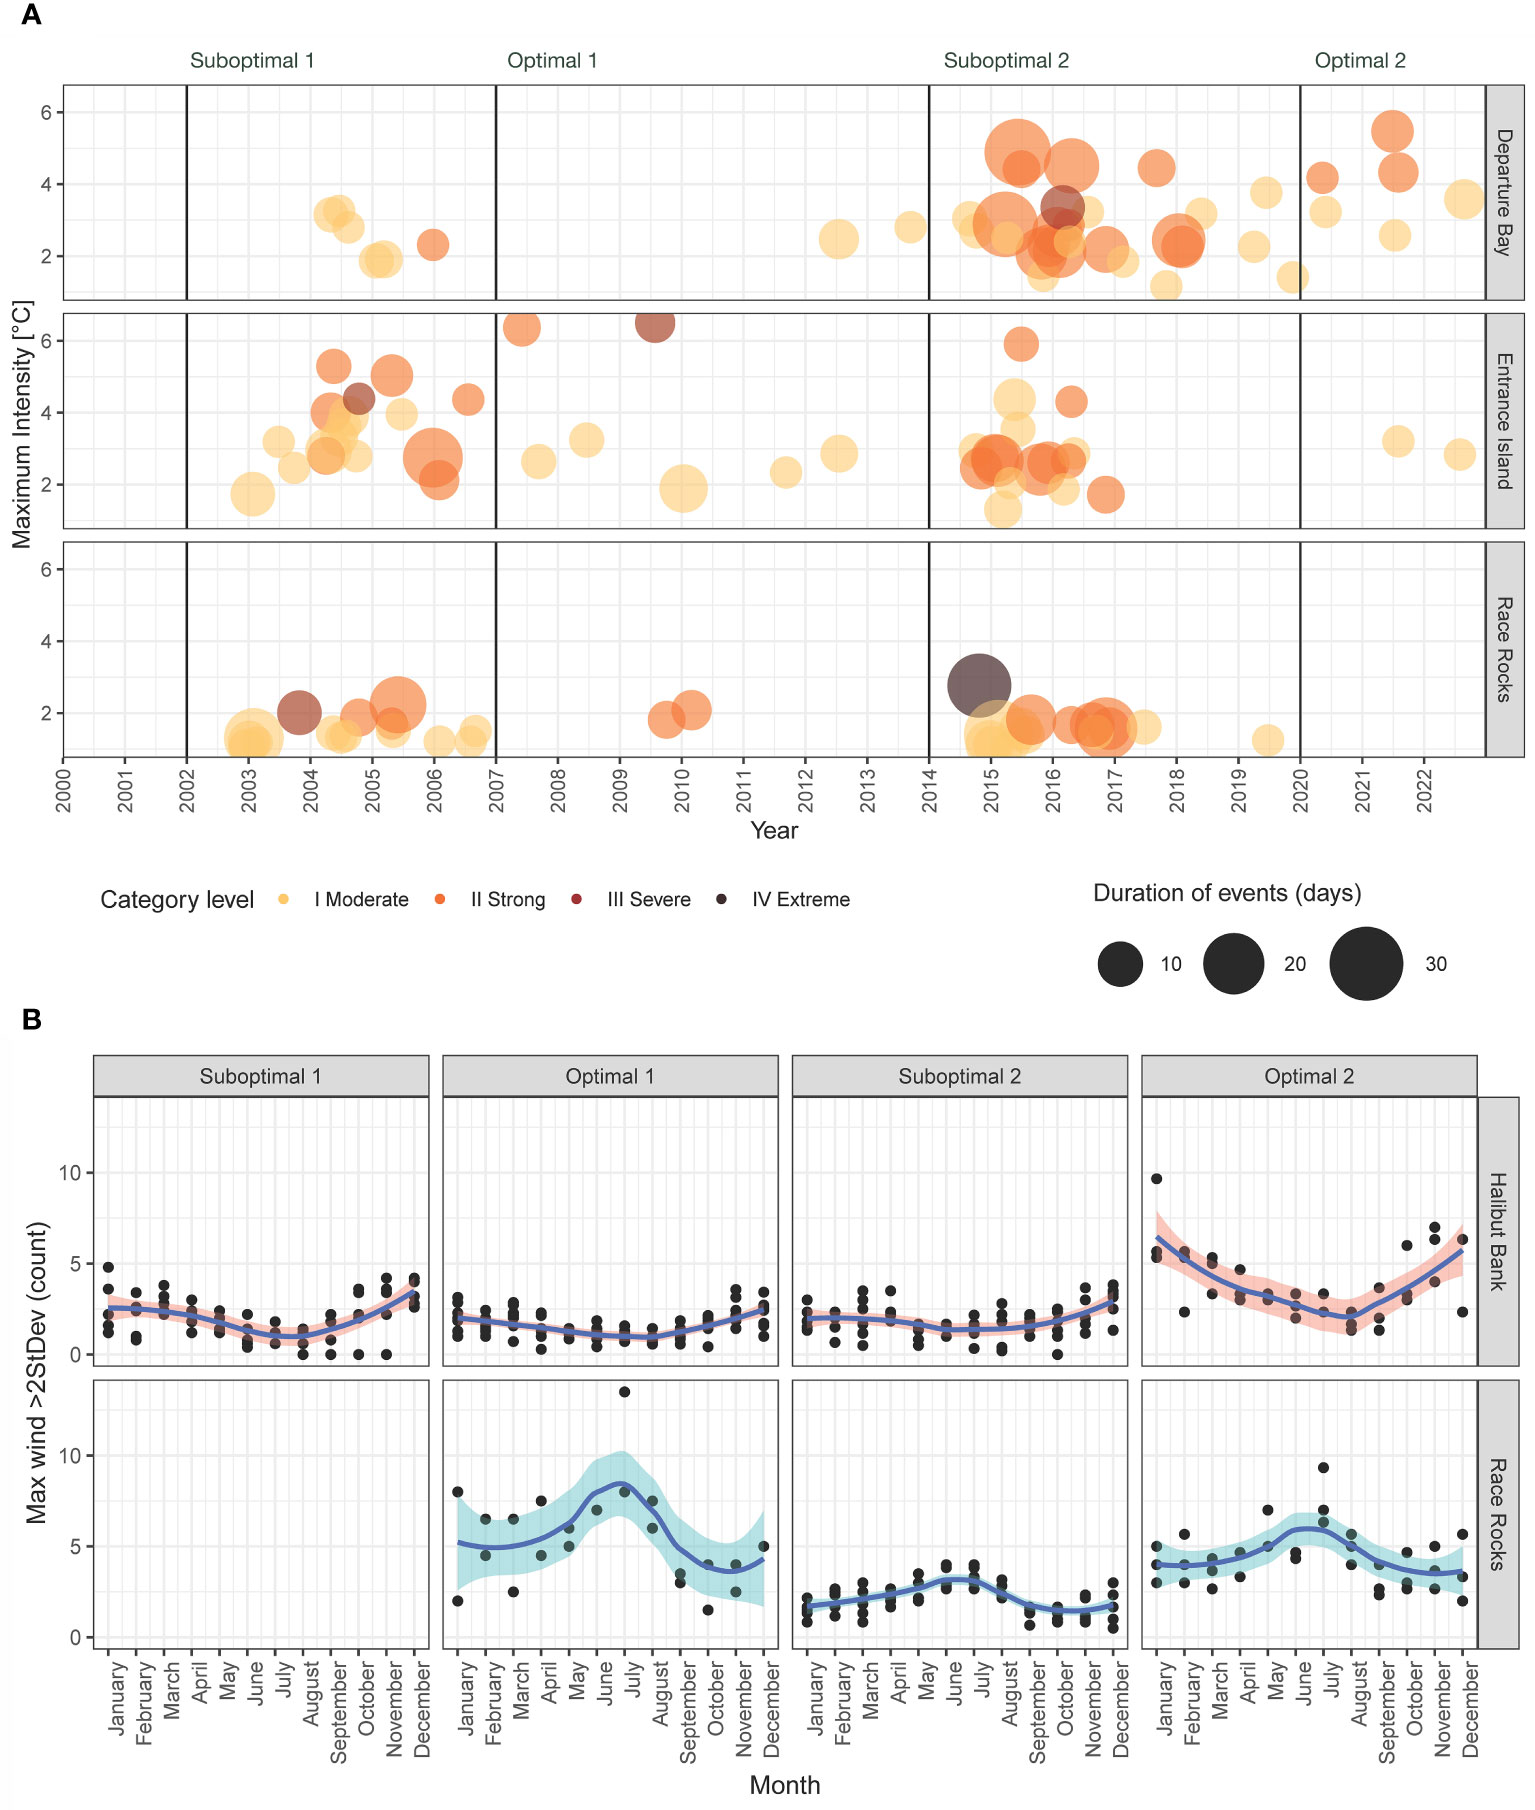
Figure 5 (A) Marine heatwaves per date and period; the color indicates the category level and the size indicates the duration of days per event. (B) Frequency of extreme maximum wind speed per month (maximum wind speed >95th percentile) by periods. Race Rocks data started in 2012. The names of the stations (Departure Bay, Entrance Island, Halibut Bank, Race Rocks) and buoy (Halibut Bank) are at the right of each plot.
3.3 Wind speed and direction
The predominant wind direction for the study area is from the offshore Pacific, entering the Salish Sea in the Strait of Juan de Fuca from the west (Race Rocks) and then splitting directions and losing energy in the central Strait of Georgia, where the Halibut Bank sensor is located (Figure 1; Supplementary Figure S4) (Thomson, 1981). Mean speed was higher at Race Rocks (25.8 km/h; moderate breeze), whereas lighter wind was predominant in Halibut Bank, with an average of 4.9 km/h (light air). The 95th percentile of the maximum wind speed was 47.8 km/h (strong breeze) at Race Rocks and 8.8 km/h at Halibut Bank (light breeze), with a clear seasonal divergence: Halibut Bank showed a higher intensity of maximum wind speed in autumn and winter (October to February), whereas Race Rocks extreme wind events predominated in spring and summer months (May to July). Optimal periods had higher frequencies of extreme winds compared to the previous suboptimal periods. In particular, there was a significant increase of extreme winds during Optimal 2 (2020–2022) compared to Suboptimal 2 (2014–2019). This difference was statistically significant (Dunn’s test = 8.3, adjusted p-value< 0.001) (Figure 5B; Supplementary Figure S5).
3.4 Temporal trends of floating kelp in southern Vancouver Island and the Gulf Islands
3.4.1 Segments with kelp by cluster (2005–2022)
The spatial range of the segments with mapped kelp data is in Figure 3B. Cluster 1—the most exposed and coldest area—had the highest temporal and spatial coverage, with 16 years of data covering 204 segments (78.5% of 260 segments), followed by Cluster 2, representing medium exposed and slightly warmer coasts, with 12 years and 241 segments (39.5% of 610 segments). Cluster 3, the exposed coast facing the Strait of Georgia, covered 11 years of data, with 31 segments (33.7% of 92 segments), and Cluster 4, gathering the most sheltered and warmest coasts, had 8 years (13 segments = 5.3% of 246 segments). The percentage of kelp cover exhibited non-parametric behavior, with left-skewed patterns in Clusters 2, 3, and 4 caused by documented absence of kelp (true negatives) throughout the time series, reflecting the remarkable temporal variability of kelp in sheltered and warmer coasts.
3.4.2 Kelp percentage cover by period
The percentage of kelp cover per period shows different trends per cluster (Figure 6). Cluster 1, with the coldest and most exposed areas, had an average of 20.0% kelp cover throughout Suboptimal 1 (2004–2006) and Optimal 1 (2007–2013). In the anomalously warmer years of 2014–2019 (Suboptimal 2) this average decreased to 14.6% and increased (18.8%) during the following period of Optimal 2 (2020–2022). Cluster 2, representing medium exposed and slightly warmer coasts, had a mean cover of 8.6% in Suboptimal 1, increased slightly in Optimal 1 (9.4%), then decreased in Suboptimal 2 (9.1%) and finally had an apparent increase in Optimal 2 (16.9%). Cluster 3, exposed to the Strait of Georgia, had an average kelp cover of 4.7% in Suboptimal 1, peaked at 15.8% in Optimal 1, and then decreased to 8.0% in Suboptimal 2 and 6.7% in Optimal 2. In contrast, Cluster 4, representing the most protected and warmest coasts, continuously increased in kelp cover, starting at 2.8% in Suboptimal 1, increasing to 9.6% in Optimal 1, then 22.2% in Suboptimal 2 and 30.8% in Optimal 2.
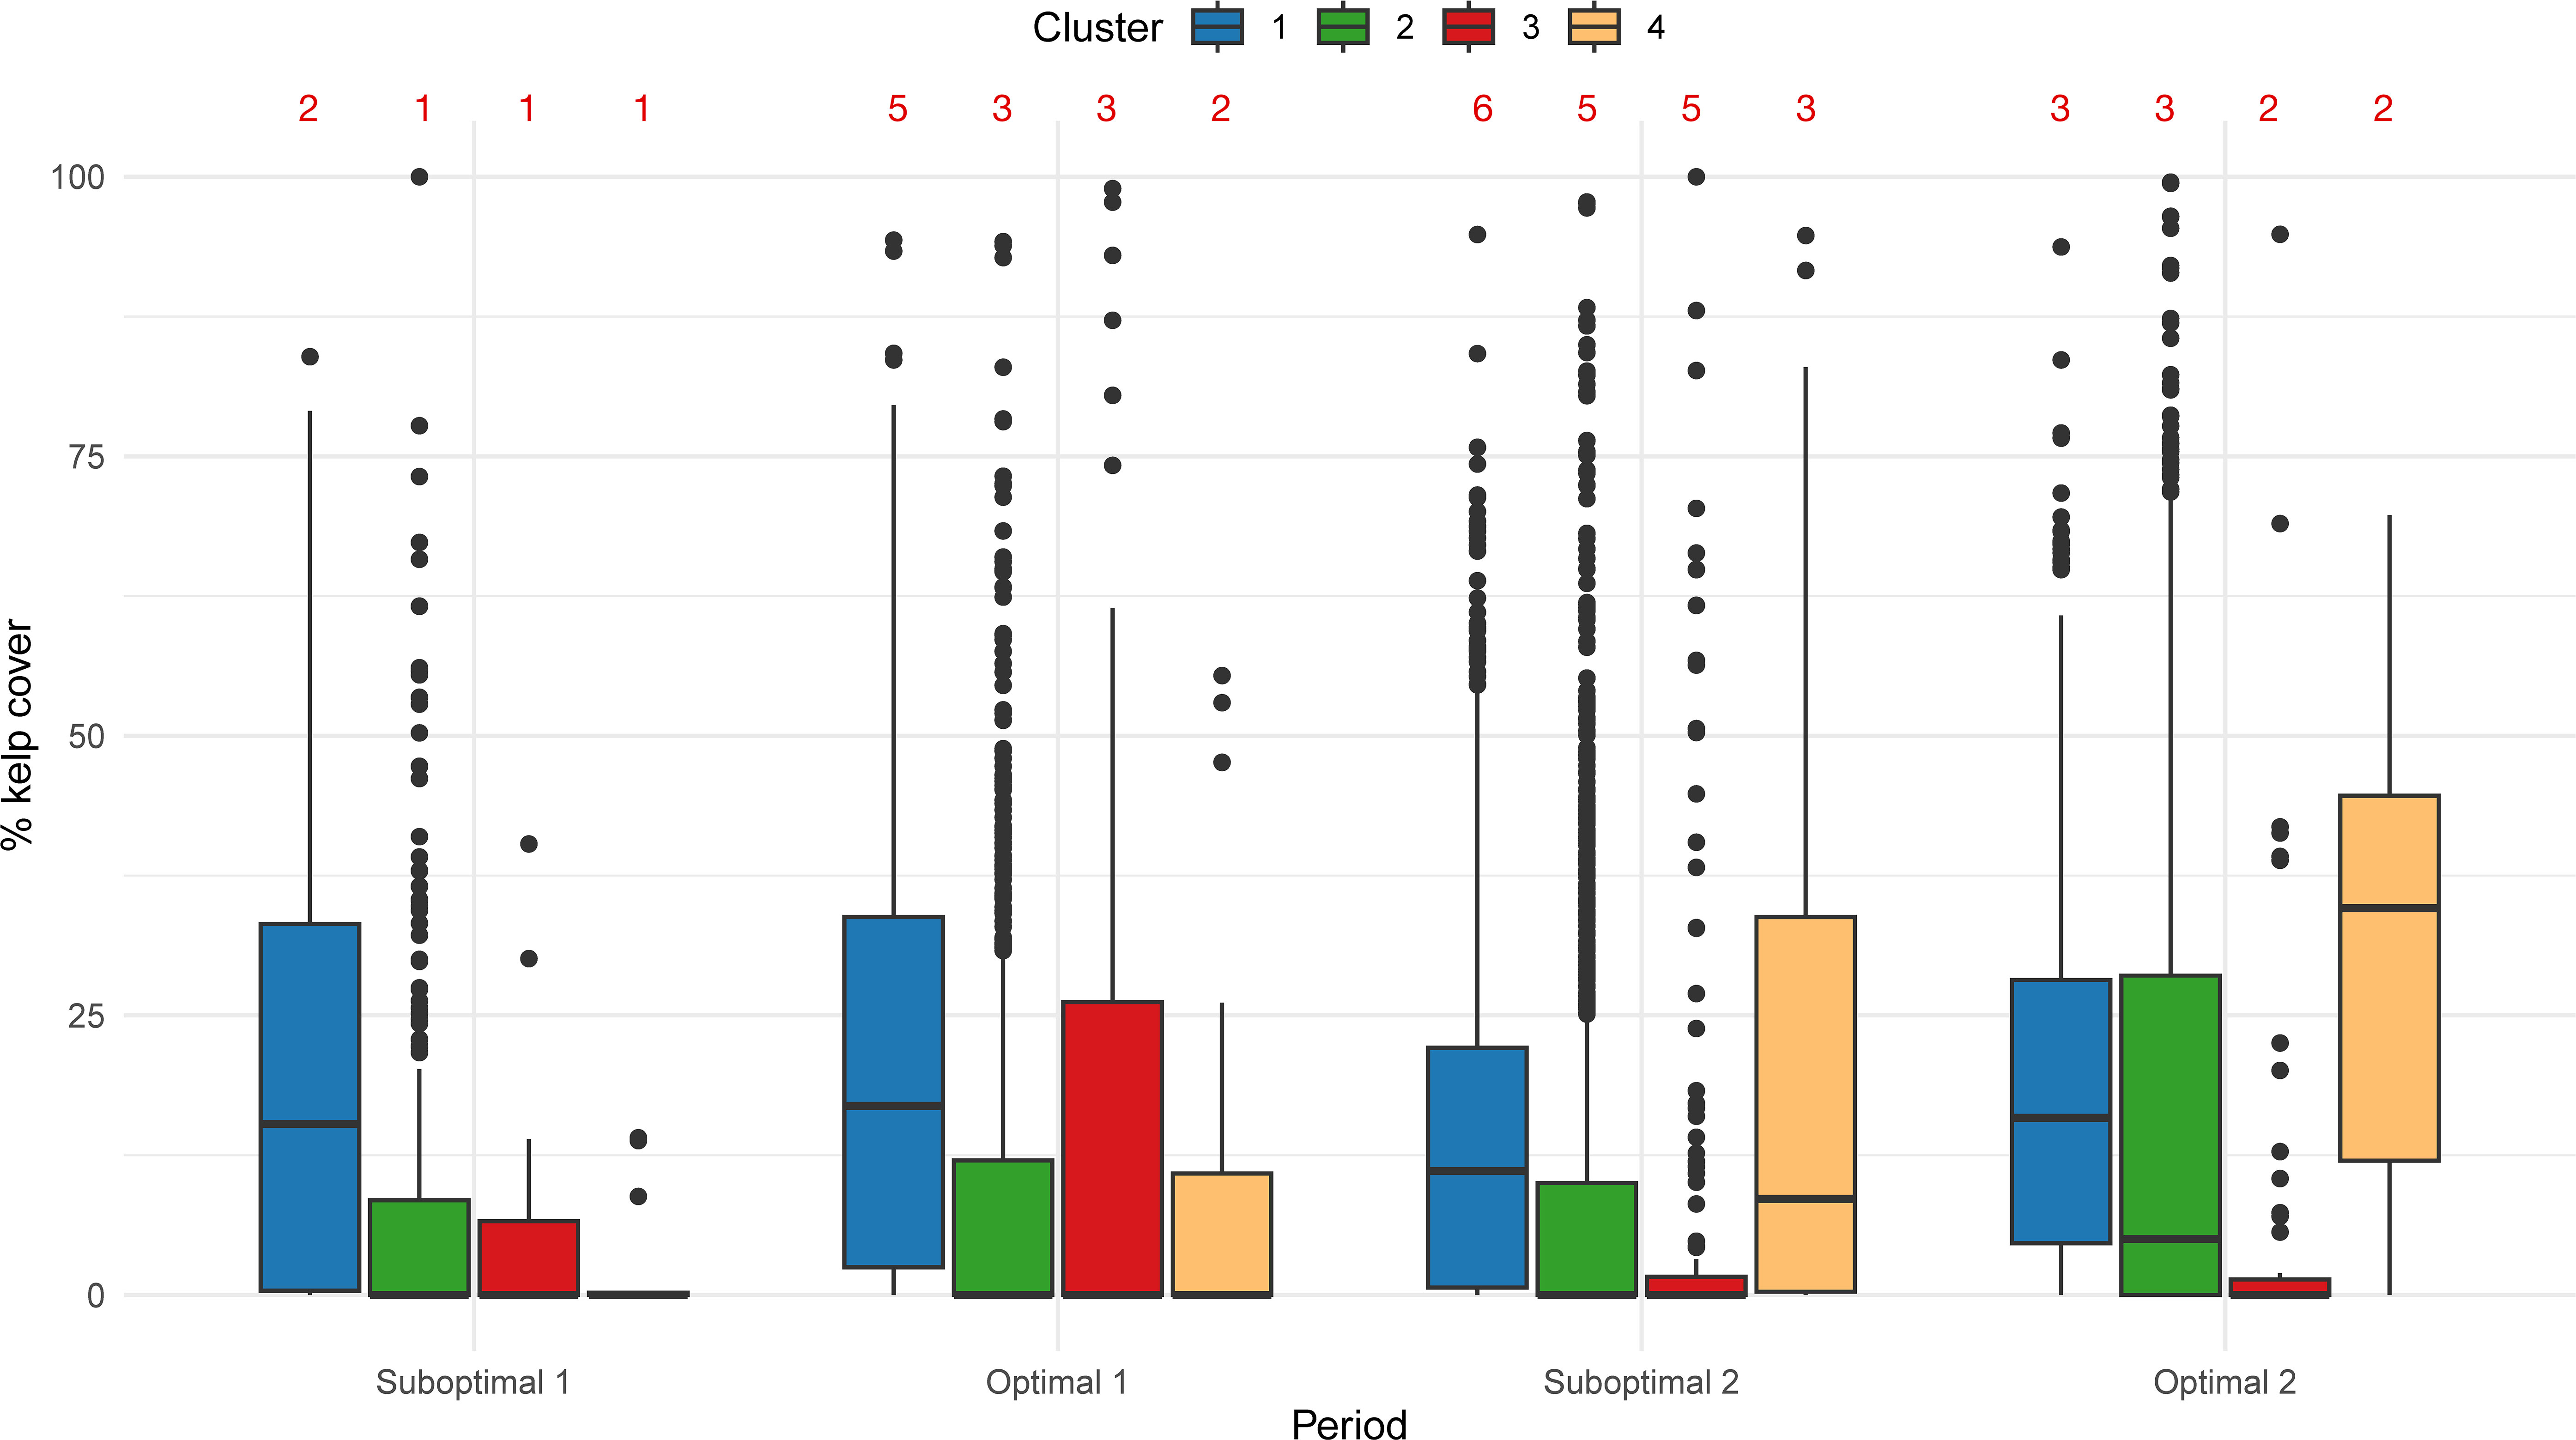
Figure 6 Box and whisker plots summarizing % kelp cover per segment and period by cluster. Red numbers indicate the number of years with data per period.
The number of segments with kelp presence also differed among clusters. Cluster 1 (coldest and exposed) had a constant presence of kelp in 80% of segments for all four periods. Cluster 2 (medium exposed and warmer) increased kelp presence from 37% to 61% of the segments; Cluster 3 (Strait of Georgia) fluctuated from 38% to 33%; and Cluster 4 (most protected and warmest) increased from 31% to 96% (Supplementary Figure S6).
3.4.3 Period 1972–2022 in the sentinel area
The sentinel site, locally known as Ella Beach, located within the colder and exposed coasts of Cluster 1 (Figure 1), is the largest floating kelp bed in the study area. The time series from 1972 to 2022 spanned 8 periods (Figure 7A): negative ONI+PDO period of 1972–1975 (Optimal), positive ONI+PDO years from 1976 to 1988 (Suboptimal), a new positive ONI+PDO cycle from 1989 to 1997 (Suboptimal), a negative ONI+PDO period from 1998 to 2001 (Optimal), and the four periods already defined from the 2005–2022 analysis.
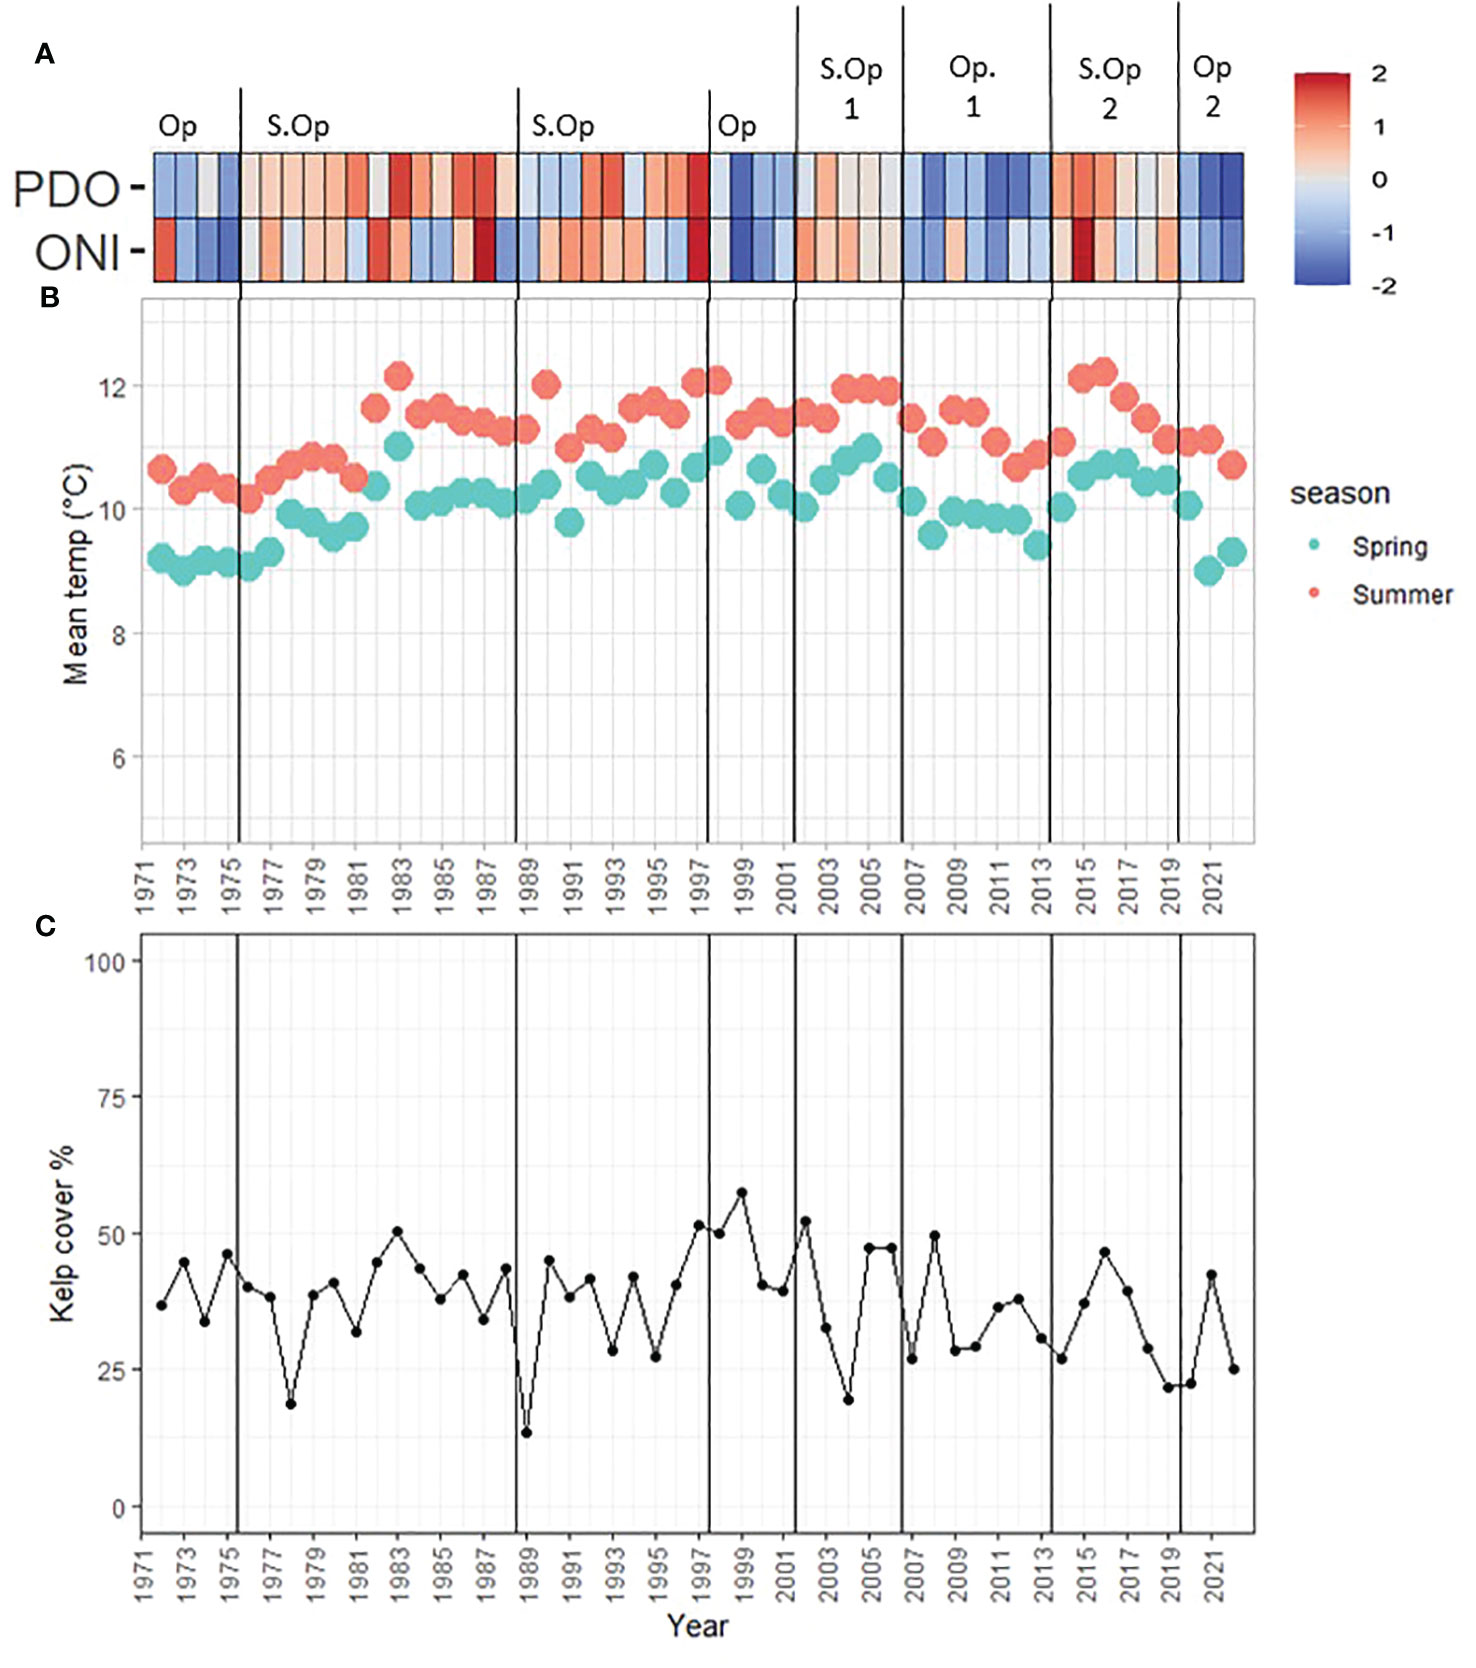
Figure 7 Sentinel site oceanic, temperature, and kelp trends (1972–2022). (A) Oceanic oscillations (z-scored): Red to blue color ramp follows positive to negative ONI, PDO, and NPGO values. Op= Optimal, S.Op = Suboptimal. (B) Race Rocks mean summer and spring SST. (C) Kelp cover percentage.
Kelp percentage cover fluctuated from a minimum of 13.6% (22.2 hectares) in 1989 (Suboptimal) and a maximum of 57.5% (94.3 hectares) of the kelp niche in 1999 (Optimal; Figures 7A, C). Despite this large variability, kelp was present over the entire series, and no significant trends were found either by period or year (Mann-Kendall’s tau = -0.14, p-value = 0.16). Local SST from the Race Rocks Lighthouse was particularly stable, with a mean of 10.0°C in spring (min = 8.9°C in 1973, max = 10.9°C in 1983) and a mean of 11.3°C in summer (min = 10.2°C in 1976, max = 12.2°C in 2016) (Figure 7B).
3.4.4 Resilience during and after the warm period of 2014–2019
Percentage cover of kelp showed different responses during the anomalous warm period (Suboptimal 2, 2014–2019; the Blob) compared to the reference bounds of the negative ONI+PDO period (Optimal 1, 2007–2013; Figure 8). The coldest and most exposed coasts (Cluster 1) showed small changes, with an overall mean (StDev) of -4.6% (16.6), a minimum observed value of -8.5% (14.4) in 2018, and a peak of 4.2% (19.2) in 2021 during the negative ONI+PDO period of 2020–2022 (Optimal 2). The average values of this cluster remained within the reference bounds (Figure 8A). Medium exposed and warmer coasts (Cluster 2) also remained within the reference bounds, showing a small negative difference compared to the reference in the years 2014, 2015, and 2016 during the Blob. The lowest average was -5.0% (12.7) in 2014, followed by a continuous increase in the following years up to an average of 11.7% (27.1) in 2022 (Figure 8B). The exposed coasts facing the Strait of Georgia (Cluster 3) had the lowest values compared to the reference (-8.1% (22.3)), ranging from minimum values of -15.8% (8.9) in 2016 during the Blob, and -15.7% (8.8) in 2020, to values of 1.8% (29.7) in 2014 and 2.2% (33.5) in 2017 (Figure 8C). The fragmented time series in the warmest and most protected coasts (Cluster 4) shows an average of 16.1% (28.4) for the complete time series, with a minimum value of -2.3% (12.8) in 2017 and a maximum of 30.6% (36.4) in 2019, compared to the reference bounds (Figure 8D).

Figure 8 Change over time in percentage of kelp cover relative to the period 2007–2013 for (A) Cluster 1, (B) Cluster 2, (C) Cluster 3, and (D) Cluster 4. The error bars show the mean and StDev of the difference with the reference value bounds (Optimal 1; 2007–2013) indicated as a mean and StDev (black horizontal line and grey area). The absence of bars indicates that there is no satellite image/no data available. The vertical line divides Suboptimal 2 from Optimal 2 periods.
4 Discussion
Globally, kelp is decreasing in area and presence due to a warming ocean. In the Northeast Pacific, Californian kelp forests have shown significant declines (McPherson et al., 2021; Bell et al., 2023; Cavanaugh et al., 2023); more locally, some Puget Sound kelp beds in Washington have been disappearing at an alarming rate (Berry et al., 2021). There is a lack of information about kelp change and resilience in British Columbia; most studies are spatially and temporally limited (Schroeder et al., 2020; Starko et al., 2022). We found that categorizing spatial and temporal dimensions offers hints on kelp resilience patterns (Pelletier et al., 2020).
Our results from southern Vancouver Island and the Gulf Islands suggest that global-scale oceanic conditions influence nearshore sea surface temperatures, marine heatwaves, and wind trends at the local level in the southern Salish Sea. Global-scale positive ONI+PDO, called Suboptimal periods in this paper, concentrated the highest peaks of spring SST, a higher frequency and intensity of MHWs, and a lower frequency of extreme winds than optimal periods. However, local summer SST has been constantly increasing despite any oceanic oscillation in the study area, confirming previous research in the ecoregion (Amos et al., 2014; Jackson et al., 2018). Bull kelp (Nereocystis luetkeana) showed different trends per cluster, confirming that kelp patterns can fluctuate greatly at the local scale (Reed et al., 2016; Bell et al., 2023).
The kelp dynamics in the coldest and most exposed coasts (Cluster 1), including the 50 years of the Ella Beach mapped data, align with Nereocystis persistence trends at the southern coast of the Strait of Juan de Fuca (Pfister et al., 2018). The stability of the floating kelp in this cluster was characterized by an average percent cover of around 20% of the kelp niche per segment (meaning that on average, mapped kelp covered 20% of the niche every year), kelp presence in 80% of the segments across the four periods, and high resilience after the anomalously warm period of 2014–2019 (Suboptimal 2; the Blob). Despite the high frequency of MHWs in suboptimal periods, favorable conditions such as high exposure to tidal currents and fetch, along with local temperatures under 16.0°C, sustained kelp forests in favorable conditions, in line with previous research on Laminariales (Buschmann et al., 2014; Supratya et al., 2020). Another factor, not covered in this research but giving support to this observation, is the relative stability of the community-wide ecosystem. At the south of the Strait of Juan de Fuca (in front of Cluster 1), kelp forests have maintained a relatively stable assemblage of invertebrates, fish, and kelp from 2015–2021 (Tolimieri et al., 2023).
Semi-sheltered and very sheltered coastlines (Clusters 2 and 4) have shown high variability in kelp cover and presence, similar to previous observations in enclosed areas of the Salish Sea (Pfister et al., 2018; Starko et al., 2019; Schroeder et al., 2020; Berry et al., 2021). It is important to mention that due to the limited availability of high-resolution satellite imagery, Cluster 4 had the smallest number of kelp areas and time series data available for the analysis, which may lead to erroneous short-scale interpretations. Nevertheless, summer Landsat SST averaged values above 16.0°C for Clusters 2 and 4 in the last two periods, reaching the upper limit of thermal tolerance for Nereocystis (Springer et al., 2010; Supratya et al., 2020). However, during the warm period of 2014–2019 (Suboptimal 2; the Blob) and the following years (2020–2022, Optimal 2) they showed an increase in kelp presence and percentage cover compared to the previous negative ONI+PDO reference period (Optimal 1; 2007–2013). The relatively lower frequency of MHWs during the Optimal 2 period could be favorable to kelp canopies, bringing a pause in stressors. The increased frequency of wind-driven wave motion during Optimal 2, during the spring and summer months when the canopies reach the surface, could also benefit bull kelp bed resilience (Springer et al., 2010). Both hypotheses might be tested with experimental and in-situ data.
Wind plays an important contribution to wave energy in the study area (Yang et al., 2019). Additionally, strong surface current anomalies have been observed in southern Vancouver Island during the autumn of 2015–2016 and 2016–2017 (Suboptimal 2; the Blob) and summer 2020 (Optimal 2) (Han and Chen, 2022), which can indicate that currents are a positive factor for floating kelp growth (Springer et al., 2010). However, if extreme wind events continue to increase in frequency due to climate change (Young et al., 2011), a possible negative effect could be that adult sporophyte fronds located in very exposed coasts may not be able to withstand hydrodynamic stress, shortening the maturity process, as was documented with other canopy-forming species (Van Tussenbroek, 1989).
The coasts facing the Strait of Georgia (Cluster 3) showed temperatures reaching the upper thermal range of kelp during the last Suboptimal and Optimal periods. However, kelp cover showed different resilience patterns compared to Clusters 2 and 4, expressed by less kelp presence, lower percentage cover values, and low to moderate resilience. Post-Blob, during the 2020–2022 period (Optimal 2), Cluster 3 returned to the previous reference value, but did not surpass it. This coastline is leeward of the southwestern wind, and the increase in frequency of extreme winds in the Strait of Georgia during Optimal 2 occurred in the autumn and winter months, times when kelp remain under the sea surface. Therefore, we infer that wind did not necessarily play a role in kelp resilience in this coastline. However, a factor that could explain its moderate resilience to the overall warming in the Salish Sea is the nutrient availability from the Fraser River (Lowe et al., 2016; Peña et al., 2016) that could potentially enhance the thermal plasticity of kelp, as nitrate-replete blades show enhanced photosynthesis and growth performance at temperatures at the higher thermal limit than nitrate-depleted ones (Fernández et al., 2020). More experimental and in-situ data could test this hypothesis, although the warming trend reaching stressing levels for kelp in the Strait of Georgia seems to be an immediate threat to these kelp beds in the near future.
5 Conclusions
This paper examined the resilience of Nereocystis floating canopies across a geographical gradient and different temporal scales in the southern Salish Sea in British Columbia, Canada. The main outcomes of this research are: first, global-scale suboptimal periods for kelp, understood as positive ONI+PDO, coincide with MHWs in the southern Salish Sea, but the overall SSTs increased despite the last negative ONI+PDO period; second, the negative ONI+PDO period of 2020–2022 coincide with a higher frequency of extreme winds compared to the previous period, which could potentially play a positive role in kelp frond productivity by wave motion; and third, despite the overall warming trend and the Blob years of 2014–2019, kelp in this area was generally resilient, but for varying reasons. The coldest and most exposed coasts remained under conditions of thermal stress for kelp growth; protected coasts facing the southwestern wind were potentially favored by an increased frequency of extreme wind during the kelp growing season; while the coast facing the Strait of Georgia showed only moderate resilience, such that if temperatures continue to increase, those areas could face an imminent threat to survival.
Our results complement previous kelp research from the northeastern Pacific, showing how local geographical conditions can play an important role in kelp dynamics. In a broader context, using this framework in other regions could help understand local ecological factors for kelp. As climate models indicate that MHWs will become more frequent and intense in the 21st century (Oliver et al., 2019), this research provides valuable information to support strategic spatial planning to identify kelp change patterns for a variety of uses, including monitoring, conservation, and restoration activities.
Data availability statement
The raw data supporting the conclusions of this article will be made available on request to MC (maycira@uvic.ca), without undue reservation.
Author contributions
AM-S: Conceptualization, Data curation, Formal analysis, Investigation, Methodology, Validation, Visualization, Writing – original draft, Writing – review & editing. SS: Conceptualization, Data curation, Formal analysis, Investigation, Methodology, Software, Validation, Visualization, Writing – review & editing. LG: Conceptualization, Data curation, Formal analysis, Investigation, Methodology, Software, Validation, Writing – review & editing. AW: Investigation, Methodology, Validation, Writing – review & editing. GN: Data curation, Formal analysis, Investigation, Methodology, Software, Writing – review & editing. SR: Writing – review & editing. IP: Funding acquisition, Project administration, Resources, Writing – review & editing. ER: Funding acquisition, Resources, Writing – review & editing. JL: Funding acquisition, Resources, Writing – review & editing. KM: Funding acquisition, Resources, Writing – review & editing. PW: Funding acquisition, Resources, Writing – review & editing. MC: Conceptualization, Funding acquisition, Methodology, Project administration, Resources, Supervision, Writing – review & editing.
Funding
The author(s) declare financial support was received for the research, authorship, and/or publication of this article. Funds were available from the Pacific Salmon Foundation through a Mitacs Accelerate grant awarded to AM-S and technician salary to process digital images. Funds were also available from the Natural Sciences and Engineering Research Council of Canada Alliance grant awarded to MC (Ref. number: ALLRP 566735 - 21).
Acknowledgments
We thank the collaboration from local partners (Hakai Institute, MaPP, Mayne Island Conservancy, Parks Canada) at different stages of this project. The careful and thoughtful suggestions of the reviewers helped improve this manuscript. We also thank Alex Guyn for processing the majority of the Landsat SST images, and Erasmo Macaya (UdeC), Mauricio Palacios (WCS), Pol Capdevila (UB) and Marta Konik (UVIC) for their constructive feedback and advice. This work was supported by Fisheries and Oceans Canada and the Canadian Hydrographic Service to obtain the high-resolution satellite imagery, the Capital Regional District of Victoria for providing high-resolution aerial photos, and the Island Trust Conservancy for providing in-situ kelp observation for validation of classified kelp.
Conflict of interest
The authors declare that the research was conducted in the absence of any commercial or financial relationships that could be construed as a potential conflict of interest.
Publisher’s note
All claims expressed in this article are solely those of the authors and do not necessarily represent those of their affiliated organizations, or those of the publisher, the editors and the reviewers. Any product that may be evaluated in this article, or claim that may be made by its manufacturer, is not guaranteed or endorsed by the publisher.
Supplementary material
The Supplementary Material for this article can be found online at: https://www.frontiersin.org/articles/10.3389/fmars.2024.1323448/full#supplementary-material
References
Ames K. M. (1998). Economic prehistory of the northern British Columbia Coast. Arctic Anthropol. 35 (1), 68–87.
Amos C. L., Martino S., Sutherland T. F., Al Rashidi T. (2014). Sea surface temperature trends in the coastal zone of British Columbia, Canada. J. Coast. Res. 31 (2), 434–446. doi: 10.2112/JCOASTRES-D-14-00114.1
Amsler C. D., Neushul M. (1989). Diel periodicity of spore release from the kelp Nereocystis luetkeana (Mertens) Postels et Ruprecht. J. Exp. Mar. Biol. Ecol. 134 (2), 117–127. doi: 10.1016/0022-0981(90)90104-K
Arafeh-Dalmau N., Montaño-Moctezuma G., Martinez J. A., Beas-Luna R., Schoeman D. S., Torres-Moye G. (2019). Extreme marine heatwaves alter kelp forest community near its equatorward distribution limit. Front. Mar. Sci. 6 (JUL). doi: 10.3389/fmars.2019.00499
Bekkby T., Rinde E., Erikstad L., Bakkestuen V. (2009). Spatial predictive distribution modelling of the kelp species Laminaria hyperborea. ICES J. Mar. Sci. 66 (10), 2106–2115. doi: 10.1093/icesjms/fsp195
Bell T. W., Allen J. G., Cavanaugh K. C., Siegel D. A. (2020). Three decades of variability in California’s giant kelp forests from the Landsat satellites. Remote Sens. Environ. 238, 110811. doi: 10.1016/j.rse.2018.06.039
Bell T. W., Cavanaugh K. C., Reed D. C., Siegel D. A. (2015). Geographical variability in the controls of giant kelp biomass dynamics. J. Biogeogr. 42 (10), 2010–2021. doi: 10.1111/jbi.12550
Bell T. W., Cavanaugh K. C., Saccomanno V. R., Cavanaugh K. C., Houskeeper H. F., Eddy N., et al. (2023). Kelpwatch: A new visualization and analysis tool to explore kelp canopy dynamics reveals variable response to and recovery from marine heatwaves. PloS One 18 (3), e0271477. doi: 10.1371/journal.pone.0271477
Berry H. D., Mumford T. F., Christiaen B., Dowty P., Calloway M., Ferrier L., et al. (2021). Long-term changes in kelp forests in an inner basin of the Salish Sea. PloS One 16 (2), e0229703. doi: 10.1371/journal.pone.0229703
Bond N. A., Cronin M. F., Freeland H., Mantua N. (2015). Causes and impacts of the 2014 warm anomaly in the NE Pacific. Geophys. Res. Lett. 42 (9), 3414–3420. doi: 10.1002/2015GL063306
Britton-Simmons K., Eckman J. E., Duggins D. O. (2008). Effect of tidal currents and tidal stage on estimates of bed size in the kelp Nereocystis luetkeana. Mar. Ecol. Prog. Ser. 355, 95–105. doi: 10.3354/meps07209
Buschmann A. H., Pereda S. V., Varela D. A., Rodríguez-Maulén J., López A., González-Carvajal L., et al. (2014). Ecophysiological plasticity of annual populations of giant kelp (Macrocystis pyrifera) in a seasonally variable coastal environment in the Northern Patagonian inner seas of Southern Chile. J. Appl. Phycol. 26, 837–847. doi: 10.1007/s10811-013-0070-z
Cavanaugh K. C., Bell T., Costa M., Eddy N. E., Gendall L., Gleason M. G., et al. (2021). A Review of the opportunities and challenges for using remote sensing for management of surface-canopy forming kelps. Front. Mar. Sci. 8. doi: 10.3389/fmars.2021.753531
Cavanaugh K. C., Cavanaugh K. C., Pawlak C. C., Bell T. W., Saccomanno V. R. (2023). CubeSats show persistence of bull kelp refugia amidst a regional collapse in California. Remote Sens. Environ. 290, 113521. doi: 10.1016/j.rse.2023.113521
Cavanaugh K. C., Reed D. C., Bell T. W., Castorani M. C. N., Beas-Luna R. (2019). Spatial variability in the resistance and resilience of giant kelp in southern and Baja California to a multiyear heatwave. Front. Mar. Sci. 6, 413. doi: 10.3389/fmars.2019.00413
Cavanaugh K. C., Siegel D. A., Kinlan B. P., Reed D. C. (2010). Scaling giant kelp field measurements to regional scales using satellite observations. Mar. Ecol. Prog. Ser. 403, 13–27. doi: 10.3354/meps08467
Cavanaugh K. C., Siegel D. A., Reed D. C., Dennison P. E. (2011). Environmental controls of giant-kelp biomass in the Santa Barbara Channel, California. Mar. Ecol. Prog. Ser. 429, 1–17. doi: 10.3354/meps09141
Chen Z., Shi J., Liu Q., Chen H., Li C. (2021). A persistent and intense marine heatwave in the Northeast Pacific during 2019–2020. Geophys. Res. Lett. 48 (13), e2021GL093239. doi: 10.1029/2021GL093239
Davis N. N., Badger J., Hahmann A. N., Hansen B. O., Mortensen N. G., Kelly M., et al. (2023). The Global Wind Atlas: A high-resolution dataset of climatologies and associated web-based application. Bull. Am. Meteorol. Soc. 104 (8), E1507–E1525. doi: 10.1175/BAMS-D-21-0075.1
Dayton P. K. (1985). Ecology of kelp communities. Annu. Rev. Ecol. Syst. 16 (1), 215–245. doi: 10.1146/annurev.es.16.110185.001243
Dayton P. K., Currie V., Gerrodette T., Keller B. D., Rosenthal R., Tresca D. V. (1984). Patch dynamics and stability of some California kelp communities. Ecol. Monogr. 54 (3), 253–289. doi: 10.2307/1942498
Dayton P. K., Tegner M. J. (1984). Catastrophic storms, El Niño, and patch stability in a southern California kelp community. Science 224 (4646), 283–285. doi: 10.1126/science.224.4646.283
Dayton P. K., Tegner M. J., Edwards P. B., Riser K. L. (1999). Temporal and spatial scales of kelp demography: the role of oceanographic climate. Ecol. Monogr. 69 (2), 219–250. doi: 10.1890/0012-9615(1999)069[0219:TASSOK]2.0.CO;2
Di Lorenzo E., Mantua N. (2016). Multi-year persistence of the 2014/15 North Pacific marine heatwave. Nat. Climate Change 6 (11), 1042–1047. doi: 10.1038/nclimate3082
Dobkowski K. A., Flanagan K. D., Nordstrom J. R. (2019). Factors influencing recruitment and appearance of bull kelp, Nereocystis luetkeana (phylum Ochrophyta). J. Phycol. 55 (1), 236–244. doi: 10.1111/jpy.12814
Druehl L. D. (1970). The pattern of Laminariales distribution in the northeast Pacific. Phycologia 9 (3–4), 237–247. doi: 10.2216/i0031-8884-9-3-237.1
Dunn O. J. (1961). Multiple comparisons among means. J. Am. Stat. Assoc. 56 (293), 52–64. doi: 10.1080/01621459.1961.10482090
Erlandson J. M., Graham M. H., Bourque B. J., Corbett D., Estes J. A., Steneck R. S. (2007). The kelp highway hypothesis: marine ecology, the coastal migration theory, and the peopling of the Americas. J. Island Coast. Archaeol. 2 (2), 161–174. doi: 10.1080/15564890701628612
Fernández P. A., Gaitán-Espitia J. D., Leal P. P., Schmid M., Revill A. T., Hurd C. L. (2020). Nitrogen sufficiency enhances thermal tolerance in habitat-forming kelp: implications for acclimation under thermal stress. Sci. Rep. 10 (1), 1–12. doi: 10.1038/s41598-020-60104-4
Foreman M. G. G., Sutherland G., Cummins P. F. (2004). M2 tidal dissipation around Vancouver Island: an inverse approach. Continental Shelf Res. 24 (18), 2167–2185. doi: 10.1016/j.csr.2004.07.008
Gendall L., Schroeder S. B., Wills P., Hessing-Lewis M., Costa M. (2023). A Multi-satellite mapping framework for floating kelp forests. Remote Sens. 15 (5), 1276. doi: 10.3390/rs15051276
Giannini F., Hunt B. P. V., Jacoby D., Costa M. (2021). Performance of OLCI Sentinel-3A satellite in the Northeast Pacific coastal waters. Remote Sens. Environ. 256, 112317. doi: 10.1016/j.rse.2021.112317
Graham M. H., Harrold C., Lisin S., Light K., Watanabe J. M., Foster M. S. (1997). Population dynamics of giant kelp Macrocystis pyrifera along a wave exposure gradient. Mar. Ecol. Prog. Ser. 148, 269–279. doi: 10.3354/meps148269
Gregr E. J., Haggarty D. R., Davies S. C., Fields C., Lessard J. (2021). Comprehensive marine substrate classification applied to Canada’s Pacific shelf. PloS One 16 (10), e0259156. doi: 10.1371/journal.pone.0259156
Gregr E. J., Palacios D. M., Thompson A., Chan K. M. A. (2019). Why less complexity produces better forecasts: an independent data evaluation of kelp habitat models. Ecography 42 (3), 428–443. doi: 10.1111/ecog.03470
Grimm V., Wissel C. (1997). Babel, or the ecological stability discussions: an inventory and analysis of terminology and a guide for avoiding confusion. Oecologia 109, 323–334. doi: 10.1007/s004420050090
Hamilton S. L., Bell T. W., Watson J. R., Grorud-Colvert K. A., Menge B. A. (2020). Remote sensing: generation of long-term kelp bed data sets for evaluation of impacts of climatic variation. Ecology 101 (7), e03031. doi: 10.1002/ecy.3031
Han G., Chen N. (2022). Variability of longshore surface current on the shelf edge and continental slope off the west coast of Canada. Remote Sens. 14 (6). doi: 10.3390/rs14061407
Hartigan J. A., Wong M. A. (1979). Algorithm AS 136: A K-means clustering algorithm. J. R. Stat. Society. Ser. C (Applied Statistics) 28 (1), 100–108. doi: 10.2307/2346830
Hobday A. J., Alexander L. V., Perkins S. E., Smale D. A., Straub S. C., Oliver E. C. J., et al. (2016). A hierarchical approach to defining marine heatwaves. Prog. Oceanography 141, 227–238. doi: 10.1016/j.pocean.2015.12.014
Hobday A. J., Oliver E. C. J., Gupta A., Benthuysen J. A., Burrows M. T., Donat M. G., et al. (2018). Categorizing and naming marine heatwaves. Oceanography 31 (2), 162–173. doi: 10.5670/oceanog.2018.205
Hoffmann A. J., Santelices B. (1991). Banks of algal microscopic forms: hypotheses on their functioning and comparisons with seed banks. Mar. Ecol. Prog. Series. Oldendorf 79 (1), 185–194. doi: 10.3354/meps079185
Holling C. S. (1973). Resilience and stability of ecological systems. Annu. Rev. Ecol. Syst. 4 (1), 1–23. doi: 10.1146/annurev.es.04.110173.000245
Jackson J. M., Johnson G. C., Dosser H. V., Ross T. (2018). Warming from recent marine heatwave lingers in deep British Columbia fjord. Geophys. Res. Lett. 45 (18), 9757–9764. doi: 10.1029/2018GL078971
Jayathilake D. R. M., Costello M. J. (2020). A modelled global distribution of the kelp biome. Biol. Conserv. 252, 108815. doi: 10.1016/j.biocon.2020.108815
Jensen J. R., Estes J. E., Tinney L. (1980). Remote sensing techniques for kelp surveys. Photogrammetric Eng. Remote Sens. 46 (6), 743–755.
Krumhansl K. A., Okamoto D. K., Rassweiler A., Novak M., Bolton J. J., Cavanaugh K. C., et al. (2016). Global patterns of kelp forest change over the past half-century. Proc. Natl. Acad. Sci. 113 (48), 13785–13790. doi: 10.1073/pnas.1606102113
Kruskal W. H., Wallis W. A. (1952). Use of Ranks in one-criterion variance analysis. J. Am. Stat. Assoc. 47 (260), 583–621. doi: 10.1080/01621459.1952.10483441
Li M., Gargett A., Denman K. (2000). What determines seasonal and interannual variability of phytoplankton and zooplankton in strongly estuarine systems? Estuarine Coast. Shelf Sci. 50 (4), 467–488. doi: 10.1006/ecss.2000.0593
Lowe A. T., Roberts E. A., Galloway A. W. E. (2016). Improved marine-derived POM availability and increased pH related to freshwater influence in an inland sea. Limnol. Oceanogr. 61 (6), 2122–2138. doi: 10.1002/lno.10357
Mackas D. L., Harrison P. J. (1997). Nitrogenous nutrient sources and sinks in the Juan de Fuca Strait/Strait of Georgia/Puget Sound estuarine system: assessing the potential for eutrophication. Estuarine Coast. Shelf Sci. 44 (1), 1–21. doi: 10.1006/ecss.1996.0110
Marchese C., Hunt B. P. V., Giannini F., Ehrler M., Costa M. (2022). Bioregionalization of the coastal and open oceans of British Columbia and Southeast Alaska based on Sentinel-3A satellite-derived phytoplankton seasonality. Front. Mar. Sci. 9, 1859. doi: 10.3389/fmars.2022.968470
Maxell B. A., Miller K. A. (1996). Demographic studies of the annual kelps Nereocystis luetkeana and Costaria costata (Laminariales, Phaeophyta) in Puget Sound, Washington. Botanica Marina 39 (1-6), 479–490. doi: 10.1515/botm.1996.39.1-6.479
McPherson M. L., Finger D. J. I., Houskeeper H. F., Bell T. W., Carr M. H., Rogers-Bennett L., et al. (2021). Large-scale shift in the structure of a kelp forest ecosystem co-occurs with an epizootic and marine heatwave. Commun. Biol. 4 (1), 298. doi: 10.1038/s42003-021-01827-6
Mora-Soto A., Palacios M., Macaya E. C., Gómez I., Huovinen P., Pérez-Matus A., et al. (2020). A high-resolution global map of giant kelp (Macrocystis pyrifera) forests and intertidal green algae (Ulvophyceae) with Sentinel-2 imagery. Remote Sens. 12 (4), 694. doi: 10.3390/rs12040694
Nijland W., Reshitnyk L., Rubidge E. (2019). Satellite remote sensing of canopy-forming kelp on a complex coastline: A novel procedure using the Landsat image archive. Remote Sens. Environ. 220, 41–50. doi: 10.1016/j.rse.2018.10.032
NOAA (2023a) Cold and warm episodes by season. Available at: https://origin.cpc.ncep.noaa.gov/products/analysis_monitoring/ensostuff/ONI_v5.php (Accessed 05 May 2023).
NOAA (2023b) Pacific decadal oscillation. Available at: https://www.ncei.noaa.gov/access/monitoring/pdo/ (Accessed 05 May 2023).
Oliver E. C. J., Burrows M. T., Donat M. G., Sen Gupta A., Alexander L. V., Perkins-Kirkpatrick S. E., et al. (2019). Projected marine heatwaves in the 21st century and the potential for ecological impact. Front. Mar. Sci. 6, 734. doi: 10.3389/fmars.2019.00734
Paine R. T. (1994). Marine rocky shores and community ecology: an experimentalist’s perspective (Vol. 4) (Germany: Ecology Institute Oldendorf/Luhe).
PCIC (2023) BC station data-PCDS. Available at: https://services.pacificclimate.org/met-data-portal-pcds/app/ (Accessed 22 May 2023).
Pelletier M. C., Ebersole J., Mulvaney K., Rashleigh B., Gutierrez M. N., Chintala M., et al. (2020). Resilience of aquatic systems: review and management implications. Aquat. Sci. 82 (2), 1–25. doi: 10.1007/s00027-020-00717-z
Peña M. A., Masson D., Callendar W. (2016). Annual plankton dynamics in a coupled physical–biological model of the Strait of Georgia, British Columbia. Prog. Oceanography 146, 58–74. doi: 10.1016/j.pocean.2016.06.002
Pfister C. A., Berry H. D., Mumford T. (2018). The dynamics of kelp forests in the Northeast Pacific Ocean and the relationship with environmental drivers. J. Ecol. 106 (4), 1520–1533. doi: 10.1111/1365-2745.12908
R Core Team (2023). R: A language and environment for statistical computing (Vienna, Austria: R Foundation for Statistical Computing). Available at: https://www.R-project.org/.
Reed D., Washburn L., Rassweiler A., Miller R., Bell T., Harrer S. (2016). Extreme warming challenges sentinel status of kelp forests as indicators of climate change. Nat. Commun. 7 (1), 13757. doi: 10.1038/ncomms13757
Rogers-Bennett L., Catton C. A. (2019). Marine heat wave and multiple stressors tip bull kelp forest to sea urchin barrens. Sci. Rep. 9 (1), 15050. doi: 10.1038/s41598-019-51114-y
Rogers-Bennett L., Catton C. A. (2022). Cascading impacts of a climate-driven ecosystem transition intensifies population vulnerabilities and fishery collapse. Front. Climate 4, 908708. doi: 10.3389/fclim.2022.908708
Schlegel R. W., Smit A. J. (2018). heatwaveR: A central algorithm for the detection of heatwaves and cold-spells. J. Open Source Software 3 (27), 821. doi: 10.21105/joss.00821
Schroeder S. B., Boyer L., Juanes F., Costa M. (2020). Spatial and temporal persistence of nearshore kelp beds on the west coast of British Columbia, Canada using satellite remote sensing. Remote Sens. Ecol. Conserv. 6 (3), 327–343. doi: 10.1002/rse2.142
Schroeder S. B., Dupont C., Boyer L., Juanes F., Costa M. (2019). Passive remote sensing technology for mapping bull kelp (Nereocystis luetkeana): a review of techniques and regional case study. Global Ecol. Conserv. 19, e00683. doi: 10.1016/j.gecco.2019.e00683
Smale D. A. (2020). Impacts of ocean warming on kelp forest ecosystems. New Phytol. 225 (4), 1447–1454. doi: 10.1111/nph.16107
Smale D. A., Moore P. J. (2017). Variability in kelp forest structure along a latitudinal gradient in ocean temperature. J. Exp. Mar. Biol. Ecol. 486, 255–264. doi: 10.1016/j.jembe.2016.10.023
Soberón J., Nakamura M. (2009). Niches and distributional areas: concepts, methods, and assumptions. Proc. Natl. Acad. Sci. 106 (supplement_2), 19644–19650. doi: 10.1073/pnas.0901637106
Spalding M. D., Fox H. E., Allen G. R., Davidson N., Ferdaña Z. A., Finlayson M. A. X., et al. (2007). Marine ecoregions of the world: a bioregionalization of coastal and shelf areas. BioScience 57 (7), 573–583. doi: 10.1641/B570707
Springer Y. P., Hays C. G., Carr M. H., Mackey M. R. (2010). Toward ecosystem-based management of marine macroalgae—The bull kelp, Nereocystis luetkeana. Oceanography Mar. Biol. 48, 1.
Starko S., Bailey L. A., Creviston E., James K. A., Warren A., Brophy M. K., et al. (2019). Environmental heterogeneity mediates scale-dependent declines in kelp diversity on intertidal rocky shores. PloS One 14 (3), e0213191. doi: 10.1371/journal.pone.0213191
Starko S., Neufeld C. J., Gendall L., Timmer B., Campbell L., Yakimishyn J., et al. (2022). Microclimate predicts kelp forest extinction in the face of direct and indirect marine heatwave effects. Ecol. Appl. 32 (7), e2673. doi: 10.1002/eap.2673
Straub S. C., Wernberg T., Thomsen M. S., Moore P. J., Burrows M. T., Harvey B. P., et al. (2019). Resistance, extinction, and everything in between–The diverse responses of seaweeds to marine heatwaves. Front. Mar. Sci. 763. doi: 10.3389/fmars.2019.00763
Suchy K. D., Le Baron N., Hilborn A., Perry R. I., Costa M. (2019). Influence of environmental drivers on spatio-temporal dynamics of satellite-derived chlorophyll a in the Strait of Georgia. Prog. Oceanography 176, 102134. doi: 10.1016/j.pocean.2019.102134
Suchy K. D., Young K., Galbraith M., Perry R. I., Costa M. (2022). Match/mismatch between phytoplankton and crustacean zooplankton phenology in the Strait of Georgia, Canada. Front. Mar. Sci. 9, 759. doi: 10.3389/fmars.2022.832684
Supratya V. P., Coleman L. J. M., Martone P. T. (2020). Elevated temperature affects phenotypic plasticity in the bull kelp (Nereocystis luetkeana, Phaeophyceae). J. Phycol. 56 (6), 1534–1541. doi: 10.1111/jpy.13049
Tegner M. J., Dayton P. K. (1987). “El Niño effects on southern California kelp forest communities,” in Advances in ecological research, vol. 17. (Elsevier), 243–279.
Tegner M. J., Dayton P. K., Edwards P. B., Riser K. L. (1997). Large-scale, low-frequency oceanographic effects on kelp forest succession: a tale of two cohorts. Mar. Ecol. Prog. Ser. 146, 117–134. doi: 10.3354/meps146117
Thomson R. E. (1981). Oceanography of the british columbia coast. Can. Spec. Publ. Fish. Aquat. Sci. 50, 1–291.
Tolimieri N., Shelton A. O., Samhouri J. F., Harvey C. J., Feist B. E., Williams G. D., et al. (2023). Changes in kelp forest communities off Washington, USA, during and after the 2014–2016 marine heatwave and sea star wasting syndrome. Mar. Ecol. Prog. Ser. 703, 47–66. doi: 10.3354/meps14220
Trebilco R., Dulvy N. K., Stewart H., Salomon A. K. (2015). The role of habitat complexity in shaping the size structure of a temperate reef fish community. Mar. Ecol. Prog. Ser. 532, 197–211. doi: 10.3354/meps11330
Van Tussenbroek B. I. (1989). The life-span and survival of fronds of Macrocystis pyrifera (Laminariales, Phaeophyta) in the Falkland Islands. Br. Phycological J. 24 (2), 137–141. doi: 10.1080/00071618900650131
Wernberg T., Krumhansl K., Filbee-Dexter K., Pedersen M. F. (2019). “Status and trends for the world’s kelp forests,” in World seas: An environmental evaluation (Elsevier), 57–78.
Yang Z., García-Medina G., Wu W.-C., Wang T., Leung L. R., Castrucci L., et al. (2019). Modeling analysis of the swell and wind-sea climate in the Salish Sea. Estuarine Coast. Shelf Sci. 224, 289–300. doi: 10.1016/j.ecss.2019.04.043
Young M., Cavanaugh K., Bell T., Raimondi P., Edwards C. A., Drake P. T., et al. (2016). Environmental controls on spatial patterns in the long-term persistence of giant kelp in central California. Ecol. Monogr. 86 (1), 45–60. doi: 10.1890/15-0267.1
Young M. A., Critchell K., Miller A. D., Treml E. A., Sams M., Carvalho R., et al. (2023). Mapping the impacts of multiple stressors on the decline in kelps along the coast of Victoria, Australia. Diversity Distributions 29 (1), 199–220. doi: 10.1111/ddi.13654
Young I. R., Zieger S., Babanin A. V. (2011). Global trends in wind speed and wave height. Science 332 (6028), 451–455. doi: 10.1126/science.1197219
Keywords: Nereocystis luetkeana, bull kelp, Salish Sea, resilience, marine heatwaves, sea surface temperature, wind-wave motion
Citation: Mora-Soto A, Schroeder S, Gendall L, Wachmann A, Narayan GR, Read S, Pearsall I, Rubidge E, Lessard J, Martell K, Wills P and Costa M (2024) Kelp dynamics and environmental drivers in the southern Salish Sea, British Columbia, Canada. Front. Mar. Sci. 11:1323448. doi: 10.3389/fmars.2024.1323448
Received: 17 October 2023; Accepted: 08 January 2024;
Published: 30 January 2024.
Edited by:
Susana Carvalho, King Abdullah University of Science and Technology, Saudi ArabiaReviewed by:
Laura Castro De La Guardia, Norwegian Polar Institute, NorwayMegan Dethier, University of Washington, United States
Copyright © 2024 Mora-Soto, Schroeder, Gendall, Wachmann, Narayan, Read, Pearsall, Rubidge, Lessard, Martell, Wills and Costa. This is an open-access article distributed under the terms of the Creative Commons Attribution License (CC BY). The use, distribution or reproduction in other forums is permitted, provided the original author(s) and the copyright owner(s) are credited and that the original publication in this journal is cited, in accordance with accepted academic practice. No use, distribution or reproduction is permitted which does not comply with these terms.
*Correspondence: Alejandra Mora-Soto, YWxlbW9yYXNAdXZpYy5jYQ==