 Mitchell J. Rider1*
 Larisa Avens2
 Heather L. Haas3
 Joshua M. Hatch3
 Samir H. Patel4
 Christopher R. Sasso5
- 1Rosenstiel School of Marine, Atmospheric, and Earth Science, University of Miami, Miami, FL, United States
- 2Southeast Fisheries Science Center, National Oceanic & Atmospheric Administration (NOAA) Fisheries, Beaufort, NC, United States
- 3Northeast Fisheries Science Center, National Oceanic & Atmospheric Administration (NOAA) Fisheries, Woods Hole, MA, United States
- 4Coonamessett Farm Foundation, East Falmouth, MA, United States
- 5Southeast Fisheries Science Center, National Oceanic & Atmospheric Administration (NOAA) Fisheries, Miami, FL, United States
Leatherback sea turtles (Dermochelys coriacea) migrate along the east coast of the United States, traversing the South and Mid-Atlantic Bights (SAB and MAB) while traveling to and from well-known northern foraging areas off Southern New England (SNE) and Nova Scotia. However, there is limited information on leatherback movement behavior in these regions. To identify leatherback movement patterns, we fit hidden Markov models (HMMs) to satellite transmitter data from 52 leatherbacks tagged between 2017 and 2022 off the coasts of Massachusetts and North Carolina to estimate locations of area restricted searching (ARS) and transient behaviors. Depth-temperature profiles were then paired to locations associated with ARS behavior to understand the vertical use of the water column. We observed leatherbacks displaying ARS behavior in SNE as expected, but also in the MAB and SAB. The HMM results indicated that leatherbacks were primarily foraging in SNE between Nantucket and Long Island Sound and depth-temperature plots from ARS behavior on Nantucket Shoals implied turtles foraging throughout the entire water column. In the MAB, ARS behavior was concentrated between Cape Hatteras, North Carolina, and the mouth of Delaware Bay during the summer. Turtles were closely associated with a well-defined thermocline, but still appeared to dive to deeper cooler waters, which may be a sign of thermoregulatory behavior. There was evidence of foraging in the SAB along the coast as well as along the continental shelf edge. The ARS behavior we documented within the MAB and SAB is the first published empirical evidence that both areas may be important foraging grounds. Our results lay a path for future research to understand how leatherbacks use these areas and the potential anthropogenic threats encountered while moving through these regions.
1 Introduction
Understanding the movement ecology of migratory species is critical to identifying key components of their behavior that may overlap with anthropogenic activity (Lascelles et al., 2014). Pinpointing such overlap can be difficult, as migratory species occupy wide geographic ranges that encompass areas where in situ observation of an individual’s position or behavior is near impossible. This is especially true for migratory marine species, since they move across geographic and political boundaries (Lascelles et al., 2014). However, recent advancements in tracking technology have facilitated movement studies of marine species with pluriannual migration cycles that span entire ocean basins (Lennox et al., 2017). As tracking technology continues to develop with enhanced battery life, finer spatial resolution, and the ability to collect ancillary data (i.e., temperature, depth, etc.), we can begin answering more specific questions about a species’ migration and the anthropogenic threats encountered along the way (Hussey et al., 2015).
In the past two decades, extensive tracking efforts have enhanced our understanding of the migration cycle of leatherback sea turtles (Dermochelys coriacea; James et al., 2005a; James et al., 2005b; James et al., 2005c; Eckert, 2006; Evans et al., 2021). These turtles undertake extensive migrations that can span multiple years (Stewart et al., 2014), traveling from subtropical and tropical nesting beaches to temperate foraging areas where prey (gelatinous zooplankton) tend to concentrate (Eckert, 2006; Hays et al., 2006; Evans et al., 2021). Despite these tracking efforts, there are still knowledge gaps in certain regions, including the Northwest Atlantic Ocean, regarding the locations of important migratory corridors and foraging areas.
Methods using telemetry data to differentiate between migratory and foraging behavior have been improving. Early studies that tracked leatherbacks along the Northwest Atlantic inferred foraging and migratory behaviors through residency patterns (James et al., 2005b; Dodge et al., 2014). Recently, studies have been employing the use of state-space models to infer behavior based on speed and turning angles (e.g., Sasso et al., 2021). While these methods have proven useful in identifying areas of high use, identifying foraging behavior in leatherbacks can be difficult as they can forage while moving with directional persistence (Wallace et al., 2015). The ability to resolve foraging vs. migratory behavior using telemetry data for leatherback turtles would therefore require collecting additional data, such as dive metrics, along with advanced modeling techniques that can infer latent behavioral states from geolocations and diving information (McClintock and Michelot, 2018). While such approaches already exist and have been used to infer latent behaviors of loggerhead sea turtles (Caretta caretta; Chimienti et al., 2020), these methods have yet to be applied to leatherbacks, specifically those in the Northwest Atlantic.
Based on previously used methods involving residency and state-space models incorporating speed and turning angles, several potential foraging areas in the Northwest Atlantic have been suggested. Leatherbacks migrating from nesting beaches in the Caribbean Sea and the Southeastern United States displayed high residency and area-restricted searching behavior along the Gulf Stream (Chambault et al., 2017) and continental shelf (Dodge et al., 2014). Along the Gulf Stream, it was suggested that leatherbacks target ephemeral patches of prey (Hays et al., 2006), while turtles traveling along the continental shelf target specific areas with annual blooms of prey (James et al., 2005b). While foraging behavior along the Gulf Stream has only been inferred based on movement behavior, studies involving extensive survey efforts, multi-year tracking, and animal-borne surveillance give strong evidence that primary foraging areas along the shelf exist in Southern New England (SNE; Dodge et al., 2014; Dodge et al., 2018), and Nova Scotia (James et al., 2005a; James et al., 2005b; James et al., 2005c; Wallace et al., 2015). In addition to the known continental shelf foraging locations, existing tagging data hints at other potential foraging areas along the United States coastline. According to several studies, post-nesting leatherbacks from Florida were observed exhibiting high use of the South Atlantic Bight (SAB) and Mid-Atlantic Bight (MAB; Eckert et al., 2006; Turtle Expert Working Group (TEWG), 2007). These findings, combined with observations of leatherbacks tagged off Massachusetts and Nova Scotia occupying the SAB and MAB during the overwintering period (James et al., 2005a; James et al., 2005b; James et al., 2005c; Dodge et al., 2014), suggest that the SAB and MAB may serve as foraging areas for Northwest Atlantic leatherbacks. However, analyses of telemetry data elucidating specific movement behaviors (i.e., foraging and migrating) within each of these regions have not been conducted.
The purpose of this study is to integrate geolocation and dive data into behavior models to identify migratory corridors and potential foraging areas used by leatherbacks along the East Coast of the United States. We affixed satellite transmitters to leatherbacks off Massachusetts in the summer and North Carolina in the spring and compared subsequent diving and movement patterns. Tracking leatherbacks from a known foraging area off Massachusetts allowed us to observe their post-foraging migrations to determine secondary foraging areas and over-wintering areas along the continental shelf. Tracking turtles captured off North Carolina enabled us to assess diving and movement behavior along migratory routes and identify subsequent foraging areas. We used both multivariate hidden Markov models (HMMs) and depth-temperature profiles to identify whether track segments were associated with searching/foraging or transient behavior. We predicted that in addition to known foraging areas off SNE and Nova Scotia, both the SAB and MAB contain important corridors and foraging areas that are exploited by leatherbacks migrating annually along the continental shelf. Identifying key areas is critical to informing successful conservation management strategies considering the myriad of anthropogenic threats leatherbacks face across the Northwest Atlantic.
2 Methods
2.1 Ethics statement
All procedures and methods were reviewed and approved by the National Marine Fisheries Service’s Atlantic Institutional Animal Care and Use Committee (IACUC). NOAA Fisheries reviewed and approved the animal study. All work was conducted under ESA permits 21233 issued to the National Marine Fisheries Service Southeast Fisheries Science Center.
2.2 Tag deployments
Tagging took place between 2017 and 2022 in two locations along the east coast of the United States: Cape Cod, Massachusetts and Cape Lookout, North Carolina. The waters off Cape Cod correspond to a known foraging ground for leatherbacks migrating along the continental shelf in Southern New England (SNE; Dodge et al., 2014; Dodge et al., 2018). Tagging efforts took place between August and October and were concentrated along the eastern and southern boundary of Cape Cod Bay (2017-2019) and along Nantucket Shoals (2022; Supplementary Figure S1). Cape Lookout hosts several leatherback nests per year (Rabon et al., 2003), but primarily serves as a migratory “bottleneck” for turtles migrating to northern foraging grounds during the late spring. Tagging took place in May either within Cape Lookout Bight or off its western shore (Supplementary Figure S1).
Leatherback capture and tagging methods were based on those used by Sasso et al. (2021) and the National Marine Fisheries Service (NMSF) Southeast Fisheries Science Center (SEFSC) (2008). A spotter aircraft was used to locate turtles and direct a capture vessel to them. Using a 2-m breakaway hoop net, turtles were captured and promptly lifted onto a small inflatable craft for the workup which consisted of measurements and tagging. Both curved carapace length (CCL) along the ridge and width (CCW) were recorded, and the CCL measurement was used to classify turtles as adults (CCL >130 cm) or late-stage juveniles (<130 cm) (Avens et al., 2020). For all adults, we determined sex based on the tail length. If not already present, a metal flipper tag was inserted onto both rear flippers, and a passive integrated transponder (PIT) tag was inserted into the shoulder musculature. Last, a satellite transmitter (MK-10AF, Wildlife Computers, Redmond, WA, USA) was attached to the caudal peduncle via a monofilament tether (Sasso et al., 2021). Once measurements and tagging were complete, turtles were released back into the water. The whole workup for each individual took place within 30 minutes.
The satellite transmitters communicated both Argos- and Fastloc GPS-derived locations via the Argos satellite system. While there was no limit to the number of Argos locations transmitted per day, we programmed transmitters to relay four GPS locations per day. Fastloc GPS locations were subsequently determined using the Wildlife Computers’ DAP processor. Transmitters recorded dive information via pressure and temperature sensors with resolutions of ± 0.5 m and ± 0.05˚C, respectively. Within 6-hour intervals starting at 0:00 GMT, the proportion of time and the number of dives were recorded within preprogrammed depth bins (0, 2, 5, 10, 25, 50, 100, 200, 300, 400, 500, 750, 1000, and >1000 m). Similarly, the number of dives within preprogrammed duration bins (0.5, 1, 2, 3, 4, 5, 10, 15, 20, 25, 30, 35, 40, and >40 minutes) were also recorded. A dive was recorded if the turtle surpassed a depth of two meters for more than 30 seconds. Additionally, transmitters measured temperature and depth summary data henceforth referred to as ‘PAT-style Depth-Temperature Profiles’ (PDTs). The PDT summary data contained the minimum and maximum temperatures recorded at different depth intervals (8-m resolution) during each 6-hour interval. To conserve battery life, transmitters were duty-cycled to relay information every four days.
2.3 Migratory routes and connectivity
In order to examine migratory routes and connectivity, we filtered the location data and reconstructed the tracks. Argos location data were calculated using the Kalman Filter algorithm provided by the CLS-Argos service (Lopez et al., 2013), which provided location-specific error ellipse information for all Argos positions. Using error ellipse information can often provide a better accounting of location measurement error than the traditional location quality class (e.g., location quality class 3 estimated error radius of <250 m, etc.; McClintock et al., 2015). Fastloc GPS locations were assumed to be within approximately 50 m of a turtle’s true position as 95% of GPS locations are accurate to ± 55 m (Bryant, 2007). Following standard guidelines for tracking marine animals, GPS locations were kept and used for analysis only if they were detected by six or more satellites and had a residual error less than 30 m (Witt et al., 2010; Dujon et al., 2014).
Prior to reconstructing tracks, both Argos- and GPS-reported locations were filtered to exclude erroneous locations, including those on land or with a location class of Z (due to their lack of estimation error). Any locations that yielded travel rates above 5 km h-1 were also excluded (James et al., 2005c) using a speed filter from the R package argosfilter (Freitas et al., 2008). Additionally, data were filtered to exclude instances in which a transmitter prematurely detached from the turtle and continued to float and transmit. Premature detachment was assumed if the total time at depth deeper than two meters equaled and stayed equal to zero for the remainder of the deployment period. In those instances, all data leading up to the tag detachment were retained. The first 24 hours of each deployment were also excluded from analyses to reduce any potential change in movement behavior that resulted from the capture and tagging procedure.
Interpolating transmitter data becomes challenging when there are large gaps in data, which can be common with Argos positions. This is especially true when gaps last weeks to months, as a lack of data can lead to unlikely location predictions within those gaps (Vogel et al., 2021). Thus, gaps were defined if missing data persisted for more than 10 days. Missing data gaps required tracks to be split into sub-tracks, with those sub-tracks being analyzed separately. If a sub-track contained less than 15 locations, then it was removed prior to track reconstruction. We excluded sub-tracks with less than 10 days or 15 locations because they would not be sufficient to estimate positions or behavior. Remaining data were re-projected into an oblique Mercator projection centered at 35˚N and 75˚W corresponding to the East Coast of the United States (Hatch et al., 2022).
After prefiltering and splitting tracks, the remaining data were used to reconstruct the most likely path for each leatherback by employing a continuous-time correlated random walk (CTCRW) state-space model using the R package aniMotum (Jonsen et al., 2023). The CTCRW state-space model allowed us to account for the uncertainty of locations and irregular time series of the Argos and GPS positions (Jonsen et al., 2020) and has been successfully used to reconstruct paths of leatherbacks and other sea turtle species (Winton et al., 2018; Asada et al., 2021). Additionally, we predicted positions at regular intervals, checking each model for convergence, fit, and if assumptions were met (i.e., homoscedasticity of residuals, normality of residuals, and reduced autocorrelation). We used an interval of 12 hours as dive data were not available for every 6-hour time bin and using a longer interval did not provide enough resolution in step lengths and turning angles to properly parse out area-restricted and transient behavior. Since dive data were recorded within 6-hour time bins, we averaged the number of dives and dive duration across 12-hour time bins and joined those metrics to the locations predicted at 12-hour intervals.
2.4 Searching and transient behavior
To distinguish between different types of behavior along each leatherback’s track, we used hidden Markov models (HMMs). HMMs associate observed behavior data, in this case the location and dive data, with an underlying latent process that is interpreted as the animals’ unobserved behavior (e.g., foraging and migrating). HMMs have been used to distinguish underlying behaviors along the migration routes of sea turtle species such as loggerheads (Chimienti et al., 2020) and Kemp’s ridleys (Gredzens and Shaver, 2020).
We tested models with combinations of four different behavior states, alternative parameter distributions, and starting values using the R package momentuHMM (McClintock and Michelot, 2018). The state process was modeled as a function of four variables: step length (i.e., Euclidean distance between two successive locations), turning angles (i.e., angles between successive locations), number of dives performed (averaged over a 12-hour period), and the average dive duration. Step length was modeled with a Gamma distribution, turning angles with a wrapped Cauchy distribution, number of dives with a negative binomial distribution, and average dive duration with a Gamma distribution.
We tested two-, three-, and four-state models each consisting of different combinations of behavioral states corresponding to searching and transiting behaviors. For the two-state model, the states corresponded to area restricted searching (ARS) and transient behaviors. To ensure model convergence with biologically relevant results, we set initial parameters for each state to coincide with previous observations of leatherback movement behavior in the Northwest Atlantic. Off Nova Scotia, leatherbacks were observed to dive less frequently and for longer durations as they transitioned from foraging to migrating (James et al., 2005b). Initial parameters for ARS behavior were represented by shorter step lengths (~10 km per 6 hours), higher concentration of turns, frequent dives (~45 dives per 6 hours), and shorter dive durations (~8 minutes), while those of transient behavior were characterized by longer step lengths (~30 km per 6 hours), lower concentration of turns, less frequent dives (~15 dives per 6 hours), and long dive durations (~24 minutes). For the three-state model, we followed methods by Chimienti et al. (2020) and split ARS behavior into two separate states corresponding to dive frequency and duration: High intensity ARS (ARS-H) and low intensity ARS (ARS-L). ARS-H behavior was represented by more frequent dives (~57 dives per 6 hours) with shorter durations (~4 minutes), and ARS-L was represented by less frequent dives (~35 dives per 6 hours) with relatively longer durations (~9 minutes). Leatherbacks have been observed to exhibit different foraging behaviors based on prey availability in the water column. For example, turtles off SNE performed frequent dives for shorter durations as prey were distributed throughout the water column. In foraging areas where prey may be aggregating at specific depths, leatherbacks displayed longer square-shaped dives presumably feeding along a physical gradient (Okuyama et al., 2021). By classifying different types of ARS behavior, we hoped to account for the behavioral plasticity associated with foraging along their migratory cycle (Hays et al., 2006). For the four-state model, we included broad area searching (BAS) behavior that was classified as having similar directional persistence as transient behavior, while displaying intermediate dive frequency (~24 dives per 6 hours) and duration (~10 minutes). Similar searching behavior has been observed in leatherbacks traveling along the West Florida Shelf during the fall and winter (Sasso et al., 2021). We selected the most appropriate model based on both Bayesian information criterion (BIC) and how well the state dependent distributions were biologically interpretable (McClintock et al., 2020). We employed the use of BIC as it penalizes models with more parameters with consideration for the sample size (Neath and Cavanaugh, 2012). Goodness-of-fit of the preferred model was quantified using pseudo-residuals (Zucchini et al., 2017).
Finally, we used multiple imputations to account for the location error from the CTCRW state-space model using the MIfitHMM function in the momentuHMM package (McClintock, 2017; McClintock and Michelot, 2018). This method consists of repeatedly fitting the preferred HMM to 50 realizations of the position process drawn from the CTCRW state-space models and pooling the estimated parameters. Pooled estimates were plotted on a map by year to identify regions of dense area restricted behavior along the continental shelf. We also averaged the number of days spent within each behavioral state across SNE, Mid-Atlantic Bight (MAB), and Southern New England (SAB). These three regions were defined by the neritic zones along the continental shelf from the most eastern part of Nantucket Shoals to Hudson Canyon (i.e., SNE), Hudson Canyon to Cape Hatteras (i.e., MAB), and Cape Hatteras to Cape Canaveral (i.e., SAB; Supplementary Figure S1).
2.5 Searching behavior in relation to depth-temperature profiles
To gain insights into leatherback association with vertical water-column features (i.e., thermocline), we examined PDT data within specific regions of interest characterized by dense zones of ARS behavior. PDT data were filtered to match locations associated with both ARS behaviors then averaged across all individuals. Using the R package RchivalTag (Bauer, 2020), the average between the minimum and maximum recorded temperatures per 6-hour bins were calculated across all 8-m intervals, then linearly interpolated to generate continuous temperature profiles. Interpolated temperatures from the profiles were then used to estimate the depth of the thermocline (methods outlined in Bauer et al., 2015). Subsequently, the time-at-depth (TAD) data were used to compute the average depth of each leatherback turtle for every 6-hour bin. These values were then averaged across individuals within the specified areas of interest. The derived estimates of thermocline and average leatherback depths were superimposed onto the average PDTs by region and year.
3 Results
3.1 Tag deployments
Between 2017 and 2022, a total of 54 leatherbacks were captured and released with satellite transmitters off Cape Cod, Massachusetts (n = 26) and Cape Lookout, North Carolina (n = 30; Supplementary Table S2). Based on curved carapace and tail lengths, 38 turtles were considered adult females (MA: n = 15; NC: n = 23), 14 were considered adult males (MA: n = 9; NC: n = 5), and two were unidentifiable to sex and classified as sub-adults (NC: n = 2; Table 1). We successfully tracked 52 of these leatherbacks between 15 and 302 days (Mean ± SD = 159.1 ± 72.3 days) and the total track lengths were between 675 and 13,715 km (Mean ± SD = 6,003 ± 3,259 km; Table 1).
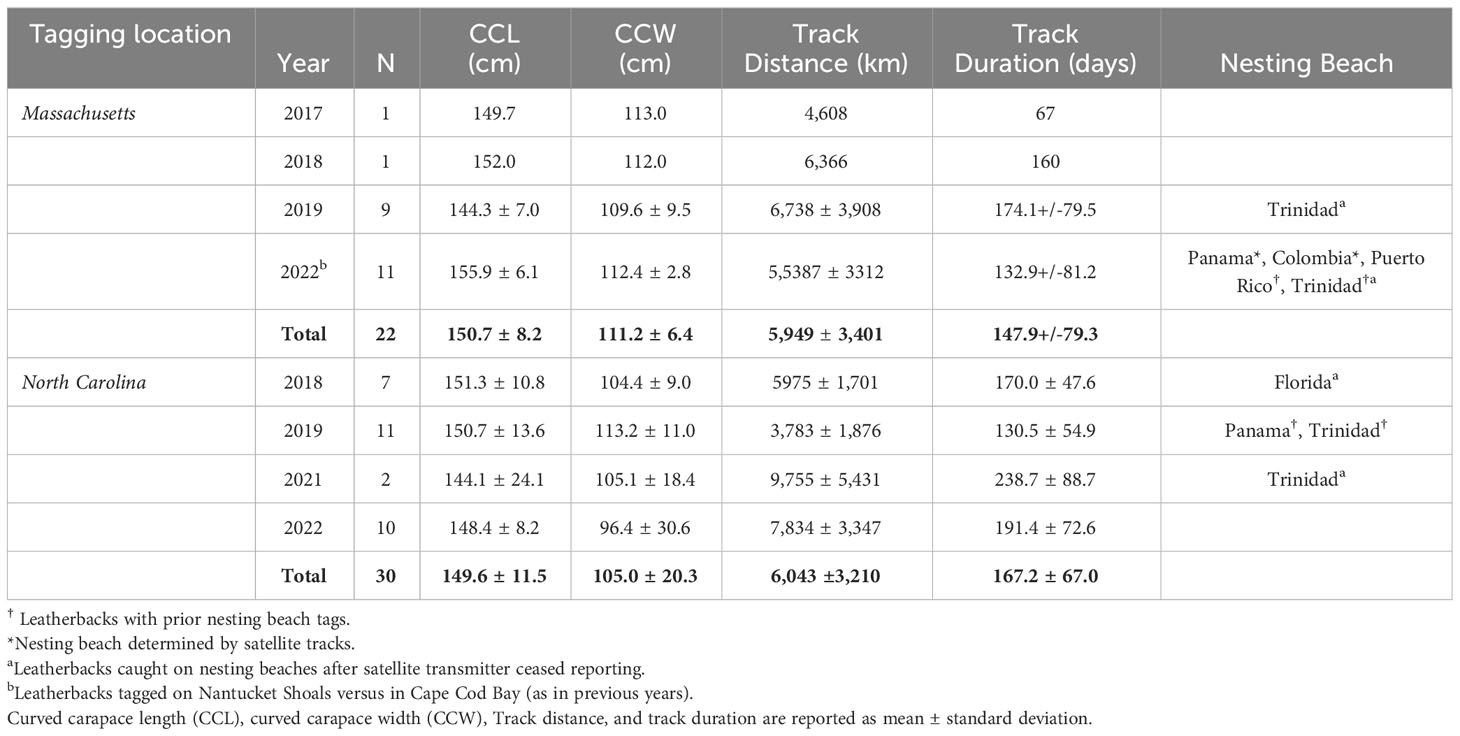
Table 1 Summary of tracking information for 52 leatherbacks equipped with Wildlife Computers MK-10AF satellite transmitters off Massachusetts and North Carolina between 2017-2022.
3.2 Migratory routes and connectivity
Leatherbacks tagged off Massachusetts and North Carolina displayed broadly similar movement patterns, as most individuals traveled to locations along the continental shelf before transitioning off the shelf and into deeper waters (Figure 1). Along the shelf, turtles from each tagging site spent time in the Mid-Atlantic Bight (MAB), Long Island Sound, Vineyard Sound, Nantucket Shoals, or Georges Bank (Figure 1). Some turtles tagged off North Carolina continued farther north along the continental shelf, spending time in the northern portion of the Gulf of Maine and along the southern coast of Nova Scotia. Most leatherbacks tagged off Massachusetts either moved directly south or followed the shelf towards the southern portion of the MAB, and few continued south towards Southern New England (SNE) or the South Atlantic Bight (SAB). Once in the Gulf Stream, leatherbacks from both groups traveled east for varying periods of time before diverging and migrating south towards Caribbean nesting beaches, the middle of the North Atlantic Ocean, or back to the SAB.
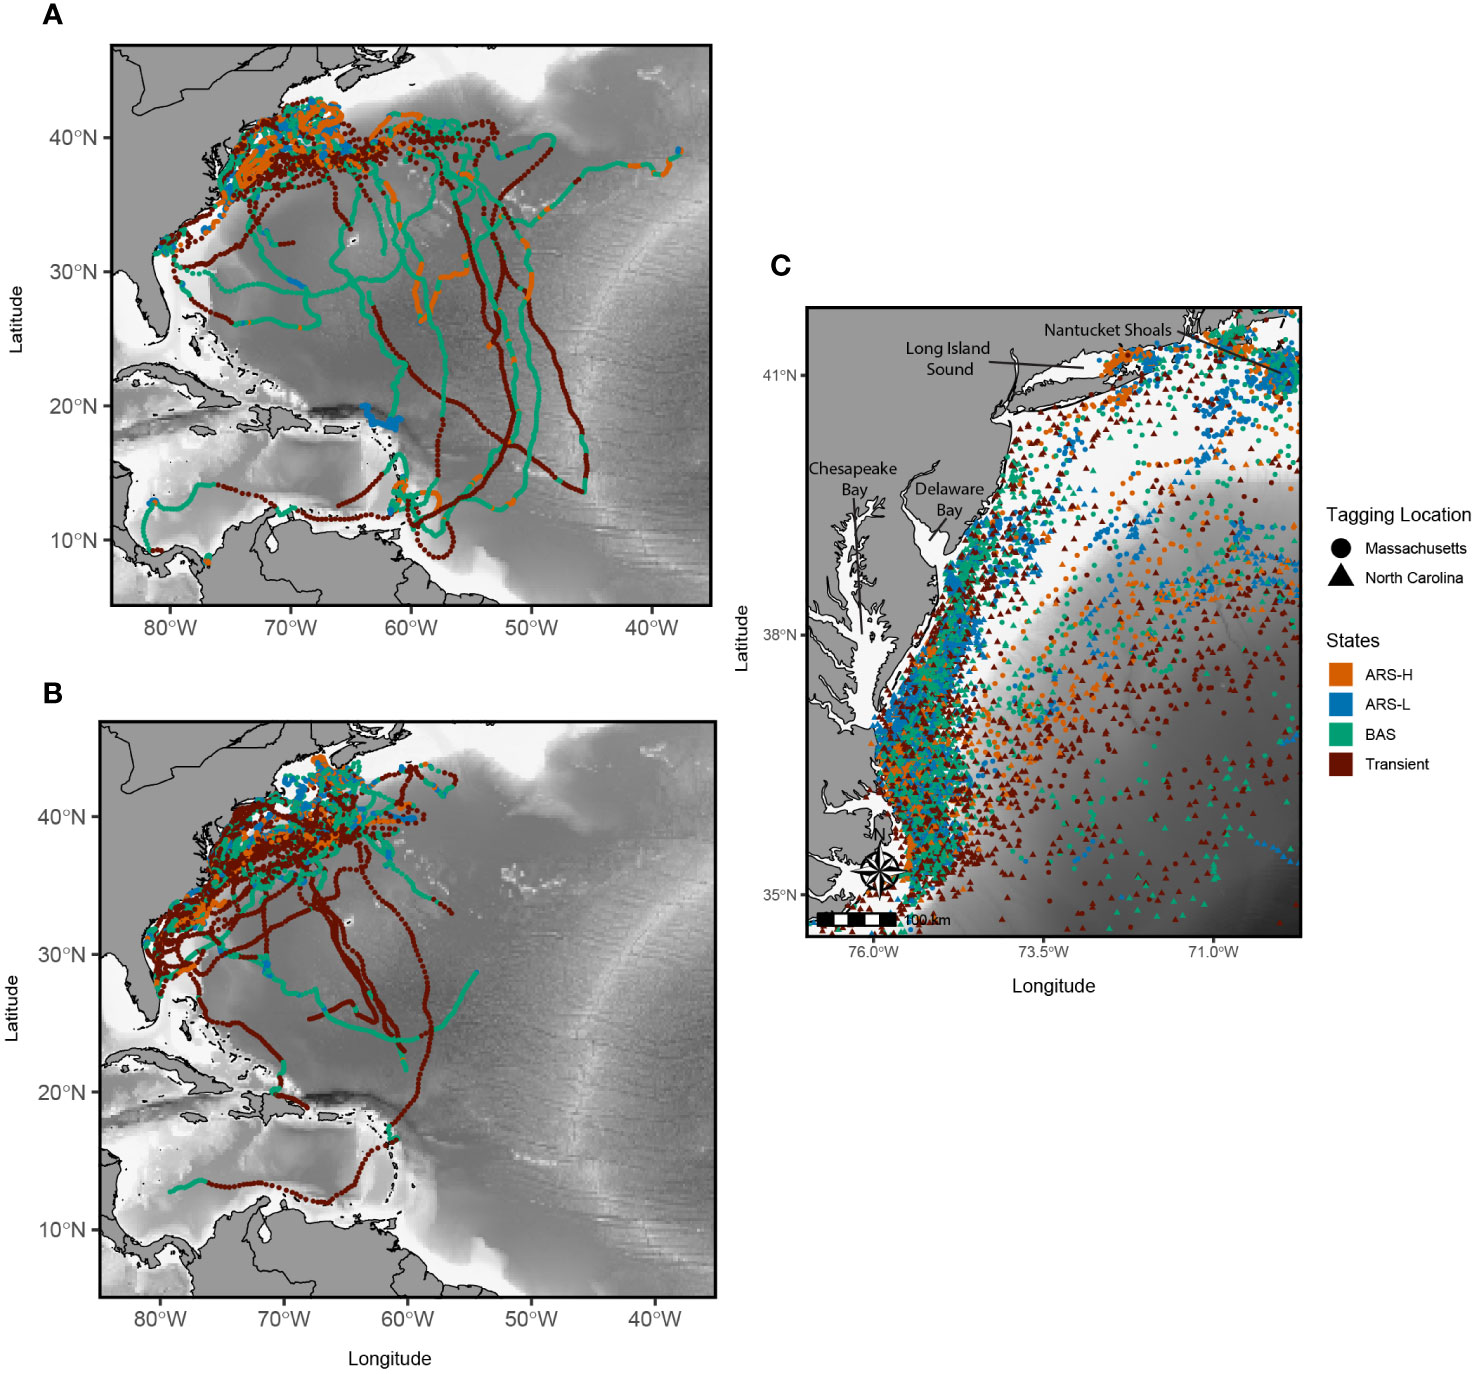
Figure 1 Reconstructed satellite tracks of leatherbacks tagged off Massachusetts in the summer (A) and North Carolina in the spring (B) between 2017 and 2022. Locations recorded along the Mid Atlantic Bight and Southern New England are in the black box in (A) and enlarged in (C) Colors correspond to the latent states predicted by the hidden Markov model: Area restricted search with high dive intensity (ARS-H), area restricted search with low dive intensity (ARS-L), broad area search (BAS), and transient.
Despite similarities in movement patterns between the leatherbacks tagged off Massachusetts and North Carolina, there were interannual variations. Leatherbacks tagged off North Carolina consistently used the MAB every year, but in 2019, none of the tagged turtles left the shelf waters. Instead, they predominantly traveled along the continental shelf towards the SNE or SAB regions (Supplementary Figure S3). Interestingly, in that same year, individuals tagged in both locations spent time in Long Island Sound, a behavior not observed in other years. Additionally, leatherbacks ventured into the northern part of the Gulf of Maine exclusively in 2022. In 2018 and 2021, they were observed along the southern coast of Nova Scotia. While turtles occupied Georges Bank in most years, it was more pronounced in 2022 for all leatherbacks, especially those tagged off Massachusetts.
Males exhibited similar movements to females. Males caught off Massachusetts traveled farther along the Gulf Stream, with most venturing east beyond 60˚W, whereas those caught off North Carolina did not travel past 65˚W (Supplementary Figure S4). Males caught in either location were observed overwintering in the South Atlantic Bight. Notably, one (ID MA19.08) moved southeast towards 12˚N and 45˚W but then turned back before reaching mating areas adjacent to nesting beaches. The movements of the two sub-adults were quite similar, as they migrated directly from North Carolina to either Georges Bank or Nova Scotia. Both traveled south through pelagic waters, followed a westward curve, and arrived in the South Atlantic Bight before their transmitters stopped reporting.
We inferred connectivity between tagging locations and nesting beaches through flipper tags and recaptures. Of the leatherbacks tagged off Massachusetts, two females had been previously tagged on nesting beaches in Trinidad (ID MA22.10) and Puerto Rico (ID MA22.06), two were recaptured on Trinidad (IDs MA19.06 and MA22.04), and two were tracked to beaches in Panama (ID MA22.01) and Colombia (ID MA22.05). Two females caught off North Carolina had been previously tagged on nesting beaches in Panama (ID NC19.04) and Trinidad (ID NC19.09), and two were recaptured on beaches in Florida (ID NC18.04) and Trinidad (ID NC21.01). We observed a few males traveling to and spending some time off possible nesting beaches prior to and during the nesting season (i.e., late January through April). Three males tagged off Massachusetts traveled to coastal waters off Grenada (ID MA22.07), South Carolina (ID MA22.08), and Anguilla (ID MA19.04), and one male tagged off North Carolina traveled to coastal waters of Florida (ID NC22.03).
3.3 Searching and transient behavior
Considering the BIC values (Table 2), successful convergence, and alignment with previously observed leatherback behavior, only the parameterization for the four-state model was selected and presented here for leatherbacks from tagged in each location. For the four-state model, we tried different initial values for each parameter of each state, but each resulted in the same estimated HMM. The estimated parameters from the HMMs were mostly consistent with the initial values used to inform the models (Figure 2). The estimated parameters for dive frequency and dive duration in in the broad area searching (BAS) behavioral state as well as the step length in the transient state did not converge near the initial values.
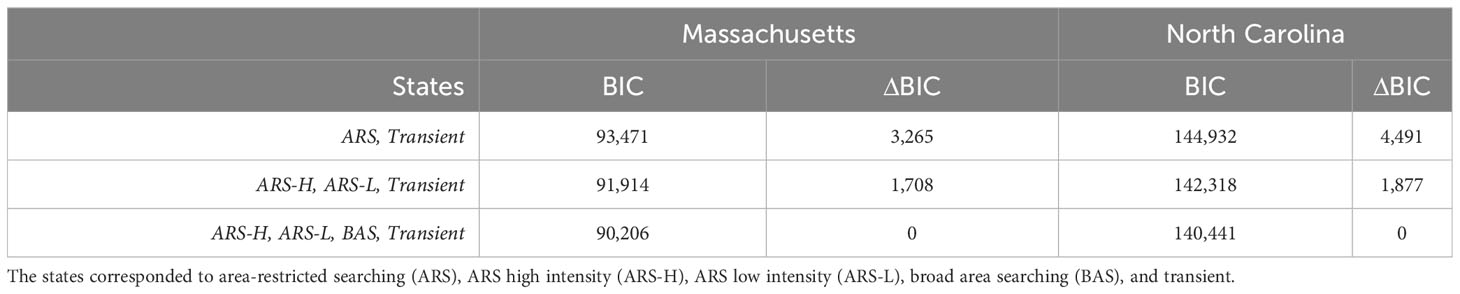
Table 2 Model selection metrics for hidden Markov models (HMMs) with varying numbers of states. Model selection was based on Bayesian information criterion (BIC) and carried out for each sample of leatherbacks (i.e., caught off Massachusetts or North Carolina).
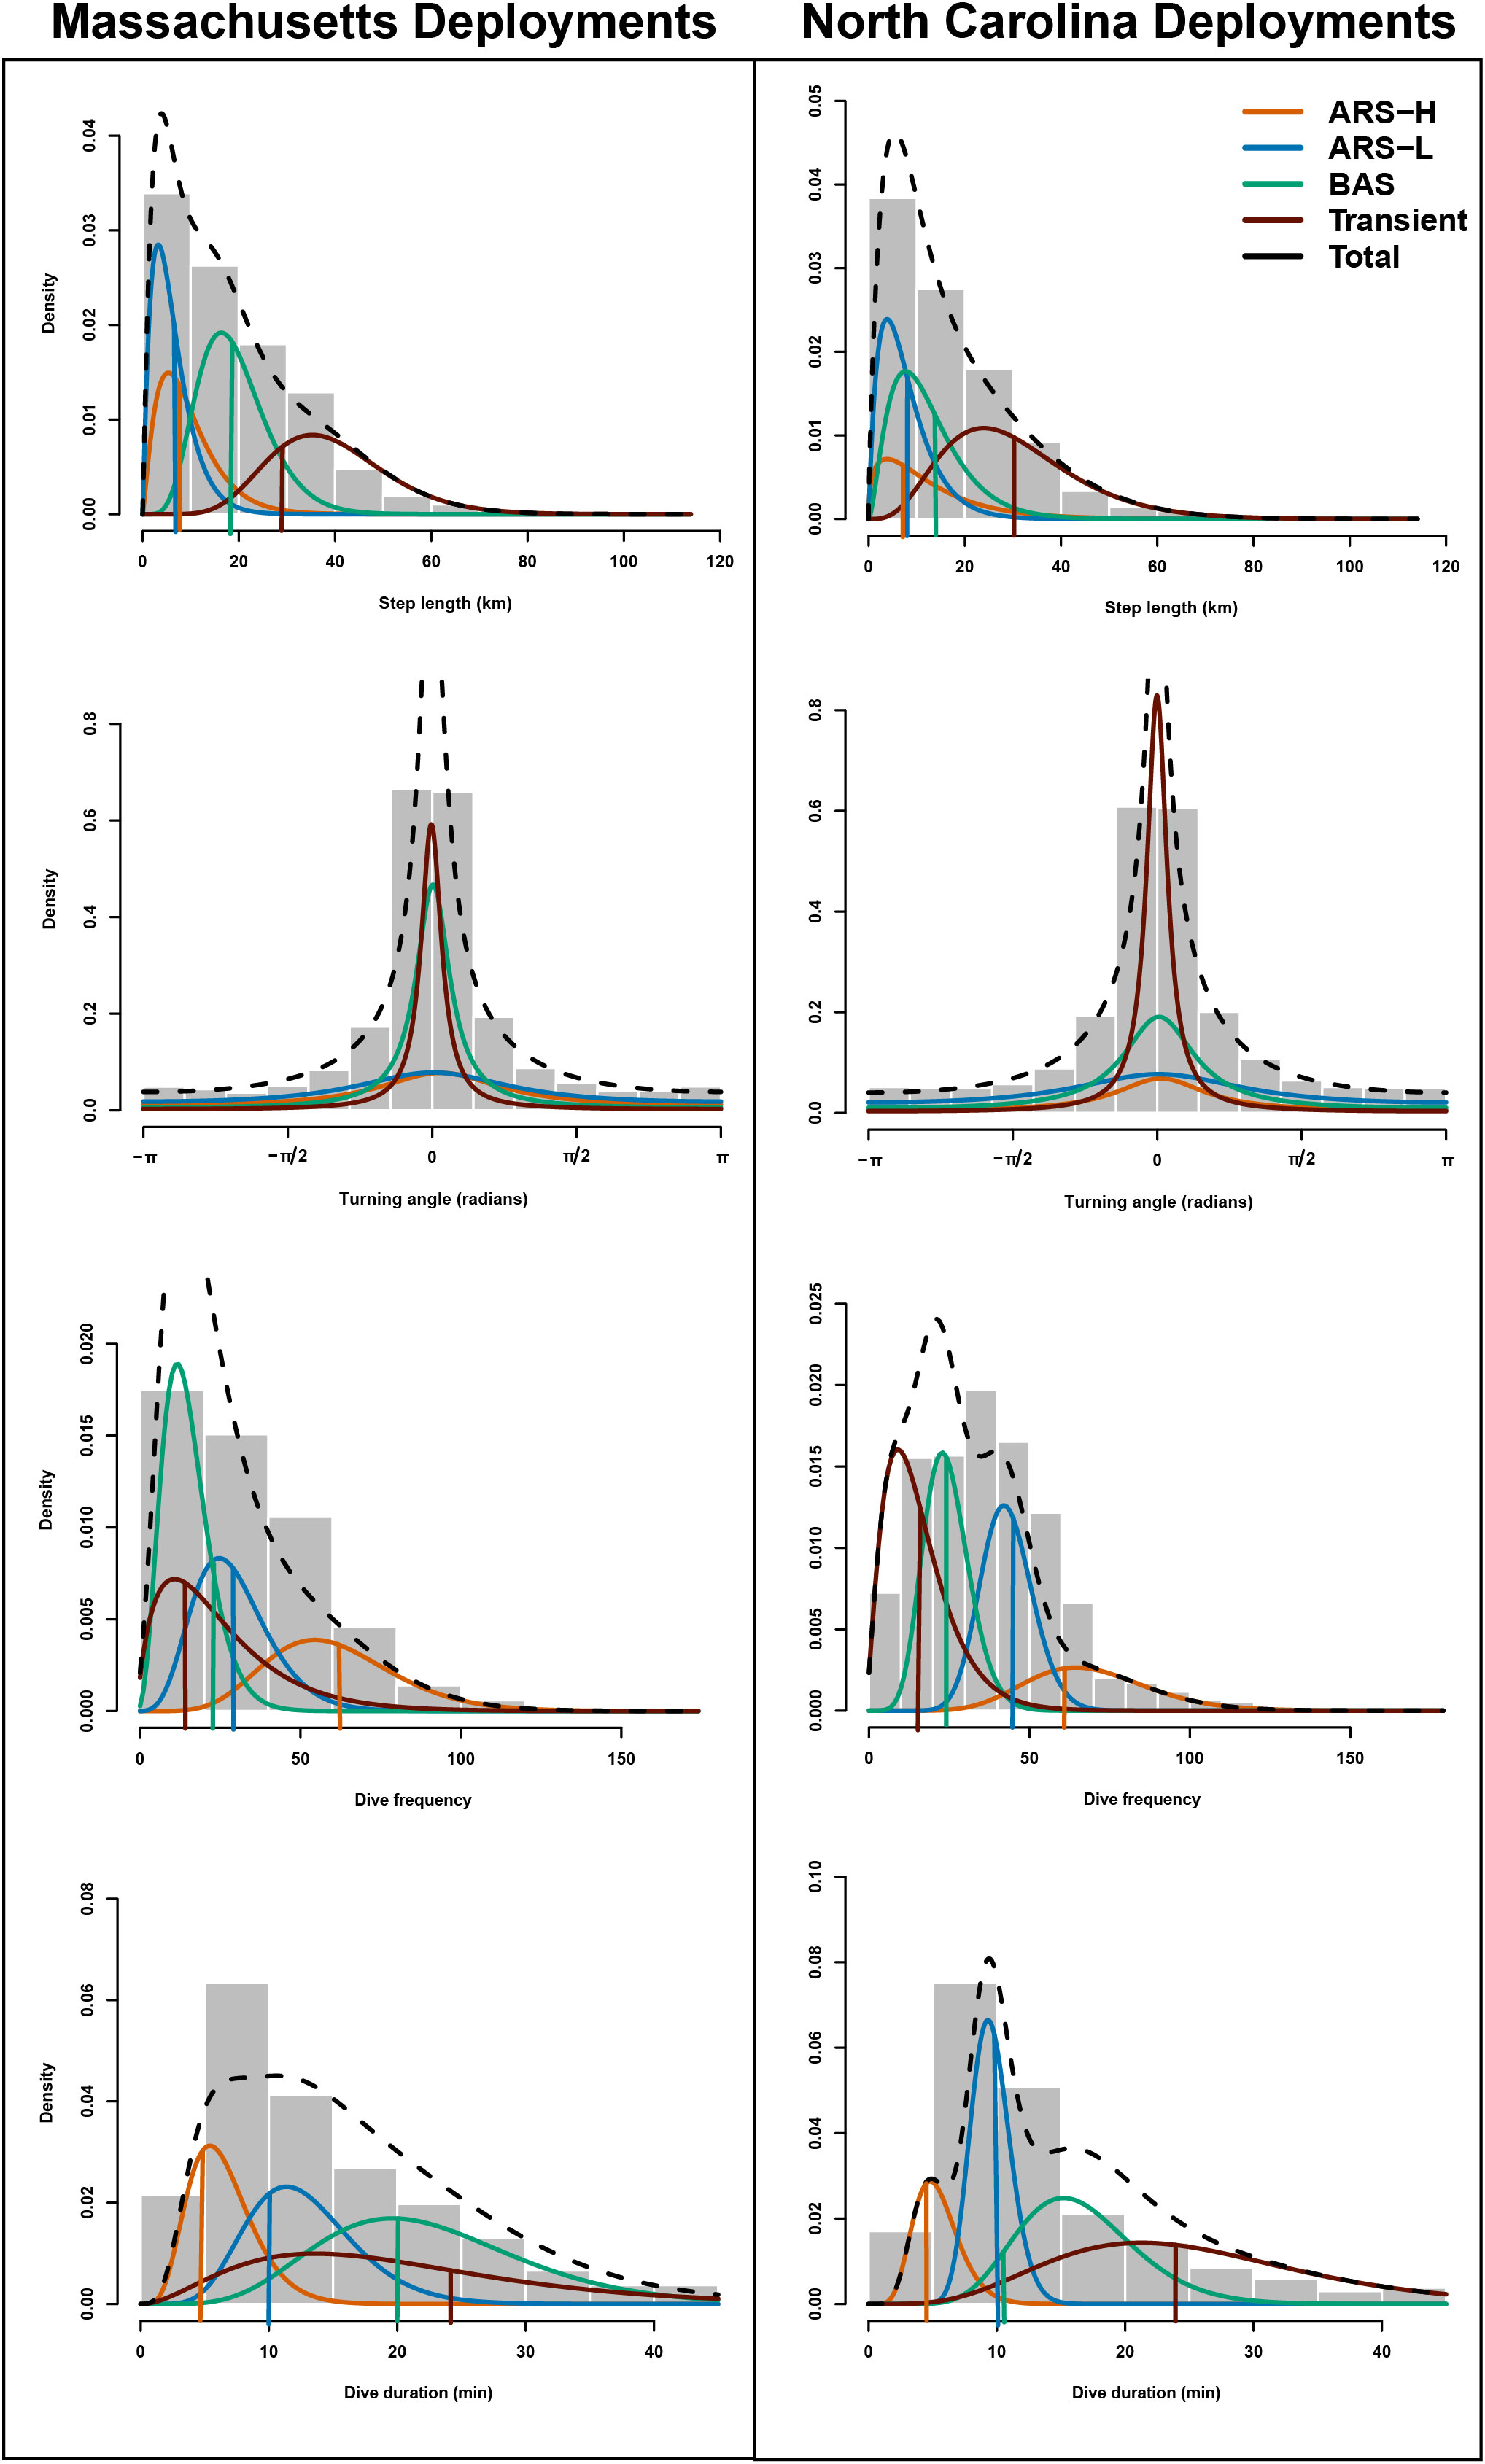
Figure 2 The estimated probability distributions for step length, turning angle, number of dives, and dive duration for the four-state (“ARS-H”, “ARS-L”, “BAS”, and “transient”) model for Massachusetts (first column) and North Carolina (second column) leatherbacks are plotted along with histograms of these data streams. The vertical lines represent the initial parameters used for the mean values of step length, dive frequency and dive duration. We did not include a vertical bar for turning angle as the initial parameter for the mean was set to zero for each state.
The distinction between each type of area-restricted searching (ARS) behavior was similar for leatherbacks tagged in Massachusetts and North Carolina. While step lengths and directional persistence were similar, area-restricted searching with high intensity diving (ARS-H) behavior consisted of more dives, and a shorter dive duration compared area restricted searching with low intensity diving (ARS-L) behavior (Figure 2; Table 3). Although, there were larger variations in the dive duration and frequency during the ARS behavioral states of leatherbacks tagged off Massachusetts compared to those of tagged off North Carolina. Compared to both ARS behaviors, transiting leatherbacks from both tagging locations performed longer step lengths, more directional persistence, less dives, and longer dive durations.
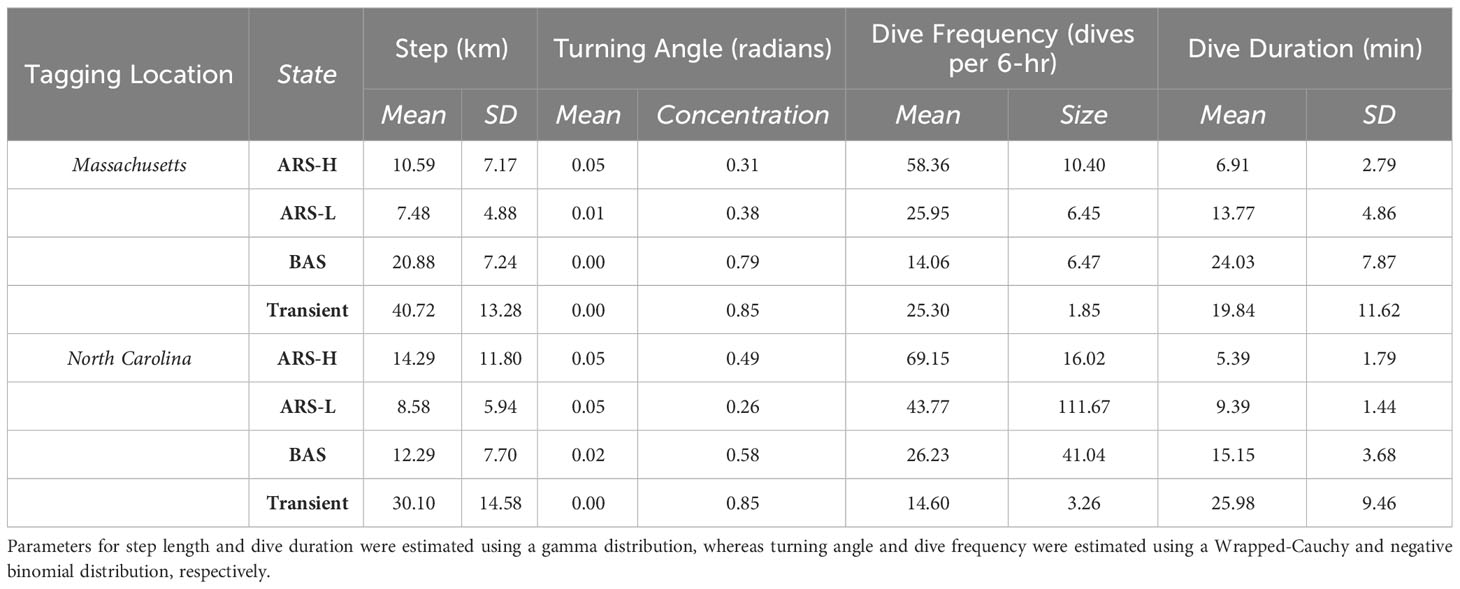
Table 3 Maximum likelihood estimates of parameters for each behavioral state from the four-state model: Area restricted searching with high intensity diving (ARS-H), area restricted searching with low intensity diving (ARS-L), broad area searching (BAS), and transient.
The comparisons of BAS behavior to the other three states varied between tagging locations. Leatherbacks tagged off Massachusetts exhibited intermediate step lengths and directional persistence during BAS compared to ARS and transient behaviors. However, they had the lowest dive frequency and the longest dive durations (Figure 2; Table 3). Leatherbacks tagged off North Carolina engaged in BAS displayed step lengths and directional persistence similar to ARS-H behaviors, falling in between ARS-L and transient behaviors (Figure 2; Table 3). Dive behavior during BAS was also intermediate when compared with ARS and transient behaviors.
Both BAS and transient behaviors were characteristics of movements along the Gulf Stream and migrations south towards nesting beaches or overwintering areas (Figure 1). When migrating south, there were a few turtles tagged in Massachusetts in 2019 and 2022 that displayed mostly BAS behavior, while the others predominantly exhibited transient behavior (Supplementary Figure S3). This was not the case for turtles tagged off North Carolina, as their migrations south mostly consisted of transient behavior with short instances of BAS behavior along the way. On the shelf, both BAS and transient behaviors were estimated either as leatherbacks moved between the MAB and SNE or as they moved back onto the shelf in the SAB and during their movements back north (Figures 3–5).
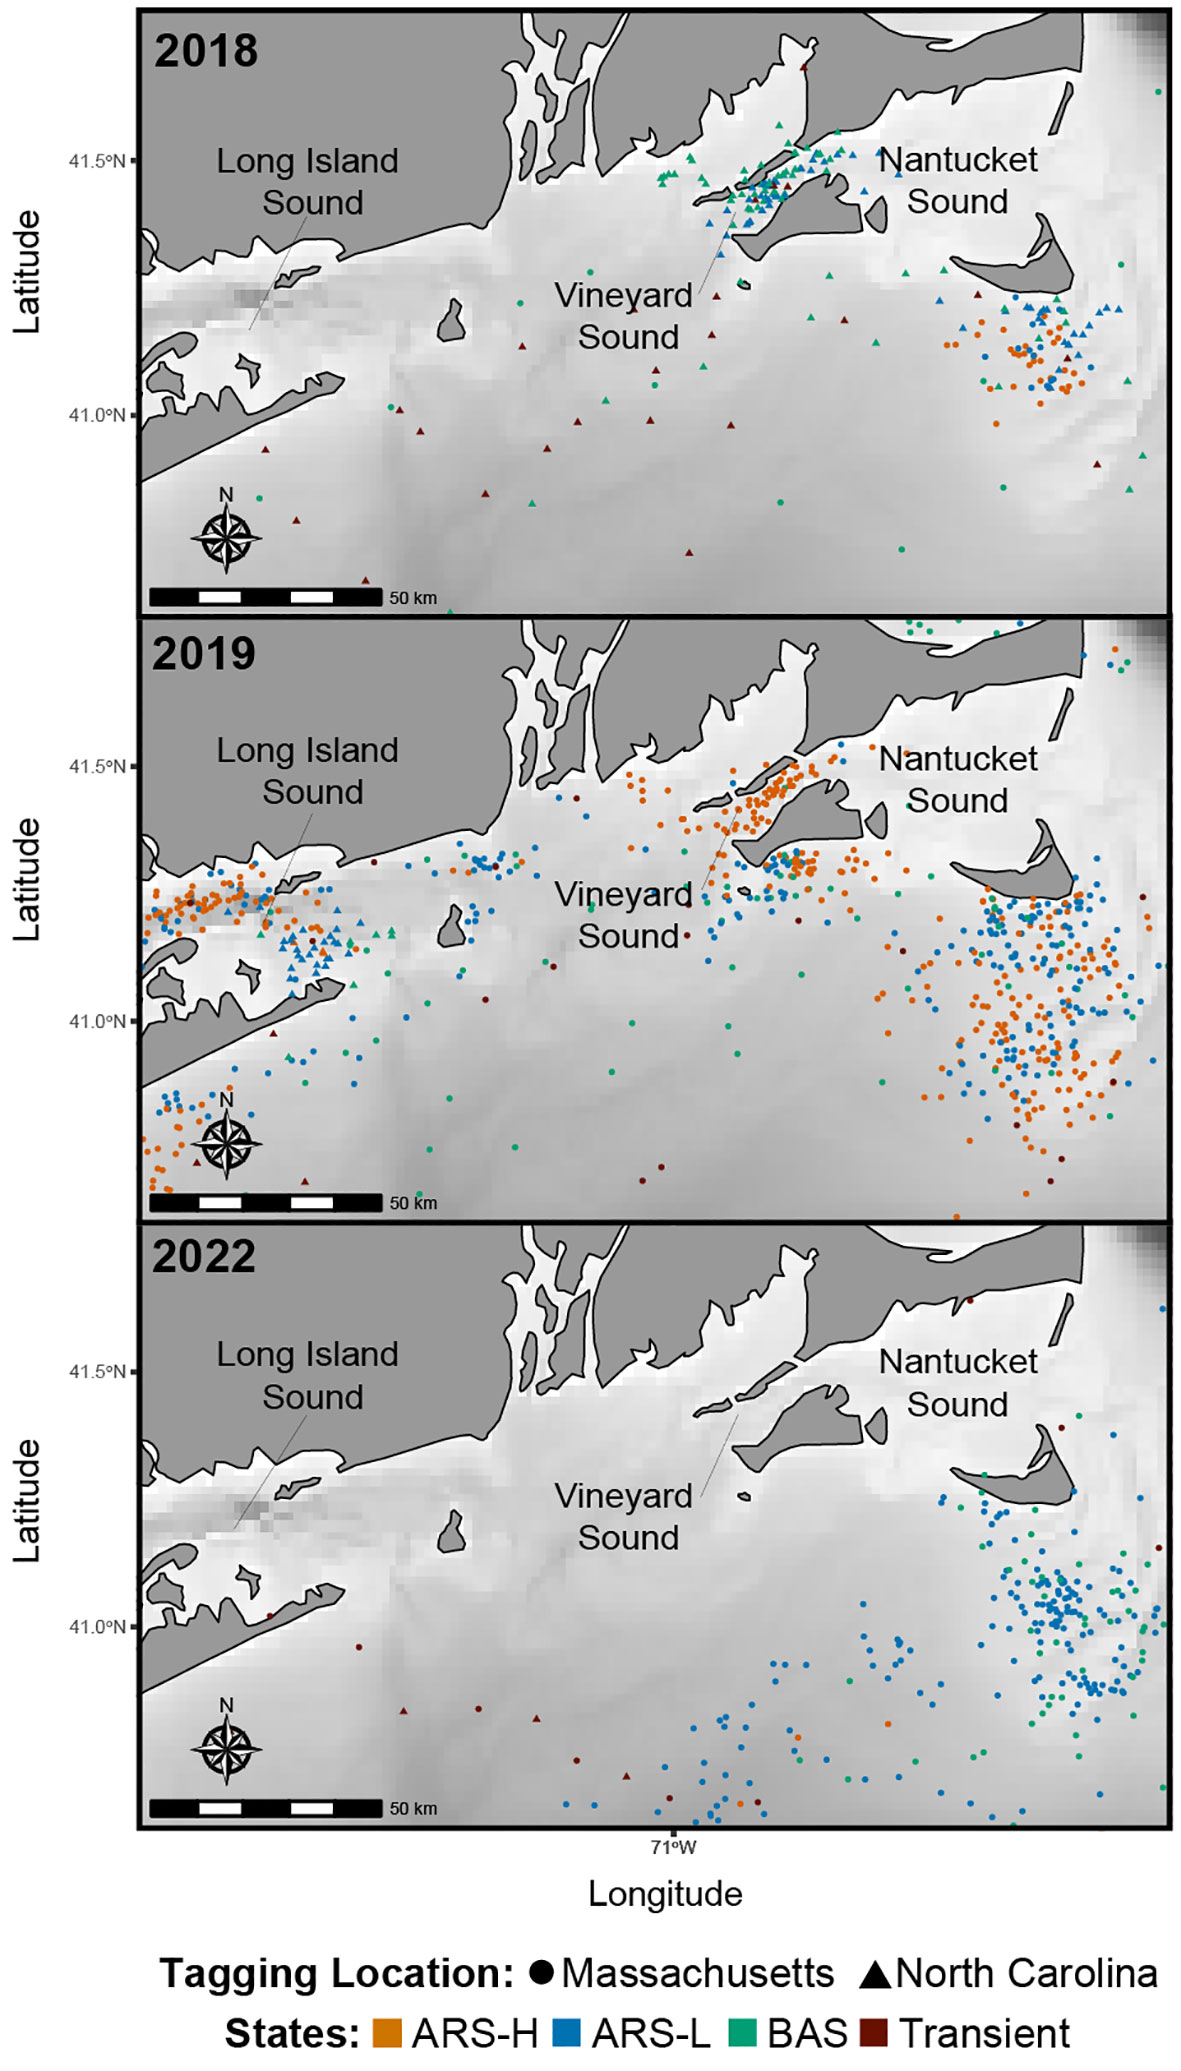
Figure 3 Predicted locations of leatherbacks along the Southern New England coast in 2018 (n = 4), 2019 (n = 9), and 2022 (n = 8). Colors correspond to the latent states predicted by the hidden Markov model: Area restricted search with high dive intensity (ARS-H), area restricted search with low dive intensity (ARS-L), broad area search (BAS), and transient.
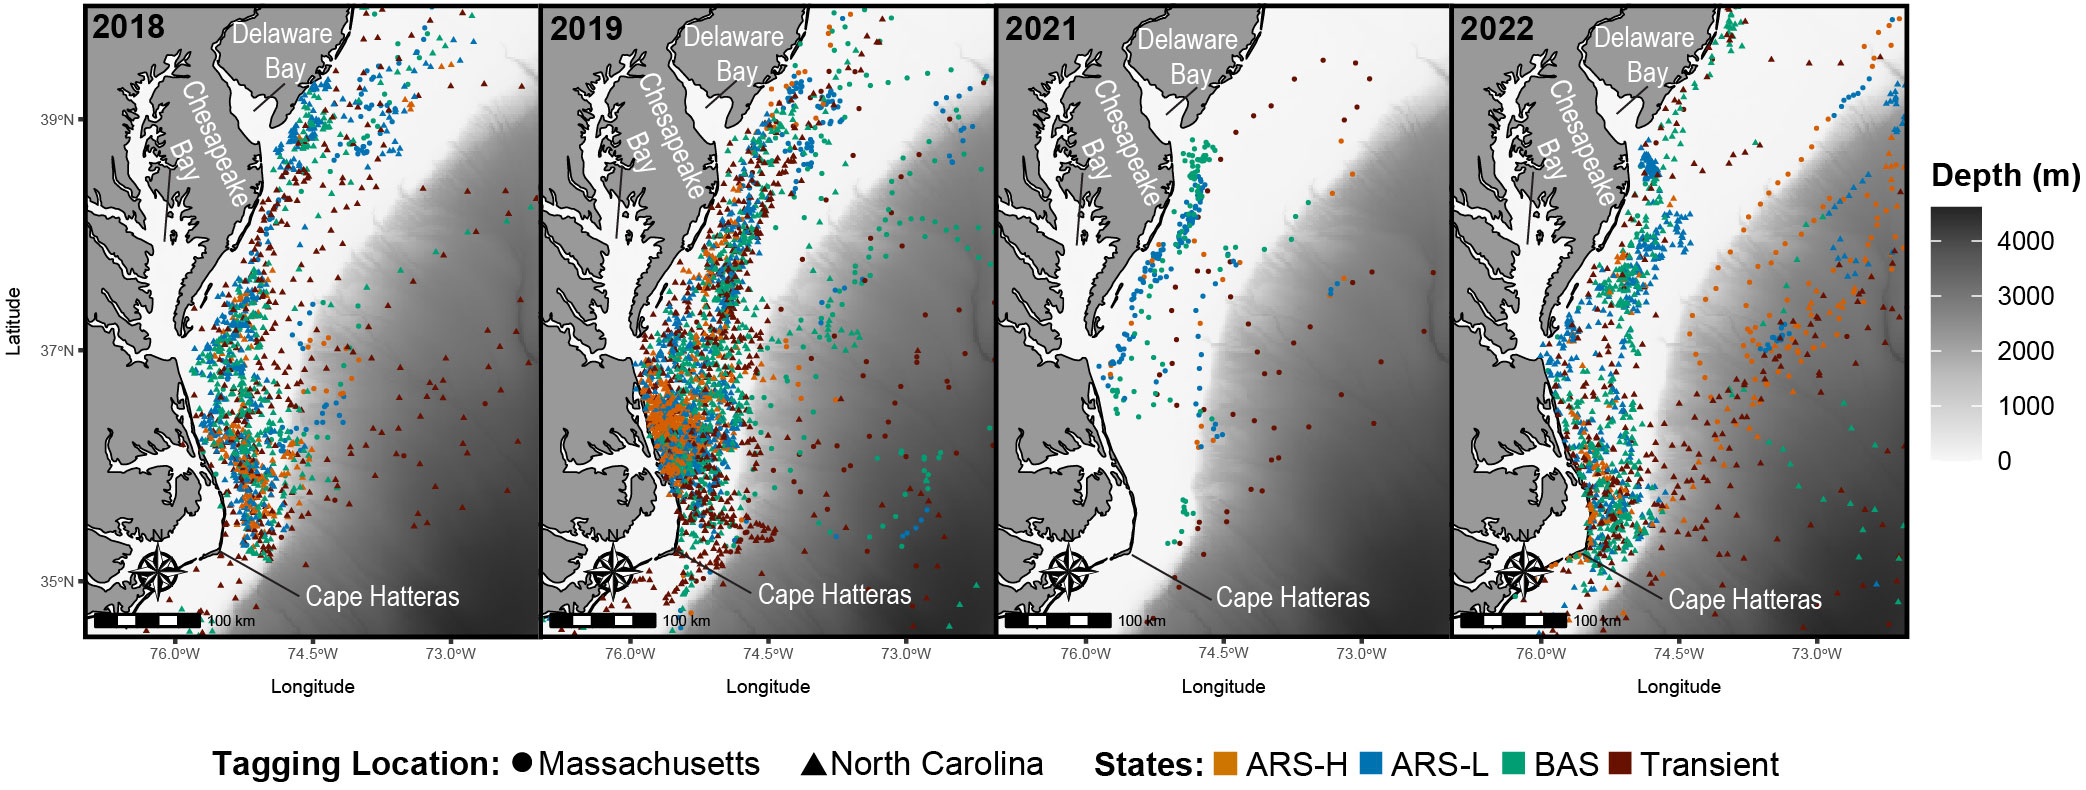
Figure 4 Predicted locations of leatherbacks along the Mid-Atlantic Bight in 2018 (n = 8), 2019 (n = 18), 2021 (n = 2), and 2022 (n = 13). Colors correspond to the latent states predicted by the hidden Markov model: Area restricted search with high dive intensity (ARS-H), area restricted search with low dive intensity (ARS-L), broad area search (BAS), and transient.

Figure 5 Predicted locations of leatherbacks along the South-Atlantic Bight in 2018 (n = 2), 2019 (n = 5), 2021 (n = 2), and 2022 (n = 8). Colors correspond to the latent states predicted by the hidden Markov model: Area restricted search with high dive intensity (ARS-H), area restricted search with low dive intensity (ARS-L), broad area search (BAS), and transient.
The HMMs estimated clusters of searching behavior dispersed along the continental shelf in SNE, MAB, and SAB (Figures 3–5). More leatherbacks tagged off Massachusetts performed ARS behavior off SNE (Table 3). These leatherbacks exhibited both ARS behaviors for similar periods of time on average, whereas those tagged off North Carolina spent more time displaying ARS-L compared to ARS-H (Table 4). Both tagging groups concentrated searching behavior in three areas within SNE: Nantucket Shoals, Vineyard Sound, and Long Island Sound (Figure 3). Turtles performed both ARS behaviors along Nantucket Shoals in 2018, 2019, and 2022 (Figure 3). Concentrations of both ARS and BAS behavior occurred within Vineyard sound in 2018 and 2019, while ARS behavior was only observed in Long Island Sound in 2019.
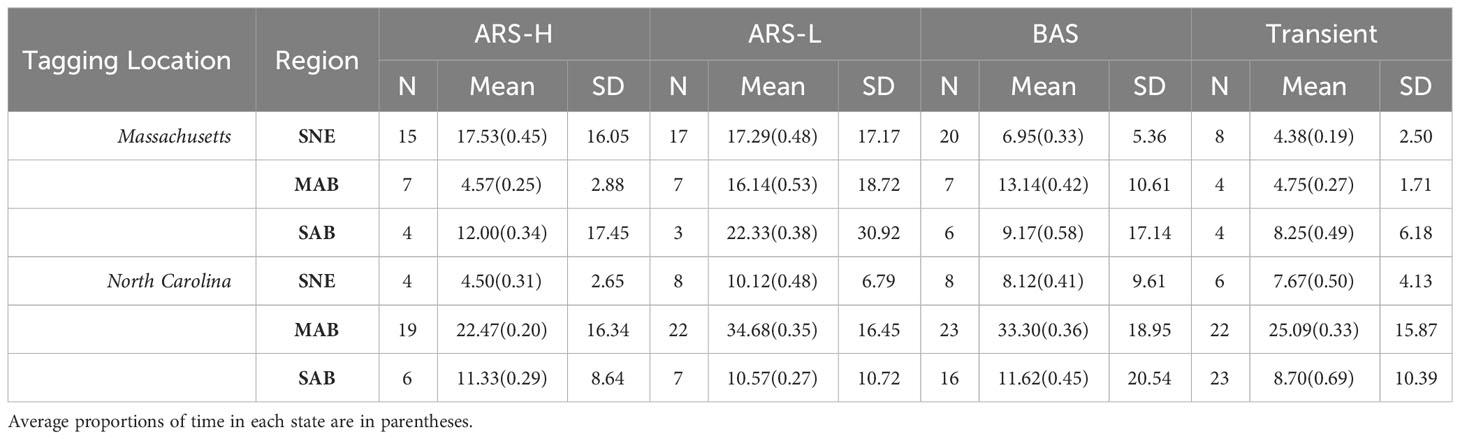
Table 4 Summary of days spent exhibiting each behavioral state in Southern New England (SNE), Mid-Atlantic Bight (MAB), and South Atlantic Bight (SAB): Area restricted searching with high intensity diving (ARS-H), area restricted searching with low intensity diving (ARS-L), broad area searching (BAS), and transient.
In the MAB, there were more leatherbacks tagged off North Carolina performing ARS behavior and for longer periods of time compared to those tagged off Massachusetts. Both groups of leatherbacks allocated a significant portion of their time to engaging in ARS-L and BAS behaviors (Table 4). The focal area for their searching behavior was predominantly situated between Cape Hatteras and just north of Delaware Bay, with a pronounced concentration along the North Carolina coastline spanning from Cape Hatteras to Chesapeake Bay (Figure 4). Concentrations close to shore were observed on an annual basis. Although, in 2021, concentrations primarily occurred between Chesapeake Bay and Delaware Bay.
Leatherbacks caught off North Carolina displayed each type of searching behavior in the SAB for less time compared to the MAB (Table 4). On average, they spent most of their time performing either BAS or transient behaviors. While fewer turtles caught off Massachusetts displayed searching behavior in the SAB, they spent more time conducting ARS-L behaviors and a similar time conducting BAS behavior compared to those caught off North Carolina. For most years, searching behavior mainly took place along the shelf’s edge. There were several individuals that conducted this behavior off the coast of South Carolina and Florida, but that was mostly observed in 2022 (Figure 5).
3.4 Searching behavior in relation to depth-temperature profiles
Based on available dive data, we constructed PDTs for the periods of ARS behavior off Nantucket Shoals for the month of September in 2019 (Supplementary Figure S5) and 2022 (Figure 6A). According to the ‘PAT-style Depth-Temperature Profiles’ (PDTs), temperatures were consistently around 20 ˚C between zero and 30 m. Leatherbacks spent most of their time between zero and 30 m, averaging between 5 and 15 m. Even though there was no predominant thermal gradient, a thermocline was still estimated to be at similar depths for most of the time as well as deeper (Figure 6A).
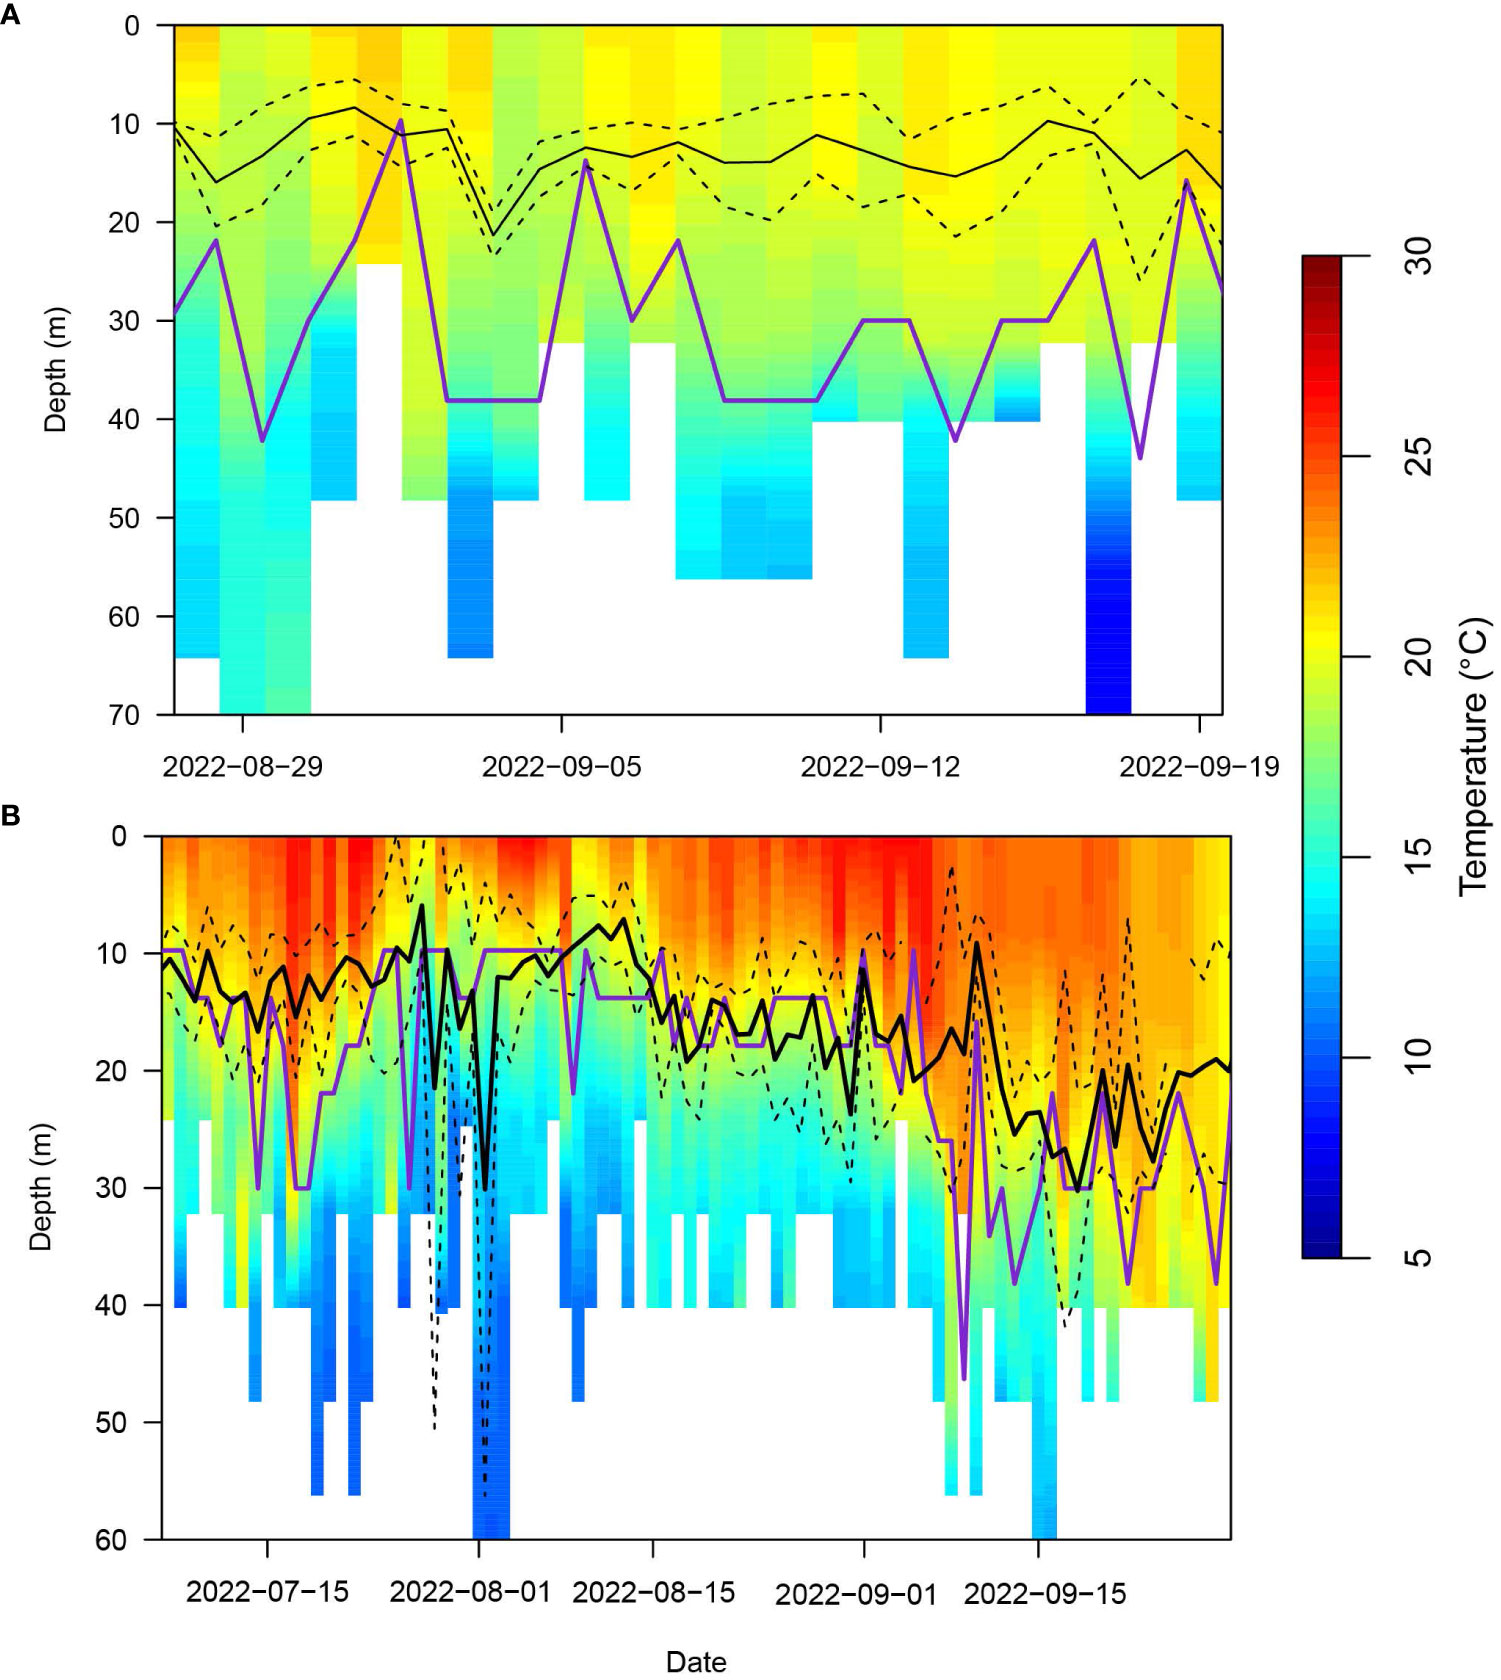
Figure 6 Average depth-temperature profiles (PDT) derived from all leatherbacks that displayed area restricted searching behavior (both high and low dive intensity) off Southern New England (SNE; A) and within the Mid-Atlantic Bight (MAB; B) in 2022. The black lines represent the mean (solid) +/- standard deviation (dashed) depth of the turtles. The purple line is the estimated depth of the thermocline. If there was not enough of a thermal gradient, then there was no estimated thermocline.
PDTs and average leatherback depth in the MAB were similar across all four years of the study (Supplementary Figure S6; Figure 6B). Average leatherback depth appeared to be closely associated with the depth of the thermocline which was estimated between 10 and 20 m in June and July and appeared to shift towards 30 m in August and September. The average leatherback depth was also associated with temperatures around 20 ˚C.
We synthesized average PDT plots from two individuals that displayed ARS along the coast of South Carolina in 2019 as well as from multiple individuals along the shelf’s edge in 2022 and 2023 (Supplementary Figure S7). Given the lack of a thermal gradient, the depth of the thermocline was not estimated for 2019 and 2023. In 2022, the thermocline was estimated to be around 100 m deep. Off the coast of South Carolina in June, leatherbacks spent their entire time above 15 m and in waters above 25 ˚C. In September and October of 2022, leatherbacks that moved along the shelf’s edge averaged depths of above 10 m in water’s above 25 ˚C. However, they were also occasionally observed to travel deeper than 300 m to waters colder than 15 ˚C. We observed different behaviors between February and April of 2023, as leatherbacks occupied depths up to 50 m and averaged around 10 m. The area they displayed ARS behavior was characterized by relatively cooler temperatures (15 to 20 ˚C).
4 Discussion
In the present study, we used geolocation and dive data derived from satellite transmitters to characterize the movement patterns and behaviors of leatherbacks during different stages of their migration cycle on the continental shelf along the U.S. coastline. Previous research has documented the presence of leatherbacks in Southern New England (SNE), Mid-Atlantic Bight (MAB), and South Atlantic Bight (SAB) regions (James et al., 2005b; Eckert et al., 2006; Dodge et al., 2014). However, empirical evidence of foraging behavior in U.S. waters is only available for coastal Massachusetts (Dodge et al., 2014; Dodge et al., 2018). Our findings not only suggest foraging behavior within each region with an emphasis on SNE and the MAB, but they also highlighted connectivity patterns between nesting beaches and foraging areas as well as novel movement patterns by male leatherbacks.
Results from the hidden Markov models (HMMs) build upon findings from previous studies to demonstrate consistent use of the SNE coast as a primary foraging area. Further, our results indicate that the waters along Nantucket Shoals provide the most consistent foraging habitat. Turtles tagged in both Cape Cod Bay and Nantucket Shoals were observed displaying high concentrations of ARS behavior in this area on an annual basis. This SNE region is highly productive (Skjoldal and Sherman, 2002) promoting gelatinous zooplankton blooms that leatherbacks exploit on an annual basis (Dodge et al., 2014; Dodge et al., 2018). Additionally, the water column off Nantucket Shoals, is well-mixed from the surface to the bottom (Limeburner and Beardsley, 1982), which could cause an even vertical distribution of prey. Indeed, the ‘PAT-style Depth-Temperature Profiles’ (PDT) plots from each year showed little variation in the temperature from the surface to the bottom (~ 30 m) as well as a weakly-defined thermocline. This may be why we observed a higher variation in the dive frequency and duration during each ARS behavior in leatherbacks tagged off Massachusetts as turtles would target their prey at different depths. On Nantucket Shoals, we observed both types of area-restricted searching (ARS) behavior, which may be indicative of horizontal and vertical changes in prey density. Leatherbacks searching for prey have been observed performing both V-shaped and square-shaped dives (Okuyama et al., 2021). Short, frequent V-shaped dives would allow leatherbacks to continuously search the entire water column, while longer, less frequent square-shaped dives would help turtles search for prey by silhouetting them against the sunlight (Dodge et al., 2018). Shifts between these behaviors have been observed in other foraging areas as well (Wallace et al., 2015).
Even though we observed dense searching behavior in Vineyard Sound and Long Island Sound, it was not consistent year to year like the waters off Nantucket Shoals. Foraging behavior has been previously recorded in Vineyard and Nantucket Sounds (Dodge et al., 2018; Rogers et al. in Review1), but this is the first instance of searching behavior recorded in Long Island Sound. There is evidence of lion’s mane jellyfish (Cyanea capillata), a known leatherback prey species (Dodge et al., 2011), occurring within this area during the fall (DEEP, 2020). It is possible that leatherbacks are targeting these blooms in Long Island Sound, but this behavior was only observed in one year (i.e., 2019). Further tagging is required to understand the importance of these other areas in SNE.
We inferred foraging in the MAB because ARS behavior was prevalent throughout the southern portion of the MAB from Cape Hatteras to the mouth of Delaware Bay for every year of tagging in North Carolina (2018-2022). The PDT plots provided further evidence that foraging was taking place as leatherbacks were closely associated with the thermocline where jellyfish, which are known leatherback prey, have been observed to concentrate (Graham et al., 2001; Wallace et al., 2015; Hamelin et al., 2017). This may be why we observed less variation in the dive frequency and during for both ARS behaviors in leatherbacks tagged in North Carolina. Since most turtles tagged in that area conducted ARS behaviors in that area and there was a close association with the thermocline, their dive behavior may be more consistent as they target prey in a specific part of the water column. The MAB has high biomass of gelatinous zooplankton (Lucas et al., 2014); however, there is limited information on fine-scale spatiotemporal distributions of specific species across this region. There is evidence of sea nettles (Chrysaora quinquecirrha), a common leatherback prey (Dodge et al., 2018), blooming on either end of the proposed foraging area. Blooms were observed to take place in both Chesapeake Bay (Brown et al., 2002) and Barnegat Bay (Bologna et al., 2017) during the summer when leatherbacks are present. Additionally, Brown et al. (2002) indicated that blooms of sea nettles occurred between 20 and 30 ˚C, which is the same range of temperatures we observed between the surface and the thermocline in the PDT plots. While our results suggest foraging is taking place in this region, future research should aim to tag turtles in this region with animal-borne video cameras for further validation.
After exhibiting ARS behavior in the MAB, most leatherbacks migrated into the Gulf Stream and continued searching behavior. While it is unclear what causes this shift, we observed the thermocline in the MAB region deepen towards the end of the summer (Figure 6B). If turtles are targeting prey along this boundary, the energetic cost of diving deeper might outweigh the benefits of continuing to forage in these areas. Another explanation could be a reduction in prey availability as the abundance of sea nettles decreases at the end of the summer in Chesapeake Bay (Sexton, 2012). Our documentation of Gulf Stream ARS and broad area searching (BAS) behaviors aligns with prior research that inferred foraging behavior along this oceanographic feature (Hays et al., 2006; Chambault et al., 2017). The Gulf Stream may serve as an intermediary foraging area for leatherbacks migrating to lower latitudes for the winter, as leatherbacks tagged off both Massachusetts and North Carolina in this study and those tagged while nesting in Panama, French Guiana, and Florida were observed to migrate along this feature (Eckert et al., 2006; Chambault et al., 2017; Evans et al., 2021).
Due to its proximity to Florida, there is a possibility that the MAB serves as a primary foraging area for the Florida nesting population. Our results add to those of genetic studies (Stewart et al., 2013; Stewart et al., 2016) and tagging studies of Florida nesting leatherbacks (Eckert et al., 2006; Turtle Expert Working Group (TEWG), 2007), which observed connectivity with the MAB. Although foraging in the MAB would be energetically beneficial for this population given the short migration distance, the average remigration interval for Florida leatherbacks was not shorter than that observed for other populations with greater migratory distances (i.e., 2.7 years in FL versus 2.2 years in Costa Rica; Stewart et al., 2014; Evans et al., 2021). Foraging success may be hindered by different abiotic and biotic factors such as high sea surface temperatures and limited prey availability, respectively. Reduced foraging success would explain why we observed migrations off the shelf, subsequent foraging along the Gulf Stream, and remigration to the SAB and MAB the following year. As the number of nests in Florida drops (NMFS and USFWS, 2020), it is essential that we further investigate the connectivity between Florida and the MAB via tagging and genetic studies.
Our study did not reveal significant use of the SAB, but this result may be an artifact of the relatively short transmission duration, as most tags ceased reporting after half a year. Despite this, we did observe some foraging behavior along the shelf edge as well as close to shore. Leatherbacks tagged in SNE and Nova Scotia were observed traveling into the SAB after overwintering in the middle of the Atlantic Ocean (James et al., 2005b; Dodge et al., 2014), with the time of arrival potentially overlapping with significant spring blooms of cannonball jellyfish (Stomolophus meleagris, Faulk et al., 2023). Although the SAB may not supply enough food to serve as a major foraging area as cannonball jellyfish have a short seasonality. According to Faulk et al. (2023), these jellyfish occur offshore in the spring and move inshore to estuaries at the beginning of the summer to reproduce. Biomass does not typically increase until the fall and winter. This could explain why we observed leatherbacks migrating to the SAB either from the MAB in the spring or oceanic waters during the winter.
While expanding on previous tagging efforts in Massachusetts, this study is the first to tag leatherbacks during their northward migration off the coast of North Carolina. Our ability to perform in-water tagging consistently each year suggests that this area serves as a migratory corridor for leatherbacks traveling to northern foraging areas. Interestingly, all turtles that migrated to Nova Scotia did so from North Carolina migrating off the shelf and up to Nova Scotia forgoing the MAB. This gives further support that the coastal area off North Carolina may serve as a significant corridor used by multiple foraging populations as we observed turtles traveling from North Carolina to the MAB and SNE as well.
By conducting in-water tagging, we were able to track 14 males, four of which were tracked to potential mating areas off the coast of nesting beaches in Florida and the Caribbean. Most of the remaining male leatherback tags did not transmit long enough to observe a southward migration to nesting beaches or mating areas. However, two males traveled to subtropical waters far offshore, immediately turned around, and then traveled back. This behavior aligns with females over-wintering in subtropical waters in the middle of the Atlantic Ocean (Dodge et al., 2014), contradicting previous conjecture suggesting males migrate between northern foraging grounds and nesting beaches on an annual basis (James et al., 2005a). Our results align with findings by Sasso et al. (2021) that suggested males foraging in the Gulf of Mexico forego remigration to nesting beaches and over-winter along the West Florida shelf. Both males that we observed overwintering were tagged off Massachusetts. It is possible that they were not able to accumulate sufficient energy reserves and had to skip the mating season, similar to females. Further investigation into male migration patterns across different foraging areas is required to fully understand how prey availability might affect remigration intervals, as this will have a significant impact on estimating adult sex-ratios and subsequent population dynamic models in the Northwest Atlantic (James et al., 2007).
In this study, we present a four-state model to characterize the behaviors of leatherbacks across a large area. Due to overwhelming support for the four-state model over the two- and three-state models, it is possible that increasing the number of states would garner more support as it may explain more variation in leatherback movement. However, given the temporal scale of our movement data (i.e., 12-hour time intervals), we believed a four-state model was most appropriate. Partitioning the states described in this study into fine-scale behaviors would require more detailed movement and dive metrics. This has been achieved in other species like Atlantic cod (Gadus morhua) and horn sharks (Heterodontus francisci) using hierarchical HMMs (Adam et al., 2019). We suggest that future research should investigate the fine-scale behaviors of leatherbacks at the foraging locations examined in this study. This can be achieved by employing instrumentation that lends itself to collecting small-scale movement metrics (i.e., accelerometers and animal-borne cameras) in conjunction with hierarchical HMMs. Doing so may reveal potential interactions with different types of human activity unique to each area.
We chose initial values that were informed from prior studies on leatherback behavior in Nova Scotia, with parameter estimates closely aligning with the used initial values. While the initial values were based on past observations of leatherback behavior from Nova Scotia, this alignment indicates the consistency in leatherback movement behavior across the entire Northwest Atlantic shelf with some variability. The only exceptions were observed in the parameters related to BAS and transient states. The initial values were based on observations of the leatherback behavior in the ARS and transient states. Thus, there is limited knowledge on the movement metrics of leatherbacks performing intermediate behaviors such as BAS, which may explain why the estimated parameters did not completely fall between what we know of leatherback ARS and transient movement. The discrepancies between documented migratory speeds of leatherbacks tagged off Nova Scotia and estimated parameters of step length in the transient state may be a result of the differences in oceanic conditions as current direction and speed may have an influence on leatherback migratory speeds. Compared to leatherbacks tagged off Nova Scotia, the leatherbacks from this study take advantage of different migratory corridors when leaving foraging grounds by either following the Gulf Stream eastward or traveling south along the continental shelf. The variability in oceanographic conditions on each of these routes may explain the discrepancies between the initial and estimated transient speeds. Despite these discrepancies, there seems to be a semblance of consistency in leatherback behavior across the continental shelf. This consistency holds significance when devising conservation management strategies aimed at mitigating interactions between turtles and humans.
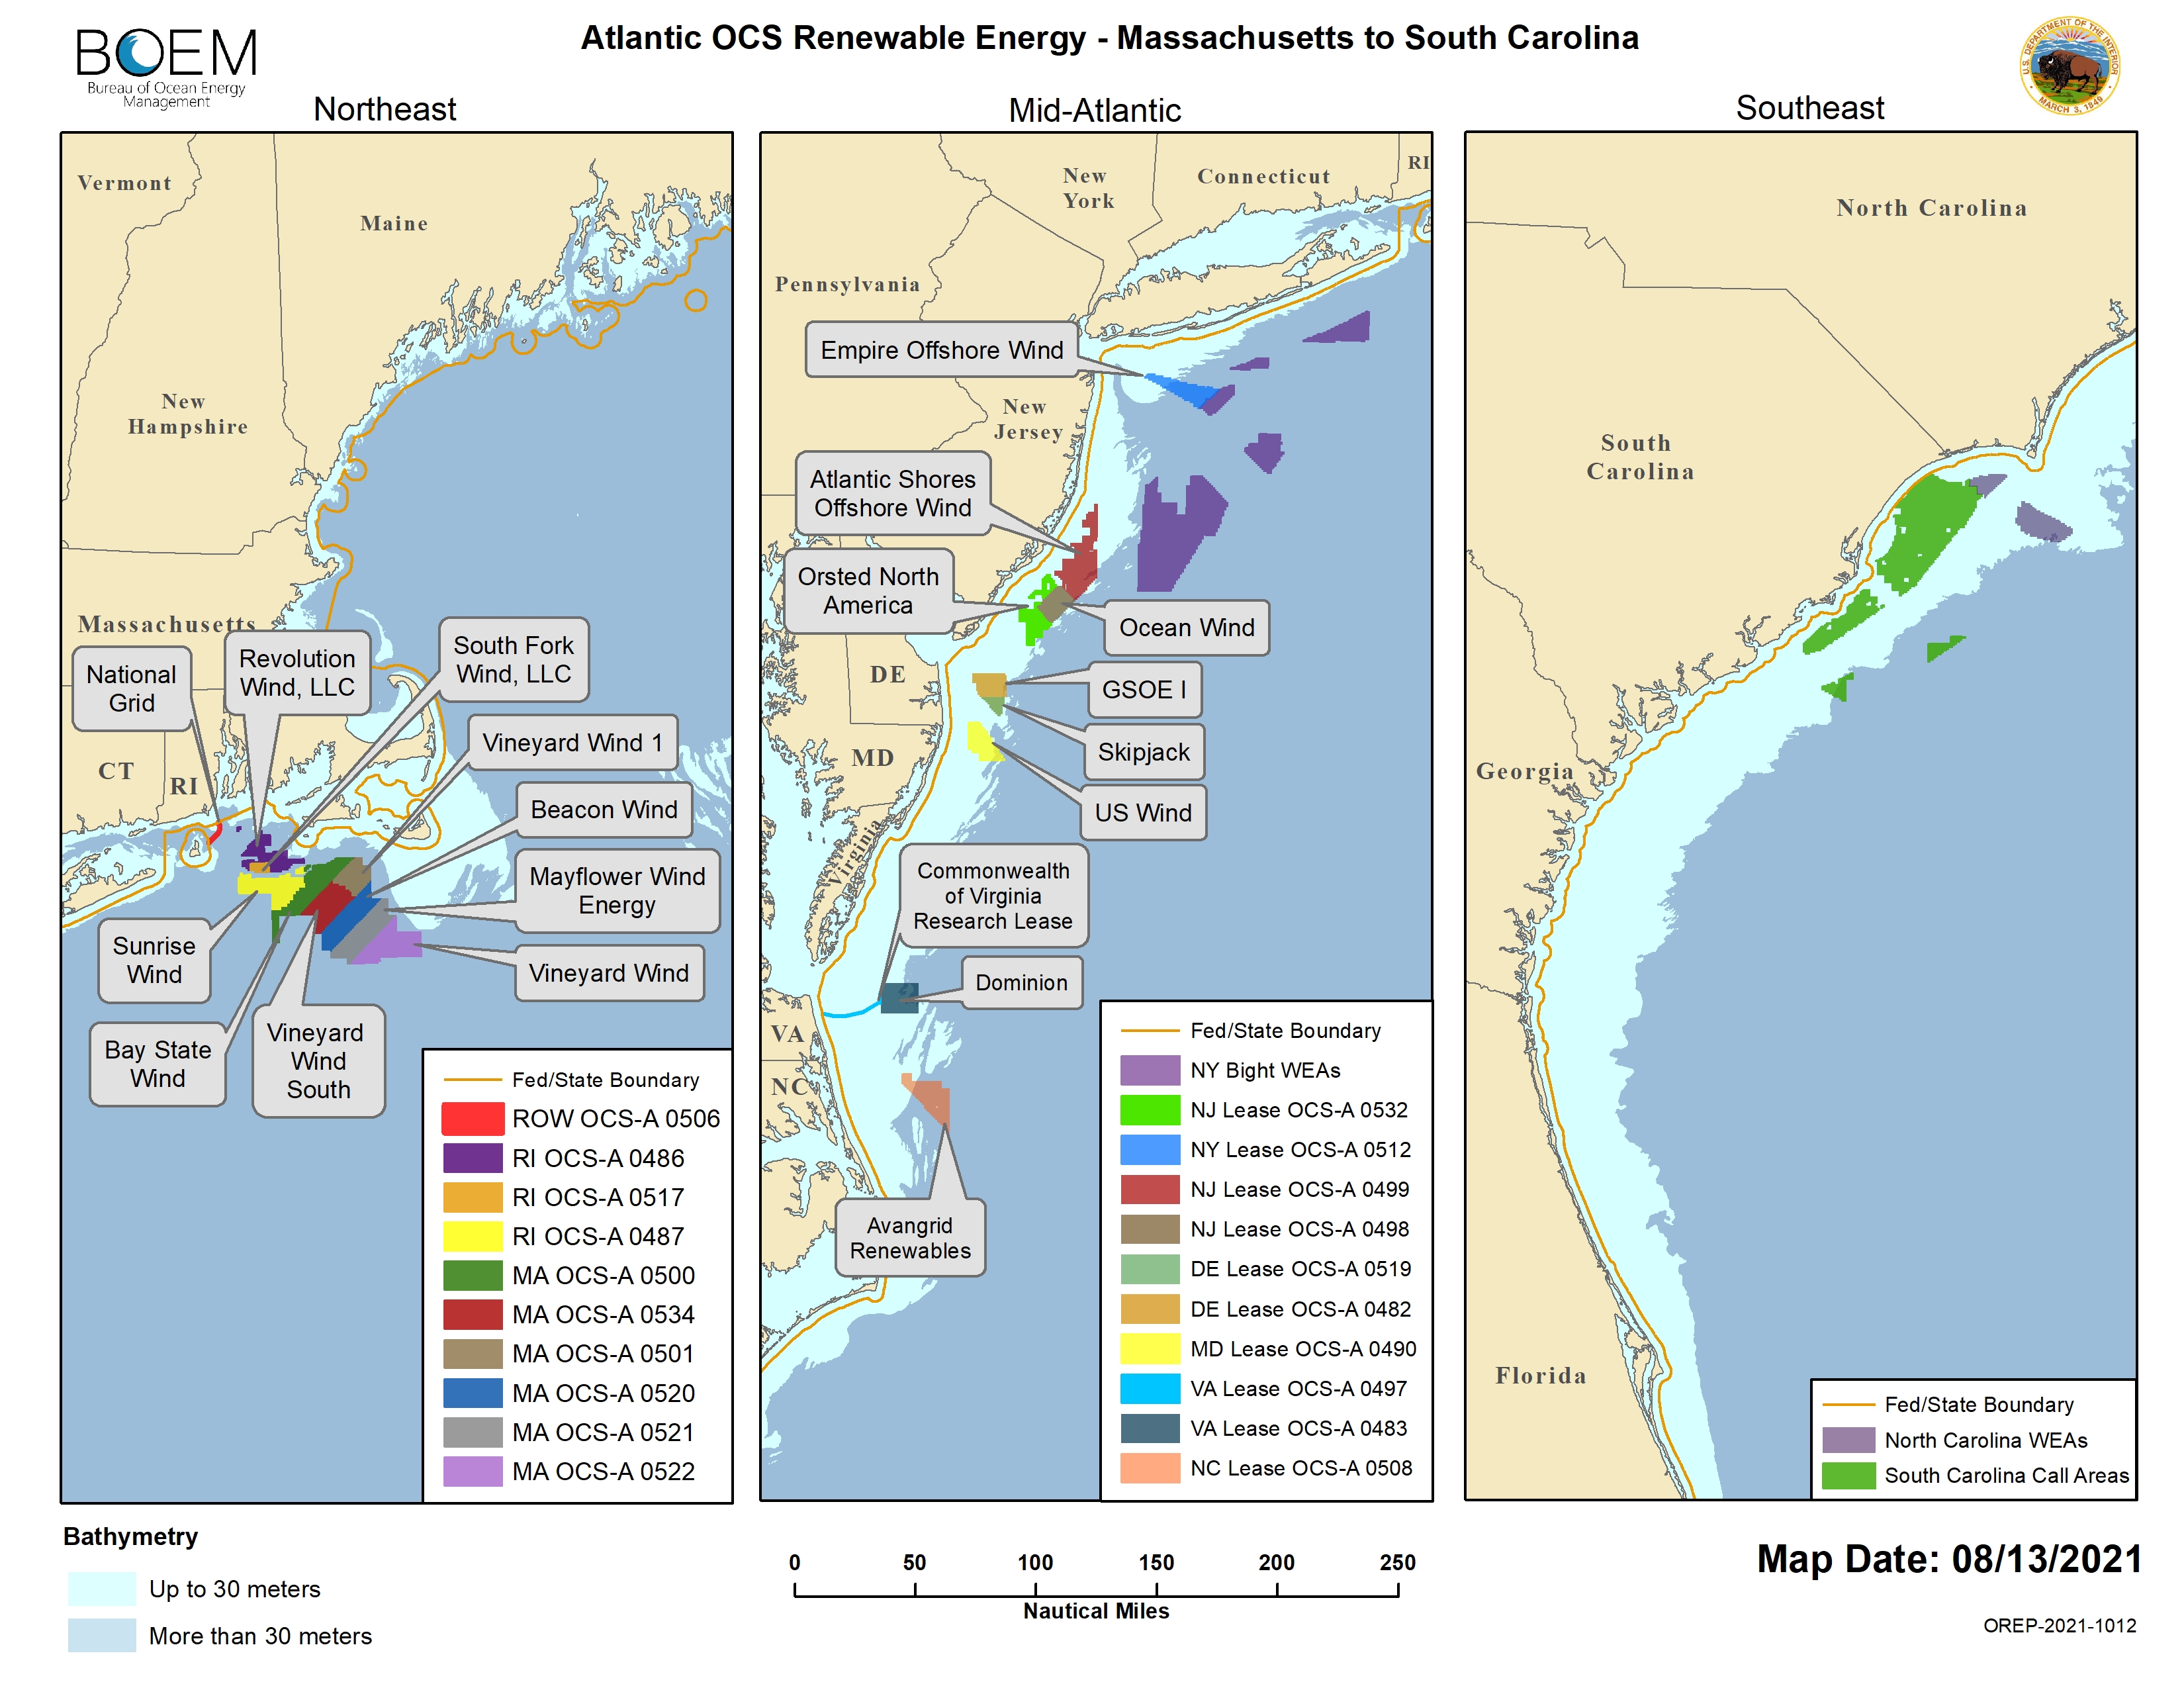
The results of this study provide new insights into our understanding of leatherback movement ecology along the Northwest Atlantic shelf. We identified important areas in SNE, MAB, and SAB that support different stages of the migration cycle. Our results give further evidence that a primary foraging area exists in SNE, as well as suggest possible foraging areas in the MAB and SAB that serve post-reproductive and overwintering leatherbacks, respectively. Moreover, the findings from this study highlight the diverse movement behaviors exhibited across these regions. In SNE, leatherbacks predominantly concentrated along Nantucket Shoals during the late summer and early autumn, where they exhibited searching behavior throughout the entire water column. This was different from leatherbacks in the MAB, which conducted searching behavior over a substantially larger area between Cape Hatteras and Delaware Bay during the summer, where they concentrated along the thermocline. While more information on leatherback behavior in the SAB is needed to elucidate specific foraging strategies, turtles executed ARS behavior over a relatively large area along the shelf edge and coastline during every season. Overall, these data should be used as a baseline for comparison with future behaviors under changing environmental conditions such as climate change and the construction of offshore windfarms. The construction of windfarms is of particular interest as most leasing areas are located along the MAB and SNE (BOEM, 2021). Conservation managers should consider these regional variations in movement behavior when devising strategies aimed at mitigating potential threats and minimizing their impact.
Data availability statement
The raw data supporting the conclusions of this article will be made available by the authors, without undue reservation.
Ethics statement
The animal study was approved by National Marine Fisheries Service’s Atlantic Institutional Animal Care and Use Committee. The study was conducted in accordance with the local legislation and institutional requirements.
Author contributions
MR: Conceptualization, Data curation, Formal analysis, Writing – original draft, Writing – review & editing, Methodology, Investigation. LA: Funding acquisition, Writing – review & editing, Resources, Investigation. HH: Funding acquisition, Project administration, Resources, Writing – review & editing, Investigation. JH: Formal analysis, Writing – review & editing, Data curation, Investigation. SP: Writing – review & editing, Resources, Investigation. CS: Conceptualization, Funding acquisition, Resources, Supervision, Writing – review & editing, Methodology, Investigation
Funding
The author(s) declare financial support was received for the research, authorship, and/or publication of this article. This study was funded by the United States Department of the Interior, Bureau of Ocean Energy Management through Interagency Agreements M14PG00005, M10PG00075, and M19PG00007 with the United States Department of the Commerce, National Oceanic and Atmospheric Administration (NOAA), National Marine Fisheries Service (NMFS), Northeast Fisheries Science Center (NEFSC) and Southeast Fisheries Science Center (SEFSC). This paper is also the result of research funded by the NOAA’s National Centers for Coastal Ocean Science, Competitive Research Program to the NOAA Fisheries Northeast Fisheries Science Center (NEFSC).
Acknowledgments
We would like to thank Leah Crowe, Annie Gorgone, Blake Price, Craig Harms, Emily Christiansen, Mike Judge, and Lisa Conger for their expert field work during leatherback captures. We would also like to thank Elizabeth Babcock, Joseph Pfaller, Heather Foley, and Neil Hammerschlag for their helpful comments on earlier versions of this manuscript. This work would not have been possible without the crew of the Warren Jr. and Semper Offshore as well as Val Diers from Anthem Commercial Air Services.
Conflict of interest
The authors declare that the research was conducted in the absence of any commercial or financial relationships that could be construed as a potential conflict of interest.
Publisher’s note
All claims expressed in this article are solely those of the authors and do not necessarily represent those of their affiliated organizations, or those of the publisher, the editors and the reviewers. Any product that may be evaluated in this article, or claim that may be made by its manufacturer, is not guaranteed or endorsed by the publisher.
Supplementary material
The Supplementary Material for this article can be found online at: https://www.frontiersin.org/articles/10.3389/fmars.2024.1325139/full#supplementary-material
Footnotes
- ^ Rogers, R., Choate, K., Crowe, L. M., Hatch, J. M., James, M., Matzen, E., et al. Investigating leatherback surface behavior using a novel tag design and machine learning. In review.
References
Adam T., Griffiths C. A., Leos-Barajas V., Meese E. N., Lowe C. G., Blackwell P. G., et al. (2019). Joint modelling of multi-scale animal movement data using hierarchical hidden Markov models. Methods Ecol. Evol. 10 (9), 1536–1550. doi: 10.1111/2041-210X.13241
Asada A., Eckert S. A., Hagey W. H., Davis R. W. (2021). Antipredatory strategies of leatherback sea turtles during internesting intervals on St. Croix, US Virgin Islands. Mar. Ecol. Prog. Ser. 678, 153–170. doi: 10.3354/meps13856
Avens L., Goshe L. R., Zug G. R., Balazs G. H., Benson S. R., Harris H. (2020). Regional comparison of leatherback sea turtle maturation attributes and reproductive longevity. Mar. Biol. 167 (1), 1–12. doi: 10.1007/s00227-019-3617-y
Bauer R. (2020). Rchivaltag: Analyzing archival tagging data. R package version 0.1, 2. Available at: https://CRAN.R-project.org/package=RchivalTag.
Bauer R. K., Forget F., Fromentin J. M. (2015). Optimizing PAT data transmission: assessing the accuracy of temperature summary data to estimate environmental conditions. Fish Oceanogr. 24 (6), 533–539. doi: 10.1111/fog.12127
BOEM (2021). Atlantic OCS Renewable Energy (Massachusetts to South Carolina). Available at: https://www.boem.gov/sites/default/files/images/Map-of-Atlantic-OCS-renewable-energy-areas_8_13_2021.jpg.
Bologna P. A., Gaynor J. J., Barry C. L., Restaino D. J. (2017). Top-down impacts of sea nettles (Chrysaora quinquecirrha) on pelagic community structure in Barnegat Bay, New Jersey, USA. J. Coast. Res. 78, 193–204. doi: 10.2112/SI78-015.1
Brown C. W., Hood R. R., Li Z., Decker M. B., Gross T. F., Purcell J. E., et al. (2002). Forecasting system predicts presence of sea nettles in Chesapeake Bay. EOS Trans. Am. Geophys. Union. 83 (30), 321–326. doi: 10.1029/2002EO000233
Bryant E. (2007). 2D location accuracy statistics for Fastloc® cores running firmware versions 2.2 & 2.3. Wildtrack Telemetry Systems Ltd, 6.
Chambault P., Roquet F., Benhamou S., Baudena A., Pauthenet E., De Thoisy B., et al. (2017). The Gulf Stream frontal system: a key oceanographic feature in the habitat selection of the leatherback turtle? Deep Sea Res. Part I Oceanogr. Res. Pap. 123, 35–47. doi: 10.1016/j.dsr.2017.03.003
Chimienti M., Blasi M. F., Hochscheid S. (2020). Movement patterns of large juvenile loggerhead turtles in the Mediterranean Sea: Ontogenetic space use in a small ocean basin. Ecol. Evol. 10 (14), 6978–6992. doi: 10.1002/ece3.6370
DEEP (2020). Long Island Sound Trawl Survey (Connecticut, United States). Available at: https://portal.ct.gov/-/media/DEEP/fishing/fisheries_management/2020-Long-Island-Sound-Trawl-Survey.pdf.
Dodge K. L., Galuardi B., Miller T. J., Lutcavage M. E. (2014). Leatherback turtle movements, dive behavior, and habitat characteristics in ecoregions of the Northwest Atlantic Ocean. PloS One 9 (3), e91726. doi: 10.1371/journal.pone.0091726
Dodge K. L., Kukulya A. L., Burke E., Baumgartner M. F. (2018). TurtleCam: A “smart” autonomous underwater vehicle for investigating behaviors and habitats of sea turtles. Front. Mar. Sci. 90. doi: 10.3389/fmars.2018.00090
Dodge K. L., Logan J. M., Lutcavage M. E. (2011). Foraging ecology of leatherback sea turtles in the Western North Atlantic determined through multi-tissue stable isotope analyses. Mar. Biol. 158 (12), 2813–2824. doi: 10.1007/s00227-011-1780-x
Dujon A. M., Lindstrom R. T., Hays G. C. (2014). The accuracy of Fastloc-GPS locations and implications for animal tracking. Methods Ecol. Evol. 5 (11), 1162–1169. doi: 10.1111/2041-210X.12286
Eckert S. A. (2006). High-use oceanic areas for Atlantic leatherback sea turtles (Dermochelys coriacea) as identified using satellite telemetered location and dive information. Mar. Biol. 149 (5), 1257–1267. doi: 10.1007/s00227-006-0262-z
Eckert S. A., Bagley D., Kubis S., Ehrhart L., Johnson C., Stewart K., et al. (2006). Internesting and postnesting movements and foraging habitats of leatherback sea turtles (Dermochelys coriacea) nesting in Florida. Chelonian Conserv. Biol. 5 (2), 239–248. doi: 10.2744/1071-8443(2006)5[239:IAPMAF]2.0.CO;2
Evans D. R., Valverde R. A., Ordoñez C., Carthy R. R. (2021). Identification of the Gulf of Mexico as an important high-use habitat for leatherback turtles from Central America. Ecosphere 12 (8), e03722. doi: 10.1002/ecs2.3722
Faulk L. G., Smart T., Stone J. P. (2023). Temporal and spatial distribution of the cannonball jellyfish Stomolophus meleagris in the South Atlantic Bight, USA. Mar. Ecol. Prog. Ser. 717, 51–65. doi: 10.3354/meps14381
Freitas C., Lydersen C., Fedak M. A., Kovacs K. M. (2008). A simple new algorithm to filter marine mammal Argos locations. Mar. Mamm. Sci. 24 (2), 315–325. doi: 10.1111/j.1748-7692.2007.00180.x
Graham W. M., Pagès F., Hamner W. M. (2001). A physical context for gelatinous zooplankton aggregations: a review. Hydrobiologia. 451, 199–212. doi: 10.1023/A:1011876004427
Gredzens C., Shaver D. J. (2020). Satellite tracking can inform population-level dispersal to foraging grounds of post-nesting Kemp’s ridley sea turtles. Front. Mar. Sci. 7, 559. doi: 10.3389/fmars.2020.00559
Hamelin K. M., James M. C., Ledwell W., Huntington J., Martin K. (2017). Incidental capture of leatherback sea turtles in fixed fishing gear off Atlantic Canada. Aquat. Conserv.: Mar. Freshw. Ecosyst. 27 (3), 631–642. doi: 10.1002/aqc.2733
Hatch J. M., Haas H. L., Sasso C. R., Patel S. H., Smolowitz R. J. (2022). Estimating the complex patterns of survey availability for loggerhead turtles. J. Wildl. Manage. 86 (4), e22208. doi: 10.1002/jwmg.22208
Hays G. C., Hobson V. J., Metcalfe J. D., Righton D., Sims D. W. (2006). Flexible foraging movements of leatherback turtles across the North Atlantic Ocean. Ecology. 87 (10), 2647–2656. doi: 10.1890/0012-9658(2006)87[2647:FFMOLT]2.0.CO;2
Hussey N. E., Kessel S. T., Aarestrup K., Cooke S. J., Cowley P. D., Fisk A. T., et al. (2015). Aquatic animal telemetry: a panoramic window into the underwater world. Science. 348 (6240), 1255642. doi: 10.1126/science.1255642
James M. C., Eckert S. A., Myers R. A. (2005a). Migratory and reproductive movements of male leatherback turtles (Dermochelys coriacea). Mar. Biol. 147 (4), 845–853. doi: 10.1007/s00227-005-1581-1
James M. C., Myers R. A., Ottensmeyer C. A. (2005b). Behaviour of leatherback sea turtles, Dermochelys coriacea, during the migratory cycle. Proc. R. Soc B: Biol. Sci. 272 (1572), 1547–1555. doi: 10.1098/rspb.2005.3110
James M. C., Ottensmeyer C. A., Myers R. A. (2005c). Identification of high-use habitat and threats to leatherback sea turtles in northern waters: new directions for conservation. Ecol. Lett. 8 (2), 195–201. doi: 10.1111/j.1461-0248.2004.00710.x
James M. C., Sherrill-Mix S. A., Myers R. A. (2007). Population characteristics and seasonal migrations of leatherback sea turtles at high latitudes. Mar. Ecol. Prog. Ser. 337, 245–254. doi: 10.3354/meps337245
Jonsen I. D., Grecian W. J., Phillips L., Carroll G., McMahon C., Harcourt R. G., et al. (2023). aniMotum, an R package for animal movement data: Rapid quality control, behavioural estimation and simulation. Methods Ecol. Evol. 14 (3), 806–816. doi: 10.1111/2041-210X.14060
Jonsen I. D., Patterson T. A., Costa D. P., Doherty P. D., Godley B. J., Grecian W. J., et al. (2020). A continuous-time state-space model for rapid quality control of argos locations from animal-borne tags. Mov. Ecol. 8 (1), 1–13. doi: 10.1186/s40462-020-00217-7
Lascelles B., Notarbartolo Di Sciara G., Agardy T., Cuttelod A., Eckert S., Glowka L., et al. (2014). Migratory marine species: their status, threats and conservation management needs. Aquat. Conserv.: Mar. Freshw. Ecosyst. 24 (S2), 111–127. doi: 10.1002/aqc.2512
Lennox R. J., Aarestrup K., Cooke S. J., Cowley P. D., Deng Z. D., Fisk A. T., et al. (2017). Envisioning the future of aquatic animal tracking: technology, science, and application. BioScience. 67 (10), 884–896. doi: 10.1093/biosci/bix098
Limeburner R., Beardsley R. C. (1982). The seasonal hydrography and circulation over Nantucket Shoals. J. Mar. Res. 40 (S), 371–406.
Lopez R., Malardé J. P., Royer F., Gaspar P. (2013). Improving Argos doppler location using multiple-model Kalman filtering. IEEE Trans. Geosci. Remote Sens. 52 (8), 4744–4755. doi: 10.1109/TGRS.2013.2284293
Lucas C. H., Jones D. O., Hollyhead C. J., Condon R. H., Duarte C. M., Graham W. M., et al. (2014). Gelatinous zooplankton biomass in the global oceans: geographic variation and environmental drivers. Glob. Ecol. Biogeogr. 23 (7), 701–714. doi: 10.1111/geb.12169
McClintock B. T. (2017). Incorporating telemetry error into hidden Markov models of animal movement using multiple imputation. J. Agric. Biol. Environ. Stat. 22, 3, 249–269. doi: 10.1007/s13253-017-0285-6
McClintock B. T., Langrock R., Gimenez O., Cam E., Borchers D. L., Glennie R., et al. (2020). Uncovering ecological state dynamics with hidden Markov models. Ecol. Lett. 23 (12), 1878–1903. doi: 10.1111/ele.13610
McClintock B. T., London J. M., Cameron M. F., Boveng P. L. (2015). Modelling animal movement using the Argos satellite telemetry location error ellipse. Methods Ecol. Evol. 6 (3), 266–277. doi: 10.1111/2041-210X.12311
McClintock B. T., Michelot T. (2018). momentuHMM: R package for generalized hidden Markov models of animal movement. Methods Ecol. Evol. 9 (6), 1518–1530. doi: 10.1111/2041-210X.12995
National Marine Fisheries Service (NMSF) Southeast Fisheries Science Center (SEFSC). (2008). Sea turtle research techniques manual. NOAA Technical Memorandum NMFS-SEFSC - Report Vol. 579 (Washington, D.C: NOAA).
Neath A. A., Cavanaugh J. E. (2012). The Bayesian information criterion: background, derivation, and applications. Wiley Interdiscip. Rev. Comput. Stat. 4 (2), 199–203. doi: 10.1002/wics.199
NMFS, USFWS. (2020). Endangered Species Act status review of the leatherback turtle (Dermochelys coriacea). (Washington, D. C.: National Marine Fisheries Service Office of Protected Resources and U.S. Fish and Wildlife Service).
Okuyama J., Benson S. R., Dutton P. H., Seminoff J. A. (2021). Changes in dive patterns of leatherback turtles with sea surface temperature and potential foraging habitats. Ecosphere. 12 (2), e03365. doi: 10.1002/ecs2.3365
Rabon D. R. Jr., Johnson S. A., Boettcher R., Dodd M., Lyons M., Murphy S., et al. (2003). Confirmed leatherback turtle (Dermochelys coriacea) nests from North Carolina, with a summary of leatherback nesting activities north of Florida. Mar. Turtle Newsletter. 101, 4–8.
Sasso C. R., Richards P. M., Benson S. R., Judge M., Putman N. F., Snodgrass D., et al. (2021). Leatherback turtles in the eastern Gulf of Mexico: foraging and migration behavior during the Fall and Winter. Front. Mar. Sci. 8, 443. doi: 10.3389/fmars.2021.660798
Sexton M. A. (2012). Factors influencing appearance, disappearance, and variability of abundance of the sea nettle Chrysaora quinquecirrha in Chesapeake Bay. Doctoral Dissertation (Maryland: University of Maryland, College Park).
Skjoldal H. R., Sherman K. (Eds.) (2002). Large marine ecosystems of the North Atlantic: changing states and sustainability (Amsterdam, The Netherlands: Elsevier).
Stewart K. R., James M. C., Roden S., Dutton P. H. (2013). Assignment tests, telemetry and tag-recapture data converge to identify natal origins of leatherback turtles foraging in Atlantic Canadian waters. J. Anim. Ecol. 82 (4), 791–803. doi: 10.1111/1365-2656.12056
Stewart K. R., LaCasella E. L., Roden S. E., Jensen M. P., Stokes L. W., Epperly S. P., et al. (2016). Nesting population origins of leatherback turtles caught as bycatch in the US pelagic longline fishery. Ecosphere. 7 (3), e01272. doi: 10.1002/ecs2.1272
Stewart K. R., Martin K. J., Johnson C., Desjardin N., Eckert S. A., Crowder L. B. (2014). Increased nesting, good survival and variable site fidelity for leatherback turtles in Florida, USA. Biol. Conserv. 176, 117–125. doi: 10.1016/j.biocon.2014.05.008
Turtle Expert Working Group (TEWG) (2007). An assessment of the leatherback turtle population in the Atlantic Ocean. NOAA Technical Memorandum NMFS-SEFSC-555, 116 p.
Vogel E. F., Biuw M., Blanchet M. A., Jonsen I. D., Mul E., Johnsen E., et al. (2021). Killer whale movements on the Norwegian shelf are associated with herring density. Mar. Ecol. Prog. Ser. 665, 217–231. doi: 10.3354/meps13685
Wallace B. P., Zolkewitz M., James M. C. (2015). Fine-scale foraging ecology of leatherback turtles. Front. Ecol. Evol. 15. doi: 10.1515/9780889774094
Winton M. V., Fay G., Haas H. L., Arendt M., Barco S., James M. C., et al. (2018). Estimating the distribution and relative density of satellite-tagged loggerhead sea turtles using geostatistical mixed effects models. Mar. Ecol. Prog. Ser. 586, 217–232. doi: 10.3354/meps12396
Witt M. J., Åkesson S., Broderick A. C., Coyne M. S., Ellick J., Formia A., et al. (2010). Assessing accuracy and utility of satellite-tracking data using Argos-linked Fastloc-GPS. Anim. Behav. 80 (3), 571. doi: 10.1016/j.anbehav.2010.05.022
Keywords: satellite telemetry, leatherback turtle, movement ecology, foraging, migration, Mid-Atlantic Bight, continental shelf, endangered species
Citation: Rider MJ, Avens L, Haas HL, Hatch JM, Patel SH and Sasso CR (2024) Where the leatherbacks roam: movement behavior analyses reveal novel foraging locations along the Northwest Atlantic shelf. Front. Mar. Sci. 11:1325139. doi: 10.3389/fmars.2024.1325139
Received: 20 October 2023; Accepted: 02 January 2024;
Published: 20 February 2024.
Edited by:
Nuno Queiroz, Centro de Investigacao em Biodiversidade e Recursos Geneticos (CIBIO-InBIO), PortugalReviewed by:
Zachary Siders, University of Florida, United StatesLuis Cardona, University of Barcelona, Spain
Copyright © 2024 Rider, Avens, Haas, Hatch, Patel and Sasso. This is an open-access article distributed under the terms of the Creative Commons Attribution License (CC BY). The use, distribution or reproduction in other forums is permitted, provided the original author(s) and the copyright owner(s) are credited and that the original publication in this journal is cited, in accordance with accepted academic practice. No use, distribution or reproduction is permitted which does not comply with these terms.
*Correspondence: Mitchell J. Rider, bWl0Y2hlbGwucmlkZXJAZWFydGgubWlhbWkuZWR1