 Xi Wu1,2,3
 Xiaolong Yuan3Xiaoqing Liu1
 Xingzhou Wang1
 Zhuo Chen1
 Ting Gu1
 Guicheng Zhang3,4Xun Gong1
 Jun Sun1,3,4*
- 1Institute for Advanced Marine Research, China University of Geosciences, Guangzhou, China
- 2Shenzhen Guanghuiyuan Environment Water Co., Ltd., Shenzhen, China
- 3Tianjin Key Laboratory of Marine Resources and Chemistry, Tianjin University of Science and Technology, Tianjin, China
- 4Research Centre for Indian Ocean Ecosystem, Tianjin University of Science and Technology, Tianjin, China
The Eastern Indian Ocean (EIO) is an ideal region to explore the variability and controlling mechanisms of the seawater carbonate system and their potential influence on global climate change due to the distinctive environmental features, while studies in the EIO is far from sufficient. The spatiotemporal distributions of pH, dissolved inorganic carbon (DIC), alkalinity (Alk), and partial pressure of carbon dioxide (pCO2) were investigated in the EIO during autumn 2020 and spring 2021. The respective quantitative contributions of different controlling processes to DIC were further delineated. Significant seasonal variations were observed in the study area. Overall, the surface pH was lower and DIC, Alk, and pCO2 were higher during spring 2021 than during autumn 2020. The pH generally decreased from east to west during autumn 2020, whereas it decreased from north to south during spring 2021. The low values of DIC and Alk that were detected in the Bay of Bengal in these two seasons were mainly attributed to the influence of river inputs. Coastal upwelling during monsoon periods led to higher pCO2 and DIC values near Sumatra and Sri Lanka during spring 2021. The relationships of carbonate system parameters with different types of nutrients and different sized chlorophyll-a in the two seasons indicated the shifts of nutrients utilized by the phytoplankton, and phytoplankton species dominated the carbonate system variabilities. In vertical profiles, carbonate system parameters showed strong correlations with other physical and biogeochemical parameters, and these correlations were more robust during spring 2021 than during autumn 2020. The average sea–air flux of CO2 was 10.00 mmol m−2 d−1 during autumn 2020 and was 16.00 mmol m−2 d−1 during spring 2021, which revealed that the EIO served as a CO2 source during the study period. In addition, the separation of different controlling processes of DIC indicated stronger mixing processes, less CaCO3 precipitation, more intensive sea–air exchange, and weaker photosynthesis during spring 2021 than during autumn 2020.
1 Introduction
The ocean carbon cycle is an essential part of the global carbon cycle and is a critical process in responding to global climate change (Palevsky and Doney, 2021; Friedlingstein et al., 2022; Wu et al., 2023). According to the Intergovernmental Panel on Climate Change Sixth Assessment Report, atmospheric carbon dioxide (CO2) concentrations have reached 410 ppm, which is nearly 50% higher than the preindustrial level of 280 ppm (https://www.ipcc.ch/ar6-syr/). The additional CO2 caused by anthropogenic activities, including burning fossil fuels, industrial production, and land-use change (Houghton, 1995; Le Quéré et al., 2014; Li et al., 2023), is partly absorbed by oceans, leading to increases in seawater inorganic carbon levels, reductions in pH, and alterations in the acid–base chemistry of surface seawaters (Doney et al., 2020; Xue et al., 2021; Qi et al., 2022). Therefore, studies on changes in the seawater carbonate system play an important role in accurately projecting future atmospheric CO2 levels and global climate change (Takahashi et al., 2009; Deng et al., 2021; Na et al., 2024).
The Eastern Indian Ocean (EIO) is dominated by seasonal monsoons and presents distinct stratification in the upper layers, which prevents the upward transport of nutrients from the deep layers and further results in oligotrophic conditions of the surface seawater (Prasanna Kumar et al., 2009). The EIO exhibits a high surface sea temperature (>28°C) year-round, which forms a major part of the warm pool (Vinayachandran and Shetye, 1991). Another feature of the EIO is the year-round dust deposition from the Nubian Desert, the Arabian Peninsula, Iran, Pakistan, Afghanistan, and North West India (Léon and Legrand, 2003). Furthermore, the Bay of Bengal (BoB) in the EIO is characterized by an extensive oxygen minimum zone and shows low biological productivity (Qasim, 1977; Paulmier and Ruiz-Pino, 2009). Each of these factors, alone and in combination, have various effects on the seawater carbonate system and ultimately on the global carbon cycle. Therefore, the EIO is an ideal region to explore the changes in the seawater carbonate system, the factors responsible for the variations, and their potential influence on global climate change.
Despite several national or international programs, including the Joint Global Ocean Flux Study (JGOFS), World Ocean Circulation Experiment (WOCE), and the NOAA Ocean–Atmosphere Carbon Exchange Study (OACES), proceeding across the world oceans since the 1990s (Sabine et al., 2000; Key et al., 2004; Bates et al., 2006), the distributions of inorganic carbon parameters and their controlling processes in the EIO, as well as the role of the EIO in the global carbon cycle, have been largely neglected compared to those in the Pacific and Atlantic oceans (Feely et al., 2006; Bates, 2007; Sutton et al., 2017; Cai et al., 2020; Curbelo-Hernández et al., 2021). In addition to these programs, Xue et al. (2014) recently reported partial pressure of carbon dioxide (pCO2) data collected in the eastern equatorial Indian Ocean (5°N–5°S, 90–95°E), Sarma et al. (2015; 2018) studied the controlling factors of dissolved inorganic carbon (DIC) and the sources and sinks of CO2 along the west coast of the BoB during the 2010s, and Sarma et al. (2023a) evaluated the contributions of chromophoric dissolved organic matter to DIC as organic alkalinity (Alk) through the investigation of 18 Indian estuaries. Furthermore, other studies in this region have been conducted based on model results, which may not sufficiently reflect the actual situation and thereby require additional observational data to support the conclusions reached (Joshi et al., 2020; Chakraborty et al., 2021). Therefore, additional observational efforts are essential to effectively monitor carbonate system parameters.
To overcome the limitations of the coarse resolution and outdated observational data available, in this study, we investigated the horizontal and vertical distributions of carbonate system parameters and the sea–air fluxes of CO2 in the EIO in different seasons (autumn 2020 and spring 2021). We further analyzed the possible influencing factors and quantified the contributions of different processes to the observed variation using statistical models. This study is expected to provide insight into how the unique environmental characteristics in the EIO affect the distributions of carbonate system parameters, which can highlight the broader role of the EIO in global carbon cycling.
2 Materials and methods
2.1 Study area
The Indian Ocean, surrounded by India, Africa, Antarctica, and Australia, is the third largest ocean in the world. The total area of the ocean is 7.056 × 10⁷ km2, and the average water depth is 3,872.4 m. The study area covers the region from 80°E to 95°E and from 15°S to 15°N in the EIO (Figures 1A, B). The northernmost border of the study area is the BoB, which is the world’s largest bay and is substantially discharged by rivers from India, Bangladesh, and Myanmar, including the Ganges River, Brahmaputra Rivers, Irrawaddy River, and Krishna River. The study area is affected by complicated water currents, including the Wyrtki Jets (WJ), the South Equatorial Current (SEC), the South Equatorial Counter Current (SECC), the South Java Current (SJC), the Northeast Monsoon Current (NMC) in winter, and the Southwest Monsoon Current (SMC) in summer, as shown in Figure 1C.
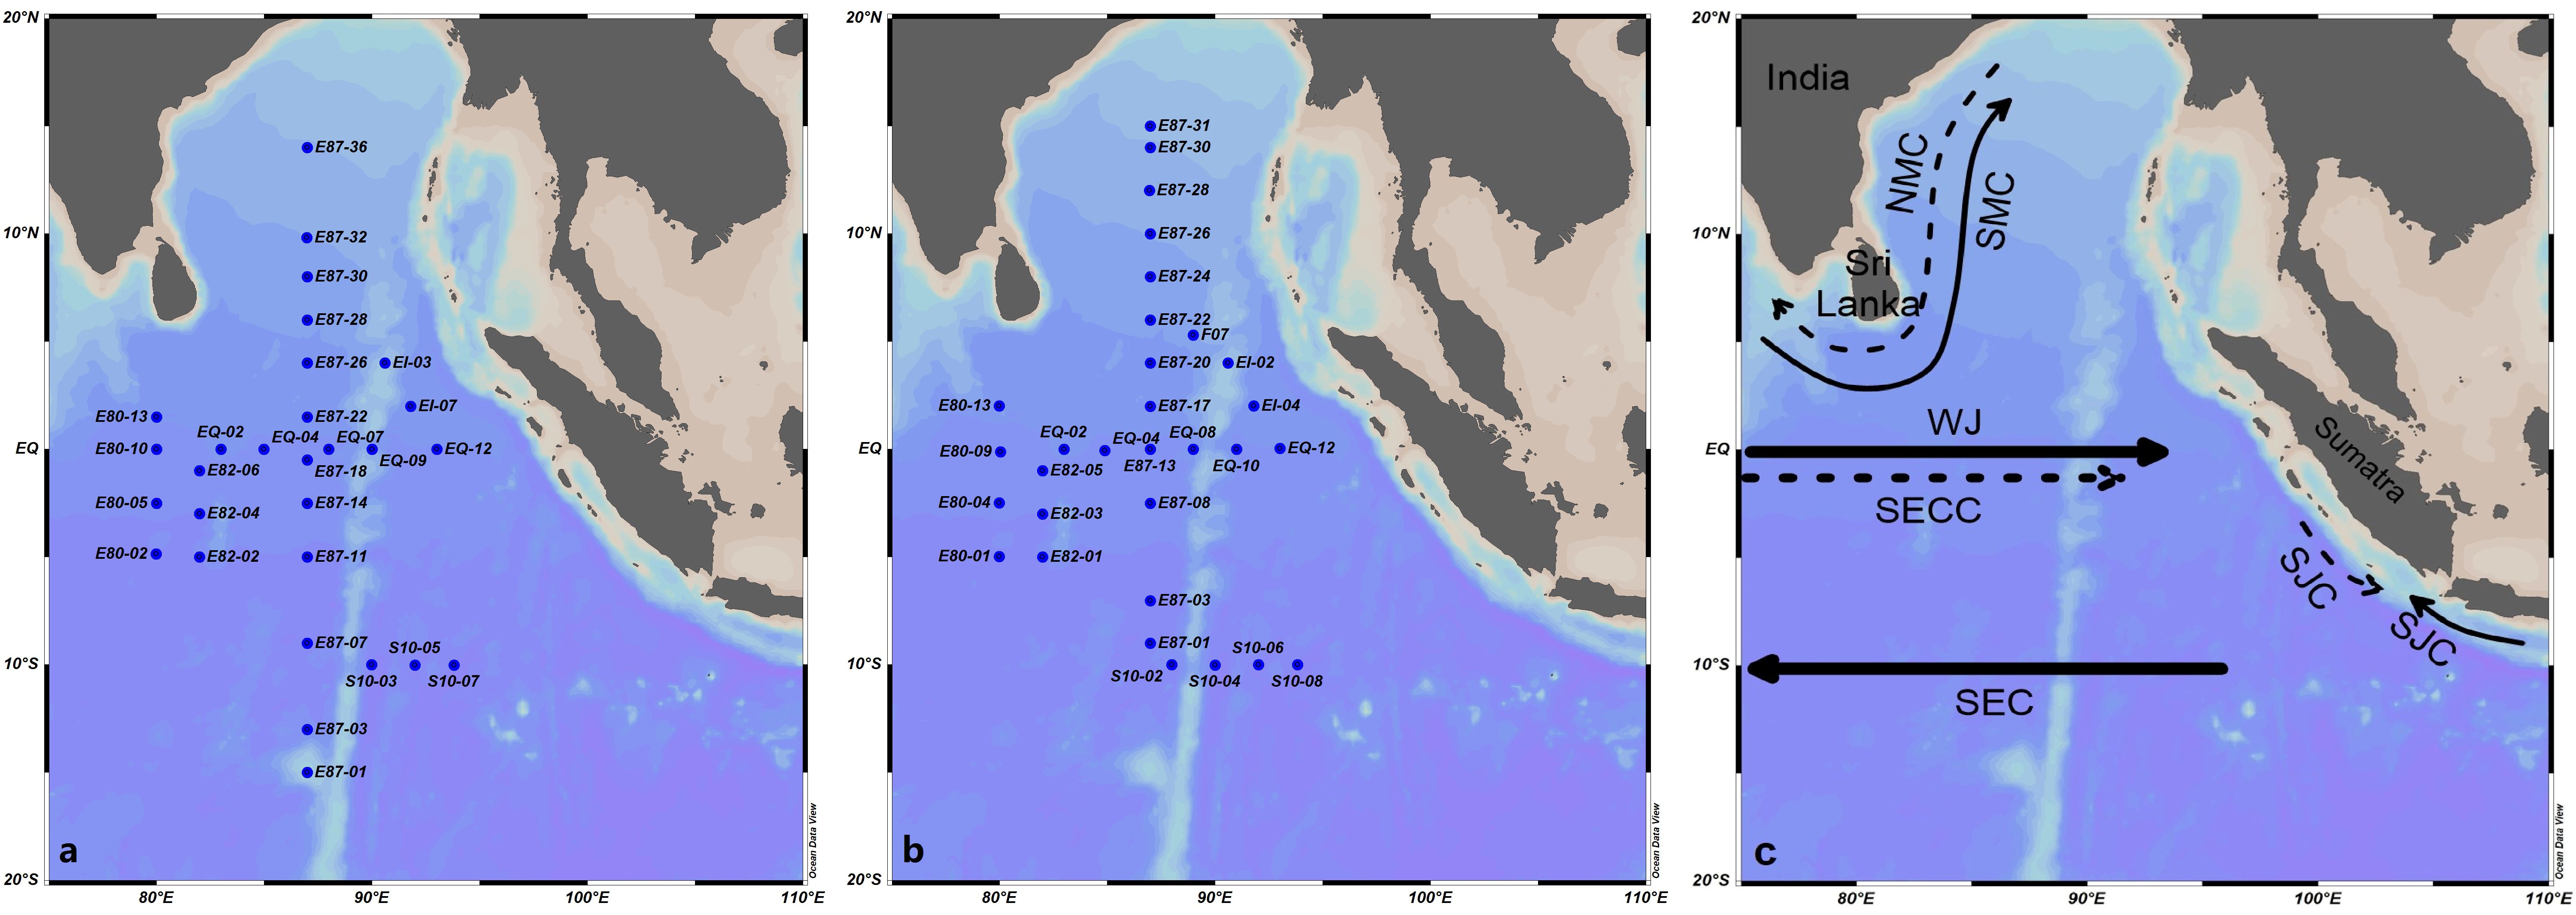
Figure 1 Locations of the sampling stations in the EIO during autumn 2020 (A) and spring 2021 (B) and major features of the surface circulation (C) in the EIO. Current systems included are the Southwest Monsoon Current (SMC), Northeast Monsoon Current (NMC), Wyrtki Jets (WJs), South Equatorial Countercurrent (SECC), South Java Current (SJC), and South Equatorial Current (SEC). Solid (dashed) line represents currents prevailing in the summer (winter). SEC lasts all year round. The strength of currents is indicated by the thickness of each line.
2.2 Sampling
Two cruises were conducted aboard the R/V “Shi Yan 3” in the EIO from 27 September to 6 November 2020 (autumn) and from 28 April to 5 June 2021 (spring). The autumn cruise covered 29 grid stations and two transects, and the spring cruise comprised 31 grid stations and two transects (Figures 1A, B). Seawater samples were collected using 12-L Niskin bottles equipped with an SBE 911 plus a conductivity–temperature–depth (CTD) sensor (Sea-Bird Electronics, Inc., USA). Temperature and salinity data were obtained from the CTD sensor. The sampling procedures were performed immediately to minimize gas escape. Dissolved oxygen (DO), pH, DIC, and Alk were sampled sequentially using the same gas-sampling method; samples used for DIC and Alk measurements were then poisoned with 100 µL of a saturated HgCl2 solution. DO and pH were measured on-board, while DIC and Alk samples were stored at 4°C and measured within 30 days after returning to the lab. Wind speed was measured at a height 10 m above the sea surface using the AWS 2700 Weather Station (Aanderaa Data Instruments, Norway).
2.3 Analytical methods
DO was measured following the Winkler method (Dickson, 1994). pH was determined using a SevenCompact S210-K pH meter equipped with an Inlab Expert Pro pH electrode (Mettler Toledo, Switzerland), calibrated according to the NBS scale. Precision levels were about ±0.01. DIC was measured by an AS-D1 DIC Analyzer (Apollo SciTech, USA), and Alk was determined by the Gran titration method using a Titrator Excellence T5 equipped with a DGi111-SC combined glass pH electrode (Mettler Toledo, Switzerland). The precisions of DIC and Alk measurements were higher than 1‰ and certified reference materials (Batch #187 with DIC of 2002.85 ± 0.40 µmol kg−1 and Alk of 2,204.98 ± 0.37 µmol kg−1) produced by the laboratory of A.G. Dickson (Scripps Institution of Oceanography, San Diego, CA, USA) were used for calibration. pCO2 was calculated from pH and Alk by using CO2SYS software (version 2.1, Lewis and Wallace, 1998) with equilibrium constants proposed by Mehrbach et al. (1973) and refitted by Dickson and Millero (1987). Quality tests were run by comparing the calculated pH from Alk and DIC with its measured NBS value.
For chlorophyll a (Chl-a) analysis, 1 L of seawater was successively vacuum filtered (<0.05 MPa) through a 20-µm pore-size mesh, a 2-µm pore-size mixed cellulose ester membrane, and Whatman GF/F filters (all diameters are 25 mm), which represent microplankton, nanoplankton, and picoplankton fractions, respectively. The filters were soaked in 5 mL of 90% acetone and stored in the dark at −20°C. After 24 h, Chl-a concentration was measured using a Trilogy Laboratory Fluorometer (Turner Designs Inc., USA) according to the procedure described by Parsons et al. (1984). The seawater samples for nutrients (PO43−, SiO32−, NO3−, NO2−, and NH4+) were measured using a Technicon AutoAnalyzer 3 (Bran+Luebbe, Germany) according to the method of Strickland and Parsons (1972).
2.4 Sea–air fluxes of CO2 calculation
The net sea–air CO2 exchange flux (F) was calculated based on the formula:
where KH is the solubility of CO2 (Weiss, 1974), and ΔpCO2 is the difference between the pCO2 of seawater and air. Gas transfer velocity k is calculated according to the Wanninkhof (2014) empirical function of short-term wind speed; u is the field-measured wind speed at 10 m height; Sc is the Schmidt number for CO2 (a function of water temperature) as calculated by Wanninkhof (2014).
The pCO2 in the air was calibrated according to the atmospheric pressure and corrected to 100% humidity at in situ seawater surface temperature (T) and salinity (S) through the following equation (Dickson and Goyet, 1994):
where Pair is atmospheric pressure, Pwater is saturated water vapor pressure calculated according to the Weiss and Price (1980) formula, and xCO2(air) is set as 406.30 ppm in October 2020 and 408.13 ppm in May 2021, which are the values of the closest atmospheric CO2 station (BKT, Bukit Kototabang, Indonesia) to the study area during the study period.
2.5 Calculations for separating DIC controlling processes
The difference between the measured values of DIC and Alk and the theoretical values of the linear regression of DIC and Alk with salinity (Figure 2), expressed by ΔDIC and ΔAlk, respectively, was calculated according to following formulas:
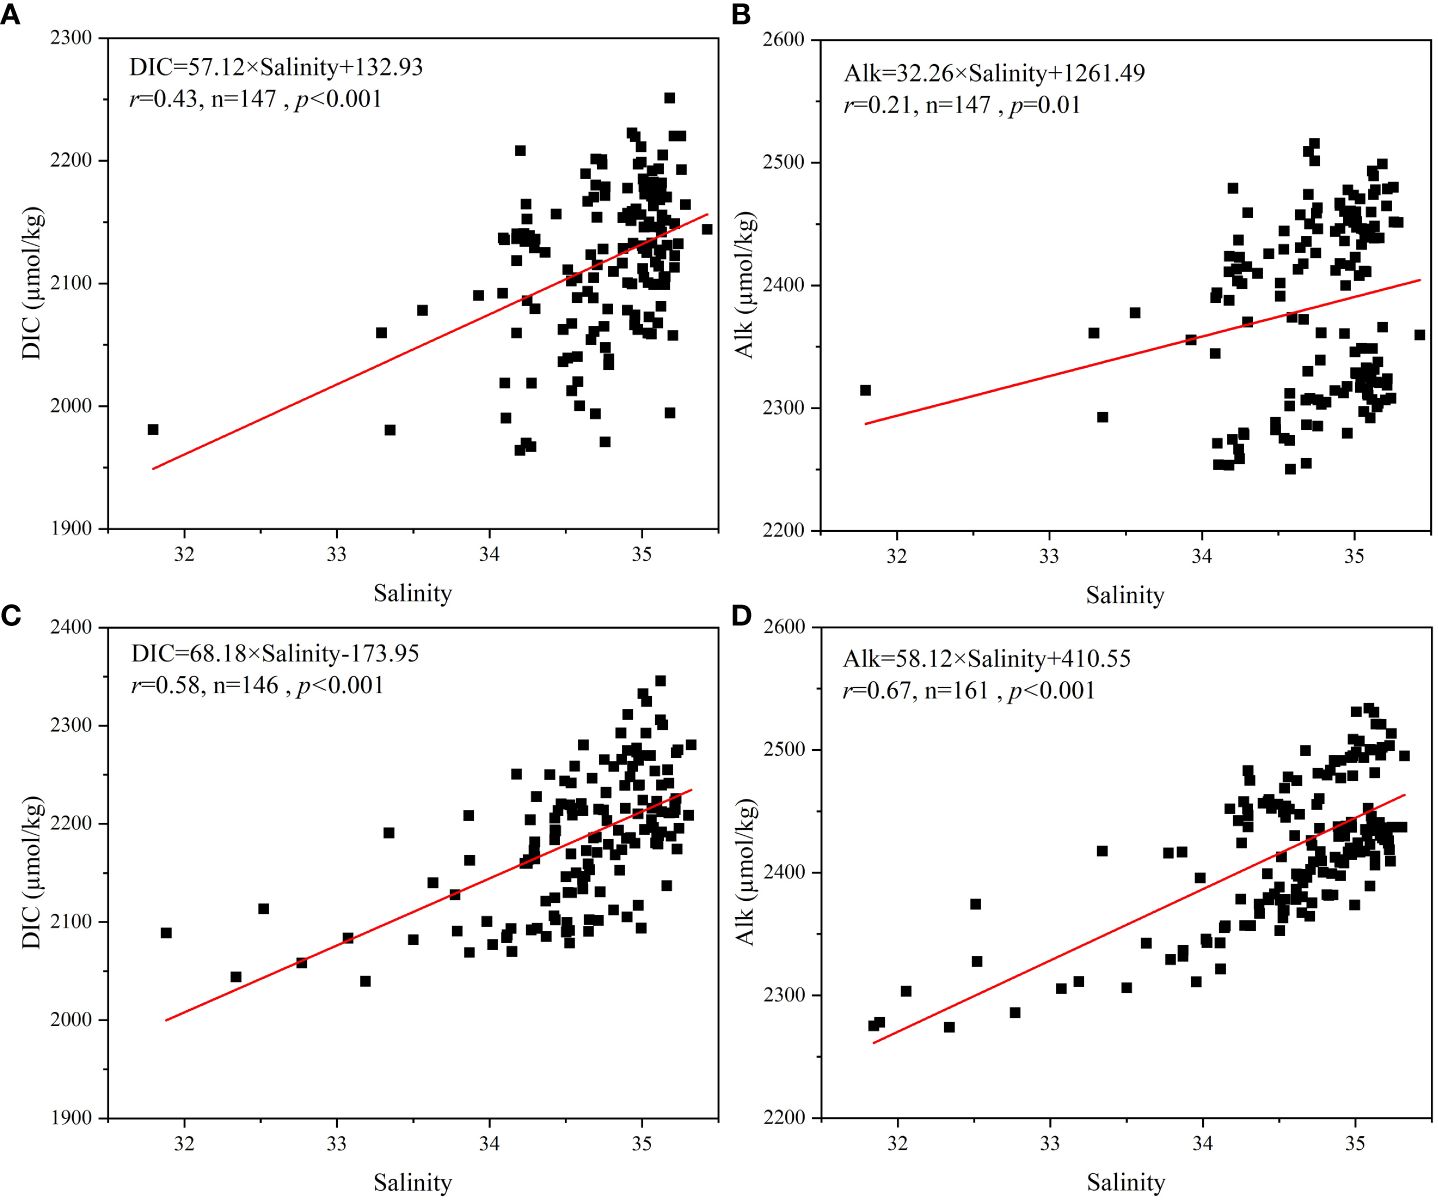
Figure 2 Relationship between DIC and Alk vs. salinity during autumn 2020 (DIC: A; Alk: B) and spring 2021(DIC: C; Alk: D).
where positive values indicate processes inputting additional DIC and Alk and negative values indicate processes consuming DIC and Alk. The absolute values of ΔDIC also represent the intensity of mixing processes; if the mixing is stronger, the measured DIC will be closer to the theoretical DIC value and thus the absolute values of ΔDIC will be lower. Large absolute values of ΔDIC indicate the effects of other processes (such as CaCO3 precipitation–dissolution, biological processes, and sea–air exchange) besides mixing processes.
In the case that the endmember salinity in our study area was not sufficiently low to obtain the regression equations, theoretical data obtained in our study were compared with those calculated using equations from Sarma et al. (2018), in which the study area was taken as the coastal waters off Visakhapatnam (India) in the western BoB and the endmember salinity is 23. This comparison was used to confirm the reliability of the theoretical data obtained in our study.
According to the composition of ΔDIC and ΔAlk, these parameters can be expressed as:
where ΔDICp-d, ΔDICbio, and ΔDICa-s represent DIC changes caused by CaCO3 precipitation–dissolution, biological, and sea–air exchange processes, respectively; ΔAlkp-d and ΔAlkbio represent Alk changes caused by the processes of CaCO3 precipitation–dissolution and biological processes, respectively; and −17/106 × ΔDICbio is the expected Alk change during the biological use or release of DIC assuming the Redfield ratio (Redfield et al., 1963). Considering that the change in Alk from biological processes is relatively minor compared to changes in DIC, the biological term was ignored in practice according to previous studies (Xue et al., 2016; Li et al., 2022; Zhang and Hu, 2023).
Since CaCO3 precipitation removes DIC and Alk at a 1:2 ratio, the relationship can be expressed as
In addition,
where F is the sea–air fluxes of CO2, t is the cruise period, ρ is the seawater density, and MLD is the mixed layer depth.
Thus,
3 Results
3.1 Hydrographical characteristics of the study area
The temperature of the surface seawater of the EIO ranged from 26.02°C to 29.46°C with an average value of 28.77°C during autumn 2020, while it varied from 28.04°C to 31.64°C with a mean of 29.99°C during spring 2021. The overall temperatures during autumn 2020 were lower than those recorded during spring 2021, although a trend of decreasing temperature from north to south was detected in both seasons (Supplementary Figure S1). The salinity of the surface seawater presented an opposite increasing trend from north to south during both seasons; these values were in a similar range during autumn 2020 (31.79–35.04) and spring 2021 (31.84–34.87), with averages of 34.29 and 34.04, respectively. Low salinity values emerged in the BoB due to riverine inputs.
In the upper 200 m of transect E87, the temperature generally decreased with increasing depth during both seasons (Supplementary Figure S2); however, the temperature during autumn 2020 (13.02–29.44°C) was in a narrower range compared to that measured during spring 2021(12.40–31.64°C). Below 75 m, the temperatures in the northern stations were lower than those in the southern stations for the same depth during autumn 2020, whereas the opposite pattern appeared during spring 2021. Salinity during both seasons was homogeneous in the upper 200 m except at stations in the BoB. Furthermore, the riverine inputs had more extensive penetration in latitudes and depths during spring 2021. Salinity were in the ranges of 31.79–35.43 and 31.84–35.22 during autumn 2020 and spring 2021, respectively. The MLD during autumn 2020 was deeper than that during spring 2021, with averages of 66 and 34 m, respectively. Nevertheless, the MLD of the northern stations (especially in the BoB) was shallower than that of the southern stations during both seasons.
At transect EQ, the distributions of both temperature and salinity presented similar patterns in the two seasons. Specifically, the temperature decreased and the salinity increased with increasing depth in the upper 200 m (Supplementary Figure S2). In addition, salinity in the eastern stations was lower than that in the western stations for the same depth above 100 m. During autumn 2020, temperature and salinity were in the ranges of 12.74–29.23°C and 34.30–35.28, respectively, whereas during spring 2021, they were in the ranges of 14.11–30.40°C and 33.98–35.32, respectively. The average MLD was 76 m for both seasons. In addition, the MLD was relatively stable along transect EQ during both seasons, except for a relatively shallow depth detected in the middle of the transect.
3.2 Horizontal distributions of seawater carbonate system parameters during autumn 2020 and spring 2021
During autumn, the pH of the surface seawater of the EIO ranged from 8.11 to 8.23 with an average value of 8.15. The pH generally decreased from east to west; the maximum pH value occurred at the easternmost station EQ-12 and the minimum was observed near the middle of the study area (the intersection of 87°E and the Equator). The values of DIC and Alk were in the ranges of 1,964–2,197 and 2,205–2,501 µmol kg−1, with averages of 2,066 and 2,350 µmol kg−1, respectively. Both DIC and Alk presented higher values in the northern hemisphere than in the southern hemisphere. The maxima of DIC and Alk both occurred at the northwest station E80-13, while the minimum DIC value was observed in the southernmost station S10-03 and the lowest Alk level was observed at the southwest station E80-2. pCO2 varied from 385 to 503 µatm, with a mean of 453 µatm. pCO2 values decreased gradually from west to east, which was opposite to the pattern observed for pH. The highest and lowest pCO2 occurred at the westernmost station E80-13 and the easternmost station EQ-12, respectively, which were both located near the Equator (Figure 3).
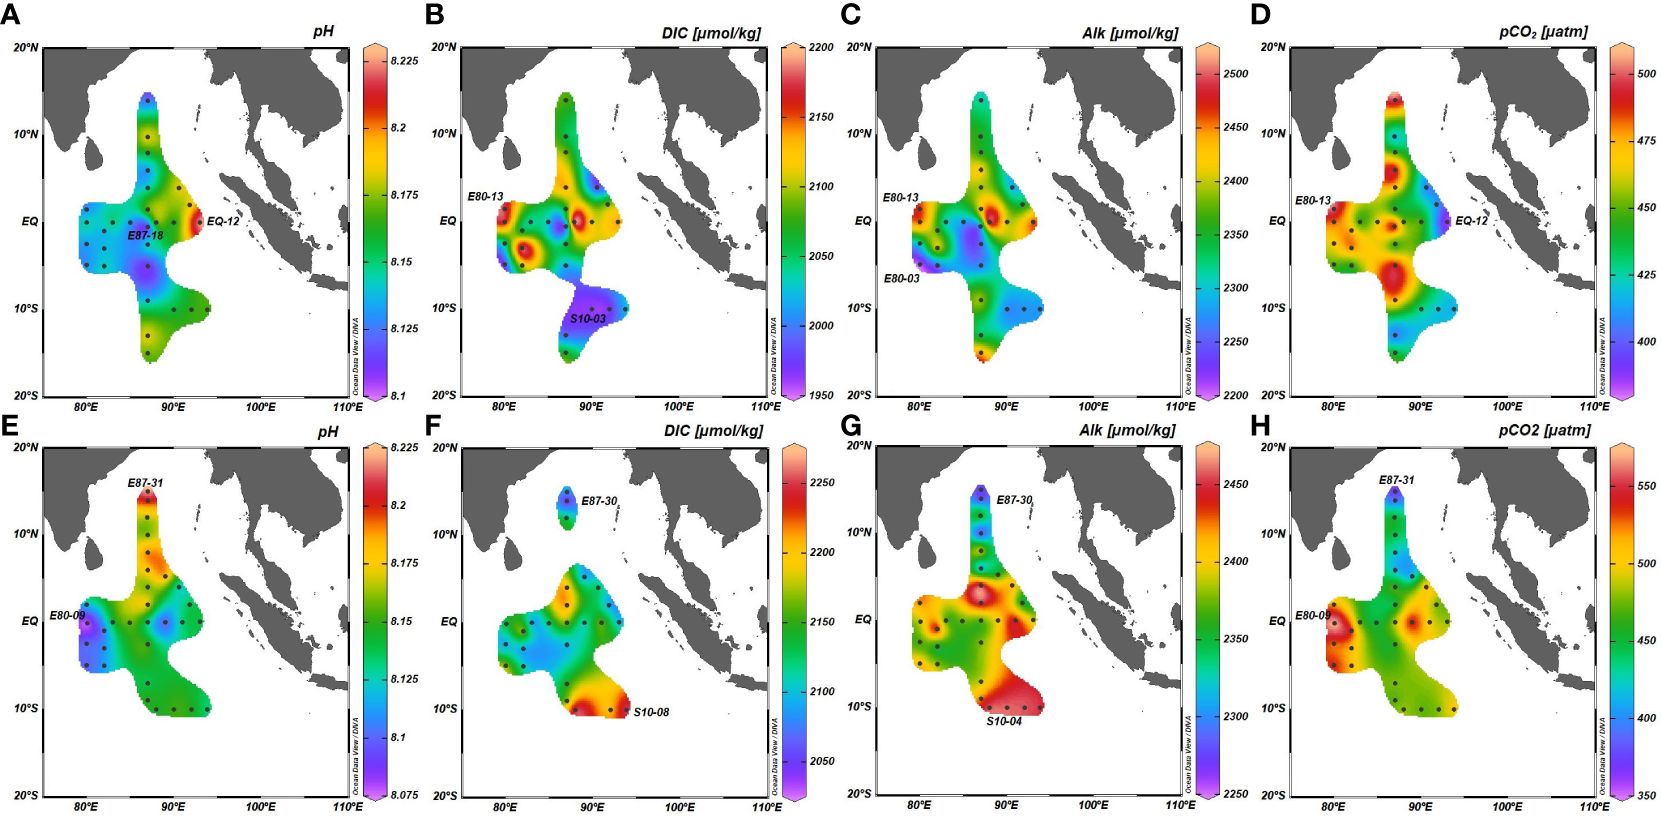
Figure 3 Horizontal distributions of pH, DIC, Alk, and pCO2 in the surface seawater of the EIO during autumn 2020 (A–D) and spring 2021 (E–H).
The pH of the surface seawater of the EIO during spring ranged from 8.08 to 8.22 with an average value of 8.14. The pH generally decreased from north to south and presented high values in the BoB (maximum at station E87-31) and low values in the west of the study area (minimum at station E80-09). The values of DIC and Alk were in the ranges of 2,044–2,251 and 2,274–2,460 µmol kg−1, with averages of 2,140 and 2,390 µmol kg−1, respectively. Both DIC and Alk showed low values in the BoB (minima at station E87-30), which was again opposite to the pattern observed for pH. High values were observed in the southernmost of the study area: the maximum DIC at station S10-08 and the maximum Alk at station S10-04. pCO2 varied from 372 to 572 µatm, with a mean of 478 µatm. pCO2 increased from north to south with the maximum observed at station E80-09 and the minimum observed at station E87-31, which was again exactly opposite to the pH distribution pattern (Figure 3).
3.3 Vertical profiles of seawater carbonate system parameters during autumn 2020 and spring 2021
At transect E87, the pH generally decreased from 8.23 to 7.68 with increasing depth in the upper 200 m during autumn. In addition, the pH in the north was lower than that in the south at the same depth below 50 m and the minimum pH occurred at the 200-m depth of station E87-36. Conversely, pCO2 increased with depth and from south to north with a range of 345–1,424 µatm, which was opposite to the pattern observed for pH. DIC presented low values at the surface layer and high values below 25 m except at the 75- to 125-m depth in the southern hemisphere. DIC concentrations varied from 1,970 to 2,223 µmol kg−1 with the maximum observed at the 100-m depth of station E87-30 and the minimum observed at the 5-m depth of station E87-18. Alk was generally elevated with depth but presented comparatively low values between 5°S and the Equator from the surface to 200- m depth. Alk values ranged from 2,254 to 2,509 µmol kg−1, with a maximum observed at the 50-m depth of station E87-03 and the minima observed at the 5-m depth of station E87-14 and at the 25-m depth of station E87-11 (Figure 4, Supplementary Figure S3).
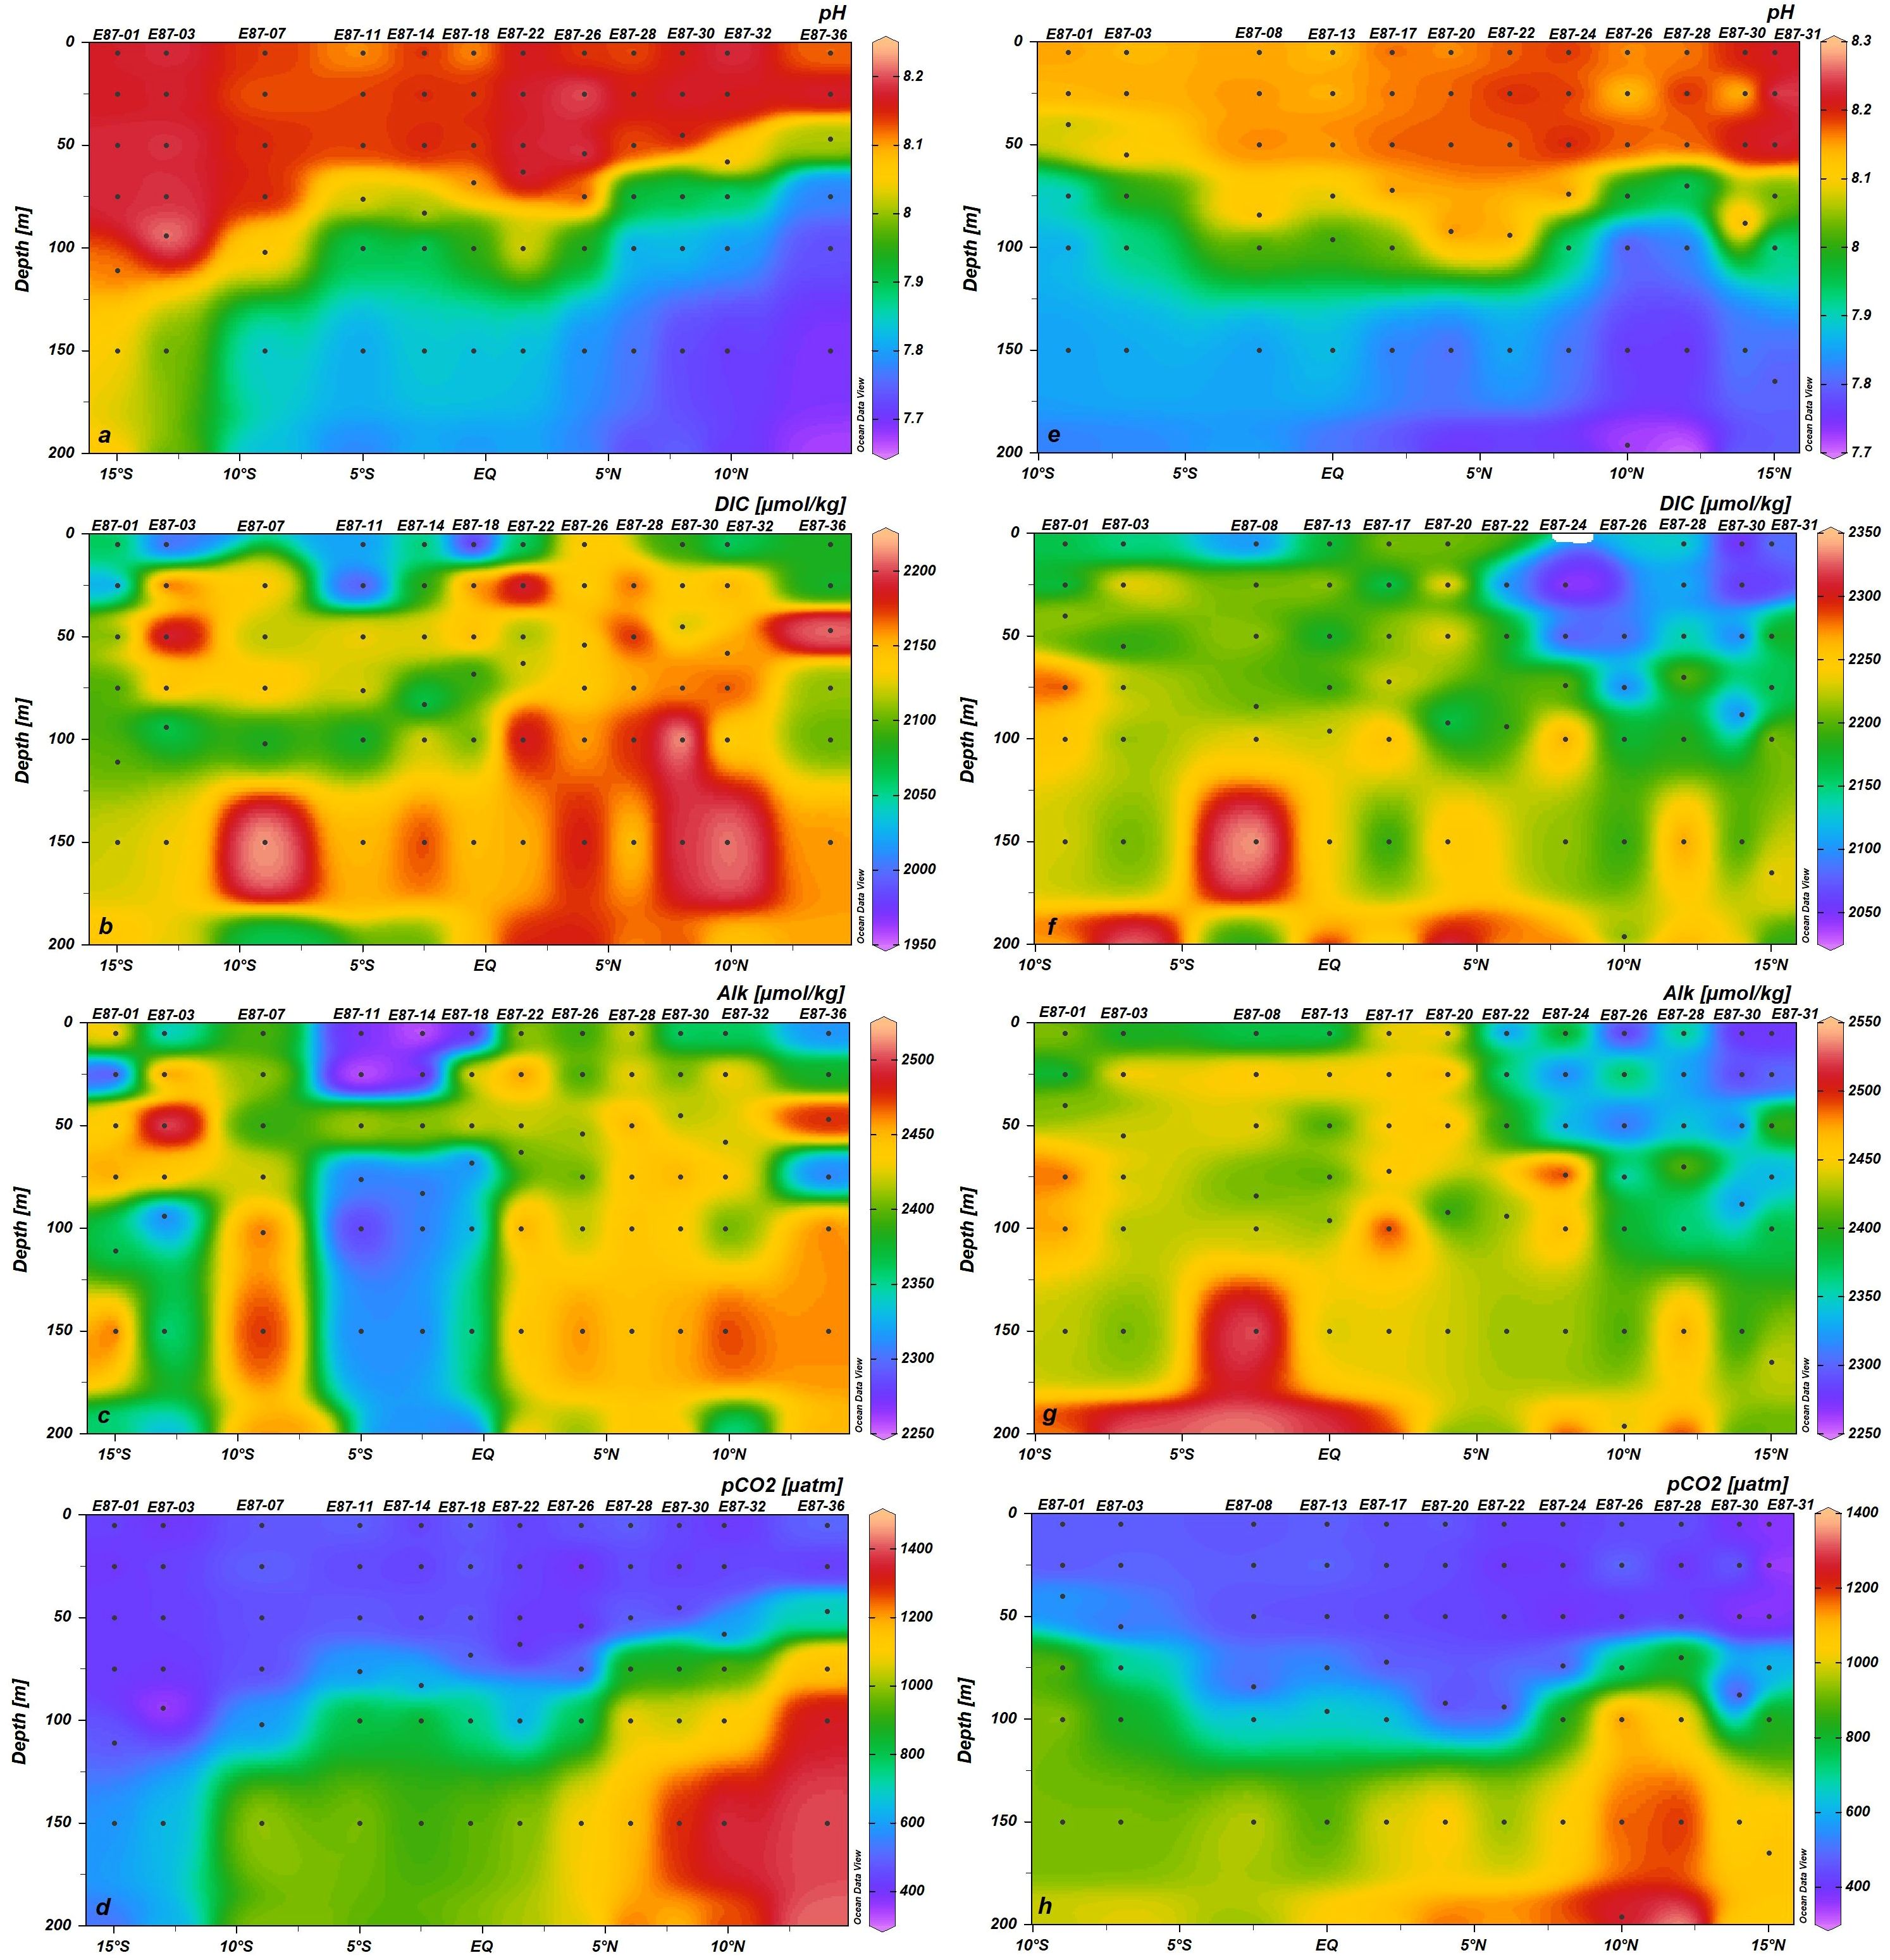
Figure 4 Vertical profiles of pH, DIC, Alk, and pCO2 in the upper 200 m at transect E87 of the EIO during autumn 2020 (A–D) and spring 2021 (E–H).
At transect EQ during autumn, the pH ranged from 7.79 to 8.24 and decreased from the surface to the 200-m depth with the minimum at 200 m of station E80-10. DIC varied from 1,995 to 2,251 µmol kg−1 and presented low values at the 50–100 m depth range; relatively high values were observed below the 100-m depth with the maximum observed at the 150-m depth of station EQ-02. Alk showed relatively low values in the middle layers west of 87°E. The maximum value (2,516 µmol kg−1) was observed at the 25-m depth of station EQ-07 and the minimum value (2,250 µmol kg−1) was observed at the 75-m depth of station EQ-02. pCO2 was in the range of 349–1,033 µatm and also presented opposite distribution patterns to those of pH, which was consistent with transect E87 (Figure 5, Supplementary Figure S4).
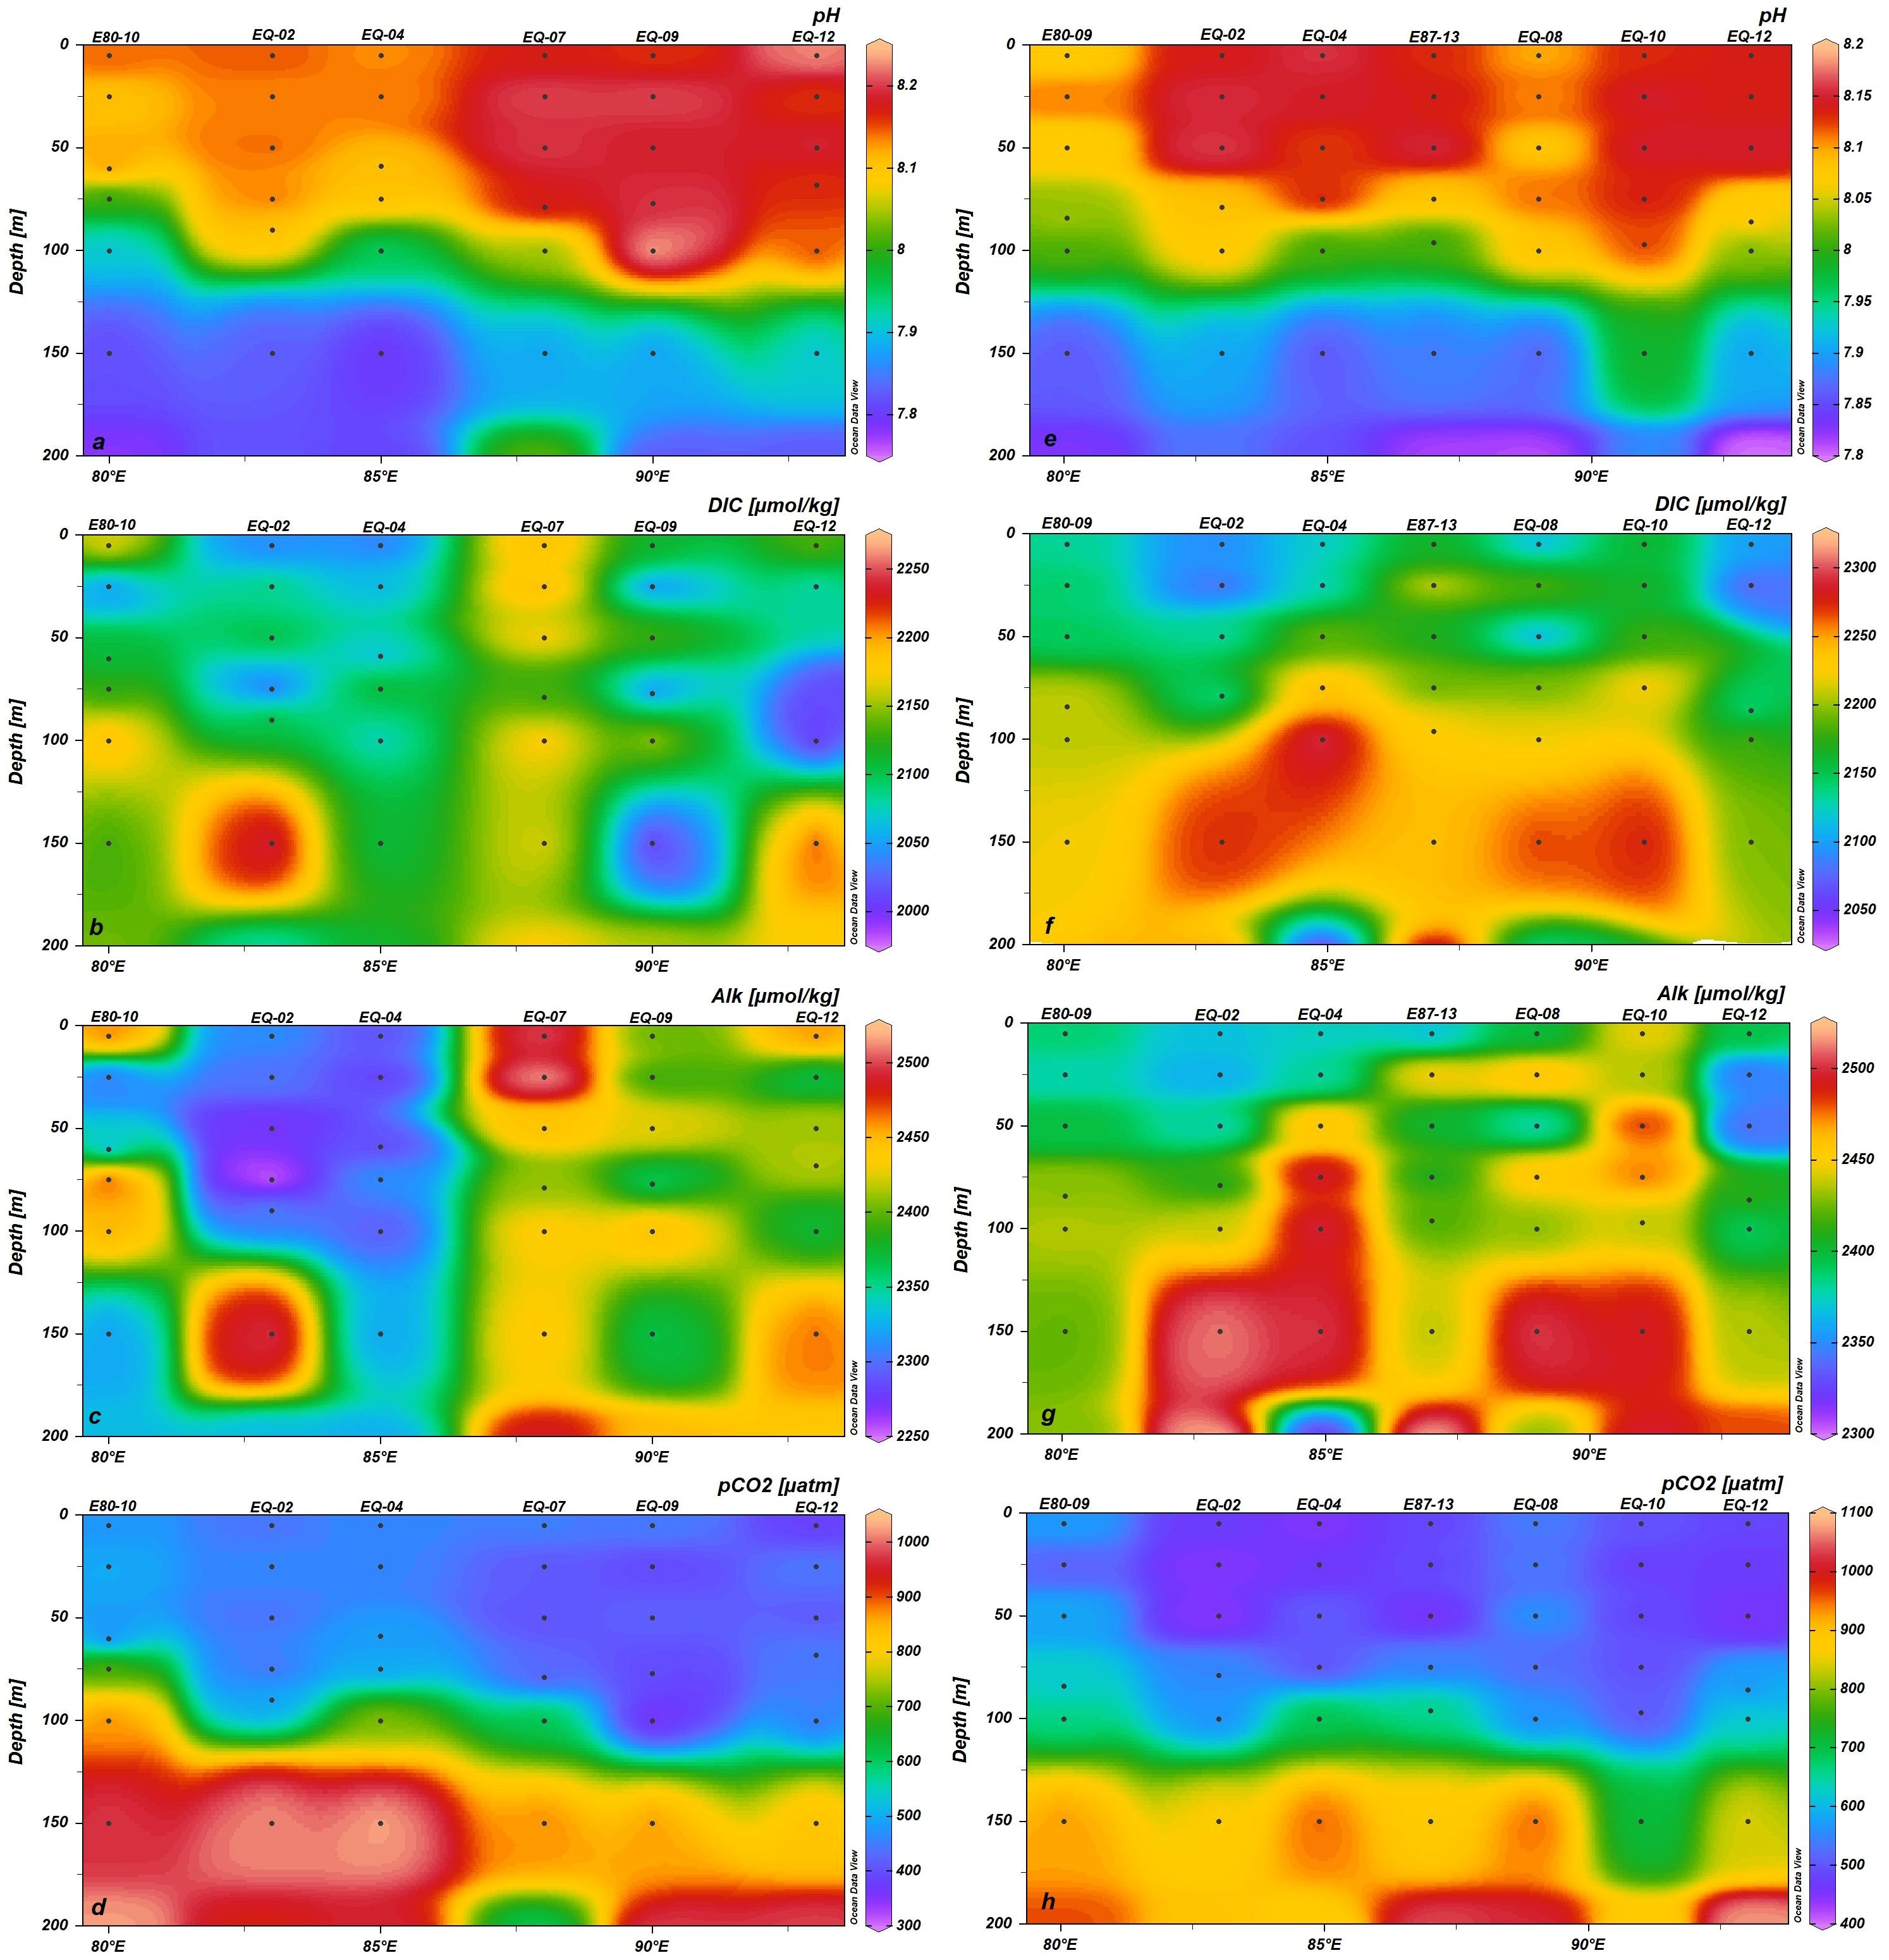
Figure 5 Vertical profiles of pH, DIC, Alk, and pCO2 in the upper 200 m at transect EQ of the EIO during autumn 2020 (A–D) and spring 2021 (E–H).
At transect E87 during spring, the pH generally decreased from 8.26 to 7.70 with increasing depth in the upper 200 m. There were comparatively low pH values at approximately 75- m depth of both end stations. DIC concentrations were lower in the upper 100 m compared to those measured below 100 m. Furthermore, in the upper 100 m, DIC concentrations were lower in the region north of 5°N compared to those measured south of 5°N. The maximum DIC (2,346 µmol kg−1) was observed at the 150-m depth of station E87-08, while the minimum (2,040 µmol kg−1) occurred at a depth of 25 m of station E87-24. Alk showed similar distributions to those of DIC. The highest Alk level (2,534 µmol kg−1) appeared at the 200-m depth of station E87-08, which was close to the region of the maximal DIC, whereas the lowest Alk level (2,274 µmol kg−1) emerged at the surface of station E87-30. pCO2 increased from 336 to 1,359 µatm with increasing depth (Figure 4, Supplementary Figure S3).
At transect EQ during spring, pH and pCO2 were in the ranges of 7.80–8.16 and 449–1,073 µatm, respectively, and presented opposite trends with respect to their vertical distributions. DIC and Alk were in the ranges of 2,048–2,306 and 2,321–2,521 µmol kg−1, respectively. DIC and Alk concentrations in the upper 50-m depth were generally lower than those below 50 m and presented minima in the upper 50 m at station EQ-12 (Figure 5, Supplementary Figure S4).
3.4 Sea–air fluxes of CO2 in the EIO during autumn 2020 and spring 2021
The average sea–air fluxes of CO2 in the EIO during autumn 2020 and spring 2021 were 10.00 ± 10.86 and 16.00 ± 15.60 mmol m−2 d−1, respectively, indicating that the study area serves as a CO2 source, albeit with substantial spatial variability during different seasons (Figure 6). During autumn 2020, only station EQ-12 acted as a very weak sink with CO2 fluxes of −0.20 mmol m−2 d−1, whereas high values of sea–air CO2 fluxes over 30 mmol m−2 d−1 occurred at stations E87-26 and E87-28. During spring 2021, sea–air CO2 fluxes decreased from the southwest to the northeast, with the maximum value (68.94 mmol m−2 d−1) observed at station E80-01 and the minimum value (−0.53 mmol m−2 d−1) observed at station E87-31. Overall, more substantial sea–air exchange of CO2 was detected in spring 2021 than in autumn 2020. Integrating over the area of the observations (~5 × 10¹² m2), the CO2 emissions from the EIO were estimated to be approximately 0.22 PgC yr−1 during autumn 2020 and 0.35 PgC yr−1 during spring 2021.
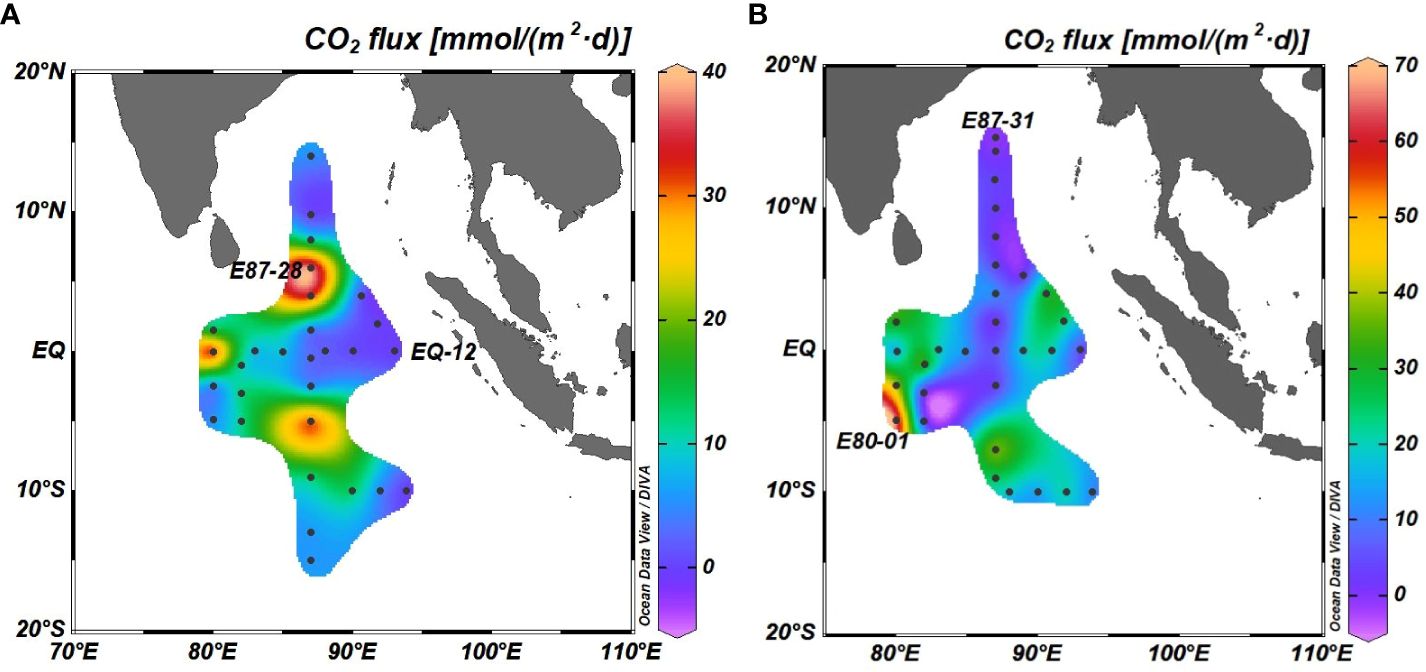
Figure 6 Sea–air fluxes of CO2 in the EIO during autumn 2020 (A) and spring 2021 (B).
4 Discussion
4.1 Factors influencing the distributions of carbonate system parameters in surface seawater
In the surface seawater of the EIO during autumn 2020, both the maximum pH and the minimum pCO2 appeared at station EQ-12, which was also the station presenting the maximum values of NO3− (5.97 µmol L−1) and NH4+ (1.49 µmol L−1). The maxima of Alk and DIC emerged at the same station (EQ-07) with the minimum level of nano-sized Chl-a (0.060 µg L−1). In addition, pH presented positive correlations with NO3− in the surface seawater of autumn 2020. These phenomena indicated that high nutrient availability (especially N nutrients) promoted the productivity and photosynthesis of phytoplankton (especially nano-sized phytoplankton), further lowering the inorganic carbon concentrations. Overall, the carbonate system parameters showed few correlations with physical and biogeochemical parameters in the surface seawater (Table 1), which demonstrated that in addition to biological processes, there may be a comprehensive effect of interactions among several processes influencing the distributions of carbonate system parameters in the surface seawater of the EIO. We found a positive correlation between DIC and Alk and a negative correlation between pH and pCO2.
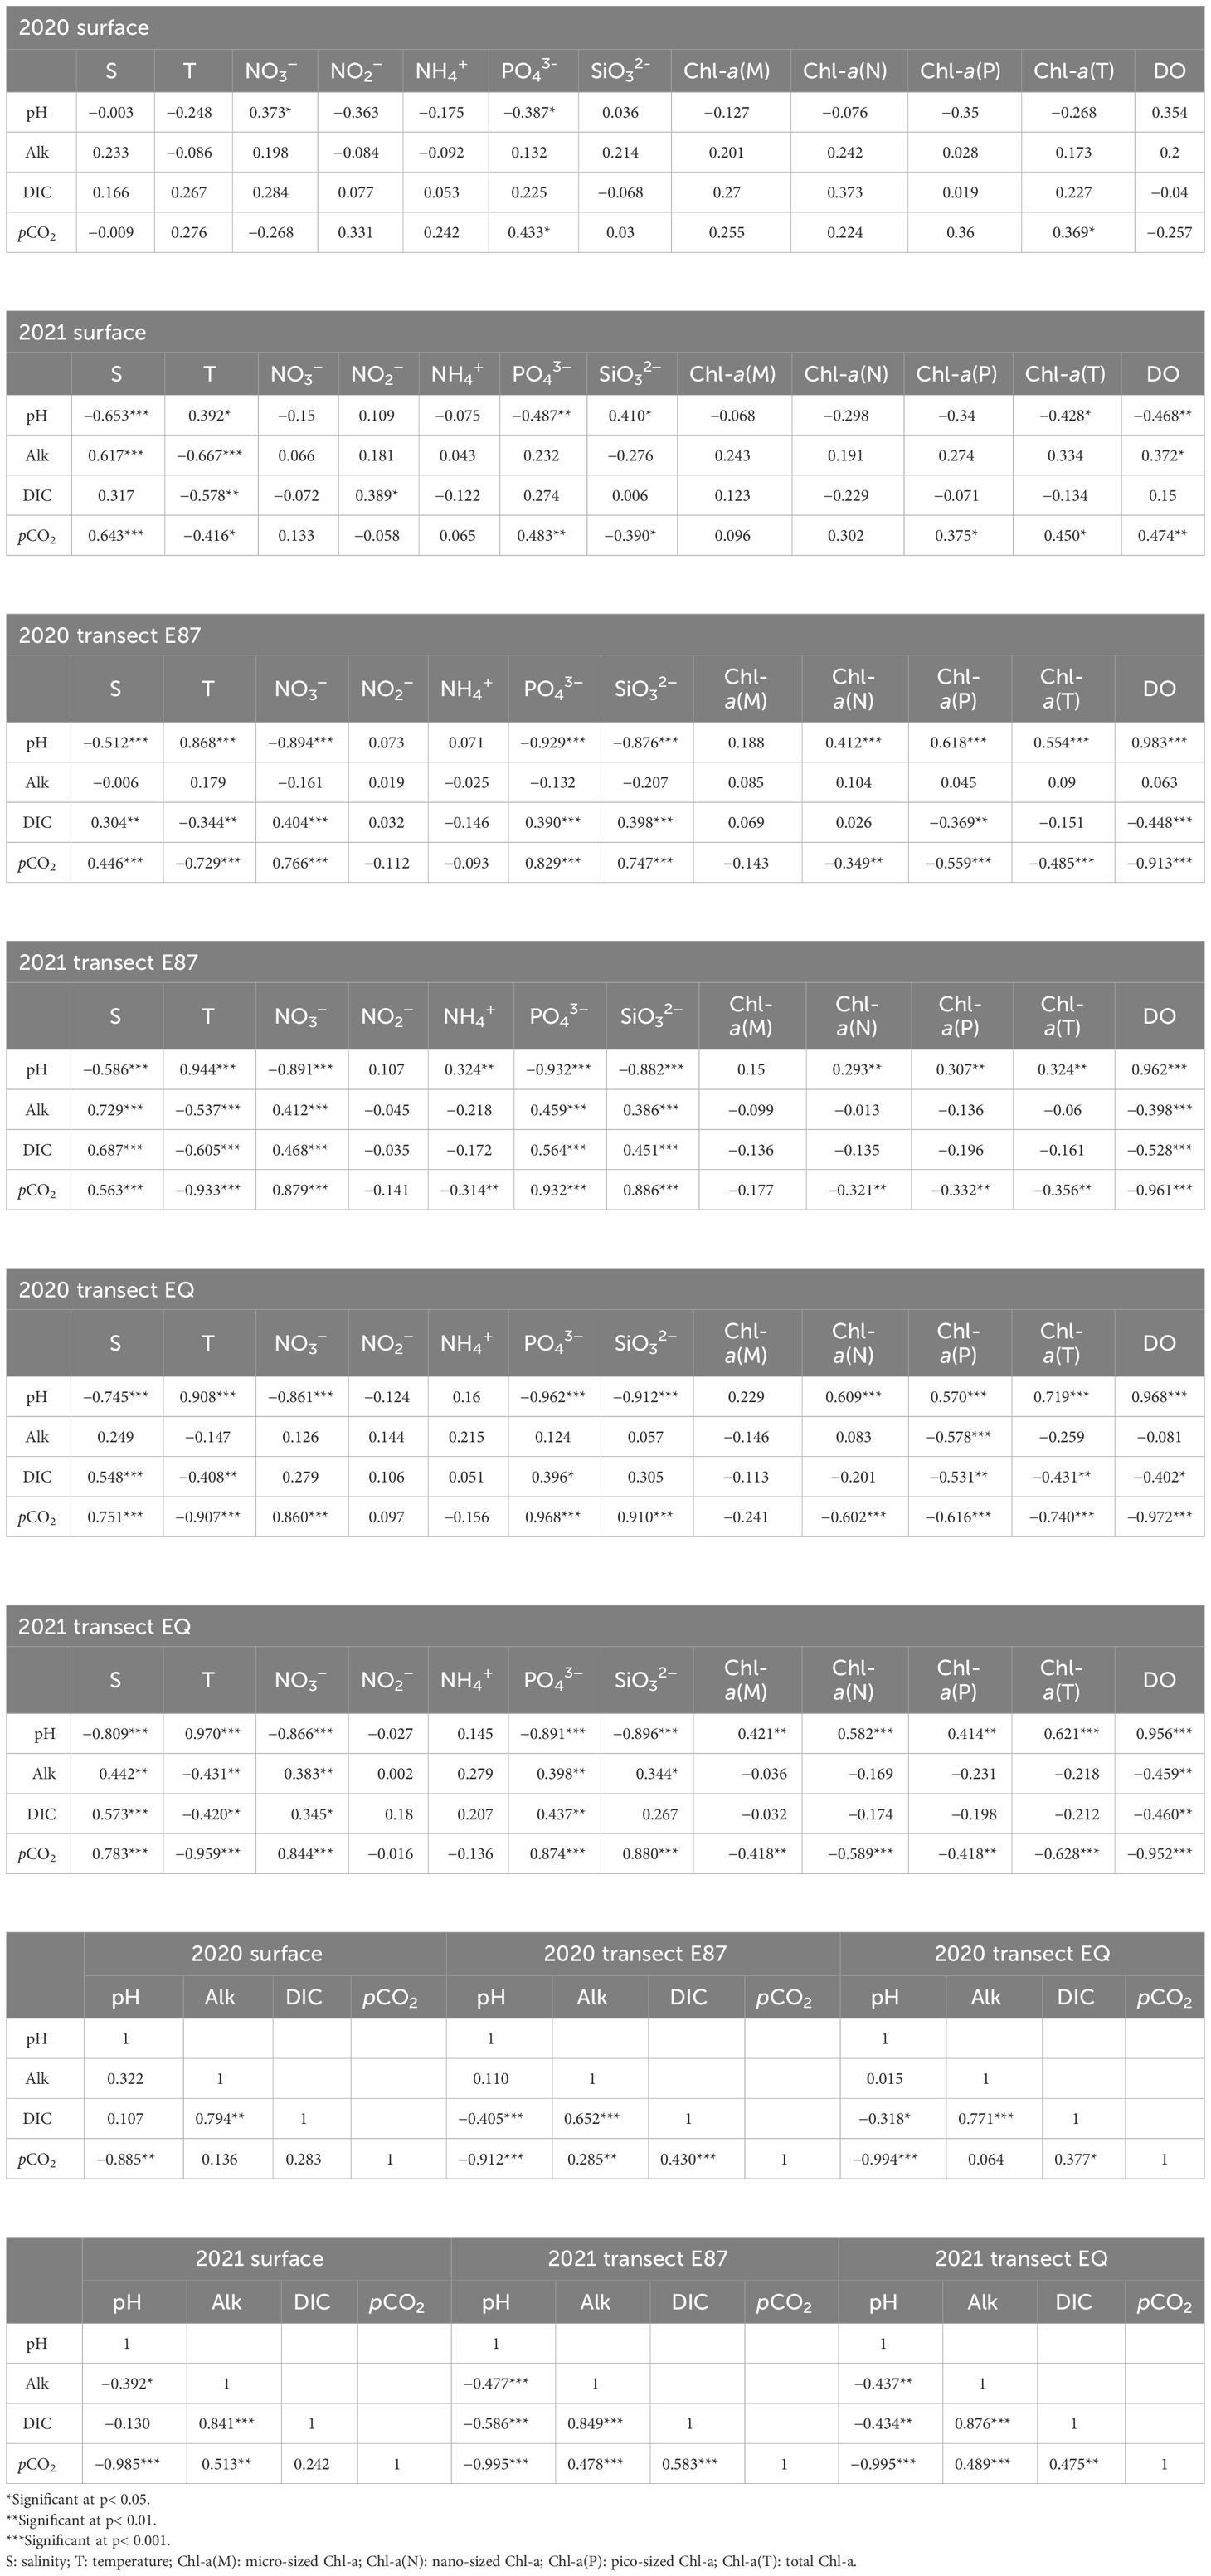
Table 1 Correlations between carbonate system parameters and biogeochemical parameters in the surface seawater, along transects E87 and EQ during autumn 2020 and spring 2021.
In the surface seawater of the EIO during spring 2021, the maximum pH, minimum pCO2, and maximum SiO32− levels were all observed at the same station (E87-31), and the minimum pH, maximum pCO2, and minimum of micro-sized Chl-a were also detected at the same station (E80-09). Over the whole study area, the average concentration of NO3− decreased by 38%, while the average concentration of SiO32− increased by 36% from autumn 2020 to spring 2021. The average content of nano-sized Chl-a decreased by 24%, while the average content of micro-sized Chl-a increased by 63% from autumn 2020 to spring 2021. In addition, pH presented positive correlations with SiO32− during spring 2021. These phenomena indicated a shift in corresponding nutrients utilized by the phytoplankton along with the phytoplankton species dominating the inorganic carbon concentrations from autumn 2020 to spring 2021. At the surface seawater, carbonate system parameters correlated with salinity and temperature, which indicated a stronger physical process in spring than in autumn. In addition, all carbonate system parameters showed correlations with each other, except for pH or pCO2 with DIC (Table 1).
Overall, the surface pH was lower during spring 2021 than during autumn 2020, while surface DIC, Alk, and pCO2 levels presented higher values during spring 2021 than during autumn 2020. This pattern might reflect a seasonal or interannual fluctuation (Chakraborty et al., 2021). The low values of DIC and Alk detected in the BoB in both seasons were mainly attributed to the river inputs, which is in line with previously reported data (<30 salinity,<2,200 µmol kg−1 Alk, and<1,900 µmol kg−1 DIC) by Bates et al. (2006). Bates et al. (2006) also found relatively lower DIC values between the Equator and ~15°S (<2,000 µmol kg−1), which is in accordance with the results of our study during autumn 2020. Low DIC values might be related to the advection processes by the WJ with relatively high salinity (>34) and temperature (>30°C) along the Equator. Wei et al. (2019) found that the WJ contributed to an increased abundance of picoplankton at the surface seawater of the Equator, which could, in turn, reduce the DIC levels through photosynthesis processes. pCO2 presented high values near Sumatra and Sri Lanka but was higher during spring 2021 than during autumn 2020, which was driven by coastal upwelling in these areas during monsoon periods, as evidenced by the relatively low temperature and high salinity near Sumatra and Sri Lanka (Supplementary Figure S1). Previous studies reported similar phenomena (Körtzinger et al., 1997; Chakraborty et al., 2018). pCO2 levels reached over 600 μatm in the northwestern Indian Ocean (i.e., off Somalia and the Oman coast) during peak southwest monsoon periods (June to August). Chakraborty et al. (2018) developed a high-resolution state-of-the-art ocean biogeochemical model (Regional Ocean Modeling System), which showed that upwelling enhanced the pCO2 level by 34 μatm at the sea east of Sri Lanka during the summer monsoon (May to August). As shown in Figure 2, the correlations of DIC/Alk and salinity during spring 2021 were more significant than those during autumn 2020, which indicated that the effects of mixing processes on carbonate system parameters were enhanced during spring 2021. The wind speed was in the ranges of 1.9–14.2 m s−1 and 2.3–15.3 m s−1 during autumn 2020 and during spring 2021, respectively, with averages of 7.8 m s−1 and 8.2 m s−1, which was consistent with previous data of 0–18 m s−1 obtained by different methods (Parekh et al., 2007). The average wind speed during spring 2021 was slightly higher than that detected during autumn 2020, which could also be generally conducive to intensifying the mixing processes (Sinha et al., 2020). Furthermore, wind speeds presented a positive correlation with pCO2 and a negative correlation with pH during spring 2021, demonstrating their relatively stronger regulation effect on carbonate system parameters compared to the corresponding influence during autumn 2020.
Moreover, monsoon currents in different seasons appeared to play important roles in affecting the distributions of carbonate system parameters, although our study periods were not completely consistent with the monsoon periods: autumn 2020 and spring 2021 correspond to the very early stage of the winter and summer monsoon period, respectively. The currents flowed in different directions during different monsoon periods: the NMC and SJC flowed out of our study area during the winter monsoon, whereas the SMC and SJC flowed into our study area during the summer monsoon, with the latter causing upwelling, thereby giving rise to high productivity and phytoplankton blooms, which also brought influxes of nutrients and DIC from the deep waters. Meanwhile, as higher trophic-level species have evolved behavioral responses to these seasonally changing conditions, their respiration process also results in the production of more CO2 (Hood et al., 2017; Vinayachandran et al., 2021), which can explain the detection of lower pH and higher DIC, Alk, and pCO2 values during spring 2021 compared to those in autumn 2020.
4.2 Factors influencing the distributions of carbonate system parameters in vertical profiles
In the vertical profiles evaluated during autumn, pH presented strong negative correlations with salinity and nutrients (including NO3−, PO43−, and SiO32−) and positive correlations with temperature, Chl-a (including nano-sized, pico-sized, and total Chl-a), and DO. However, the correlations of DIC and pCO2 with the above parameters were in the opposite directions (Table 1). The relationships of carbonate system parameters with temperature, salinity, and nutrients were mainly attributed to physical processes. Specifically, the temperature decreased, while the salinity and nutrient contents increased with depth mainly due to the pronounced stratification (Supplementary Figure S2). Moreover, the correlations between carbonate system parameters and Chl-a demonstrated that the photosynthesis of phytoplankton, especially small-sized phytoplankton, dominated in the EIO. Furthermore, these phenomena validated that despite the high nutrient contents in deeper waters, inorganic carbon could not be removed without the contributions of phytoplankton. All carbonate system parameters showed correlations except for pH with Alk along transect E87 and pH/pCO2 with Alk along transect EQ.
Carbonate system parameters along vertical profiles showed stronger correlations during spring 2021 than during autumn 2020. In addition to its correlations with pH, DIC, and pCO2, Alk also exhibited associations with temperature, salinity, nutrients, Chl-a, and DO. All carbonate system parameters showed significant correlations in the vertical profiles during spring 2021 (Table 1).
Overall, the concentrations of carbonate system parameters along transects E87 and EQ were slightly higher during spring 2021 than during autumn 2020. Along transect E87, pCO2 decreased from north to south during both autumn 2020 and spring 2021. DIC and Alk showed different distribution patterns in different seasons but always presented relatively low values at the depth of chlorophyll maximum (~75 m), reflecting the importance of biological processes in regulating the distributions of carbonate species. At low latitudes south of the Equator, a large volume of Pacific Ocean water penetrates the Indian Ocean via the Indonesian Throughflow in the upper 300-m depth (Goyet and Touratier, 2009). This water, characterized by relatively high concentrations of anthropogenic CO2, led to high values of DIC in the upper 200 m in the southern hemisphere of our study area near Indonesia. The MLD was consistently below 100 m along transects E87 and EQ during both seasons, and all carbonate system parameters generally showed minimal fluctuation above the MLD. At transect E87, the MLD in the BoB during spring 2021 was shallower than that detected during autumn 2020, which might be due to the increased river inputs during spring 2021 that further affected the distributions of carbonate system parameters. A previous model-based study in the BoB also found a prominent impact of river inputs on the MLD (Jana et al., 2015). The MLD is generally shallower with the addition of river input, which is consistent with the results of our study. The MLD at transect EQ was deeper than that at transect E87 during both seasons, which might be attributed to the influence of currents (especially the development of the WJ during the monsoon transitions) near the Equator (Masson et al., 2002; Chi et al., 2021). In addition, the increase of MLD in the region south of 10°S was determined to be driven by the climatological winds, which is consistent with the findings of Keerthi et al. (2016). The carbonate system parameters fluctuated distinctly in the thermocline below the MLD. However, since our data were only collected in the upper 200-m depth and did not cover the entire thermocline, more samples will be collected at greater depths to comprehensively explore the effects of the thermocline on the carbonate system parameters in the future.
In both surface seawater and vertical profiles, physical, chemical, and biological factors all affected the carbonate system. The physical characteristics could influence the distributions of carbonate system parameters directly, and they could also change the dominating nutrients and phytoplankton species in different seasons and ultimately lead to variations on carbonate system parameters.
4.3 Controlling processes of surface DIC
As mentioned above, the distributions of carbonate system parameters might be comprehensively controlled by several interacting processes rather than by only one process. Therefore, we separated the effects of different potential controlling processes of DIC using the method described in Section 2.5. As shown in Figure 7, the average ΔDIC was −27 µmol kg−1 during autumn 2020, which meant the measured DIC was lower than the theoretical DIC by 27 µmol kg−1. The ΔDIC could be attributed to CaCO3 precipitation–dissolution, sea–air exchange, and biological processes by −11, −6, and −10 µmol kg−1, respectively; in other words, the effect of CaCO3 precipitation decreased the DIC by 11 µmol kg−1, sea–air exchange brought 6 µmol kg−1 CO2 out of the seawater, and photosynthesis consumed 11 µmol kg−1 of DIC. However, during spring 2021, the average ΔDIC, ΔDICp-d, ΔDICa-s, and ΔDICbio values were −14, −1, −11, and −2 µmol kg−1, respectively. The contributions of CaCO3 precipitation and photosynthesis accounted for 41% and 37% of ΔDIC during autumn 2020, while ΔDIC was mainly attributed to sea–air exchange (79%) during spring 2021. Compared to those measured for autumn 2020, the absolute values of ΔDIC, ΔDICp-d, and ΔDICbio were lower in spring 2021, although they were still negative, which indicated a strong mixing process and weak CaCO3 precipitation and photosynthesis processes occurring during spring 2021. Sulpis et al. (2021) reported that the ΔDICp-d was −12.5 µmol kg−1 at the surface seawater in the subtropical Atlantic Ocean and that the subtropical gyre regions of the Pacific, Atlantic, and Indian Oceans showed generally similar patterns. Sabine et al. (2002) determined that the ΔDICp-d at the surface seawater of our study area ranged from −17.5 to 0 µmol kg−1, which is consistent with the present findings. Sulpis et al. (2021) also pointed out that global ocean CaCO3 surface production is mainly derived from biotic (planktonic) precipitation (Milliman, 1993; Milliman et al., 1999; Gehlen et al., 2007). Therefore, biological processes were the main contributors to ΔDIC as most of the CaCO3 precipitation could be related to biological processes. The overall weak photosynthesis processes during spring 2021 were likely due to the heterotrophy of the BoB. Indeed, Wiggert et al. (2013) found that the increased river inputs of the summer monsoon drove the BoB toward heterotrophy and we also observed such increased river inputs in our study during spring 2021 (Supplementary Figure S2). The inefficient CaCO3 precipitation processes during spring 2021 were likely due to the lower pH and the corresponding low biological activity. Nevertheless, the sea–air exchange process was enhanced due to the higher wind speed and pCO2 during spring 2021. In addition, the average ΔDIC caused by CaCO3 precipitation–dissolution and biological processes exhibited a similar magnitude during both autumn 2020 and spring 2021, although the variation ranges were greater in autumn 2020, suggesting more fluctuation during autumn 2020. In general, during both autumn 2020 and spring 2021, the CaCO3 precipitation process was stronger in the southern hemisphere than in the northern hemisphere, the sea–air exchange process outgassed CO2 continuously with the maxima found at the westernmost region, and intense respiration typically occurred north of transect E87. Specifically, the maximum positive ΔDIC values occurred in the BoB where the biological (respiration) process dominated, whereas the maximum negative ΔDIC values emerged at the south of transect E80 during both autumn 2020 and spring 2021. The controlling processes at transect S10 changed completely from autumn 2020 to spring 2021; that is, the dominance of photosynthesis processes during autumn 2020 shifted to a dominance of respiration processes during spring 2021. This shift of biological process was due to the lower phytoplankton abundance (<100 cells L−1; Wang, 2022) and weaker solar radiation (according to the collected PAR data: https://hermes.acri.fr/index.php) during spring 2021.
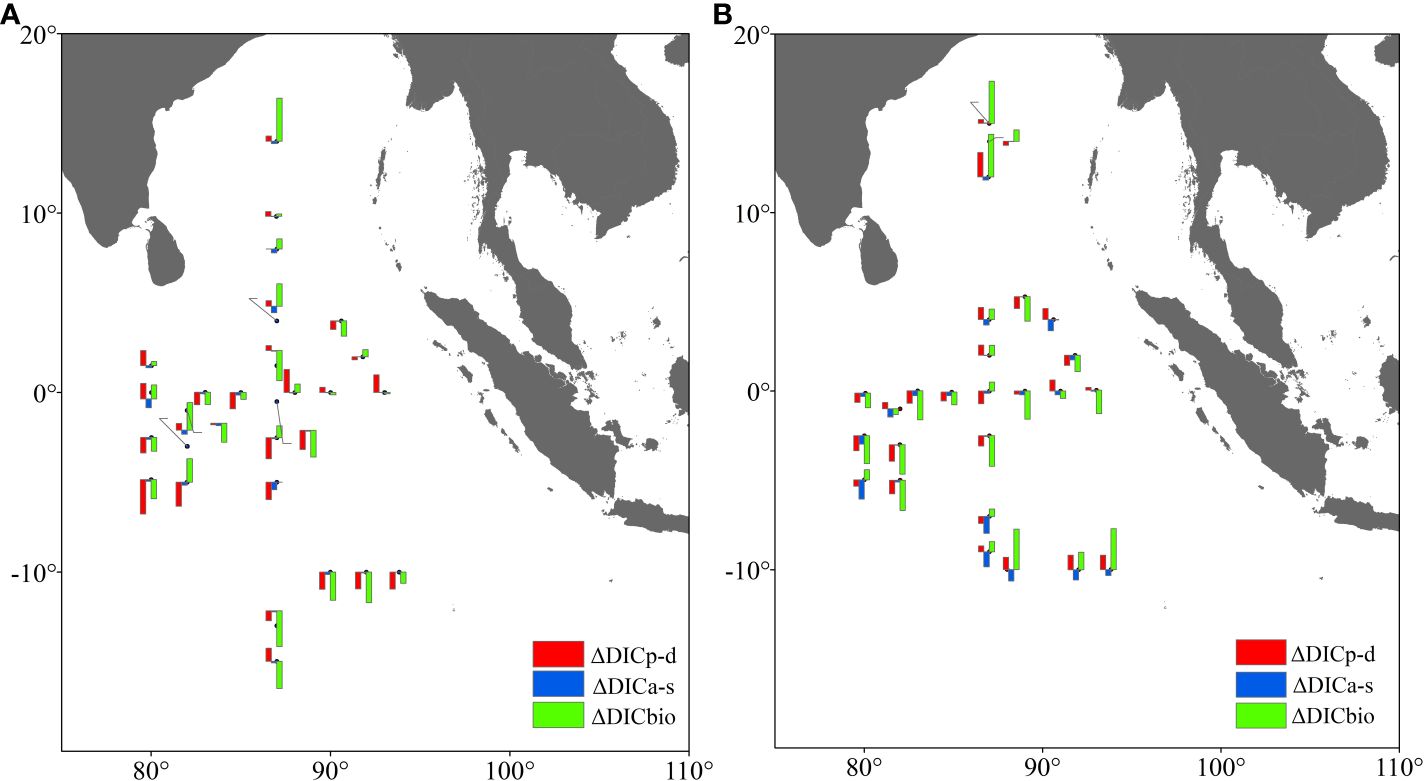
Figure 7 The contributions of CaCO3 precipitation–dissolution, sea–air exchange, and biologica processes to the DIC concentrations in the surface layer of the EIO during autumn 2020 (A) and spring 2021 (B).
In summary, biological processes (including photosynthesis and biotic precipitation) dominated the surface DIC during autumn 2020, whereas sea–air exchange was the main contributor during spring 2021. Compared with autumn 2020, the mixing process intensified, CaCO3 precipitation reduced, sea–air exchange enhanced, and photosynthesis weakened during spring 2021.
4.4 Comparison with other areas in the Indian Ocean
The Indian Ocean north of 18°S is considered to serve as a net source of CO2, with an estimated annual flux of CO2 across 14°N–14°S of the Indian Ocean of 0.18 PgC yr−1 (Takahashi et al., 2002; Sarma et al., 2023b). However, the sea–air fluxes measured in our study were slightly higher than those reported previously, which was likely due to the high instantaneous wind speeds (>13 m s−1) at some stations and the slight difference in the location of the study area (15°N–15°S of the Indian Ocean). According to Sarma et al. (2023b), the CO2 fluxes in the equatorial Indian Ocean displayed seasonality with high fluxes occurring from January to May and low fluxes occurring from June to October. In addition, they found a prominent trend of seasonality in the BoB characterized by higher CO2 fluxes from May to August associated with monsoon mixing and lower fluxes from October to December due to river discharge and stratification (Sarma et al., 2018), which is in line with our finding of higher fluxes in May 2021 than in October 2020.
Table 2 provides a summary of the key data of surface carbonate system parameters in different areas of the entire Indian Ocean. We were only able to collect limited observational data, whereas the other data were based on model output and interpolation from the limited observational results; notably, the focus of these studies is on the accuracy of the model and the sea–air fluxes of CO2 rather than all carbonate system parameters. For consistency of comparison, we converted our data to the total hydrogen scale using CO2SYS software, and the pH in our study (average: 7.97 during autumn 2020) would be a little lower than that reported by Xue et al. (2014), which might be related to the smaller area examined and that pH was spatially averaged and seasonally corrected in their study. The DIC and Alk values measured in our study area were generally in the same ranges as those reported in other areas of the Indian Ocean. The pCO2 levels in our study were in the same range as those reported in the Arabian Sea but higher than those reported in the south Indian Ocean, which was attributed to the fact that the south Indian Ocean serves as a stronger CO2 sink than the north Indian Ocean. Even though the EIO served as a CO2 source during our sampling period, it might transition into a CO2 sink during monsoon periods (Bates et al., 2006). Furthermore, other areas in the Indian Ocean, especially the south Indian Ocean, play significant roles in the uptake, storage, and transportation of anthropogenic carbon. In addition, since the biological productivity in the Indian Ocean accounts for 15%–20% of global ocean productivity (Behrenfeld and Falkowski, 1997), the effects of a biological pump on the ocean carbon cycle should not be ignored. Therefore, more long-term and continuous observations in the Indian Ocean should be carried out to better explore the interannual variations of the carbonate system, the influences of the El Niño-Southern Oscillation and Indian Ocean dipole, the tendency of ocean acidification, the ability to absorb anthropogenic CO2, and other related factors.
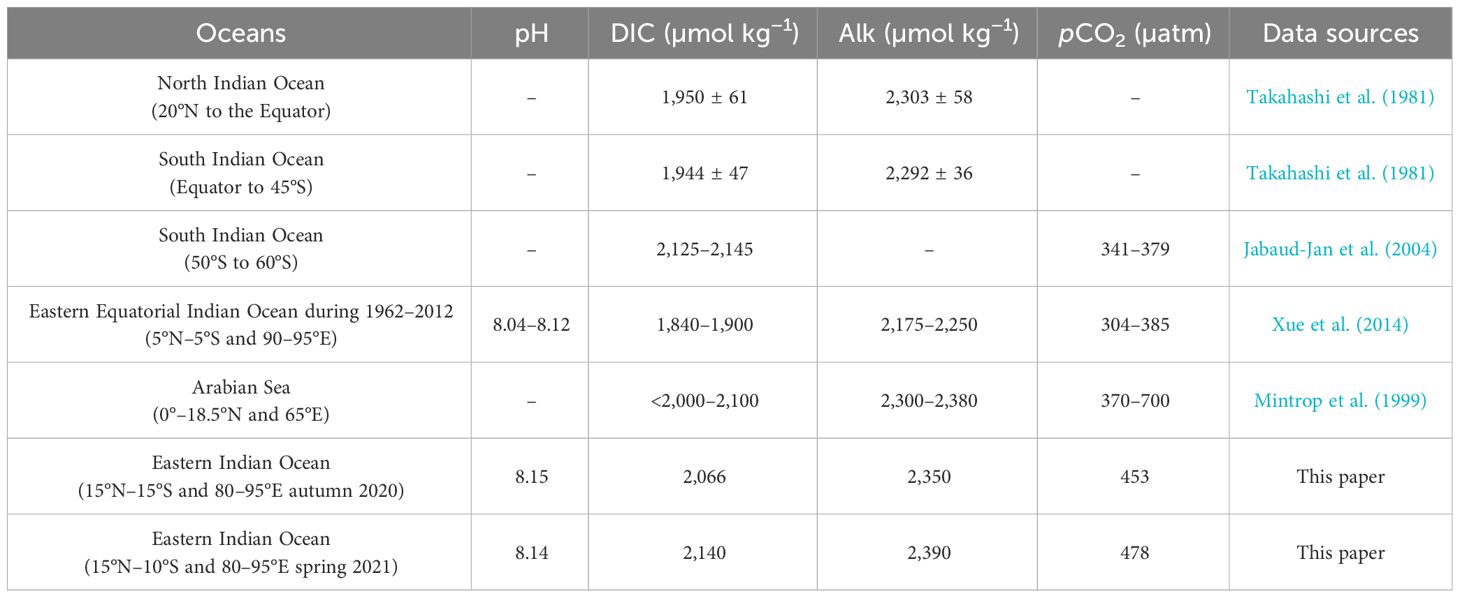
Table 2 Historical data of surface carbonate system parameters in different areas of the entire Indian Ocean.
5 Conclusion
We investigated the horizontal and vertical distributions of pH, DIC, Alk, and pCO2 in the EIO during autumn 2020 and spring 2021. Significant seasonal variations were observed in the study area. The pH generally decreased from east to west during autumn 2020, whereas it decreased from north to south during spring 2021. Low values of DIC and Alk emerged in the BoB in both seasons, which were mainly attributed to the effects of river inputs. Coastal upwelling during monsoon periods led to higher values of pCO2 and DIC near Sumatra and Sri Lanka during spring 2021. Extreme values of carbonate system parameters occurred in parallel with extreme values of nutrients and Chl-a, although different types of nutrients and different sized Chl-a were detected in different seasons. This indicated that shifts of the nutrients utilized by phytoplankton along with phytoplankton species dominated the carbonate system concentrations. Overall, the surface pH was lower, whereas DIC, Alk, and pCO2 levels were higher during spring 2021 than during autumn 2020. In vertical profiles, carbonate system parameters showed strong correlations with other physical and biogeochemical parameters, and the correlations were even more robust during spring 2021 than during autumn 2020. We also estimated the sea–air flux of CO2 during autumn 2020 (10.00 mmol m−2 d−1) and spring 2021 (16.00 mmol m−2 d−1), which revealed that the EIO acted as a CO2 source during the study period. Moreover, different controlling processes of DIC were separated to quantify their contributions, demonstrating that CaCO3 precipitation decreased the DIC by 11 µmol kg−1, sea–air exchange brought approximately 6 µmol kg−1 of CO2 out of the seawater, and photosynthesis consumed approximately 10 µmol kg−1 DIC during autumn 2020; the corresponding values were 1, 11, and 2 µmol kg−1, respectively, during spring 2021, which indicated an intense mixing process, reduced CaCO3 precipitation, enhanced sea–air exchange, and weak photosynthesis during spring 2021. Overall, this work improves our understanding of the spatiotemporal variations in the marine carbonate system in the EIO, the mechanisms controlling the variations in different seasons, and the role of the EIO in global carbon cycling. Additionally, this work also provides valuable insight and fundamental data for projecting future atmospheric CO2 levels and global climate change.
Data availability statement
The original contributions presented in the study are included in the article/Supplementary Material. Further inquiries can be directed to the corresponding author.
Author contributions
XW: Conceptualization, Data curation, Funding acquisition, Investigation, Writing – original draft, Writing – review & editing. XY: Data curation, Writing – review & editing. XL: Data curation, Writing – review & editing. XZW: Investigation, Writing – review & editing. ZC: Investigation, Writing – review & editing. TG: Investigation, Writing – review & editing. GZ: Data curation, Writing – review & editing. XG: Methodology, Writing – review & editing. JS: Conceptualization, Methodology, Project administration, Resources, Supervision, Visualization, Writing – review & editing.
Funding
The author(s) declare that financial support was received for the research, authorship, and/or publication of this article. This work was financially supported by the Ministry of Science and Technology of the People’s Republic of China (No. 2019YFE0125000), the National Natural Science Foundation of China (No. 41876134), the Knowledge Innovation Program of Wuhan-Shuguang (No. 2023020201020330), the Foundation (No. 202202) of Tianjin Key Laboratory of Marine Resources and Chemistry (Tianjin University of Science & Technology), P. R. China, and the Changjiang Scholar Program of Chinese Ministry of Education (T2014253) to JS.
Acknowledgments
Data and samples were collected onboard R/V “Shi Yan 3” implementing the open research cruise NORC2020-10 and NORC2021-10 supported by the NSFC Shiptime Sharing Project (project numbers: 41949910 and 42049910). We thank the captain and crew of the R/V “Shi Yan 3” for their help during the investigations.
Conflict of interest
Author XW was employed by the company Shenzhen Guanghuiyuan Environment Water Co., Ltd.
The remaining authors declare that the research was conducted in the absence of any commercial or financial relationships that could be construed as a potential conflict of interest.
The author(s) declared that they were an editorial board member of Frontiers, at the time of submission. This had no impact on the peer review process and the final decision.
Publisher’s note
All claims expressed in this article are solely those of the authors and do not necessarily represent those of their affiliated organizations, or those of the publisher, the editors and the reviewers. Any product that may be evaluated in this article, or claim that may be made by its manufacturer, is not guaranteed or endorsed by the publisher.
Supplementary material
The Supplementary Material for this article can be found online at: https://www.frontiersin.org/articles/10.3389/fmars.2024.1343690/full#supplementary-material
References
Bates N. R. (2007). Interannual variability of the oceanic CO2 sink in the subtropical gyre of the North Atlantic Ocean over the last 2 decades. J. Geophys. Res.: Oceans 112, C09013. doi: 10.1029/2006JC003759
Bates N. R., Pequignet A. C., Sabine C. L. (2006). Ocean carbon cycling in the Indian Ocean: 1. Spatiotemporal variability of inorganic carbon and air-sea CO2 gas exchange. Global Biogeochem. Cycles 20, GB3020. doi: 10.1029/2005GB002491
Behrenfeld M. J., Falkowski P. G. (1997). Photosynthetic rates derived from satellite-based chlorophyll concentration. Limnol. Oceanogr. 42, 1–20. doi: 10.4319/lo.1997.42.1.0001
Cai W. J., Xu Y. Y., Feely R. A., Wanninkhof R., Jönsson B., Alin S. R., et al. (2020). Controls on surface water carbonate chemistry along North American ocean margins. Nat. Commun. 11, 1–13. doi: 10.1038/s41467-020-16530-z
Chakraborty K., Valsala V., Bhattacharya T., Ghosh J. (2021). Seasonal cycle of surface ocean pCO2 and pH in the northern Indian Ocean and their controlling factors. Prog. Oceanogr. 198, 102683. doi: 10.1016/j.pocean.2021.102683
Chakraborty K., Valsala V., Gupta G. V. M., Sarma V. V. S. S. (2018). Dominant biological control over upwelling on pCO2 in sea east of Sri Lanka. J. Geophys. Res.: Biogeosci. 123, 3250–3261. doi: 10.1029/2018JG004446
Chi N. H., Lien R. C., D'Asaro E. A. (2021). The mixed layer salinity budget in the Central Equatorial Indian Ocean. J. Geophys. Res.: Oceans 126, e2021JC017280. doi: 10.1029/2021JC017280
Curbelo-Hernández D., González-Dávila M., González A. G., González-Santana D., Santana-Casiano J. M. (2021). CO2 fluxes in the Northeast Atlantic Ocean based on measurements from a surface ocean observation platform. Sci. Total Environ. 775, 145804. doi: 10.1016/j.scitotenv.2021.145804
Deng X., Zhang G. L., Xin M., Liu C. Y., Cai W. J. (2021). Carbonate chemistry variability in the southern Yellow Sea and East China Sea during spring of 2017 and summer of 2018. Sci. Total Environ. 779, 146376. doi: 10.1016/j.scitotenv.2021.146376
Dickson A. G. (1994). Determination of dissolved oxygen in sea water by Winkler titration. WHP Operations Methods, 1–14. doi: 10.2172/10107773
Dickson A. G., Goyet C. (1994). Handbook of methods for the analysis of the various parameters of the carbon dioxide system in sea water (United States).
Dickson A., Millero F. J. (1987). A comparison of the equilibrium constants for the dissociation of carbonic acid in seawater media. Deep Sea Res. Part A. Oceanographic Res. Pap. 34, 1733–1743. doi: 10.1016/0198-0149(87)90021-5
Doney S. C., Busch D. S., Cooley S. R., Kroeker K. (2020). The impacts of ocean acidification on marine ecosystems and reliant human communities. Annu. Rev. Environ. Resour. 45, 83–112. doi: 10.1146/annurev-environ-012320-083019
Feely R., Takahashi T., Wanninkhof R., McPhaden M., Cosca C., Sutherland S., et al. (2006). Decadal variability of the air-sea CO2 fluxes in the equatorial Pacific Ocean. J. Geophys. Res.: Oceans 111, C08S90. doi: 10.1029/2005JC003129
Friedlingstein P., O'Sullivan M., Jones M. W., Andrew R. M., Gregor L., Hauck J., et al. (2022). Global carbon budget 2022. Earth Sys. Sci. Data 14, 4811–4900. doi: 10.5194/essd-14-4811-2022
Gehlen M., Gangstø R., Schneider B., Bopp L., Aumont O., Éthé C. (2007). The fate of pelagic CaCO3 production in a high CO2 ocean: a model study. Biogeosciences 4, 505–519. doi: 10.5194/bg-4-505-2007
Goyet C., Touratier F. (2009). “Challenges for present and future estimates of anthropogenic carbon in the Indian Ocean,” in Indian Ocean Biogeochemical Processes and Ecological Variability. Eds. Wiggert J. D., Hood R. R., Naqvi S. W. A., Brink K. H., Smith S. L. (American Geophysical Union, Washington, DC), 231–237.
Hood R. R., Beckley L. E., Wiggert J. D. (2017). Biogeochemical and ecological impacts of boundary currents in the Indian Ocean. Prog. Oceanogr. 156, 290–325. doi: 10.1016/j.pocean.2017.04.011
Houghton R. A. (2008). Carbon flux to the atmosphere from land-use changes: 1850-2005. United States. doi: 10.3334/CDIAC/LUE.NDP050.2008
Jabaud-Jan A., Metzl N., Brunet C., Poisson A., Schauer B. (2004). Interannual variability of the carbon dioxide system in the southern Indian Ocean (20°S–60°S): The impact of a warm anomaly in austral summer 1998. Global Biogeochem. Cycles 18, GB1042. doi: 10.1029/2002GB002017
Jana S., Gangopadhyay A., Chakraborty A. (2015). Impact of seasonal river input on the Bay of Bengal simulation. Continental Shelf Res. 104, 45–62. doi: 10.1016/j.csr.2015.05.001
Joshi A. P., Roy Chowdhury R., Kumar V., Warrior H. V. (2020). Configuration and skill assessment of the coupled biogeochemical model for the carbonate system in the Bay of Bengal. Mar. Chem. 226, 103871. doi: 10.1016/j.marchem.2020.103871
Keerthi M. G., Lengaigne M., Drushka K., Vialard J., de Boyer Montegut C., Pous S., et al. (2016). Intraseasonal variability of mixed layer depth in the tropical Indian Ocean. Climate Dynamics 46, 2633–2655. doi: 10.1007/s00382-015-2721-z
Key R. M., Kozyr A., Sabine C. L., Lee K., Wanninkhof R., Bullister J. L., et al. (2004). A global ocean carbon climatology: Results from Global Data Analysis Project (GLODAP). Global Biogeochem. Cycles 18, GB4031. doi: 10.1029/2004GB002247
Körtzinger A., Duinker J. C., Mintrop L. (1997). Strong CO2 emissions from the Arabian Sea during south-west monsoon. Geophys. Res. Lett. 24, 1763–1766. doi: 10.1029/97GL01775
Léon J. F., Legrand M. (2003). Mineral dust sources in the surroundings of the north Indian Ocean. Geophys. Res. Lett. 30, 1309. doi: 10.1029/2002GL016690
Le Quéré C., Peters G. P., Andres R. J., Andrew R. M., Boden T. A., Ciais P., et al. (2014). Global carbon budget 2013. Earth Sys. Sci. Data 6, 235–263. doi: 10.5194/essd-6-235-2014
Lewis E. R., Wallace D. W. R. (1998). Program Developed for CO2 System Calculations (United States). doi: 10.15485/1464255
Li Y., Xue L., Yang X., Wei Q., Xin M., Xue M., et al. (2023). Wastewater inputs reduce the CO2 uptake by coastal oceans. Sci. Total Environ. 901, 165700. doi: 10.1016/j.scitotenv.2023.165700
Li Y., Yang H., Dang J., Yang X., Xue L., Zhang L. (2022). Seasonal variation of sea surface pH and its controls in the Jiaozhou Bay, China. Continental Shelf Res. 232, 104613. doi: 10.1016/j.csr.2021.104613
Masson S., Delecluse P., Boulanger J. P., Menkes C. (2002). A model study of the seasonal variability and formation mechanisms of the barrier layer in the eastern equatorial Indian Ocean. J. Geophys. Res.: Oceans 107, 8017. doi: 10.1029/2001JC000832
Mehrbach C., Culberson C., Hawley J., Pytkowicx R. (1973). Measurement of the apparent dissociation constants of carbonic acid in seawater at atmospheric pressure. Limnol. Oceanogr. 18, 897–907. doi: 10.4319/lo.1973.18.6.0897
Milliman J. D. (1993). Production and accumulation of calcium carbonate in the ocean: Budget of a nonsteady state. Global Biogeochem. Cycles 7, 927–957. doi: 10.1029/93GB02524
Milliman J. D., Troy P. J., Balch W. M., Adams A. K., Li Y. H., Mackenzie F. T. (1999). Biologically mediated dissolution of calcium carbonate above the chemical lysocline? Deep Sea Res. Part I: Oceanographic Res. Pap. 46, 1653–1669. doi: 10.1016/S0967-0637(99)00034-5
Mintrop L., Körtzinger A., Duinker J. C. (1999). The carbon dioxide system in the northwestern Indian Ocean during south–west monsoon. Mar. Chem. 64, 315–336. doi: 10.1016/S0304-4203(98)00089-9
Na R., Rong Z., Wang Z. A., Liang S., Liu C., Ringham M., et al. (2024). Air-sea CO2 fluxes and cross-shelf exchange of inorganic carbon in the East China Sea from a coupled physical-biogeochemical model. Sci. Total Environ. 906, 167572. doi: 10.1016/j.scitotenv.2023.167572
Palevsky H. I., Doney S. C. (2021). Sensitivity of 21st century ocean carbon export flux projections to the choice of export depth horizon. Global Biogeochem. Cycles 35, e2020GB006790. doi: 10.1029/2020GB006790
Parekh A., Sharma R., Sarkar A. (2007). A comparative assessment of surface wind speed and sea surface temperature over the Indian Ocean by TMI, MSMR, and ERA-40. J. Atmospheric Oceanic Technol. 24, 1131–1142. doi: 10.1175/JTECH2021.1
Parsons T., Lalli C. M., Maita Y. (1984). A manual of chemical and biological methods for seawater analysis (Oxford: Pergamon Press).
Paulmier A., Ruiz-Pino D. (2009). Oxygen minimum zones (OMZs) in the modern ocean. Prog. Oceanogr. 80, 113–128. doi: 10.1016/j.pocean.2008.08.001
Prasanna Kumar S., Narvekar J., Nuncio M., Gauns M., Sardesai S. (2009). “What drives the biological productivity of the Northern Indian Ocean?,” in Indian Ocean Biogeochemical Processes and Ecological Variability. Eds. Wiggert J. D., Hood R. R., Naqvi S. A., Brink K. H., Smith S. L. (American Geophysical Union, Washington, DC), 33–56.
Qi D., Ouyang Z., Chen L., Wu Y., Lei R., Chen B., et al. (2022). Climate change drives rapid decadal acidification in the Arctic Ocean from 1994 to 2020. Science 377, 1544–1550. doi: 10.1126/science.abo0383
Redfield A. C., Ketchum B. H., Richards F. A. (1963). “The influence of organisms on the composition of seawater,” in The Sea. 2. Ed. Hill M. N. (Interscience Publishers, New York), 26–77.
Sabine C. L., Key R. M., Feely R. A., Greeley D. (2002). Inorganic carbon in the Indian Ocean: Distribution and dissolution processes. Global Biogeochem. Cycles 16, 1067. doi: 10.1029/2002GB001869
Sabine C., Wanninkhof R., Key R., Goyet C., Millero F. J. (2000). Seasonal CO2 fluxes in the tropical and subtropical Indian Ocean. Mar. Chem. 72, 33–53. doi: 10.1016/S0304-4203(00)00064-5
Sarma N. S., Chiranjeevulu G., Pandi S. R., Rao D. B., Sarma V. V. S. S. (2023a). Coupling between chromophoric dissolved organic matter and dissolved inorganic carbon in Indian estuaries. Sci. Total Environ. 905, 167120. doi: 10.1016/j.scitotenv.2023.167120
Sarma V. V. S. S., Krishna M. S., Paul Y. S., Murty V. S. N. (2015). Observed changes in ocean acidity and carbon dioxide exchange in the coastal Bay of Bengal – a link to air pollution. Tellus B: Chem. Phys. Meteorol. 67, 24638. doi: 10.3402/tellusb.v67.24638
Sarma V. V. S. S., Kumari V. R., Srinivas T. N. R., Krishna M. S., Ganapathi P., Murty V. S. N. (2018). East India Coastal Current controls the dissolved inorganic carbon in the coastal Bay of Bengal. Mar. Chem. 205, 37–47. doi: 10.1016/j.marchem.2018.07.010
Sarma V. V. S. S., Sridevi B., Metzl N., Patra P. K., Lachkar Z., Chakraborty K., et al. (2023b). Air-sea fluxes of CO2 in the Indian Ocean between 1985 and 2018: A synthesis based on observation-based surface CO2, hindcast and atmospheric inversion models. Global Biogeochem. Cycles 37, e2023GB007694. doi: 10.1029/2023GB007694
Sinha M., Jha S., Chakraborty P. (2020). Indian Ocean wind speed variability and global teleconnection patterns. Oceanologia 62, 126–138. doi: 10.1016/j.oceano.2019.10.002
Strickland J. D. H., Parsons T. R. (1972). A practical handbook of seawater analysis (Ottawa: Fisheries Research Board of Canada).
Sulpis O., Jeansson E., Dinauer A., Lauvset S. K., Middelburg J. J. (2021). Calcium carbonate dissolution patterns in the ocean. Nat. Geosci. 14, 423–428. doi: 10.1038/s41561-021-00743-y
Sutton A., Wanninkhof R., Sabine C., Feely R., Cronin M., Weller R. (2017). Variability and trends in surface seawater pCO2 and CO2 flux in the Pacific Ocean. Geophys. Res. Lett. 44, 5627–5636. doi: 10.1002/2017GL073814
Takahashi T., Broecker W. S., Bainbridge A. E. (1981). The alkalinity and total carbon dioxide concentration in the world oceans, in "Carbon Cycle Modelling", SCOPE, Bolin, B., ed. (J. Wiley & Sons, NY) 16, 271-286.
Takahashi T., Sutherland S. C., Sweeney C., Poisson A., Metzl N., Tilbrook B., et al. (2002). Global sea–air CO2 flux based on climatological surface ocean pCO2, and seasonal biological and temperature effects. Deep Sea Res. Part II: Topical Stud. Oceanogr. 49, 1601–1622. doi: 10.1016/S0967-0645(02)00003-6
Takahashi T., Sutherland S. C., Wanninkhof R., Sweeney C., Feely R. A., Chipman D. W., et al. (2009). Climatological mean and decadal change in surface ocean pCO2, and net sea–air CO2 flux over the global oceans. Deep Sea Res. Part II: Topical Stud. Oceanogr. 56, 554–577. doi: 10.1016/j.dsr2.2008.12.009
Vinayachandran P. N. M., Masumoto Y., Roberts M. J., Huggett J. A., Halo I., Chatterjee A., et al. (2021). Reviews and syntheses: Physical and biogeochemical processes associated with upwelling in the Indian Ocean. Biogeosciences 18, 5967–6029. doi: 10.5194/bg-18-5967-2021
Vinayachandran P. N., Shetye S. R. (1991). The warm pool in the Indian Ocean. Proc. Indian Acad. Sci. - Earth Planetary Sci. 100, 165–175. doi: 10.1007/BF02839431
Wang X. Z. (2022). The Study of Phytoplankton Community and Carbon Sink in the Eastern Indian Ocean. Tianjin University of Science and Technology, Tianjin, China. Ph.D. Thesis.
Wanninkhof R. (2014). Relationship between wind speed and gas exchange over the ocean revisited. Limnol. Oceanogr.: Methods 12, 351–362. doi: 10.4319/lom.2014.12.351
Wei Y., Guicheng Z., Chen J., Wang J., Ding C., Zhang X., et al. (2019). Dynamic responses of picophytoplankton to physicochemical variation in the eastern Indian Ocean. Ecol. Evol. 9, 5003–5017. doi: 10.1002/ece3.5107
Weiss R. F. (1974). Carbon dioxide in water and seawater: the solubility of a non-ideal gas. Mar. Chem. 2, 203–215. doi: 10.1016/0304-4203(74)90015-2
Weiss R., Price B. (1980). Nitrous oxide solubility in water and seawater. Mar. Chem. 8, 347–359. doi: 10.1016/0304-4203(80)90024-9
Wiggert J. D., Hood R. R., Naqvi S. W. A., Brink K. H., Smith S. L. (2013). Indian Ocean Biogeochemical Processes and Ecological Variability (Hoboken, NJ: Wiley).
Wu D., Chen J., Wang K., Ni X., Li D., Zeng D., et al. (2023). The Changjiang River plume shifts from carbon source to sink when net community production exceeds a threshold in early autumn. Sci. Total Environ. 888, 164126. doi: 10.1016/j.scitotenv.2023.164126
Xue L., Cai W. J., Hu X., Sabine C., Jones S., Sutton A. J., et al. (2016). Sea surface carbon dioxide at the Georgia time series site, (2006–2007): Air–sea flux and controlling processes. Prog. Oceanogr. 140, 14–26. doi: 10.1016/j.pocean.2015.09.008
Xue L., Cai W. J., Jiang L. Q., Wei Q. (2021). Why are Surface Ocean pH and CaCO3 Saturation State Often out of Phase in Spatial Patterns and Seasonal Cycles? Global Biogeochem. Cycles 35, e2021GB006949. doi: 10.1029/2021GB006949
Xue L., Yu W., Wang H., Jiang L. Q., Feng L., Gao L., et al. (2014). Temporal changes in surface partial pressure of carbon dioxide and carbonate saturation state in the eastern equatorial Indian Ocean during the 1962–2012 period. Biogeosciences 11, 6293–6305. doi: 10.5194/bg-11-6293-2014
Keywords: seawater carbonate system, sea-air CO2 flux, Eastern Indian Ocean, dissolved inorganic carbon, carbon cycle
Citation: Wu X, Yuan X, Liu X, Wang X, Chen Z, Gu T, Zhang G, Gong X and Sun J (2024) Distributions and controlling processes of the carbonate system in the Eastern Indian Ocean during autumn and spring. Front. Mar. Sci. 11:1343690. doi: 10.3389/fmars.2024.1343690
Received: 24 November 2023; Accepted: 18 March 2024;
Published: 05 April 2024.
Edited by:
Jie Xu, University of Macau, Macao SAR, ChinaReviewed by:
Yubin Hu, Shandong University, ChinaLiang Xue, Ministry of Natural Resources, China
Vlad Macovei, Helmholtz Zentrum Hereon, Germany
Copyright © 2024 Wu, Yuan, Liu, Wang, Chen, Gu, Zhang, Gong and Sun. This is an open-access article distributed under the terms of the Creative Commons Attribution License (CC BY). The use, distribution or reproduction in other forums is permitted, provided the original author(s) and the copyright owner(s) are credited and that the original publication in this journal is cited, in accordance with accepted academic practice. No use, distribution or reproduction is permitted which does not comply with these terms.
*Correspondence: Jun Sun, cGh5dG9wbGFua3RvbkAxNjMuY29t