 Dimitra G. Georgopoulou
 Charalabos Vouidaskis
 Nikos Papandroulakis
- Institute of Marine Biology, Biotechnology and Aquaculture, Hellenic Center for Marine Research, AquaLabs, Thalassocosmos, Heraklion, Greece
Aquaculture is anticipated to contribute to two-thirds of the world’s fish consumption by 2030, emphasizing the need for innovative methods to optimize practices for economic viability, social responsibility, and environmental sustainability. Feeding practices play a pivotal role in aquaculture success and the feeding requirements are dynamic, influenced by factors like fish size, environmental conditions, and health status necessitating ongoing improvements in feeding practices. This study addresses a critical gap in feeding control systems in sea cages. It introduces a continuous, real-time monitoring system for analyzing the feeding behavior of European seabass, employing advanced AI models (YOLO and DEEPSORT) and computer vision techniques. The investigation focuses on key parameters, including speed and the newly defined feeding behavior index (FBI), to evaluate swimming responses under varying feeding scenarios exploring meal frequency, feeding time, and feeding quantity. The findings reveal a sensitivity of fish speed and the feeding behavior index (FBI) to different feeding scenarios, elucidating distinct behavioral patterns in response to varying frequencies, times, and quantities of feeding, such as increased activity in the morning relative to later times and the emergence of asymmetric activity patterns when fish are underfed or overfed. Notably, this study is one of the few in the field, presenting the development of a continuous, real-time monitoring system for feeding control in sea cages. Simultaneously, it explores reference curves and threshold values to enhance the overall efficacy of feeding control measures.
1 Introduction
Aquaculture is expected to supply two-thirds of the world’s fish by the year 2030, underscoring the need for continuous improvement (FAO, 2022). Feeding plays a pivotal role in determining the success of aquaculture, with significant influence on various aspects such as operational costs, fish growth rates, overall health and welfare of the aquatic organisms, and the environmental footprint of the industry. It’s important to note that feeding requirements in aquaculture are far from static; they can be notably impacted by factors like the fish size, the environmental conditions, and the health status of the reared group (Sun et al., 2016; Zhang et al., 2020). Thus, innovative methods to optimize feeding practices become imperative in achieving the triple bottom line of economic viability, social responsibility, and environmental sustainability within the realm of aquaculture.
Efficient feeding can be achieved by monitoring both behavioral and water quality parameters. On one hand, water quality parameters, such as temperature, oxygen and pH, can impact the metabolism of the fish and consequently their appetite (Kramer, 1987; Zhou et al., 2018b; Volkoff and Rønnestad, 2020; Assan et al., 2021). On the other hand, changes in metabolism are associated with changes in activity. The variations in activity levels can therefore serve as indicators of appetite, revealing the feeding needs (Chen et al., 2023; Conde-Sieira et al., 2018; Zhou et al., 2018b, Zhou et al., 2019). Studying activity can, thus, enable efficient feed utilization, preventing overfeeding and associated environmental implications, while avoiding stress and health issues from underfeeding. In addition, tailoring feeding practices based on fish behavior can lead to lower production costs and promote well-being. A comprehensive understanding of fish behavior can therefore empower responsible feeding practices, benefiting fish welfare and the environment, making it vital for sustainable aquaculture practices.
Fish display distinct and diverse behavioral responses to external stimuli and internal requirements. Numerous research studies have delved into these behavioral adaptations when it comes to feeding. Hansen et al. (2015b) demonstrated that differences in the internal states of fish within shoals influenced their individual spatial positions, with hungrier individuals tending to position themselves at the forefront of the group. Hunger also impacts activity patterns, as insufficient food prompts animals to engage in increased locomotor behavior associated with searching and exploration (Miyazaki et al., 2000; Priyadarshana et al., 2006; Hansen et al., 2015a) and greater overall swimming and turning speeds compared to well-fed fish (Hansen et al., 2015a; Killen et al., 2017). It can also increase the aggression between individual fish for food (Huntingford et al., 2012a, Huntingford et al., 2012b). Satiation levels are, therefore, tightly linked to specific behavioral expressions in aquatic environments.
Long efforts have been made to identify indicators, including behavioral, that can detect satiation levels and regulate feeding for different species. Initial studies attempt this using visual observations or indirect behavioral metrics. Brännäs and Alanärä (1993) for example, have recorded the biting activity of the arctic charr (Salvelinus alpinus) in tanks, while Fast et al. (1997) the feed consumption using cell loads to understand the satiation level of Chinese catfish (Clarias fuscus). Others have applied hydro-acoustic sensors for detecting feed pellets in sea cages for feeding control (Juell, 1991; Juell and Westerberg, 1993; Juell et al., 1993). Fang and Chang (1999) used a reflective type of photoelectric sensor to detect the gathering behavior of the fish. In other studies, an infrared photoelectric sensor was used to observe the collective behavior of Cyprinus carpio (Zhao et al., 2017), and developed an intelligent feeding control system for eel breeding (Chang et al., 2005). Parra et al. (2018) designed and deployed Low-Cost Sensors for monitoring the water quality and fish behavior in aquaculture tanks during the feeding process.
Acoustic telemetry systems have also been adopted by the aquaculture industry and have been proven valuable for understanding biological processes (Hussey et al., 2015; Abecasis et al., 2018; Føre et al., 2018; Schwinghamer et al., 2019; Villegas-Ríos et al., 2020; Svendsen et al., 2021). These systems could enable feeding control as they can wirelessly transmit real-time data, enabling fish farmers to promptly respond to changes in group behavior, such as during feeding (Thorstad et al., 2013; Føre et al., 2018) However, their invasive deployment may influence fish attributes, potentially leading to erroneous data (Hussey et al., 2015; McKenna et al., 2021; Georgopoulou et al., 2022; Runde et al., 2022). Moreover, the expense and limited deployment (An et al., 2021) to a few individuals result in a small, potentially unrepresentative sample size for farm-wide monitoring, restricting current use to feeding control.
Demand or self-feeders have also been developed to enable fish to feed according to their appetite (Alanärä et al., 2001; Noble et al., 2007a, Noble et al., 2007b, 2008). Self-feeders activate when fish trigger them, releasing food from a dispenser (Alanärä et al., 2001). These feeders aim to enhance feeding in aquaculture by aligning feed delivery with fish appetite, leading to improved growth and reduced feed wastage (Talbot et al., 1999; Noble et al., 2007b). Additionally, their implementation could potentially decrease competition, thereby enhancing fish welfare (Noble et al., 2008). Despite the positive performance outcomes observed in several cases (de Mattos et al., 2022), the use of self-feeders comes with challenges. Their operation depends on specific individuals and social hierarchies, which may result in growth inhomogeneity within a stock (Arechavala-Lopez et al., 2020. Moreover, deploying self-feeders in open cages poses challenges, especially in larger cages with a high number of individuals. Fish in marine cage environments often exhibit variable appetites due to factors such as changes in water temperature, environmental conditions, and the health status of the fish. While social learning and training theoretically hold the potential to address these inhomogeneities, there has been no successful demonstration of social learning as an effective tool for aquaculture to date (Macaulay et al., 2021). While many small-scale experimental studies report promising results, few have successfully translated to commercial scale, highlighting a gap between theoretical concepts and practical application. Caution is warranted against extrapolating results from small-scale studies to commercial situations.
In the past decade, there has been a recent surge in scientists proposing methods to quantify fish behavior using computer vision techniques (Xu et al., 2006; Niu et al., 2018; Zhou et al., 2018a; Georgopoulou et al., 2021) and only recently, from 2016, they have applied more elaborated methodologies, such deep learning (Macaulay et al., 2021). These techniques offer an automated, non-invasive, and cost-effective means to record behavioral parameters. To describe these behaviors, images captured are converted to statistical results using computer vision models, and then some behavioral parameters are estimated. Categorically, these methods can be distinguished based on several criteria: the species under study, the adopted methodology (ranging from simple computer vision techniques to more sophisticated machine learning models such as convolutional neural networks-CNN), the applicable system (e.g., recirculating aquaculture systems-RAS, cages), the specific research questions they aim to address [e.g. feed behavior, abnormal behavior such as aggressive behavior, disease states, environmental factors, stress, and daily swimming behavioral variations (Yang et al., 2021)], and the type of behavioral parameters studied. These parameters can be direct, such as the swimming speed, direction, spatial distribution, and turning angle (An et al., 2021), or indirect, such as the changes in the water surface due to higher activity and the loss of feed pellet due to low activity. Here, we focus on the methodologies that specifically have been applied for feeding monitoring and control. An et al. (2021), Li et al. (2020), Niu et al. (2018), Wang et al. (2021), Yang et al. (2021) and Zhou et al. (2018b) offer a thorough investigation and discussion on computer vision techniques used for monitoring fish behavior in other contexts.
In the realm of applicable systems, a concentrated effort has been directed toward recirculating aquaculture systems (RAS) but usually the studies involve a limited number of individuals (Foster et al., 1995; Parsonage and Petrell, 2003; Xu et al., 2003, 2006; Papadakis et al., 2012; Lee et al., 2013; Liu et al., 2014; Papadakis et al., 2014; Al-Jubouri et al., 2017; Zhou et al., 2018b, Zhou et al., 2018a; Han et al., 2020; Wang et al., 2021; Kong et al., 2022). Some of these investigations have developed methodologies centered on indirect metrics, such as counting uneaten pellets using simple computer vision techniques (Foster et al., 1995; Parsonage and Petrell, 2003). More recently, others have proposed a feeding control method in RAS, which involves integrating pellet count using more elaborated methodologies, i.e., a feed pellet counting module using convolutional neural networks (CNNs) (Wang et al., 2022).
Turning to methodologies directly monitoring the fish behavior (Papadakis et al., 2012; Lee et al., 2013; Papadakis et al., 2014; Zhao et al., 2017; Al-Jubouri et al., 2017; Zhou et al., 2018b, Zhou et al., 2018a; Han et al., 2020; Kong et al., 2022), Lee et al. (2013) introduced the Sustainable Aquaculture Feed System (SAFS), utilizing simple computer vision techniques to detect fish presence around the feeding area and evaluate their appetite. Another approach by Liu et al. (2014) involved defining an index for measuring the feeding activity of Atlantic salmon shoals in an RAS through the subtraction of two consecutive frames. Alzubi et al. (2016) employed a combination of traditional computer vision and more elaborated support vector machine to analyze fish activity and determine if fish were actively fed. Zhao et al. (2017) proposed a method characterizing fish groups’ appetite based on their dispersion, interaction force, and the degree of change in the water flow field. More recently, there has been a growing body of work developing methodologies based on CNNs to classify feeding-related activity into different classes (Han et al., 2020; Kong et al., 2022). Wang et al. (2022) used a multi-task CNN that contained also a feeding activity classification module, that could binary classify fish group into active or inactive.
In contrast, fewer studies have addressed systems applicable to sea cages, with a tendency towards indirect measures of fish appetite, such as detecting feed loss using cameras (Hu et al., 2021) or monitoring surface activity during feeding (Ubina et al., 2021; Hu et al., 2022; Pradana and Horio, 2022). Maløy et al. (2019) considered both temporal and spatial flow by combining a three-dimensional CNN (3D-CNN) and an RNN to form a new dual deep neural network. The 3D-CNN and RNN were used to capture spatial and temporal sequence information, respectively, thereby achieving recognition of both feeding and nonfeeding behaviors in salmon.
In general, previous work focused on developing feeding monitoring tools in RAS, with a limited number of fish and more controlled environments. In addition, they controlled a small number of parameters and did the analysis for short-time intervals. As a result, there is a significant lack of long-term experiments specifically designed to be applied in industrial aquaculture settings, particularly in cages. In these conditions, the feeding frequency and quantity of feed are typically determined based on feeding tables and farmers’ experience, with limited adaptability to actual fish feeding needs (Benhaïm et al., 2012; Wang et al., 2017). Furthermore, the use of automatic feeders without any control may result in cases of both, over-feeding and underfeeding (Ang, 1998; Petrell and Pee Ang, 2001; Liu et al., 2014).
Considering the above, we have developed a system capable of continuous, real-time monitoring of European seabass feeding behavior in sea cages using single vision underwater cameras. The system allows for the automated detection and tracking of individual fish, as well as the identification of their feeding actions and progression. Within this framework, we have introduced two parameters for control purposes: the speed and the feeding behavior index (FBI). While other parameters, such as polarization and fish turns, were also considered we focus on assessing how these two behavior-based indicators, speed and FBI, respond across various feeding scenarios including feeding frequency, feeding quantity, and feeding duration. Building on previous research, we anticipate two key findings: Firstly, the fish are likely to exhibit increased activity leading up to feeding events, suggesting an anticipatory response. Secondly, as the fish approach satiation, a decline in their activity levels is expected.
The current work is organized in the following sections: first, we describe the methodology we used to develop the continuous real-time tracking system and to extract the behavioral parameter. Then, we discuss the experimental design of the different feeding scenarios. Next, we present the results of the fish behavior parameters for the different feeding scenarios. Last, we discuss possible methodologies that could help us achieve feeding control.
2 Methodology
2.1 System development
2.1.1 Experimental animals and site
A group of more than 10,000 E. seabass (Dicentrarchus labrax, 220 ± 30 g body weight) at a stocking density of 5.2 kg m−3 was reared in a circular polyester cage of 40m in diameter and 9m depth, having a cylinder-shaped net up to 8m depth and a closing cone of 1m. The cage (Figure 1) was located at the pilot scale farm of HCMR (certified as an aquaculture facility from the national veterinary authority; code GR94FISH0001) at Souda Bay, Crete. The stock was obtained from the Mesocosm hatchery of the HCMR. Following larval rearing and pre-growing, juveniles of apx 2g mean weight were transferred to the pilot scale farm, after 120 days post hatching.
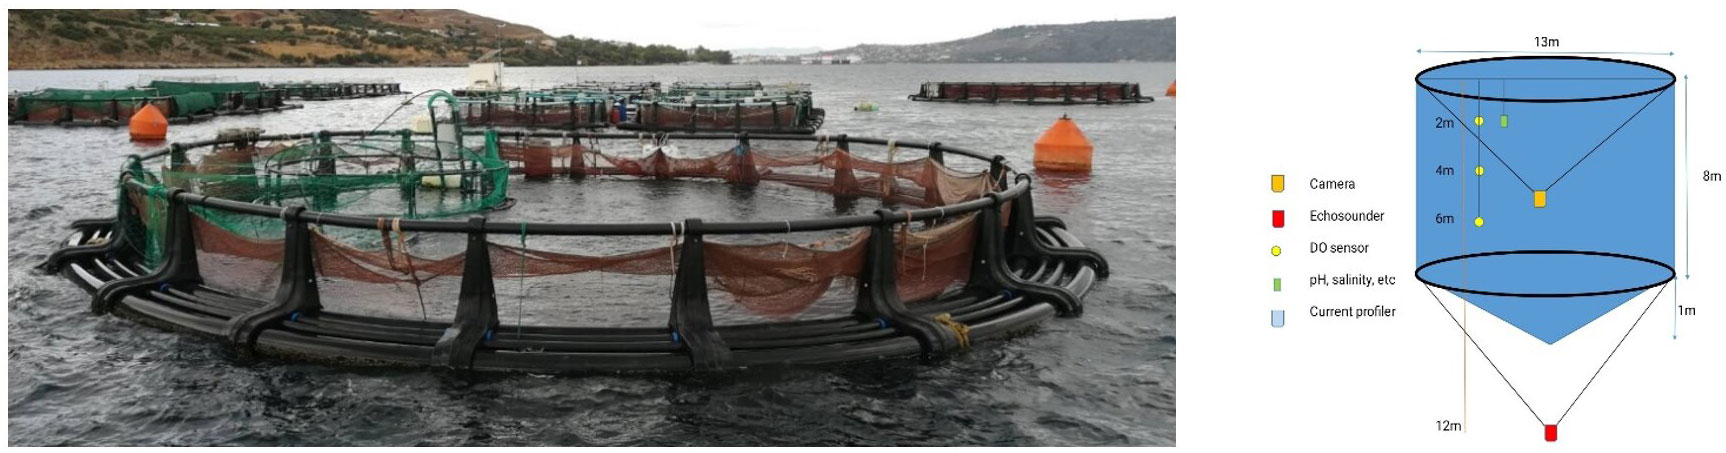
Figure 1 Experimental site and camera setup.
2.1.2 Automatic feeder
An automatic feeder was located at the center of the cage. It comprised of a microcomputer (rpi, Rasberry4 - model B) that was used as a node which was controlling a simple motor (feeding motor, 12V). To enable remote control of the feeder the MQTT communication protocol (messaging protocol for the transmission of data from sensors) was used. During the trial, the feeder was activated at specific times (see below) and for specific duration according to the experimental protocol that is explained below.
2.1.3 Monitoring system
A submerged network camera (Fyssalis v3.1; Figure 1) capturing at 10 fps was used for monitoring and video recording during daylight hours. The image resolution was 1280 x 720 pixels. The camera was positioned at 4 m depth using a gyroscopic gimbal stabilizer to ensure upwards positioning. The videos were collected using RTSP streaming and were analyzed locally at the institute’s facilities. Different types of behavior captured with the camera are shown in Figure 2.
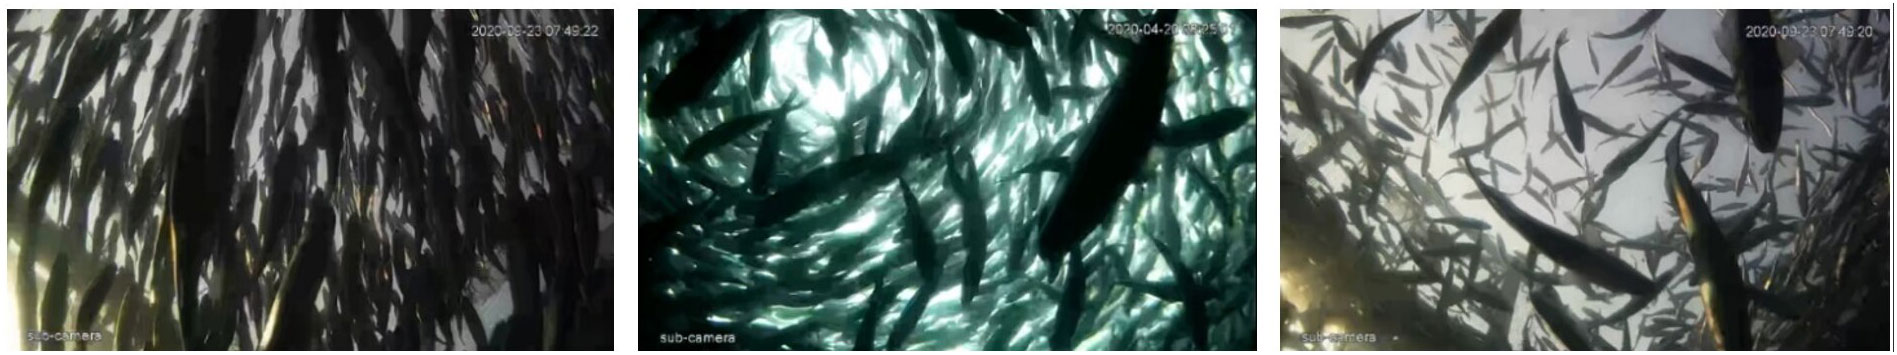
Figure 2 Variation in the swimming patterns of the European seabass crowd in cages: i) Polarized behavior, ii) Milling behavior, iii) Swarm behavior (Tunstrøm et al., 2013).
2.1.4 Video Analysis
The swimming behavior analysis was performed at two different levels, the individual level, and the group level (Figure 3). At the individual level, we trained previously existing models, as explained in the next paragraph, for the detection and tracking of individual fish in the cage. At the group level, we used computer vision techniques to extract group level swimming performance parameters, such as the feeding behavior index (FBI). We used Python (v3.9) for both video and data analysis.
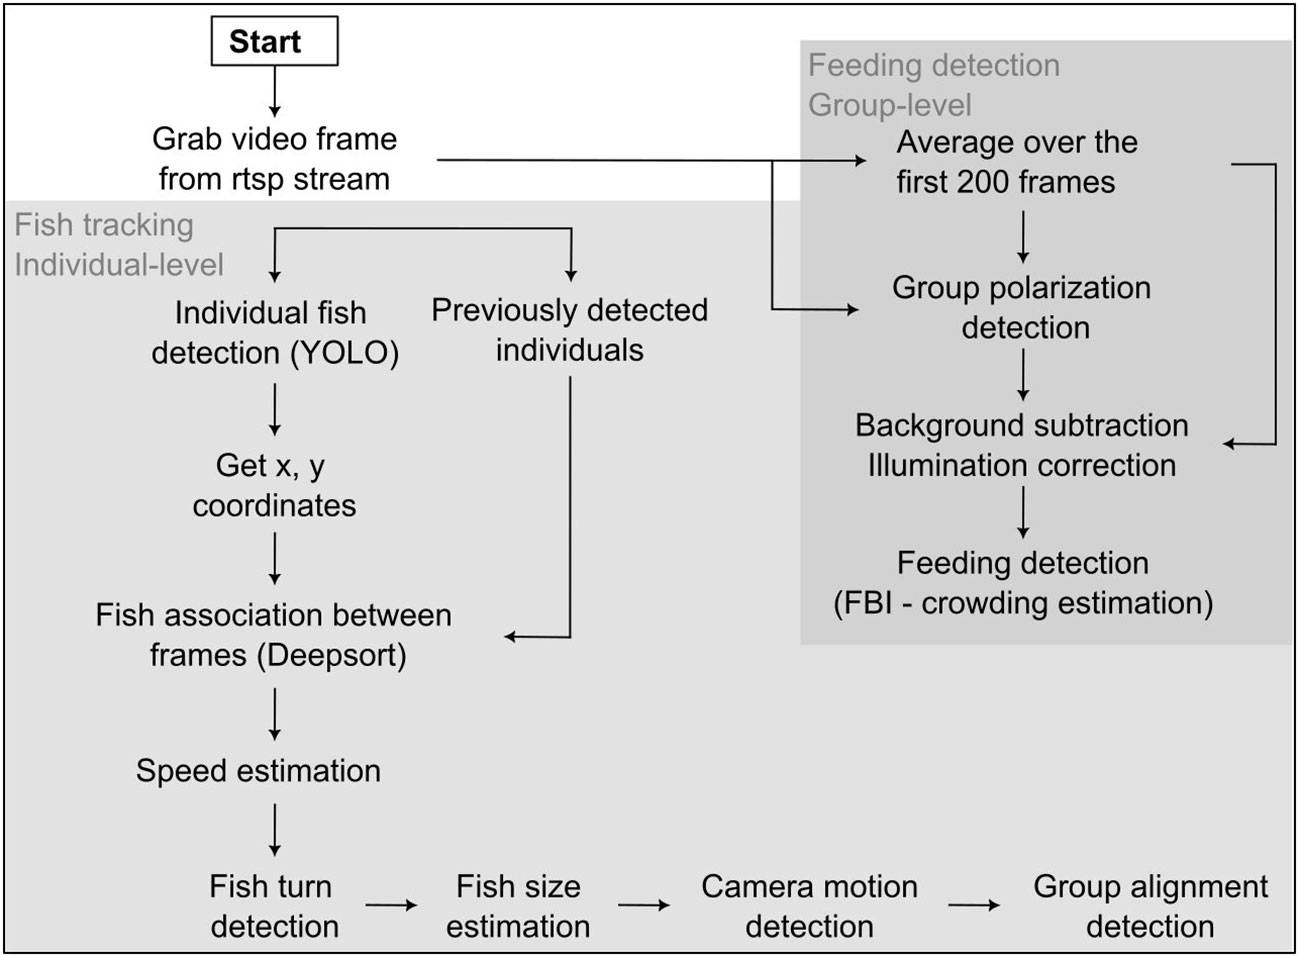
Figure 3 Flowchart of the algorithm.
2.1.4.1 Individual-level video analysis
We used YOLOv5 (Jocher et al., 2022) in python (Van Rossum and Drake, 1995; version 3.9) to detect the fish in the videos, after training the model with 1,000 annotated images of individual fish of only one species, i.e. of European seabass (see Supplementary Figure for the performance parameters of the training). To associate each detected fish between frames, i.e., to track the fish, we applied the DEEPSORT algorithm (Wojke et al., 2017) excluding the appearance-based association parameter. All training and video analysis were performed on a Desktop computer with the following specifications: Intel Core i7-8700 3.2 GHz CPU, 32GB RAM and NVIDIA GeForce 3060Ti GPU. The fish’s speed (as body lengths/sec) was calculated using the extracted trajectories.
2.1.4.2 Group-level video analysis
2.1.4.2.1 Crowding estimation - feeding behavior index
We took advantage of the particular behavior exhibited by E. seabass during feeding where the fish create a dense group at the feeding area (see Supplementary Video) to define the FBI as a parameter that shows variation in the group density around the feeding area and helps us determine when feeding takes place. More specifically, to calculate it we first corrected for the uneven illumination of the image by subtracting the current image with the background image (which is calculated as the average of the last 200 image frames and is re-calculated every 15 minutes; Figure 4A). Next, we converted the image into the HSV color space, and we segmented the image into the foreground pixels containing the fish and the background (Figure 4B). The range of threshold values was chosen after manual investigation (H: 0-0; S: 0-0; V: 0-140; Figure 4C). The total density of the crowd was calculated as (Figure 4D). During feeding, fish tend to form a very dense core that does not cover all image area and in the edge of it the fish are sparsely distributed (see Supplementary Video). This core could be centered at any of the image areas. Thus, we next split the segmented image into four equal rectangles (R1, R2, R3 and R4) and calculated the density at each of them (Figures 4C, D). We detected significant crowding when any of the regional densities (Density R1, R2, R3, R4) were higher than 0.845 (a manually defined threshold, decided after investigation) as is shown in Figure 4E. Then feeding behavior index was then calculated as , where the maximum density was the maximum density detected until that time frame (Figure 4F). To detect feeding event, the condition must last for at least 80 frames (8 seconds). The opposite condition must be held to detect relaxation after feeding (Figure 4G).
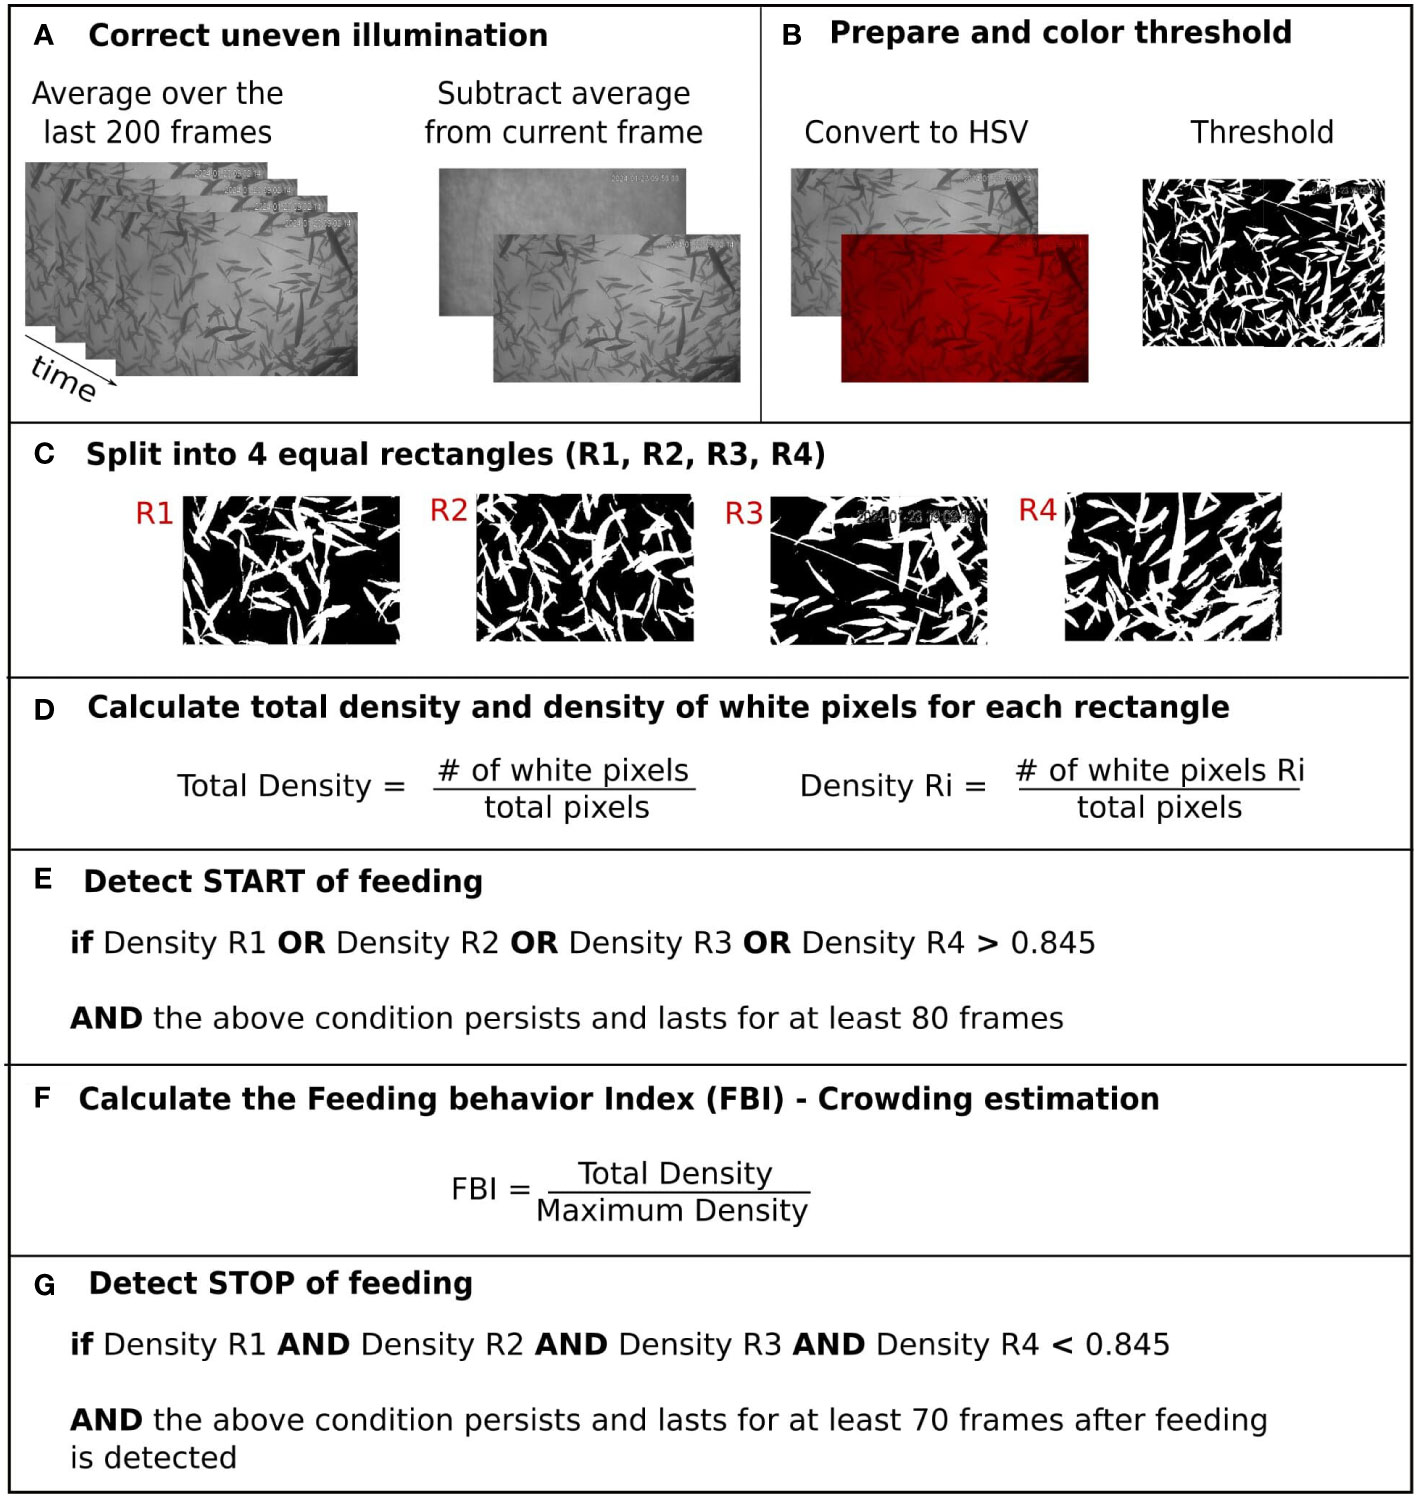
Figure 4 Schematic representation of the steps followed for the estimation of the FBI. (A) Correct uneven illumination (B) Prepare and color threshold (C) Split into 4 equal rectangles (R1, R2, R3, R4), (D) Calculate total density and density of white pixels for each rectangle, (E) Detect START of feeding, (F) Calculate the Feeding behavior Index (FBI) - Crowding estimation, (G) Detect STOP of feeding.
2.2 System testing
The experimental protocol was approved by the Ethics Committee of the IMBBC and the relevant veterinary authorities (Ref Number 32257 09-02-2021) in accordance with legal regulations (EU Directive 2010/63).
2.2.1 Experimental procedure
We were recording the fish for a duration of approximately a year, and we followed different feeding scenarios as shown in Figure 5. We controlled for three different feeding parameters: the feeding frequency (feed distribution once, twice or three times per day), the feeding time (morning, noon or afternoon) and the feeding quantity (normal feeding based on feeding tables, reduced feeding at 50% from normal, overfeeding at 150% of the normal and no feeding).
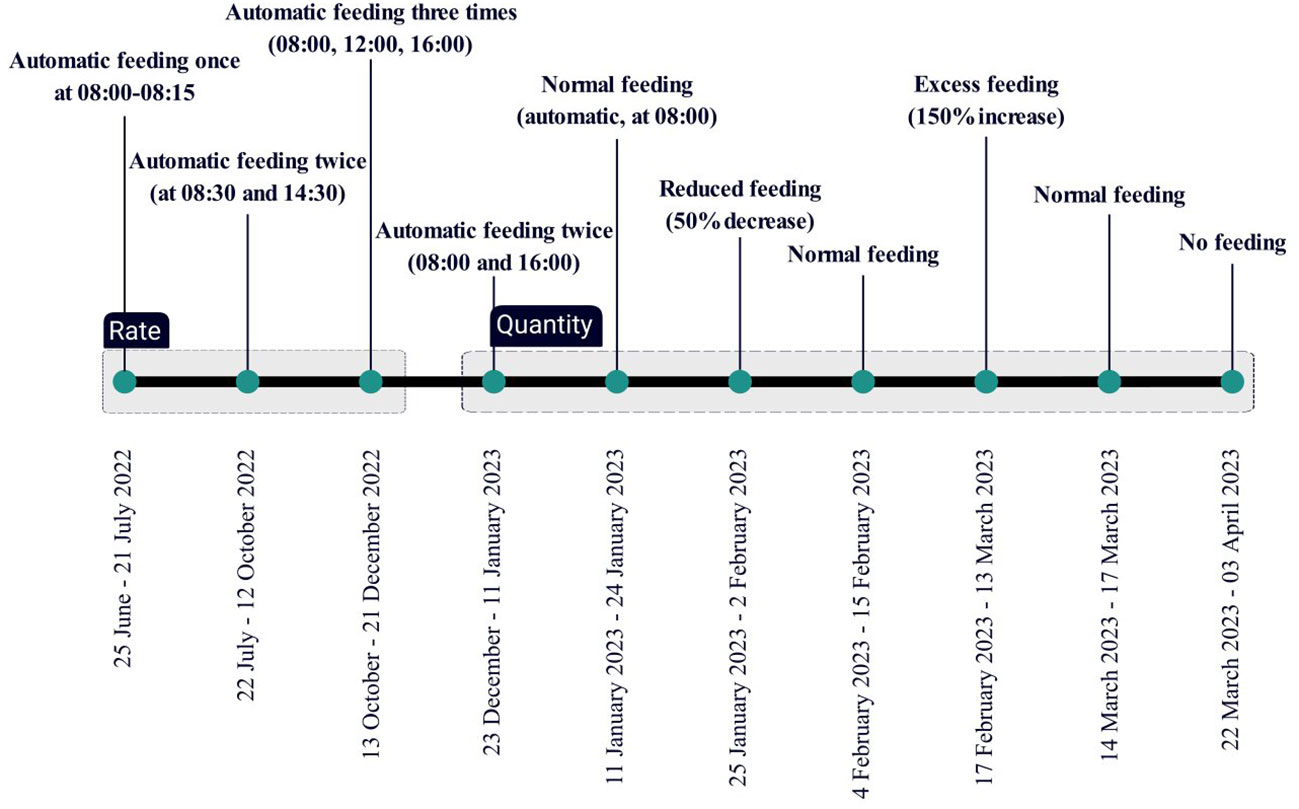
Figure 5 Experimental timeline and planning.
Morning feeding took place between 08:00 and 08:30, as this is the normal feeding schedule in the farm. When the frequency of feeding was two meals per day, then the morning feeding was at 08:00 and the second meal was delivered either in the noon at 14:30 or in the afternoon feeding at 16:00. When 3 meals were provided, this was done during morning, noon and afternoon at the same time as mentioned earlier. On days with multiple feed delivery the overall quantity remained the same. Each feeding treatment lasted for a period of 7-10 days (any variability on the actual days of the treatment was due to weather conditions and husbandry practices). The feed used was standard 6mm pellets for E. seabass (Zoonomi S.A).
2.3 Data analysis
2.3.1 Polynomial fit
As the speed and FBI data are noisy and to ensure an analysis independent of noise, we fit each individual signal with a polynomial curve of degree 10 using the Polynomial.fit() function in Python. This enabled us to keep the signal while removing the noise. All the analysis (except the GMM clustering) was done on the smoothed data.
2.3.2 Asymmetry
To compare the speed and FBI across different feeding scenarios we considered the start of the feeding as a reference axis. This was used to test changes in motion and FBI relative to the start of the feeding in an effort to detect symmetric behaviors of the fish around the feeding time. We, therefore, defined the asymmetry parameter as:
Where f(t) is the signal of interest (the speed or the FBI) at time t (). If this difference is positive, this means that the fish’s activity is higher at time “t” after feeding compared to time “-t”.
2.3.3 Duration of excitation
To estimate the excitation period during feeding, we calculated the total time in which the speed or the FBI was over its average value, after feeding started. The resulted duration was normalized for all experimental cases after being divided by the total feeding duration for comparison purposes and therefore this metric is unitless.
2.3.4 Statistical analysis
We calculated the average and median value for both, the raw and the asymmetry values of the FBI and speed. As our data were not normally distributed, we run Kruskal-Wallis (Kruskal and Wallis, 1952) tests to find any statistical difference between treatments and post hoc Dunn test where necessary (Dunn, 1961) for pairwise comparisons. More specifically, we tested the following: 1) does the average speed and FBI differ significantly for different feeding times and, 2) feeding quantities? 3) Does the asymmetry of the speed and FBI differ significantly for different feeding times and 4) feeding quantities? 5) Does the duration of the excitation of the speed and FBI change for different feeding times and 6) feeding quantities?
2.3.5 Additional analysis for the FBI signal
The FBI was automatically grouped into four different clusters to get insight into the feeding behavior changes in time. We used the function GaussianMixture(), that implements the expectation-maximization (EM) algorithm for fitting mixture-of-Gaussian models, from the scikit-learn library of Python.
3 Results
3.1 Feeding time, feeding frequency
Figure 6 presents the fish speed under the different feeding scenarios (variable feeding times and feeding frequencies). Both, feeding time (F-statistic = 3.78, p-value = 0.02) and feeding frequency (F-statistic = 8.73, p-value< 0.001) significantly affected the speed and the two independent variables showed significant interaction (F-statistic = 4.68, p-value< 0.001, Supplementary Table 1).
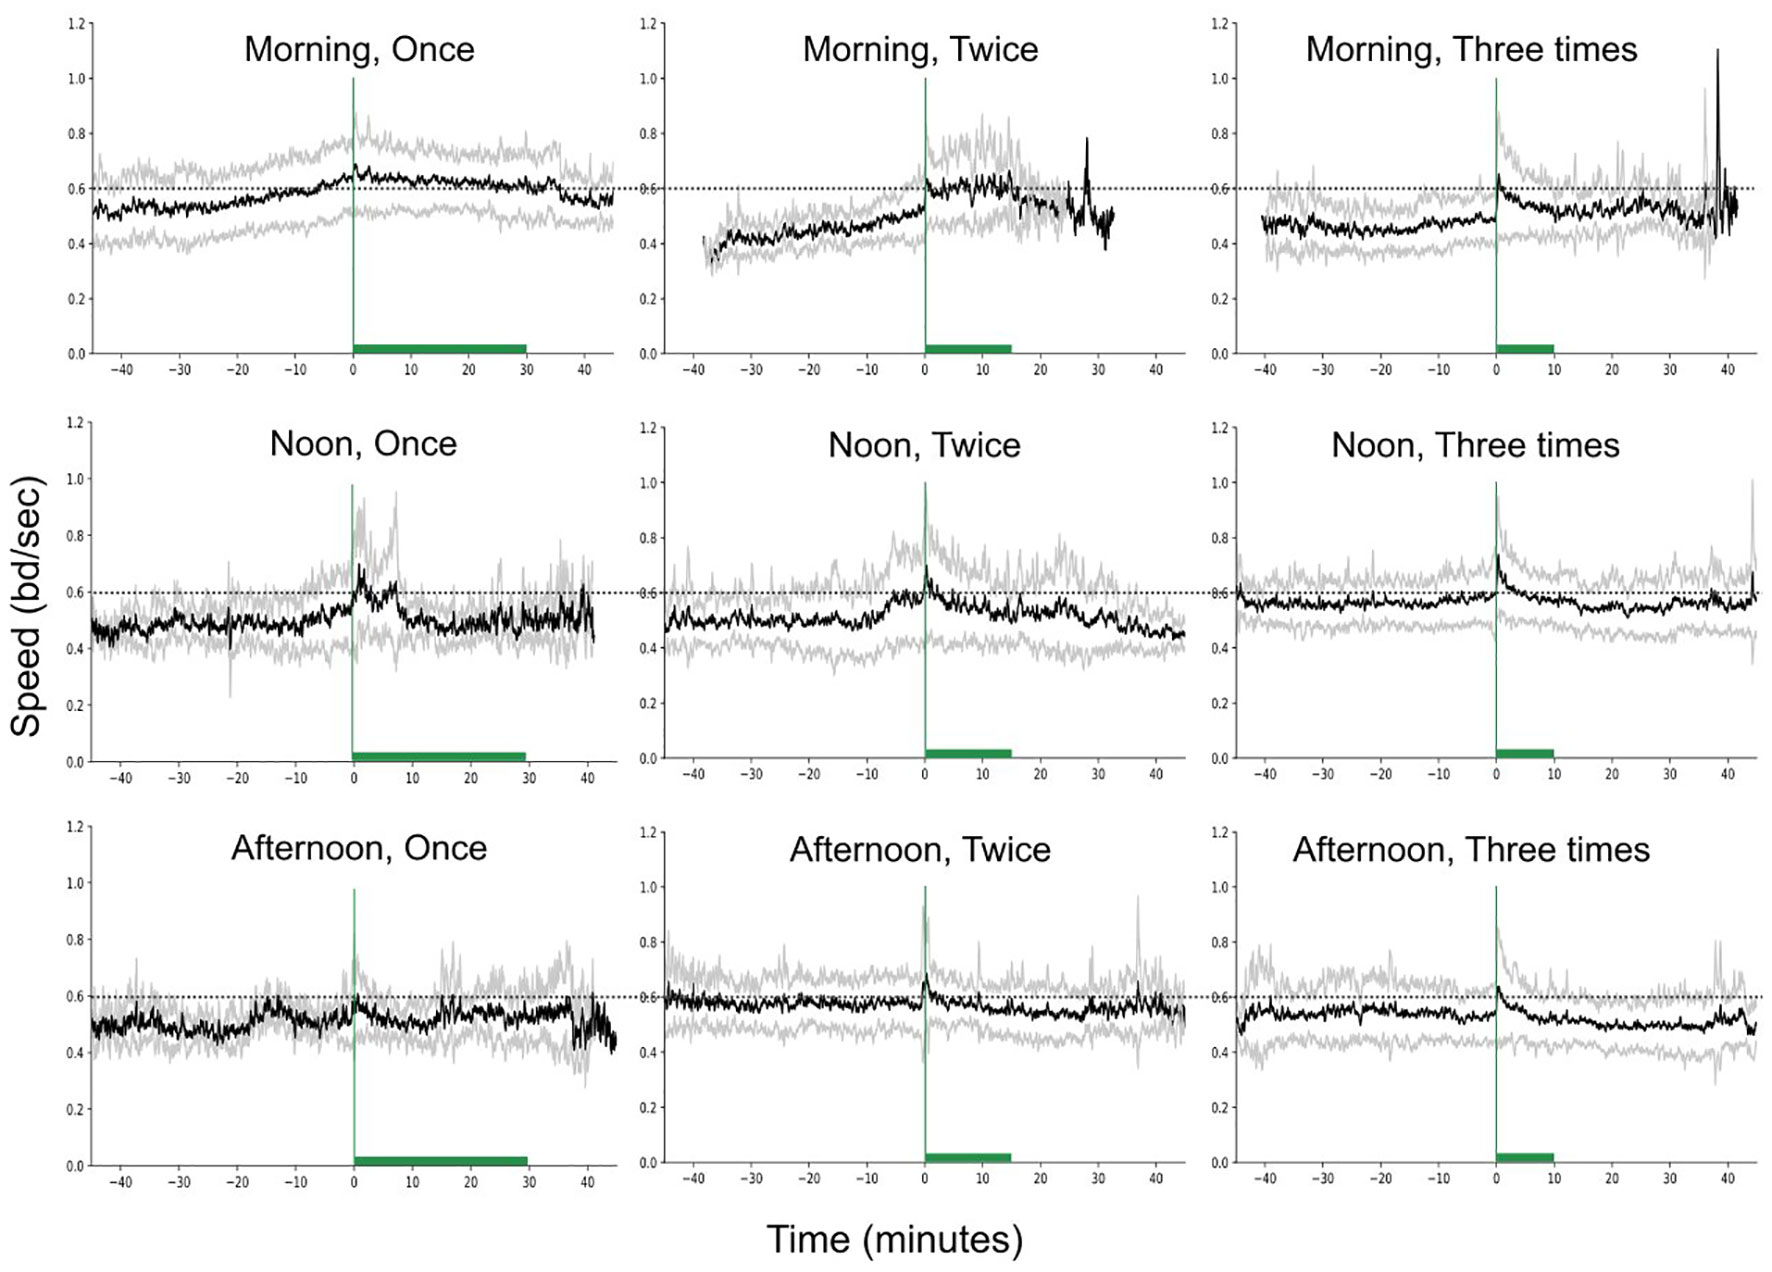
Figure 6 Speed variation (raw data) in time, for different feeding times and frequencies, while keeping the feeding quantity constant. The green vertical lines show the start of feeding while the horizontal bars the duration of feeding. The dashed horizontal lines are reference lines to help comparison between the different scenarios.
The speed was significantly higher in the morning and noon compared to afternoon (Figure 7A; Statistic = 3.63, p-value = 0.056, marginal significance and Statistic = 6.80, p-value = 0.009, respectively). In addition, the speed was significantly higher in the morning when fish were receiving one meal per day (Figures 6, 7B), compared to the morning speed during multiple feedings (Feeding twice: Statistic = 7.72, p-value = 0.005; Feeding three times: Statistic = 19.02, p-value< 0.001).
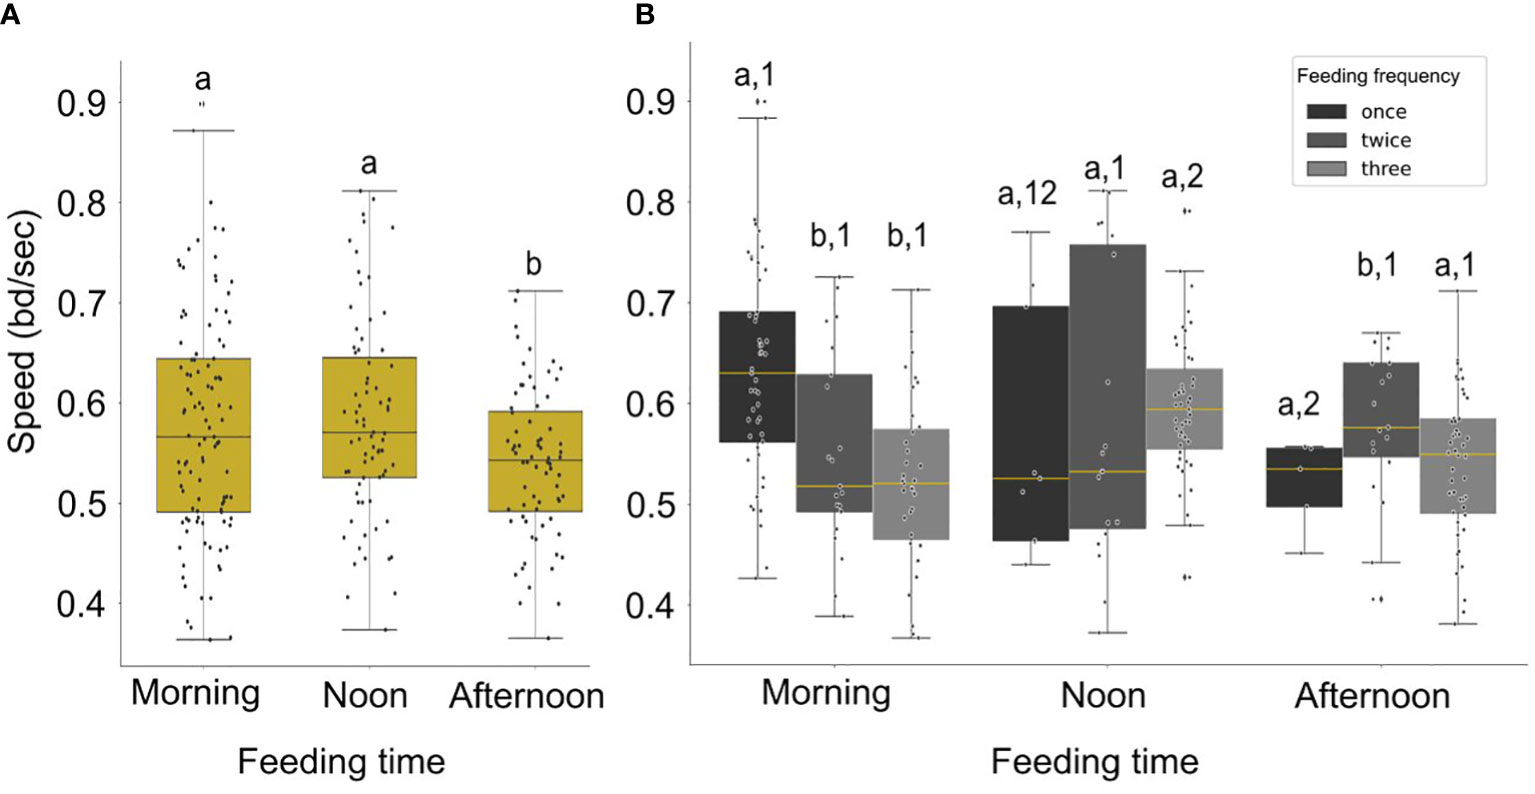
Figure 7 (A) Boxplot of the distribution of the speed (filtered data) for different times of day. Significant differences are indicated by letters. (B) Boxplot of distribution of the average speed (filtered data) for different feeding times and feeding frequencies (black color for one meal per day, dark grey for two meals per day and light grey for three meals per day). Statistically significant differences between frequencies each time of day are indicated by letters and between different times in a day with different numbers.
By observing Figure 6 we see that when the frequency of feeding was three meals per day, the fish presented an asymmetrical motion around the feeding time (Statistic = 12.77, p-value = 0.002; Figure 6). The asymmetry of the speed was significantly stronger when fish were fed in the morning than when fed at noon (Statistic = 12.51, p-value< 0.001) or in the afternoon (Statistic = 8.32, p-value = 0.004). In general, the asymmetry of the speed was on average positive (mean = 0.02 ± 0.06; total range: -0.17 to 0.25), and negative values appeared mainly in the afternoon feeding although were close to zero (mean = 0.0008).
In addition, the duration of the increased activity during feeding was also affected by the different feeding times (Statistic = 39.76, p-value< 0.001). The duration of the excitation decreases significantly if fish are fed at noon (0.5 ± 0.22; Statistic = 22.38, p-value< 0.001) or at afternoon (0.44 ± .25; Statistic = 31.43, p-value< 0.001) in comparison to the morning (0.68 ± 0.27). In contrast, the feeding frequency did not affect the duration of the excitation.
Regarding the feeding behavior index (FBI), we found significant differences between the different feeding times (Figure 8, Statistic = 9.73, p-value = 0.008), but not between different feeding frequencies (Statistic = 1.57, p-value = 0.46). The FBI was minimum during noon feeding and significantly higher during morning (Statistic = 3.73, p-value = 0.05) and afternoon feeding (Statistic = 4.27, p-value = 0.04), when fish were fed once.
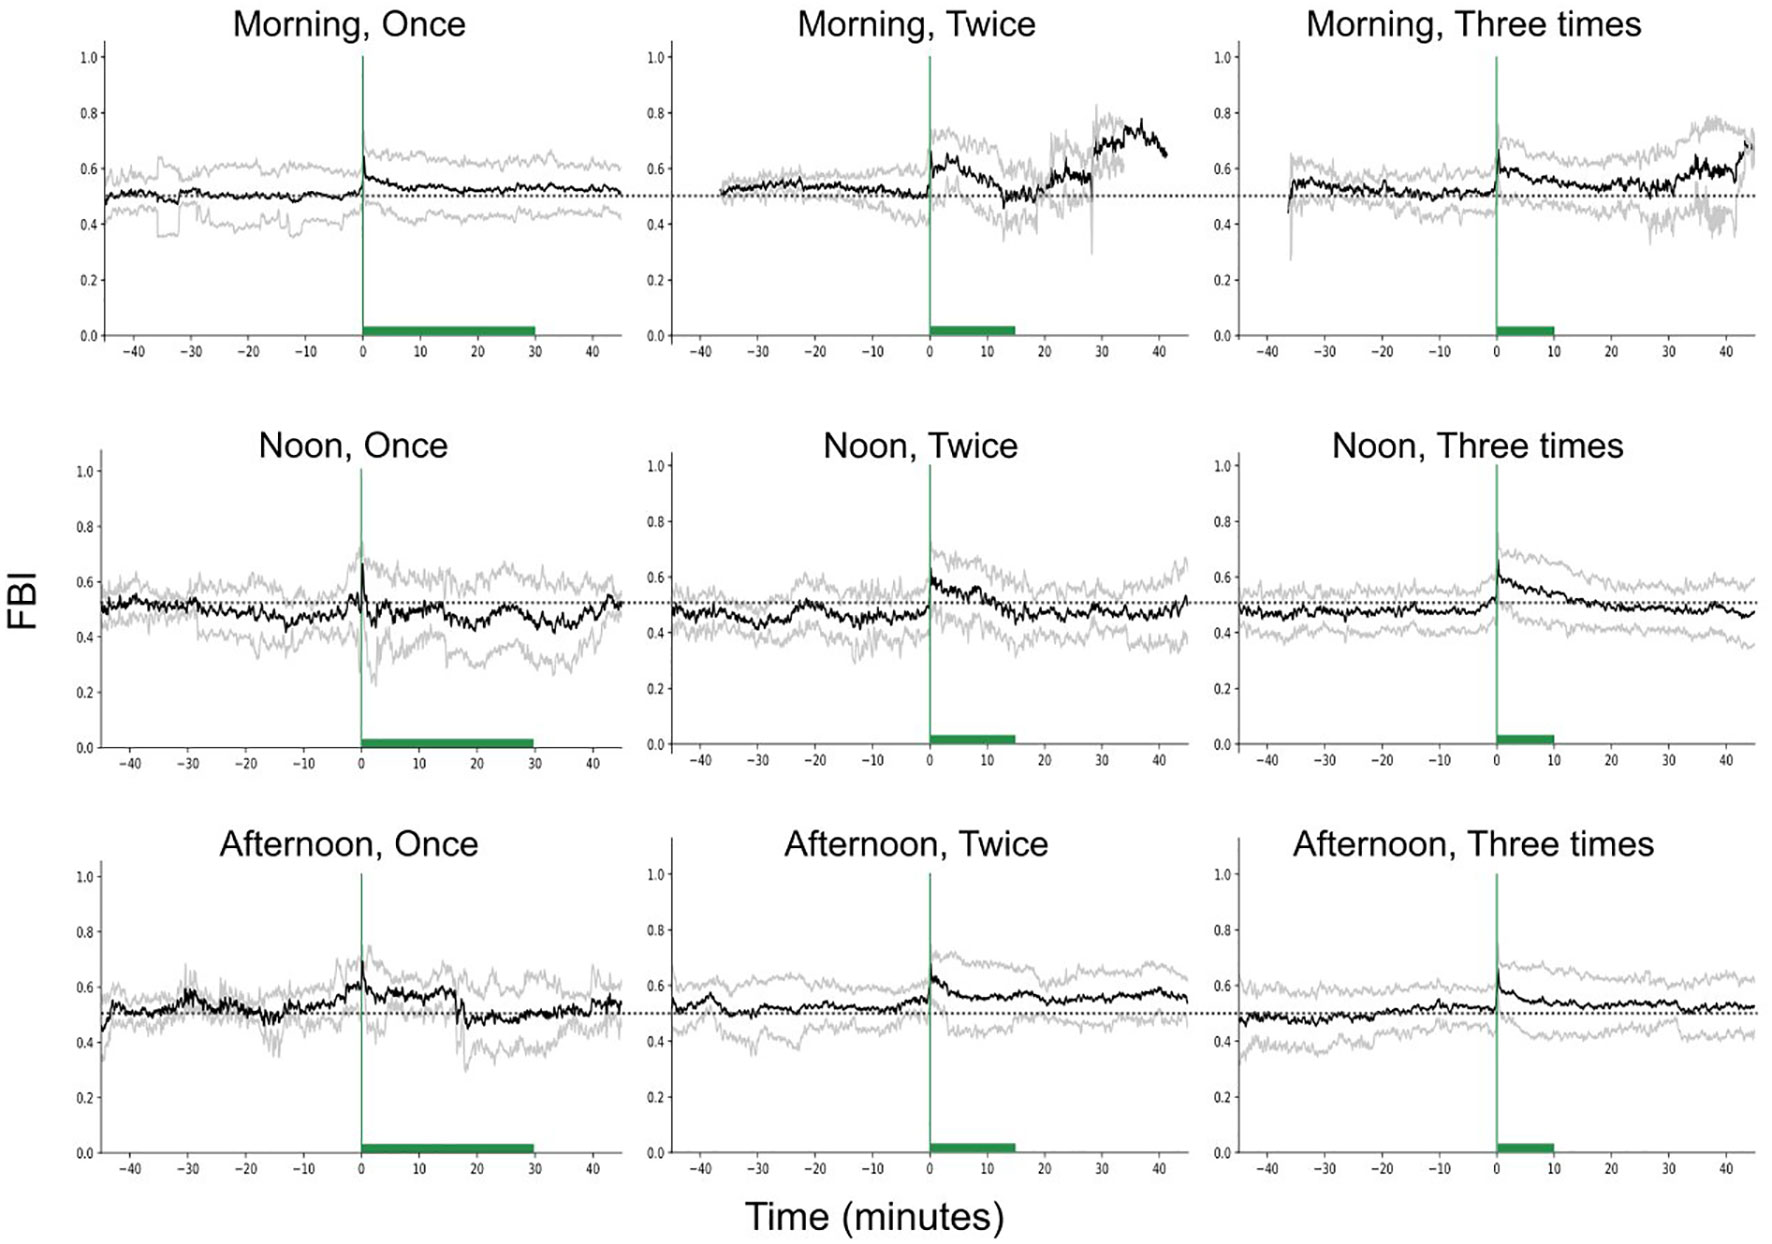
Figure 8 Feeding behavior index (raw data) in time, for different feeding times and frequencies, while keeping the feeding quantity constant. The green vertical lines show the start of feeding while the green bars the duration of the feeding. The dashed horizontal lines are reference lines to help comparison between the different scenarios.
We found differences in the asymmetry for different feeding frequencies (Statistic = 12.25, p-value = 0.002) with the asymmetry to be significantly higher when the feeding frequency was two times (Statistic = 6.29, p-value = 0.01) and three times (Statistic = 11.86, p-value< 0.001) in comparison with one meal per day.
3.2 Feeding quantity
Feeding quantity affected both speed and FBI. In Figure 9 the changes in speed and how it varies around feeding times for the different feeding quantities are shown. There is a clear change in the fish activity relative to the start of the feeding. More specifically for the normal feeding, there is a gradual increase of the speed from 0.5 bd/sec to 0.6 bd/sec (mean speed is 0.54 ± 0.11 bd/secs) before feeding starts followed by a gradual decrease afterwards. In contrast, during the reduced feeding, there is a prolonged increased activity before feeding, and this increase remains for some time after feeding commences before a decrease is observed. The speed during reduced feeding (0.61 ± 0.1 bd/sec) was higher than the one when normal feeding is applied (0.54 ± 0.11 bd/sec; Statistic = 4.48, p-value = 0.03). However, it was not significantly different from the overfeeding (0.57 ± 0.12 bd/sec; Statistic = 1.30, p-value = 0.25) and no feeding case (0.56 ± 0.15 bd/sec; Statistic = 0.10, p-value = 0.75). During overfeeding fish present a quite different pattern in their motion being active during feeding and relaxing only after feeding stops in contrast to the case of no feeding, where fish display an increased activity around the expected feeding time. The duration of excitation for the speed did not present any difference between the conditions tested (Statistic = 1.85, p-value = 0.6).
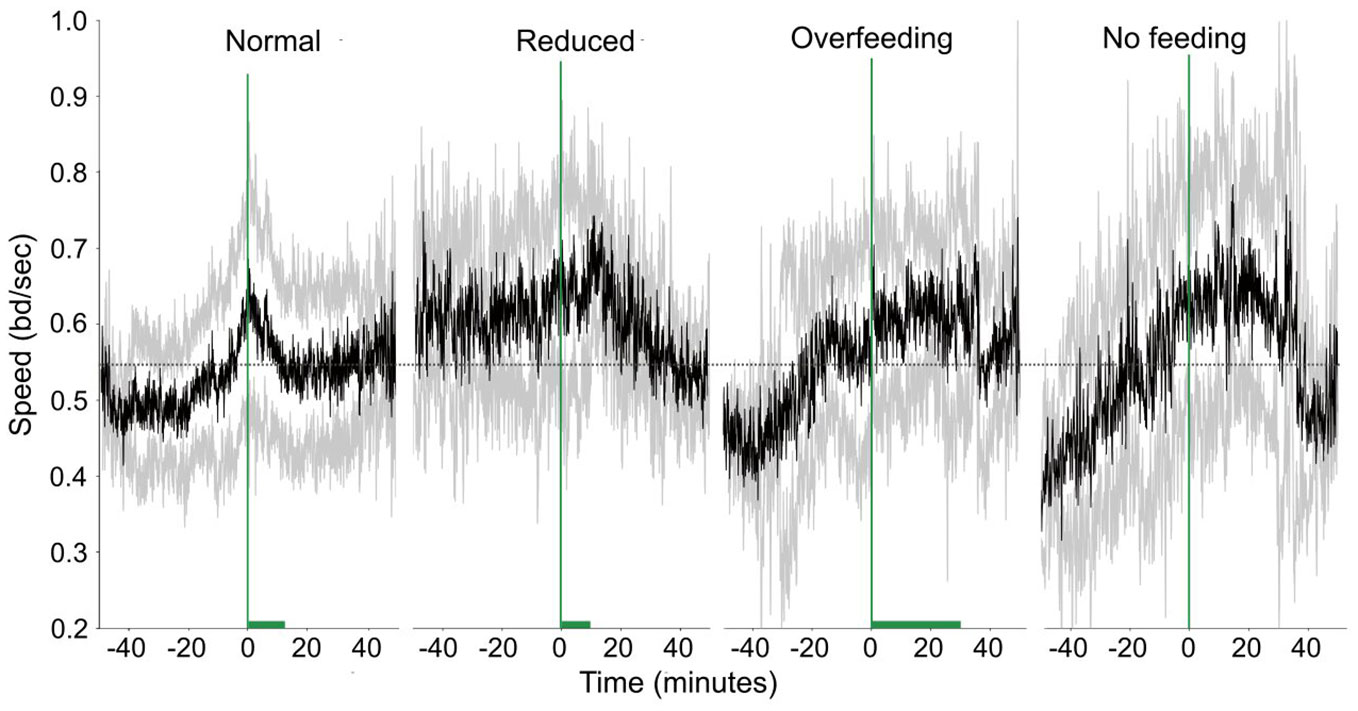
Figure 9 Speed in time (raw data) for different feeding quantities. The green dashed vertical line shows when feeding starts and the green horizontal bar the duration of feeding. The dashed horizontal lines are reference lines to help comparison between the different scenarios.
There is a distinct pattern of asymmetry for fish speed between the different feeding quantities (Figure 10). When fish are fed with normal quantities, the asymmetry is stable and close to 0, suggesting that the fish’s activity is symmetric around feeding time. In contrast, when fish are fed reduced quantities or are overfed, an asymmetry in their activity around feeding times is observed, being different between the two feeding scenarios. In particular, when fish received reduced quantities, showed an increased activity prior to feeding while during overfeeding the increased activity is expressed after feeding. There is no specific pattern of asymmetry when fish receive no feed. There are no statistically significant differences however in the average asymmetry between different treatments (Statistic = 1.57; p-value = 0.67).
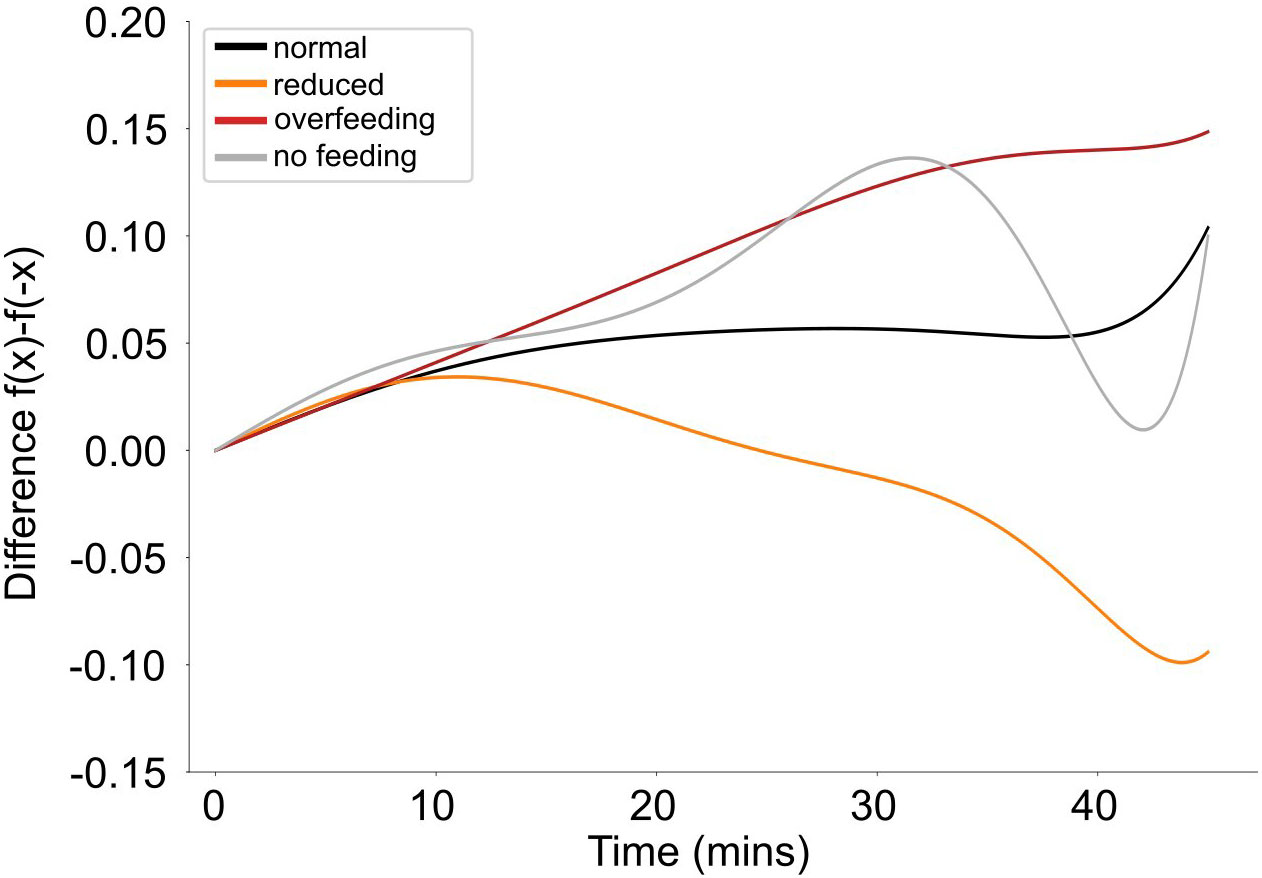
Figure 10 Average asymmetry of the speed (filtered data) for different feeding quantities (different colors).
The changes of the FBI (Figure 11) around feeding times also vary for the different feeding scenarios. In general, the fish immediately respond to the start of feeding and a sharp increase of the FBI is observed. During the reduced feeding, the increase is sharper, and the FBI signal is larger than normal feeding, while during the overfeeding, the signal is smaller. Although we see differences in the data, we could not show statistically for the raw FBI (Statistic = 5.66, p-value = 0.13) or the asymmetry of FBI (Statistic = 5.67, p-value = 0.13).
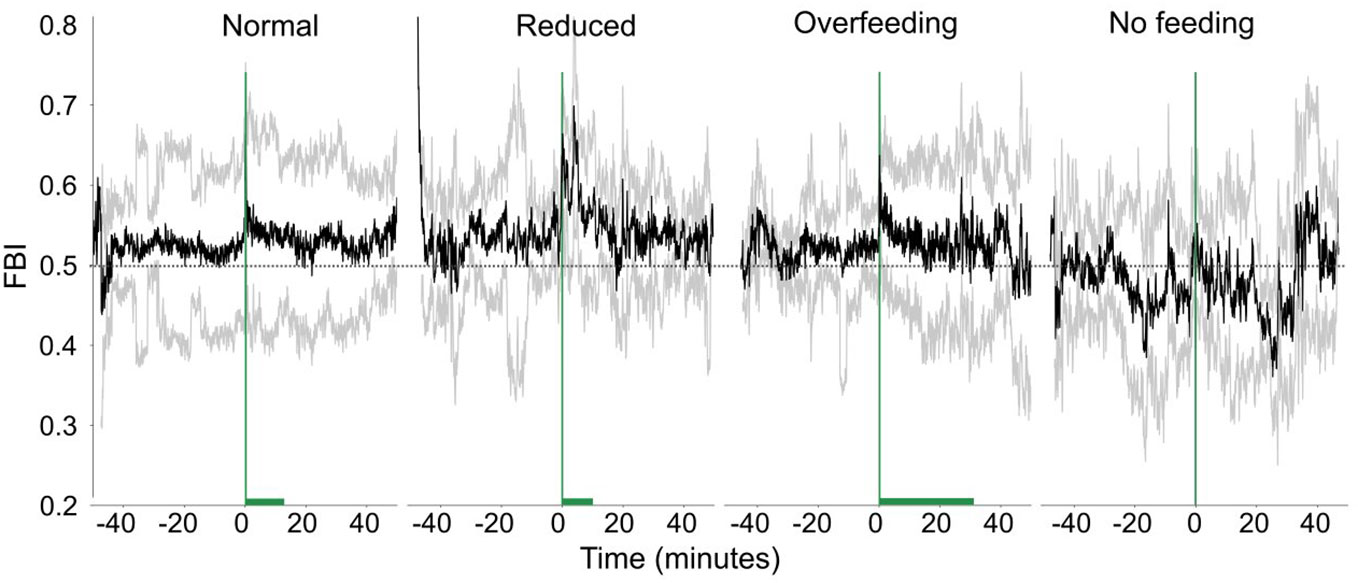
Figure 11 The feeding behavior index (FBI, raw data) in time for different feeding quantities. The green vertical line shows when feeding starts and the green horizontal bar the duration of feeding. The dashed horizontal lines are reference lines to help comparison between the different scenarios.
The duration of excitation for the FBI signal is variable for the different feeding scenarios (Figure 12). During normal and reduced feeding the excitation lasts longer (0.67 and 0.70, respectively) than during the overfeeding (0.57), while the minimum was during no feeding (0.55). Despite the observed differences there was no statistically significant difference between the tested conditions (Statistic = 5.11, p-value = 0.16).
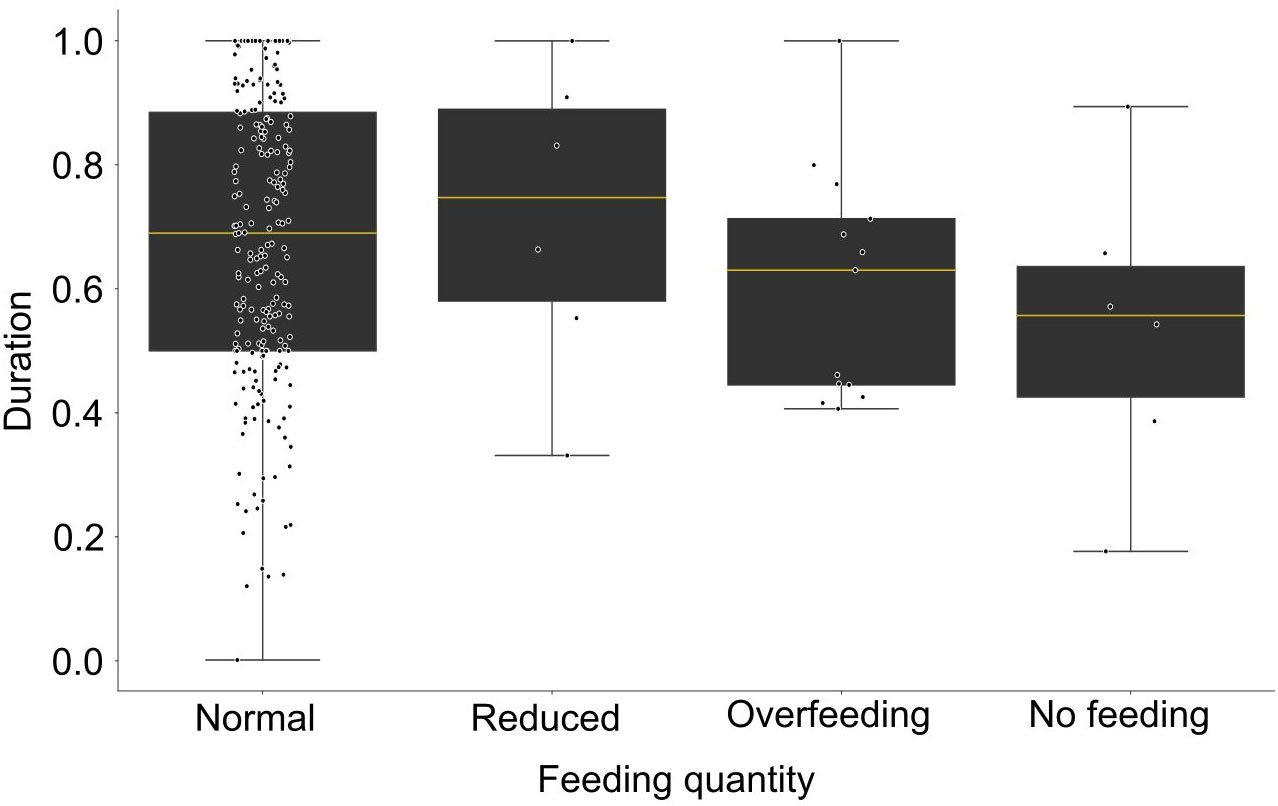
Figure 12 Boxplot of the duration of excitation of the feeding behavior index (expressed in ratio, filtered data) for different feeding quantities.
Taking as reference the normal feeding scenario, we determined distinct FBI clusters applying the Gaussian Mixture Model clustering (Figure 13). Four clusters were identified, the pre-feeding (black color), two feeding clusters (red and grey) and a post-feeding one (blue). The first of the two feeding clusters refers to the period immediately after feeding commences (red) and lasts almost half of the total feeding period, while the second one (grey) lasts until the end of feeding (grey). In comparison to normal feeding, during overfeeding, the post-feeding cluster appears 10 mins before the feeding stops. In contrast, during reduced feeding the second feeding cluster is prolonged several minutes after feeding stopped. Finally, during fasting, the pre-feeding cluster lasts longer, covering partly the expected feeding period.
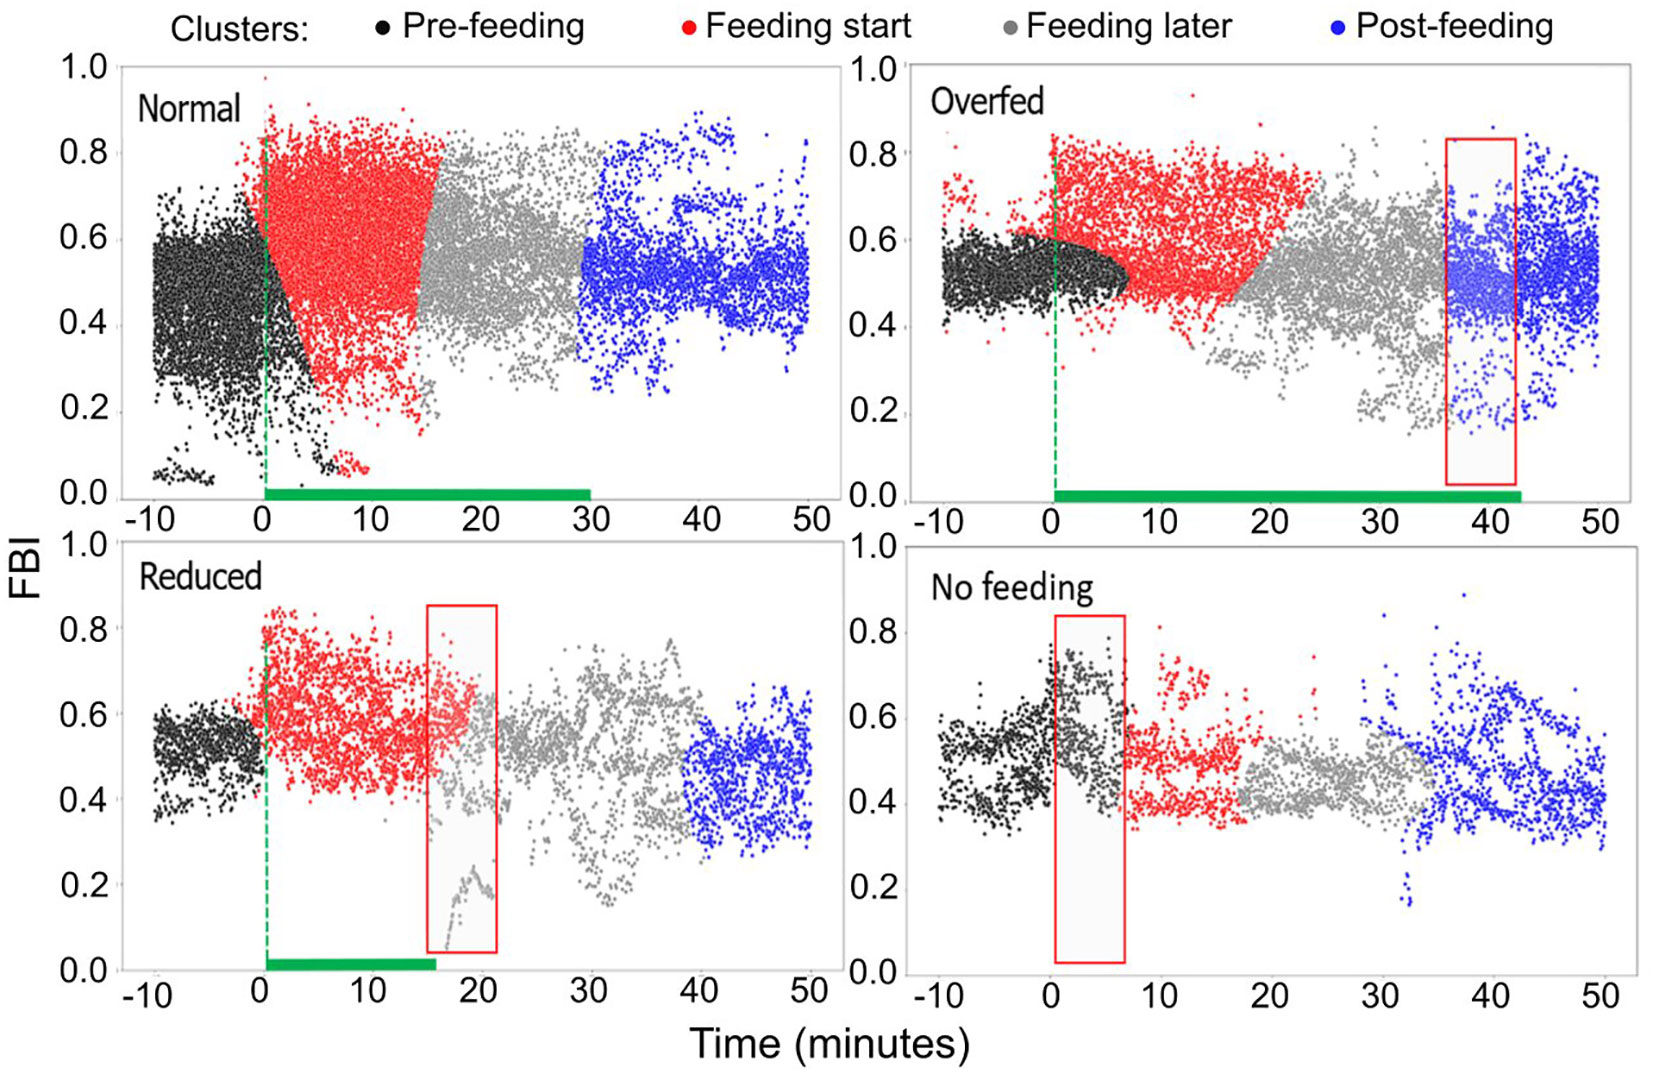
Figure 13 Clustering of the FBI for different feeding quantities (raw data). Black color: the pre-feeding, red color: feeding cluster immediately after feeding starts, grey color: feeding cluster at the later stages of feeding, blue color: post-feeding cluster.
4 Discussion
In the present study, our objective was to address the lack of feeding control systems in sea cages. For this, we developed a system capable of continuously monitoring the feeding behavior of European seabass within the cages. To achieve this, we employed a combination of AI models (YOLO and DEEPSORT) along with computer vision techniques. To test our system and the sensitivity of the parameters to feeding we conducted a long-term experiment with variable feeding scenarios. We examined two different behavioral parameters, the group speed, and the feeding behavioral index. All tested parameters varied for different feeding scenarios suggesting they could be used for feeding control. Our findings suggest that fish exhibit distinct behavioral patterns in response to various feeding situations, and for both, the speed and feeding behavior index, can identify threshold values that correspond to satiation levels, facilitating controlled feeding. To our knowledge, this is the first study to have developed a continuous, real-time monitoring system for feeding control in sea cages and discusses reference curves that can facilitate feeding control.
Our monitoring system exhibits both advantages and limitations. On one hand, we successfully developed an online system capable of individual-level fish tracking. However, we observed that the tracking performance decreases with increasing shoal density, particularly during feeding. To address this, further annotation is required to improve tracking in such scenarios. To monitor behavior in high densities, we developed a group-level behavioral metric, the feeding behavior index (FBI). Although the FBI remains unaffected by fish density, it is negatively impacted by varying lighting conditions. While we partially addressed this issue by removing the background, additional refinement is necessary. We also tried our individual-level tracking system for different species, i.e., the gilthead seabream and the salmon, and without extra annotation, we could successfully track them in different farms (unpublished data). This is because our camera points upwards and the annotation includes fish that have very high contrast with the background, with a dark silhouette. Therefore, fish from different species look similar enabling flexibility for the selection of species.
Speed showed significant sensitivity, both quantitatively and qualitatively to the different feeding scenarios. Our findings show, in accordance with previous works (Miyazaki et al., 2000; Priyadarshana et al., 2006; Hansen et al., 2015a, Hansen et al., 2015b), that fish increase their speed in response to higher hunger levels. More specifically, there was higher speed in the morning in comparison with noon and afternoon, higher speed if the fish are fed once in comparison with multiple feedings, and higher speed in reduced feeding in comparison with normal feeding. Other studies, i.e., of Riddell and Webster (2017), in a different setup offer contrasting findings, as they show that hunger is not necessarily correlated with the time that individuals find and approach prey patches. This deviation could be explained by the differences in the species studied, their social structure and the small number of fish in the group (Hansen et al., 2020) and additionally by the fact that in our case the fish group has been habituated to receive feed in specific times at a specific area of their environment. During no feeding we did not see a significantly increased speed, during the whole day outside the feeding times something that we would potentially expect. One explanation for this could be that the prolonged hunger acts as a chronic stressor and the group adapts to conserve energy (Lankford et al., 2005). Although we see a difference in the speed between reduced feeding and overfeeding, this was not significant. This could be either because the level of hunger for individuals of the body size used in the trial was not perceived as chronic stress, or due to the duration of each trial that did not last for more than 10 days, a period that probably is not sufficient for the applied restriction on feed to be considered as a chronic stressor for E. seabass for which longer periods are needed (Santos et al., 2010). Further experiments are required with longer trials of different feeding quantities.
We detected significant differences in the speed asymmetry between different times only when the frequency of feeding was three times daily and not in other feeding frequencies. This could show that the time interval between consecutive feeding events can affect the response of the fish on feeding. Fish that feed more frequently have on average lower speed and probably weaker anticipation for food. Weaker anticipation would be seen as a more symmetrical behavior around feeding times. As the normal feeding schedule for this fish stock was to feed once per day, the fish showed a more symmetrical behavior in the morning. The fact that we did not detect respective significant differences when the frequency was two meals per day could suggest that the effect of the time interval between feeding events on the fish behavior could also be important and needs to be tested. Depending on the digestion rate (which also depends on temperature, feed composition and oxygen availability), stomach may not empty sufficiently for the fish to feel hungry again, until several hours have passed from their last meal (Adamidou et al., 2009; Gilannejad et al., 2019). The hypothalamus is responsible for controlling appetite and integrates information from different sources, i.e., the endocrine signals, the nutrient levels and the presence/absence of food in the gastrointestinal gut (Rønnestad et al., 2017). The differences seen could also be explained by the circadian rhythms and the environmental variability (Assan et al., 2021), something that should be tested in the future. Previous studies on different species demonstrated that the feeding frequency can be optimal under specific scenarios there must be an optimal feeding frequency (Paspatis et al., 2000; Hassan et al., 2021; Priya et al., 2021) in which the fish do show minimal stress levels, optimal energy expenditure and higher satiation levels.
The frequency of feeding has a significant impact on the fish’s behavioral response. While it is a common practice to feed fish once daily, this approach may lead to heightened excitation levels during feeding time, potentially indicating increased energy expenditure, elevated stress levels, or more instances of abrasion, negatively affecting the fish’s welfare (Rønnestad et al., 2017; Assan et al., 2021). This could suggest that providing multiple meals in a day would be better for the fish. However, it’s important to note that these observations are speculative, as it remains challenging to directly link the higher speed to the fish’s actual satiation level (Adamidou et al., 2009; Gilannejad et al., 2019). Further research could be therefore suggested to sample fish stomachs and/or blood for satiety markers. Our hypothesis arises from comparing the speed between different feeding frequencies and feeding times, but as well between normal and reduced feeding quantities, where we observed a substantial increase in activity when fish are underfed. Nevertheless, we must carefully define welfare in fish and identify reference behaviors, deviations from which could serve as indicators of hunger. Further studies are required for this.
The feeding behavior index (FBI) also showed sensitivity to different feeding scenarios. The average FBI showed a minimal plateau at noon and was high during morning and afternoon. The asymmetry of the excitation increased in multiple feedings, something that could be explained as in the case of speed asymmetry. From our analysis we observe that the excitation lasts longer when fish are underfed and thus, feel hungry. However, the opposite happens when fish are fasting. During this period, the fish show excitation for shorter times, suggesting that during long-term fasting fish adapt their behavior and the energy expenditure (Gilannejad et al., 2019). To our knowledge, there are no similar studies that use a similar index.
We have not identified any existing work that introduces the Fish Behavioral Index (FBI) in cages in the manner presented here. While there are studies that quantify population activity and its progression by detecting changes in the water surface (Atoum et al., 2015), none directly quantifies changes in fish density within cages. Another set of studies (Zhou et al., 2018b) introduces a similar index, the Feeding Behavior Quantification Factor (FIFFB), reflecting fish aggregation. However, these studies employ Delaunay triangulation in a more controlled and static environment, specifically in Recirculating Aquaculture Systems (RAS). In contrast, our presented metric, the FBI, is distinct and designed for dynamic environments such as cages. Further research (Zhao et al., 2016) has quantified shoal dispersion using a statistical joint histogram related to motion vectors derived from optical flow analysis. However, this metric differs from the FBI, and its applicability is limited to static environments, specifically RAS systems. In summary, our approach with the FBI in cages is novel and distinct from existing methods, offering a valuable contribution to understanding fish behavior in dynamic aquatic settings.
The two variables tested here, the speed and the FBI, showed some differences in their sensitivity to the variable feeding scenarios. The FBI showed a minimal plateau at noon while it was high during morning and afternoon. The speed variable is dynamic and although here it is studied at the group-level, is directly affected by the metabolic state of the fish and the fish energy requirements and reservoirs. In contrast, the FBI is a spatial variable that shows the crowding behavior of the group, and although dynamic, it is not directly linked to the metabolic state of the fish. The fact that the FBI showed a minimal plateau during noon, and higher activity during morning and afternoon suggests that this is an indicator that expresses the specific dual (diurnal/nocturnal) feeding behavior of seabass, i.e., during morning and dusk mostly than during the day.
We also showed that the activity expressed by the FBI can be grouped into four different clusters of behaviors, one pre-feeding cluster, two feeding clusters (the first that shows the feeding behavior at the initial period of the feeding and the second the behavior during the relaxation of the feeding) and the post feeding cluster. In addition, we showed that the duration of these feeding clusters could be affected by the different feeding quantities. This methodology could therefore be used in the future to achieve automatic detection of the satiation state of the fish and could help to control feeding better. Other potential tools that could help us predict and control feeding would be the detection of the transition point between the feeding and post feeding clusters. We have preliminary unpublished results, that show that the use of changepoint analysis and the prediction of the future value of FBI using neural networks could be very useful for the early detection and adjustment of feeding needs of the fish. Despite not yet achieving real-time feeding control, our work encompasses the development and presentation of valuable tools for inferring fish satiation levels. Consequently, there are two feasible approaches to controlling feeding: asynchronous and synchronous. The first involves evaluating today’s feeding and adjusting the quantity for the following day accordingly. Alternatively, we can anticipate the evolution of the control parameter using neural networks and make feeding adjustments when the prediction indicates that a specific threshold has been reached.
Until now, we showed that our system can reveal important information on the feeding state at the group-level. As shown previously, disparities in the internal condition of fish can serve as a significant source of heterogeneity within animal groups (Wilson et al., 2019; Jolles et al., 2020). It would be, therefore, very interesting to see if this heterogeneity of the internal satiation state of the fish is also expressed at the group-level. If this is the case, then, by designing appropriate experiments, we could work to identify specific behavioral parameters that can quantify the percentage of the hungry fish in the cage. Previous laboratory studies have already shown that differences in the hungry/satiated ratio can impact also the collective behavior of the fish (Wilson et al., 2019). However, these studies are controlled and with a limited number of individuals. Findings such the above but at large scales in farms, would be very valuable for the optimization of the feeding and the improvement of the welfare of the fish.
Changes in the main parameters of the farm environment (e.g., water temperature, dissolved oxygen concentration, pH value, and ammonia nitrogen compounds) can directly affect the appetite and food intake of fish (Stoner et al., 2006; Remen et al., 2016). For example, when fish eat, the concentration of local dissolved oxygen may decrease. Uneaten pellets deposit on the bottom of the water also causes changes in dissolved oxygen and ammonia nitrogen compound concentrations (Skøien et al., 2016; Li et al., 2017). Although the influence of these parameters on the feeding behavior was not part of the current study and are highly influenced by the hydrodynamics in the farm, especially in cage aquaculture, we believe it is necessary to study these in the future. Previous studies have shown that fish have different energy demands at different temperatures (Krumschnabel and Wieser, 1994; Krumschnabel et al., 1997; Volkoff and Rønnestad, 2020). Therefore, differences in the environmental conditions could potentially demand adaptation of the reference curves and the satiation thresholds.
To conclude, our work focused on developing tools for the real-time monitoring and analysis of the European seabass behavior at sea cages, providing preliminary results from a feeding experiment, to show the tools’ potential. Data on the feeding behavior variations of European seabass are scarce at sea cages. For this, our work has a significant contribution on the field of behavioral monitoring of the Mediterranean species in sea cages. Further data collection of long-time experiments and different feeding parameters is required to enhance the findings of our experiment. Although the system is developed for the European seabass, it is also tested and shows promising results for the gilthead seabream and also salmon. Additionally, we successfully identified distinct behavioral characteristics of the fish under various conditions, including normal, reduced feeding, over-feeding, and fasting. Up to now, we have not achieved full control of the feeding process. Nonetheless, we provided reference values and curves. Moving forward, our next objective is to explore additional feeding scenarios to further enhance the system’s capabilities.
Data availability statement
The raw data supporting the conclusions of this article will be made available by the authors, without undue reservation.
Ethics statement
The animal studies were approved by the Ethics Committee of the IMBBC and the relevant veterinary authorities (Ref Number 32257 09-02-2021). The studies were conducted in accordance with the local legislation and institutional requirements. Written informed consent was obtained from the owners for the participation of their animals in this study.
Author contributions
DG: Conceptualization, Data curation, Formal analysis, Investigation, Methodology, Software, Validation, Visualization, Writing – original draft, Writing – review & editing. CV: Data curation, Formal analysis, Methodology, Software, Writing – review & editing. NP: Conceptualization, Funding acquisition, Investigation, Project administration, Resources, Supervision, Visualization, Writing – review & editing.
Funding
The author(s) declare financial support was received for the research, authorship, and/or publication of this article. This work was partially funded by the EU Horizon 2020 iFishIENCi project (818036).
Acknowledgments
The authors would like to thank Michalis Asderis for all the technical support he provided at the farm site and the two reviewers for their constructive comments.
Conflict of interest
The authors declare that the research was conducted in the absence of any commercial or financial relationships that could be construed as a potential conflict of interest.
Publisher’s note
All claims expressed in this article are solely those of the authors and do not necessarily represent those of their affiliated organizations, or those of the publisher, the editors and the reviewers. Any product that may be evaluated in this article, or claim that may be made by its manufacturer, is not guaranteed or endorsed by the publisher.
Supplementary material
The Supplementary Material for this article can be found online at: https://www.frontiersin.org/articles/10.3389/fmars.2024.1350385/full#supplementary-material
References
Abecasis D., Steckenreuter A., Reubens J., Aarestrup K., Alós J., Badalamenti F., et al. (2018). A review of acoustic telemetry in Europe and the need for a regional aquatic telemetry network. Anim. Biotelemetry 6, 1–7. doi: 10.1186/s40317-018-0156-0
Adamidou S., Nengas I., Alexis M., Foundoulaki E., Nikolopoulou D., Campbell P., et al. (2009). Apparent nutrient digestibility and gastrointestinal evacuation time in European seabass (Dicentrarchus labrax) fed diets containing different levels of legumes. Aquaculture 289, 106–112. doi: 10.1016/j.aquaculture.2009.01.015
Alanärä A., Kadri S., Paspatis M. (2001). Feeding management. Food Intake Fish 332–353. doi: 10.1002/9780470999516.ch14
Al-Jubouri Q., Al-Nuaimy W., Al-Taee M. A., Young I. (2017). “Computer stereovision system for 3D tracking of free-swimming zebrafish,” in 2017 10th International Conference on Developments in eSystems Engineering (DeSE). (Paris, France: Institute of Electrical and Electronics Engineers Inc), 188–192. doi: 10.1109/DeSE.2017.31
Alzubi H. S., Al-Nuaimy W., Buckley J., Young I. (2016). “An intelligent behavior-based fish feeding system,” in 13th International Multi-Conference on Systems, Signals and Devices, SSD 2016. 22–29 (Institute of Electrical and Electronics Engineers Inc). doi: 10.1109/SSD.2016.7473754
An D., Huang J., Wei Y. (2021). A survey of fish behaviour quantification indexes and methods in aquaculture. Rev. Aquaculture 13, 2169–2189. doi: 10.1111/raq.12564
Ang K. P. (1998). Pellet wastage, and subsurface and surface feeding behaviours associated with different feeding systems in sea cage farming of salmonids. Aquac. Eng. 18 (2), 95–115. doi: 10.1016/S0144-8609(98)00026-0
Arechavala-Lopez P., Nazzaro-Alvarez J., Jardí-Pons A., Reig L., Carella F., Carrassón M., et al. (2020). Linking stocking densities and feeding strategies with social and individual stress responses on gilthead seabream (Sparus aurata). Physiol. Behav. 213, 112723. doi: 10.1016/j.physbeh.2019.112723
Assan D., Huang Y., Mustapha U. F., Addah M. N., Li G., Chen H. (2021). Fish feed intake, feeding behavior, and the physiological response of apelin to fasting and refeeding. Front. Endocrinol. (Lausanne) 12. doi: 10.3389/fendo.2021.798903
Atoum Y., Srivastava S., Liu X. (2015). Automatic feeding control for dense aquaculture fish tanks. IEEE Signal Process. Lett. 22, 1089–1093. doi: 10.1109/LSP.2014.2385794
Benhaïm D., Bégout M. L., Péan S., Brisset B., Leguay D., Chatain B. (2012). Effect of fasting on self-feeding activity in juvenile sea bass (Dicentrarchus labrax). Appl. Anim. Behav. Sci. 136, 63–73. doi: 10.1016/j.applanim.2011.11.010
Brännäs E., Alanärä A. (1993). Monitoring the feeding activity of individual fish with a demand feeding system. J. Fish Biol. 42, 209–215. doi: 10.1111/j.1095-8649.1993.tb00322.x
Chang C. M., Fang W., Jao R. C., Shyu C. Z., Liao I. C. (2005). Development of an intelligent feeding controller for indoor intensive culturing of eel. Aquac Eng. 32, 343–353. doi: 10.1016/j.aquaeng.2004.07.004
Chen I. H., Georgopoulou D. G., Ebbesson L. O. E., Voskakis D., Lal P., Papandroulakis N. (2023). Food anticipatory behaviour on European seabass in sea cages: activity-, positioning-, and density-based approaches. Front. Mar. Sci. 10. doi: 10.3389/fmars.2023.1168953
Conde-Sieira M., Chivite M., Míguez J. M., Soengas J. L. (2018). Stress effects on the mechanisms regulating appetite in teleost fish. Front. Endocrinol. (Lausanne) 9. doi: 10.3389/fendo.2018.00631
de Mattos B. O., Sousa E., da S., Saboia W. A., Santana T. M., Corrêa M.A.de A., et al. (2022). Effects of three feeding strategies (self-feeders, automatic feeding and apparent satiety) on growth performance, haematological parameters, waste excretion and feed cost in Amazonian fish (Colossoma macropomum). Aquaculture Res. 53, 4531–4539. doi: 10.1111/are.15950
Dunn O. J. (1961). Multiple comparisons among means. J. Am. Stat. Assoc. 56, 52–64. doi: 10.1080/01621459.1961.10482090
Fang W., Chang C. M. (1999). “Development of an automatic feeder with the capability of knowing when to stop feeding,” in Proceedings of the Annual International Conference and Exposition of the World Aquaculture society, Vol. 26. (Australia), 251.
FAO. (2022). “The state of world fisheries and aquaculture 2022,” Towards Blue Transformation (Rome: FAO). doi: 10.4060/cc0461en
Fast A. W., Qin T., Szyper J. (1997). A new method for assessing fish feeding rhythms using demand feeders and automated data acquisition. Aquac Eng. 16, 213–220. doi: 10.1016/S0144-8609(97)00003-4
Føre M., Svendsen E., Alfredsen J. A., Uglem I., Bloecher N., Sveier H., et al. (2018). Using acoustic telemetry to monitor the effects of crowding and delousing procedures on farmed Atlantic salmon (Salmo salar). Aquaculture 495, 757–765. doi: 10.1016/j.aquaculture.2018.06.060
Foster M., Petrell R., Ito M. R., Ward R. (1995). Detection and counting of uneaten food pellets in a sea cage using image analysis. Aquac. Eng. 14 (3), 251–269. doi: 10.1016/0144-8609(94)00006-M
Georgopoulou D. G., Fanouraki E., Voskakis D., Mitrizakis N., Papandroulakis N. (2022). European seabass show variable responses in their group swimming features after tag implantation. Front. Anim. Sci. 3, 997948. doi: 10.3389/fanim.2022.997948
Georgopoulou D. G., Stavrakidis-Zachou O., Mitrizakis N., Papandroulakis N. (2021). Tracking and analysis of the movement behavior of european seabass (Dicentrarchus labrax) in aquaculture systems. Front. Anim. Sci. 2. doi: 10.3389/fanim.2021.754520
Gilannejad N., Silva T., Martínez-Rodríguez G., Yúfera M. (2019). Effect of feeding time and frequency on gut transit and feed digestibility in two fish species with different feeding behaviours, gilthead seabream and Senegalese sole. Aquaculture 513, 734438. doi: 10.1016/j.aquaculture.2019.734438
Han F., Zhu J., Liu B., Zhang B., Xie F. (2020). Fish shoals behavior detection based on convolutional neural network and spatiotemporal information. IEEE Access 8, 126907–126926. doi: 10.1109/Access.6287639
Hansen M. J., Ligocki I. Y., Zillig K. E., Steel A. E., Todgham A. E., Fangue N. A. (2020). Risk-taking and locomotion in foraging threespine sticklebacks (Gasterosteus aculeatus): the effect of nutritional stress is dependent on social context. Behav. Ecol. Sociobiol 74, 1–12. doi: 10.1007/s00265-019-2795-4
Hansen M. J., Schaerf T. M., Ward A. J. W. (2015a). The effect of hunger on the exploratory behaviour of shoals of mosquitofish Gambusia holbrooki. Behaviour 152, 1659–1677. doi: 10.1163/1568539X-00003298
Hansen M. J., Schaerf T. M., Ward A. J. W. (2015b). The influence of nutritional state on individual and group movement behaviour in shoals of crimson-spotted rainbowfish (Melanotaenia duboulayi). Behav. Ecol. Sociobiol 69, 1713–1722. doi: 10.1007/s00265-015-1983-0
Hassan H. U., Ali Q. M., Khan W., Masood Z., Abdel-Aziz M. F. A., Shah M. I. A., et al. (2021). Effect of feeding frequency as a rearing system on biological performance, survival, body chemical composition and economic efficiency of Asian seabass Lates calcarifer (Bloch 1790) reared under controlled environmental conditions. Saudi J. Biol. Sci. 28, 7360–7366. doi: 10.1016/j.sjbs.2021.08.031
Hu W. C., Chen L. B., Huang B. K., Lin H. M. (2022). A computer vision-based intelligent fish feeding system using deep learning techniques for aquaculture. IEEE Sens J. 22, 7185–7194. doi: 10.1109/JSEN.2022.3151777
Hu X., Liu Y., Zhao Z., Liu J., Yang X., Sun C., et al. (2021). Real-time detection of uneaten feed pellets in underwater images for aquaculture using an improved YOLO-V4 network. Comput. Electron Agric. 185, 106135. doi: 10.1016/j.compag.2021.106135
Huntingford F., Malcolm J., Sunil K. (2012b). Aquaculture and behavior (Wiley-Blackwell). doi: 10.1002/9781444354614
Huntingford F., Tamilselvan P., Jenjan H. (2012a). Why do some fish fight more than others? Physiol. Biochem. Zoology 85, 584–593. doi: 10.1086/668204
Hussey N. E., Kessel S. T., Aarestrup K., Cooke S. J., Cowley P. D., Fisk A. T., et al. (2015). Aquatic animal telemetry: A panoramic window into the underwater world. Science 348, 1255642. doi: 10.1126/science.1255642
Jocher G., Chaurasia A., Stoken A., Borovec J., Kwon Y., Michael K., et al. (2022). ultralytics/yolov5: v7.0 - YOLOv5 SOTA realtime instance segmentation (Zenodo). doi: 10.5281/zenodo.7347926
Jolles J. W., King A. J., Killen S. S. (2020). The role of individual heterogeneity in collective animal behaviour. Trends Ecol. Evol. 35, 278–291. doi: 10.1016/j.tree.2019.11.001
Juell J.-E. (1991). Hydroacoustic detection of food waste-A method to estimate maximum food intake of fish populations in sea cages. Aquac. Eng. 10 (3), 207–217. doi: 10.1016/0144-8609(91)90024-E
Juell J. E., Furevik D. M., Bjordal A. (1993). Demand feeding in salmon farming by hydroacoustic food detection. Aquac. Eng. 12 (3), 155–167. doi: 10.1016/0144-8609(93)90008-Y
Juell J.-E., Westerberg H. (1993). An Ultrasonic Telemetric System for Automatic Positioning of Individual Fish used to Track Atlantic Salmon (Salmo salar L.) in a Sea Cage. Aquac. Eng. 12 (1), 1–18. doi: 10.1016/0144-8609(93)90023-5
Killen S. S., Marras S., Nadler L., Domenici P. (2017). The role of physiological traits in assortment among and within fish shoals. Philos. Trans. R. Soc. London. Ser. B Biol. Sci. 372 (1727), 20160233. doi: 10.1098/rstb.2016.0233
Kong Q., Du R., Duan Q., Zhang Y., Chen Y., Li D., et al. (2022). A recurrent network based on active learning for the assessment of fish feeding status. Comput. Electron Agric. 198, 106979. doi: 10.1016/j.compag.2022.106979
Kramer D. L. (1987). Dissolved oxygen and fish behavior. Environ. Biol. Fishes 18 (2), 81–92. doi: 10.1007/BF00002597
Krumschnabel G., Biasi C., Schwarzbaum P. J., Wieser W. (1997). Acute and chronic effects of temperature, and of nutritional state, on ion homeostasis and energy metabolism in teleost hepatocytes. J. Comp. Physiol. B: Biochemical Systemic Environ. Physiol. 167, 280–286. doi: 10.1007/s003600050075
Krumschnabel G., Wieser W. (1994). Inhibition of the sodium pump does not cause a stoichiometric decrease of ATP-production in energy limited fish hepatocytes. Experientia 50, 483–485. doi: 10.1007/BF01920752
Kruskal W. H., Wallis W. A. (1952). Use of ranks in one-criterion variance analysis. J. Am. Stat. Assoc. 47, 583–621. doi: 10.1080/01621459.1952.10483441
Lankford S. E., Adams T. E., Miller R. A., Cech J. J. Jr. (2005). The cost of chronic stress: impacts of a nonhabituating stress response on metabolic variables and swimming performance in sturgeon. Physiol. Biochem. Zoology 78, 599–609. doi: 10.1086/430687
Lee J. V., Loo J. L., Chuah Y. D., Tang P. Y., Tan Y. C., Goh W. J. (2013). The use of vision in a sustainable aquaculture feeding system. Res. J. Appl. Sciences Eng. Technol. 6, 3658–3669. doi: 10.19026/rjaset.6.3573
Li D., Xu L., Liu H. (2017). Detection of uneaten fish food pellets in underwater images for aquaculture. Aquac Eng. 78, 85–94. doi: 10.1016/j.aquaeng.2017.05.001
Li D., Wang Z., Wu S., Miao Z., Du L., Duan Y. (2020). Automatic recognition methods of fish feeding behavior in aquaculture: a review. Aquaculture 528, 735508. doi: 10.1016/j.aquaculture.2020.735508
Liu Z., Li X., Fan L., Lu H., Liu L., Liu Y. (2014). Measuring feeding activity of fish in RAS using computer vision. Aquac Eng. 60, 20–27. doi: 10.1016/j.aquaeng.2014.03.005
Macaulay G., Bui S., Oppedal F., Dempster T. (2021). Challenges and benefits of applying fish behaviour to improve production and welfare in industrial aquaculture. Rev. Aquaculture 13, 934–948. doi: 10.1111/raq.12505
Måløy H., Aamodt A., Misimi E. (2019). A spatio-temporal recurrent network for salmon feeding action recognition from underwater videos in aquaculture. Comput. Electron. Agric. 167, 105087. doi: 10.1016/j.compag.2019.105087
McKenna J. E., Sethi S. A., Scholten G. M., Kraus J., Chalupnicki M. (2021). Acoustic tag retention and tagging mortality of juvenile cisco Coregonus artedi. J. Great Lakes Res. 47, 937–942. doi: 10.1016/j.jglr.2021.03.020
Miyazaki T., Masuda R., Furuta S., Tsukamoto K. (2000). Feeding behaviour of hatchery-reared juveniles of the Japanese flounder following a period of starvation. doi: 10.1016/S0044-8486(00)00385-9
Niu B., Li G., Peng F., Wu J., Zhang L., Li Z. (2018). Survey of fish behavior analysis by computer vision. J. Aquac Res. Dev. 09, 534. doi: 10.4172/2155-9546.1000534
Noble C., Kadri S., Mitchell D. F., Huntingford F. A. (2007a). The effect of feed regime on the growth and behaviour of 1+ Atlantic salmon post-smolts (Salmo salar L.) in semi-commercial sea cages. Aquaculture Res. 38, 1686–1691. doi: 10.1111/j.1365-2109.2007.01833.x
Noble C., Kadri S., Mitchell D. F., Huntingford F. A. (2008). Growth, production and fin damage in cage-held 0+ Atlantic salmon pre-smolts (Salmo salar L.) fed either a) on-demand, or b) to a fixed satiation–restriction regime: Data from a commercial farm. Aquaculture 275, 163–168. doi: 10.1016/j.aquaculture.2007.12.028
Noble C., Mizusawa K., Suzuki K., Tabata M. (2007b). The effect of differing self-feeding regimes on the growth, behaviour and fin damage of rainbow trout held in groups. Aquaculture 264, 214–222. doi: 10.1016/j.aquaculture.2006.12.028
Papadakis V. M., Glaropoulos A., Kentouri M. (2014). Sub-second analysis of fish behavior using a novel computer-vision system. Aquac Eng. 62, 36–41. doi: 10.1016/j.aquaeng.2014.06.003
Papadakis V. M., Papadakis I. E., Lamprianidou F., Glaropoulos A., Kentouri M. (2012). A computer-vision system and methodology for the analysis of fish behavior. Aquac Eng. 46, 53–59. doi: 10.1016/j.aquaeng.2011.11.002
Parra L., Sendra S., García L., Lloret J. (2018). Design and deployment of low-cost sensors for monitoring the water quality and fish behavior in aquaculture tanks during the feeding process. Sensors (Switzerland) 18, 750. doi: 10.3390/s18030750
Parsonage K. D., Petrell R. J. (2003). Accuracy of a machine-vision pellet detection system. Aquac Eng. 29, 109–123. doi: 10.1016/S0144-8609(03)00049-9
Paspatis M., Boujard T., Maragoudaki D., Kentouri M. (2000). European sea bass growth and N and P loss under different feeding practices. Aquaculture 184, 77–88. doi: 10.1016/S0044-8486(99)00313-0
Petrell R. J., Pee Ang K. (2001). Effects of pellet contrast and light intensity on salmonid feeding behaviours. doi: 10.1016/S0144-8609(01)00081-4
Pradana H., Horio K. (2022). Automatic controlling fish feeding machine using feature extraction of nutriment and ripple behavior. Int. J. Innov. Comput. Information Control (IJICIC). 17 (5), 1483–1500. doi: 10.24507/ijicic.17.05.1483
Priya N. P., Joseph S., Ajith Kumar P. B., Sunithakumari K., Smina M. S. (2021). Effect of feeding frequencies on growth and profit of asian seabass (Lates calcarifer) in cage culture systems. J. Aquat. Biol. Fisheries 9, 165–170.
Priyadarshana T., Asaeda T., Manatunge J. (2006). Hunger-induced foraging behavior of two cyprinid fish: Pseudorasbora parva and Rasbora daniconius. Hydrobiologia 568, 341–352. doi: 10.1007/s10750-006-0201-5
Remen M., Sievers M., Torgersen T., Oppedal F. (2016). The oxygen threshold for maximal feed intake of Atlantic salmon post-smolts is highly temperature-dependent. Aquaculture 464, 582–592. doi: 10.1016/j.aquaculture.2016.07.037
Riddell J., Webster M. M. (2017). How does hunger affect convergence on prey patches in a social forager? Ethology 123, 811–817. doi: 10.1111/eth.12653
Rønnestad I., Gomes A. S., Murashita K., Angotzi R., Jönsson E., Volkoff H. (2017). Appetite-controlling endocrine systems in teleosts. Front. Endocrinol. 8, 73. doi: 10.3389/fendo.2017.00073
Runde B. J., Buckel J. A., Bacheler N. M., Tharp R. M., Rudershausen P. J., Harms C. A., et al. (2022). Evaluation of six methods for external attachment of electronic tags to fish: assessment of tag retention, growth and fish welfare. J. Fish Biol. 101 (3), 419–430. doi: 10.1111/jfb.14989
Santos G. A., Schrama J. W., Mamauag R. E. P., Rombout J., Verreth J. A. J. (2010). Chronic stress impairs performance, energy metabolism and welfare indicators in European seabass (Dicentrarchus labrax): the combined effects of fish crowding and water quality deterioration. Aquaculture 299, 73–80. doi: 10.1016/j.aquaculture.2009.11.018
Schwinghamer C. W., Tripp S., Phelps Q. E. (2019). Using ultrasonic telemetry to evaluate paddlefish spawning behavior in harry S. Truman reservoir, missouri. North Am. J. Fisheries Manage. 39, 231–239. doi: 10.1002/nafm.10263
Skøien K. R., Aas T. S., Alver M. O., Romarheim O. H., Alfredsen J. A. (2016). Intrinsic settling rate and spatial diffusion properties of extruded fish feed pellets. Aquac Eng. 74, 30–37. doi: 10.1016/j.aquaeng.2016.05.001
Stoner A. W., Ottmar M. L., Hurst T. P. (2006). Temperature affects activity and feeding motivation in Pacific halibut: Implications for bait-dependent fishing. Fish Res. 81, 202–209. doi: 10.1016/j.fishres.2006.07.005
Sun M., Hassan S. G., Li D. (2016). Models for estimating feed intake in aquaculture: A review. Comput. Electron. Agric. 127, 425–438). doi: 10.1016/j.compag.2016.06.024
Svendsen E., Føre M., Økland F., Gräns A., Hedger R. D., Alfredsen J. A., et al. (2021). Heart rate and swimming activity as stress indicators for Atlantic salmon (Salmo salar). Aquaculture 531, 735804. doi: 10.1016/j.aquaculture.2020.735804
Talbot C., Corneillie S., Korsøen Ø. (1999). Pattern of feed intake in four species of fish under commercial farming conditions: implications for feeding management. Aquaculture Res. 30, 509–518. doi: 10.1046/j.1365-2109.1999.00369.x
Thorstad E. B., Rikardsen A. H., Alp A., Økland F. (2013). The use of electronic tags in fish research–an overview of fish telemetry methods. Turkish J. Fisheries Aquat. Sci. 13, 881–896. doi: 10.4194/1303-2712-v13_5_13
Tunstrøm K., Katz Y., Ioannou C. C., Huepe C., Lutz M. J., Couzin I. D. (2013). Collective states, multistability and transitional behavior in schooling fish. PloS Comput. Biol. 9, 1–11. doi: 10.1371/journal.pcbi.1002915
Ubina N., Cheng S. C., Chang C. C., Chen H. Y. (2021). Evaluating fish feeding intensity in aquaculture with convolutional neural networks. Aquac Eng. 94, 102178. doi: 10.1016/j.aquaeng.2021.102178
Van Rossum G., Drake F. L. Jr (1995). Python reference manual (Amsterdam: Centrum voor Wiskunde en Informatica).
Villegas-Ríos D., Freitas C., Moland E., Thorbjørnsen S. H., Olsen E. M. (2020). Inferring individual fate from aquatic acoustic telemetry data. Methods Ecol. Evol. 11, 1186–1198. doi: 10.1111/2041-210X.13446
Volkoff H., Rønnestad I. (2020). Effects of temperature on feeding and digestive processes in fish. Temperature 7, 307–320. doi: 10.1080/23328940.2020.1765950
Wang C., Li Z., Wang T., Xu X., Zhang X., Li D. (2021). Intelligent fish farm—the future of aquaculture. Aquaculture Int. 29, 2681–2711. doi: 10.1007/s10499-021-00773-8
Wang Y., Yu X., Liu J., An D., Wei Y. (2022). Dynamic feeding method for aquaculture fish using multi-task neural network. Aquaculture 551. doi: 10.1016/j.aquaculture.2022.737913
Wang S. H., Zhao J. W., Chen Y. Q. (2017). Robust tracking of fish schools using CNN for head identification. Multimed Tools Appl. 76, 23679–23697. doi: 10.1007/s11042-016-4045-3
Wilson A. D. M., Burns A. L. J., Crosato E., Lizier J., Prokopenko M., Schaerf T. M., et al. (2019). Conformity in the collective: Differences in hunger affect individual and group behavior in a shoaling fish. Behav. Ecol. 30, 968–974. doi: 10.1093/beheco/arz036
Wojke N., Bewley A., Paulus D. (2017). “Simple online and realtime tracking with a deep association metric,” in IEEE International Conference on Image Processing (ICIP). 3645–3649.
Xu J., Liu Y., Cui S., Miao X. (2006). Behavioral responses of tilapia (Oreochromis niloticus) to acute fluctuations in dissolved oxygen levels as monitored by computer vision. Aquac Eng. 35, 207–217. doi: 10.1016/j.aquaeng.2006.02.004
Xu H., Sha M. Y., Wong E. Y., Uphoff J., Xu Y., Treadway J. A., et al. (2003). Multiplexed SNP genotyping using the Qbead system: a quantum dot-encoded microsphere-based assay. Nucleic Acids Res. 31, e43–e43. doi: 10.1093/nar/gng043
Yang X., Zhang S., Liu J., Gao Q., Dong S., Zhou C. (2021). Deep learning for smart fish farming: applications, opportunities and challenges. Rev. Aquaculture 13, 66–90. doi: 10.1111/raq.12464
Zhang Y., Lu R., Qin C., Nie G. (2020). Precision nutritional regulation and aquaculture. Aquaculture Rep. 18, 100496. doi: 10.1016/j.aqrep.2020.100496
Zhao J., Bao W. J., Zhang F. D., Ye Z. Y., Liu Y., Shen M. W., et al. (2017). Assessing appetite of the swimming fish based on spontaneous collective behaviors in a recirculating aquaculture system. Aquac Eng. 78, 196–204. doi: 10.1016/j.aquaeng.2017.07.008
Zhao J., Gu Z., Shi M., Lu H., Li J., Shen M., et al. (2016). Spatial behavioral characteristics and statistics-based kinetic energy modeling in special behaviors detection of a shoal of fish in a recirculating aquaculture system. Comput. Electron. Agric. 127, 271–280. doi: 10.1016/j.compag.2016.06.025
Zhou C., Lin K., Xu D., Chen L., Guo Q., Sun C., et al. (2018a). Near infrared computer vision and neuro-fuzzy model-based feeding decision system for fish in aquaculture. Comput. Electron Agric. 146, 114–124. doi: 10.1016/j.compag.2018.02.006
Zhou C., Xu D., Chen L., Zhang S., Sun C., Yang X., et al. (2019). Evaluation of fish feeding intensity in aquaculture using a convolutional neural network and machine vision. Aquaculture 507, 457–465. doi: 10.1016/j.aquaculture.2019.04.056
Keywords: precision farming, aquaculture, feeding behavior, animal welfare, stressors, hunger levels, tracking, collective behavior
Citation: Georgopoulou DG, Vouidaskis C and Papandroulakis N (2024) Swimming behavior as a potential metric to detect satiation levels of European seabass in marine cages. Front. Mar. Sci. 11:1350385. doi: 10.3389/fmars.2024.1350385
Received: 05 December 2023; Accepted: 14 February 2024;
Published: 04 March 2024.
Edited by:
Amalia Pérez-Jiménez, University of Granada, SpainReviewed by:
Pablo Arechavala-Lopez, Spanish National Research Council (CSIC), SpainDaniel Molina Cabrera, University of Granada, Spain
Copyright © 2024 Georgopoulou, Vouidaskis and Papandroulakis. This is an open-access article distributed under the terms of the Creative Commons Attribution License (CC BY). The use, distribution or reproduction in other forums is permitted, provided the original author(s) and the copyright owner(s) are credited and that the original publication in this journal is cited, in accordance with accepted academic practice. No use, distribution or reproduction is permitted which does not comply with these terms.
*Correspondence: Dimitra G. Georgopoulou, ZC5nZW9yZ29wb3Vsb3VAaGNtci5ncg==