 Karin Hüssy1*
 Stefanie Haase2
 Monica Mion3Annelie Hilvarsson3
 Krzysztof Radtke4Tonny B. Thomsen5Maria Krüger-Johnsen1
 Michele Casini3,6
 Anna M. Sturrock7
- 1National Institute of Aquatic Resources, Technical University of Denmark, Kgs. Lyngby, Denmark
- 2Thünen Institute of Baltic Sea Fisheries, Rostock, Germany
- 3Department of Aquatic Resources, Institute of Marine Research, Swedish University of Agricultural Sciences, Lysekil, Sweden
- 4National Marine Fisheries Research Institute, Gdynia, Poland
- 5Geological Survey of Denmark and Greenland, Copenhagen, Denmark
- 6Department of Biological, Geological and Environmental Sciences, University of Bologna, Bologna, Italy
- 7School of Life Sciences, University of Essex, Colchester, United Kingdom
Chronological records of elemental concentrations in fish otoliths are a widely used tool to infer the environmental conditions experienced by individual fish. To interpret elemental signals within the otolith, it is important to understand how both external and internal factors impact ion uptake, transport and incorporation. In this study, we have combined chronological records from otoliths and archival data storage tags to quantify the influence of internal (sex, size, age, growth) and external (temperature, depth, salinity) conditions on otolith elemental chemistry of cod (Gadus morhua) in natural settings of the Baltic Sea. This study focused on elements primarily under physiological control: Phosphorus (P), magnesium (Mg) and zinc (Zn); and elements under environmental control: Strontium (Sr), barium (Ba) and manganese (Mn). Based on known spatial and temporal patterns in environmental conditions and fish size, growth, and maturity, we posed a series of hypotheses of expected otolith element patterns. Partial effects of internal and external drivers on element concentration were analyzed using a Linear Mixed Model approach with random variables (fish and year). Predicted effects of otolith concentrations of all elements under physiological control (P, Mg, Zn) showed similar trends, with distinct seasonal patterns (lowest concentration in late spring, highest concentrations in winter), and a positive correlation with water temperature, in addition to higher Zn and lower P in spawning individuals. Predicted effects of otolith concentrations of elements expected to be predominantly under environmental control showed the predicted geographic and depth-related trends based on ambient salinity (Ba) and coastal hypoxia (Mn). However, contrary to expectation, Sr was unrelated to salinity. Predicted otolith Ba, Sr and Mn concentrations also exhibited pronounced seasonal patterns that were out of phase with each other but appeared to be partly explained by spawning/feeding migrations. While performing laboratory validation studies for adult fish is typically not possible, these results highlight the importance of assessing local water chemistry and freshwater endmembers in one’s study system before otolith elemental chemistry can be reliably used to reconstruct fish habitat use and environmental histories.
1 Introduction
Chronological records of elemental concentrations in fish otoliths have become widely used to infer the environmental conditions experienced by individual fish, and to reconstruct stock dynamics, migration phenology and connectivity patterns (Campana, 1999; Campana and Thorrold, 2001; Elsdon et al., 2008; Carlson et al., 2017). To interpret elemental signals within the otolith, it is important to understand how both external and internal factors affect ion uptake, transport and incorporation (Sturrock et al., 2015; Hüssy et al., 2020b). Fish absorb elements primarily from the water and diet across the intestinal wall, and from the water across the gill surface (Watanabe et al., 1997; Campana, 1999; Milton and Chenery, 2001). On their route to the otolith, elements face three major interfaces that may regulate their uptake: water (or food) – plasma, plasma – endolymph and endolymph – otolith (Kalish, 1989; Campana, 1999). Element concentrations in the different tissues and organs of fish are regulated by uptake and excretion rates as well as storage mechanisms within tissue pools. These processes may be influenced by exogenous (f. ex. water element concentration, salinity, temperature, oxygen concentration) as well as endogenous (f. ex. size, age, sex, maturation, metabolism) factors. Validation studies have primarily focused on early life stages, quantifying the relationships between ambient water concentrations, salinity, temperature and/or growth on otolith concentrations. However, the extent to which the results can be extrapolated to complex, natural systems, other species and/or older, mature fish remains an ongoing question [see e.g. Sturrock et al. (2012)]. Yet, particularly in marine environments field validation studies using wild-caught fish are hampered by difficulties inferring cause and effect, particularly for highly mobile species, given a lack of knowledge about their precise whereabouts and environmental experience prior to capture (Hüssy et al., 2020b). Combining chronological records from otoliths and archival data storage tags (DST) attached to the same fish provides rare opportunity to quantify the influence of internal (sex, size, age, growth) and external (temperature, depth, salinity) conditions on otolith elemental chemistry in a natural setting. To date, there have been just three published studies directly linking DST and otolith chemical records (Darnaude et al., 2014; Darnaude and Hunter, 2018; Le Luherne et al., 2022), with two of the three focusing on oxygen isotope ratios. However, most otolith chemistry studies still use element concentrations, given the relative ease and low cost of obtaining measurements at sub-annual resolution. Combining DST and otolith records for cod in the Baltic Sea represents an ideal opportunity to validate the factors driving otolith element concentrations in adult fish in situ, given their distinct migration patterns between feeding and spawning areas across a chemically heterogeneous but well-described seascape.
1.1 Eastern Baltic cod
Two genetically distinct cod stocks exist in the Baltic Sea, the western Baltic stock (distributed in ICES SDs 22 – 24), and the eastern Baltic stock (distributed in ICES SDs 24 – 32) (ICES, 2022). The distribution and management areas of the two stocks thus overlap in the Arkona Basin (SD 24), with approximately 70% eastern Baltic cod stock (Hüssy et al., 2016a). Since the biology (spawning time, growth, fecundity) of the two stocks differs, we exclusively focus on genetically identified eastern Baltic cod to avoid unwanted bias. Historically, eastern Baltic cod supported a commercially important fishery. Today, the stock size has dropped dramatically, coinciding with large changes in most biological parameters (truncated length distribution, earlier maturation, decrease in body condition, growth, and recruitment), resulting in the closure of the directed fishery since 2019 (ICES, 2022). While the reasons for these changes are not addressed here (reviewed in detail by Eero et al. (2015)), the current status of the stock highlights the importance of gaining a better understanding of the cod’s lifetime habitat use to support stock recovery. Many eastern Baltic cod perform seasonal migrations from coastal feeding areas into deep spawning areas, where the salinity is high enough for the eggs to be buoyant (Nissling et al., 1994) (Figure 1). Today, successful spawning of the eastern Baltic cod stock is largely limited to the Bornholm Basin due to anoxic conditions in other historic spawning sites (Aro, 1989; Bagge et al., 1994; MacKenzie et al., 2000). Eastern Baltic cod’s spawning season is longer than in any other cod stock, typically lasting from May to November (peaking July/August) (Wieland et al., 2000; Bleil et al., 2009) and lasting approximately 4 to 8 weeks for individual fish (Vallin and Nissling, 2000). Outside the spawning season, adult cod are not usually found in the deep basins (Aro, 1989; Bagge et al., 1994). Baltic cod consume prey throughout the year, including during the spawning season (Bagge, 1981), but consumption is greatest post-spawning in fall/early winter (Fordham and Trippel, 1999; Pachur and Horbowy, 2013). Juvenile cod generally occupy shallower areas compared to their larger conspecifics (Sparholt et al., 1991; Pihl and Ulmestrand, 1993; Oeberst, 2008).
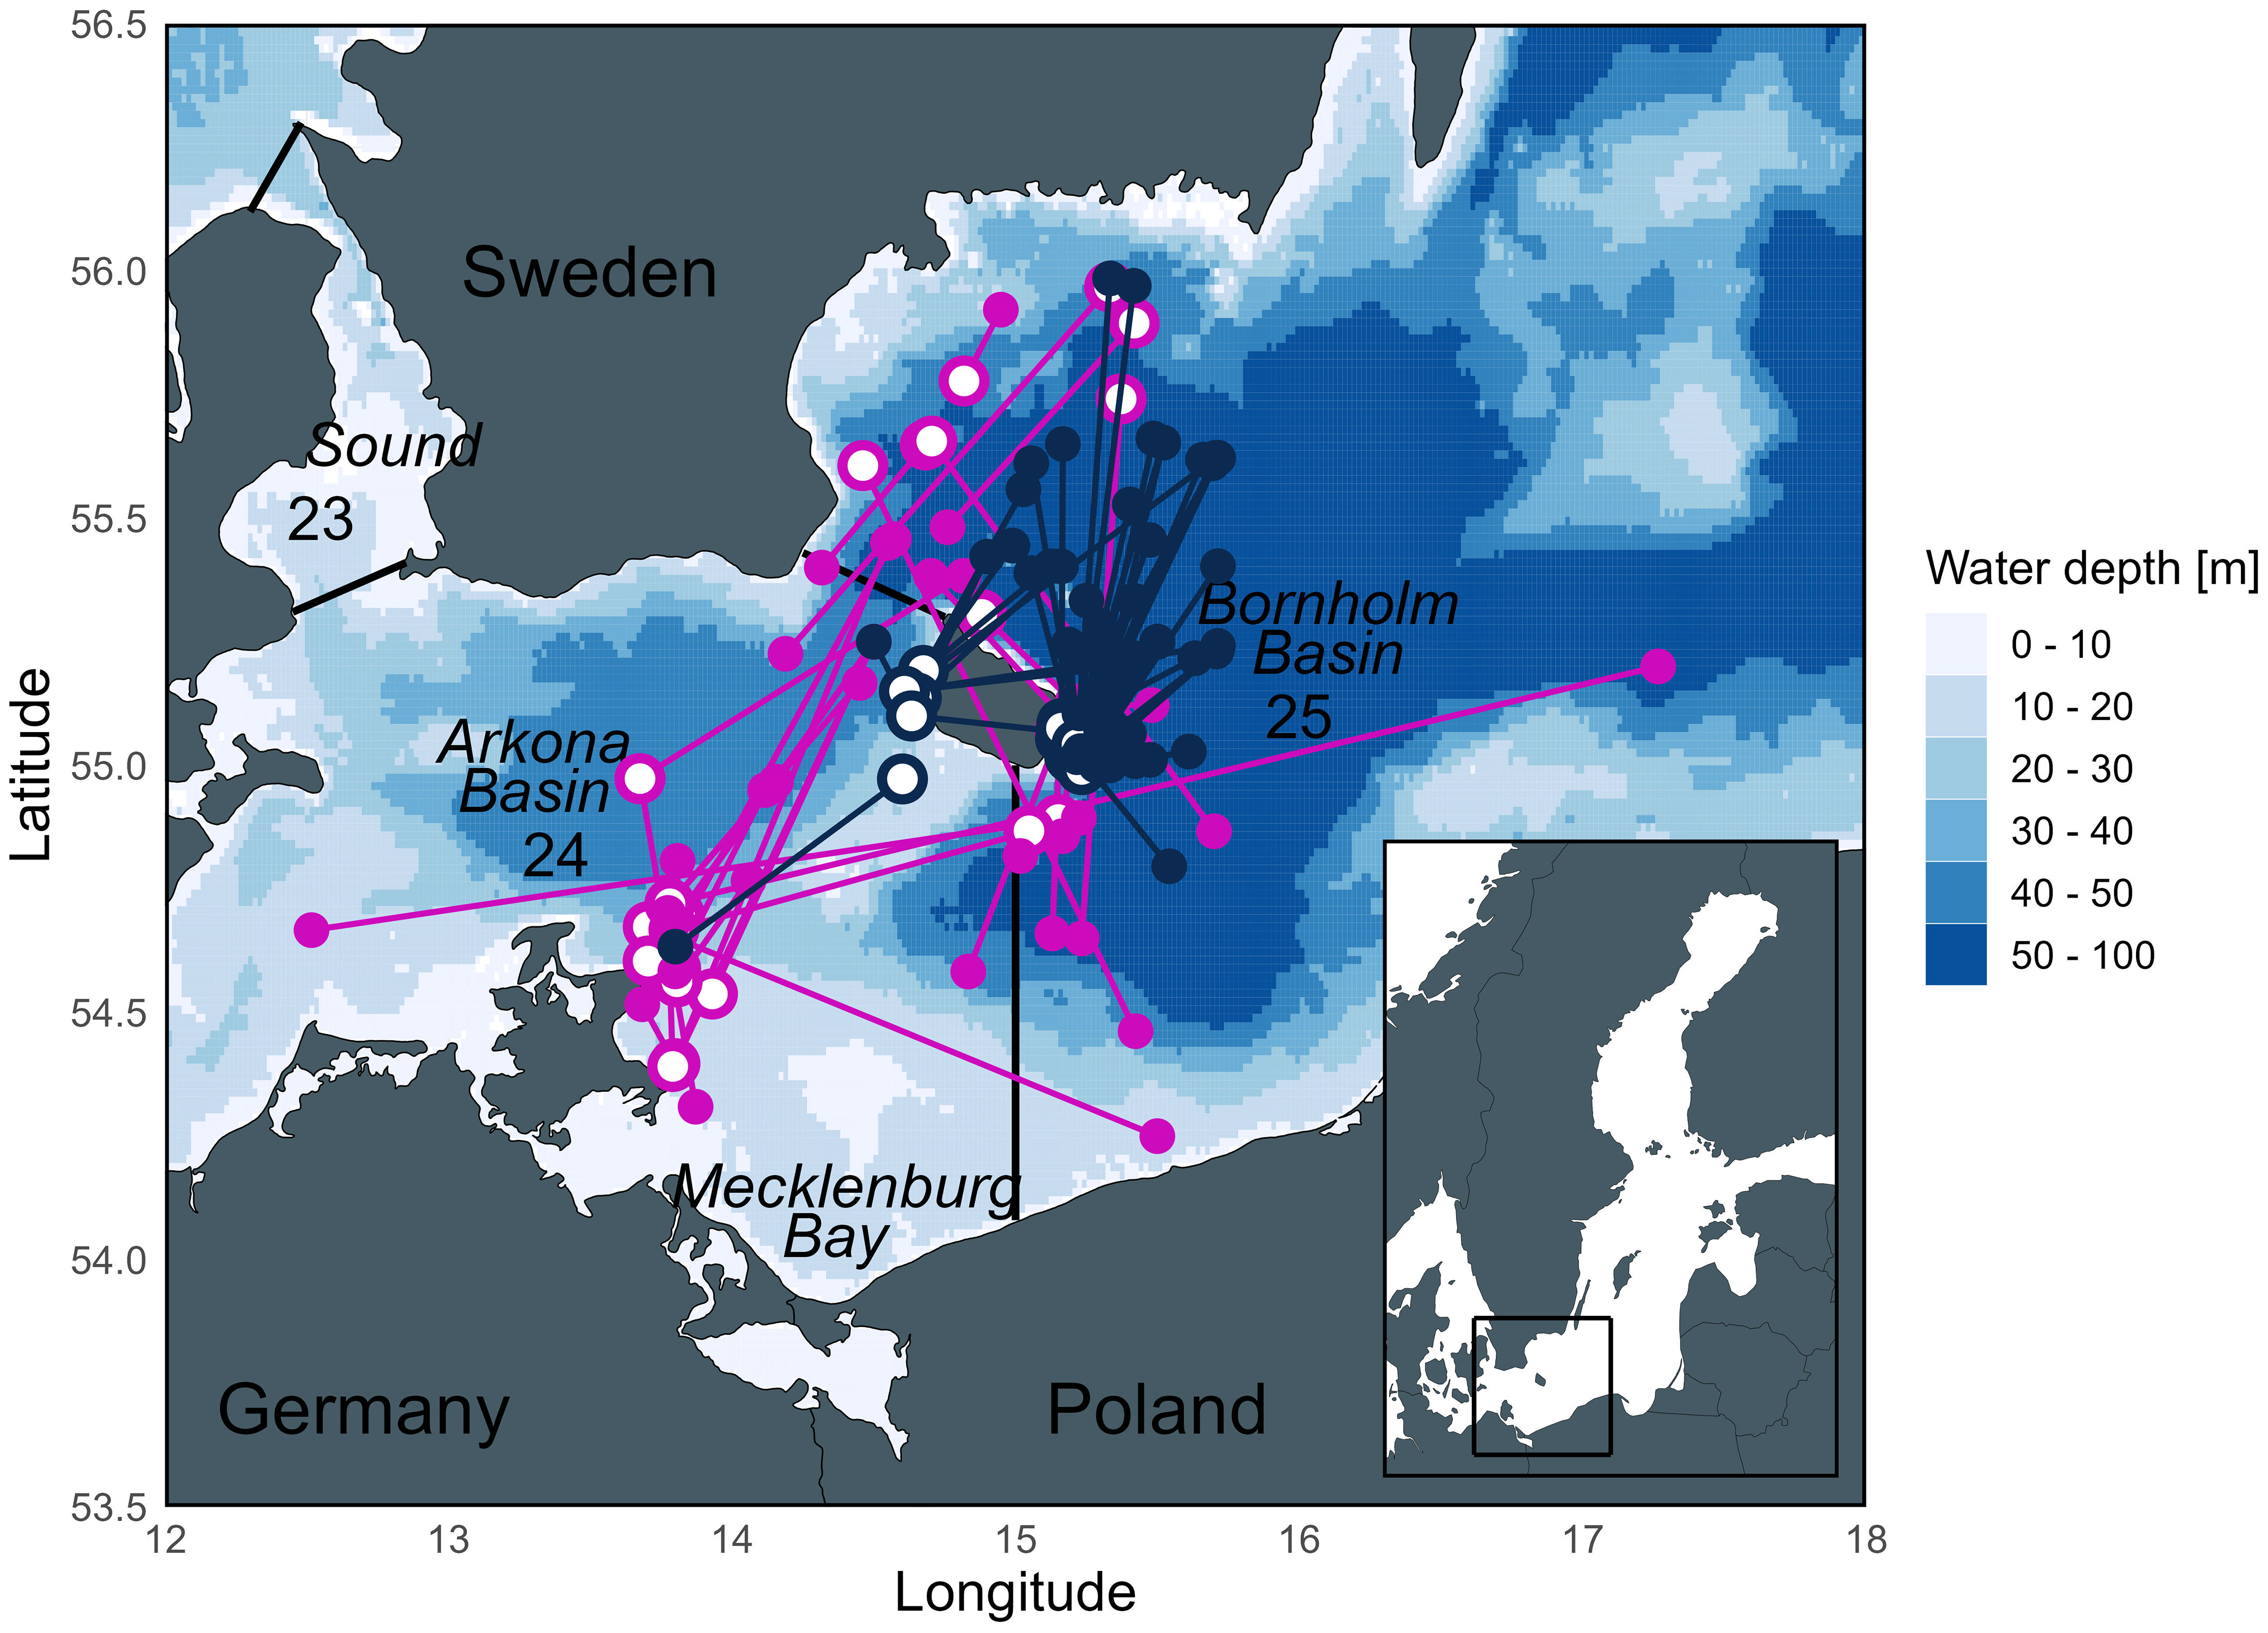
Figure 1 Map of the release and recapture positions of eastern Baltic cod used in this study from the TABACOD (2016-2020; pink) and CODYSSEY (2002-2006; blue) tagging programs. Open circles = release positions, filled circles = recapture positions. Numbers represent ICES Subdivisions (SD) and SD boundaries are outlined by straight lines. Currently, the Bornholm Basin is the main spawning area of eastern Baltic cod, while spawning of both eastern and western Baltic cod in the Arkona Basin is rather limited.
1.2 The Baltic Sea
The Baltic Sea is a large estuary, with consecutive deep basins with progressively larger maximum depths (53 m in the Arkona Sea, 105 m in the Bornholm Basin, and even deeper further east) separated by shallower sills (Figure 1). The hydrography is characterized by deep-water inflow of saline water from the Atlantic Ocean and outflow of freshwater, resulting in a general salinity gradient from west (high) to east (low) (Meier et al., 2006; Naumann et al., 2020). Salinity also varies three-dimensionally. Riverine freshwater inputs create a low salinity (~7‰) surface layer (typically 0 –50 m depth), which sits on top of more saline bottom waters (10 to 18‰) (Matthäus and Franck, 1992; Schinke and Matthäus, 1998; Meier et al., 2006; Naumann et al., 2020). Salinity conditions are inflow dependent, but the halocline depth has remained fairly constant across multiple decades (Carstensen et al., 2014). As a result of this stable salinity stratification and decades of eutrophication, the extent of hypoxic areas has been spreading as a persistent layer in the deeper basins (Helcom, 2009; Viktorsson, 2018; Hansson et al., 2019; Naumann et al., 2020). Many shallower areas within the Baltic Sea, with restricted exchange of bottom water due to complex bottom topography, also suffer from seasonal periods of hypoxia during summer (Conley et al., 2011; Carstensen and Conley, 2019). Overall, the total volume of hypoxic areas (< 2 mg O2 l-1) in the Baltic Sea has been increasing through recent decades (Carstensen et al., 2014; Kõuts et al., 2021). In terms of water temperature, a seasonal thermocline occurs at 30 – 40 m depth in summer (July to September), with a relatively homogeneous mixed surface layer down to the halocline (Matthäus and Franck, 1992; Møller and Hansen, 1994; Schinke and Matthäus, 1998).
The geochemistry of the Baltic Sea is also characterized by a high degree of spatiotemporal heterogeneity. Many elements have a relatively uniform distribution in sea water (Walther and Limburg, 2012; Lebrato et al., 2020), the unique bathymetry and hydrography of the Baltic Sea with the associated variations in salinity and dissolved oxygen, are likely to manifest in strong geographic and temporal gradients in ambient elemental concentrations. For elements under greater environmental control, we hypothesize that these gradients will manifest in predictable patterns in otolith elemental signatures, potentially providing a tool for retrospective geolocation of individual fish.
1.3 Hypothesis development
Fish are complex organisms, and elemental processing and incorporation pathways can vary by system, species, individual physiological state and life stage (Sturrock et al., 2012; Hüssy et al., 2020b). However, many studies have shown strong relationships between water and otolith concentrations, particularly when salinity gradients are more extreme (e.g. Elsdon and Gillanders, 2003). Otolith Mn is also increasingly used to reconstruct past hypoxia-exposure in fish (Limburg et al., 2011; Mohan et al., 2012; Mohan and Walther, 2016; Altenritter et al., 2018; Altenritter and Walther, 2019). Eastern Baltic cod experience considerable variation in their physicochemical environment that are amplified by their seasonal movements between nearshore, shallow feeding grounds and deeper spawning areas (Figure 2). In this study, we take advantage of these sharp environmental gradients alongside general movement patterns of tagged fish to test hypotheses of otolith element incorporation mechanisms in a natural setting, focusing on six commonly measured elements: Strontium (Sr), barium (Ba), manganese (Mn), magnesium (Mg), phosphorus (P), and zinc (Zn). We have broadly grouped these into elements under greater environmental (Sr, Ba, Mn) vs. physiological (P, Mg, Zn) control, and pose a series of hypotheses based on expected environmental gradients and otolith incorporation mechanisms [summarized below and in Sturrock et al. (2012), Heimbrand et al. (2020), and Hüssy et al. (2020b)].
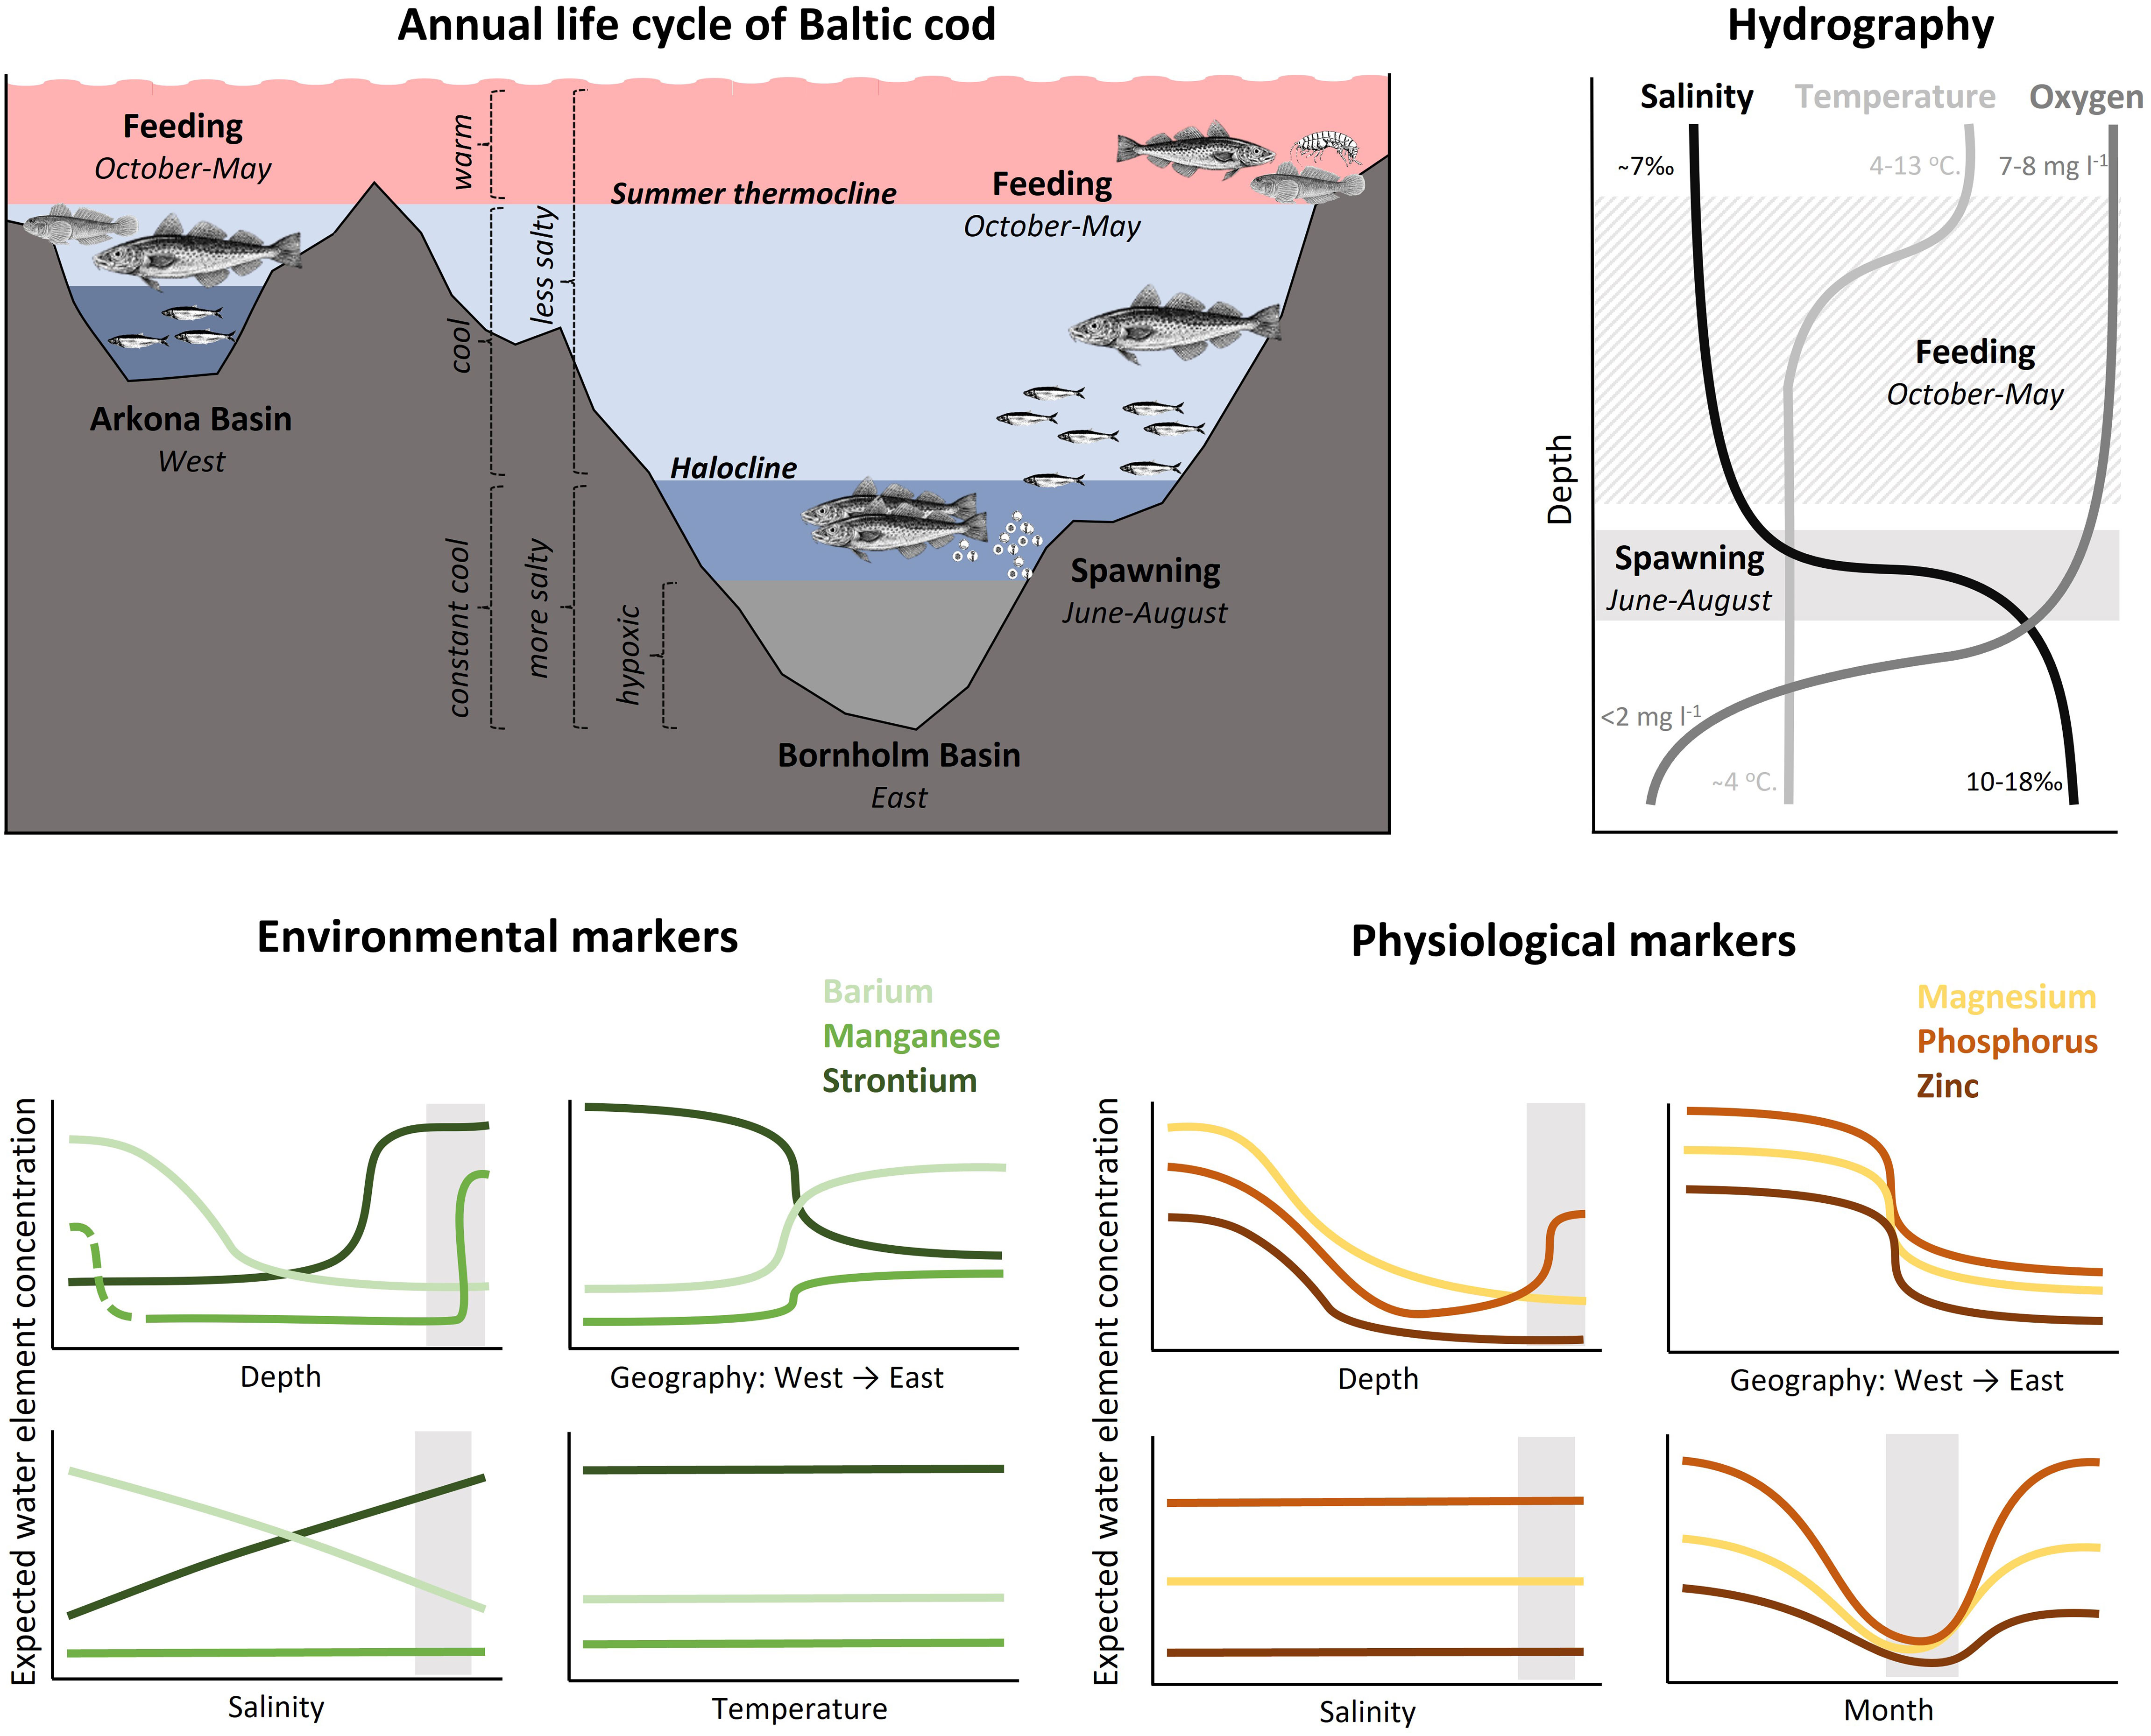
Figure 2 Conceptual representation of the hydrographic and thermal conditions in the Arkona and Bornholm Basins of the Baltic Sea, the general seasonal distribution patterns of the eastern Baltic cod stock focused on in this study (top left), and typical profiles of salinity, temperature, and dissolved oxygen in the Bornholm Basin in summer (top right). Predicted variation in water concentrations for the six elements examined in this study relative to depth, salinity, and region (west to east), temperature (environmental markers only) and month (physiological markers only). Expected water concentrations do not represent actual expected concentrations, but rather general patterns for each element separately (i.e. Sr will always be higher than Ba and Mn). The elements are separated into those presumed to be under greater environmental vs. physiological control during incorporation into fish otoliths. Each panel corresponds to one of the main hypotheses of expected otolith chemistry patterns. Spawning area and time of the year is indicated with light grey shaded rectangles. Note that depth, month and region (W/E) were treated as categorical factors in the analyses.
Elements under greater environmental control (Sr, Ba, Mn): Sr, Ba and Mn all form divalent cations that substitute for calcium in the growing otolith crystals (Doubleday et al., 2014; Thomas et al., 2017). Multiple studies have shown that ambient water Sr : Ca and Ba : Ca ratios are strongly correlated with otolith concentrations in laboratory experiments and field studies (Bath et al., 2000; Elsdon and Gillanders, 2003; De Vries et al., 2005; Hamer et al., 2006; Hicks et al., 2010; Reis-Santos et al., 2013), but Mn only in field studies (Thorrold and Shuttleworth, 2000; Dorval et al., 2007; Mohan et al., 2012). Thus, we expect that if we can predict spatiotemporal variations in ambient Sr, Ba and Mn concentrations based on salinity and dissolved oxygen, that these variations should be reflected in the otoliths of cod inhabiting that location at that time.
Strontium: In the Baltic Sea, the lowest salinities are in the east, superimposed by a secondary salinity gradient from coast (shallow) to offshore (deep). In most systems, salinity is strongly correlated with water and otolith Sr concentrations, particularly across the salinity ranges seen in the current study area (i.e. 7 – 20 psu) (Lin et al., 2007; Hicks et al., 2010; Walther and Limburg, 2012; Albertsen et al., 2021).
Bariums: Ba is dissolved from its freshwater particulate state in low-salinity estuarine water, and precipitates as barite at higher salinities (Coffey et al., 1997; Paytan and Griffith, 2007), leading to a coastal-offshore depth gradient. We predict that this depth gradient will result in a negative relationship between water – and otolith – Ba concentrations and depth, and also to higher Ba concentrations in the shallower western than the eastern Baltic.
Manganese: Mn is an active redox participant that cycles between dissolved and particulate phases as a function of pH and dissolved oxygen, with lower pH and oxygen favouring the dissolved forms (Slomp et al., 1997; Trouwborst et al., 2006). Therefore, dissolved Mn concentrations are presumed to be elevated in the deep hypoxic areas in the eastern Baltic Sea, and in shallow coastal areas during summer throughout the Baltic Sea.
Assuming that spatiotemporal variations in salinity and dissolved oxygen result in predictable differences in water and otolith Sr, Ba and Mn in this system (an essential pre-requisite for using these markers for movement and/or environmental reconstructions) we make a series of predictions. Note that – while temperature can influence salinity, dissolved oxygen and fish physiology – effects on otolith element concentrations will be indirect, and thus while we account for temperature in subsequent analyses, we do not explicitly use it to frame these predictions.
● H1: Salinity. Where direct salinity measurements are available for a given fish, these will be positively related to otolith Sr and negatively related to otolith Ba.
● H2: Geography. Otolith Sr will be higher and Ba lower during periods spent in the saltier and shallower western Baltic Sea (cf. east), while otolith Mn will be higher in individuals inhabiting the more hypoxic areas in the eastern Baltic Sea (cf. west).
● H3: Depth. Otolith Sr and Mn will be positively related to depth, given higher salinity and lower dissolved oxygen concentrations in deep (spawning) areas. Otolith Mn may also exhibit a cubic relationship with depth given high levels of hypoxia in shallow coastal areas during summer. Conversely, otolith Ba will be negatively related to depth due to freshwater inputs from the land.
● H4: Month. Otolith Mn will be highest during the late summer/fall months (cf. winter/spring months) given increased hypoxia during warmer periods. Otolith Sr and Ba will not vary by month (after accounting for influence of depth and/or salinity).
● H5: Physiology. Otolith Sr, Ba and Mn will not be significantly influenced by physiological variables (size, age, sex, growth, maturity), ambient temperature or otolith opacity.
Elements under greater physiological control (P, Mg, Zn): These three elements are all either essential constituents of the otolith’s organic matrix, or co-factors in metabolic processes, including those in the endolymphatic epithelium (Wojtas et al., 2012; Sturrock et al., 2013, 2014; Maret, 2017; Thomas and Swearer, 2019). Their ions appear to be primarily incorporated into the otolith randomly trapped in the crystal lattice (Miller et al., 2006; Izzo et al., 2016; Thomas et al., 2017). As such, these elements are assumed to be under strong physiological control, thus – while their ambient concentrations exhibit large horizontal, vertical and seasonal variations gradients (Sylva, 1976; Cox, 1989; Conley et al., 2002; Lebrato et al., 2020; Naumann et al., 2020) – we predict that cod otolith concentrations will be uncorrelated to these and instead driven by endogenous factors such as feeding rate, growth, size, sex, age and/or reproduction. Previous studies have suggested positive relationships between growth rate and otolith Zn (Halden et al., 2000; Limburg and Elfman, 2010), and with otolith P and Mg (Limburg et al., 2018; Heimbrand et al., 2020; Hüssy et al., 2021a). Concentrations in otolith Mg and P were furthermore linked to seasonal temperature fluctuations, with lowest concentration during the coldest months in late winter/spring and highest concentrations in late summer (Hüssy et al., 2021a). Sturrock et al. (2015) also speculated that the drop in plasma and otolith Zn in mature female plaice during the spawning season was caused by rerouting of Zn to the ovaries during vitellogenesis (Sturrock et al., 2014). Thus, for these elements, we suggest the following hypotheses:
● H6: Month. Otolith P, Mg and Zn will – overall – exhibit seasonal patterns with higher concentrations occurring post spawning in fall/early winter months typically associated with increased feeding following spawning.
● H7: Temperature. Otolith P, Mg and Zn measurements will be positively correlated with temperature, in that metabolic rate and physiological processes generally increase with increasing temperature, providing temperatures are within the species’ tolerance range.
● H8: Size and growth. Otolith P, Mg and Zn will be positively correlated with absolute somatic growth (over the entire tagging period) and fish size (at release) given slower growth in older, larger fish.
● H9: Spawning. Otolith Zn will be lower during the spawning season for spawning females vs. males and non-spawning females, given rerouting of Zn ions to the ovaries for vitellogenesis.
● H10: Environment. Otolith P, Mg and Zn will be unrelated to salinity or environmental covariates linked to variations in salinity and dissolved oxygen (geographic area, depth).
The general seasonal patterns in cod movements and expected temperature, salinity and dissolved oxygen concentrations are conceptualized in Figure 2, alongside the predicted relative element concentrations in the water (low/high) as a function of depth, month and area. Here, we combine otolith and Data Storage Tag (DST) records from two cod tagging programs to estimate the influence of environmental and physiological different drivers on otolith elemental concentrations in situ and to test whether our hypotheses (H1 – 10) are supported or refuted by these data.
2 Materials and methods
2.1 Samples
The otolith samples used in this study originate from two tag-recapture programs carried out in the Baltic Sea: CODYSSEY (Cod spatial dynamics and vertical movements in European waters and implications for fishery management, 2002 – 2006, https://cordis.europa.eu/project/id/Q5RS-2002-00813) and TABACOD (“Tagging Baltic Cod”, 2016 – 2020, https://tabacod.dtu.dk/) (Figure 1). Details on the tagging protocols of CODYSSEY and TABACOD are summarised in the Supplementary Material (Section 1.1 and Supplementary Table 1). Further details may be found in Nielsen et al. (2013) and for TABACOD in Hüssy et al. (2020a, 2021a). Given very low samples sizes (n = 5) for western stock cod, only cod belonging to the eastern stock were used in this study. For stock identification, see Hemmer-Hansen et al. (2019) and Schade et al. (2019). All procedures were carried out under the necessary animal test permissions: German DST tagging: AZ 7221.3.1-007/18; Danish T-bar and DST tagging: 016-15-0201-00929, Swedish T-bar and DST tagging: Dnr 5.8.18-14823/2018.
Days at liberty (DAL) were defined as the number of days between release and recapture. The samples used in this study were restricted to fish with DAL > 30 to ensure sufficient otolith accretion to have multiple chemical records post-release. From CODYSSEY n = 146 recaptured cod in the length range 435 – 960 mm (released in 2003 – 2006) were available and from TABACOD n = 32 recaptures in the length range 298 – 503 mm (released in 2016 – 2018). Release and recapture locations are shown in Figure 1. For details on length distribution and DAL between tagging and recapture, see Supplementary Figure 2. After recapture, fish total length (TL, mm), weight (g), sex (female, male) and maturity (ICES 6-stage standard) were recorded. Somatic growth was calculated as change in total length per day Gfish = (TLrecapture – TLrelease) DAL-1. Sagittal otoliths were removed, cleaned, and stored dark and dry.
2.2 Data Storage tag data
In both experiments, the DSTs used measured temperature and pressure (converted into depth) (Figure 3). The DSTs used in the CODYSSEY project also measured conductivity. Star-Oddi micro-TD and milli-TD tags were used for TABACOD, and Star-Oddi DST-CTD for CODYSSEY. While depth was estimated with high resolution, given differences in the geolocations available among individuals and studies, the geographic resolution used for cod movement reconstructions in this study was relatively coarse, with fish assigned to ICES subdivision on a daily scale (SD 24 or 25, Figure 1). Further details about the DST data processing are provided in the Supplemental Material and Supplementary Table 1.
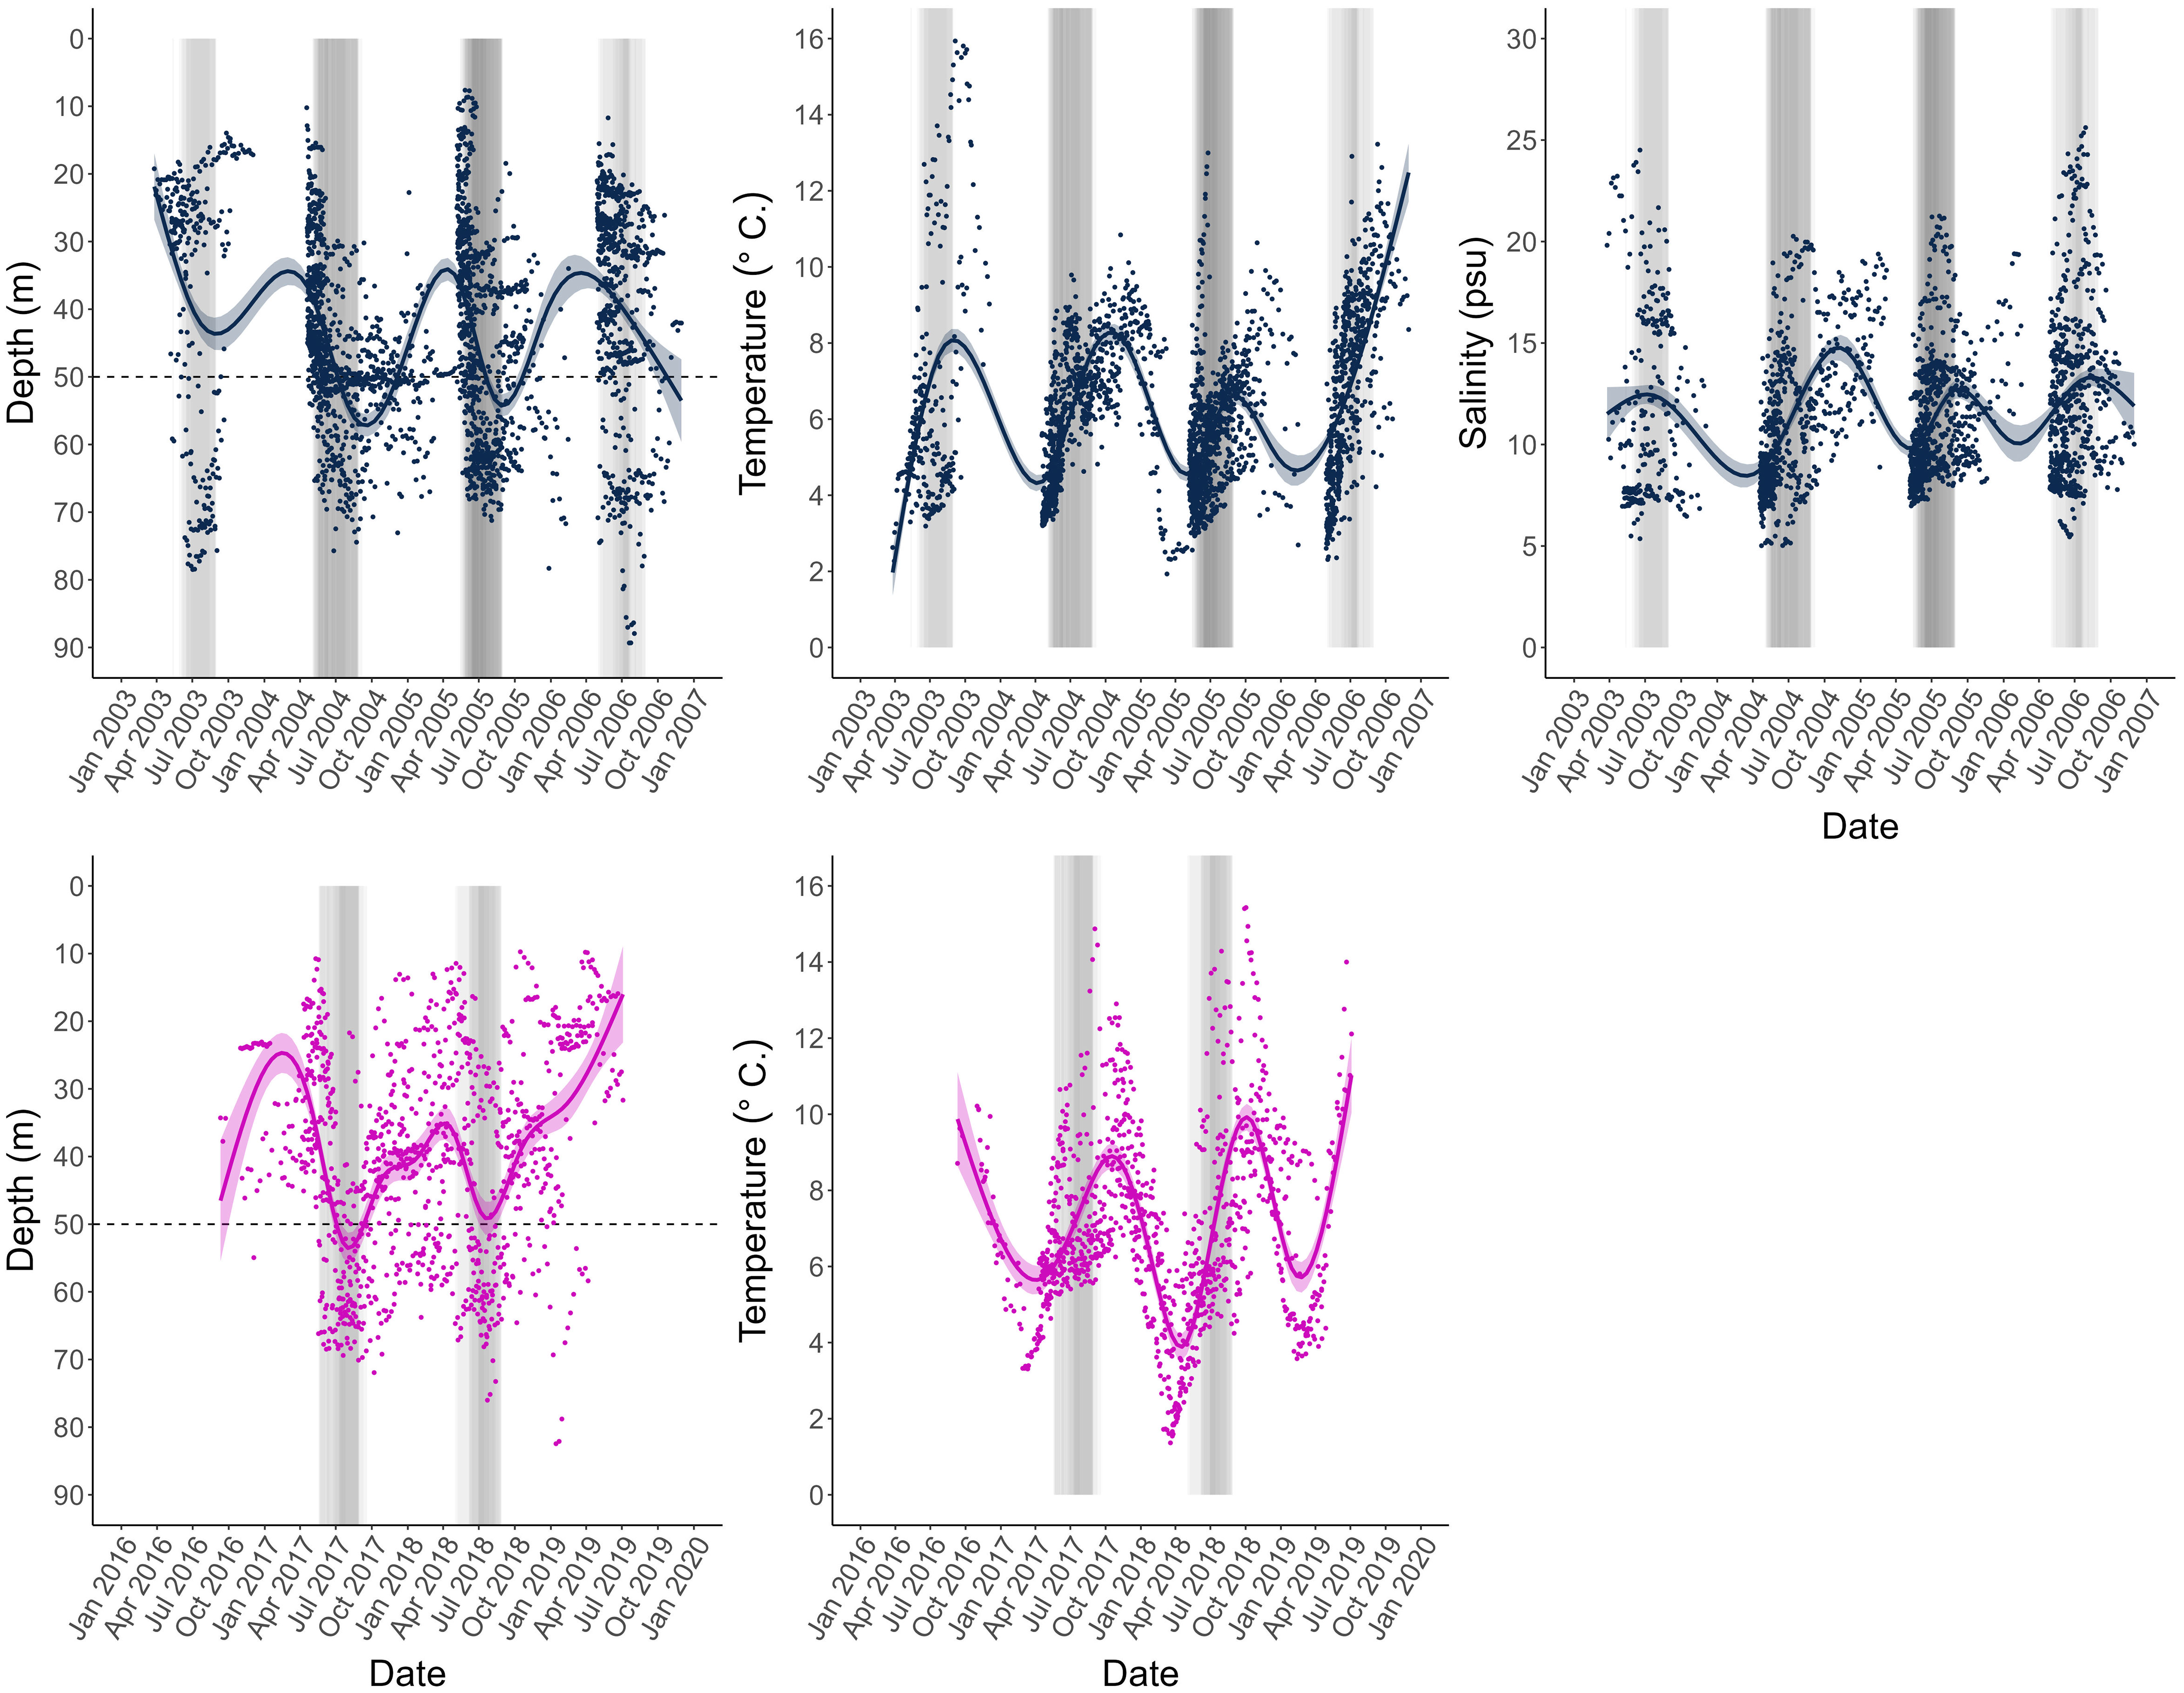
Figure 3 Depth, temperature, and salinity profiles obtained from the archival tags of all individual data points for all fish including loess-smoothed means and 95% confidence interval bands, and represented for the two tagging projects separately, CODYSSEY (blue) and TABACOD (pink). Salinity was only measured by the tags used in the CODYSSEY program. Years differ between tagging programs, but measurements are aligned by month to facilitate visual interpretation of the graphs. Shaded bars indicate individual spawning periods, where the season of individual fish are superimposed on each other, so that the shading represents the intensity of spawning. The darker the colour, the more individuals were in the spawning area during this time. The horizontal line indicates the 50 m depth line used to identify spawning periods in individual fish. CODYSSEY fish were released in April (2003 - 2006), and since most individuals were recaptured within a year after release, the distribution of the data appears uneven across the year. TABACOD fish on the other hand were released throughout the year (2016 - 2018) resulting in a more even temporal distribution of data.
For all fish, mean daily depth was used to classify spawning and feeding season for each individual: Spawning of Baltic cod occurs in the deep waters of the Bornholm Basin (SD 25), while the feeding grounds are found in shallower areas (Aro, 1989; Bagge et al., 1994; MacKenzie et al., 2000). Spawning migrations therefore leave a distinct pattern in the DST records: a sudden change in distribution towards depths below 50 m. In the Baltic Sea, these conditions only exist in the Bornholm Basin. Thus, individual spawning periods were classified as any periods when an individual remained at depths >50 m for more than 7 days during May – September, the known spawning season of the stock (Wieland et al., 2000; Bleil et al., 2009). See Nielsen et al. (2013) for further details on spawning time identification.
2.3 Otolith preparation
Otoliths were marked chemically with strontium chloride in the CODYSSEY program and with tetracycline in the TABACOD program. Methods to identify the chemical mark therefore differ by tagging program. Mark identification of the CODYSSEY samples is based on acquisition of chemical profiles and described under 2.4. Chemical analyses. In the TABACOD samples, mark identification was based on visual identification and described in the following.
Otolith preparation procedures were described in detail in Hüssy et al. (2020a, 2021a) In brief, otoliths were embedded in Epoxy resin (Struers ®) and sectioned through the core using an Accutom-100 multicut sectioning machine to obtain a 10 mm wide block with the nucleus exposed at the sectioned surface. The TABACOD otolith sections, which were marked with tetracycline, were viewed under UV light using a Leica DMLB microscope (with a BP 355 – 425 excitation filter, magnification of 1.36 μm·pixel-1, 3648 pixel x 2736 pixel frame) and images digitized using a Leica DCF290 camera (Figure 4). The otolith growth during the tagging period (Goto) was measured as the distance from the tetracycline mark (or the strontium spike, see below) to the otolith edge along the dorsal axis, while the lifetime growth was inferred via the otolith radius (OR) from the core to the dorsal edge. All measurements were made using Image J ver. 1.54d (Schindelin et al., 2015).
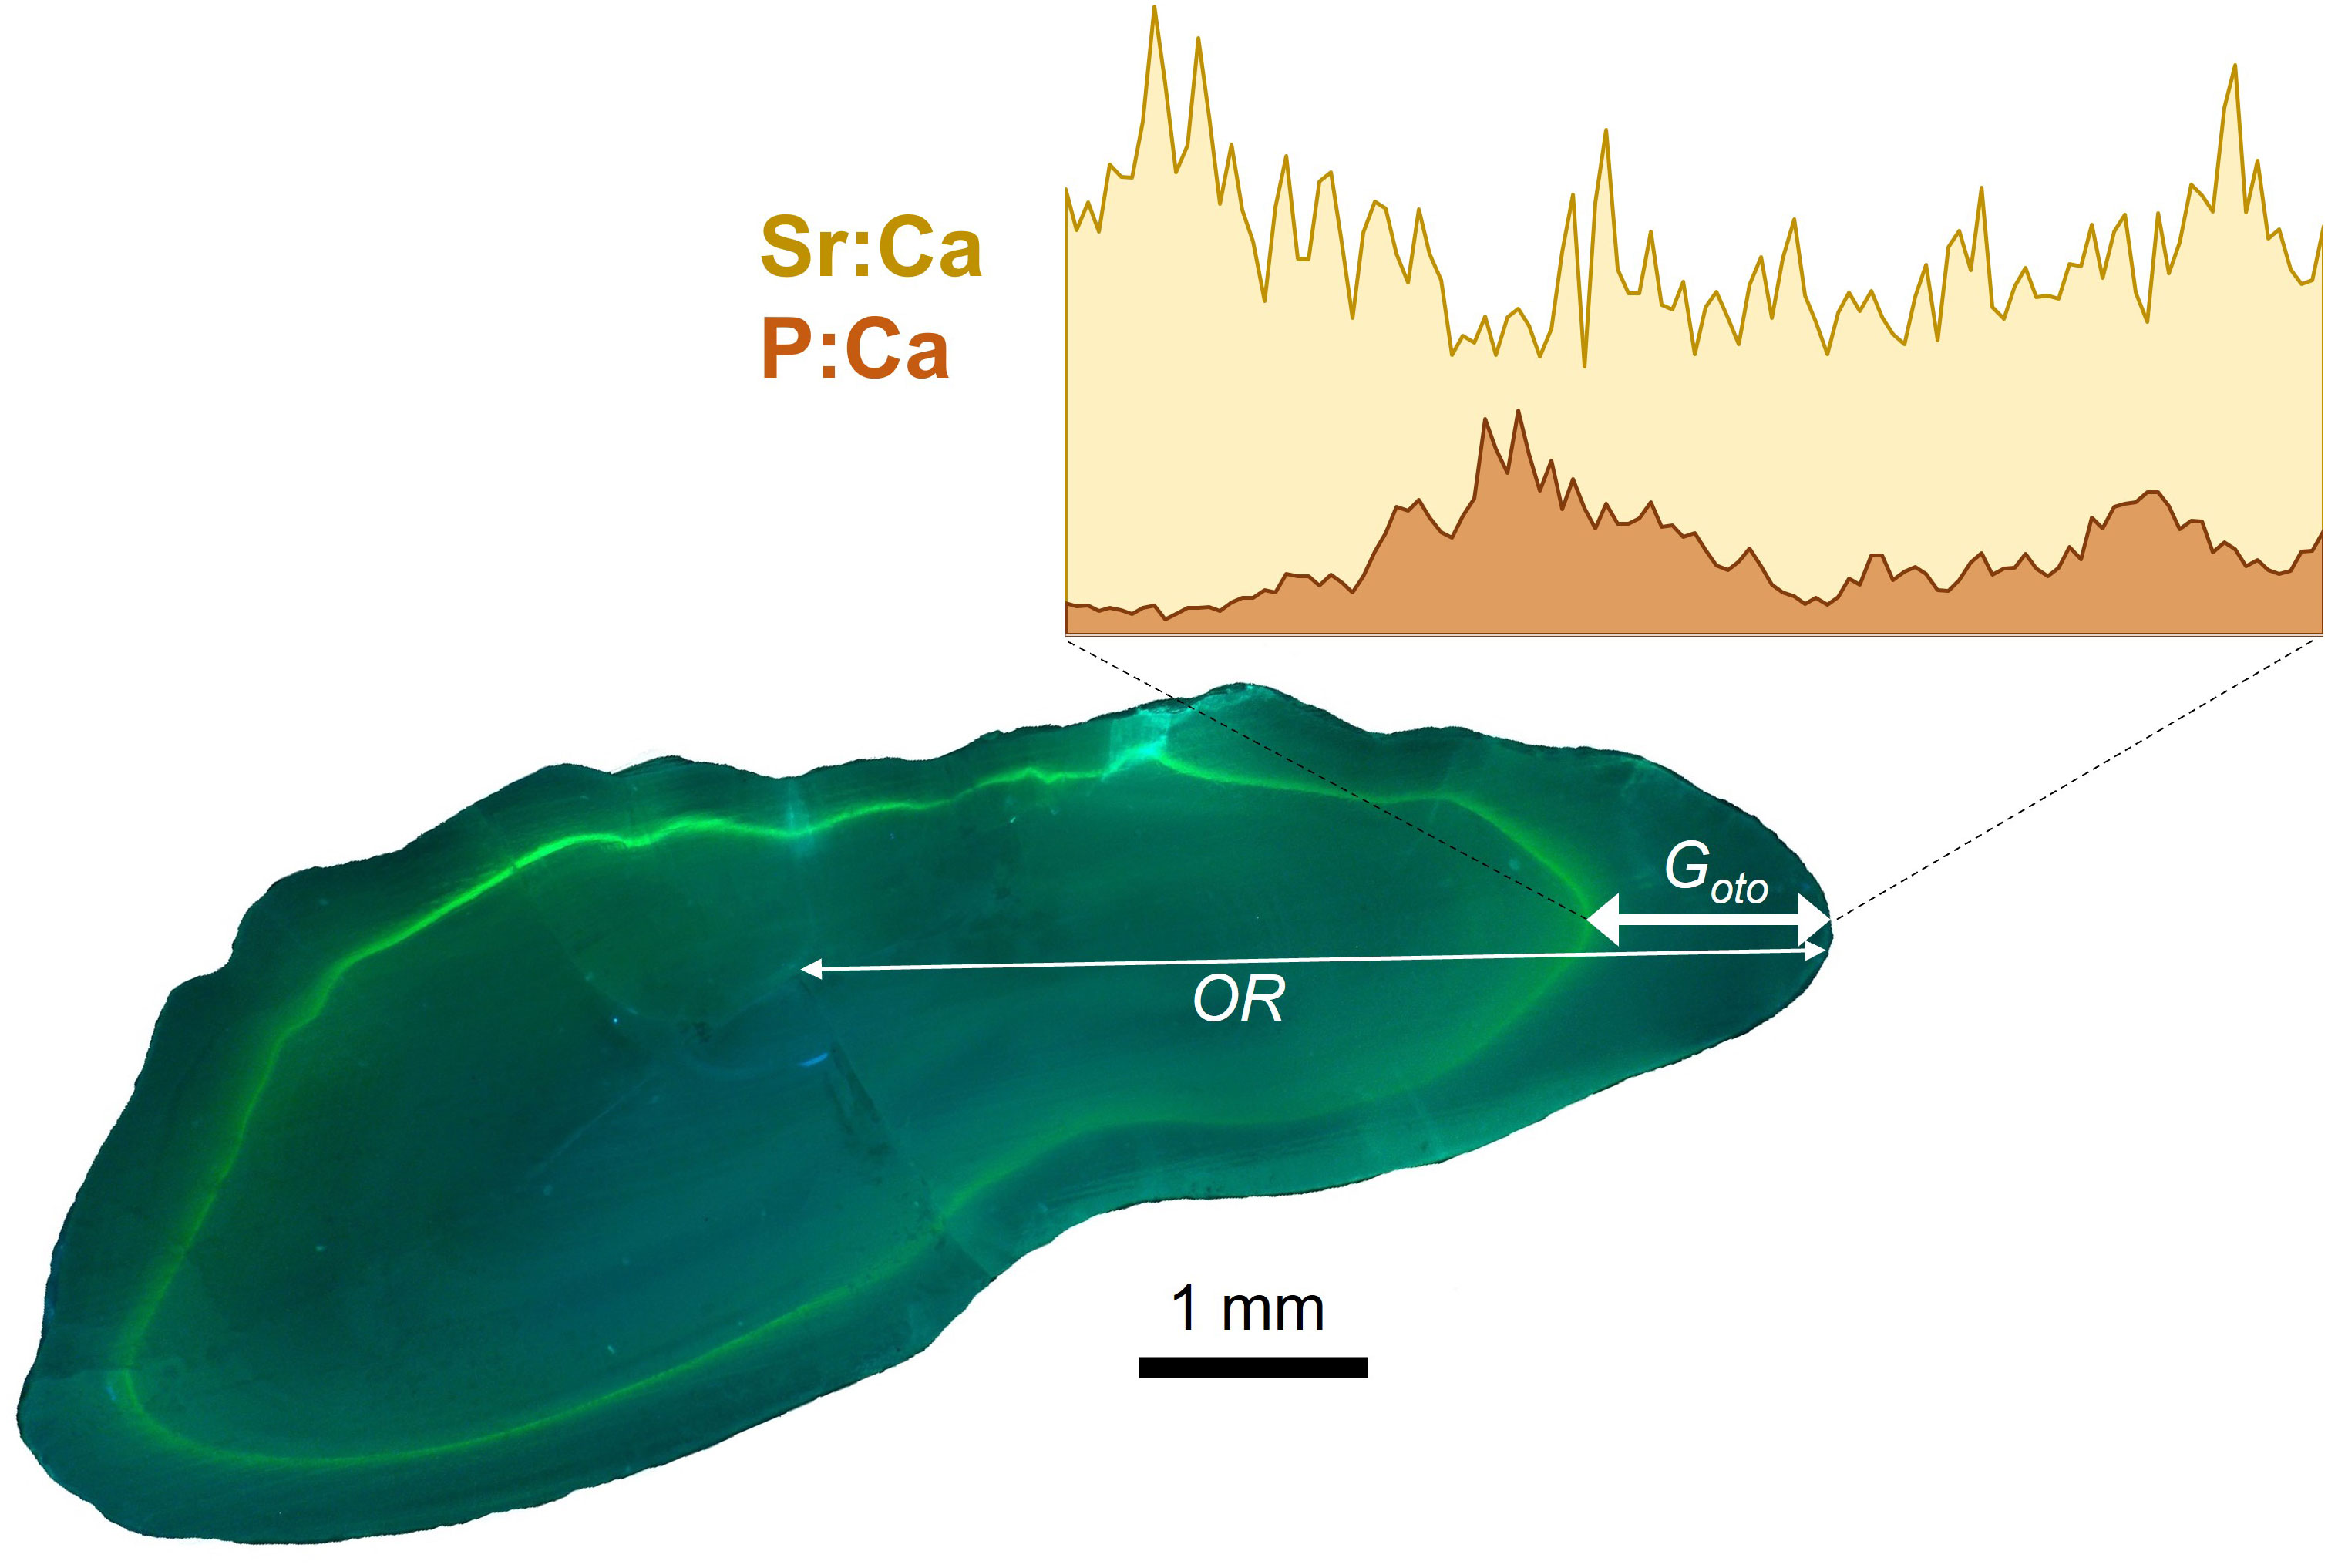
Figure 4 Image of cross section of cod otolith viewed under UV light showing the fluorescent tetracycline-hydrochloride mark (green), where the thin white line shows the total otolith radius (OR) along the dorsal axis and the white line with arrows indicates the laser transect along the and growth measure (Goto). Inset image shows is an example of Sr:Ca (yellow) and P:Ca (orange) profiles measured during the experimental period between when the fish was tagged and recaptured.
Otolith biomineralization and protein concentrations can result in variations in opacity and differences in element incorporation rates (e.g. Sturrock et al., 2015; Hüssy et al., 2020b). Thus, while not a central hypothesis of the study, we still wanted to account for potential influences of otolith opacity on element concentrations. To measure opacity, images of the otolith sections were taken under reflected light (32-bit black and white images). Otolith optical characteristics were examined as a profile of grey values corresponding to the otolith material deposited during time at liberty. Grey values ranged between 0 (black = translucent) and 255 (pure white = opaque), with high values corresponding to high dispersion of light due to high otolith protein content (Watabe et al., 1982; Seyama et al., 1991). These grey values are hereon referred to as otolith opacity.
2.4 Chemical analyses
Trace element analyses were carried out by laser ablation inductively coupled plasma mass spectrometry (LA-ICP-MS) at the Geological Survey of Denmark and Greenland, using a NWR213 frequency-quintupled Nd : YAG solid state laser system from Elemental Scientific Lasers that was coupled to an ELEMENT 2 double-focusing, single-collector magnetic sector field ICP-MS from Thermo-Fisher Scientific. The otoliths were analysed along a transect from the core to the dorsal edge of the otolith following the axis of maximum growth. We used a beam diameter of 40 μm, a laser fluence of 9.5 J·cm–2, a repetition rate of 10 Hz, and a travelling speed of 5 μm·s-1. Concentrations are reported in element:calcium ratios in ppm, using calcium (43Ca) as an internal standard to account for any variable sample introduction parameters affecting the ablation yield. Values > 4x standard deviations from the mean were treated as outliers and discarded (representing<1% of the data for all elements except for Zn, for which 10% of the data were excluded). Further details on operating conditions, standards used, data acquisition parameters, analytical protocols and data processing techniques are described in Serre et al. (2018) and Hüssy et al. (2021a), and summarised in Supplementary Table 2. This study focuses on magnesium (25Mg), phosphorus (31P), manganese (55Mn), zinc (66Zn), strontium (88Sr), and barium (137Ba).
From these line transects, only measurements corresponding to the period between the chemical mark and the otolith edge were selected. In the CODYSSEY samples marked with strontium chloride, a sharp increase in otolith Sr concentration to values > 10 times the reported maximum concentrations of wild Baltic cod (Heidemann et al., 2012; Heimbrand et al., 2020), followed by a rapid subsequent decline, was identified as the chemical mark to use for selecting the appropriate transect data.
2.5 Alignment of otolith and DST data
To align otolith chemical measurements with calendar dates and associated DST data, we assigned calendar dates using the proportional distance between the otolith measurement and the chemical mark (release date). Eastern Baltic cod do not form clearly defined seasonal otolith growth zones, preventing a direct validation of seasonal otolith accretion (Hüssy, 2010; Hüssy et al., 2016b). The assumption of linear otolith growth was therefore tested – for details see Supplementary materials. Otolith accretion (Goto) from the chemical mark to the otolith edge was linearly correlated with DAL, without any seasonal patterns in model residuals (Supplementary Figure 1). Thus – while we recognise that individual deviations from this could result in some decoupling of ‘otolith time’ with ‘calendar time’ and some noise in relationships between sub-annual measurements – otolith accretion during the tagging period was largely constant within fish throughout the year. Each individual measurement was then assigned to a date of formation using Equation 1 and based on the measurements distance to the chemical mark, the proportional relationship between Goto and DAL, using the date of release as the start date:
While the temporal resolution of DST data is high (sub-daily), elemental data typically span several days or weeks, depending on beam size and otolith growth rate. In this study, with a beam travelling speed of 5 μm·s-1, each chemical measurement represented an advancement of approximately 4 days, but the 40 μm beam size incorporated roughly 10 days worth of otolith material in total. Matching otolith chemical measurements with the corresponding DST-derived data required the DST data to be averaged over the same period as each chemical measurement. Here, we averaged DST measurements from the date of release to the date of formation corresponding to the mid-point of the first chemical measurement, and between consecutive days of formation of the following chemical measurements throughout the rest of the transect data, resulting in average values for temperature Tij and depth Dij for each individual i and each measurement j. This approach invariably results in considerable smoothing of the depth and temperature data, potentially masking variation on short temporal scales. Data from the first 7 – 10 days post-tagging, corresponding to the first chemistry measurement, were discarded to avoid effects of the tagging procedure on the behaviour of the fish (van der Kooij et al., 2007).
2.6 Drivers of otolith chemical composition
To examine how much variation in otolith elemental concentrations were explained by environmental and/or physiological variables we fitted linear mixed-effects (LME) models similar to (Sturrock et al., 2015) using the “lme4” package (Bates et al., 2015) in R, ver. R-4.1.3 (R Core Team, 2020). Models were fitted using individual fish and release year as random variable to allow variable intercepts, accounting for inter-individual differences and differences between tagging years (Crawley, 2007; Zuur et al., 2009).
The initial global model [model (2)] included all fixed effects, including area (each individual assignment to western (SD 24) or eastern (SD 25) Baltic (Figure 1), season (spawning/feeding season based on individual depth profiles – see methods), month (month of formation 1 – 12, treated as categorical variable), T (temperature), D (10-m depth stratum, 0 – 10 to 80 – 90, treated as categorical variable), sex (males/females), TL (total length), Gfish (somatic growth between release and recapture), and opacity (0 – 255), with subscripts i representing individual fish and j individual chemistry measurements. Note that Gfish and Goto (otolith extension distance between release and recapture) were highly correlated (r2 = 0.52, df = 1.75, p< 0.001) so only Gfish was included in the global model. For the CODYSSEY samples, where direct measurements of salinity were available, model (2) also included salinity Sij (salinity), whereas salinity was not available and hence not included in the TABACOD samples.
Element concentrations were log+1 transformed to meet assumptions of homogeneity and normally distributed model residuals. Collinearity among the fixed effects may result in variance inflation (VIF). We tested the degree of VIF using “vif” test of the “car” package (Fox and Weisberg, 2019). Models with VIF > 5 are considered to suffer from collinearity among predictor variables (Zuur et al., 2010). The highest VIF values were observed for month (4.42), season (2.69) and depth (2.23) as spawning usually occurs within specific months in the deepest parts of the Bornholm Basin. However, all VIF values were< 5 and therefore all fixed effects were included in the initial global model [model (2)]. Prior to model testing and selection, the predictor and response variables were centred and scaled using the “scale” function in R in order to standardise the model (Schielzeth, 2010). Finally, the most parsimonious model was identified by ranking all possible models by the Akaike information criterion (AIC) using the “dredge” function of the MuMIn package (Burnham and Anderson, 2002). The final model was selected as the model with an AIC difference > 2 compared to all other models (Zuur et al., 2009). Model statistics, including partial p values and conditional and marginal correlations, were extracted using the “lmerTest” package (Kuznetsova et al., 2017).
3 Results
Element concentrations through time vary considerably but are similar between the two tagging programs. While notable seasonal patterns are evident in the elements under greater physiological control (Equation 2), fluctuations in elements primarily controlled by environmental concentration appear irregular over time. Profiles through time for all elements are shown in Supplementary Figure 3. Element concentrations are also shown in relation to depth (Supplementary Figure 4A), temperature (Supplementary Figure 4B), salinity (Supplementary Figure 4C), and fish length (Supplementary Figure 4D). In the following, we highlight general patterns and when otolith element concentrations did or did not meet the predicted patterns described at the end of the introduction. We also report on patterns associated with otolith biomineralization, inferred through correlations with otolith opacity.
3.1 Elements under greater environmental control (Sr, Ba, Mn)
For samples where salinity was directly measured by the DST attached to the fish (CODYSSEY samples), global model (2) was fitted including salinity as a possible predictor, however it was never selected for the final model. Even when model (2) was fitted excluding potentially covarying variables area and depth (see hypotheses) there was still no relationship between salinity and otolith Sr and Ba as we had expected (H1; Table 1, Supplementary Figure 4C). As such, the results presented herein are based on the combined data from the two programmes (hence without salinity as a predictor).
Despite the apparent absence of a salinity effect, otolith Sr concentrations were significantly higher and Ba and Mn concentrations lower in the western than in the eastern Baltic Sea, as predicted (H2; Figure 5, Table 1). Contrary to expectation, otolith Sr concentrations decreased with depth, while otolith Ba concentrations, as expected, were highest in shallow water (H3). Overall, however, Sr and Ba were positively correlated (ANOVA, df = 2006, r2 = 0.15, p< 0.001) unlike observations throughout much of the literature. Otolith Mn concentrations were highest in shallow water during the late summer – winter (August – February) feeding season. (H4) All three elements varied seasonally with the highest Sr concentrations in August to September and lowest concentrations in November to January, coinciding with general spawning- and feeding seasons respectively. Seasonal signals were even more pronounced in Mn, but out of phase with the Sr, with a peak in fall/winter and a sharp drop in spring. Ba concentrations followed the same seasonal pattern as Mn, but somewhat less pronounced. Contrary to hypothesis H5 we detected size-related patterns in otolith Sr, Ba and Mn concentrations, with all elements negatively related to fish size at recapture. Mean fish growth was not included in the final model. There was a negative relationship between otolith opacity and both Ba and Mn, and a positive relationship with Sr. The only element that differed between the sexes in this group of elements was Ba, with higher otolith concentrations in males than females (Table 1). For all three elements reported in this section, the fixed effects explained a considerably lower proportion of the variability in otolith concentrations than the random effects of tagging year and fish (Sr: marginal r2 = 19.5%, conditional r2 = 58.5%; Ba: marginal r2 = 13.2%, conditional r2 = 73.4%; Mn: marginal r2 = 10.0%, conditional r2 = 58.9%).
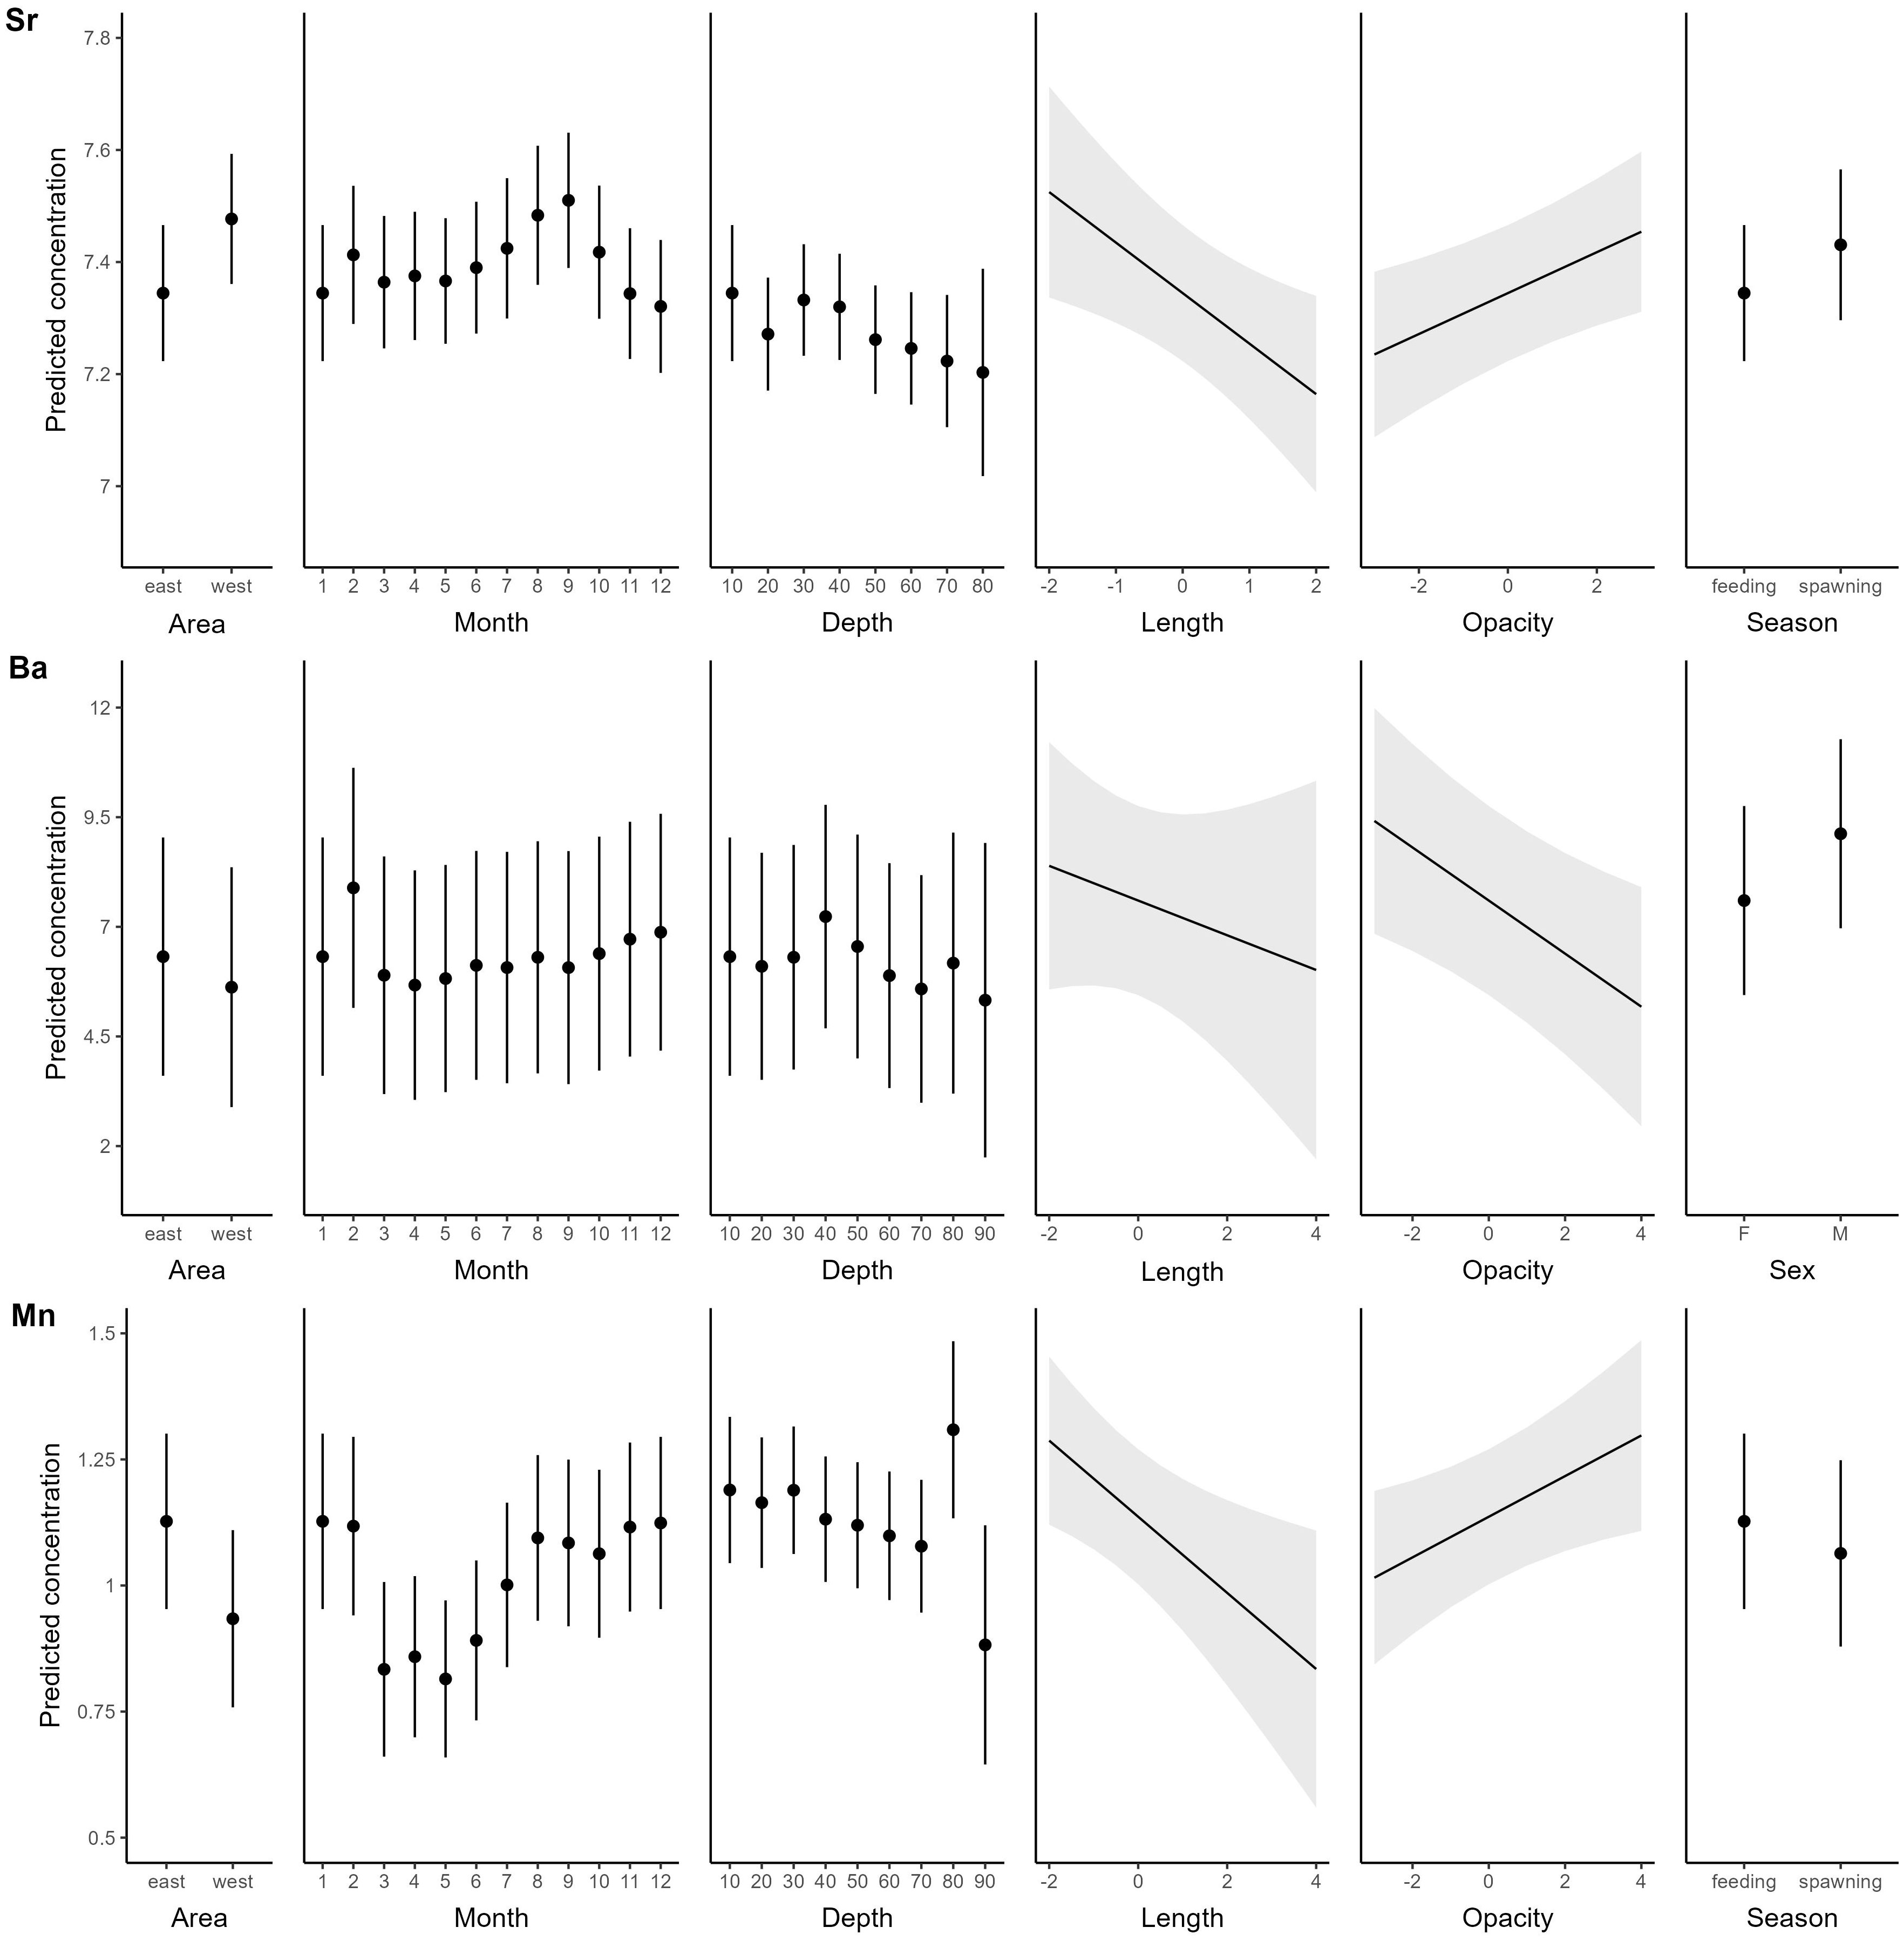
Figure 5 Predicted response of Sr (top panels) Ba (middle panels) and Mn (bottom panels) to significant drivers. Element concentrations are log+1 transformed predicted ppm values. Note that all drivers are the same for the two elements except those in the last column on the right, and that continuous variables were centred and scaled prior to analysis. For factors: Dots = Predicted mean values, bars: ± 1.96 SE; for continuous variables: Lines = Predicted mean estimates, shaded areas: confidence intervals based on ± 1.96 SE.
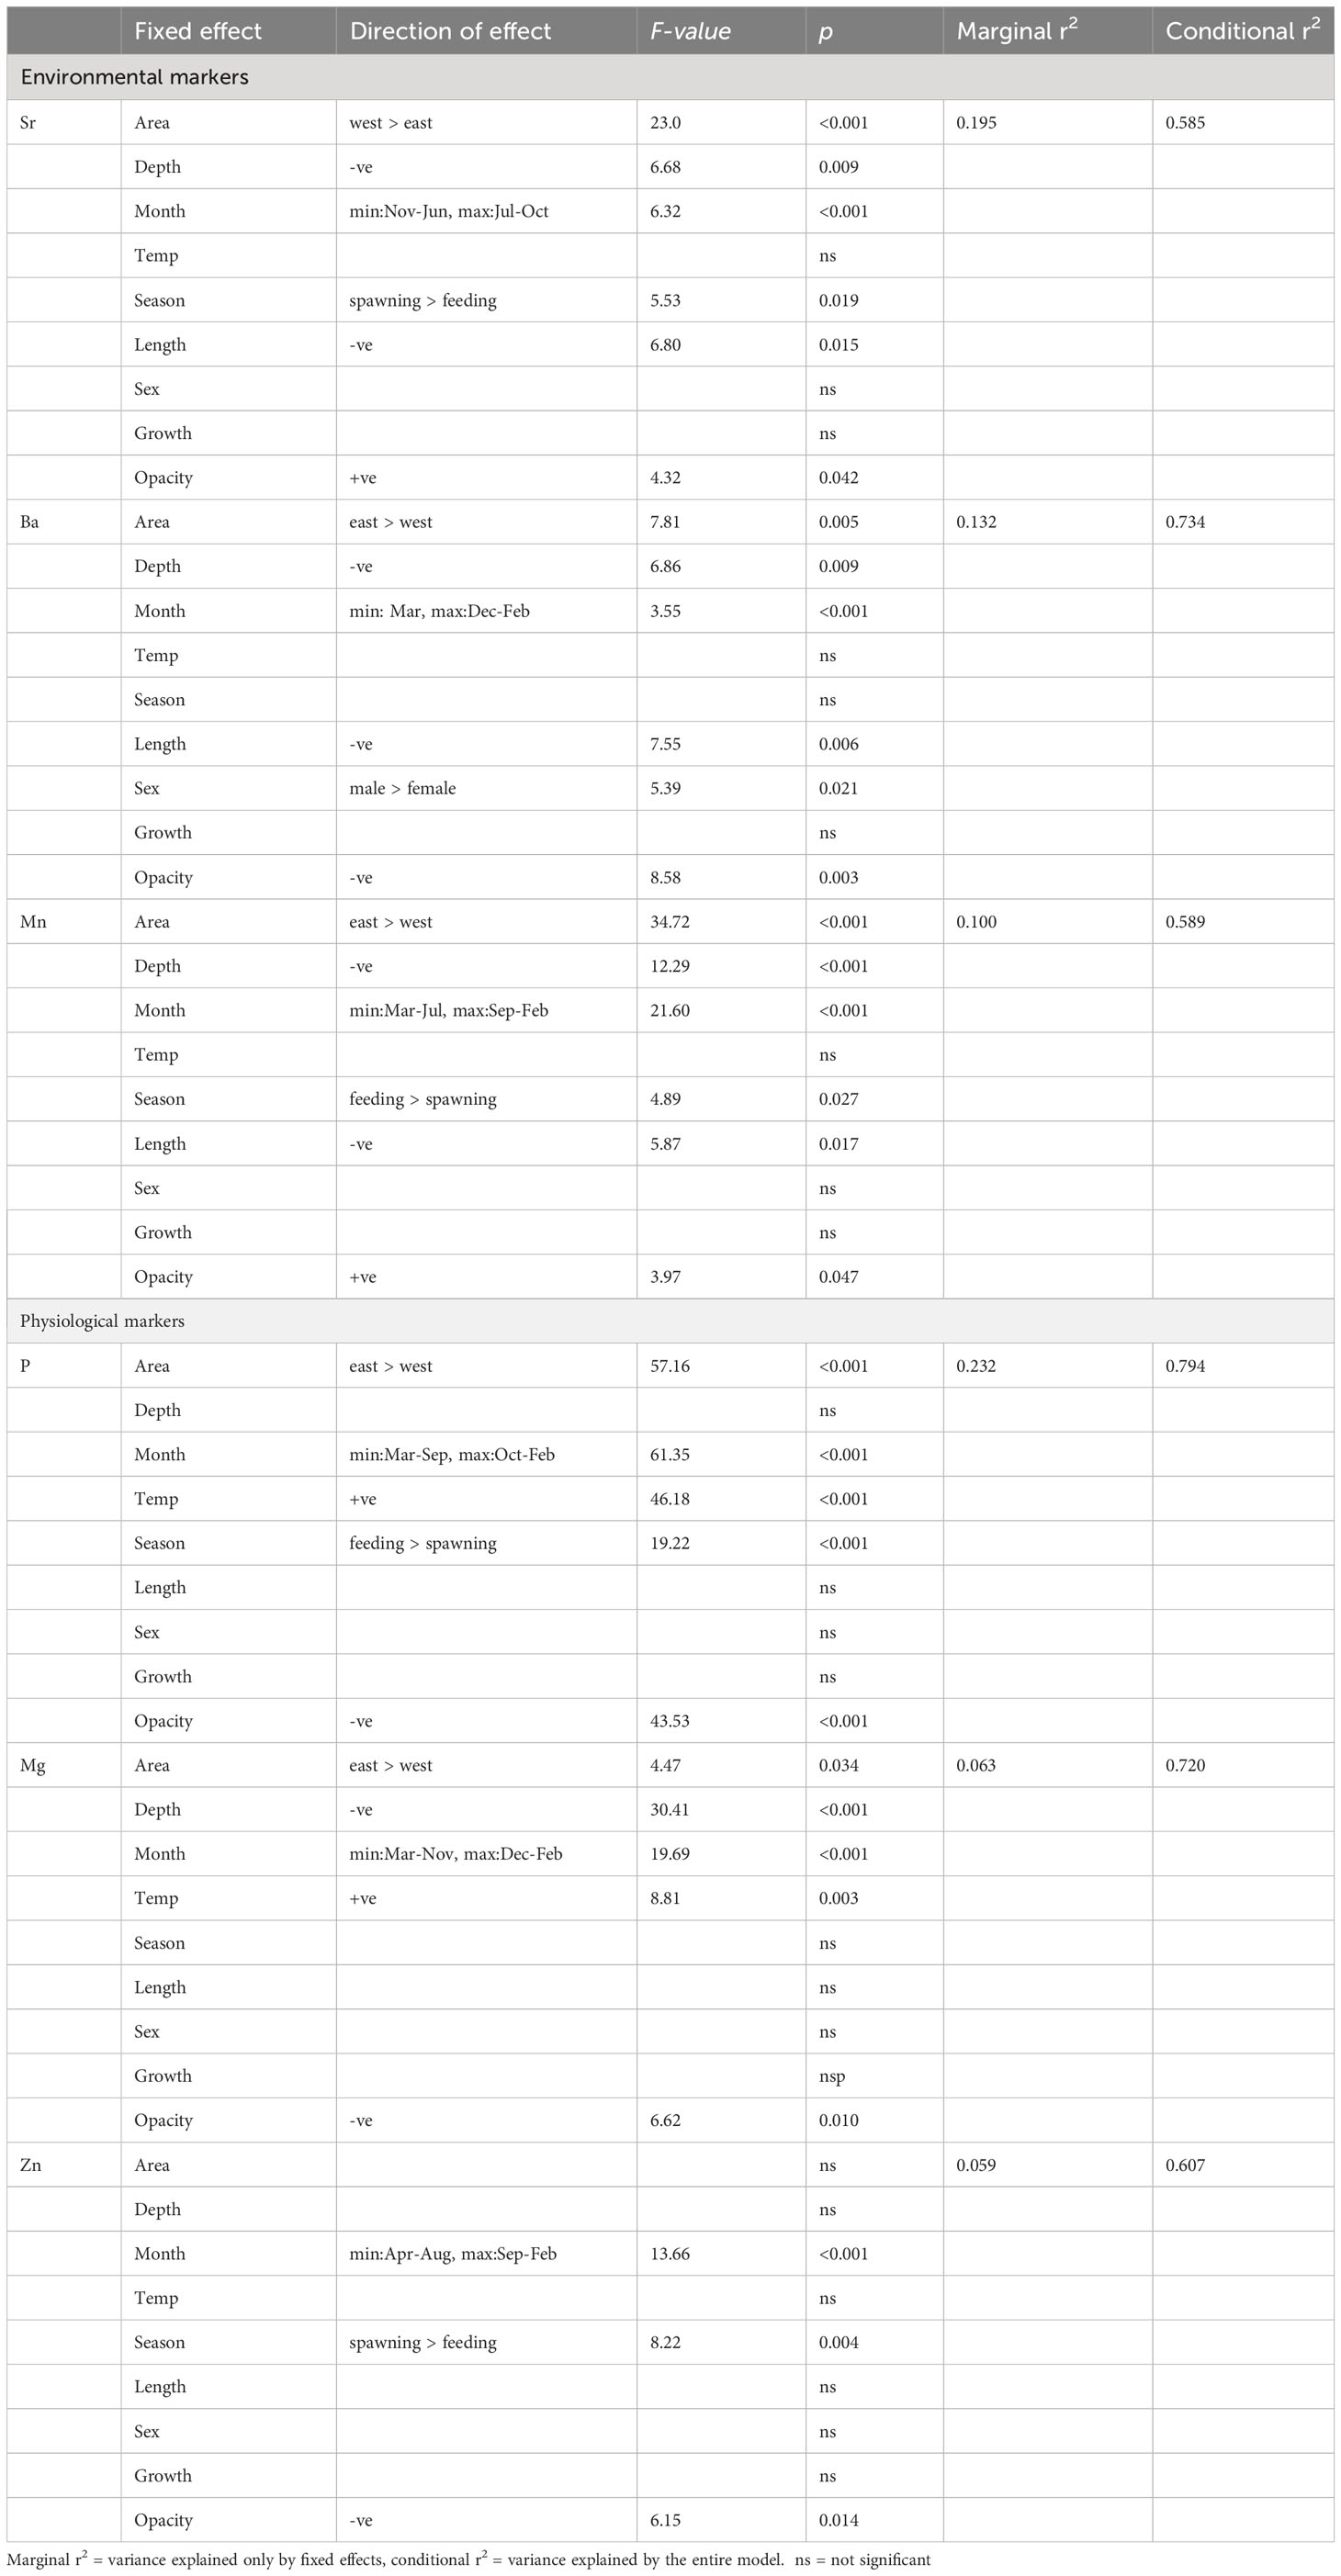
Table 1 Summary statistics of drivers influencing otolith element concentrations in Baltic Sea cod.
3.2 Elements under greater physiological control (P, Mg, Zn)
P, Mg and Zn all exhibited similar relationships with environmental and biological variables (Table 1, Figure 6) in the final Equation 2. All elements showed a distinct seasonal pattern with lowest concentration in late spring (April – May) and highest concentrations in winter (November – February), as predicted (H6), except that the peak concentrations were predicted to occur in fall/early winter when consumption (and presumably also growth) is highest. P and Mg were also positively correlated with temperature (H7), while there was no temperature effect on Zn concentrations. We also predicted higher element concentrations during the feeding season compared to the spawning season (H9), but this was only evident for P, while the opposite was observed for Zn (highest Zn during spawning), and Mg showed no difference between seasons. Also contrary to our predictions was that all three elements were not related to mean fish somatic growth across the tagging period (H8). They were also negatively related to otolith opacity. Also not consistent with our predictions were the observations of increased Mg with depth, and higher concentrations in P and Mg in the eastern than the western Baltic Sea (H10). Similar to the previous section, the fixed effects explained a considerably lower proportion of the observed variability than the random effects of tagging year and fish (P: marginal r2 = 23.2%, conditional r2 = 79.4%; Mg: marginal r2 = 6.3%, conditional r2 = 72.0%; Zn: marginal r2 = 5.9%, conditional r2 = 60.7%).
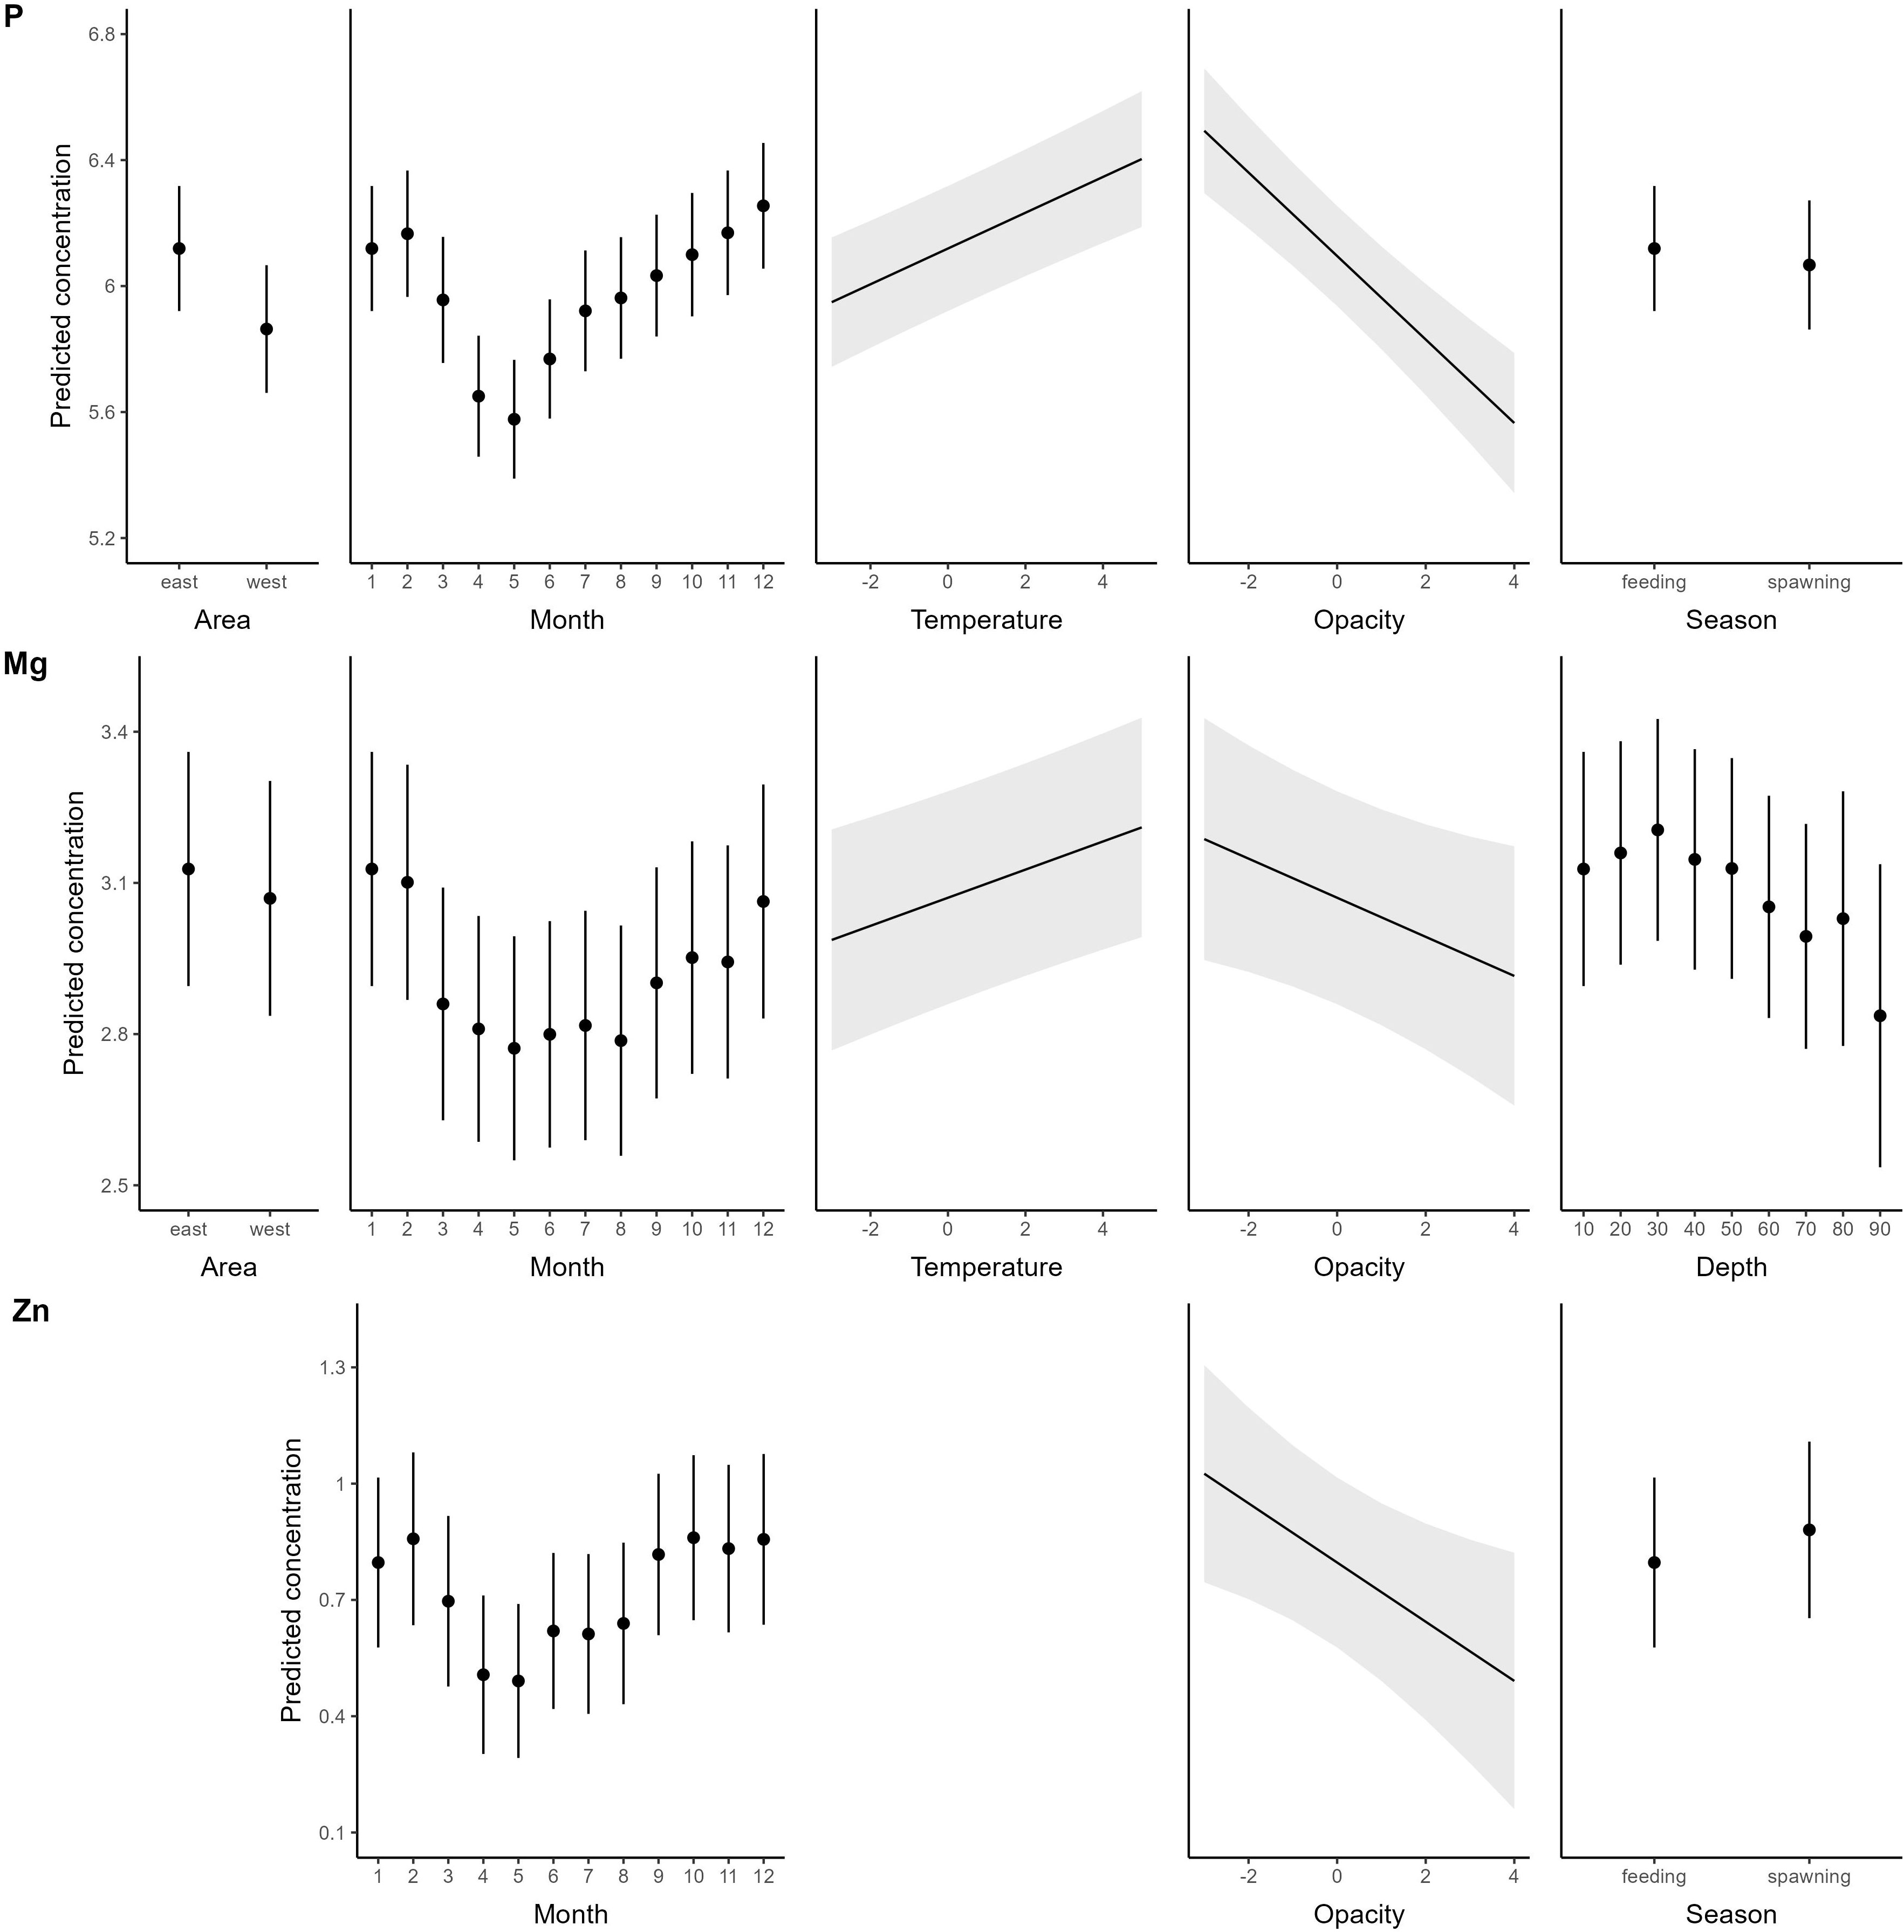
Figure 6 Predicted response of P, Mg, and Zn to significant drivers. Element concentrations are log+1 transformed predicted ppm values. Note that all drivers are the same for the two elements except the last to the right, and that continuous variables were centred and scaled prior to analysis. For factors: Dots = Predicted mean values, bars: ± 1.96 SE; for continuous variables: Lines = Predicted mean estimates, shaded areas: confidence intervals based on ± 1.96 SE.
4 Discussion
The results of this study demonstrate that the interpretation of otolith elemental patterns in adult eastern Baltic cod, is complex. Many studies have reported seasonal patterns in otolith chemistry in marine fishes (e.g. Kalish, 1989, 1991), however, disentangling the drivers, given covarying patterns in somatic and otolith growth rate, reproductive condition, movements (i.e. between spawning- and feeding areas, nursery- and adult distribution areas, vertical movements) and ambient environmental conditions, remains a daunting task. While the importance of controlled laboratory studies cannot be underestimated, the logistics of performing these with mature, large fish remain a challenge, giving incentive for performing ‘uncontrolled’ in situ experiments like the ones included in this paper. Here, patterns in otolith elemental concentrations sometimes varied as expected, sometimes showed no clear signal, and sometimes exhibited significant trends opposite to those expected. In this discussion we highlight some common trends within the two ‘groups’ of elements (environmental and physiological) and discuss some of the possible reasons for observed discrepancies. The influence of biomineralization (inferred through otolith opacity) is discussed in a separate paragraph.
4.1 Elements under greater environmental control (Sr, Ba, Mn)
Sr, Ba and Mn all showed expected differences among geographic areas (H2) and months of the year (H4) and expected lack of relationships with fish age, somatic growth rate, and ambient temperature (H5). However, some elements also showed unexpected relationships with depth (H3), salinity (H1), sex and fish length (H5). Each of the elements will therefore be discussed separately.
4.1.1 Strontium
While many variables exhibited expected patterns (outlined above), otolith Sr did not seem to reflect variations in ambient salinity (Hüssy et al., 2020b and references therein), even for fish where direct salinity measurements were available (H1). This strongly suggests that in the area occupied by the tagged fish, the relationship between salinity and water Sr concentrations (or Sr/Ca ratios) does not follow the typical positive relationship, and/or that other drivers could be masking potential relationships. Another unexpected result was that otolith Sr decreased with depth and fish size (H3, H5). Size-stratification with depth is a well-known phenomenon thought to prevent cannibalism, with larger cod generally occupying deeper areas than smaller cod (Sparholt et al., 1991; Pihl and Ulmestrand, 1993; Oeberst, 2008). Most field studies on marine species report increases in otolith Sr with fish age/size (Kalish, 1989; Secor and Rooker, 2000; Fowler et al., 2005; Jessop et al., 2008; Brown and Severin, 2009; Avigliano et al., 2015; Hughes et al., 2016; Siskey et al., 2016; Grammer et al., 2017). Only two studies found a decrease in otolith Sr with size (and growth) (Morales-Nin et al., 2005; Sturrock et al., 2015). Thus, one would expect higher otolith Sr concentrations at depth both as a result of salinity and size differences – yet we observed the opposite. In other Atlantic cod stocks, no relationship between fish size and otolith Sr was observed (Hüssy et al., 2021b). It is likely that some of the contradictions in otolith Sr concentrations in this study have occurred because ambient Sr concentrations (or Sr/Ca ratios) do not relate consistently to salinity. This is more common than is typically assumed as a result of unexpectedly high freshwater endmembers (Gillanders, 2005; Brown and Severin, 2009; Rohtla et al., 2022). In the Baltic Sea, water Sr concentrations are generally well conserved with salinity, but with significant local deviations attributable to river chemistry (Andersson et al., 1992). Sr concentrations in the rivers along the southeastern Baltic Sea are for example significantly higher than in rivers in the northwestern Baltic Sea region, reflecting differences in geology (Andersson et al., 1994). While large differences in ambient Sr concentrations are typically linearly related to otolith concentrations, where ambient variations are lower, physiological factors such as metabolic rate, age and growth rate can play a significant role (Brown and Severin, 2009; Sturrock et al., 2014, 2015; Hüssy et al., 2020b). Seasonal peaks in otolith Sr often coincide with peak spawning (Kalish, 1991; Granzotto et al., 2003; Clarke and Friedland, 2004; Sturrock et al., 2015), reflecting a change in Sr availability in the blood plasma (Sturrock et al., 2015).
While we had hoped that the fine-scale movement patterns revealed by DST records would help to decouple these drivers since migration patterns and maturation/spawning cycles tended to coincide, it was not possible to resolve whether sub-annual changes in otolith Sr concentrations were driven more by environmental signals resulting from seasonal migrations among habitats or by physiological processes related to spawning.
4.1.2 Barium
Otolith Ba largely behaved as expected, with higher concentrations in the fresher eastern areas (H1, H2) and shallower depths (H3) suggesting movement-driven seasonal patterns without significant effects of most physiological variables (age, temperature and growth, H5). However, there were some examples where otolith Ba refuted our hypotheses, with apparent effects of physiology (fish size, sex) and biomineralization (otolith opacity).
As for otolith Sr, otolith Ba was negatively related to fish size (H5). In other species, no relationships between otolith Ba and fish age and size were observed, for wild marine fish over several years (Elsdon and Gillanders, 2005; Hamer et al., 2006), and in pen-reared Pleuronectes platessa (Sturrock et al., 2015). Grammer et al. (2017) attributed a consistent increase in otolith Ba with age to species-specific ontogenetic mechanisms, or – more likely – an overlying environmental signal. Negative effects of size might be expected if our assumptions that water Ba concentrations indeed decrease with depth given the size stratifications mentioned above, with larger fish typically using deeper more saline water (Coffey et al., 1997). In addition, while not observed here, food and growth rates can have an effect on otolith Ba, with higher otolith Ba in individuals subjected to low rations (Walther et al., 2010) and exhibiting slower growth (Walther et al., 2010; Miller, 2011; Sturrock et al., 2015). Indeed Walther et al. (2010) suggested that somatic growth rate may explain 20% of the observed variation in otolith Ba. Overall, size- and sex-dependent (Nielsen et al., 2013) variations in depth distributions (Hüssy et al., 2009; Nielsen et al., 2013; this study) appear to explain the majority of otolith Ba patterns observed in this study, supporting our hypothesis that otolith Ba faithfully reflects ambient concentrations in wild fish.
4.1.3 Manganese
Otolith Mn is increasingly used to trace fish’s exposure to hypoxia (Limburg et al., 2011; Mohan et al., 2012; Mohan and Walther, 2016; Altenritter et al., 2018; Altenritter and Walther, 2019). In support of this, we found expected effects of area (H2), month (H4) and partial support for the effect of depth (highest Mn concentrations in shallow coastal areas; H3), but also unpredicted effects of fish size and spawning season (H5) and we did not observe the expected increases in Mn in the deepest, hypoxic parts of the basin (H3). Given the size-related depth distribution of Baltic cod described above (Sparholt et al., 1991; Pihl and Ulmestrand, 1993; Oeberst, 2008) and movements into deeper water to spawn, we expected otolith Mn to be positively related to size, higher during the spawning season, and/or positively related to depth. Instead, otolith Mn concentrations were highest among smaller fish, during the feeding season (late summer to winter) and negatively related to depth. While this result should be interpreted with some caution, given fitting of a linear model to potentially non-linear data (but see Supplementary Figure 4 for raw plots), it suggests that hypoxia exposure is greatest in shallow coastal waters and limited during spawning in the deep basin. Indeed, even though eastern Baltic cod are known to undertake vertical migrations down into hypoxic water for foraging (Neuenfeldt et al., 2009), they generally avoid water with oxygen concentrations< 2 ml O2 l-1 during the spawning season by moving higher up into the water column (Schaber et al., 2011). Predicted oxygen concentrations at the depths frequented by cod during spawning in the present study were consistently above > 2 ml O2 l-1 (Lehmann et al., 2022). It thus seems likely that exposure to hypoxia-related increases in water Mn during the spawning season is limited in this population. Furthermore, otolith Mn is also governed by additional physiological regulation (Altenritter et al., 2018; Thomas and Swearer, 2019; Hüssy et al., 2020b). In Pleuronectes platessa for example, otolith Mn was regulated by both water concentration and fish growth rate (Sturrock et al., 2015), and the pronounced seasonal pattern in otolith Mn observed in this study has previous been shown to coincide with seasonal changes in somatic growth of cod, where otolith Mn was highest during fall, coinciding with the time when growth rates are fastest (Hüssy et al., 2021a). While the present study suggests predominantly environmental control of Mn incorporation into the otoliths of wild eastern Baltic cod, some additional physiological regulation cannot be excluded.
4.2 Elements under greater physiological control (P, Mg, Zn)
P, Mg and Zn are important co-factors in many physiological processes. Spatiotemporal differences occur in the environmental concentrations of these elements, because they are taken up by primary producers during annual phytoplankton blooms (Elsdon and Gillanders, 2005; Walther and Limburg, 2012). Here, otolith P, Mg and Zn concentrations showed remarkably similar seasonal trends, with the lowest concentrations in April and May and – as predicted – the highest concentrations in fall and winter (H6). Also as predicted, Mg and P were positively related to temperature (H7) but were unexpectedly related to geographic area and/or depth (H10). Also unexpectedly, none of these elements were influenced by fish size or overall growth rate (H8), or their effects were already accounted for by factors such as month and season.
4.2.1 Phosphorus
In the Baltic Sea, ambient P varies strongly between seasons, where phosphate concentrations are near zero in summer and peak in autumn – winter (Helcom, 2009; Seidel et al., 2017; Naumann et al., 2020), owing to increased primary production (Wulff and Rahm, 1988), precipitation-related increases in P loading during fall–winter (Rolff et al., 2008) and recycling in the sediments in hypoxic areas (Viktorsson et al., 2013). Conversely, otolith P increased sharply from June onwards showing that it is not synchronous with ambient P. Hüssy et al. (2021a) therefore proposed that P is a consistent tracer of seasonally varying physiological activity and growth in Baltic cod. The coldest temperatures experienced by the fish in this study occurred during April and the highest temperatures in September – October (see also (Hüssy et al., 2009; Hüssy, 2010; Righton et al., 2010; Hüssy et al., 2020a) – and thus in synchrony with otolith P concentrations. The fact that otolith P is higher during the feeding than the spawning season, and increases with temperature, further supports this hypothesis and other patterns observed for plaice (Sturrock et al., 2015). However, there may be some influence of hypoxia and area-specific water concentrations, with otolith P concentrations overall higher in the east, reflecting geographic patterns in dissolved organic phosphate (Conley et al., 2002, 2009; Naumann et al., 2020). Hypoxia regulates the biogeochemical cycles of P, where sediments may act as a source of P loading during anoxic conditions and as a sink under oxic conditions (Conley et al., 2002). Dissolved organic phosphate is highest in the deeper parts of the basins and highest in the eastern parts of the central Baltic Sea (Conley et al., 2002, 2009; Naumann et al., 2020). The higher concentrations of otolith P in the east may thus be the result of higher environmental bioavailability related to hypoxia.
4.2.2 Magnesium
The seasonality in otolith Mg closely mirrored the pattern in otolith P, both apparently reflecting seasonal variations in physiological activity. There is growing evidence that otolith Mg is tied to the feeding activity and metabolic rate of the fish (Limburg et al., 2018; Thomas and Swearer, 2019). However, the negative relationship between otolith Mg and depth could reflect an environmental signal, in that freshwater runoff is known to create a coast to offshore gradient in environmental concentration (Cox, 1989; Lebrato et al., 2020).
4.2.3 Zinc
Otolith Zn concentrations also mirror the seasonal patterns of P and Mg, but with more abrupt changes to minima in April/May. In sockeye salmon (Oncorrhynchus nerka), plasma concentrations of Zn decrease during spawning migrations (Fletcher et al., 1975; Fletcher and Fletcher, 1980), as maternal Zn is rerouted for vitellogenesis (Riggio et al., 2003; Thompson et al., 2012). Consistent with this, Zn concentration in both plasma (Sturrock et al., 2015) and otolith Zn decreased prior to spawning in female Pleuronectes platessa (Sturrock et al., 2015). Conversely, in this study, otolith Zn concentrations were higher during the spawning season and lower during the feeding season. Interestingly, walrus tusks of both sexes exhibit a sudden increase in Zn at sexual maturity (Clark et al., 2020). It could be that increased demand for Zn during reproduction is common across vertebrates. In water, the availability of Zn ions is salinity dependent (Sylva, 1976) with some evidence that otolith Zn is somewhat related to environmental Zn concentrations in fish moving between marine – and freshwater (Milton et al., 2000; Arai et al., 2007). However, otolith Zn in marine fishes may also be derived from the diet (Ranaldi and Gagnon, 2008), and therefore presumably subject to bioaccumulation through the food web (Ranaldi and Gagnon, 2010).
4.3 Otolith opacity
As otolith opacity relates primarily to the relative concentration of otolith matrix compounds in the calcium carbonate lattice, and is driven by daily, seasonal, and ontogenetic patterns in otolith biomineralization, we discuss it separately here. Otolith matrix protein concentrations exhibit a negative relationship with fish size (Baba et al., 1991; Sasagawa and Mugiya, 1996; Hüssy et al., 2004) and a positive relationship with temperature (Hüssy et al., 2004; Fablet et al., 2011), due to reduced matrix synthesis, increased calcium carbonate accretion, or an interaction between the two. Otolith opacity increases with increasing concentrations of organic matrix compounds (Hüssy et al., 2004; Pilling et al., 2007). Thus, one would expect the concentration of matrix-bound elements to be positively related to otolith opacity. However, P, Mg and Zn were all negatively correlated with opacity. Elements that primarily substitute for Ca in the crystal lattice, on the other hand, would be expected to be unrelated to otolith opacity. Yet Sr and Mn were positively related, and Ba negatively related to otolith opacity. These contradictory results highlight our still limited understanding of the organic matrix chemistry and how these compounds interact with endolymph ions during biomineralization (Thomas et al., 2019).
4.4 Future perspectives
The key lessons learned from this study were (1) the value of performing controlled experimental studies to disentangle variables that are intrinsically collinear in nature, and (2) the value of measuring element concentrations in freshwater endmembers entering a brackish or marine system. While fully marine environments typically lack large physicochemical gradients that can impede our ability to reconstruct individual migrations using otolith chemistry (Sturrock et al., 2012), the Baltic Sea contains perhaps too many gradients. The heterogeneous brackish hydrography in the Baltic Sea coupled with the cod’s complex migration patterns covaried temporally, horizontally, and vertically, making it impossible to tease apart physiological signals from environmental signals relating to changes in water temperature and chemistry as the fish moved among habitats. Thus, contrary to our initial expectation, tagged Baltic cod were not the ideal case study for testing the validity of hypotheses on otolith biomineralization and element uptake. To improve our understanding of the dynamics in this environment, we recommend the combined sampling of water, fish plasma and otoliths (e.g. Sturrock et al., 2015) in order to establish a comprehensive library of information for calibrating measured otolith concentrations. Improved understanding of biomineralization mechanisms have been highlighted as essential research need in this field for many decades (Campana, 1999; Hüssy et al., 2020b). Our results reinforce this perception, particularly for understanding patterns in P, Mg, Mn, and Zn that are co-factors for proteins involved in fish metabolism and otolith growth and opacity.
Another caveat of this study was the potential for otolith time (element concentrations) to be decoupled from calendar time (environmental measurements) given assumptions of constant growth over the tagging period. Other studies have used fine-scale otolith δ18O measurements to add a temperature-driven otolith timeline (Sturrock et al., 2015), but this was impossible here given considerable salinity variations and lack of a detailed three-dimensional water δ18O isoscape. Nor could we use the periodicity of growth bands to infer intra-annual growth rates as they are famously indistinct in Baltic cod otoliths (Hüssy, 2010; Hüssy et al., 2016b). Future work should focus on expanding the research using otolith Mg and P (Heimbrand et al., 2020; Hüssy et al., 2021a; Reis-Santos et al., 2022) to link their seasonal concentration patterns to calendar month.
A persistent pattern observed in this study was that the fixed effects explained a relatively low fraction of the variation in otolith element concentrations (6 – 23%), with the fish and year level random effects explaining – on average – more than 5.5 times as much (40 – 60%). This observation is far from unusual. In the most comprehensive study of its kind, using fish reared under identical mesocosm conditions and including water and blood plasma element concentrations and El/Ca ratios as possible explanatory variables, individual variation still dominated the signal (fixed vs. random effects explaining 16 – 50% vs. 16 – 59% of the variation otolith elemental concentrations; Sturrock et al., 2015). Together, these studies highlight the need to understand the factors driving individual differences in order to effectively partition variance in otolith elemental chemistry before it can be reliably used for environmental and movement reconstructions in a heterogeneous environment.
The focus of future studies should include targeted laboratory and field studies to better understand elemental uptake and transport from water, food, and existing body pools to the otolith (Hüssy et al., 2020b). While challenging to do, it is important to carry out these studies across life stages and growth and maturation cycles in order to quantify the impact of physiology, and to always include sex as a covariate, in case sexual dimorphism or factors associated with vitellogenesis prove to be important.
Data availability statement
The raw data supporting the conclusions of this article will be made available by the authors, without undue reservation.
Ethics statement
The animal study was approved by The Animal Experiments Inspectorate Ministry of Food, Agriculture and Fisheries of Denmark License: 016-15-0201-00929 Further experimentation licenses: Germany: AZ 7221.3.1-007/18 Sweden: Dnr 5.8.18-14823/2018. The study was conducted in accordance with the local legislation and institutional requirements.
Author contributions
KH: Conceptualization, Data curation, Formal Analysis, Funding acquisition, Investigation, Methodology, Project administration, Resources, Validation, Visualization, Writing – original draft, Writing – review & editing. SH: Conceptualization, Data curation, Formal Analysis, Methodology, Validation, Visualization, Writing – review & editing. MM: Data curation, Investigation, Methodology, Validation, Writing – review & editing. AH: Data curation, Investigation, Writing – review & editing. KR: Data curation, Investigation, Validation, Writing – review & editing. TT: Data curation, Methodology, Resources, Writing – review & editing. MK: Data curation, Formal Analysis, Methodology, Writing – review & editing. MC: Funding acquisition, Writing – review & editing. AS: Conceptualization, Formal Analysis, Investigation, Methodology, Visualization, Writing – original draft.
Funding
The author(s) declare financial support was received for the research, authorship, and/or publication of this article. This work was supported by the Danish Ministry for Environment and Food and the European Union under the project “Future perspectives for cod in the eastern Baltic Sea-stock development & fishing and management opportunities in a changing ecosystem” Grant [33113-B-20-157]. The provision of samples and auxiliary data was funded by DG Fisheries of the EU under the project “Cod spatial dynamics and vertical movements in European waters and implications for fishery management” (CODYSSEY) (contract code Q5RS-2002-00813) and by BalticSea2020 (http://balticsea2020.org) under the project “Tagging Baltic Cod” (TABACOD). AMS received salary support from a UK Research and Innovation Future Leaders Fellowship [MR/V023578/1]. This study also contributes to project “Shifting the Hypoxia Paradigm -New Directions to Explore the Spread and Impacts of Ocean/Great Lakes Deoxygenation” [NSF grant NSF-OCE-1923965].
Acknowledgments
We thank Kate McQueen, Institute of Marine Research, Norway, for participating in the tagging of cod and programming of DSTs in the TABACOD project. We also thank the CODYSSEY consortium for making samples and data available for this study.
Conflict of interest
The authors declare that the research was conducted in the absence of any commercial or financial relationships that could be construed as a potential conflict of interest.
Publisher’s note
All claims expressed in this article are solely those of the authors and do not necessarily represent those of their affiliated organizations, or those of the publisher, the editors and the reviewers. Any product that may be evaluated in this article, or claim that may be made by its manufacturer, is not guaranteed or endorsed by the publisher.
Supplementary material
The Supplementary Material for this article can be found online at: https://www.frontiersin.org/articles/10.3389/fmars.2024.1365023/full#supplementary-material
References
Albertsen C. M., Hüssy K., Serre S. H., Hemmer-Hansen J., Thomsen T. B. (2021). Estimating migration patterns of fish from otolith chemical composition time series. Can. J. Fisheries Aquat. Sci. 78, 1512–1523. doi: 10.1139/cjfas-2020-0356
Altenritter M. E., Cohuo A., Walther B. D. (2018). Proportions of demersal fish exposed to sublethal hypoxia revealed by otolith chemistry. Mar. Ecol. Prog. Ser. 589, 193–208. doi: 10.3354/meps12469
Altenritter M. E., Walther B. D. (2019). The legacy of hypoxia: tracking carryover effects of low oxygen exposure in a demersal fish using geochemical tracers. Trans. Am. Fisheries Soc. 148, 569–583. doi: 10.1002/tafs.10159
Andersson P. S., Wasserburg G. J., Ingri J. (1992). The sources and transport of Sr and Nd isotopes in the Baltic Sea. Earth Planet. Sci. Lett. 113, 459–472. doi: 10.1016/0012-821X(92)90124-E.
Andersson P. S., Wasserburg G. J., Ingri J., Stordal M. C. (1994). Strontium dissolved and particulate loads in fresh and brackish waters: the Baltic Sea and Mississippi Delta. Earth Planet. Sci. Lett. 124, 195–210. doi: 10.1016/0012-821X(94)00062-X.
Arai T., Ohji M., Hirata T. (2007). Trace metal deposition in teleost fish otolith as an environmental indicator. Water Air Soil pollut. 179, 255–263. doi: 10.1007/s11270-006-9229-4
Aro E. (1989). A review of fish migration patterns in the Baltic. Rapports Procès-Verbaux Des. Réunions du Conseil Int. pour l’Exploration la Mer 190, 72–96.
Avigliano E., Saez M. B., Rico R., Volpedo A. V., Avigliano E., Saez M. B., et al. (2015). Use of otolith strontium:calcium and zinc:calcium ratios as an indicator of the habitat of Percophis brasiliensis in the southwestern Atlantic Ocean. Neotrop. Ichthyol. 13, 187–194. doi: 10.1590/1982-0224-20130235
Baba K., Shimizu M., Mugiya Y., Yamada J. (1991). Otolith Matrix Proteins of Walley Pollock; Biochemical Properties and Immunohistochemical Localization in the Saccular Tissue. In Mechanisms and Phylogeny of Mineralization in Biological Systems. Eds. Suga S., Nakahara H. (Tokyo: Springer), 57–61. doi: 10.1007/978-4-431-68132-8.
Bates D., Mächler M., Bolker B., Walker S. (2015). Fitting linear mixed-effects models using lme4. J. Stat. Softw. 67, 1–48. doi: 10.18637/jss.v067.i01
Bath G. E., Thorrold S. R., Jones C. M., Campana S. E., McLaren J. W., Lam J. W. H. (2000). Strontium and barium uptake in aragonitic otoliths of marine fish. Geochim. Cosmochim. Acta 64, 1705–1714. doi: 10.1016/S0016-7037(99)00419-6.
Bleil M., Oeberst R., Urrutia P. (2009). Seasonal maturity development of Baltic cod in different spawning areas: importance of the Arkona Sea for the summer spawning stock. J. Appl. Ichthyol. 25, 10–17. doi: 10.1111/jai.2009.25.issue-1
Brown R. J., Severin K. P. (2009). Otolith chemistry analyses indicate that water Sr : Ca is the primary factor influencing otolith Sr : Ca for freshwater and diadromous fish but not for marine fish. Can. J. Fisheries Aquat. Sci. 66, 1790–1808. doi: 10.1139/F09-112
Burnham K. P., Anderson D. R. (2002). Model selection and multimodel inference: A practical information-theoretic approach. 2nd ed. (New York: Springer).
Campana S. E. (1999). Chemistry and composition of fish otoliths: Pathways, mechanisms and applications. Mar. Ecol. Prog. Ser. 188, 263–297. doi: 10.3354/meps188263.
Campana S. E., Thorrold S. R. (2001). Otoliths, increments, and elements: Keys to a comprehensive understanding of fish populations? Can. J. Fisheries Aquat. Sci. 58, 30–38. doi: 10.1139/f00-177.
Carlson A. K., Phelps Q. E., Graeb B. D. S. (2017). Chemistry to conservation: Using otoliths to advance recreational and commercial fisheries management. J. Fish Biol. 90, 505–527. doi: 10.1111/jfb.13155
Carstensen J., Andersen J. H., Gustafsson B. G., Conley D. J. (2014). Deoxygenation of the Baltic Sea during the last century. Proc. Natl. Acad. Sci. U. States America 111, 5628–5633. doi: 10.1073/pnas.1323156111.
Carstensen J., Conley D. J. (2019). Baltic sea hypoxia takes many shapes and sizes. Limnol. Oceanogr. Bull. 28, 125–129. doi: 10.1002/lob.10350
Clark T. C., Horstmann L., Misarti N. (2020). Zinc concentrations in teeth of female walruses reflect the onset of reproductive maturity. Conserv. Physiol. 8, coaa029. doi: 10.1093/conphys/coaa029
Clarke L. M., Friedland K. D. (2004). Influence of growth and temperature on strontium deposition in the otoliths of Atlantic salmon. J. Fish Biol. 65, 744–759. doi: 10.1111/j.0022-1112.2004.00480.x.
Coffey M., Dehairs F., Collette O., Luther G., Church T., Jickells T. (1997). The behaviour of dissolved barium in estuaries. Estuar. Coast. Shelf Sci. 45, 113–121. doi: 10.1006/ecss.1996.0157.
Conley D. J., Björck S., Bonsdorff E., Carstensen J., Destouni G., Gustafsson B. G., et al. (2009). Hypoxia-related processes in the Baltic Sea. Environ. Sci. Technol. 43, 3412-3420. doi: 10.1021/es802762a
Conley D. J., Carstensen J., Aigars J., Axe P., Bonsdorff E., Eremina T., et al. (2011). Hypoxia is increasing in the coastal zone of the Baltic Sea. Environ. Sci. Technol. 45, 6777–6783. doi: 10.1021/es201212r
Conley D. J., Humborg C., Rahm L., Savchuk O. P., Wulff F. (2002). Hypoxia in the Baltic Sea and basin-scale changes in phosphorus biogeochemistry. Environ. Sci. Technol. 36, 5315–5320. doi: 10.1021/es025763w.
Cox P. (1989). The elements. Their origin, abundance, and distribution (Oxford, UK: Oxford University Press), 207 pp.
Darnaude A., Hunter E. (2018). Validation of otolith δ18O values as effective natural tags for shelf-scale geolocation of migrating fish. Mar. Ecol. Prog. Ser. 598, 167–185. doi: 10.3354/meps12302.
Darnaude A. M., Sturrock A., Trueman C. N., Mouillot D., EIM, Campana S. E., Hunter E. (2014). Listening in on the past: what can Otolith δ18O values really tell us about the environmental history of fishes? PloS One 9, e108539. doi: 10.1371/journal.pone.0108539.
De Vries M. C., Gillanders B. M., Elsdon T. S. (2005). Facilitation of barium uptake into fish otoliths: Influence of strontium concentration and salinity. Geochim. Cosmochim. Acta 69, 4061–4072. doi: 10.1016/j.gca.2005.03.052.
Dorval E., Jones C. M., Hannigan R., Montfrans J. (2007). Relating otolith chemistry to surface water chemistry in a coastal plain estuary. Can. J. Fisheries Aquat. Sci. 64, 411–424. doi: 10.1139/f07-015.
Doubleday Z. A., Harris H. H., Izzo C., Gillanders B. M. (2014). Strontium randomly substituting for calcium in fish otolith aragonite. Anal. Chem. 86, 865–869. doi: 10.1021/ac4034278.
Eero M., Hjelm J., Behrens J., Buchmann K., Cardinale M., Casini M., et al. (2015). Eastern Baltic cod in distress: Biological changes and challenges for stock assessment. ICES J. Mar. Sci. 72, 2180–2186. doi: 10.1093/icesjms/fsv109.
Elsdon T. S., Gillanders B. M. (2003). Relationship between water and otolith elemental concentrations in juvenile black bream Acanthopagrus butcheri. Mar. Ecol. Prog. Ser. 260, 263–272. doi: 10.3354/meps260263.
Elsdon T. S., Gillanders B. M. (2005). Alternative life-history patterns of estuarine fish: Barium in otoliths elucidates freshwater residency. Can. J. Fisheries Aquat. Sci. 62, 1143–1152. doi: 10.1139/f05-029
Elsdon T. S., Wells B. K., Campana S. E., Gillanders B. M., Jones C. M., Limburg K. E., et al. (2008). “Otolith chemistry to describe movements and life-history parameters of fishes: Hypotheses, assumptions, limitations and inferences,” in Oceanography and Marine Biology: An Annual Review. Eds. Gibson R. N., Atkinson R. J. A., Gordon J. D. M. (CRC Press, Boca Raton, London, New York), 297–330. doi: 10.1201/9781420065756-9
Fablet R., Pecquerie L., de Pontual H., Høie H., Millner R., Mosegaard H., et al. (2011). Shedding light on fish otolith biomineralization using a bioenergetic approach. PloS One 6, e27055. doi: 10.1371/journal.pone.0027055.
Fletcher P. E., Fletcher G. L. (1980). Zinc- and copper-binding proteins in the plasma of winter flounder (Pseudopleuronectes americanus). Can. J. Zool. 58, 609–613. doi: 10.1139/z80-086.
Fletcher G. L., Watts E. G., King M. J. (1975). Copper, zinc, and total protein levels in the plasma of sockeye salmon (Oncorhynchus nerka) during their spawning migration. J. Fisheries Res. Board Canada 32, 78–82. doi: 10.1139/f75-012.
Fordham S. E., Trippel E. A. (1999). Feeding behaviour of cod (Gadus morhua) in relation to spawning. J. Appl. Ichthyol. 15, 1–9. doi: 10.1046/j.1439-0426.1999.00098.x.
Fowler A. J., Gillanders B. M., Hall K. C. (2005). Relationship between elemental concentration and age from otoliths of adult snapper (Pagrus auratus, Sparidae): Implications for movement and stock structure. Mar. Freshw. Res. 56, 661–676. doi: 10.1071/MF04157.
Fox J., Weisberg S. (2019). An R Companion to Applied Regression. 3rd ed. (Thousand Oaks CA: Sage). Available at: https://socialsciences.mcmaster.ca/jfox/Books/Companion/.
Gillanders B. M. (2005). Otolith chemistry to determine movements of diadromous and freshwater fish. Aquat. Living Resour. 18, 291–300. doi: 10.1051/alr:2005033.
Grammer G. L., Morrongiello J. R., Izzo C., Hawthorne P. J., Middleton J. F., Gillanders B. M. (2017). Coupling biogeochemical tracers with fish growth reveals physiological and environmental controls on otolith chemistry. Ecol. Monogr. 87, 487–507. doi: 10.1002/ecm.1264.
Granzotto A., Franceschini G., Malavasi S., Molin G., Pranovi F., Torricelli P. (2003). Marginal increment analysis and Sr/Ca ratio in otoliths of the grass goby, Zosterisessor ophiocephalus. Ital. J. Zool. 70, 5–11. doi: 10.1080/11250000309356489.
Halden N. M., Mejia S. R., Babaluk J. A., Reist J. D., Kristofferson A. H., Campbell J. L., et al. (2000). Oscillatory zinc distribution in Arctic char (Salvelinus alpinus) otoliths: The result of biology or environment? Fisheries Res. 46, 289–298.
Hamer P. A., Jenkins G. P., Coutin P. (2006). Barium variation in Pagrus auratus (Sparidae) otoliths: A potential indicator of migration between an embayment and ocean waters in south-eastern Australia. Estuar. Coast. Shelf Sci. 68, 686–702. doi: 10.1016/j.ecss.2006.03.017.
Hansson M., Viktorsson L., Andersson L. (2019). Oxygen survey in the Baltic Sea 2019 - Extent of Anoxia and Hypoxia 1960-2019. SMHI Report Oceanography (Göteborg, Sweden) 67, 88 pp.
Heidemann F., Marohn L., Hinrichsen H. H., Huwer B., Hüssy K., Klügel A., et al. (2012). Suitability of otolith microchemistry for stock separation of Baltic cod. Mar. Ecol. Prog. Ser. 465, 217–226. doi: 10.3354/meps09922.
Heimbrand Y., Limburg K. E., Hüssy K., Casini M., Sjöberg R., Palmén Bratt A., et al. (2020). Seeking the true time: exploring otolith chemistry as an age-determination tool. J. Fish Biol 97, 552-565. doi: 10.1111/jfb.14422
Helcom (2009). Eutrophication in the Baltic Sea An integrated thematic assessment of the effects of nutrient enrichment in the Baltic Sea region. Baltic Sea Environmental Proceedings (Helsinki Commission) No 115B, 152 pp.
Hemmer-Hansen J., Hüssy K., Baktoft H., Huwer B., Bekkevold D., Haslob H., et al. (2019). Genetic analyses reveal complex dynamics within a marine fish management area. Evol. Appl. 12, 830–844. doi: 10.1111/eva.12760
Hicks A. S., Closs G. P., Swearer S. E. (2010). Otolith microchemistry of two amphidromous galaxiids across an experimental salinity gradient: A multi-element approach for tracking diadromous migrations. J. Exp. Mar. Biol. Ecol. 394, 86–97. doi: 10.1016/j.jembe.2010.07.018.
Hughes J. M., Stewart J., Gillanders B. M., Collins D., Suthers I. M. (2016). Relationship between otolith chemistry and age in a widespread pelagic teleost Arripis trutta: influence of adult movements on stock structure and implications for management. Mar. Freshw. Res. 67, 224–237. doi: 10.1071/MF14247.
Hüssy K. (2010). Why is age determination of Baltic cod (Gadus morhua) so difficult? ICES J. Mar. Sci. 67, 1198–1205. doi: 10.1093/icesjms/fsq023
Hüssy K., Albertsen C. M., Hemmer-Hansen J., Vinther M., Serre S. H., Thomsen T. B., et al. (2021b). Where do you come from, where do you go: Early life stage drift and migrations of cod inferred from otolith microchemistry and genetic population assignment. Can. J. Fisheries Aquat. Sci. 79, 300–313. doi: 10.1139/cjfas-2020-0409
Hüssy K., Casini M., Haase S., Hilvarsson A., Horbowy J., Krüger-Johnsen M., et al. (2020a). Tagging Baltic Cod – TABACOD. Eastern Baltic cod: Solving the ageing and stock assessment problems with combined state-of-the-art tagging methods. DTU Aqua Report no.: 368-2020 (Lyngby, Denmark: National Institute of Aquatic Resources, Technical University of Denmark), 94 pp. Available at: https://www.aqua.dtu.dk/-/media/Institutter/Aqua/Publikationer/Rapporter-352-400/368-2020-TABACOD-Final-Report.ashx?la=da&hash=FC37F4B5145973B6C17AB4D0E0EB3FC858FFD5F2.
Hüssy K., Hinrichsen H.-H., Eero M., Mosegaard H., Hemmer-Hansen J., Lehmann A., et al. (2016a). Spatio-temporal trends in stock mixing of eastern and western Baltic cod in the Arkona Basin and the implications for recruitment. ICES J. Mar. Sci. 73, 293-303. doi: 10.1093/icesjms/fsv227.
Hüssy K., Krüger-Johnsen M., Thomsen T. B., Heredia B. D., Næraa T., Limburg K. E., et al. (2021a). It’s elemental, my dear Watson: Validating seasonal patterns in otolith chemical chronologies. Can. J. Fisheries Aquat. Sci. 78, 551–566. doi: 10.1139/cjfas-2020-0388
Hüssy K., Limburg K. E., de Pontual H., Thomas O. R. B., Cook P. K., Heimbrand Y., et al. (2020b). Trace element patterns in otoliths: the role of biomineralization. Rev. Fisheries Sci. Aquac. 29, 445–477. doi: 10.1080/23308249.2020.1760204
Hüssy K., Mosegaard H., Jessen F. (2004). Effect of age and temperature on amino acid composition and the content of different protein types of juvenile Atlantic cod (Gadus morhua) otoliths. Can. J. Fisheries Aquat. Sci. 61, 1012–1020. doi: 10.1139/f04-037
Hüssy K., Nielsen B., Mosegaard H., Clausen L. (2009). Using data storage tags to link otolith macrostructure in Baltic cod (Gadus morhua) with environmental conditions. Mar. Ecol. Prog. Ser. 378, 161–170. doi: 10.3354/meps07876
Hüssy K., Radtke K., Plikshs M., Oeberst R., Baranova T., Krumme U., et al. (2016b). Challenging ICES age estimation protocols: lessons learned from the eastern Baltic cod stock. ICES J. Mar. Sci. 73, 2138–2149. doi: 10.1093/icesjms/fsw107.
ICES (2022). Baltic Fisheries Assessment Working Group (WGBFAS). ICES Scientific Reports, Vol. 4. 659 pp. doi: 10.17895/ices.pub.19793014
Izzo C., Doubleday Z. A., Gillanders B. M. (2016). Where do elements bind within the otoliths of fish? Mar. Freshw. Res. 67, 1072–1076. doi: 10.1071/MF15064.
Jessop B., Cairns D., Thibault I., Tzeng W. (2008). Life history of American eel Anguilla rostrata: new insights from otolith microchemistry. Aquat. Biol. 1, 205–216. doi: 10.3354/ab00018.
Kalish J. M. (1989). Otolith microchemistry: validation of the effects of physiology, age and environment on otolith composition. J. Exp. Mar. Biol. Ecol. 132, 151–178. doi: 10.1016/0022-0981(89)90126-3.
Kalish J. M. (1991). Determinants of otolith chemistry: seasonal variation in the composition of blood plasma, endolymph and otoliths of bearded rock cod Pseudophycis barbatus. Mar. Ecol. Prog. Ser. 74, 137–159. doi: 10.3354/meps074137.
Kõuts M., Maljutenko I., Elken J., Liu Y., Hansson M., Viktorsson L., et al. (2021). Recent regime of persistent hypoxia in the Baltic Sea. Environ. Res. Commun. 3, 075004. doi: 10.1088/2515-7620/ac0cc4
Kuznetsova A., Brockhoff P. B., Christensen R. H. B. (2017). lmerTest package: tests in linear mixed effects models. J. Stat. Softw. 82, 1–26. doi: 10.18637/jss.v082.i13
Lebrato M., Garbe-Schönberg D., Müller M. N., Blanco-Ameijeiras S., Feely R. A., Lorenzoni L., et al. (2020). Global variability in seawater Mg : Ca and Sr : Ca ratios in the modern ocean. Proc. Natl. Acad. Sci. U. States America 117, 22281–22292. doi: 10.1073/pnas.1918943117.
Lehmann A., Myrberg K., Post P., Chubarenko I., Dailidiene I., Hinrichsen H. H., et al. (2022). Salinity dynamics of the Baltic Sea. Earth Syst. Dyn. 13, 373–392. doi: 10.5194/esd-13-373-2022
Le Luherne E., Daverat F., Woillez M., Pécheyran C., de Pontual H. (2022). Coupling natural and electronic tags to explore spawning site fidelity and natal homing in northeast Atlantic European seabass. Estuar. Coast. Shelf Sci. 278, 108118. doi: 10.1016/j.ecss.2022.108118.
Limburg K. E., Elfman M. (2010). Patterns and magnitude of Zn : Ca in otoliths support the recent phylogenetic typology of Salmoniformes and their sister groups. Can. J. Fisheries Aquat. Sci. 67, 597–604. doi: 10.1139/F10-014.
Limburg K. E., Olson C., Walther Y., Dale D., Slomo C. P., Høie H. (2011). Tracking Baltic hypoxia and cod migration over millennia with natural tags. Proc. Natl. Acad. Sci. U.S.A. 108, E177–E182. doi: 10.1073/pnas.1100684108.
Limburg K. E., Wuenschel M. J., Hüssy K., Heimbrand Y., Samson M. (2018). Making the otolith magnesium chemical calendar-clock tick: plausible mechanism and empirical evidence. Rev. Fisheries Sci. Aquac. 26, 479–493. doi: 10.1080/23308249.2018.1458817
Lin S. H., Chang C. W., Iizuka Y., Tzeng W. N. (2007). Salinities, not diets, affect strontium/calcium ratios in otoliths of Anguilla japonica. J. Exp. Mar. Biol. Ecol. 341, 254–263. doi: 10.1016/j.jembe.2006.10.025.
MacKenzie B. R., Hinrichsen H. H., Plikshs M., Wieland K. (2000). Quantifying environmental heterogeneity: estimating the size for successful cod egg development in the Baltic Sea and its influence on recruitment. Mar. Ecol. Prog. Ser. 193, 143–156. doi: 10.3354/meps193143.
Maret W. (2017). Zinc in cellular regulation: the nature and significance of “zinc signals”. Int. J. Mol. Sci. 18, 2285. doi: 10.3390/ijms18112285.
Matthäus W., Franck H. (1992). Characteristics of major Baltic inflows - a statistical analysis. Continental Shelf Res. 12, 1375–1400. doi: pii/027843439290060W?via%3Dihub
Meier H. E. M., Feistel R., Piechura J., Arneborg L., Burchard H., Fiekas V., et al. (2006). Ventilation of the Baltic Sea deep water: a brief review of present knowledge from observations and models. Oceanologia 48, 133–164.
Miller J. A. (2011). Effects of water temperature and barium concentration on otolith composition along a salinity gradient: implications for migratory reconstructions. J. Exp. Mar. Biol. Ecol. 405, 42–52. doi: 10.1016/j.jembe.2011.05.017.
Miller M. B., Clough A. M., Batson J. N., Vachet R. W. (2006). Transition metal binding to cod otolith proteins. J. Exp. Mar. Biol. Ecol. 329, 135–143. doi: 10.1016/j.jembe.2005.08.016.
Milton D. A., Chenery S. R. (2001). Sources and uptake of trace metals in otoliths of juvenile barramundi (Lates calcarifer). J. Exp. Mar. Biol. Ecol. 264, 47–65. doi: 10.1016/S0022-0981(01)00301-X
Milton D. A., Tenakanai C. D., Chenery S. R. (2000). Can the movements of barramundi in the Fly River Region, Papua New Guinea be traced in their otoliths? Estuar. Coast. Shelf Sci. 50, 855–868. doi: 10.1006/ecss.2000.0608
Mohan J. A., Rulifson R. A., Corbett D. R., Halden N. M. (2012). Validation of oligohaline elemental otolith signatures of striped bass by use of in situ caging experiments and water chemistry. Mar. Coast. Fisheries 4, 57–70. doi: 10.1080/19425120.2012.656533.
Mohan J., Walther B. (2016). Out of breath and hungry: natural tags reveal trophic resilience of Atlantic croaker to hypoxia exposure. Mar. Ecol. Prog. Ser. 560, 207–221. doi: 10.3354/meps11934.
Møller J. S., Hansen I. S. (1994). Hydrographic processes and changes in the Baltic Sea. Dana 10, 87–104.
Morales-Nin B., Swan S. C., Gordon J. D. M., Palmer M., Geffen A. J., Shimmield T., et al. (2005). Age-related trends in otolith chemistry of Merluccius merluccius from the north-eastern Atlantic Ocean and the western Mediterranean Sea. Mar. Freshw. Res. 56, 599–607. doi: 10.1071/MF04151.
Naumann M., Gräwe U., Mohrholz V., Kuss J., Kanwischer M., Feistel S., et al. (2020). Hydrographic-hydrochemical assessment of the Baltic Sea 2019. Meereswissenschaftliche Berichte 114, 1-98. doi: 10.12754/msr-2020-0114
Neuenfeldt S., Andersen K. H., Hinrichsen H. (2009). Some Atlantic cod Gadus morhua in the Baltic Sea visit hypoxic water briefly but often. J. Fish Biol. 75, 290–294. doi: 10.1111/j.1095-8649.2009.02281.x.
Nielsen B., Hüssy K., Neuenfeldt S., Tomkiewicz J., Behrens J. W., Andersen K. H. (2013). Individual behaviour of Baltic cod Gadus morhua in relation to sex and reproductive state. Aquat. Biol. 18, 197–207. doi: 10.3354/ab00505.
Nissling A., Kryvi H., Vallin L. (1994). Variation in egg buoyancy of Baltic cod Gadus morhua and its implications for egg survival in prevailing conditions in the Baltic Sea. Mar. Ecol. Prog. Ser. 110, 67–74. doi: 10.3354/meps110067.
Oeberst R. (2008). Distribution patterns of cod and flounder in the Baltic Sea based on international coordinated trawl surveys. ICES CM, 2008/J:09.
Pachur M. E., Horbowy J. (2013). Food composition and prey selection of cod, Gadus morhua (actinopterygii: gadiformes: gadidae), in the southern Baltic Sea. Acta Ichthyologica Piscatoria 43, 109–118. doi: 10.3750/AIP2013.43.2.03
Paytan A., Griffith E. M. (2007). Marine barite: Recorder of variations in ocean export productivity. Deep Sea Res. Part II: Topical Stud. Oceanogr. 54, 687–705. doi: 10.1016/j.dsr2.2007.01.007
Pihl L., Ulmestrand M. (1993). Migration pattern of juvenile cod (Gadus morhua) on the Swedish west coast. ICES J. Mar. Sci. 50, 63–70. doi: 10.1006/jmsc.1993.1007.
Pilling G. M., Millner R. S., Easey M., Maxwell D., Tidd A. (2007). Phenology and North Sea cod Gadus morhua L.: has climate change affected otolith annulus formation and cod growth? J. Fish Biol. 70, 584–599. doi: 10.1111/j.1095-8649.2007.01331.x.
Ranaldi M. M., Gagnon M. M. (2008). Zinc incorporation in the otoliths of juvenile pink snapper (Pagrus auratus Forster): the influence of dietary versus waterborne sources. J. Exp. Mar. Biol. Ecol. 360, 56–62. doi: 10.1016/j.jembe.2008.03.013
Ranaldi M. M., Gagnon M. M. (2010). Trace metal incorporation in otoliths of pink snapper (Pagrus auratus) as an environmental monitor. Comp. Biochem. Physiol. Part C 152, 248–255. doi: 10.1016/j.cbpc.2010.04.012
R Core Team (2020). R: a language and environment for statistical computing (Vienna, Austria: R Foundation for Statistical Computing). Available at: http://www.r-project.org.
Reis-Santos P., Tanner S. E., Elsdon T. S., Cabral H. N., Gillanders B. M. (2013). Effects of temperature, salinity and water composition on otolith elemental incorporation of Dicentrarchus labrax. J. Exp. Mar. Biol. Ecol. 446, 245–252. doi: 10.1016/j.jembe.2013.05.027
Reis-Santos P., Gillanders B.M., Sturrock A.M., Izzo C., Oxman D.S., Lueders-Dumont J.A., et al (2022). Reading the biomineralized book of life: expanding otolith biogeochemical research and applications for fisheries and ecosystem-based management. Reviews in Fish Biology and Fisheries 33, 411–449. doi: 10.0007/s11160-022-09720-z
Riggio M., Filosa S., Parisi E., Scudiero R. (2003). Changes in zinc, copper and metallothionein contents during oocyte growth and early development of the teleost Danio rerio (zebrafish). Comp. Biochem. Physiol. C Toxicol. Pharmacol. 135, 191–196. doi: 10.1016/S1532-0456(03)00107-8
Righton D. A., Andersen K. H., Neat F., Thorsteinsson V., Steingrund P., Svedäng H., et al. (2010). Thermal niche of Atlantic cod Gadus morhua: Limits, tolerance and optima. Mar. Ecol. Prog. Ser. 420, 1–13. doi: 10.3354/meps08889.
Rohtla M., Daverat F., Arts M. T., Browman H. I., Parzanini C., Skiftesvik A. B., et al. (2022). Habitat use and growth of yellow-stage European eel in coastal and freshwater ecosystems in Norway. Can. J. Fisheries Aquat. Sci. 80, 14–26. doi: 10.1139/cjfas-2022-0033
Rolff C., Elmgren R., Voss M. (2008). Deposition of nitrogen and phosphorus on the Baltic Sea: seasonal patterns and nitrogen isotope composition. Biogeosciences 5, 1657–1667. doi: 10.5194/bg-5-1657-2008
Sasagawa T., Mugiya Y. (1996). Biochemical properties of water-soluble otolith proteins and the immunobiochemical detection of the proteins in serum and various tissues in the tilapia (Oreochromis niloticus). Fisheries Sci. 62, 970–976. doi: 10.2331/fishsci.62.970.
Schaber M., Hinrichsen H.-H., Gröger J. P. (2011). Seasonal changes in vertical distribution patterns of cod (Gadus morhua) in the Bornholm Basin, central Baltic Sea. Fisheries Oceanogr. 21, 33–43. doi: 10.1111/j.1365-2419.2011.00607.x
Schade F., Weist P., Krumme U. (2019). Evaluation of four stock discrimination methods to assign individuals from mixed-stock fisheries using genetically validated baseline samples. Mar. Ecol. Prog. Ser. 627, 125–139. doi: 10.3354/meps13061.
Schindelin J., Rueden C. T., Hiner M. C., Eliceiri K. W. (2015). The ImageJ ecosystem: An open platform for biomedical image analysis. Mol. Reprod. Dev. 82, 518–529. doi: 10.1002/mrd.22489.
Schielzeth H. (2010). Simple means to improve the interpretability of regression coefficients. Methods in Ecology and Evolution 1, 103–113. doi: 10.1111/j.2041-210X.2010.00012.x.
Schinke H., Matthäus W. (1998). On the causes of major Baltic inflows - an analysis of long time series. Continental Shelf Res. 18, 67–97. doi: 10.1016/S0278-4343(97)00071-X.
Secor D. H., Rooker J. R. (2000). Is otolith strontium a useful scalar of life cycles in estuarine fishes? Fisheries Res. 46, 359–371. doi: 10.1016/S0165-7836(00)00159-4
Seidel M., Manecki M., Herlemann D. P. R., Deutsch B., Schulz-Bull D., Jürgens K., et al. (2017). Composition and transformation of dissolved organic matter in the Baltic Sea. Front. Earth Sci. 5, 31. doi: 10.3389/feart.2017.00031.
Serre S. H., Hüssy K., Nielsen K. E., Fink-Jensen P., Thomsen T. B. (2018). Analysis of cod otolith microchemistry by continuous line transects using LA-ICP-MS. Geol. Survey Denmark Greenland Bull. 41, 91–94. doi: 10.34194/geusb.v41.4351.
Seyama H., Edmonds J. S., Moran M. J., Shibata Y., Soma M., Morita M. (1991). Periodicity in fish otolith Sr, Na, and K corresponds with visual banding. Experientia 47, 1193–1196. doi: 10.1007/BF01918383.
Siskey M. R., Lyubchich V., Liang D., Piccoli P. M., Secor D. H. (2016). Periodicity of strontium: Calcium across annuli further validates otolith-ageing for Atlantic bluefin tuna (Thunnus thynnus). Fisheries Res. 177, 13–17. doi: 10.1016/j.fishres.2016.01.004.
Slomp C. P., Malschaert J. F. P., Lohse L., Van Raaphorst W. (1997). Iron and manganese cycling in different sedimentary environments on the North Sea continental margin. Continental Shelf Res. 17, 1083–1117. doi: 10.1016/S0278-4343(97)00005-8.
Sparholt H., Aro E., Modin J. (1991). The spatial distribution of cod (Gadus morhua L.) in the Baltic Sea. Dana 9, 45–56.
Sturrock A. M., Hunter E., Milton J. A., Johnson R. C., Waring C. P., Trueman C. N., et al. (2015). Quantifying physiological influences on otolith microchemistry. Methods Ecol. Evol. 6, 806–816. doi: 10.1111/2041-210X.12381.
Sturrock A. M., Hunter E., Milton J. A., Trueman C. N. (2013). Analysis methods and reference concentrations of 12 minor and trace elements in fish blood plasma. J. Trace Elements Med. Biol. 27, 273–285. doi: 10.1016/j.jtemb.2013.03.001.
Sturrock A. M., Trueman C. N., Darnaude A. M., Hunter E. (2012). Can otolith elemental chemistry retrospectively track migrations in fully marine fishes? J. Fish Biol. 81, 766–795. doi: 10.1111/j.1095-8649.2012.03372.x.
Sturrock A., Trueman C., Milton J., Waring C., Cooper M., Hunter E. (2014). Physiological influences can outweigh environmental signals in otolith microchemistry research. Mar. Ecol. Prog. Ser. 500, 245–264. doi: 10.3354/meps10699
Sylva R. N. (1976). The environmental chemistry of copper (II) in aquatic systems. Water Res. 10, 789–792. doi: 10.1016/0043-1354(76)90097-X
Thomas O. R. B., Ganio K., Roberts B. R., Swearer S. E. (2017). Trace element–protein interactions in endolymph from the inner ear of fish: implications for environmental reconstructions using fish otolith chemistry. Metallomics 9, 239–249. doi: 10.1039/C6MT00189K
Thomas O. R. B., Swearer S. E. (2019). Otolith biochemistry—A review. Rev. Fisheries Sci. Aquac. 27, 458–489. doi: 10.1080/23308249.2019.1627285
Thomas O. R. B., Swearer S. E., Kapp E. A., Peng P., Tonkin-Hill G. Q., Papenfuss A., et al. (2019). The inner ear proteome of fish. FEBS J. 286, 66–81. doi: 10.1111/febs.14715
Thompson E. D., Mayer G. D., Glover C. N., Capo T., Walsh P. J., Hogstrand C. (2012). Zinc hyperaccumulation in squirrelfish (Holocentrus adscenscionis) and its role in embryo viability. PloS One 7, e46127. doi: 10.1371/journal.pone.0046127.
Thorrold S. R., Shuttleworth S. (2000). In situ analysis of trace elements and isotope ratios in fish otoliths using laser ablation sector field inductively coupled plasma mass spectrometry. Can. J. Fisheries Aquat. Sci. 57, 1232–1242. doi: 10.1139/f00-054.
Trouwborst R. E., Clement B. G., Tebo B. M., Glazer B. T., Luther G. W. (2006). Soluble Mn(III) in suboxic zones. Science 313, 1955–1957. doi: 10.1126/science.1132876
Vallin L., Nissling A. (2000). Maternal effects on egg size and egg buoyancy of Baltic cod, Gadus morhua Implications for stock structure effects on recruitment. Fisheries Res. 49, 21–37. doi: 10.1016/S0165-7836(00)00194-6.
van der Kooij J., Righton D., Strand E., Michalsen K., Thorsteinsson V., Svedäng H., et al. (2007). Life under pressure: insights from electronic data-storage tags into cod swimbladder function. ICES J. Mar. Sci. 64, 1293–1301. doi: 10.1093/icesjms/fsm119.
Viktorsson L. (2018) Hydrography and oxygen in the deep basins. Available online at: https://helcom.fi/wp-content/uploads/2020/07/BSEFS-Hydrography-and-oxygen-in-the-deep-basins-2017.pdf.
Viktorsson L., Ekeroth N., Nilsson M., Kononets M., Hall P. O. J. (2013). Phosphorus recycling in sediments of the central Baltic Sea. Biogeosciences 10, 3901–3916. doi: 10.5194/bg-10-3901-2013.
Walther B. D., Kingsford M. J., O’Callaghan M. D., McCulloch M. T. (2010). Interactive effects of ontogeny, food ration and temperature on elemental incorporation in otoliths of a coral reef fish. Environ. Biol. Fishes 89, 441–451. doi: 10.1007/s10641-010-9661-6.
Walther B. D., Limburg K. E. (2012). The use of otolith chemistry to characterize diadromous migrations. J. Fish Biol. 81, 796–825. doi: 10.1111/j.1095-8649.2012.03371.x.
Watabe N., Tanaka K., Yamada J., Dean J. M. (1982). Scanning electron microscope observations of the organtic matrix in the otolith of the teleost fish Fundulus heteroclitus (Linnaeus) and Tilapia nilotica (Linnaeus). J. Exp. Mar. Biol. Ecol. 58, 127–134. doi: 10.1016/0022-0981(82)90100-9.
Watanabe T., Kiron V., Satoh S. (1997). Trace minerals in fish nutrition. Aquaculture 151, 185–207. doi: 10.1016/S0044-8486(96)01503-7
Wieland K., Jarre-Teichmann A., Horbowa K. (2000). Changes in the timing of spawning of Baltic cod: possible causes and implications for recruitment. ICES J. Mar. Sci. 57, 452–464. doi: 10.1006/jmsc.1999.0522
Wojtas M., Wołcyrz M., Ożyhar A., Dobryszycki P. (2012). Phosphorylation of intrinsically disordered starmaker protein increases its ability to control the formation of calcium carbonate crystals. Crystal Growth Design 12, 158–168. doi: 10.1021/cg200905f.
Wulff F., Rahm L. (1988). Long-term, seasonal and spatial variations of nitrogen, phosphorus and silicate in the Baltic: An overview. Mar. Environ. Res. 26, 19–37. doi: 10.1016/0141-1136(88)90032-3.
Zuur A. F., Ieno E. N., Elphick C. S. (2010). A protocol for data exploration to avoid common statistical problems. Methods Ecol. Evol. 1, 3–14. doi: 10.1111/j.2041-210X.2009.00001.x.
Keywords: data storage tags, habitat, physiology, hypoxia, otolith chemistry, salinity
Citation: Hüssy K, Haase S, Mion M, Hilvarsson A, Radtke K, Thomsen TB, Krüger-Johnsen M, Casini M and Sturrock AM (2024) Into the wild: coupling otolith and archival tag records to test assumptions underpinning otolith chemistry applications in wild fish. Front. Mar. Sci. 11:1365023. doi: 10.3389/fmars.2024.1365023
Received: 03 January 2024; Accepted: 05 February 2024;
Published: 18 March 2024.
Edited by:
Josipa Ferri, University of Split, CroatiaReviewed by:
Felippe Alexandre Daros, São Paulo State University, BrazilJason Leppi, The Wilderness Society, United States
Serena Savoca, University of Messina, Italy
Copyright © 2024 Hüssy, Haase, Mion, Hilvarsson, Radtke, Thomsen, Krüger-Johnsen, Casini and Sturrock. This is an open-access article distributed under the terms of the Creative Commons Attribution License (CC BY). The use, distribution or reproduction in other forums is permitted, provided the original author(s) and the copyright owner(s) are credited and that the original publication in this journal is cited, in accordance with accepted academic practice. No use, distribution or reproduction is permitted which does not comply with these terms.
*Correspondence: Karin Hüssy, a2hAYXF1YS5kdHUuZGs=