 Rui Wang
 Jihua Liu
 Yongle Xu
 Li Liu1,2
 Kenneth Mopper
- 1Institute of Marine Science and Technology, Shandong University, Qingdao, China
- 2Qingdao Key Laboratory of Ocean Carbon Sequestration and Negative Emission Technology, Shandong University, Qingdao, China
- 3Department of Chemistry and Biochemistry, Old Dominion University, Norfolk, VA, United States
Cyanate is a nitrogen and energy source for diverse marine microorganisms, playing important roles in the nitrogen cycle. Despite the extensive research on cyanate utilization, the sources of this nitrogen compound remain largely enigmatic. To unravel the sources of cyanate, distributions and production of cyanate during photochemical degradation of natural dissolved organic matter (DOM) were investigated across various environments, including freshwater, estuarine, coastal areas in Florida, and the continental and slope regions of the North American mid-Atlantic Ocean (NATL). Cyanate production was also examined during the photochemical degradation of exudates from a typical strain of Synechococcus, an important phytoplankton component. To deepen our understanding of the sources and production mechanisms of cyanate, its production was assessed during the photochemical degradation of a natural seawater DOM supplemented with five nitrogen–containing compounds with distinguishing structures and functional groups. Generally, cyanate exhibited higher concentrations in the Florida coastal, estuarine, and freshwater environments than the NATL. However, cyanate distribution did not consistently align with its production rates. Despite significantly low concentrations in the NATL, DOM from this region exhibited cyanate production rates comparable to estuarine and Florida coastal environments. Although relatively high cyanate concentrations were observed in the freshwaters, DOM in this environment exhibited very low cyanate production rates. A highly significant correlation was observed between cyanate and chlorophyll a (Chl a) concentrations in these areas. Moreover, in most estuarine and NATL stations, cyanate concentration and production rate in the Chl a maximum layer were significantly higher than in other layers. Cyanate was produced during the photochemical degradation of the Synechococcus exudates. The cyanate production was significantly enhanced when the natural seawater DOM was supplemented with GlycylGlycine, 4-(methylamino) benzoic acid, 4-[ethyl(methyl)amino] benzaldehyde or methyl 2-aminobenzoate. Our study implies that photochemical degradation of marine DOM, especially phytoplankton-derived DOM, is a substantial source of cyanate in the ocean. Additionally, cyanate may form during the degradation of peptides and small aromatic compounds in DOM, providing novel insights into the nitrogen cycle.
1 Introduction
Nitrogen is an essential element for microorganisms, playing vital roles in marine biogeochemical cycles. Marine microbes utilize both inorganic and organic nitrogen compounds. The inorganic nitrogen compounds, such as nitrate and ammonium, serve as essential nutrients for primary producers (Bristow et al., 2017; Hutchins and Capone, 2022). Additionally, the organic nitrogen compounds, such as amino acids and urea, represent crucial alternative nitrogen sources for non-diazotrophic phytoplankton (Berman and Bronk, 2003; Zubkov et al., 2003; Bronk et al., 2007; Scanlan et al., 2009; Berthelot et al., 2019). However, most bioavailable organic nitrogen compounds in the ocean have not been fully characterized (Sipler and Bronk, 2015). Therefore, investigating the sources of new bioavailable nitrogen compounds is imperative for further understanding of the nitrogen cycle in the ocean.
Cyanate, a simple organic nitrogen compound, can be taken up by microbes through a substrate-specific ABC-type transporter (cynABD) and subsequently be decomposed into NH4+ and CO2 by cyanase (Kamennaya et al., 2008; Kamennaya and Post, 2011, 2013). Initially considered toxic to living organisms at high concentrations, cyanate can undergo detoxification within cells. For instance, cyanate in the cells of cyanobacteria, bacteria, fungi, and plants can be decomposed to NH4+ and CO2 by cyanase (Carepo et al., 2004; Elleuche and Pöggeler, 2008; Kebeish and Al-Zoubi, 2017). Cyanate also serves as an organic nitrogen source in both terrestrial and marine environments. It is recently found that cyanate serves as an active nitrogen or energy source for soil microbes (Mooshammer et al., 2021). The discovery of the cyanase gene in various marine microbes, particularly in the picocyanobacterial strains, such as Synechococcus sp. WH7803, WH7804, WH8102, Prochlorococcus sp. MED4, NATL1A, underscores the growing importance of cyanate in marine biogeochemistry and microbial ecology (Palenik et al., 2003; Rocap et al., 2003; Kamennaya et al., 2008; Kamennaya and Post, 2011). It has been revealed that many of the Synechococcus and Prochlorococcus strains can utilize cyanate as sole nitrogen source for growth (Palenik et al., 2003; Rocap et al., 2003; Kamennaya et al., 2008). A recent study reveals that Synechococcus dominates cyanase transcripts in the surface water of non-polar oceans (Mao et al., 2021). In nitrogen-limiting surface waters, Prochlorococcus and Synechococcus can utilize cyanate as an alternative nitrogen source (Ustick et al., 2021). Therefore, utilization of cyanate may significantly affect primary productivity in the ocean.
Adding to its emerging biogeochemical significance, cyanate also plays a substantial role in nitrification, where ammonia is oxidized to nitrate via nitrite in the ocean (Stein, 2015). Nitrososphaera gargensis, an ammonia-oxidizing Thaumarchaeota isolate, utilizes cyanate as the sole nitrogen source and reductant by converting it to ammonium and CO2 via cyanase. In the Gulf of Mexico, Thaumarchaeota utilizes cyanate as an energy and nitrogen source, even though no cyanase gene was identified in the genomic data of Thaumarchaeota in this environment (Kitzinger et al., 2019). Additionally, genes encoding cyanate cyanase/lyase have been identified in the genomes of several marine Nitrospinae and Nitrospirae, two important nitrite-oxidizing bacteria (Pachiadaki et al., 2017; Koch et al., 2019). A recent study reveals that cyanate is a significant nitrogen source for Nitrospinae in the Gulf of Mexico, fulfilling more than half of their nitrogen demand (Kitzinger et al., 2020). Nitrospira moscoviensis, a nitrite-oxidizing bacterium that encodes cyanase, can directly convert cyanate to ammonium and CO2, supplying cyanase-lacking ammonia bacterium, Nitrosomonas nitrosa, with ammonium as a source of energy and reductant (Palatinszky et al., 2015). Furthermore, cyanate supports anaerobic ammonium oxidation (anammox) in the oxygen-deficient zone (Babbin et al., 2017; Ganesh et al., 2018; Widner et al., 2018). Observations of cyanate uptake by microbial communities in the North Atlantic coastal waters (Widner et al., 2016a; Widner and Mulholland, 2017) and the Eastern Tropical South and North Pacific oxygen-deficient zone (Widner et al., 2018a, b) further highlight its ecological significance.
The quantitative significance of cyanate utilization in the marine environment depends on the flux and availability of cyanate. However, previous studies rarely examine the source of cyanate in the ocean, leaving it largely enigmatic. Although cyanate is identified as an intermediate product in carbamyl phosphate and urea degradation within cells, this pathway does not constitute the primary source of cyanate in the ocean (Qian et al., 1997; Purcarea et al., 2003). The recent development of a nanomolar cyanate detection method by Widner et al. has facilitated the measurement of cyanate concentrations in seawater (Widner et al., 2013). Cyanate concentrations range from a few to tens of nanomoles in the Chesapeake Bay Mouth (Widner et al., 2013), the coastal North Atlantic Ocean (Widner et al., 2016; Widner and Mulholland, 2017), and oxygen-deficient zone in the Eastern Tropical South and North Pacific Ocean (Widner et al., 2018a, b). Typically, it exhibits lower concentrations in the surface layer, with peak values occurring below the chlorophyll a (Chl a) maximum layer in the euphotic zone, displaying similar vertical distribution profiles to other reactive nitrogen compounds, such as urea, ammonium, and nitrite (Widner et al., 2016). Interestingly, areas with high Chl a concentration tend to exhibit higher cyanate concentrations (Widner and Mulholland, 2017). The distribution profiles of cyanate in the ocean strongly suggest that the origin of cyanate is highly correlated to the activity of phytoplankton, providing insights into a potential source.
In a recent study, cyanate production is observed during the decay of the natural microbial community assemblages collected during a dinoflagellate bloom (Zhu et al., 2023), which further indicates that cyanate is produced by phytoplankton or through the degradation of phytoplankton-derived organic matter. Furthermore, it has been found that cyanate concentrations increase linearly in the cultures of two marine diatoms during their late stationary phase (Widner et al., 2016). However, cyanate production became slow or stopped when the cultures were moved to darkness in the late stationary phase (Widner, 2016). The cessation of cyanate production in the diatom cultures under dark conditions suggests that light is an essential factor in cyanate production with cyanate possibly being produced through the photochemical degradation of diatom-derived organic matter in the cultures. Photosynthesis of phytoplankton is one of the primary sources of dissolved organic matter (DOM) in the euphotic zone of marine environment (Azam and Malfatti, 2007). Therefore, we hypothesize that the photochemical degradation process of marine DOM, especially phytoplankton-derived DOM, might be an important source of cyanate in the ocean. Due to the variations in composition and sources of DOM, the potential production of cyanate during the photochemical degradation of DOM may differ in different environments. This study examined the distribution of cyanate in the freshwaters, estuarine, coastal areas along Florida coastline and continental and slope regions of the North American mid-Atlantic Ocean (NATL), as well as the production of cyanate during the photochemical degradation of DOM collected from multiple depths in the euphotic zone of these environments.
In addition to eukaryotic algae, picocyanobacteria are also important primary producers in the ocean (Li, 1995; Scanlan, 2012; Flombaum et al., 2013). Whether cyanate can be produced from the DOM released by picocyanobacteria remains unknown. Therefore, to further explore the source of cyanate, the photochemical production of cyanate was also examined during photochemical degradation of DOM secreted by Synechococcus sp. CB0101 (SynCB0101–DOM), a typical picocyanobacterial strain widely distributed in estuarine and coastal environments (Marsan et al., 2014; Fucich et al., 2019). Photochemical experiments were also conducted with a natural seawater DOM that was supplemented with five nitrogen–containing compounds with different structures and functional groups to gain insights into possible photochemical precursors of cyanate. The overall goal of this study is to enhance our understanding of the role of cyanate in marine environments by investigating its distribution, sources, and production mechanisms in various environments.
2 Materials and methods
2.1 Cyanate and DOM sampling
Natural water samples of cyanate and DOM were collected from 13 stations across various environments (Figure 1), including freshwater, estuarine, coastal areas along the Florida coastline, and the continental and slope regions of the NATL. Pine Glades Lake and Nine Mile Pond were two freshwater stations in the Everglades National Park, Florida. Bay Mouth was an estuarine station situated in the Chesapeake Bay mouth. Naples Pier and Edward B. Knight Pier were coastal stations in the Gulf of Mexico and Key West, Florida, respectively. Light Tower, Station 14, Station 24, Station 36, Station 37, Station 11, Station 33, and Station 39 extended along the continental and slope regions of the NATL (34–37°N).
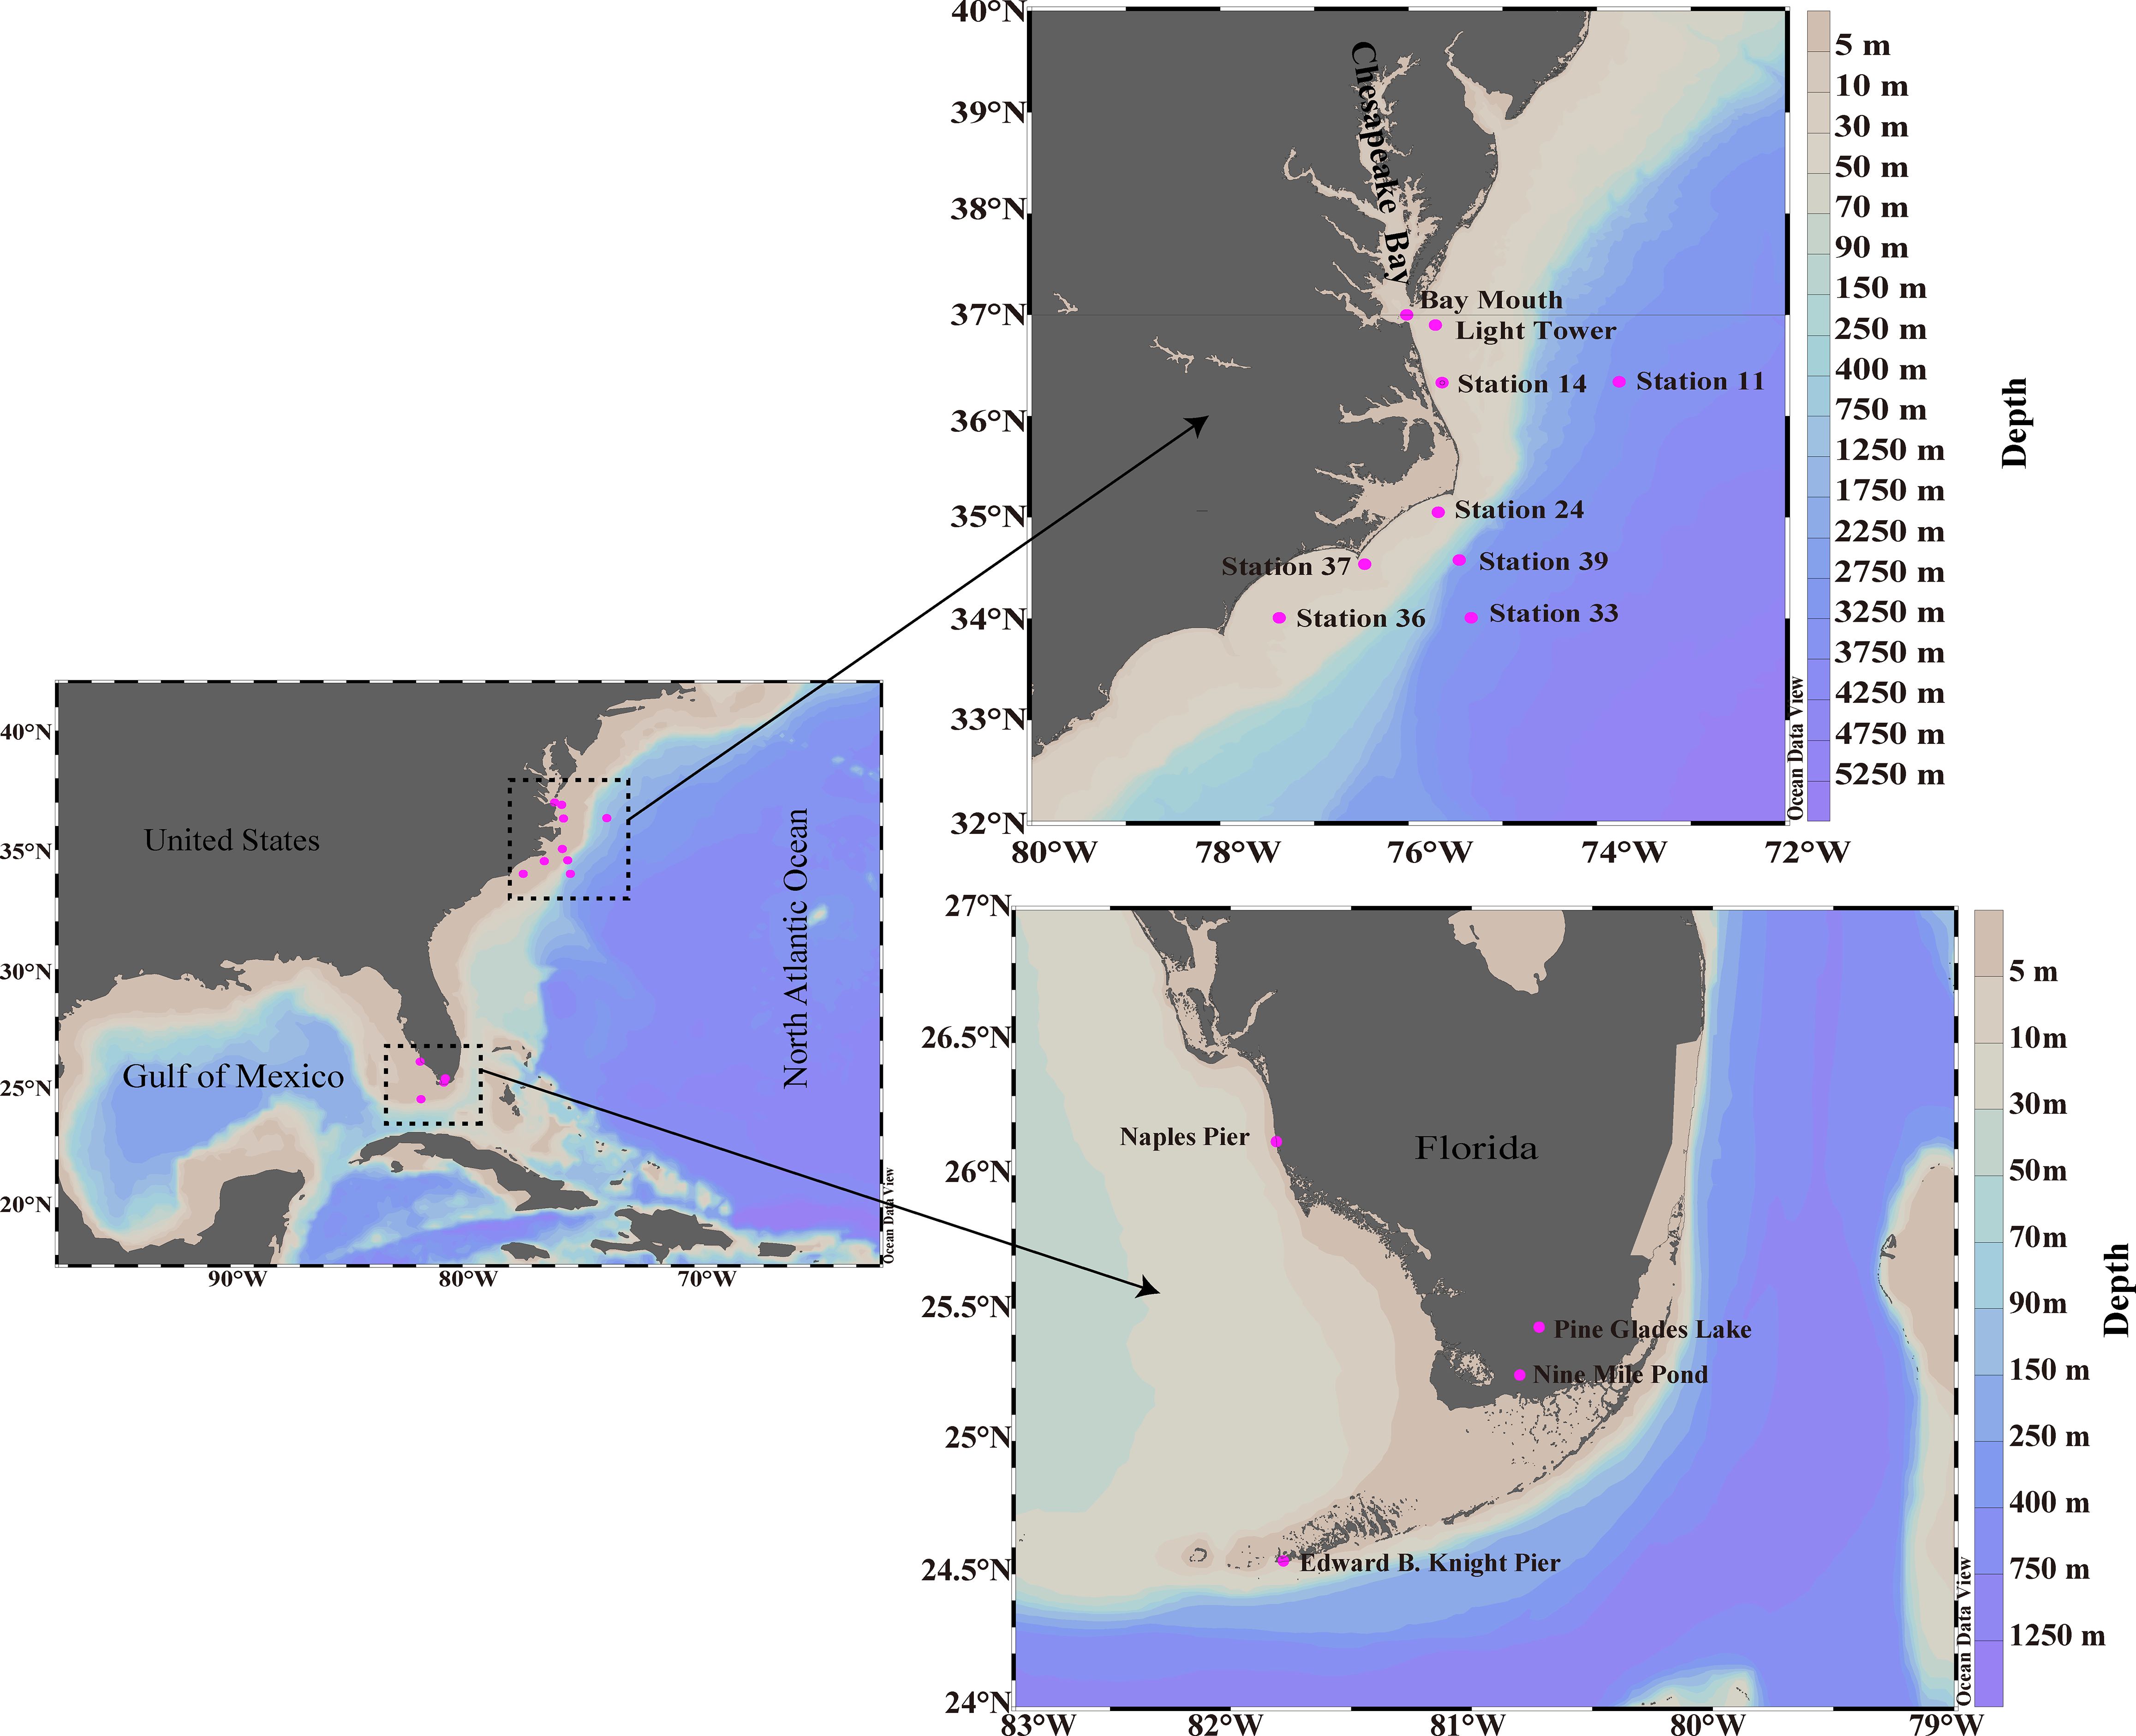
Figure 1 Cyanate and DOM sampling stations in the freshwater (Pine Glades Lake and Nine Mile Pond), Estuarine (Bay Mouth), coastal areas along the Florida coastline (Edward B. Knight Pier and Naples Pier), and the continental and slope areas of the NATL (Light Tower, Station 11, Station 14, Station 24, Station 33, Station 36, Station 37 and Station 39). See Supplementary material for additional information about the sampling in Table S1.
Only surface water samples were collected from the two freshwater stations and the two coastal stations in Florida. Water samples were taken using a polypropylene bucket in September 2018 at these sampling stations. The polypropylene bucket had been pre-cleaned and rinsed multiple times with sample water before collection. In addition to the surface layer samples, samples from beneath the surface layers were also collected in the Estuarine and the NATL stations. Water samples at Bay Mouth and Light Tower were collected aboard an R/V Slover cruise operated by Old Dominion University in May, 2016. Furthermore, samples from the continental and slope regions of the NATL were collected during the R/V Hugh R. Sharp cruise in August 2016. These samples were collected from Niskin bottles attached to a rosette equipped with a SeaBird Electronics 911plus Conductivity, Temperature and Depth sensor package. In-situ Chl a fluorescence in multiple layers of the stations in the continental and slope regions of the NATL was measured by a fluorometer (ECO-AFL/FL, WET Labs) mounted to the water sampler and converted to μg/L (Selden et al., 2021). Detailed information on the sampling stations and depths for cyanate and DOM is provided in Supplementary Table S1.
Upon collection, water samples were filtered through a 0.2 μm Supor Pall capsule filter using a peristaltic pump. Triplicate subsamples (~1.5 to 2 mL) were transferred from the filtrate and placed into polypropylene tubes to determine cyanate. The cyanate samples were stored at -80°C freezer until derivatization and subsequent analysis using high-performance liquid chromatography (HPLC). Additionally, around 4 L filtrate was transferred to pre-combusted (450 °C for 5 h) amber glass bottles as the DOM for the follow-up photochemical experiment described below. The DOM samples were stored in a 4 °C fridge before conducting the photochemical experiment within one week.
2.2 Photochemical degradation experiments on euphotic zone DOM in various environments
To investigate whether cyanate is produced during the photochemical degradation of DOM, photochemical experiments were conducted on the DOM samples collected from euphotic zones across various environments in a UV solar simulator, as described elsewhere (Minot et al., 2006; Helms et al., 2008; Widner et al., 2016). The solar simulator employs 12 Q-Panel UV340 bulbs as the light source, mimicking the spectral shape of natural sunlight within the 295–365 nm range (Minot et al., 2006; Helms et al., 2008). The reason for choosing UVA lamps as the light source is that the dominance of the solar spectrum within this range constitutes the primary wavelengths where photochemical degradation of DOM occurs.
Each DOM sample was divided into six round-bottom quartz flasks (500-mL each). Three flasks were wrapped in aluminum foil to serve as the dark control group, while the remaining three were designated as the light group. All flasks in the dark control and light groups were placed simultaneously in the simulator and irradiated for 8 hours at 20 ± 2 °C. The 8-hour irradiation period in this solar simulator corresponds to approximately 10.2 hours of mid-day inter-sunlight at 37°N (Minot et al., 2006; Helms et al., 2008; Widner et al., 2016).
Approximately 2 mL of samples were collected from each flask in the dark control and light group before and after irradiation and filled into polypropylene tubes to determine cyanate concentration. The production of cyanate in both the light and dark groups was calculated after the 8-hour photochemical experiment, respectively. The cyanate production rate was determined as the difference between the production rate in the light and dark control groups. To accommodate variations in concentration and composition of DOM across different environment, the cyanate production rates were normalized to the initial absorption coefficient of DOM at 300 nm. The absolute (non-normalized) cyanate production rates were also listed in Table S1.
2.3 Photochemical degradation experiments on DOM secreted by Synechococcus sp. CB0101
To further investigate the potential production of cyanate during the photochemical degradation of phytoplankton-derived DOM, cyanate concentrations were monitored during photochemical degradation of DOM secreted by a typical picocyanobacterial strain, Synechococcus sp. CB0101. The strain, belonging to Synechococcus sub-cluster 5.2, was isolated from the Baltimore Inner Harbor in Chesapeake Bay (Marsan et al., 2014; Fucich et al., 2019).
Synechococcus sp. CB0101 was cultured in SN medium with 15‰ salinity (SN15 medium) at 22°C under constant cool white light with an intensity of 20–30 μm E m-2 s-1 (Waterbury et al., 1986). To minimize the background DOM in the SN15 medium, aged seawater and Milli-Q water were mixed at a ratio of 1:1 (v/v) and used as the medium base. In addition, no EDTA and vitamin B12 were added to the SN15 medium. Initially, Synechococcus sp. CB0101 was pre-cultured in SN15 medium to mid-logarithmic growth phase in a small volume. Subsequently, the cells were collected by centrifugation at 6000 × g for 5 minutes and resuspended in SN15 medium. About 5% of the resuspended cells (v/v) were inoculated into SN15 medium for expanded culture of Synechococcus sp. CB0101. Samples for determining the cell abundance of Synechococcus sp. CB0101 were taken in triplicates daily. Briefly, 1.98 mL of the culture medium was transferred to a 2 mL tube, and 20 μL of 50% glutaraldehyde was added and thoroughly mixed. The sample was then fixed in the dark for 15 minutes, rapidly frozen in liquid nitrogen for approximately 15 minutes, and stored at -80°C freezer for subsequent analysis. The samples were measured immediately after sampling using a BD Accuri C6 Flow Cytometer (BD Bioscience, Franklin Lakes, NJ, USA). The growth curve of Synechococcus sp. CB0101 was plotted based on its cell abundance over the incubation period.
Upon reaching the mid-logarithmic growth phase, the culture medium of Synechococcus sp. CB0101 was filtered through a 0.22 μm polycarbonate membrane. The resulting filtrate was collected and stored in an amber glass bottle as SynCB0101–DOM. The DOM in the culture medium (Medium–DOM) was also collected immediately after inoculation using the same procedure as SynCB0101–DOM and served as control in the subsequent photochemical experiment. Both SynCB0101–DOM and Medium–DOM were stored in a refrigerator at 4°C before conducting the photochemical degradation experiment. All the glassware used in the experiment had been pre-combusted at 450°C for 4 hours in a muffle furnace to prevent potential organic matter contamination.
To conduct the photochemical experiment, both SynCB0101–DOM and Medium–DOM were brought from the refrigerator, warmed to room temperature, and gently inverted to mix. Subsequently, 50 mL of SynCB0101–DOM was transferred to each of 6 quartz tubes, with three designated as the light group and the remaining three wrapped in aluminum foil to serve as the dark group. The light and dark groups for Medium–DOM were prepared using the same procedure as for SynCB0101–DOM, serving as control. The 12 quartz tubes containing Medium–DOM and SynCB0101–DOM were placed simultaneously in the UV solar, as described in section 2.2. The photochemical degradation experiment was conducted for 8 hours at 20 ± 2 °C. Approximately 1.5 mL of sample was transferred from each quartz tube at 0 h, 2 h, 4 h, 6 h and 8 h to determine cyanate concentration.
2.4 Photochemical experiment on natural seawater DOM supplemented with different nitrogen–containing compounds
To further elucidate the source and mechanism underlying cyanate production, a photochemical experiment was conducted on a coastal seawater DOM sample supplemented with five different nitrogen–containing compounds. The coastal seawater DOM sample was collected from the surface seawater in a coastal area (75.085°W, 38.328°N) near Ocean City, Delaware, USA. Approximately 3.5 L in-situ seawater was collected using a polypropylene bucket, filled into an amber glass bottle, and kept in a cooler filled with several ice packs. The water sample was transported to the laboratory within 4 hours, and immediately filtered through a 0.22 μm polycarbonate membrane. The resulting filtrate was transferred to another amber glass bottle as the coastal seawater DOM sample. The amber glass bottles were combusted at 450°C for 5 h in a muffle furnace before use. Five nitrogen–containing compounds, namely N-Acetyl-D-glucosamine (Sigma A8625), GlycylGlycine (Sigma 1042330100), 4-(methylamino) benzoic acid (Sigma 119695), 4-[ethyl(methyl)amino] benzaldehyde (Sigma CDS023138), and methyl 2-aminobenzoate (Sigma 236454), each with distinct structures or functional groups, were selected as model compounds. Stock solutions of these compounds, each at a concentration of 100 mM, were prepared using Milli-Q water and stored at 4°C before use. The stock solutions were diluted to 100 μM as working solutions.
To conduct the photochemical degradation experiment, five nitrogen-containing compounds were supplemented to a coastal seawater sample, respectively, resulting in five amended groups. The coastal seawater sample was divided into 30 pre-combusted (450 °C for 5 h) quartz tubes, each receiving 40 mL. These tubes were further divided into five groups, each consisting of six tubes. Subsequently, each working solution of the five nitrogen–containing compounds was separately added to the six tubes in each group, with each tube receiving 10 mL, resulting in a final nitrogen-containing compound concentration of 20 μM. Additionally, another six quartz tubes were filtered with 50 mL of the coastal seawater sample, each without adding any nitrogen–containing compounds, serving as a control group. To account for the effects of darkness, three tubes in each amended and control group was wrapped in aluminum foil, serving as dark control. All quartz tubes in the amended and control groups were placed in the solar simulator, as mentioned in section 2.2. The samples were irradiated at 20 ± 2 °C for 8 hours. At 0 and 8 hours, subsamples were transferred from each tube in the amended and control groups into 2 mL tubes and stored at -80 °C for subsequent cyanate concentration analysis. Before the photochemical experiment, UV-visible absorption spectra (200–700 nm, at 1 nm intervals) of the DOM in the control and nitrogen–containing compound amended groups were measured using an Agilent 8543 diode array spectrophotometer with a 1 cm quartz cuvette. Milli-Q water was used as the blank. Absorbance values were converted to Napierian absorption coefficients using the following formula:
where “a” is Napierian absorption coefficient (m-1), “A” is absorbance, and “L” is path length (m) (Green and Blough, 1994; Helms et al., 2013).
2.5 Measurement of cyanate concentration
Cyanate concentration was measured by pre-column fluorescence derivatization using 2-aminobenzoic acid (ABA) (Sigma-Aldrich, ≥ 99.5% purity) as the derivatization reagent on a modular Shimadzu high-performance liquid chromatography (HPLC) system, with modifications according to Widner et al. (Widner et al., 2013; Widner and Mulholland, 2017). Potassium cyanate (KOCN, Sigma-Aldrich, 96%) was utilized to prepare standards at various concentrations. Both standards and samples were derivatized simultaneously using the same procedure. Briefly, 1.0 mL of either a water sample or a standard solution was initially reacted with 0.4 mL of 30 mM ABA to form the 2, 4-quinazolinedione derivative in a pre-combusted (450°C for 5 h) 4 mL amber borosilicate glass vial (Fisher Scientific) with a polypropylene cap (Sigma-Aldrich, PTFE/silicone septum). The derivatization reaction occurred in a 35°C water bath for 30 min. Immediately upon removal of the vials from the water bath, 1.4 mL of 12 N HCl (reagent grade) was added to each sample, resulting in a final concentration of 6 N HCl. Due to the strong acidity of the derived samples, there was potential for corrosion to HPLC metal components, adversely affecting column efficiency and longevity. Therefore, the pH of the derivatized standards and samples was adjusted to ~7 before injection. Usually, an equal number of 4 mL amber borosilicate glass vials were employed based on the number of standards and samples. Then, 900 μL of the derived samples and standards were added to each vial and mixed with 1 mL of 0.5 M boric acid buffer (pH = 9.5) and 540 μL of 10 N NaOH. About 1.5 mL of these mixtures were transferred to 2 mL HPLC autosampler vials after cooling to room temperature. Cyanate was then quantified on the HPLC equipped with a fluorescence detector (RF-10AXL), configured with excitation and emission wavelengths of 312 and 370 nm. The mobile phase comprised 60:40 5% trifluoroacetic acid (TFA)/100% methanol, and the flow rate was 0.1 mL/min. Both of the TFA and methanol were of HPLC grade and were purchased from Fisher Scientific. A poly (styrene-divinylbenzene) column with broad pH stability (Hamilton, PRP-1, 2.1 × 150 mm, 5 μm) was used. The sample injection volume was 100 μL, and the run time was 15 min. The method detection limit was 0.4 nmol L-1 (Widner et al., 2013). An independent sample t-test was used to analyze the differences in cyanate concentration and production rate between the Chl a maximum layers and other water depths at the same sampling station and the differences in cyanate production between the nitrogen-containing amended and control group using SPSS Statistics Software (IBM, Armonk, NY, USA).
3 Results
3.1 Distributions of cyanate in different environments
Cyanate concentrations in the surface water were measured in various aquatic environments. Stations located in the freshwater, estuarine, and coastal areas of Florida demonstrated higher cyanate concentrations compared to those in the continental and slope regions of the NATL (Figure 2). The cyanate concentrations in these stations ranged from 4.17–18.7 nmol L-1 (Figure 2). On average, the two coastal stations in Florida exhibited the highest concentrations, with 15.4 nmol L-1 at Naples Pier in the Gulf of Mexico and 18.7 nmol L-1 at Edward. Knight Pier in the Key West, Florida (Figure 2). Additionally, the Bay Mouth station in the Chesapeake Bay also exhibited a relatively high concentration of 12.5 nmol L-1 (Figure 2). In contrast to the higher concentrations observed in the stations in the estuarine and coastal areas in Florida, the two freshwater stations within the Everglades National Park displayed lower cyanate concentrations (Figure 2). Specifically, Pine Glades Lake displayed a concentration of 4.17 nmol L-1, while Nine Mile Pond exhibited a concentration of 9.36 nmol L-1 (Figure 2). Stations in the NATL generally exhibited lower cyanate concentrations, with most values remaining below 5 nmol L-1 (Figure 2).
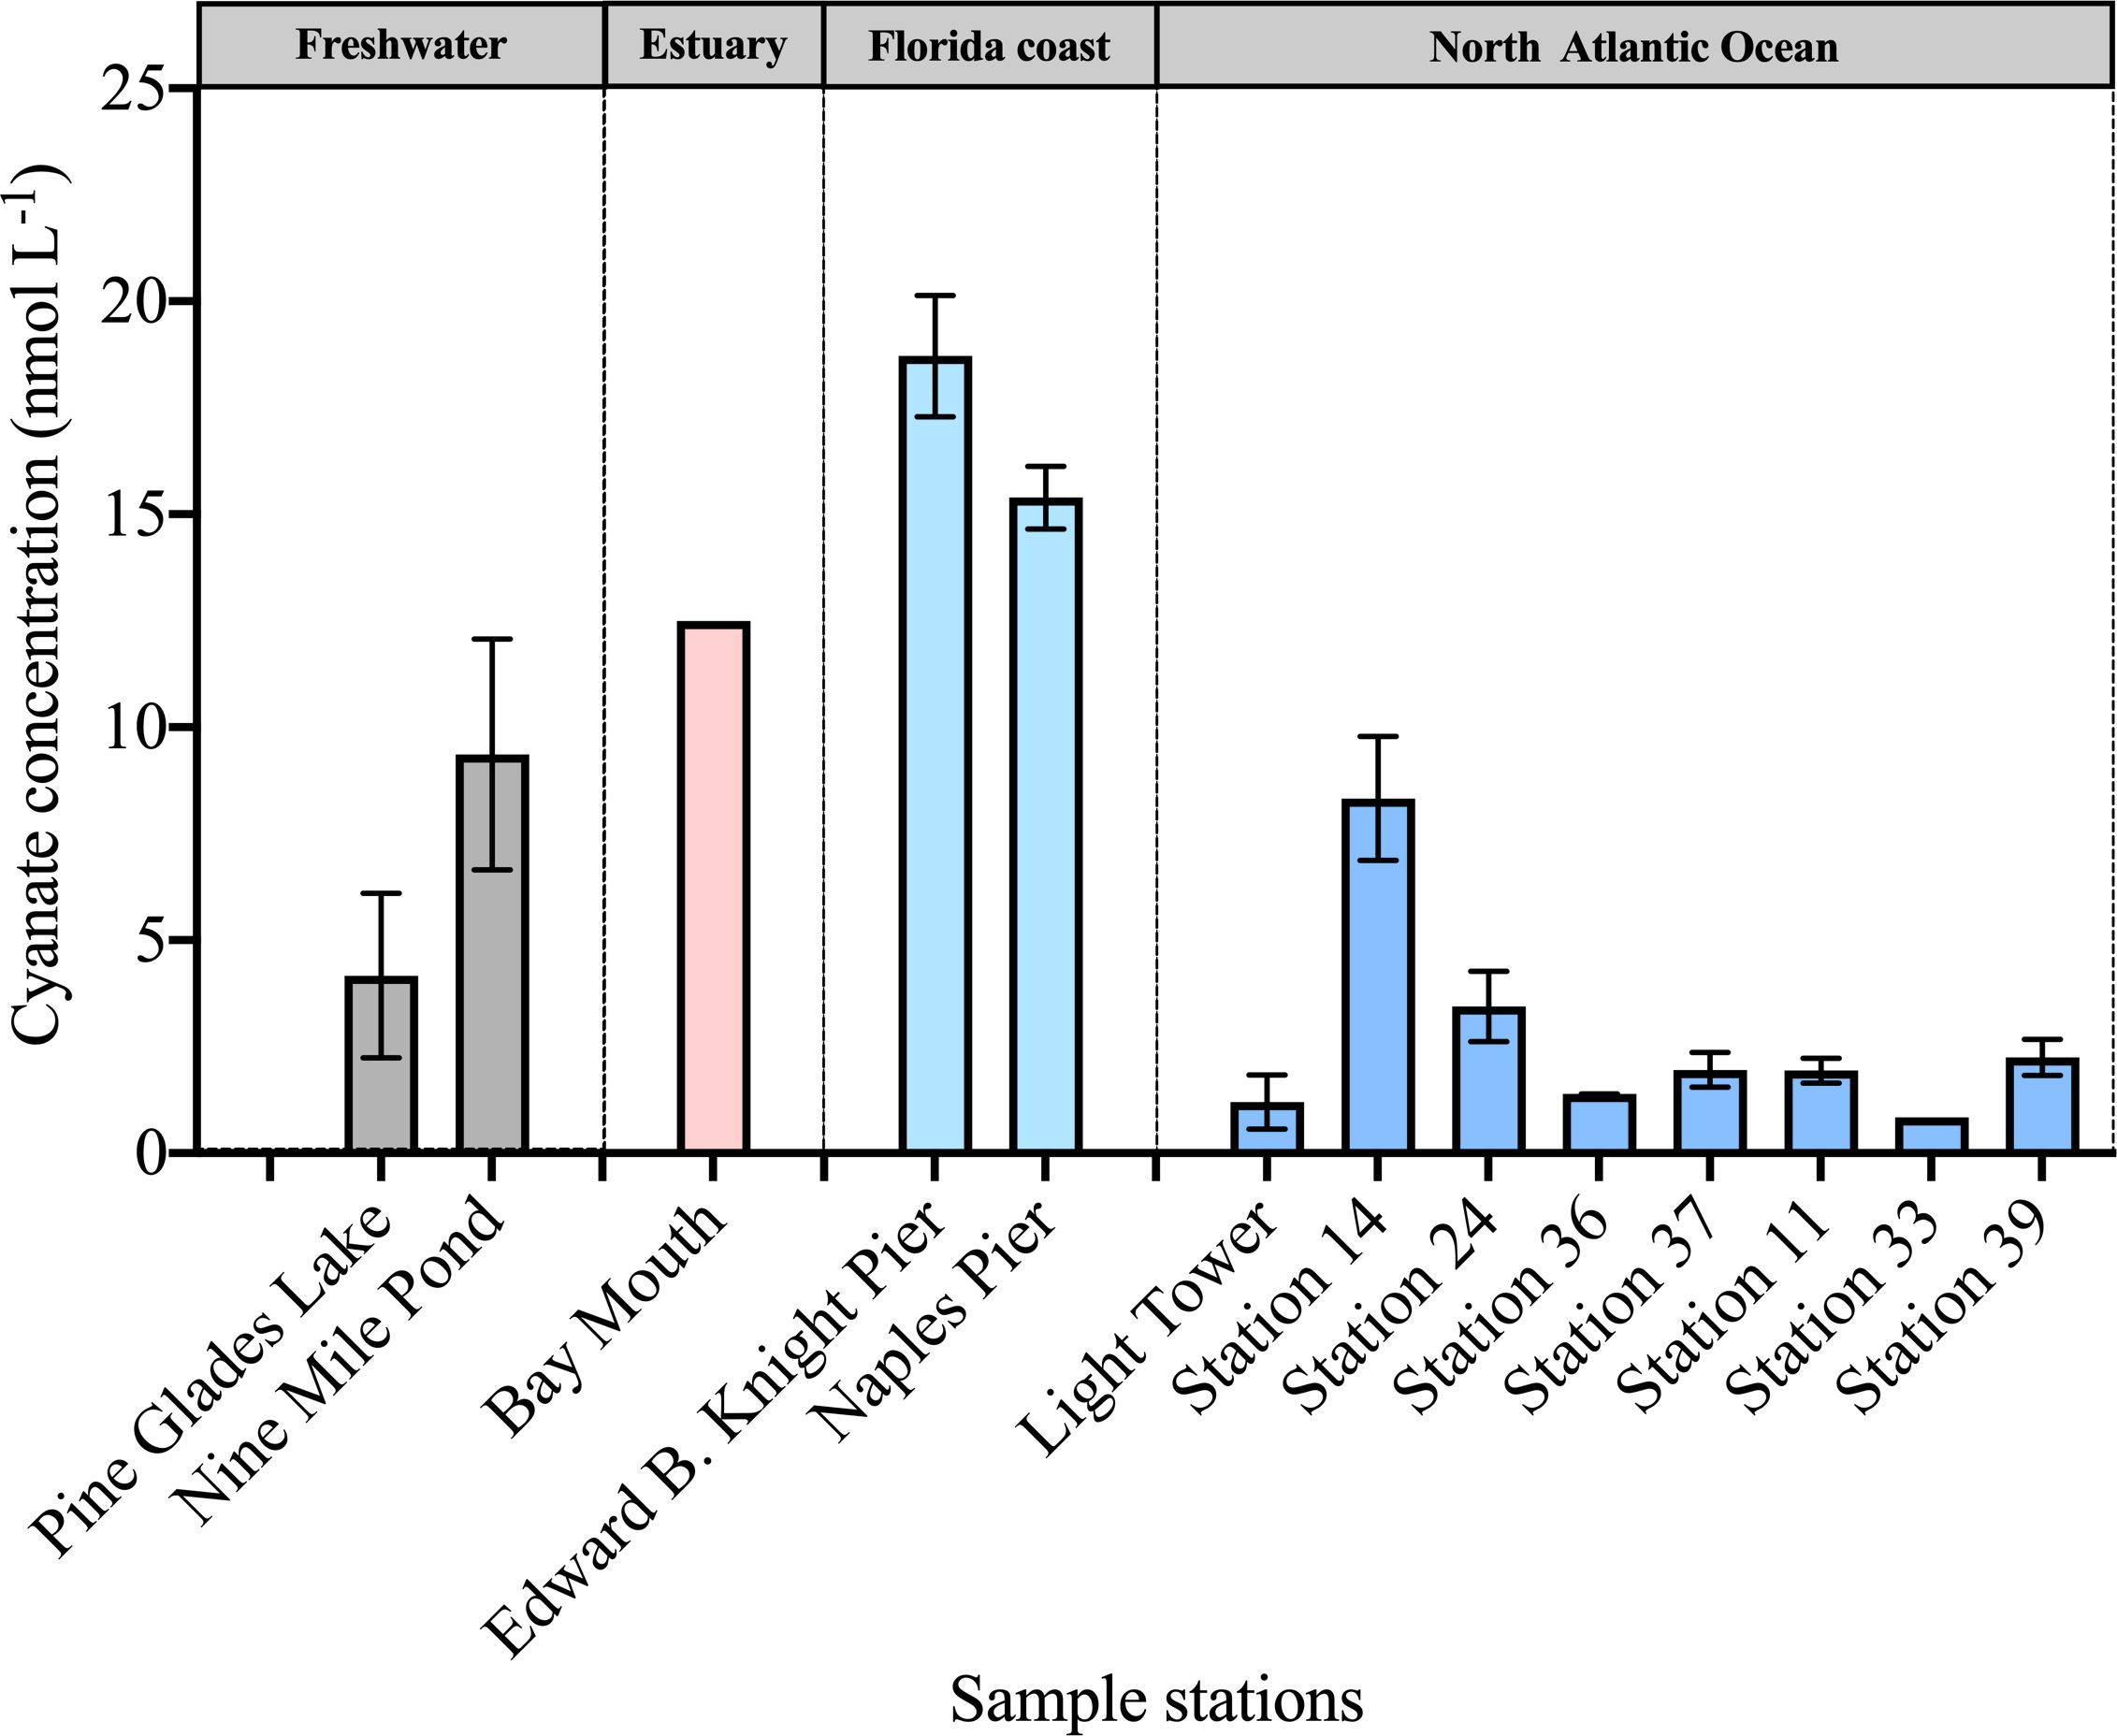
Figure 2 Cyanate concentrations in surface layers of sampling stations across diverse environments.
Cyanate concentrations were also measured in multiple water layers at stations in Chesapeake Bay and the continental and slope regions of the NATL. Across these stations and their associated water layers, cyanate concentrations ranged from 0.84–16.9 nmol L-1 (Figure 3). In most water layers, cyanate concentrations were below 5 nmol L-1 (Figure 3). Furthermore, a consistent pattern emerged across most stations, with lower cyanate concentrations in the surface layer than in other water layers within the same stations. These stations encompassed Bay Mouth, Light Tower, Station 36, Station 37, and Station 11 (Figure 3). Notably, within the five stations, cyanate concentrations in the Chl a maximum layer surpassed those in other water layers at the same stations. For instance, at Bay Mouth, cyanate concentration in the surface layer was 12.5 nmol L-1, was 16.9 nmol L-1 in the Chl a maximum layer of this station (Figure 3). Likewise, at the Light Tower station, cyanate concentration in the Chl a maximum layer (5.6 nmol L-1) was significantly (P< 0.05) higher than that in the surface layer (1.2 nmol L-1) (Figure 3). Although the surface layer cyanate concentration at station 11 was 1.94 nmol L-1, a significantly higher cyanate concentration was observed in the Chl a maximum layer (12.0 nmol L-1, P< 0.01) (Figure 3). Additionally, at depths of 244 m and 272 m in station 11, cyanate concentrations were 3.3 nmol L-1 and 6.0 nmol L-1, respectively (Figure 3). These concentrations were also significantly (P< 0.05) lower than that in the Chl a maximum layer but higher than that in the surface layer (Figure 3).
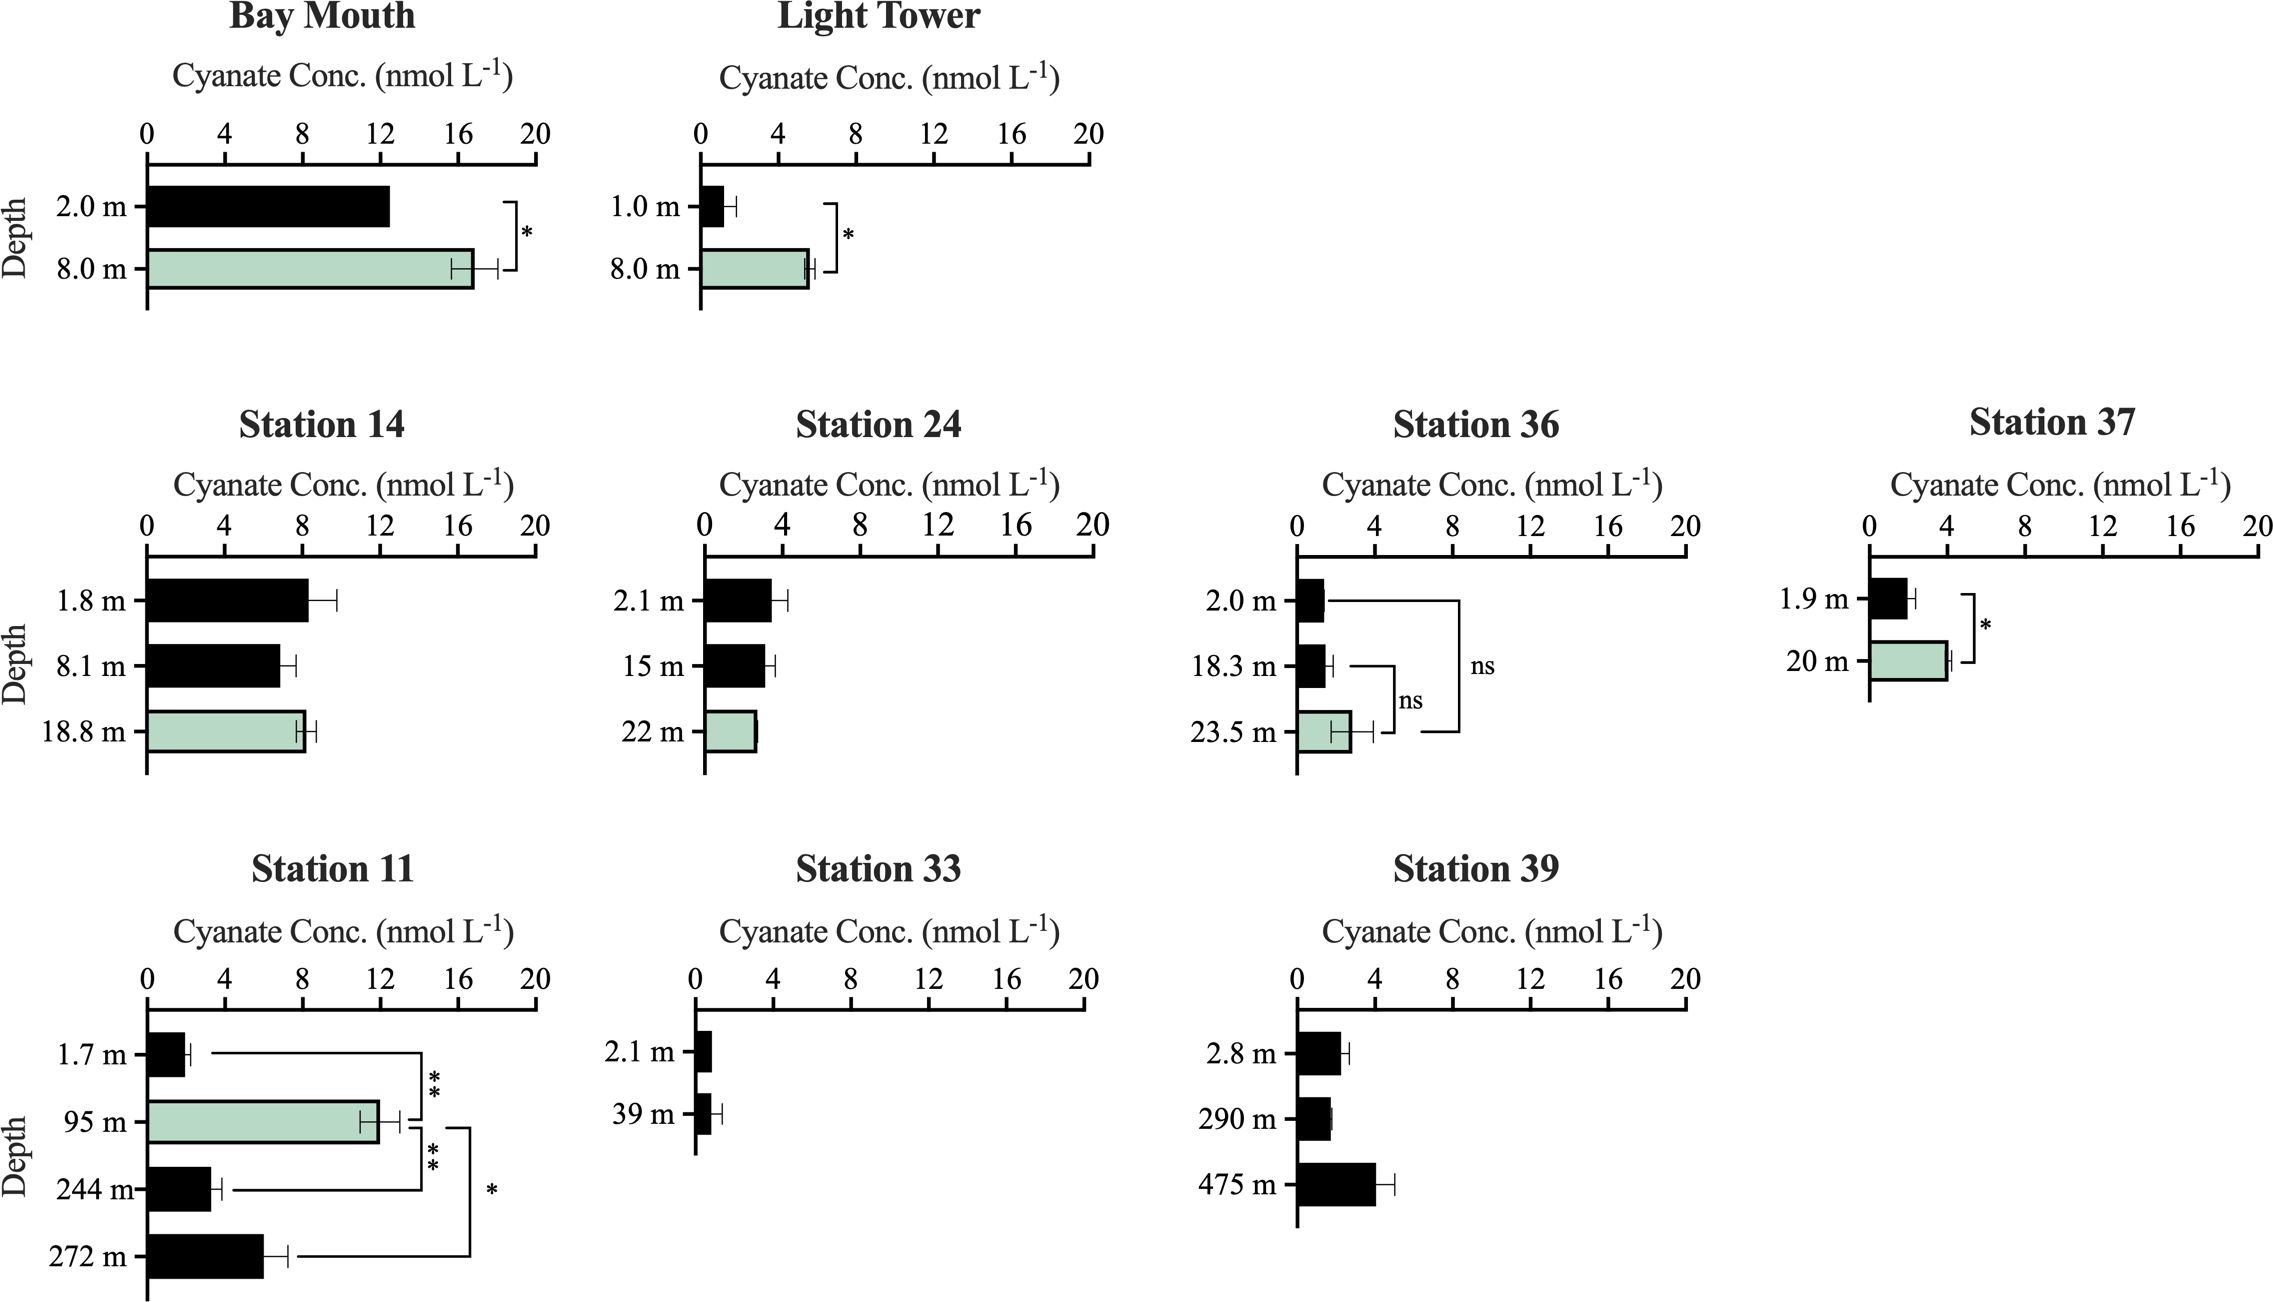
Figure 3 Cyanate concentrations at different water layers of stations in the Chesapeake Bay Mouth and the continental and slope regions of the NATL. The green columns specifically represent cyanate concentration in the Chl a maximum layer. No significant (“ns”), significant (*, P< 0.05), or highly significant (**, P< 0.01) differences in cyanate concentrations between the Chl a maximum layer and other layers at Bay Mouth, Light Tower, Station 36, Station 37, and Station 11 were indicated.
3.2 Photochemical production of cyanate from DOM in the euphotic zone across various environments
Photochemical experiments were conducted with DOM collected from various depths within the euphotic zone across diverse environments to investigate the production of cyanate during the photochemical degradation process of marine DOM, particularly the phytoplankton-derived DOM. Cyanate concentrations showed distinct distribution patterns between cyanate production rate and concentrations.
Cyanate production rates from DOM in surface waters across various environments ranged from 0.054–1.3 nM m h-1 (Figure 4). Among the DOM samples examined, a relatively high cyanate production rate (1.2 nM m h-1) was observed from DOM collected at the Bay Mouth station in Chesapeake Bay (Figure 4). Additionally, DOM collected from stations in the coastal areas in Florida and the continental and slope regions of the NATL exhibited average cyanate production rates of 0.56 nM m h-1 and 0.46 nM m h-1, respectively (Figure 4). Notably, despite the deficient cyanate concentration (0.84 nmol L-1) in the surface layer of station 33, a high cyanate production rate of 1.3 nM m h-1 from the collected DOM in this station was observed, suggesting efficient cyanate utilization in this area (Figures 3, 4). In contrast, DOM from the two freshwater stations in the Everglades National Park exhibited the lowest cyanate production rates, with Pine Glades Lake and Nine Mile Pond with rates of 0.054 nM m h-1 and 0.22 nM m h-1, respectively (Figure 4).
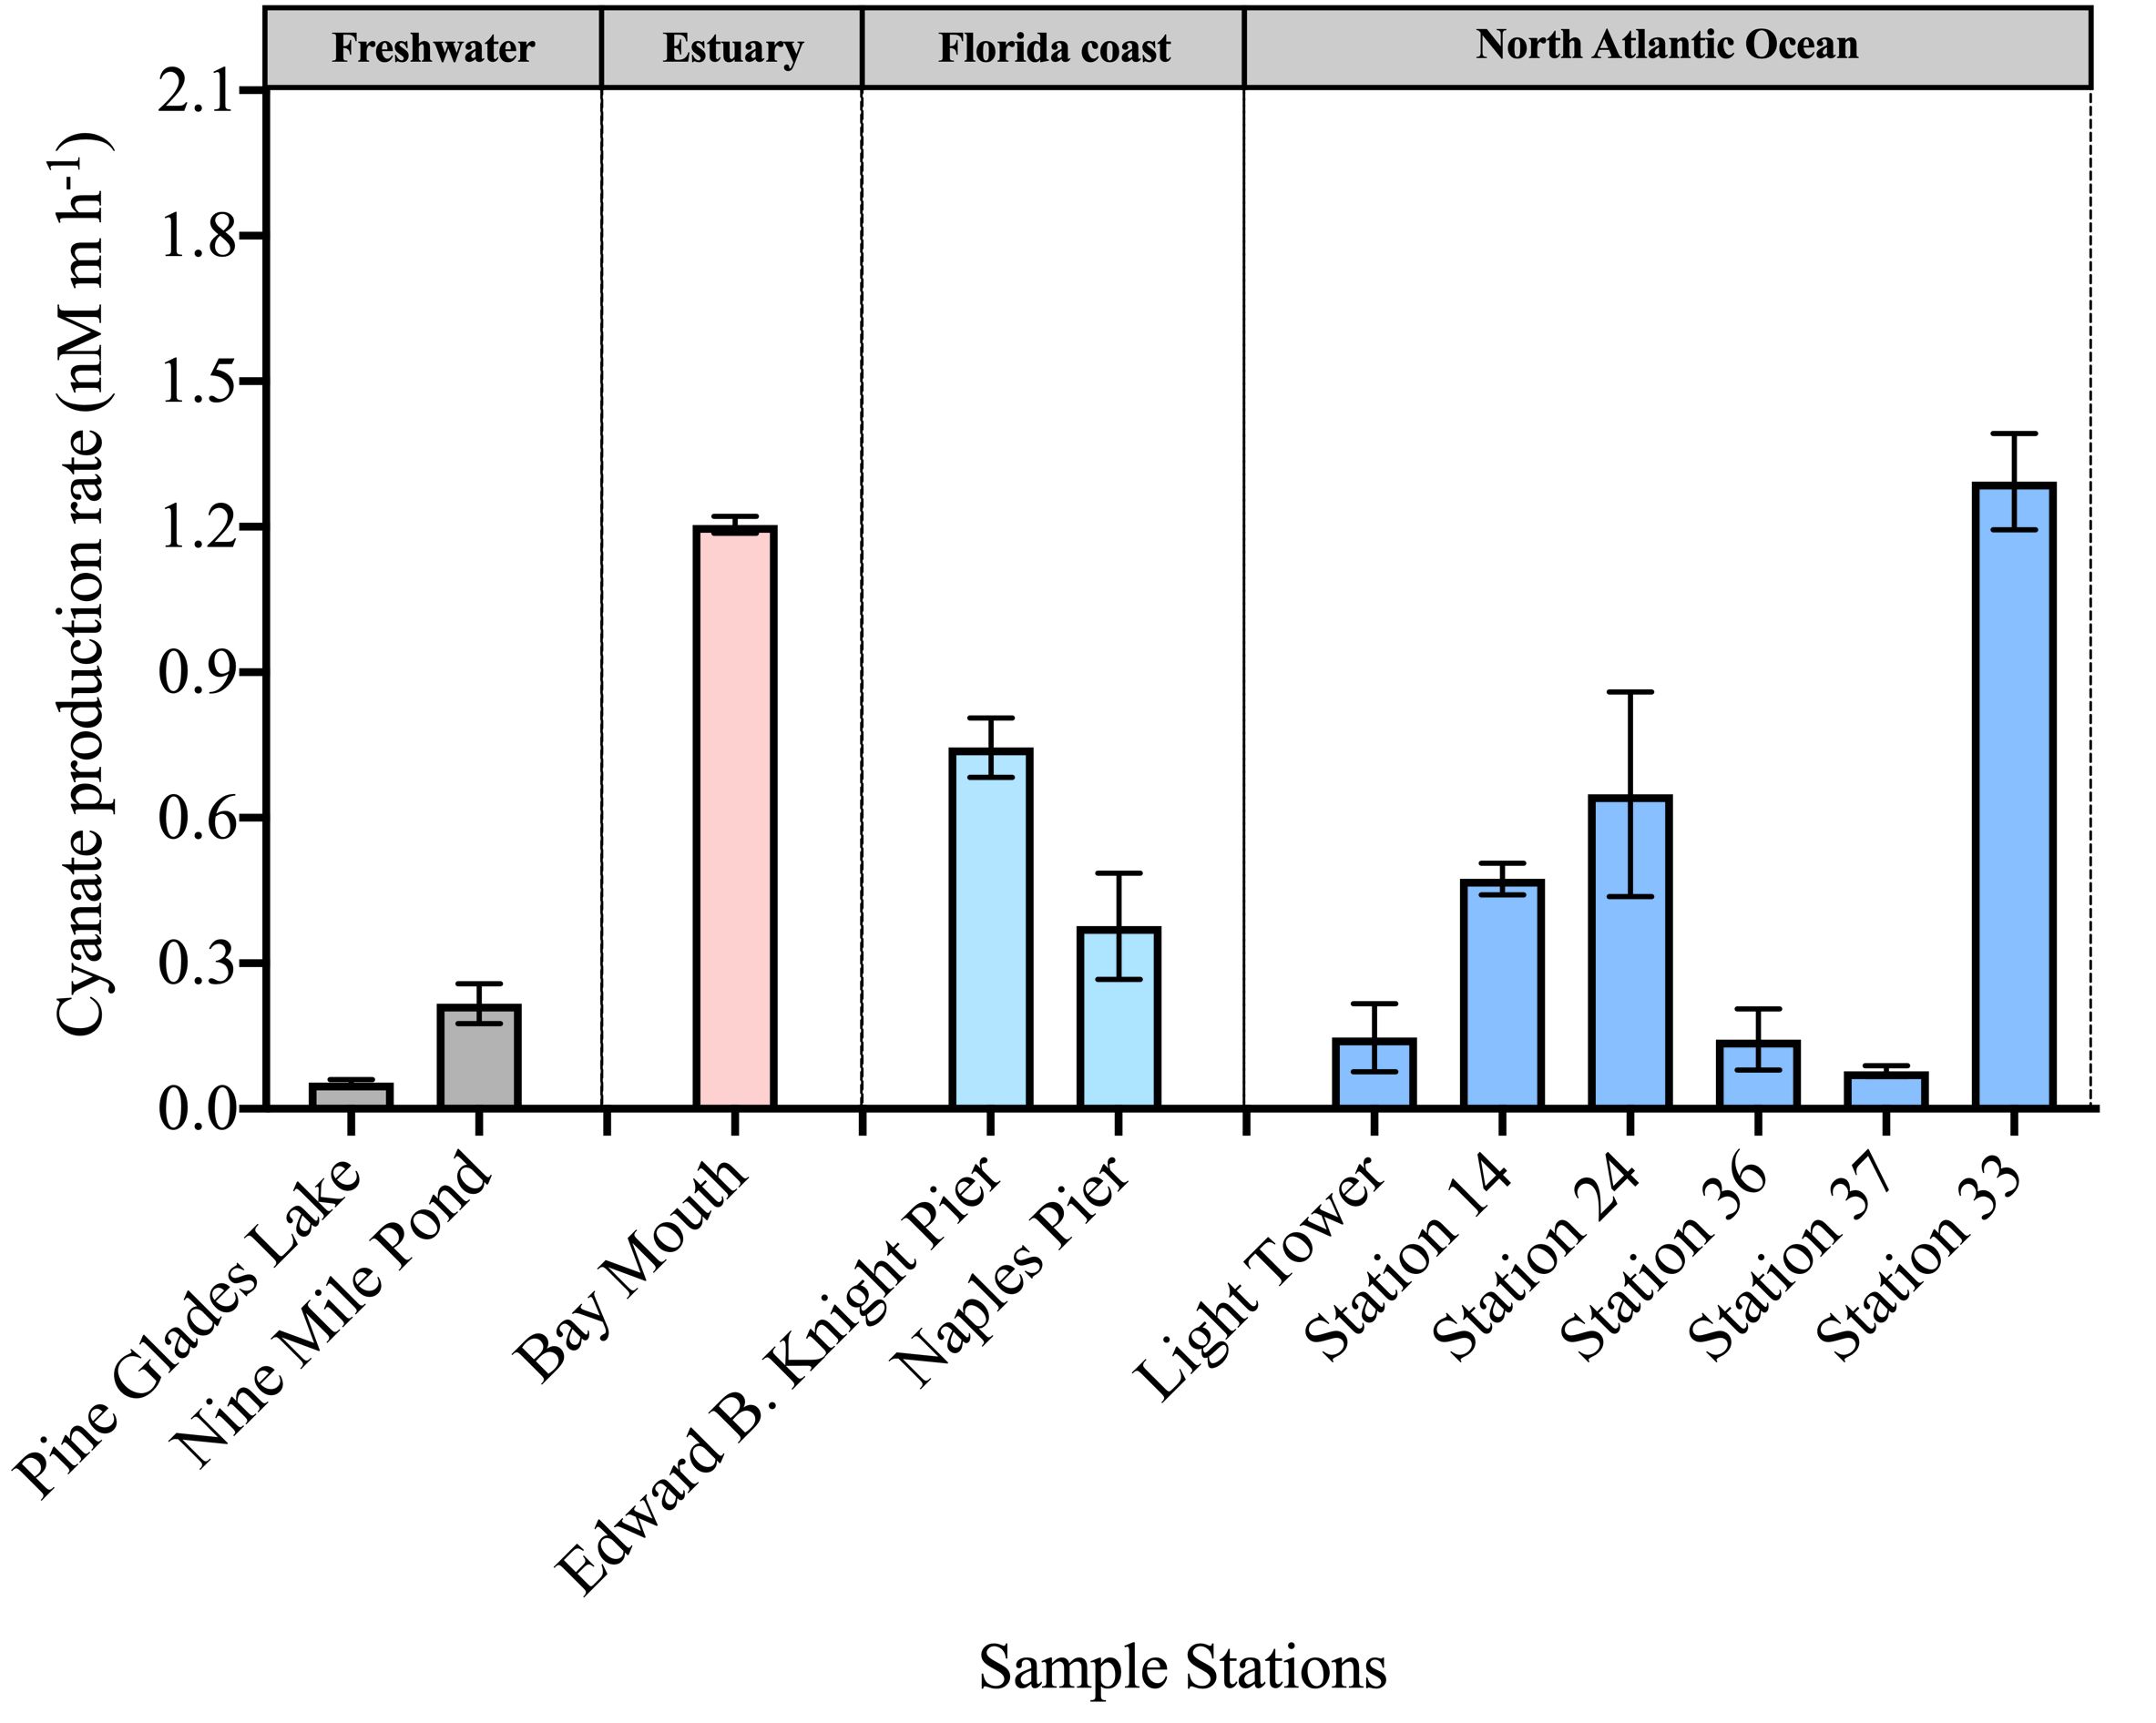
Figure 4 Photochemical production rate of cyanate from DOM collected in the surface layers of stations across diverse environments.
Across different water layers within the euphotic zone, the cyanate production rate of DOM ranged from 0.15–2.7 nM m h-1 (Figure 5). Except for the 8.1 m water layer of station 14, the cyanate production rate of DOM in the surface water of all other stations was lower than that in the subsurface layers within the same station (Figure 5). Moreover, the 8 m layer in Bay Mouth and Light Tower, and the 18.8 m layer in station 14, were three Chl a maximum layers. Interestingly, DOM in these layers exhibited a higher cyanate production rate than other water layers within the same station. For example, in the Chl a maximum layer of Light Tower, DOM had a cyanate production rate of 2.7 nM m h-1, which was significantly (P< 0.01) higher than the rate observed in the surface layer (0.15 nM m h-1) at this station (Figure 5). Likewise, in the Chl a maximum layer of station 14, the cyanate production rate of DOM (2.3 nM m h-1) was also significantly higher than that in the surface layer (0.47 nM m h-1) (P< 0.05) and in the 8.1 m water layer (0.25 nM m h-1) (P< 0.01) of the same station (Figure 5). These results highly indicate that the photochemical degradation process of marine DOM, especially the phytoplankton-derived DOM, is an important source of cyanate in the marine environment.
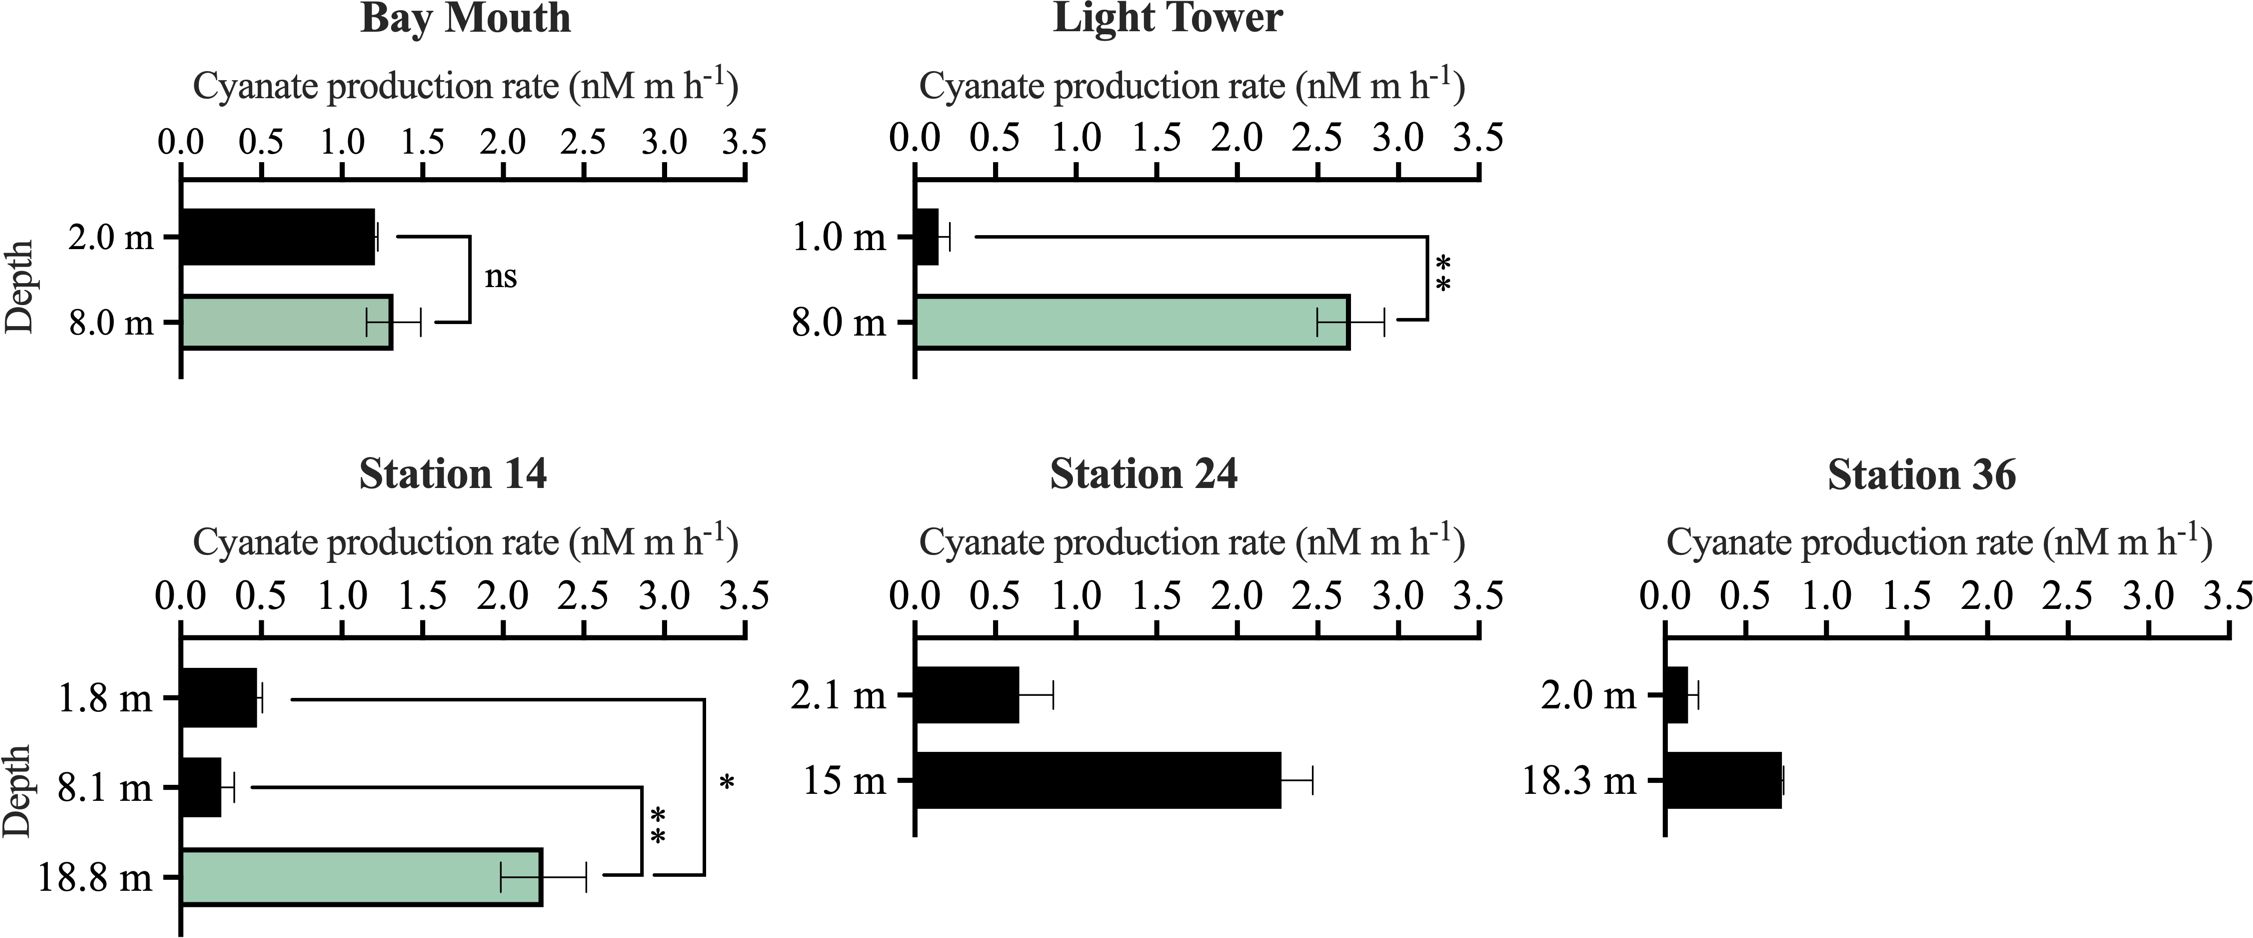
Figure 5 Photochemical production of cyanate from DOM collected at different water layers within the euphotic zone of the stations in the Chesapeake Bay Mouth and the continental shelf and slope regions of the NATL. The green columns specifically represent the cyanate production rate in the Chl a maximum layer. No significant (“ns”), significant (*, P< 0.05), or highly significant (**, P< 0.01) differences in cyanate production rate between the Chl a maximum layer and other layers at Bay Mouth, Light Tower, and Station 14 were indicated.
3.3 Photochemical production of cyanate from DOM secreted by Synechococcus sp. CB0101
The production of cyanate was examined during photochemical degradation of SynCB0101–DOM, in order to further investigate the potential production of cyanate from phytoplankton-derived DOM. Synechococcus sp. CB0101 underwent a slow growth phase for approximately 10 days, followed by a logarithmic growth phase from day 10 to day 22 (Figure 6A). By day 22, cell abundance reached 1.5 × 10⁹ cells mL-1 (Figure 6A). Concurrently, a substantial amount of DOM was secreted by Synechococcus sp. CB0101 during its growth, causing the DOM concentration in the culture medium to increase from 43 μmol C L-1 on day 0 to 602 μmol C L-1 on day 22 (Figure 6A). In this study, SynCB0101–DOM was collected on day 22, which was the mid-logarithmic growth phase of Synechococcus sp. CB0101.
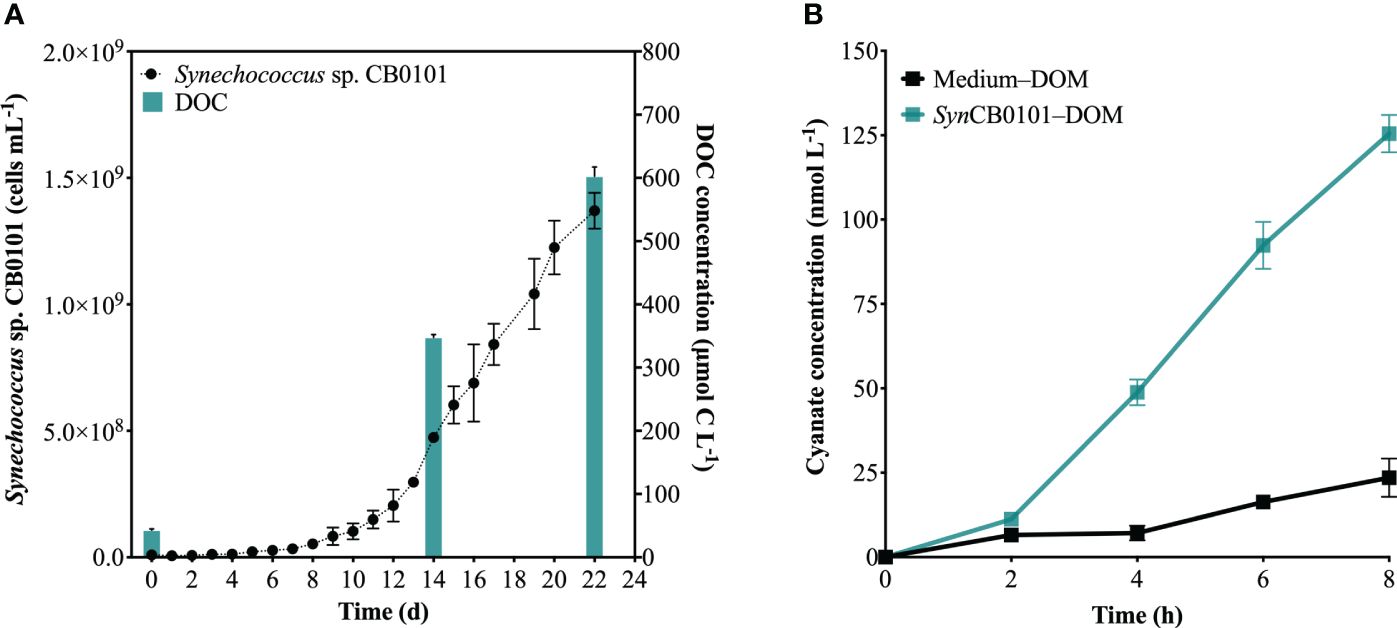
Figure 6 Photochemical production of cyanate from SynCB0101–DOM. (A) Changes in cell abundance and DOC concentration in the culture medium during the growth of Synechococcus sp. CB0101; (B) Changes in cyanate concentration during the photochemical degradation processes of SynCB0101–DOM and Medium–DOM.
The cyanate concentrations at each time point, as shown in Figure 6B, were subtracted from the initial cyanate concentrations in Medium–DOM or SynCB0101–DOM, indicating the net production of cyanate during photochemical degradation of these two DOM samples. Cyanate was produced during photochemical degradation of Medium–DOM and SynCB0101–DOM (Figure 6B), with cyanate concentrations increasing at the same trend within the first 2 hours of irradiation. Remarkably, the production of cyanate began to rise rapidly during the photochemical degradation of SynCB0101–DOM after 2 hours of light exposure, resulting in approximately 125 nM of cyanate produced after 8 hours of irradiation. However, only 24 nM cyanate was produced during photochemical degradation of Medium–DOM (Figure 6B). No cyanate was produced in the dark group of either Medium–DOM or SynCB0101–DOM.
3.4 Photochemical production of cyanate from natural seawater DOM supplemented with various nitrogen–containing compounds
Five nitrogen-containing compounds each with distinct structures and functional groups, were supplemented to the coastal seawater DOM sample collected near the Ocean City as mentioned in section 2.4. N-Acetyl-D-glucosamine is the main component of bacterial peptidoglycan and lipopolysaccharides in the ocean (Riemann and Azam, 2002). The remaining four nitrogen–containing compounds comprise peptides and aromatic compounds, which are common constituents in aquatic DOM (He et al., 2023). The photoproduction of cyanate was examined during the irradiation of the nitrogen–containing compound amended and unamended seawater DOM sample to explore the potential sources of cyanate production in seawater.
The five nitrogen–containing compounds exhibited unique light absorption features. The absorption spectra of DOM supplemented with N-Acetyl-D-glucosamine or GlycylGlycine resembled that of the DOM in the control group, exhibiting an exponential decrease in absorption coefficient as wavelength increased. Conversely, the DOM supplemented with 4-(methylamino) benzoic acid, methyl 2-aminobenzoate, or 4-[ethyl(methyl)amino]benzaldehyde displayed distinct absorption spectra, featuring prominent light absorption peaks at 279 nm (59.6 m-1), 326 nm (24.0 m-1) and 356 nm (103.7 m-1), respectively (Figure 7).
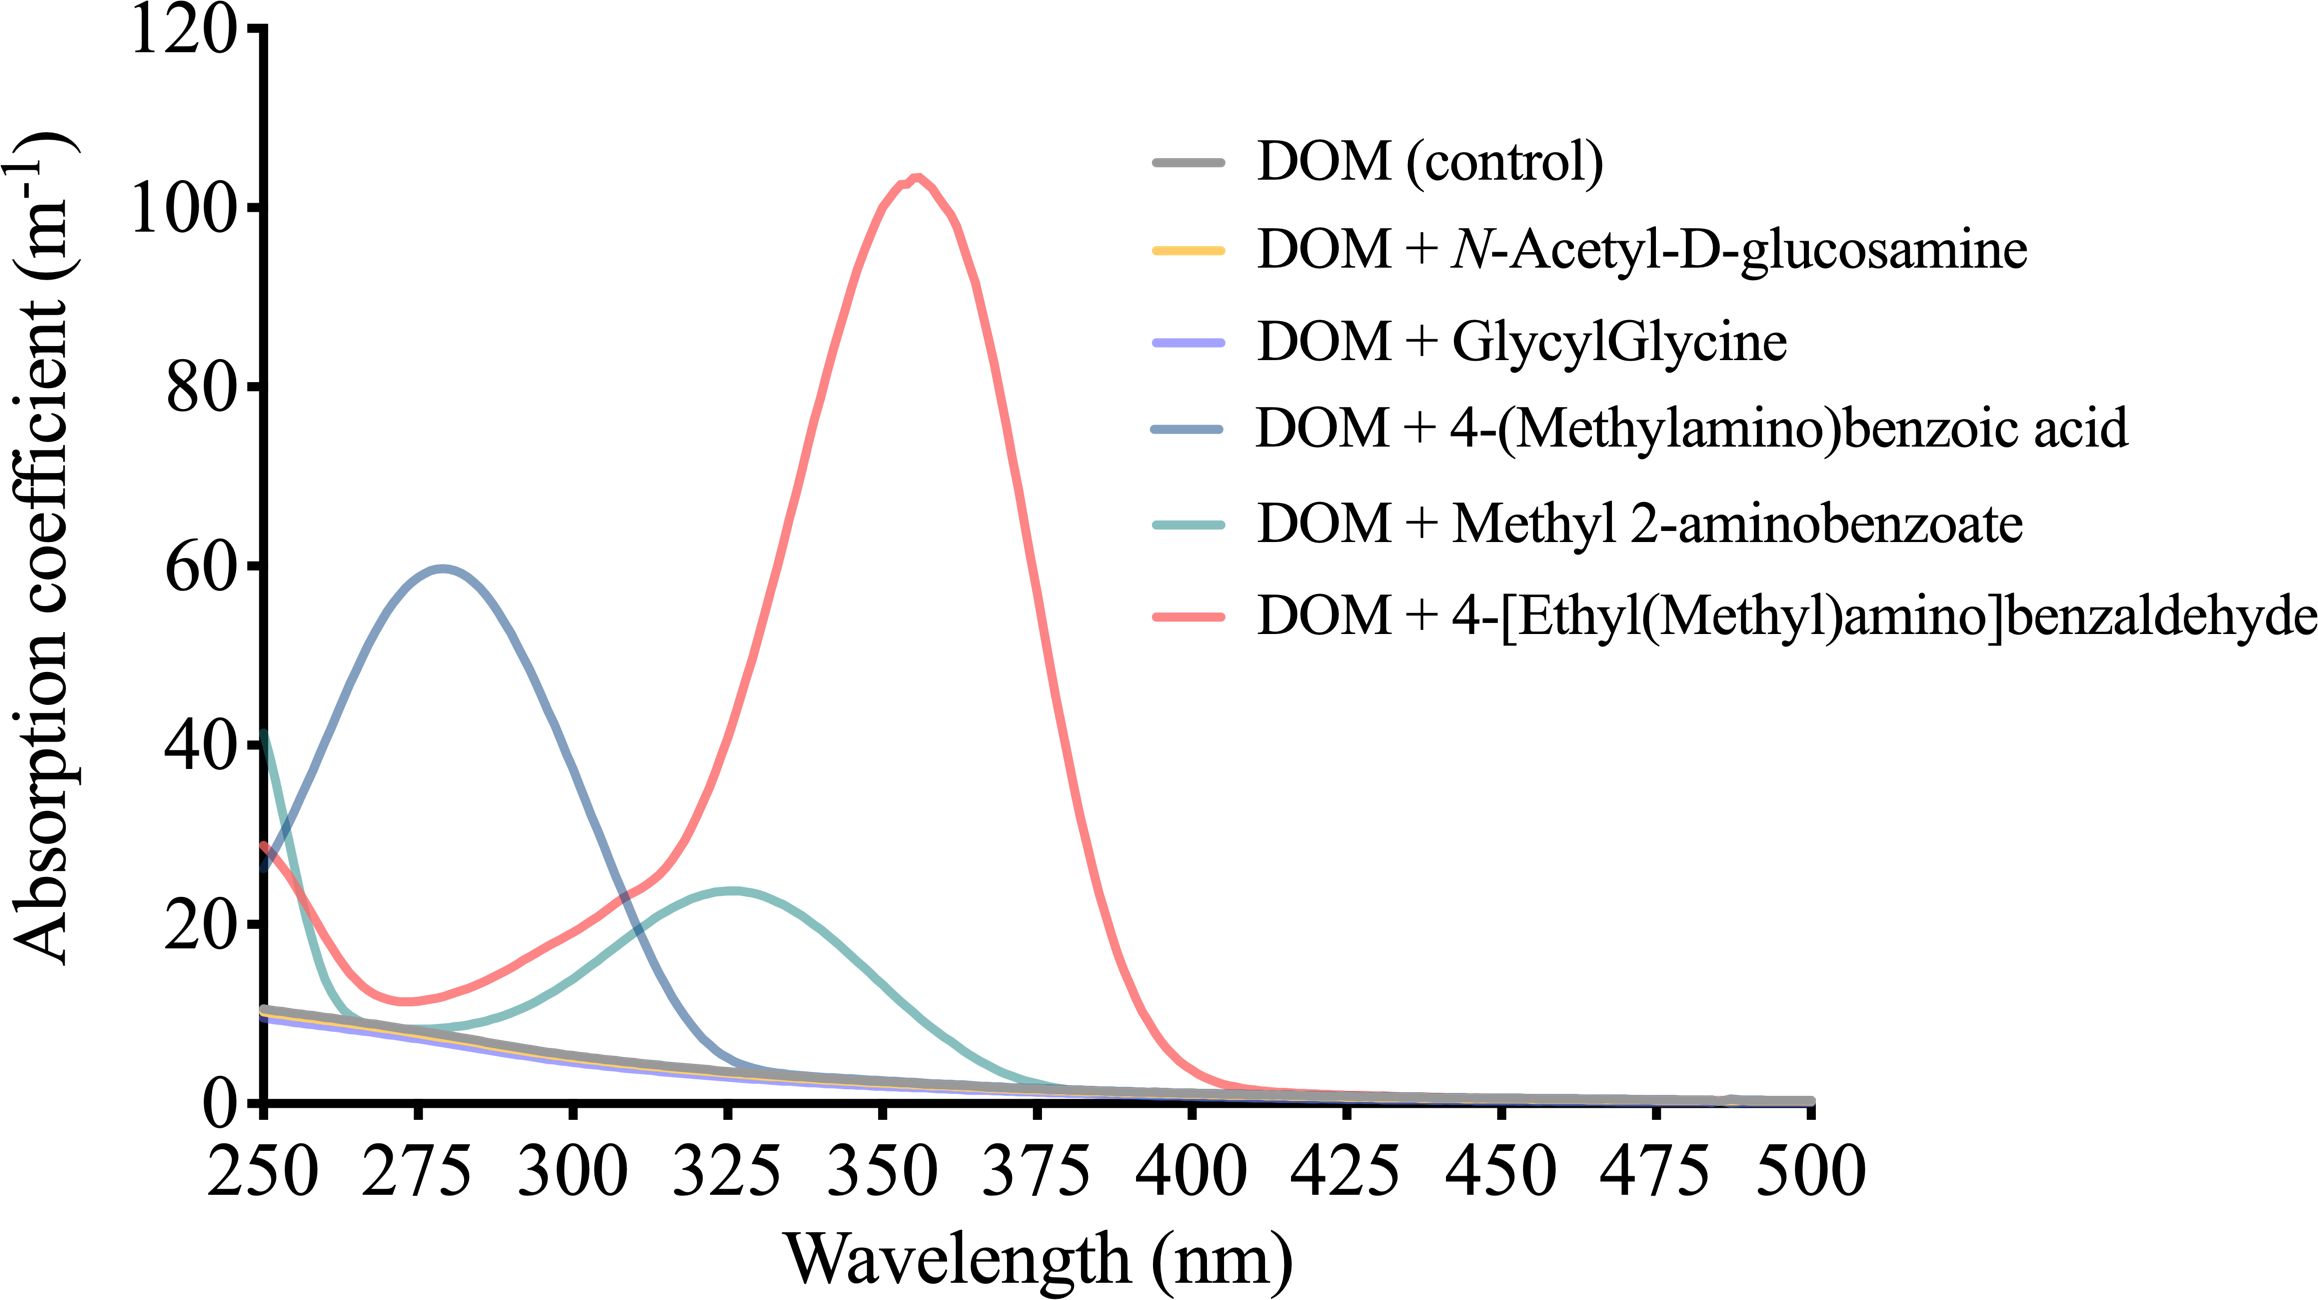
Figure 7 Absorption coefficients of a natural DOM supplemented with five different nitrogen–containing compounds.
As no cyanate production occurred in any of the dark groups, cyanate production in control and each nitrogen–containing compound amended group was determined by measuring the change in cyanate concentration before and after 8 hours of irradiation. With the exception of DOM amended with N-Acetyl-D-glucosamine, the DOM amended with the other four nitrogen–containing compounds exhibited significantly higher cyanate production than the DOM in the control group (18.8 nM) (Figure 8). The most substantial cyanate production was observed in the DOM amended with GlycylGlycine, yielding 29.3 nM cyanate after 8 hours of irradiation (Figure 8). Cyanate production from the DOM amended with 4-(methylamino) benzoic acid (29.005 nM) closely resembled that of GlycylGlycine (Figure 8). Interestingly, despite being isomers, cyanate production in the DOM amended with 4-(methylamino) benzoic acid (29.0 nM) significantly exceeded that of the DOM amended with methyl 2-aminobenzoate (21.7 nM) (Figure 8), indicating that the relative positions of the functional groups around the ring affect the photoreactivity.
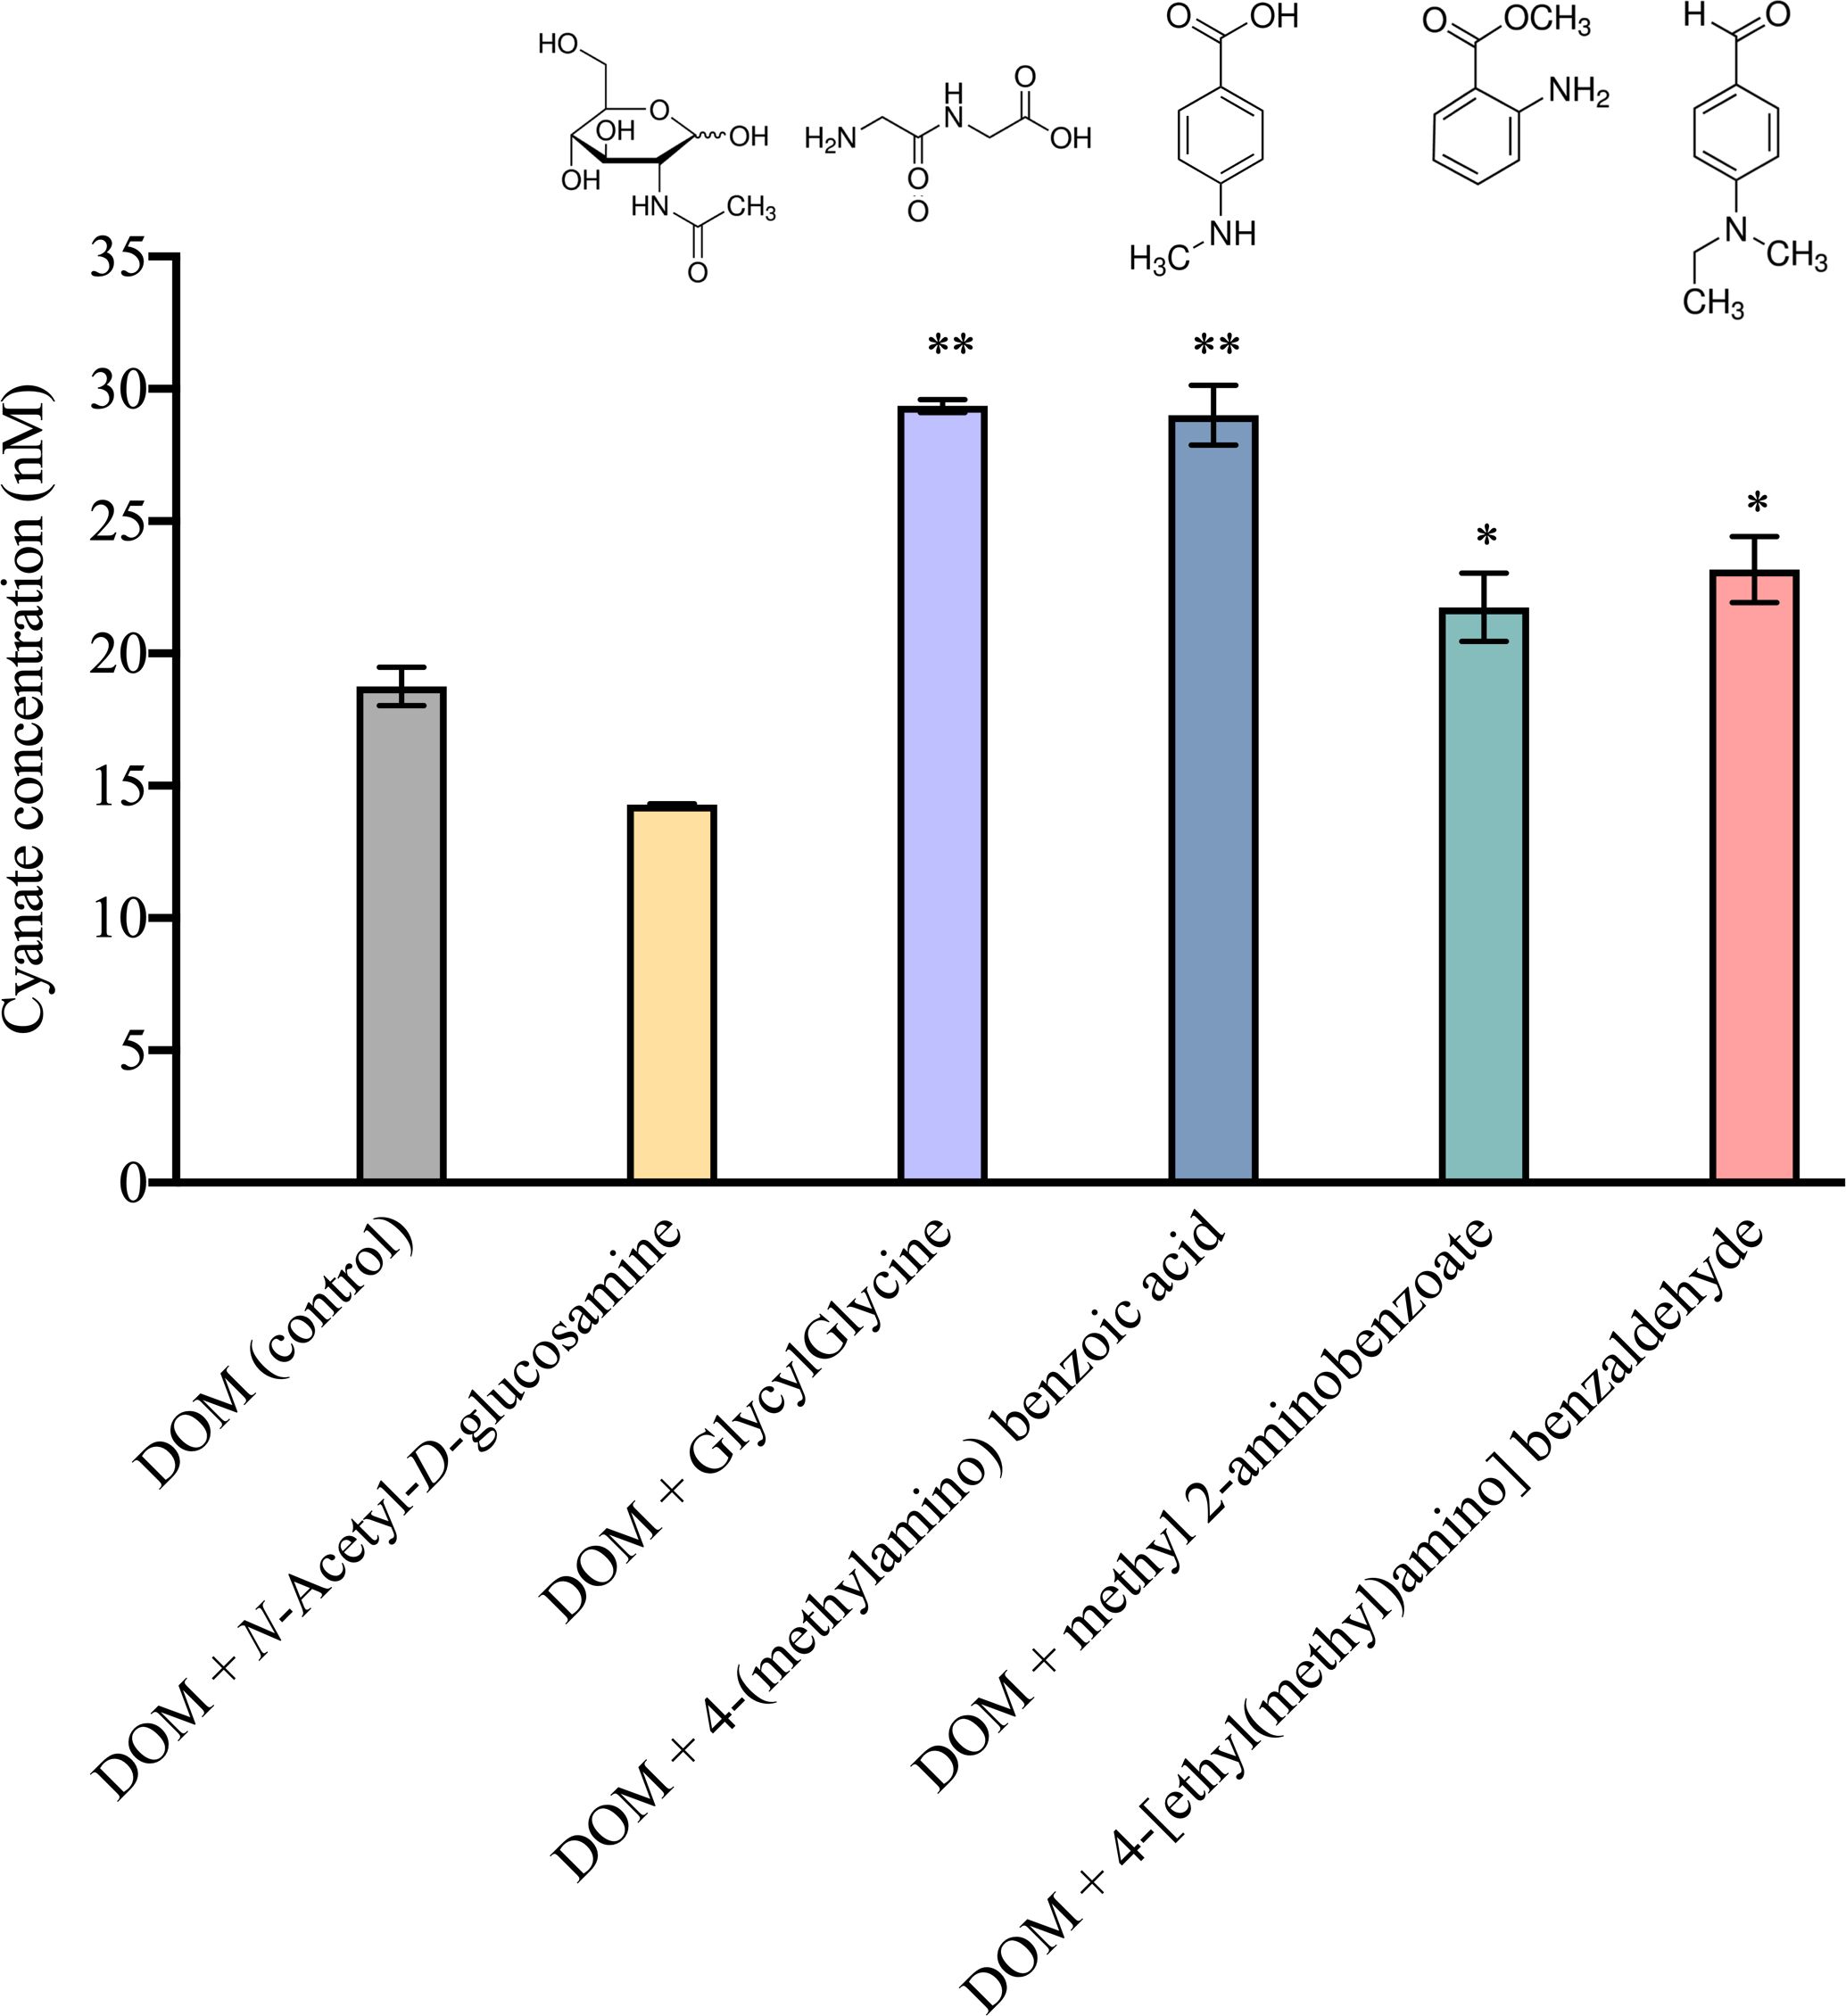
Figure 8 Photochemical production of cyanate from natural DOM supplemented with five different nitrogen–containing compounds after 8 hours of irradiation. Significant (*, P<0.05) or highly significant (**, P<0.01) differences in cyanate production between the nitrogen–containing compound amended and control groups were indicated.
4 Discussion
4.1 Potential sources of cyanate in different environments
In this study, distributions of cyanate across various environments were investigated. Cyanate concentrations in the Chesapeake Bay estuary and the continental and slope regions of the NATL generally agree with the findings of Widner et al. in nearby areas (Widner et al., 2013; Widner et al., 2016; Widner and Mulholland, 2017). Cyanate concentration was initially assessed in a freshwater environment (Pine Glades Lake and Nine Mile Pond) in this study, where a decoupling between its concentration and production rate was observed (Figures 2, 4). The elevated cyanate levels in this region may be attributed to a lower utilization rate. However, there is no documented utilization of cyanate by freshwater microorganisms. Additionally, this phenomenon may suggest the existence of alternative sources contributing to cyanate accumulation. The extensive use of urea as a nitrogen fertilizer in agriculture, with global usage increasing over 100-fold in the past 40 years, comprises over 50% of global urea consumption. Given urea’s conversion propensity to cyanate (Dirnhuber and Schutz, 1948), elevated cyanate concentrations in the freshwater environment may result from urea degradation in soil. Furthermore, the urea retained in the soil can be transported to estuarine and coastal environments, becoming a substantial component of total dissolved organic nitrogen (Glibert et al., 2006). A previous study monitored urea concentrations in a Chesapeake Bay tributary for five years, revealing that urea concentration could reach up to 10 μM, surpassing urea concentrations in surface waters of the Chesapeake Bay estuary by over 50-fold (Glibert et al., 2005). Therefore, the relatively higher cyanate concentrations in the Chesapeake Bay estuary and Florida coastal environments may result from urea degradation from terrestrial and riverine sources. Additionally, urea constitutes a significant portion of domestic sewage (Glibert et al., 2006). Edward. Knight Pier and Naples Pier located along Florida’s coastline are near urban areas with sewage discharges. Therefore, the high cyanate concentrations at these two stations may stem from urea degradation from nearby domestic sewage.
Generally, the impact of terrestrial organic matter input on the NATL appears relatively insignificant when compared to estuarine and coastal regions. Consequently, cyanate in this environment is likely primarily generated through in-situ biological or abiotic processes. Additionally, it’s intriguing to observe a discrepancy between the relatively low cyanate concentration and its high production rate in the NATL (Figures 2–5). Previous studies have demonstrated the capability of microbial communities in the coastal area of the NATL to utilize cyanate, with uptake rates comparable to the photoproduction rates from DOM collected at the NATL stations in this study (Widner et al., 2016). Therefore, it’s conceivable that the cyanate produced undergoes rapid consumption in the NATL, resulting in its low concentrations.
4.2 Disparities in sources and composition of DOM in various environments accounting for variations in cyanate production during their photochemical degradation processes
Previous studies primarily addressed cyanate utilization, leaving the sources of cyanate largely unknown (Kitzinger et al., 2019; Linder, 2019; Sáez et al., 2019; Mooshammer et al., 2021). The results of this study reveal that cyanate can be produced by photochemical degradation of DOM in diverse environments. However, the cyanate production rate varies among the DOM samples, probably reflecting differences in their sources and composition. The DOM samples collected in different environment contexts in this study exhibit variations in the sources and composition. For instance, the two freshwater stations, Nine Mile Pond and Pine Glades Lake, located in a subtropical freshwater wetland within Everglades National Park, Florida, USA, primarily consist of humic-like substances from marsh soil. Additionally, due to the proximity of the Everglades Agricultural Area to the northern part of the sampling sites, the DOM in this area is partly characterized by high molecular weight, peat-soil, and highly oxidized agricultural soil-derived DOM (Yamashita et al., 2010). In contrast, Naples Pier and Edward B. Knight Pier, located in southwestern Florida along the Gulf of Mexico and at the southernmost Key West, are minimally influenced by freshwater inputs from the Everglades. Therefore, the DOM in these areas predominantly originates from autochthonous sources (Jaffé et al., 2004). The Chesapeake Bay estuary, impacted by freshwater influx from nearby rivers and the mixing with coastal waters from the NATL, exhibits a DOM comprising both terrestrial and marine origins. In comparison, the DOM in the NATL is comparatively dominated by marine-derived DOM (Loh et al., 2006). Despite elevated cyanate concentrations in freshwater environments, the photochemical production rates of cyanate from DOM in such environments are markedly lower than those in the Chesapeake Bay estuary, coastal areas in Florida, and the continental and slope regions of the NATL (Figures 2, 4). This suggests that, unlike terrestrial DOM, photochemical degradation of marine DOM constitutes a substantial source of cyanate. Consequently, the differences in the sources and composition of DOM in freshwater, Chesapeake Bay estuary, coastal areas in Florida, and the NATL may be potentially crucial factors accounting for the observed variations in cyanate production rates within these diverse environments.
4.3 Photochemical degradation of phytoplankton-derived DOM: a substantial source of cyanate in the marine environment
It is noteworthy that the cyanate production rates from DOM in the Chl a maximum layer at Light Tower and Station 14 are significantly higher than those from other depths within the same station (Figure 5). Similarly, in the Chesapeake Bay estuary and the continental and slope regions of the NATL, cyanate concentrations in Chl a maximum layers of most stations in these areas surpassed those in other water layers within the same station (Figure 3). Additionally, a strong positive correlation between Chl a and cyanate concentrations in different water layers was identified using the Mantel test (Figure 9). This aligns with previous findings indicating higher cyanate concentrations in areas with elevated Chl a concentrations in the coastal areas of the NATL (Widner and Mulholland, 2017). Moreover, Widner et al. reported cyanate accumulation in the cultures of two prevalent diatom species in coastal and oceanic environments (Widner et al., 2016). Recent research also reveals cyanate production from the decomposition of organic matter in a station located near the mouth of the Lafayette River Virginia, during a Margalefidinium polykrikoides bloom (Zhu et al., 2023). In the marine environment, Chl a maximum layer is typically characterized by high biomass and productivity, hosting abundant microorganisms engaged in various biogeochemical processes (Xie et al., 2020; Mao et al., 2021). Consequently, this layer contains substantial organic matter produced by primary producers and other microorganisms. Therefore, the high cyanate production rates in the Chl a maximum layers highly suggested that DOM from the Chl a maximum layer is very photoreactive and the photochemical degradation of phytoplankton-derived DOM is a substantial source of cyanate in the marine environment.
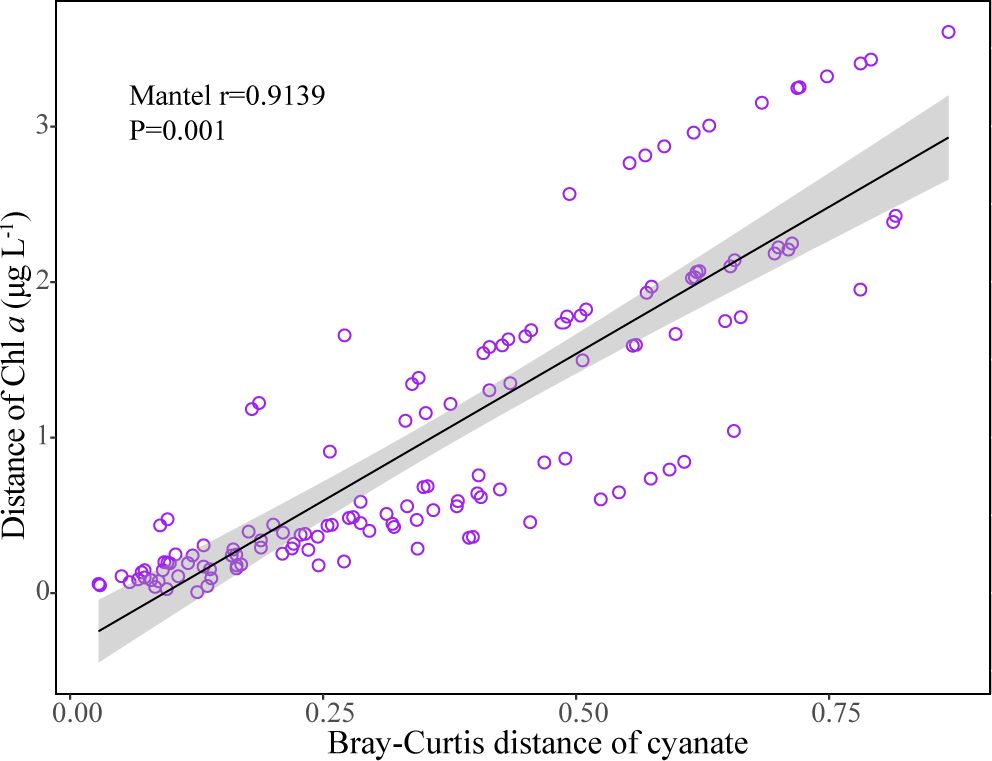
Figure 9 Correlation between cyanate and Chl a concentrations in different water layers of sampling stations in the Chesapeake Bay estuary and the continental and slope regions of the NATL.
Furthermore, Synechococcus, a key primary producer widely distributed in marine environments, contributes nearly half of ocean productivity (Scanlan, 2012; Flombaum et al., 2013). The DOM secreted by Synechococcus constitutes a substantial part of the marine DOM pool (Zhao et al., 2017). This study observed cyanate production during the photochemical degradation of DOM secreted by Synechococcus sp. CB0101 (Figure 6), further supporting that the photochemical degradation of phytoplankton-derived DOM is an important source of cyanate in the ocean.
The light intensity of the photochemical experiment in this study resembled the light conditions in the surface seawater at noon at 37°N latitude. However, there is a large difference in light intensity and spectrum between the Chl a maximum layer and the surface layer. Therefore, it is necessary to systematically investigate cyanate production during photochemical degradation of DOM produced by different microorganisms during different growth stages, such as eukaryotic, prokaryotic primary producers, and heterotrophic bacteria, by simulating the light intensity under various environmental conditions. It has been found that cyanase transcripts are prevalent in marine microorganisms, particularly in Synechococcus, Prochlorococcus and nitrifying bacteria, spanning from the ocean surface to the chlorophyll maximum layer (Mao et al., 2021). Consequently, utilization of cyanate catalyzed by cyanase potentially plays an important role in the marine nitrogen cycle within the chlorophyll maximum layer. If cyanate is photochemically produced from the degradation of DOM under the light condition in the Chl a maximum layer, it will become available for utilization by surrounding microorganisms, serving as an important nitrogen source. Additionally, in the marine environment, microorganisms and organic matter in the Chl a maximum layer are typically transported into surface water through vertical mixing (Huisman et al., 2006). If this DOM is further degraded after being brought into the surface layer, the cyanate produced will provide potentially available nitrogen sources for the surface microorganisms. Numerous marine microorganisms have been found to utilize cyanate as a nitrogen source (Kitzinger et al., 2019; Sato et al., 2022). Therefore, the revelation that cyanate can be generated during the photochemical degradation of DOM in this study provides important insight into the marine nitrogen cycle.
4.4 Processes and mechanisms underlying cyanate production in the marine environment
The composition and structure of marine DOM are complex, with nitrogen-containing compounds being a significant component. DOM constituents include sugars, proteins, and some aromatic and aliphatic compounds (Kujawinski and Behn, 2006; Sleighter and Hatcher, 2008; Seidel et al., 2022). In this study, the photochemical production of cyanate from the natural DOM, supplemented with GlycylGlycine, methyl 2-aminobenzoate, 4-(methylamino) benzoic acid, or 4-[ethyl(methyl)amino]benzaldehyde, exhibited marked enhancement compared to the DOM in the control group (Figure 8). Chromophoric dissolved organic matter (CDOM) is the primary component responsible for light absorption in the ocean. High-energy UV light absorbed by CDOM is sufficient to break down its chemical bonds, leading to alterations of its composition or the generation of new compounds, such as small nitrogen–containing molecules (Santos et al., 2014; Mopper et al., 2015). The photochemical degradation of CDOM can also induce the production of a series of free radicals, leading to further oxidation or degradation of other DOM, including colorless DOM and CDOM. GlycylGlycine does not exhibit significant light absorption characteristics in the ultraviolet-visible light region and belongs to colorless DOM. Therefore, the increase in cyanate production in the GlycylGlycine–amended group may be attributed to bond photolysis and the production of free radicals during photochemical degradation of the natural DOM, which in turn promoted GlycylGlycine degradation/oxidation followed by cyanate production. Methyl 2-aminobenzoate, 4-(methylamino) benzoic acid, or 4-[ethyl(methyl)amino] exhibited strong light absorption characteristics at wavelengths of 272 nm, 325 nm, and 350 nm, respectively, and belong to CDOM. Therefore, cyanate produced in amended groups with these three nitrogen–containing compounds may have originated from photochemical degradation of these compounds or from enhanced degradation of the natural DOM induced by free radicals generated during photochemical degradation of these nitrogen–containing compounds. Furthermore, these results support the significance of the photochemical degradation of polypeptides and aromatic compounds in the ocean as a potential source of cyanate. Notably, despite 4-(methylamino) benzoic acid and methyl 2-aminobenzoate being isomers, the cyanate produced during photochemical degradation of the coastal DOM differed when supplemented with these two compounds. This discrepancy may be attributed to the positions of functional groups on their respective benzene ring. Specifically, 4-(methylamino) benzoic acid features a benzene ring with a carboxylic acid group and a methylamino group at the 4-position. In contrast, the benzene ring of methyl 2-aminobenzoate incorporates a carboxylic ester group and an amino group at the 2-position. It has been previously shown that the relative position of functional groups around the rings affects the compound's photoreactivity and consequently its quantum yields (Sun et al., 2015). A systematic study of the effects of positional isomers on the photoproduction of cyanate would likely yield new insights into the photoreactivity of marine DOM.
5 Conclusions
Cyanate is an important organic nitrogen and energy source for various microbial organisms. This study investigated the distribution and production of cyanate during the photochemical degradation of DOM from various environments to understand its sources. Cyanate concentrations varied markedly with depth in freshwater, Chesapeake Bay estuary, coastal areas in Florida, and the continental and slope regions of the NATL, and are highly correlated with Chl a concentrations. Additionally, our findings also provide strong evidence that photochemical degradation of marine DOM, especially phytoplankton-derived DOM, is a major source of cyanate in the ocean. Furthermore, it was found that cyanate is likely produced from peptides and aromatic compounds present in DOM. The findings of this study provide new insights into the roles of cyanate in the marine nitrogen cycle. It appears that cyanate's photochemical production may be useful for studying photodegradation pathways of DOM and nitrogen-containing DOM precursors.
Data availability statement
The original contributions presented in the study are included in the article/Supplementary Material. Further inquiries can be directed to the corresponding authors.
Author contributions
RW: Conceptualization, Formal analysis, Funding acquisition, Methodology, Writing – review & editing. JL: Funding acquisition, Writing – review & editing. YX: Writing – review & editing. LL: Formal analysis, Writing – review & editing. KM: Writing – review & editing, Methodology, Supervision.
Funding
The author(s) declare that financial support was received for the research, authorship, and/or publication of this article. This work was supported by awards from the Key Research and Development Program of Shandong Province (2020ZLYS04), the China Postdoctoral Science Foundation (2022M711897), the Natural Science Foundation of Shandong province (ZR2022QD116), the U.S. National Science Foundation (OCE-1155666, OCE-1459698 and OCE-1543784) and the Fujian Key Laboratoryof Marine Carbon Sequestration (FKLMCS2023001).
Acknowledgments
We would like to thank the captain and all the crew of the R/V Hugh R. Sharp cruise for their dedication and support. In particular, we thank Brittany Winder for her help in the cruise planning and preparation. We thank Dr. Margaret R. Mulholland and Peter W. Bernhardt for providing all the lab facilities and their assistance in handling the HPLC for measurement of cyanate samples.
Conflict of interest
The authors declare that the research was conducted in the absence of any commercial or financial relationships that could be construed as a potential conflict of interest.
Publisher’s note
All claims expressed in this article are solely those of the authors and do not necessarily represent those of their affiliated organizations, or those of the publisher, the editors and the reviewers. Any product that may be evaluated in this article, or claim that may be made by its manufacturer, is not guaranteed or endorsed by the publisher.
Supplementary material
The Supplementary Material for this article can be found online at: https://www.frontiersin.org/articles/10.3389/fmars.2024.1373643/full#supplementary-material
References
Azam F., Malfatti F. (2007). Microbial structuring of marine ecosystems. Nat. Rev. Microbiol. 5, 782–791. doi: 10.1038/nrmicro1747
Babbin A. R., Peters B. D., Mordy C. W., Widner B., Casciotti K. L., Ward B. B. (2017). Multiple metabolisms constrain the anaerobic nitrite budget in the Eastern Tropical South Pacific. Global Biogeochem. Cy. 31, 258–271. doi: 10.1002/2016gb005407
Berman T., Bronk D. A. (2003). Dissolved organic nitrogen: a dynamic participant in aquatic ecosystems. Aquat. Microb. Ecol. 31, 279–305. doi: 10.3354/ame031279
Berthelot H., Duhamel S., L’Helguen S., Maguer J. F., Wang S., Cetinić I., et al. (2019). NanoSIMS single cell analyses reveal the contrasting nitrogen sources for small phytoplankton. ISME J. 13, 651–662. doi: 10.1038/s41396-018-0285-8
Bristow L. A., Mohr W., Ahmerkamp S., Kuypers M. M. M. (2017). Nutrients that limit growth in the ocean. Curr. Biol. 27, R474–R478. doi: 10.1016/j.cub.2017.03.030
Bronk D. A., See J. H., Bradley P., Killberg L. (2007). DON as a source of bioavailable nitrogen for phytoplankton. Biogeosciences 4, 283–296. doi: 10.5194/bg-4-283-2007
Carepo M. S. P., Nina de Azevedo J. S., Porto J. I. R., Bentes-Sousa A. R., Batista J. D. S., Da Silva A. L. C., et al. (2004). Identification of Chromobacterium violaceum genes with potential biotechnological application in environmental detoxification. Genet. Mol. Res. 3, 181–194.
Dirnhuber P., Schutz F. (1948). The isomeric transformation of urea into ammonium cyanate in aqueous solutions. Biochem. J. 42, 628–632.
Elleuche S., Pöggeler S. (2008). A cyanase is transcriptionally regulated by arginine and involved in cyanate decomposition in Sordaria macrospora. Fungal Genet. Biol. 45, 1458–1469. doi: 10.1016/j.fgb.2008.08.005
Flombaum P., Gallegos J. L., Gordillo R. A., Rincón J., Zabala L. L., Jiao N., et al. (2013). Present and future global distributions of the marine Cyanobacteria Prochlorococcus and Synechococcus. Proc. Natl. Acad. Sci. U.S.A. 110, 9824–9829. doi: 10.1073/pnas.1307701110
Fucich D., Marsan D., Sosa A., Chen F. (2019). Complete genome sequence of subcluster 5.2 Synechococcus sp. strain CB0101, isolated from the Chesapeake Bay. Microbiol. Resour. Announc. 8, e00484–e00419. doi: 10.1128/MRA.00484-19
Ganesh S., Bertagnolli A. D., Bristow L. A., Padilla C. C., Blackwood N., Aldunate M., et al. (2018). Single cell genomic and transcriptomic evidence for the use of alternative nitrogen substrates by anammox bacteria. ISME J. 12, 2706–2722. doi: 10.1038/s41396-018-0223-9
Glibert P. M., Harrison J., Heil C., Seitzinger S. (2006). Escalating worldwide use of Urea – a global change contributing to coastal eutrophication. Biogeochemistry 77, 441–463. doi: 10.1007/s10533-005-3070-5
Glibert P. M., Trice T. M., Michael B., Lane L. (2005). Urea in the tributaries of the chesapeak and coastal bays of Maryland. Water Air Soil Poll. 160, 229–243. doi: 10.1007/s11270-005-2546-1
Green S. A., Blough N. V. (1994). Optical absorption and fluorescence properties of chromophoric dissolved organic matter in natural waters. Limnol. Oceanogr. 39, 1903–1916. doi: 10.4319/lo.1994.39.8.1903
He C., Yi Y., He D., Cai R., Chen C., Shi Q. (2023). Molecular composition of dissolved organic matter across diverse ecosystems: Preliminary implications for biogeochemical cycling. J. Environ. Manage. 344, 118559. doi: 10.1016/j.jenvman.2023.118559
Helms J. R., Stubbins A., Perdue E. M., Green N. W., Chen H., Mopper K. (2013). Photochemical bleaching of oceanic dissolved organic matter and its effect on absorption spectral slope and fluorescence. Mar. Chem. 155, 81–91. doi: 10.1016/j.marchem.2013.05.015
Helms J. R., Stubbins A., Ritchie J. D., Minor E. C., Kieber D. J. (2008). Absorption spectral slopes and slope ratios as indicators of molecular weight, source and photobleaching of chromophoric dissolved organic matter. Limnol. Oceanogr. 53, 955–969. doi: 10.4319/lo.2008.53.3.0955
Huisman J., Pham Thi N. N., Karl D. M., Sommeijer B. (2006). Reduced mixing generates oscillations and chaos in the oceanic deep chlorophyll maximum. Nature 439, 322–325. doi: 10.1038/nature04245
Hutchins D. A., Capone D. G. (2022). The marine nitrogen cycle: new developments and global change. Nat. Rev. Microbiol. 20, 401–414. doi: 10.1038/s41579-022-00687-z
Jaffé R., Boyer J. N., Lu X., Maie N., Yang C., Scully N. M., et al. (2004). Source characterization of dissolved organic matter in a subtropical mangrove-dominated estuary by fluorescence analysis. Mar. Chem. 84, 195–210. doi: 10.1016/j.marchem.2003.08.001
Kamennaya N. A., Chernihovsky M., Post A. F. (2008). The cyanate utilization capacity of marine unicellular cyanobacteria. Limnol. Oceanogr. 53, 2485–2494. doi: 10.4319/lo.2008.53.6.2485
Kamennaya N. A., Post A. F. (2011). Characterization of cyanate metabolism in marine synechococcus and prochlorococcus spp. Appl. Environ. Microb. 77, 291–301. doi: 10.1128/aem.01272-10
Kamennaya N. A., Post A. F. (2013). Distribution and expression of the cyanate acquisition potential among cyanobacterial populations in oligotrophic marine waters. Limnol. Oceanogr. 58, 1959–1971. doi: 10.4319/lo.2013.58.6.1959
Kebeish R., Al-Zoubi O. (2017). Expression of the cyanobacterial enzyme cyanase increases cyanate metabolism and cyanate tolerance in Arabidopsis. Environ. Sci. pollut. Res. Int. 24, 11825–11835. doi: 10.1007/s11356-017-8866-z
Kitzinger K., Marchant H. K., Bristow L. A., Herbold C. W., Padilla C. C., Kidane A. T., et al. (2020). Single cell analyses reveal contrasting life strategies of the two main nitrifiers in the ocean. Nat. Commun. 11, 767. doi: 10.1038/s41467-020-14542-3
Kitzinger K., Padilla C. C., Marchant H. K., Hach P. F., Herbold C. W., Kidane A. T., et al. (2019). Cyanate and urea are substrates for nitrification by Thaumarchaeota in the marine environment. Nat. Microbiol. 4, 243–234. doi: 10.1038/s41564-018-0316-2
Koch H., van Kessel M. A. H. J., Lucker S. (2019). Complete nitrification: insights into the ecophysiology of comammox Nitrospira. Appl. Microbiol. Biot. 103, 177–189. doi: 10.1007/s00253-018-9486-3
Kujawinski E. B., Behn M. D. (2006). Automated analysis of electrospray ionization fourier transform ion cyclotron resonance mass spectra of natural organic matter. Anal. Chem. 78, 4363–4373. doi: 10.1021/ac0600306
Li W. K. W. (1995). Composition of ultraphytoplankton in the central North Atlantic. Mar. Ecol. Prog. Ser. 122, 1–8. doi: 10.3354/meps122001
Linder T. (2019). Cyanase-independent utilization of cyanate as a nitrogen source in ascomycete yeasts. World J. Microb. Biot. 35, 3. doi: 10.1007/s11274-018-2579-4
Loh A. N., Bauer J. E., Canuel E. A. (2006). Dissolved and particulate organic matter source-age characterization in the upper and lower Chesapeake Bay: A combined isotope and biochemical approach. Limnol. Oceanogr. 51, 1421–1431. doi: 10.4319/lo.2006.51.3.1421
Mao X., Chen J., van Oosterhout C., Zhang H., Liu G., Zhuang Y., et al. (2021). Diversity, prevalence, and expression of cyanase genes (cynS) in planktonic marine microorganisms. ISME J. 16, 602–605. doi: 10.1038/s41396-021-01081-y
Marsan D., Wommack K. E., Ravel J., Chen F. (2014). Draft genome sequence of synechococcus sp. Strain CB0101, isolated from the Chesapeake bay estuary. Genome Announc. 2, e01111–e01113. doi: 10.1128/genomeA.01111-13
Minot E. C., Pothen J., Dalzell B. J., Abdulla H., Mopper K. (2006). Effects of salinity changes on the photodegradation and ultraviolet-visible absorbance of terrestrial dissolved organic matter. Limnol. Oceanogr. 51, 2181–2186. doi: 10.4319/lo.2006.51.5.2181
Mooshammer M., Wanek W., Jones S. H., Richter A., Wagner M. (2021). Cyanate - a low abundance but actively cycled nitrogen compound in soil. Commun. Earth Environ. 2, 161. doi: 10.1101/2020.07.12.199737
Mopper K., Kieber D. J., Stubbins A. (2015). “Marine photochemistry of organic matter,” in Biogeochemistry of Marine Dissolved Organic Matter. Eds. Hansel D. A., Carlson C. A. (The Netherlands: Elsevier), 389–450.
Pachiadaki M. G., Sintes E., Bergauer K., Brown J. M., Record N. R., Swan B. K., et al. (2017). Major role of nitrite-oxidizing bacteria in dark ocean carbon fixation. Science 358, 1046–1051. doi: 10.1126/science.aan8260
Palatinszky M., Herbold C., Jehmlich N., Pogoda M., Han P., von Bergen M., et al. (2015). Cyanate as an energy source for nitrifiers. Nature 524, 105–108. doi: 10.1038/nature14856
Palenik B., Brahamsha B., Larimer F. W., Land M., Hauser L., Chain P., et al. (2003). The genome of a motile marine Synechococcus. Nature 424, 1037–1042. doi: 10.1038/nature01943
Purcarea C., Ahuja A., Lu T., Kovari L., Guy H. I., Evans D. R. (2003). Aquifex aeolicus aspartate Transcarbamoylase, an enzyme specialized for the efficient utilization of unstable carbamoyl phosphate at elevated temperature. J. Biol. Chem. 278, 52924–52934. doi: 10.1074/jbc.M309383200
Qian M., Eaton J. W., Wolff S. P. (1997). Cyanate-mediated inhibition of neutrophil myeloperoxidase activity. Biochem. J. 326, 159–166. doi: 10.1042/bj3260159
Riemann L., Azam F. (2002). Widespread N-Acetyl-D-Glucosamine uptake among pelagic marine bacteria and tts ecological implications. Appl. Environ. Microb. 68, 5554–5562. doi: 10.1128/AEM.68.11.5554-5562.2002
Rocap G., Larimer F. W., Malfatti J., Malfatti S., Chain P., Ahlgren N. A., et al. (2003). Genome divergence in two Prochlorococcus ecotypes reflects oceanic niche differentiation. Nature 424, 1042–1047. doi: 10.1038/nature01947
Sáez L. P., Cabello P., Ibáñez M. I., Luque-Almagro V. M., Roldán M. D., Moreno-Vivián C. (2019). Cyanate assimilation by the alkaliphilic cyanide-degrading bacterium Pseudomonas pseudoalcaligenes CECT5344: Mutational Analysis of the cyn Gene Cluster. Int. J. Mol. Sci. 20, 3008. doi: 10.3390/ijms20123008
Santos L., Santos E. B. H., Dias J. M., Cunha A., Almeida A. (2014). Photochemical and microbial alterations of DOM spectroscopic properties in the estuarine system Ria de Aveiro. Photoch. Photobio. Sci. 13, 1146–1159. doi: 10.1039/c4pp00005f
Sato M., Hashihama F., Takeda S. (2022). Effects of cyanate enrichment on growth of natural phytoplankton populations in the subtropical Pacific. J. Oceanogr. 79, 1–12. doi: 10.1007/s10872-022-00658-1
Scanlan D. J. (2012). “Marine picocyanobacteria,” in Ecology of cyanobacteria II: Their diversity in space and time. Ed. Whittom B. A. (Berlin, Germany: Springer Science + Business media B.V), 503–533.
Scanlan D. J., Ostrowski M., Mazard S., Dufresne A., Garczarek L., Hess W. R., et al. (2009). Ecological genomics of marine picocyanobacteria. Microbiol. Mol. Biol. Rev. 73, 249–299. doi: 10.1128/MMBR.00035-08
Seidel M., Vemulapalli S. P. B., Mathieu D., Dittmar T. (2022). Marine dissolved organic matter shares thousands of molecular formulae yet differs structurally across major water masses. Environ. Sci. Technol. 56, 3758–3769. doi: 10.1021/acs.est.1c04566
Selden C. R., Chappell P. D., Clayton S., Macías-Tapia A., Bernhardt P. W., Mulholland M. R. (2021). A coastal N2 fixation hotspot at the Cape Hatteras front: Elucidating spatial heterogeneity in diazotroph activity via supervised machine learning. Limnol. Oceanogr. 66, 1832–1849. doi: 10.1002/lno.11727
Sipler R. E., Bronk D. A. (2015). “Dynamics of dissolved organic nitrogen,” in Biogeochemistry of marine dissolved organic matter, Eds. Hansel D. A., Carlson C. A. (Amsterdam, The Netherlands: Elsevier B.V.) 127–232.
Sleighter R. L., Hatcher P. G. (2008). Molecular characterization of dissolved organic matter (DOM) along a river to ocean transect of the lower Chesapeake Bay by ultrahigh resolution electrospray ionization Fourier transform ion cyclotron resonance mass spectrometry. Mar. Chem. 110, 140–152. doi: 10.1016/j.marchem.2008.04.008
Stein L. A. (2015). Microbiology: Cyanate fuels the nitrogen cycle. Nature 524, 43–44. doi: 10.1038/nature14639
Sun L., Qian J., Blough N. V., Mopper K. (2015). Insights into the photoproduction sites of hydroxyl radicals by dissolved organic matter in natural waters. Environ. Sci. Technol. Lett. 2 (12), 352–356. doi: 10.1021/acs.estlett.5b00294
Ustick L. J., Larkin A. A., Garcia C. A., Garcia N. S., Brock M. L., Lee J. A., et al. (2021). Metagenomic analysis reveals global-scale patterns of ocean nutrient limitation. Science 372, 287–291. doi: 10.1126/science.abe6301
Waterbury J. B., Watson S. W., Valois F. W., Franks D. G. (1986). Biological and ecological characterization of the marine unicellular cyanobacterium Synechococcus. Can. Bull. Fish Aquat. Sci. 214, 71–120.
Widner B., Fuchsman C. A., Chang B. X., Rocap G., Mulholland M. R. (2018a). Utilization of urea and cyanate in waters overlying and within the eastern tropical north Pacific oxygen deficient zone. FEMS Microbiol. Ecol. 94, fiy138. doi: 10.1093/femsec/fiy138
Widner B., Mordy C. W., Mulholland M. R. (2018b). Cyanate distribution and uptake above and within the Eastern Tropical South Pacific oxygen deficient zone. Limnol. Oceanogr. 63, 177–192. doi: 10.1002/lno.10730
Widner B., Mulholland M. R. (2017). Cyanate distribution and uptake in North Atlantic coastal waters. Limnol. Ooceanogr. 62, 2538–2594. doi: 10.1002/lno.10588
Widner B., Mulholland M. R., Mopper K. (2016). Distribution, sources, and sinks of cyanate in the coastal North Atlantic Ocean. Environ. Sci. Technol. Lett. 3, 297–302. doi: 10.1021/acs.estlett.6b00165
Widner B. (2016). The marine cyanate cycle [doctoral dissertation] (Norfolk (VA): Old Dominion University).
Widner B., Mulholland M. R., Mopper K. (2013). Chromatograhic determination of nanomolar cyanate concentrations in Estuaine and Sea Waters by precolumn fluorescence derivatization. Anal. Chem. 85, 6661–6666. doi: 10.1021/ac400351c
Xie Z., He Y., Wang M., Zhang S., Kong L., Lin L., et al. (2020). Dissecting microbial community structure and metabolic activities at an oceanic deep chlorophyll maximum layer by size-fractionated metaproteomics. Prog. Oceanogr. 188, 102439. doi: 10.1016/j.pocean.2020.102439
Yamashita Y., Scinto L. J., Maie N., Jaffé R. (2010). Dissolved organic matter characteristics across a subtropical wetland’s landscape: application of optical properties in the assessment of environmental dynamics. Ecosystems 13, 1006–1019. doi: 10.1007/s10021-010-9370-1
Zhao Z., Gonsior M., Luek J., Timko S., Ianiri H., Hertkorn N., et al. (2017). Picocyanobacteria and deep-ocean fluorescent dissolved organic matter share similar optical properties. Nat. Commun. 8, 15284. doi: 10.1038/ncomms15284
Zhu Y., Mulholland M. R., Macías T. A., Echevarría M. A., Pérez V. E., Bernhardt P. (2023). Cyanate dynamics under algal blooms and sediment resuspension events in a shallow micro-tidal estuary in the lower Chesapeake Bay. Estuar. Coast. Shelf S. 281, 108188. doi: 10.1016/j.ecss.2022.108188
Keywords: cyanate, photochemical degradation of dissolved organic matter, Synechococcus sp. CB0110 exudates, nitrogen-containing compound, DOM, marine nitrogen cycle
Citation: Wang R, Liu J, Xu Y, Liu L and Mopper K (2024) Unraveling sources of cyanate in the marine environment: insights from cyanate distributions and production during the photochemical degradation of dissolved organic matter. Front. Mar. Sci. 11:1373643. doi: 10.3389/fmars.2024.1373643
Received: 20 January 2024; Accepted: 21 February 2024;
Published: 14 March 2024.
Edited by:
Junfu Dong, Shandong University, ChinaCopyright © 2024 Wang, Liu, Xu, Liu and Mopper. This is an open-access article distributed under the terms of the Creative Commons Attribution License (CC BY). The use, distribution or reproduction in other forums is permitted, provided the original author(s) and the copyright owner(s) are credited and that the original publication in this journal is cited, in accordance with accepted academic practice. No use, distribution or reproduction is permitted which does not comply with these terms.
*Correspondence: Kenneth Mopper, a21vcHBlckBvZHUuZWR1; Jihua Liu, bGl1amlodWExOTgyQGZveG1haWwuY29t