 Mengyao Ma
 Lucas Porz
 Corinna Schrum
 Wenyan Zhang
- 1Institute of Coastal Systems – Analysis and Modeling, Helmholtz-Zentrum Hereon, Geesthacht, Germany
- 2Institute of Oceanography, Center for Earth System Research and Sustainability, University of Hamburg, Hamburg, Germany
The formation and dynamics of individual estuarine turbidity maximum (ETM) in the Pearl River estuary (PRE) have been investigated but the temporal variability of the ETMs and interconnections among them remain poorly understood. To address these open questions, the distribution and transport of suspended particulate matter (SPM) in the PRE for the period of 2017–2020 are investigated by numerical modeling. The simulated sediment transport flux is decomposed into several major components associated with specific physical processes. Then, the relative contribution of each component to the formation of the ETMs is evaluated. Results suggest the coexistence of three prominent ETMs in the Lingding Bay of the PRE. They are formed by different physical mechanisms and characterized by remarkable seasonality in the spatial extension. In the two ETMs located at the west shoal and middle shoal, advection dominates the sediment transport flux, whilst tidal pumping plays a crucial role in maintaining the ETMs. A sharp bathymetric gradient leads to an entrapment of sediment flux within the bottom layer in the west channel ETM, a phenomenon referred to as topographical trapping. The interconnection analysis shows that the sediment transport between the ETMs varies with seasons, which is attributed to the variation of stratification driven by the monsoon-mediated river runoff. Our results provide new insights into the physical dynamics and interconnections of the ETMs in the PRE, which can serve as scientific base for estuarine sediment management and engineering.
1 Introduction
Estuaries, as part of the transition zone between land and ocean, are highly dynamic in terms of physical transport and biogeochemical cycling. They serve as transient or long-term sinks of sediments delivered by river runoff and tidal currents. Estuarine turbidity maxima (ETMs) are zones of elevated concentration of suspended sediments that often occur in estuaries, and exert a significant influence on the morphological development, biogeochemical cycling, and contaminant redistribution of estuaries (Wai et al., 2004; Etcheber et al., 2007; Cheng et al., 2013; Zhang et al., 2020; Moriarty et al., 2021).
ETMs are often located near the head of the salt intrusion where the suspended sediment concentration (SSC) is higher than that in the upstream and downstream sides of the estuary (Dyer, 1988). However, the SPM dynamics in the ETMs exhibit significant differences among estuaries, depending on local topography, fluvial, and tidal forcing. The formation of ETMs can be attributed to estuarine gravitational circulation, tidal pumping and straining, sediment resuspension and settling, river discharge, and topographical trapping (Burchard et al., 2018). Among all driving factors, tidal pumping is often reported as the dominant factor for ETM formation, which has been reported in well-mixed macrotidal estuaries (Yu et al., 2014), partially stratified estuaries (Scully and Friedrichs, 2007) and highly stratified estuaries (Garel et al., 2009). Tidal pumping denotes the barotropic, tide-induced transport of suspended sediment. It is considered to be mainly caused by tidal current asymmetry between the ebb and flood phase, and sediment lag effects (Uncles and Stephens, 1989; Brenon and Le Hir, 1999; Scully and Friedrichs, 2007). The latter refers to the phase lag between the velocity and the variation of SSC during the flood and ebb phase (Sommerfield and Wong, 2011). Tidal trapping occurs when the cross-sectionally averaged velocity and SPM signals are out of quadrature (MacVean and Stacey, 2011).
In estuaries with distinct seasonal variations in river runoff, variation of the ETM is also characterized by seasonality. For instance, in the Changjiang River, the ETM is located further upstream and with higher concentration in the dry season than in the wet season since the relative impact of tide currents is more significant in the dry season due to reduced river runoff (Hua et al., 2020). Seasonal enhancement of stratification due to increased river runoff can influence the concentration of the ETM by suppressing turbulence, which leads to a rapid accumulation of sediment near the bottom, as reported by Geyer (1993). In addition, seasonal change of wind-induced currents can also cause a landward or seaward shift of the ETM (Rao et al., 2011). In an idealized convergent partially mixed estuary investigated by Gong et al. (2023), it was demonstrated that the down-estuary wind enhances estuarine circulation and salt intrusion, thereby shifting the ETM landward and increasing SSC through an increase in bottom stress. Existing observations in numerous estuaries demonstrate that ETMs are not necessarily correlated with the limits of stratification or tidal propagation. Some ETMs appear to be spatially locked and are associated with bathymetric transitions (Burchard et al., 2018). Examples are seen in the Chesapeake Bay (North and Houde, 2001) and the Danshui River (Chen et al., 2015). Formation of ETMs due to topography-induced sediment convergence and enhanced deposition are also noted in the San Francisco Bay (Schoellhamer, 2000) and the Hudson River Estuary (Ralston et al., 2012).
In estuaries characterized by multiple ETMs, the response to a change in river runoff, tidal forcing, temperature, and salinity change may vary among the ETMs. For instance, a double ETM structure in the Nam Trieu estuary was found by Vinh and Ouillon (2021), with the downstream part of the double ETM resulting from gravitational circulation and the upstream part driven by tidal pumping.
The Pearl River Estuary (PRE) is the second largest river in terms of water discharge and the third largest river in terms of sediment loading in China (Liu et al., 2018). A rapid development of the economy and associated human activities, such as channel dredging, sand mining, and land reclamation, have caused an irreversible change in the estuarine circulation, stratification, and morphological change of the PRE during the past few decades (Ma et al., 2023). In the PRE, it has been reported that the formation of ETM is influenced by a combined effect of tides, river discharge, and topography, wherein sediment resuspension dominates the variation of ETM (Liu et al., 2016; Cui et al., 2022). According to existing observations, multiple ETMs are found in the upper and lower parts of the PRE (Wai et al., 2004; Yang and Liu, 2015b; Liu et al., 2016; Cui et al., 2022). ETMs in the upper estuary were observed between Qi’ao Island and Neilingding Island (Figure 1). The intensity and extent of the ETMs are weaker during the wet season than during the dry season as a result of variation of stratification, and the center of the ETMs moves upstream following the movement of salt wedge by a distance of ~10 km during wet seasons (Liu et al., 2016). Based on the analysis of observation data, Wai et al. (2004) proposed that gravitational circulation and tidal pumping are the principal formation mechanisms of the ETMs. However, a model study conducted by Liu et al. (2016) argued that sediment resuspension and vertical circulation are the major controlling factors of the ETMs in the upper estuary. In the lower estuary, an ETM was observed close to the west channel, in the west of Lantau island, in the wet season (Cui et al., 2022). In this ETM, particle resuspension induced by tidal pumping and straining significantly increases the concentration of SPM in the bottom layer.
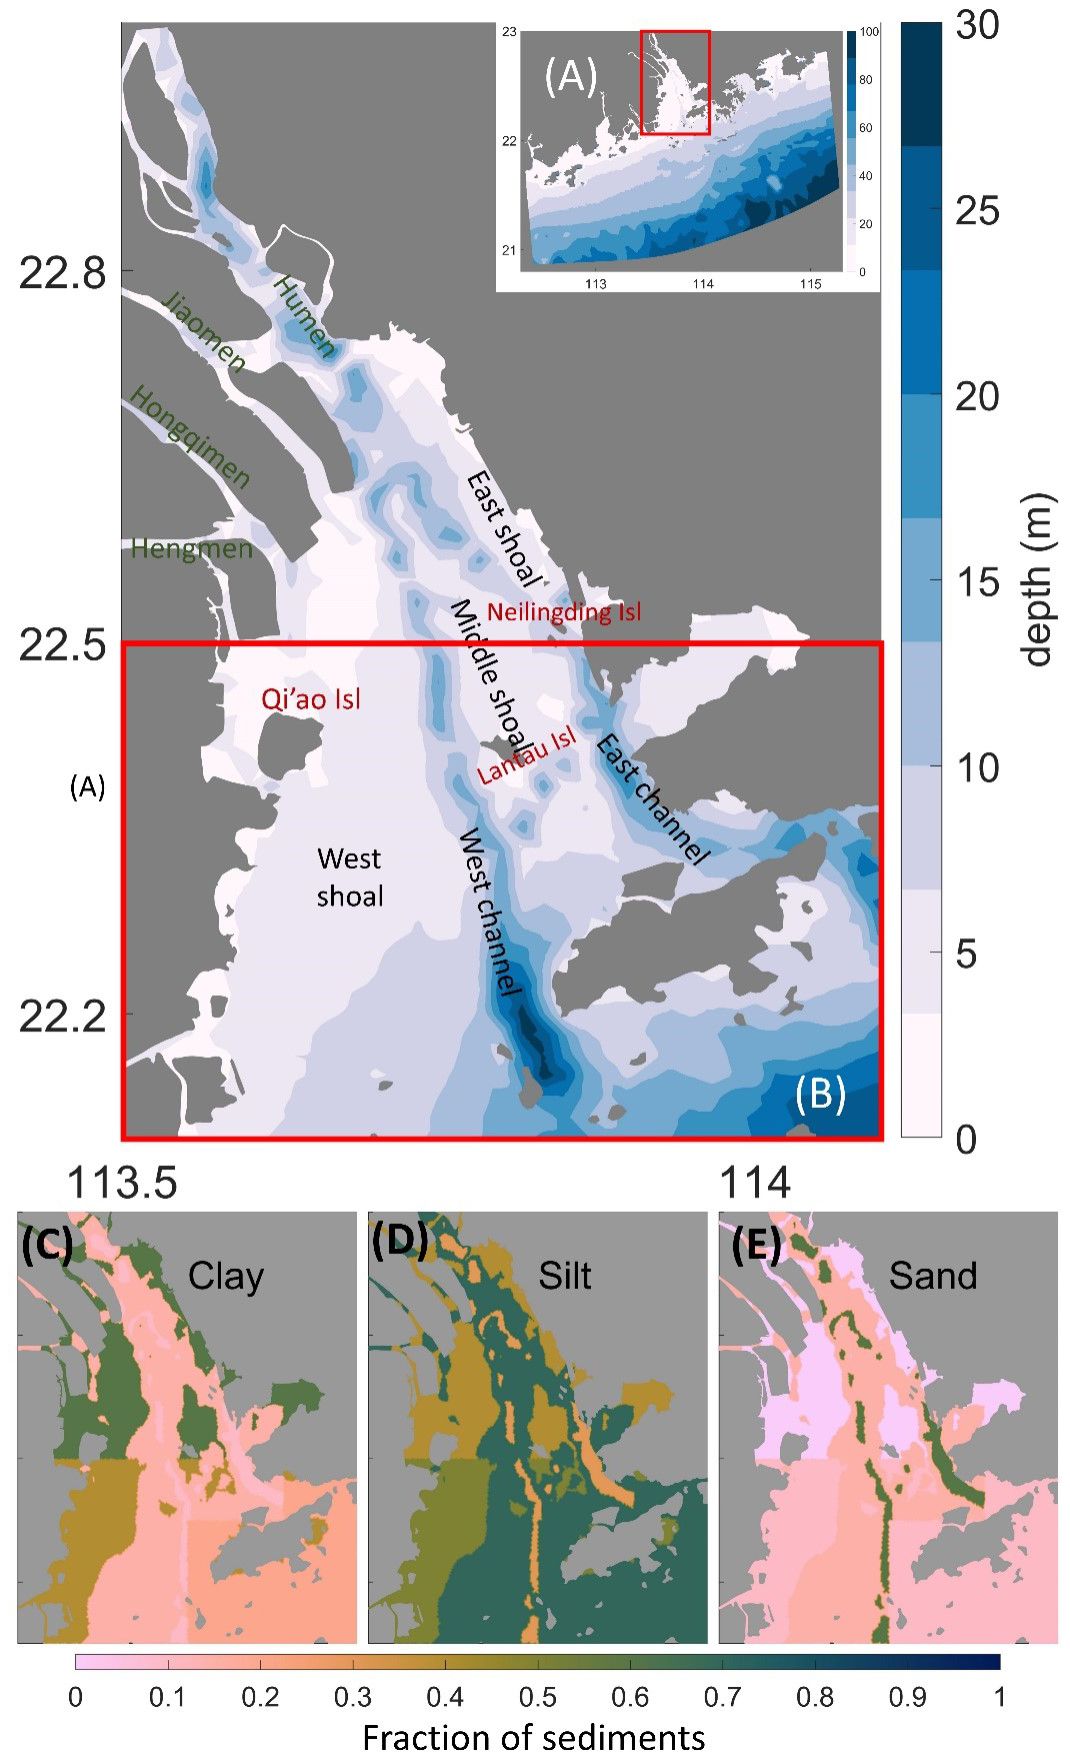
Figure 1 (A) The study area. The red box indicates the range of the Lingding Bay. The topographical features of the Lingding Bay are shown in (B), the red box indicates the focus area in this study. The sediment map shows the spatial distribution of clay (C), silt (D), and sand (E), respectively. Sediment data stem from Zhang et al. (2019) for the Lingding Bay and from Wang and Li (2014) for the outer estuary and shelf area.
In addition to the gravitational circulation and tides, complex geographical and topographical features of many estuaries exert a non-negligible influence on the dynamics of ETMs, including the sediment exchange between different geographical units (Leuven et al., 2019; Zhang et al., 2021a; Teng et al., 2022; Wang et al., 2022). The PRE is featured by a channel-shoal system superposed by various obstacles such as outcrops and islands (Figure 1). It has been reported that the lateral sediment flux from the channel to the west shoal leads to a large depositional rate (3.0–5.0 cm yr-1) at the western part of the estuary, together with the formation of an ETM (Zhang et al., 2021a). However, according to our knowledge, there is no study investigating the dynamics of the ETMs across multiple time scales (from tides to multiple years) and potential interconnections between the ETMs in the PRE. Given the large natural topographic variation that is further complicated by intensive human activities and sea level rise (Yuan et al., 2015; Wu et al., 2016; Lin et al., 2021), a comprehensive understanding of the spatio-temporal dynamics of ETMs becomes increasingly vital.
In this study, we aim to fill the knowledge gap in understanding the spatio-temporal dynamics of ETMs across multiple time scales from tides, to multiple years and potential interconnections between the ETMs in the PRE. We applied a high-resolution 3-dimensional hydrodynamics-sediment transport model to investigate the sediment transport and dynamics of ETMs in the PRE from 2017 to 2020. Based on model validation by observation, we decomposed the simulated sediment transport into major components associated with specific physical mechanisms to identify the relative contribution and variability of the drivers. We then investigated the stability/variability of the ETMs and their future fates associated with climate change. The derived conclusions may help to inform coastal and estuarine spatial planning strategies in the context of climate change mitigation.
2 Study area
The PRE, with its major part located in the Lingding Bay, is situated in the south of China, connecting to the South China Sea (Figure 1). Morphology of the Lingding Bay is generally characterized by three distinct shoals separated by two navigation channels, namely the east channel and the west channel. The west shoal has the most extensive area and is proximate to the trio of Pearl River outlets, designated as Jiaomen, Hongqimen, and Hengmen, arrayed from north to south, respectively. The suspended sediment in the PRE has a mean concentration of ~200 mg L-1 and an annual flux of about 30 million tons, of which more than 90% is discharged during the wet season. About 80% of the discharged sediment is deposited within the estuary, and the rest is transported offshore to the continental shelf (Wai et al., 2004).
The characteristics of suspended sediment in terms of particle size and settling velocity spread over a wide spectrum in the PRE. The median grain size of suspended sediments is reported to vary between 10 and 100 and the settling velocity is between 0.001 and 0.02 cm s-1 (Xia et al., 2004). Sediment distribution map shows that the abundance of clay (diameter< 2 ) is generally low in most areas except near the northeast and southwest coasts, while silt (diameter between 2 and 63 ) is abundant in the whole PRE except for the waterways and channels, where the bottom is mostly (>70%) covered by sands (Figures 1D, E).
The tides in the PRE are of asymmetric, semi-diurnal and partially mixed type in which the tidal fluctuations between two consecutive tides may have different amplitudes. The tidal range is between 1.0 and 1.7 m in a major part of the estuary, with maximum value up to 3.7 m in some local parts (Mao et al., 2004). A gradual increase in the flood-to-ebb duration ratio is observed downstream and eastward, with a notable dependency of tidal duration asymmetry on river discharge rates. A substantially increased river discharge amplifies the ebb duration during the wet seasons (Mao et al., 2004).
3 Methods and data
3.1 Numerical model
3.1.1 Hydrodynamic setup
We applied the Semi-implicit Cross-scale Hydrodynamic Integrated System Model (SCHISIM) (Zhang et al., 2016). SCHISM solves the Reynolds averaged Navier-Stokes equations using unstructured grids, which allow us to adequately account for coastal dynamics over the complex topography with fine spatial resolution. Effect of wind-waves is included in SCHISM though a coupling to the third-generation, unstructured-grid Wind Wave Model III (WWM III).
The model domain covers the PRE and its eight river outlets spanning from 21 to 23°N in latitude and 112.4 to 115.25°E in longitude (Figure 1A). The grid resolution is ~50 m in the Lingding Bay and gradually coarsens to approximately 1000 at the open boundary on the South China Sea shelf. The vertical plane is divided into 26 maximum layers. A terrain-following grid is employed near the bottom of the model domain. The number of vertical layers is different between shallow and deep water. In shallow water, the number of vertical layers is reduced, for instance, to a single layer in areas with depth less than 0.4 m. Whilst the number of layers becomes increasingly larger in deeper water, until reaching 26 layers in the deepest cell (~100 m) of the model domain. To ensure a high-resolution modeling for the bottom transport, the vertical grid has been designed with a resolution of approximately 0.5 m for the bottom-most layer throughout the entire model domain. The open boundary is forced by 8 major tidal constituents (M2, S2, N2, K2, K1, O1, P1, Q1) superposed by the regional circulation provided by the CMEMS product (doi.org/10.48670/moi-00021). Monthly discharge rates were specified at each of the river outlets. The ECMWF ERA5 reanalysis was used as atmospheric forcing. The model was used to reproduce hydrodynamics and sediment transport from July 2017 to September 2020. A detailed model configuration for hydrodynamics is provided in Ma et al. (2023), including the validation of water level variation and velocity field.
3.1.2 Sediment setup
The sediment model (SED3D) integrated into SCHISM, described in detail in Pinto et al. (2012), is adapted from the Community Sediment Transport Model (Warner et al., 2008). The sediment model calculates erosion, deposition, suspended load, and bed load transport of multiple sediment classes. Classes of suspended sediment are represented by tracer concentration values with sinking velocities dependent on grain size. The transport of these particles is managed by the implicit schemes of the hydrodynamic core. In this study, the critical shields parameter from Soulsby (1997) was used to specify the threshold for erosion of each sediment class. Bed load transport is neglected since it does not contribute to the dynamics of SPM and the formation of ETMs.
We implemented three sediment classes, namely clay, silt, and fine sands (Table 1), according to the sediment map from Zhang et al. (2019) for the Lingding Bay and that from Wang et al. (2014) for the outer estuary and shelf area. The initial fraction of each sediment class (Figures 1C–E) in the seabed was specified according to the compiled sediment map.
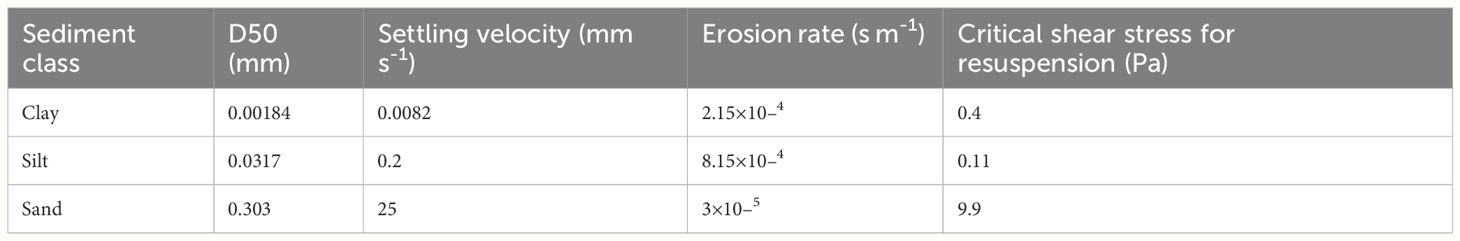
Table 1 Configuration of sediment classes in the model.
At the river boundary, the monthly sediment loading data obtained from the Sediment Report of China (http://www.mwr.gov.cn/sj/tjgb/zghlnsgb/) were implemented. In order to distinguish the source of SPM in the model domain, six sediment classes were defined in the simulation. These included three classes (clay, silt, and fine sand) explicitly delivered by river discharge during the simulation period, and three classes (clay, silt, and fine sand) initially from the local seabed in the study area.
with the intention of exploring the interconnections between the ETMs in the PRE, an additional dedicated model experiment was performed in which erodible silt (Table 1) is placed at the seabed of three sites where the nucleus of the three ETMs are located, as illustrated in Figure 2. Meanwhile, other parts of the seabed are specified as hard bottom and sediment input from the rivers, and the open boundary is set to zero, ensuring that there are no other sediment sources for the ETMs. The silt placed at each site is classified as an independent sediment class (e.g. silt from the TM_shoalw is labeled as Silt_TM_shoalw) despite that the same physical properties (Table 1) are used so that the transport of each class can be traced individually and their relative contribution to the ETMs can be quantified. The simulation period also covers the time from July 2017 to September 2020.
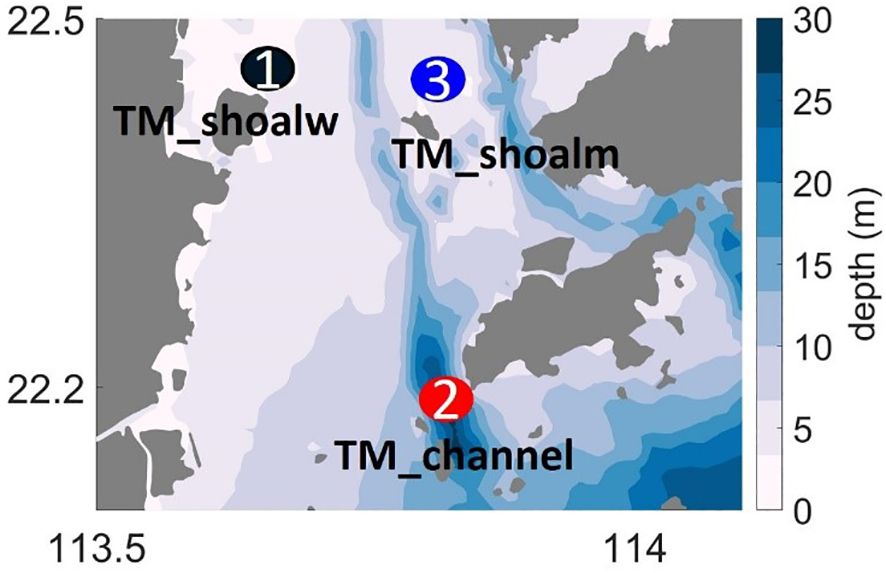
Figure 2 Location of the sites where erodible silt is placed in the experiment for analysis of interconnections between the ETMs.
3.2 Data
Observation data provide important means for parameterization, initialization, calibration and validation of the model.
In General, fine-grained sediment can be classified into three-grain size classes, namely clay (0–0.004 mm), silt (0.004–0.063 mm), and sand (0.063–2 mm) according to Shepard (1954). In this study, the exact grain size of each class is configured (Table 1) based on observations from Xia et al. (2004) and Zhang et al. (2019). The settling velocity and erosion rate for each class are obtained from Xia et al. (2004) and Arlinghaus et al. (2022). For the erosion rate and critical shear stress of each class, the general formula by Winterwerp et al. (2012) are applied.
Data from Zhang et al. (2019) show that the area exhibits low clay abundance, with exceptions near the northeast and southeast coastlines. The sediment map exhibits a high abundance of silt, which is present throughout the PRE, with the exception of the channels, which are dominated by sand. The sand content exceeds 70% in channels.
The time series observation of SPM on 25–26 August 2018 at a site on the west shoal (Zhang et al., 2020) was used to calibrate the sediment model. The available data for the validation of the location of ETMs were obtained from a number of sources (Yang and Liu, 2015a; Liu et al., 2016; Cui et al., 2022). The distribution of SPM and salinity of a transect was utilized to validate the model result, which was derived from Cui et al. (2022). A full list of data sources is provided in Table 2.
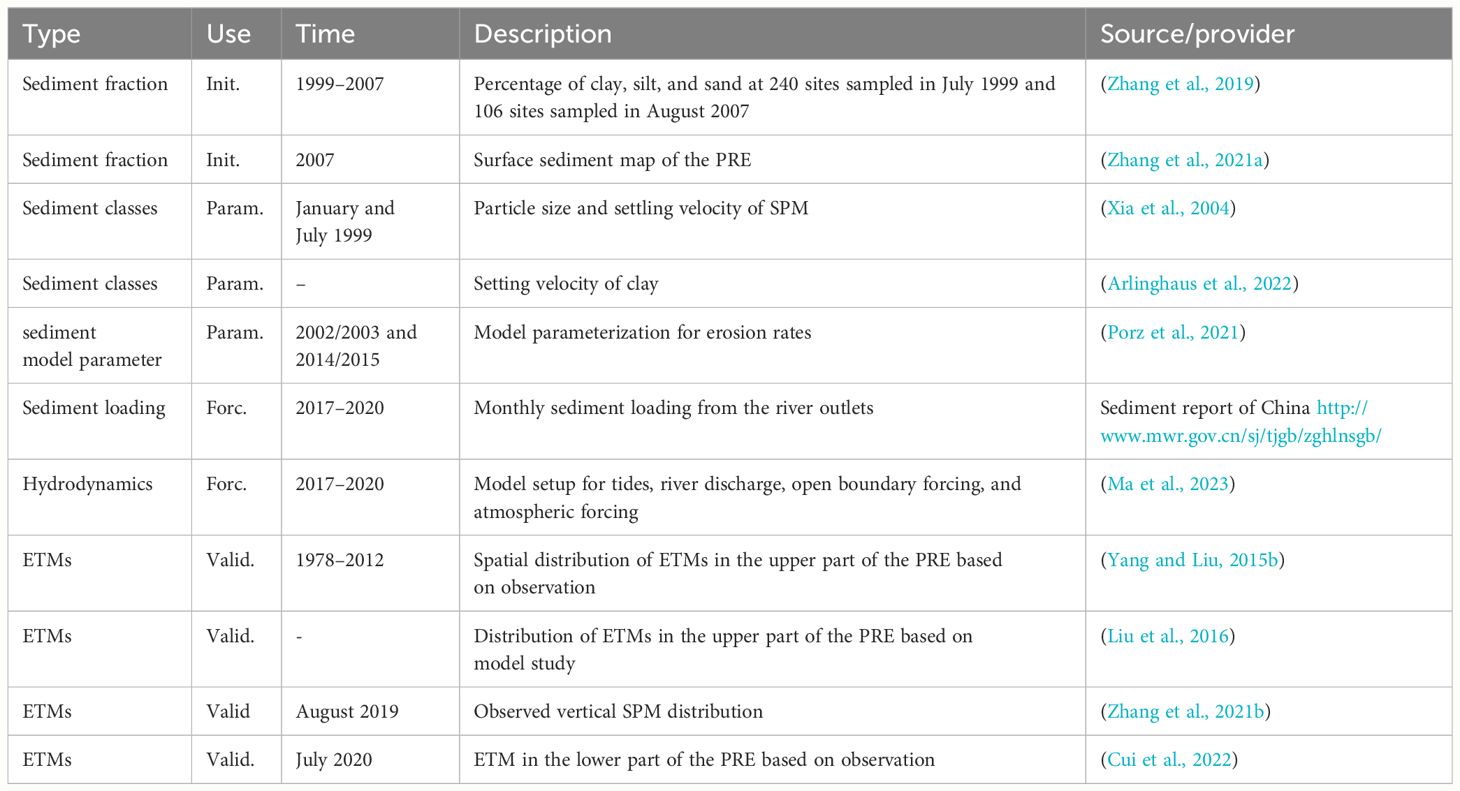
Table 2 Data sources used for model initialization (Init.), setup parameterization (Param.), forcing (Forc.), and model validation (Valid.).
3.3 Decomposition of sediment transport
Based on the analytical method of mass transport flux proposed by Dyer (1974), and using the relative depth as a vertical coordinate instead of absolute depth, Jilan and Kangshan (1986) decomposed cross-sectional currents for analysis of respective forcing. The same method was applied by (Wai et al., 2004) to investigate tidally averaged sediment transport, the sediment transport was decomposed into non-tidal drift, stokes drift, tidal pumping, vertical gravitational circulation, and a term resulting from scouring and settling activities.
Utilizing the aforementioned decomposition methodology, the terms derived from the model results were reassessed in terms of their actual contribution to sediment transport. This re-evaluation process ensures a more accurate understanding of each term’s role within the sediment transport. We made the decomposition of sediment transportation as follows:
Sediment transport flux at each grid cell is calculated by:
Where is the sediment flux, h is the local water depth, η is the sea surface elevation, z is the vertical coordinate with zero at the mean sea level, is the current velocity with a vertical structure and is the SSC which also varies vertically.
h is composed of a tidally averaged value () and its deviation ):
The current velocity is composed of a vertical averaged value () and its deviation ():
where varies with time (e.g., tides). Thus is composed of a tidally averaged value and its deviation .
Thus, the combination of Equations 3, 4 allows for the decomposition of current velocity to be expressed as follows:
Following the method for velocity decomposition, the concentration of sediment can also be decomposed into similar terms:
The instantaneous sediment transport flux is calculated based on the decomposition of depth (Equation 2), current velocity (Equation 5), and SPM concentration (Equation 6). The resulting equation is as follow:
A complete decomposition of f (Equation 7) over a tidal cycle 〈〉 is approximated by seven major flux terms:
In Equation 8, the brackets 〈 〉 indicate the tidally averaged value, while the over bar symbol denotes the vertical average value. refers to the mean advective flux, accounts for the transport by stokes’ drift related to tides wave, and are the tidal pumping terms that arise from the phase lag between variables related to the tidal cycle, with negative values corresponding to the phase lag between variables beyond , refer to the vertical gravitational circulation related to the estuarine exchange flow and the change of water depth partly caused by sediment scouring and settling, respectively.
The sediment transport in a single model layer (assuming h = 1) in which both current velocity and sediment concentration are vertically uniform, Equation 1 is simplified as:
Following the aforementioned decomposition methodology, (Equation 9) in a single layer can be decomposed into:
The terms and are much smaller than the other three terms after being averaged over the tidal cycles, and therefore Equation 10 can be further simplified as:
We computed the transport flux and its major terms in the bottom-most model layer. The Equation 11 can be rewritten as follows:
where subscript b denotes the bottom layer, represents the mean advective transport, is the tidal pumping term corresponding to the phase lag transport between velocity and sediment concentration associated with sediment resuspension and settling. These terms collectively govern the sediment transport dynamics in the bottom layer, in which the nucleus of the ETMs is located.
4 Results
4.1 Model validation
The hydrodynamic model has been validated in terms of water level, salinity, and temperature by Ma et al. (2023). In this study, the simulated suspended sediment distribution and associated hydrodynamic parameters are compared to observations.
4.1.1 Location of ETMs
In accordance with previous studies (Wai et al., 2004; Cui et al., 2022), the areas where the SSC surpasses 100 mg L-1 near the bottom are designated as ETMs. Our model result shows three ETMs in Lingding Bay in the wet season (Figure 3). One of them is located on the West shoal to the northeast of Qi’ao Isl (named TM_shoalw hereafter) and one on the Middle shoal to the east of Neilingding Isl (named TM_shoalm hereafter). These two ETMs have been observed and described by Yang and Liu (2015b); Liu et al. (2016), and Zhang et al. (2021b), and confirmed by our model results. The modeled concentration of SPM in the TM_shoalw is generally greater than in the TM_shoalm, which has also been reported by existing literature. In addition to the two ETMs on the shoals, a third ETM is located in the western channel (named TM_channel hereafter, Figure 3). This ETM had not been reported until the observation by (Cui et al., 2022).
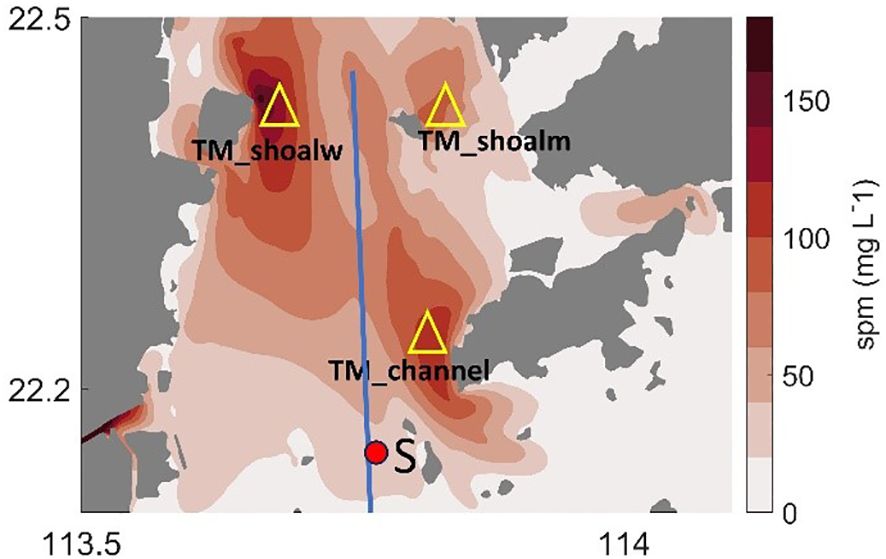
Figure 3 The spatial distribution of SSC in the bottom-most model layer in the wet season shows three ETMs in the study area in consistency with existing field observations. The blue line refers to the observation transect in Cui et al. (2022), and the red dot indicates the location of the site (S) where a lander was deployed in that study. Observation data from the transect and from site S were used to assess the model result.
Our simulation results are able to capture all three ETMs in the PRE that have been observed in the wet seasons in terms of spatial location and SSC level (Figure 3).
4.1.2 SPM dynamics
The assessment of simulated SPM dynamics is based on a comparison with observation data. Existing observations in the study area indicate that the distribution of SPM is constrained by salinity-induced stratification (Zhang et al., 2021b; Cui et al., 2022). The observation data shown in Figure 4A depicts the vertical profile of SPM along the transect, which exhibited a high concentration up to 300 mg L-1 in the bottom layer. The high concentration was observed at the salinity front. As illustrated in Figures 4B, C, the model output during the same period exhibited a similar distribution of salinity and SPM. The comparison between the modeled and observed distributions of salinity and SPM indicates that the model reproduced the observations with a reasonable degree of accuracy.
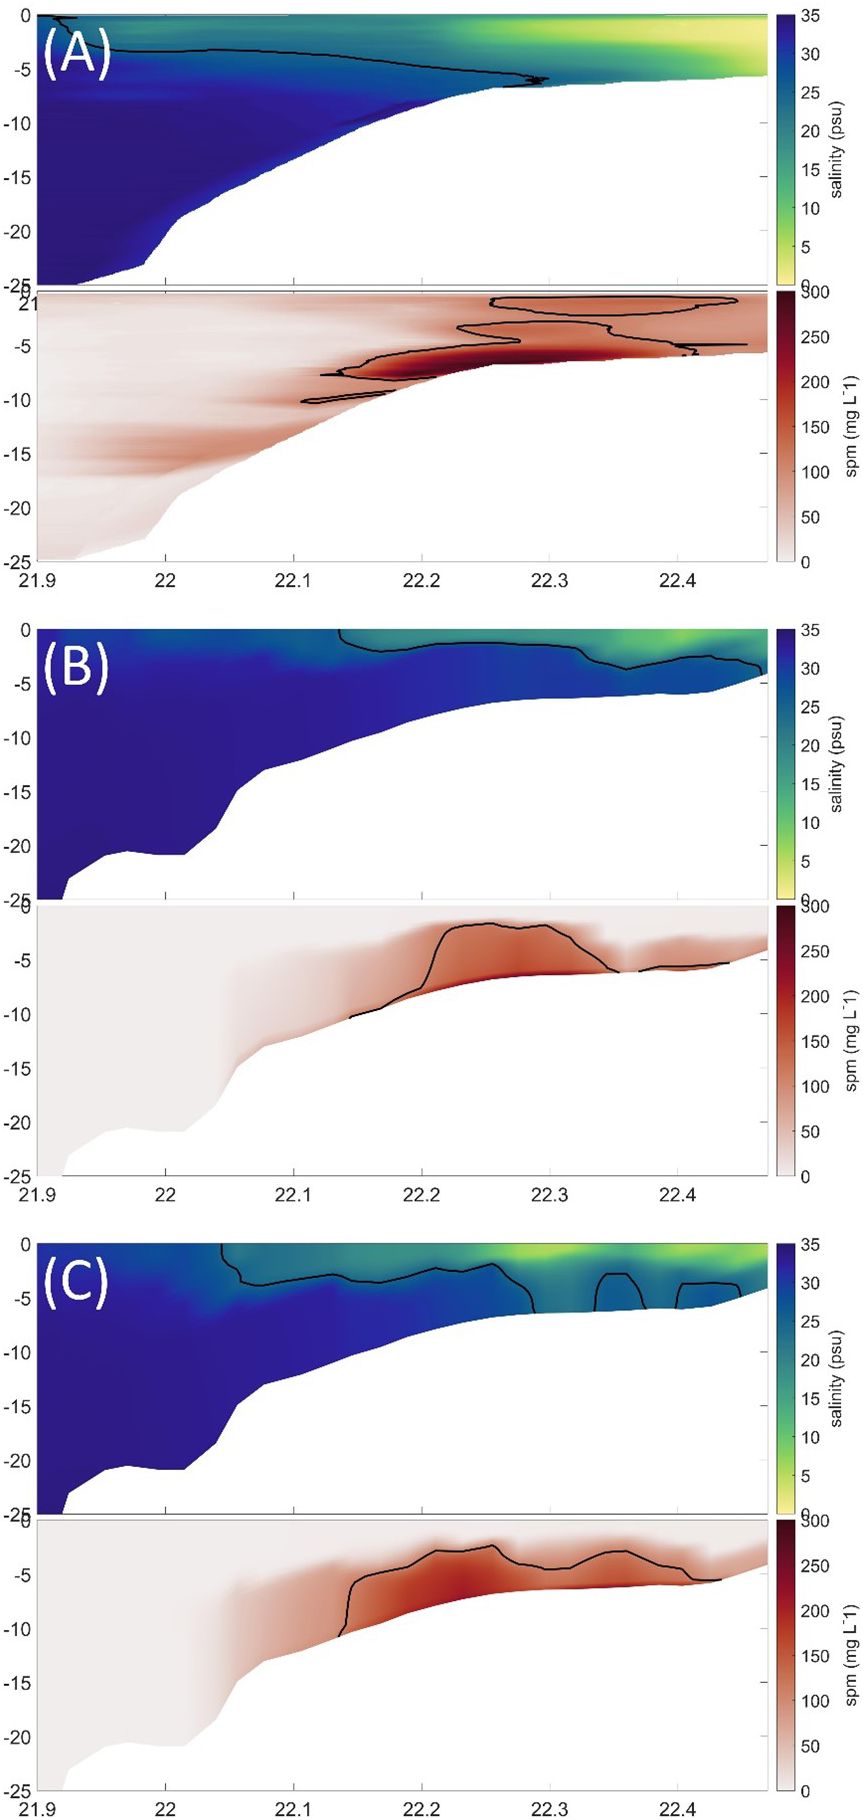
Figure 4 The distribution of sanility and SPM concentration along a transect in Lingding Bay. (A) Observed distribution of SPM concentration along the transect (during July 2020) by Cui et al., (2022). (B) and (C) snapshots of model results during a tidal cycle in the same day. The contour line of salinity of 25 psu and SPM concentration of 110 mg L-1 was marked by the black line in respective plots.
The time series of current velocity demonstrates the dominance of tidal cycles at the observation site S. The variation of salinity and SSC exhibit a strong connection with tidal cycles and additionally controlled by the two-layer flow (low-salinity fresh water above saline water), as evidenced by both model results and observations (Figure 5). Besides a background concentration of 50–100 mg L-1, enhanced near-bottom SPM concentration (150–200 mg L-1) appearing in pulses are induced exclusively by strong tidal currents during the flooding phase at site S. This variation is also captured by our simulation results. Model results indicate an elevated bed shear stress during the flooding phase (Figure 5G), suggesting a tidal pumping effect at this site.
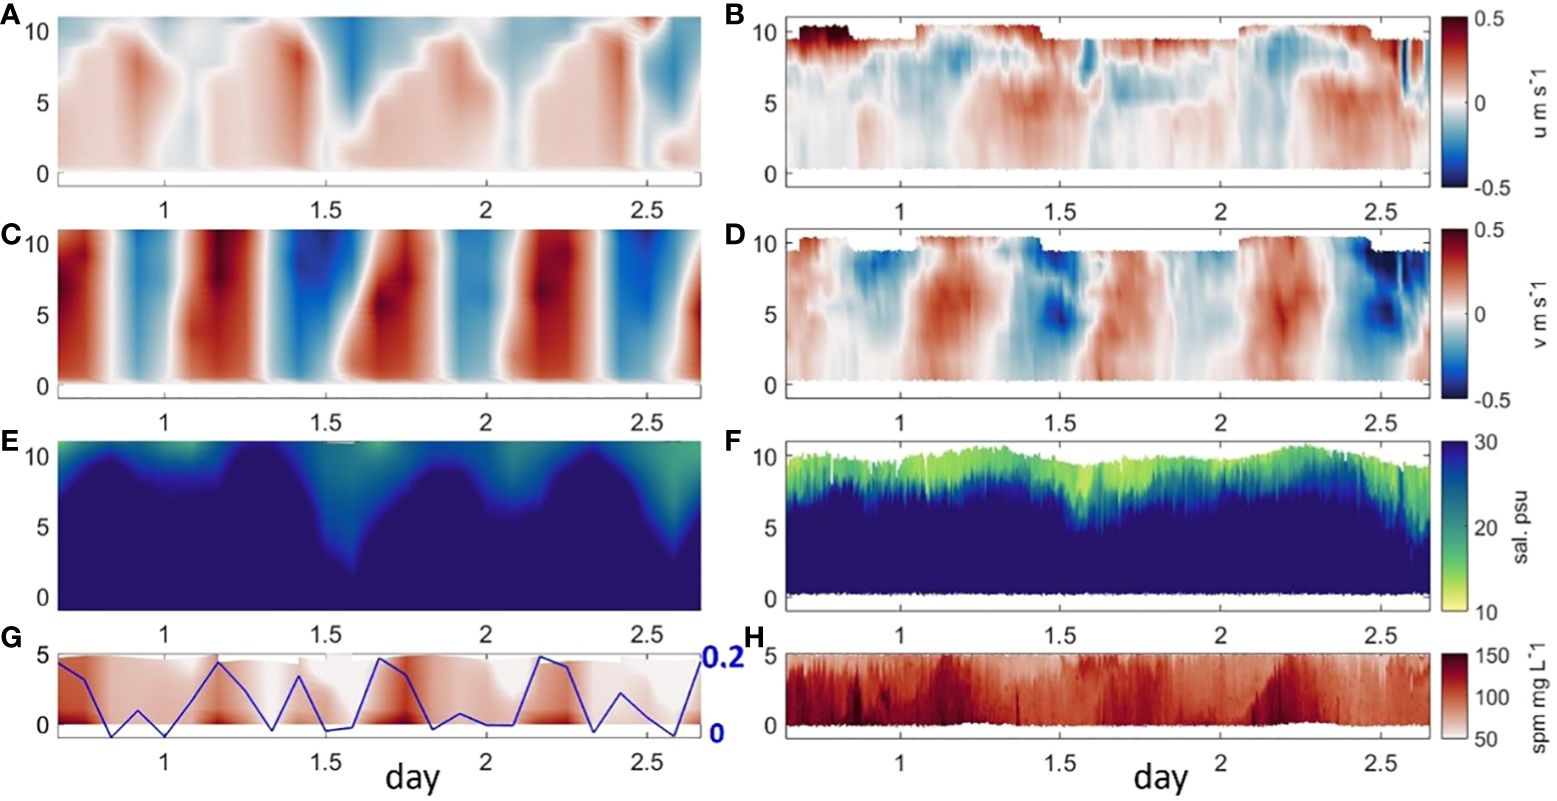
Figure 5 Vertical distribution of (A, B) eastward velocity u, (C, D) northward velocity v, (E, F) salinity, (G, H) SPM concentration at S site. The left panel is model result, and the right panel is observation data derived from (Cui et al., 2022). The solid line in (G) indicates simulated bed shear stress with axis on the right (unit: Pa).
4.2 Formation mechanisms and dynamics of the ETMs
The physical mechanisms and dynamics of the ETMs are featured by distinct seasonality in the PRE. To provide a clearer depiction of the variation of the ETMs, the contour line of 100 mg L-1 is defined as the boundary of an ETM.
4.2.1 Spatial distribution
Our simulation results show that the physical mechanisms for the formation of the TM_shoalw and TM_shoalm show high similarity (Supplementary Figures S2, S3). These two ETMs are both formed by the convergence of SPM delivered by fresh riverine water and saline oceanic water. The formation of the TM_channel is driven by a different mechanism compared to the other two. The location of the nucleus of the ETMs remains relatively stable, despite that they exhibit different extension and SSC between wet and dry seasons. To avoid redundant process descriptions, we focus on the elucidation of the TM_shoalw (which shares similarity with the TM_shoalm) and the TM_channel.
In the TM_shoalw, the spatial average SSC exceeds 170 mg L-1 in the wet season, with a reduced level in the dry season. Notably, the spatial extent of the ETM is more pronounced during the wet season, whilst the location of its nucleus remains unchanged (Figures 6C, D). This stability in the nucleus location is attributed to the confluence of fresh riverine water and saline oceanic water, forming a distinct salinity front along the western shoal in both seasons, as illustrated in (Figures 6A, B). The estuarine front traps SPM, primarily due to the suppression of turbulence by stratification (Geyer, 1993; Largier, 1993). TM_shoalw is consistently located to the shoreward side of the front (Ma et al., 2023), effectively trapping SPM from both riverine and oceanic sources. The higher concentration of TM_shoalw in the wet season results from the larger river flow and sediment loading, given that the wet season accounts for approximately 70% of river flow and 85% of the sediment load annually.
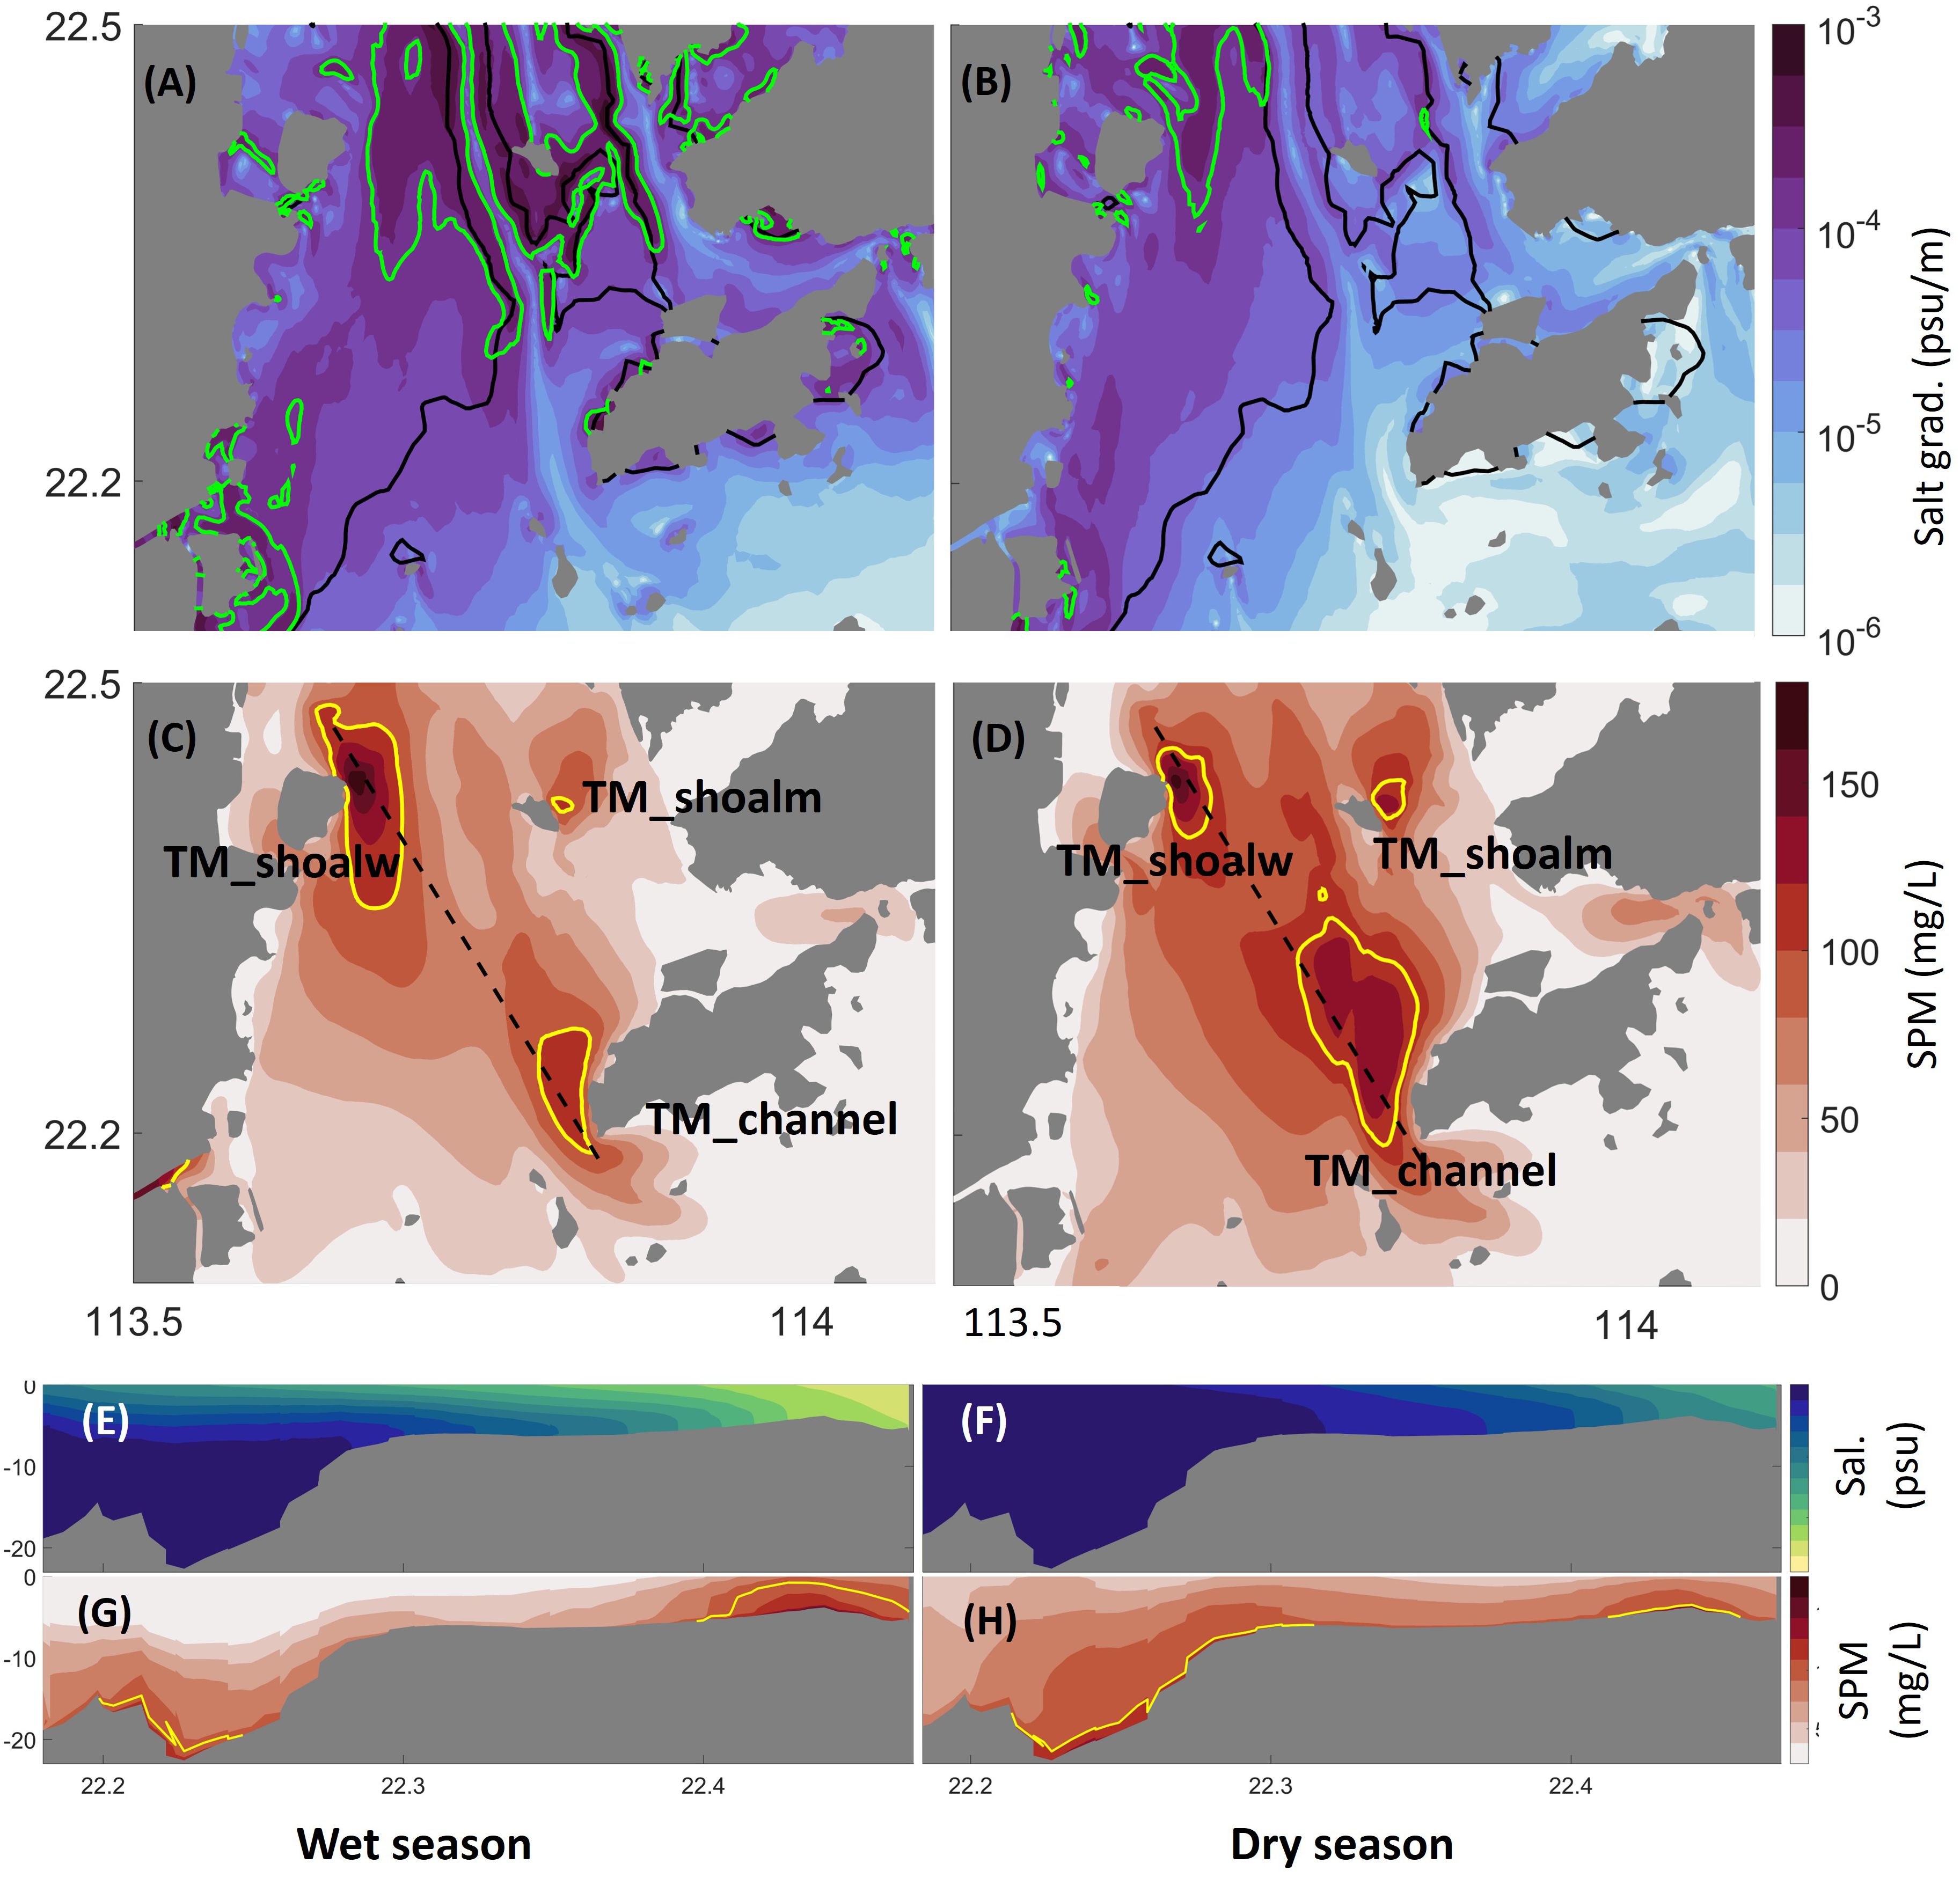
Figure 6 (A, B) Horizontal bottom water salinity gradient in the wet and dry seasons, respectively. The green line depicts the estuarine front according to Ma et al. (2023), and the green line marks the 7-m isobaths. (C, D) Seasonal average SSC in the bottom layer in the wet and dry seasons, respectively. The yellow lines mark the 100mg L-1 contours, and the dashed black line marks the transect which is plotted in (E–H). (E, G) show the distribution of salinity and SSC along the transect in the wet season, respectively. (F, H) are for the same parameters but for the dry season.
In the TM_channel, the average SSC is 120 mg L-1 and 133 mg L-1 during the wet and dry seasons, respectively. The lower SSC in the TM_channel than in the TM_shoalw is due to the smaller fraction of silt in the channel which serves as the main source of SPM. An enhanced stratification occurs in the channel area in the wet season (Figure 6), which is induced by the extensive river plume that suppresses the saline water to the channel (Ma et al., 2023). The stratification reduces turbulence greatly, resulting in lower SSC in the TM_channel in the wet season compared to the dry season (Figure 6). The stratification also affects the spatial extent of the TM_channel. In the wet season, the TM_channel is mainly restricted to the deeper channel, whereas it extends upstream and to the shoals during the dry season. This pattern is clearly different from the TM_shoalw, which shrinks in the dry season.
4.2.2 Residual current and sediment flux
A comparison between the residual current and the residual sediment flux provides insight into the physical mechanisms for the formation of the ETMs. The simulated residual current and sediment flux in the bottom and surface layers in the wet and dry seasons are depicted in Figure 7. In the surface layer, the residual current predominantly exhibits a seaward direction in both the wet and dry seasons. In the lower reach of the estuary, the current is primarily influenced by the large-scale coastal current that is driven by the monsoon, that is, northeastward in the wet season and southwestward in the dry season (Zu and Gan, 2015). SPM in the surface water layer is mainly from the riverine sediment load and the residual transport direction generally follows the surface residual current, with elevated values in regions characterized by pronounced resuspension (Figures 7A, B).
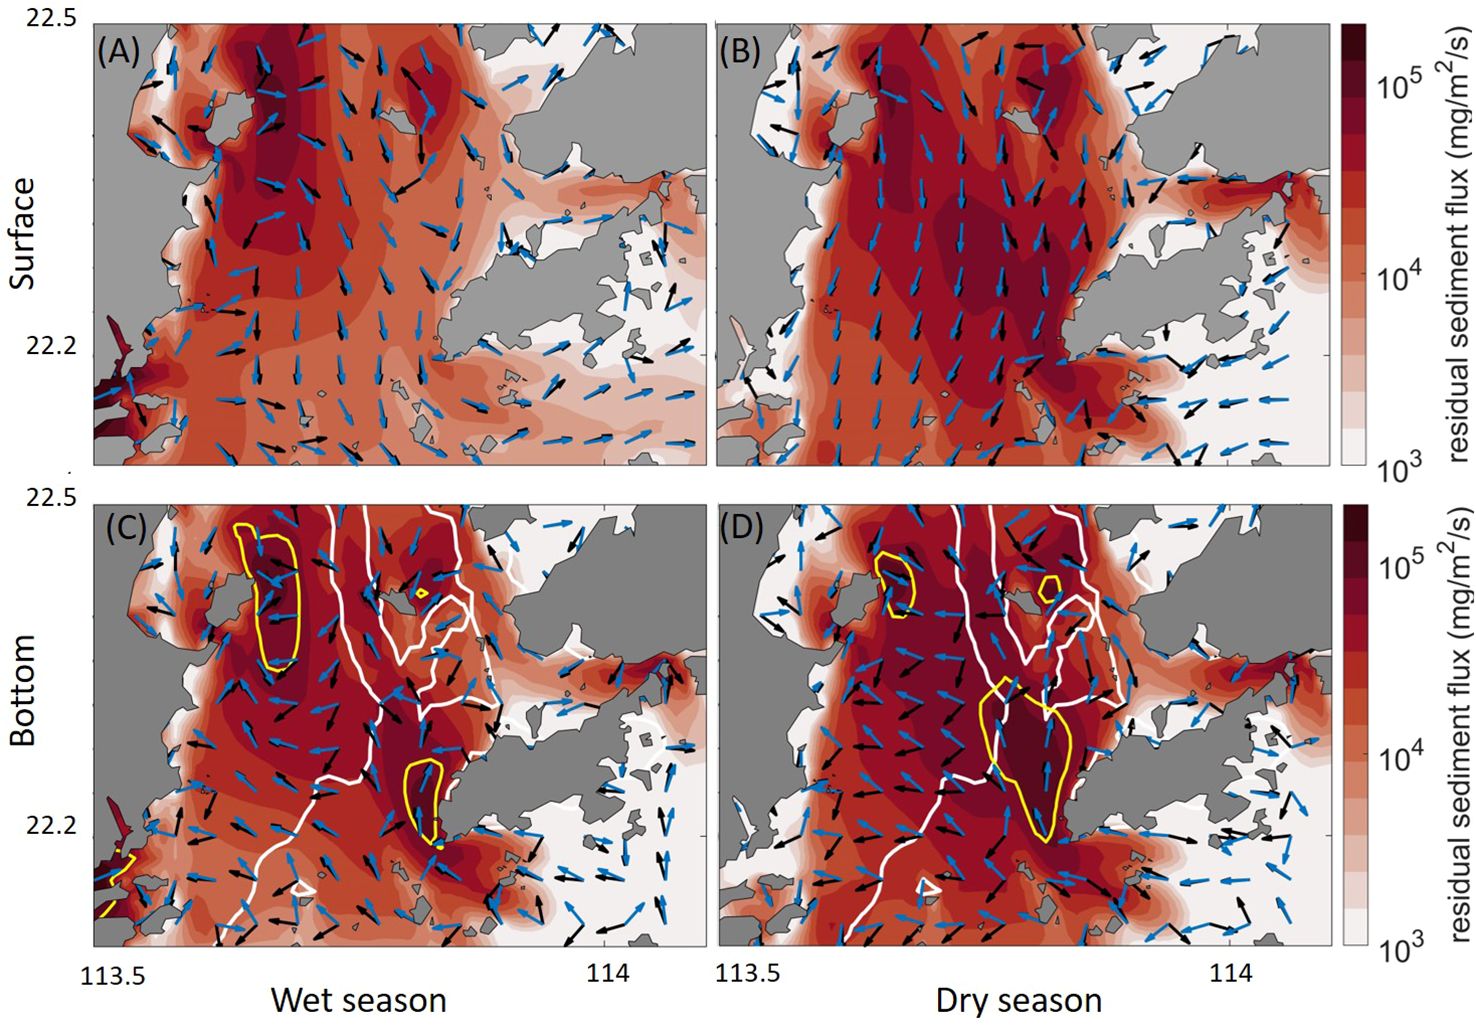
Figure 7 Residual current direction (blue arrows) and sediment transport flux (direction indicated by black arrows and magnitude indicated by the color) in the surface (A, B) and bottom layers (C, D). (A, C) are for the wet season, whilst (B, D) are for the dry season. ETMs are indicated by the yellow lines in the bottom layer. The white line refers to the 7 m-isobaths.
The residual current and residual sediment flux in the bottom layer is significantly modulated by the estuarine morphology and tides (Figures 7C, D). The saline water intrudes into the estuary via the channel in the bottom layer, and the extension is much further upstream in the dry season than in the wet season. This significantly modifies the residual current and sediment transport flux at a seasonal scale. The bottom residual current on the west shoal is directed to the northwest, which results from a shear front between the west channel and the west shoal that is consistent with a previous study (Zhang et al., 2021a). The residual sediment flux follows the direction of the residual current within the channel. However, large discrepancies in their directions occur on the west shoal. This is due to the tidal asymmetry of SSC. In a major part of the west shoal, the bottom residual current points to the right relative to the residual sediment transport direction, indicating that the SSC is elevated during the ebbing phase compared to the flooding phase.
The formation of the TM_shoalw mainly results from a convergence of the residual transport. During the wet season, there is a notable convergence of residual current and sediment flux in both the surface and bottom layers. However, during the dry season, the convergence is weakened in the surface layer, leading to lower SSC than in the wet season.
In the TM_channel, the residual current and sediment transport are directed seaward in the surface layer, whereas landward transport occurs at the bottom. At the boundary between the west shoal and the west channel, an entrainment of SPM is induced by the counteracting surface and bottom residual transport, marking the boundary of the TM_channel. Along the west channel, a relatively sharp gradient in the bathymetry of Lantau Island on both landward and seaward sides creates a hole-like topography in the channel (Figure 1). Baroclinic circulation and stratification are locally intensified in this area (Figure 6), and hinder the landward SPM transport. This specific sediment trapping mechanism leading to the formation of ETM that is locked at topographic transitions independent of salinity is termed topographic trapping (Burchard et al., 2018).
4.2.3 Sediment sources
According to previous studies, a major portion of the riverine sediment is initially deposited in the estuary (Wai et al., 2004) and therefore contributes to the formation of the seabed in modern times. In this study, we distinguish the source of SPM in the ETMs between the sediment directly delivered by the river plume and local resuspension, despite that locally resuspended sediment may also have a terrestrial origin. The modeled fractions of SPM in the ETMs from these two sources are shown in Figure 6.
Our results show that local resuspension contributes to a major part of the SPM in all ETMs. In the wet season, SPM delivered directly by the river plume is also important for maintaining the two ETMs in the upper part of the estuary (Figure 8), whereas the ETM in the lower part of the estuary (TM_channel) is almost exclusively maintained by resuspended sediment. In the dry season, there is an enhanced contribution of local resuspension across all three ETMs, with the most pronounced observed in the TM_shoalm. In the TM_channel, local resuspended sediment almost entirely dominates.
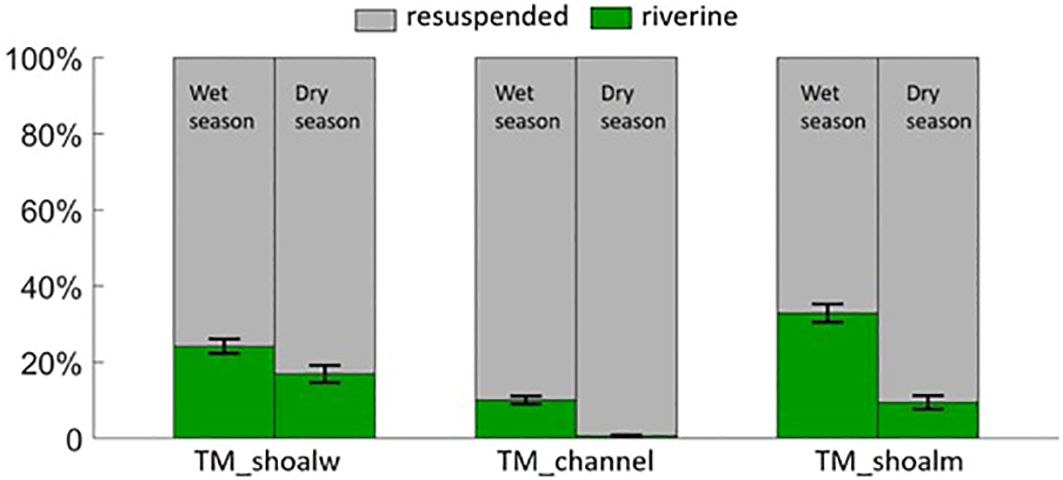
Figure 8 Fractions of SPM in the ETMs from the two sources (local resuspension and river plume) distinguished between wet and dry seasons according to the simulation results.
4.3 Processes of SPM transport in the ETMs
The relative contribution of various sediment transport processes to the ETMs was quantified through a decomposition of the sediment transport flux (section 3.2).
4.3.1 Temporal variation
The time series of sediment transport terms averaged over the area of the TM_shoalw and TM_channel respectively, are shown in Figure 9. Results show that the sediment flux is largely modulated by river discharge and sediment loading. High water discharge and high river sediment loads occur in the wet season, whilst lower water discharge and river sediment loads occur in the dry season. During the simulation period, the wet season of 2018 experienced the lowest water discharge and sediment loading compared to the wet seasons of other years. This seasonal signal is clearly reflected in the advection and resuspension terms.
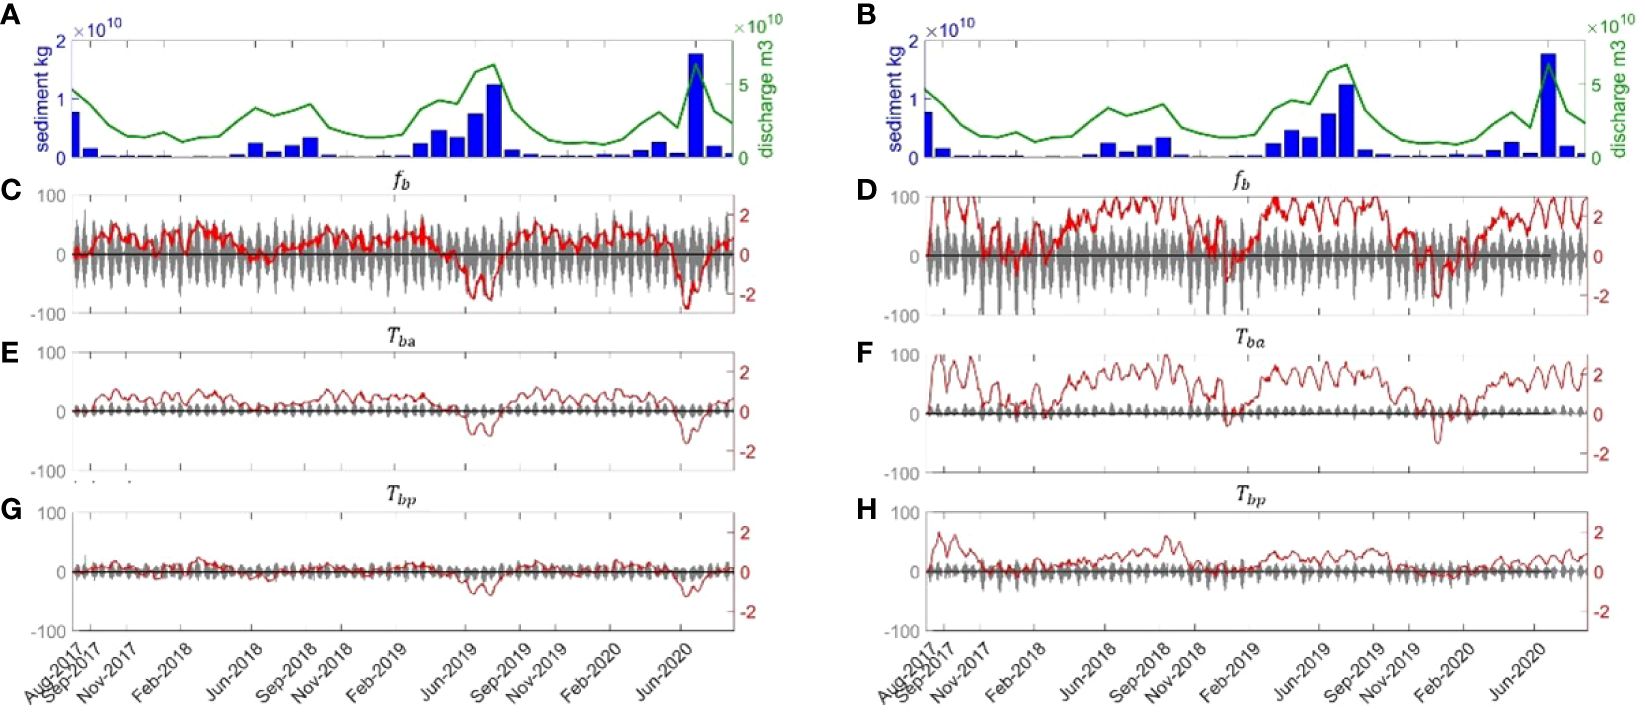
Figure 9 (A, B) Monthly averaged river discharge and sediment loading of the PRE. (C, D) Time series of modeled sediment flux in the bottom layer of the TM_shoalw (left column) and TM_channel (right column) from August 2017 to September 2020. (E, F) Time series of the advective transport flux (Tba) in the two ETMs. (G, H) Time series of transport flux due to tidal pumping (Tbp). Hourly data are indicated by the grey lines with the y-axis on the left and the 7-day moving average data are indicated by the red lines with y-axis on the right in (C–H). Positive values indicate northward transport direction in (C–H).
In the TM_shoalw, which is located close to the river outlets, sediment transport is featured by a generally southward-directed (i.e., seaward) net transport in the wet season and northward-directed (landward) net transport in the dry season jointly caused by the mean advection and tidal oscillations. At an hourly scale, the tidal oscillation-induced sediment flux can reach several times larger than the advective transport in magnitude. However, the tidal transport is largely balanced between landward and seaward transport when averaged weekly (7-day moving average) (Supplementary Figure S2). The mean advective transport is largely modulated by the river runoff and exhibits a distinct seasonality, featured by prominent seaward transport in wet seasons and landward transport in dry seasons (Figure 9E). The tidal pumping Tbp contributes to a significant fraction of sediment transport flux in the TM_shoalw, which is attributed to the large fraction of suspended fine-grained particles (e.g. clay) (Supplementary Figure S1). Tbp is generally positive (northward-directed) in the dry seasons and negative in the wet seasons, suggesting a different seasonal response of SSC to current velocity. Particularly, negative values of Tbp (Figure 9G) indicate a long phase lag between flow velocity and SSC which are in opposite phases, resulting mainly from a small settling velocity of clay. Two factors contribute to the significant presence of clay around Qi’so Island during the wet season. Firstly, Qi’ao Island’s proximity to the outlet allowing it to receive substantial quantities of clay directly delivered by the river runoff. Secondly, SPM from the riverine runoff is trapped in this place due to a flow convergence (Figure 7).
In the TM_channel, the magnitude of sediment flux is larger than the TM_shoalw. In contrast to the TM_shoalw, the mean advective transport in the bottom layer of TM_channel is mostly northward (i.e., landward) driven by the gravitational circulation in the wet season. In the dry season, despite a higher SSC level (Figure 4) caused by enhanced mixing, the gravitational circulation is suppressed, leading to reduced mean advective sediment transport compared to the wet season Figure 9F. During the period of low river discharge, the advective sediment transport may even turn to a seaward direction. On a weekly scale (7-day moving average), the tidal pumping transport Tbp is generally positive and shows elevated values when river discharge is high, indicating a synchronized response of SSC and the current velocity that are with a small phase difference.
In each ETM zone, hourly-to-daily fluctuations of sediment flux are predominantly driven by tidal oscillations. However, at a longer time scale (weekly to yearly), variations in the net sediment flux patterns are primarily influenced by advection and tidal pumping.
4.3.2 Spatial variation
The spatial distribution of seasonal averaged bottom sediment flux, integrated over three months of the wet and dry seasons, respectively, is calculated to examine their roles in the ETMs across distinct geographical units. The seasonal averaged terms were derived using the following equation:
In the Equation 13, represents , and from Equation 12. These terms are averaged over the wet and dry seasons, respectively, yielding , and for each grid cell over the PRE.
Results shown in Figures 10, 11 indicate that bottom sediment flux () and all three terms (, ) are most pronounced in the west channel and influenced by bathymetrical gradients. The bottom sediment flux shows convergence in TM_ shoalw and strong advective transport in the west channel. The sharp depth gradient between 22.2N° and 22.3°N (Figures 6E–H) results in a decrease of northward transport, leading to topographic trapping of sediment in the channel. This effect is responsible for the formation of TM_channel (Figure 6). Despite a difference in the strength of the terms, their transport direction remains stable between the wet and dry seasons.
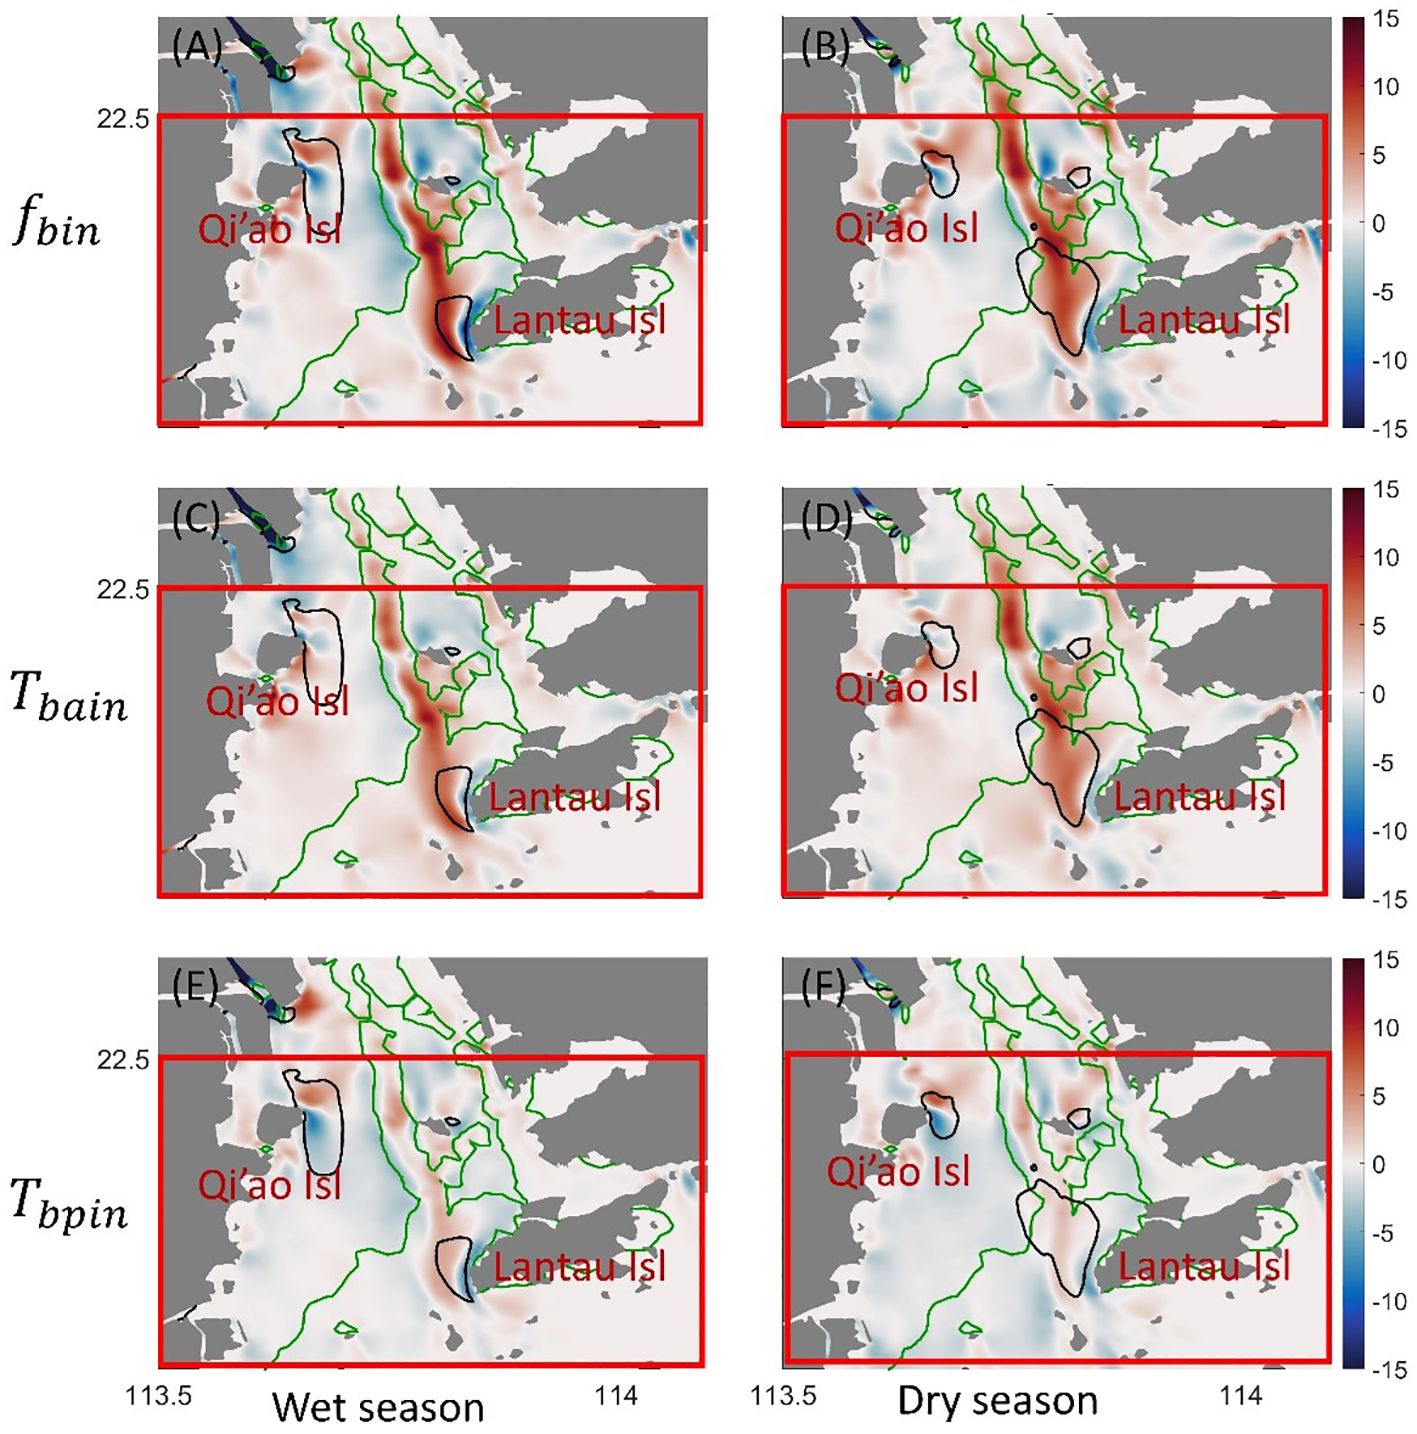
Figure 10 Spatial distribution of , and in the bottom water layer in the wet (left column) and dry seasons (unit: .). Positive (red color) and negative (blue color) values indicate northward and southward transport, respectively. The green lines indicate the 7-m isobaths, and the black polygons indicate the boundary of ETMs where SSC exceeds 100 mg L-1. The red boxes indicate the focus area of this study.
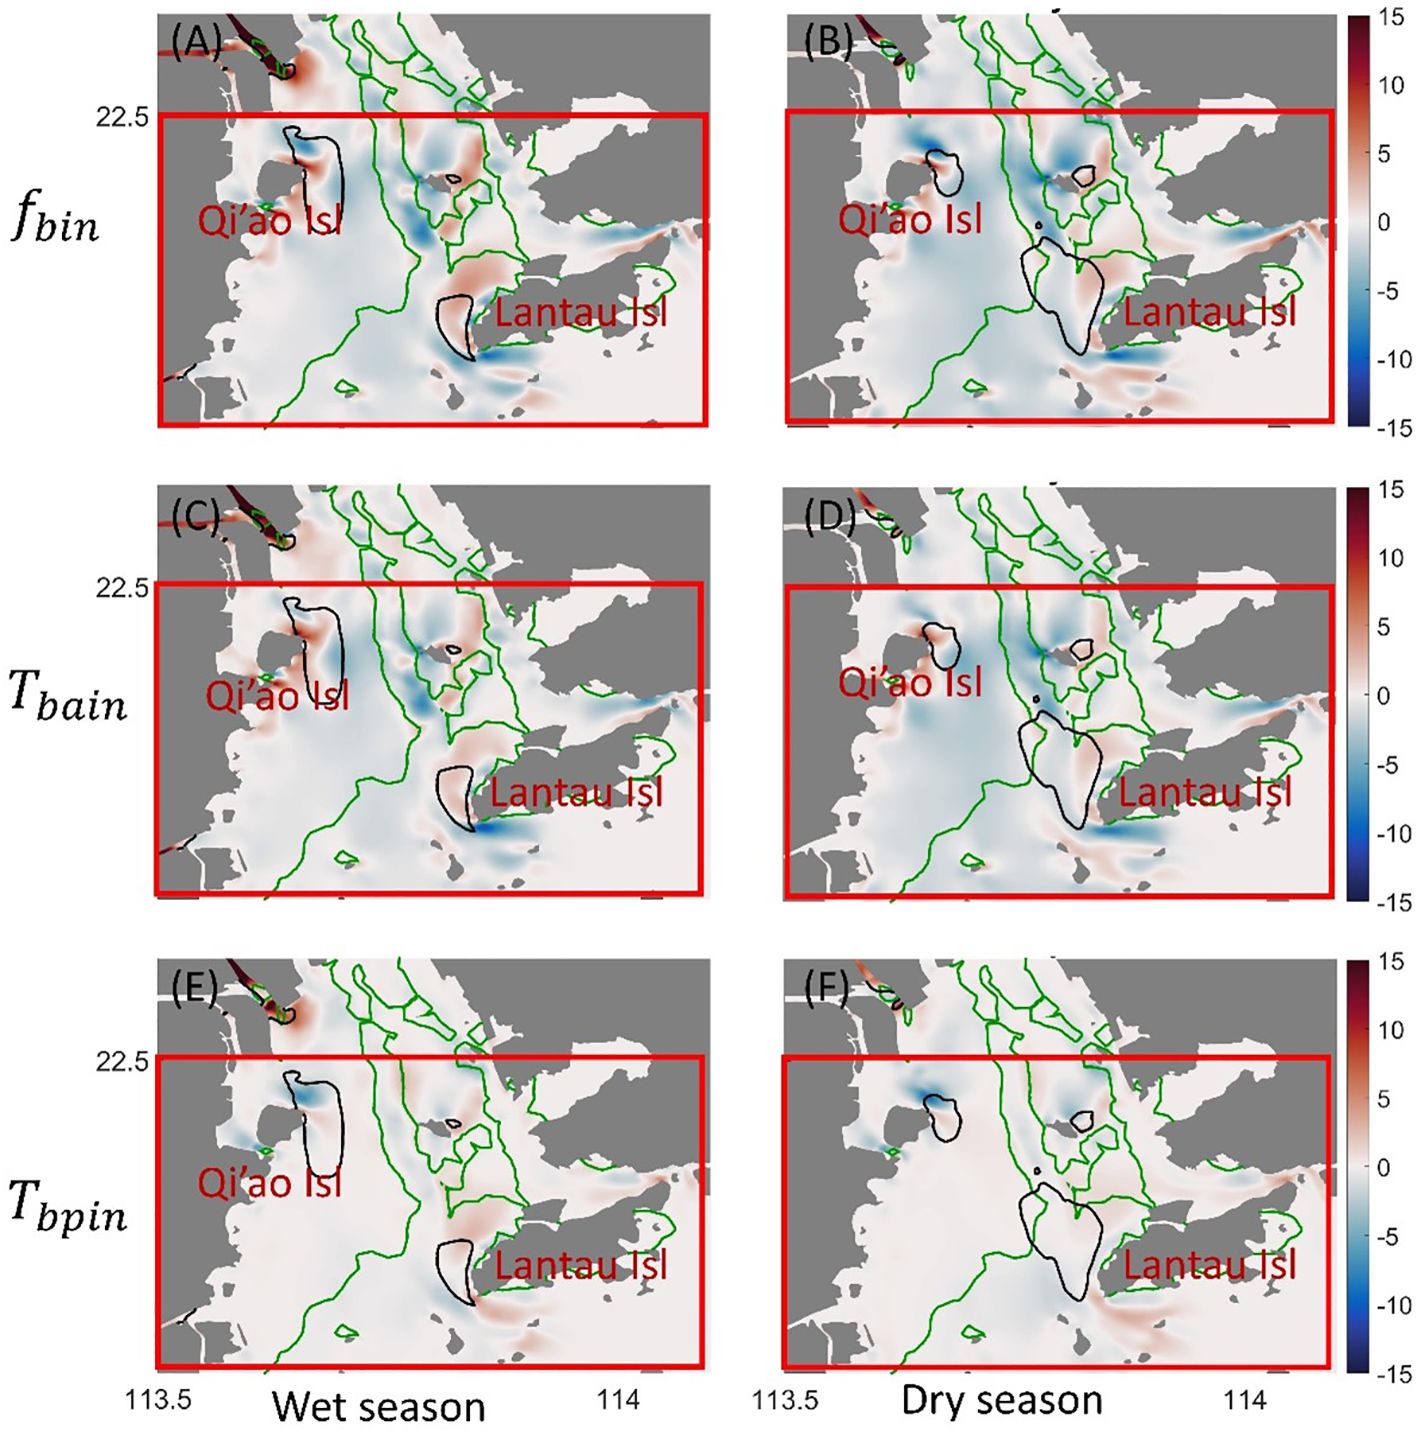
Figure 11 Spatial distribution of , and in the bottom water layer in the wet (left column) and dry seasons (unit: .). Positive (red color) and negative (blue color) values indicate eastward and westward transport, respectively. The green lines indicate the 7-m isobaths, and the black polygons indicate the boundary of ETMs where SSC exceeds 100 mg L-1. The red boxes indicate the focus area of this study.
Compared to a consistent transport direction of each term in the western channel, the shoal area is featured by convergence and divergence in these terms, along with reduced strength (Figures 10, 11). The advective transport term shows convergence in the TM_shoalw both axially and laterally in in both wet and dry seasons. The divergence within the TM_shoalw is attributed to , which shows tidally forced oscillation of the spatial extension of TM_shoalw.
Results in Figures 10, 11 indicate that the upstream of TM_shoalw is characterized by a landward sediment flux whereas the downstream of TM_shoalw is associated with a seaward sediment flux due to tidal pumping. Tidal pumping contributes to a net divergence of sediment flux. The same pattern was found in Yu et al. (2014). Upon the establishment of the ETM, tidal pumping predominantly dictates its mobility, aligning the ETM’s movement with the flood and ebb tides. The pronounced value of in the west shoal is located between 22.35N° and 22.45N° as shown in Figure 10, which is consistent with the swing of the ETM over a tidal cycle reported by Dong et al. (2020). The minimum value of is located in the center of TM_shoalw. As proposed by Dyer (1995), the tidal pumping terms are likely to be a minimum at the locations near the peak of turbidity maximum, which is mainly associated with the asymmetry in the tidal flow (for details of the relationship between tidal asymmetry and tidal pumping, please refer to Supplementary Material).
4.4 Interconnections between ETMs
ETMs are spatially distributed across various morphological units within the PRE, yet exhibit interconnections, which are revealed by the experiments described in 3.1.
Results (Figure 12) show that on TM_shoalw, the sediment input from TM_channel and from TM_shoalm are comparable. This remote transport is markedly more pronounced in the wet seasons, approximately fivefold compared to the dry seasons. Two transport pathways exist from the west channel (TM_channel) to the west shoal (TM_shoalw): one follows the ‘TM_channel-TM_shoalm-TM_shoalw’ route across the middle shoal, and the other is the direct ‘TM_channel-TM_shoalw’ route. The former is influenced by the anti-clockwise circulation within the PRE (Figure 7). The latter can be attributed to lateral circulation, moving sediment from the west channel to the southern part of the west shoal, eventually reaching TM_shoalw (Figure 7).
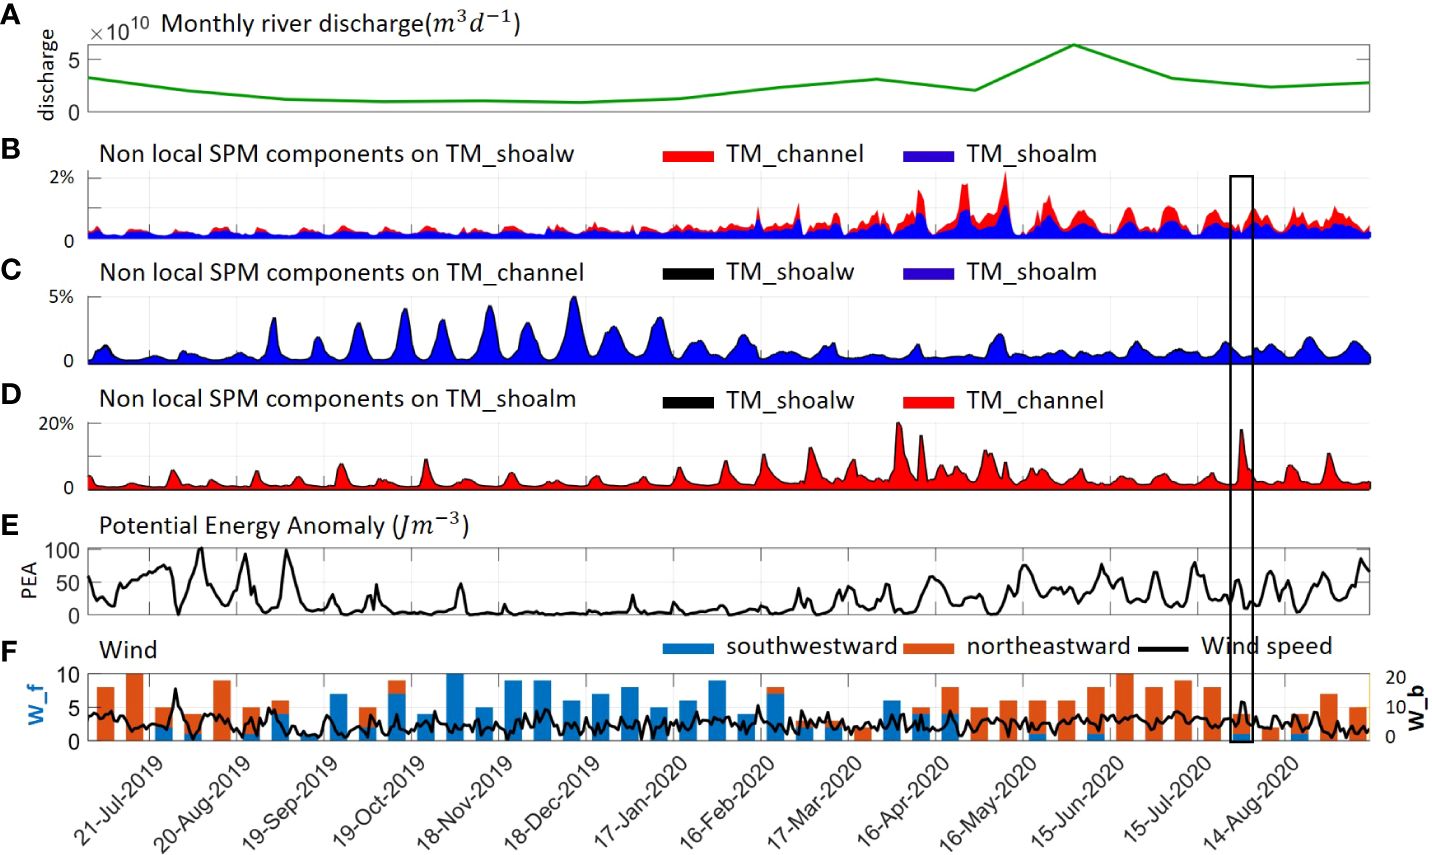
Figure 12 Interconnections between the ETMs as revealed from the simulation result of July 2019 - September 2020. (A) Monthly river discharge for the period of July 2019 – September 2020. (B–D) Temporal variation of local and non-local SPM components in each ETM zone; black, red, and blue denote the components of SPM originating from TM_shoalw, TM_channel, and TM_shoalm, respectively; The calculated potential energy anomaly (PEA) of site 3 is depicted in (E). In the subplot (F), the left y-axis represents the frequency of wind direction in 10 days, with blue indicating southwestward wind and red indicating northeastward wind. The right y-axis denotes the wind speed in meters per second(m/s). The black box indicates the passage of tropical storm Sinlaku from 31 July to 2 August 2020 (https://www.hko.gov.hk/en/publica/tc/tc2020/section3_2rpt.html).
Regarding TM_channel, sediment input from TM_shoalw is quite limited. This can be attributed to two primary factors. Firstly, the convergence effect results in sediment being predominantly trapped in TM_shoalw. Secondly, sediment transported out of the west shoal tends to settle in its southern part, as explained in section 4.2.2. Sediment transport from TM_shoalm to TM_channel is more pronounced during the dry seasons. This transport pattern is influenced by the seasonal stratification dynamics (Figure 12E). Intense stratification during the wet season impedes sediment movement from TM_shoalm to TM_channel. However, with the weakening of stratification in the wet season, this transport pathway becomes more active.
For TM_shoalm located in the middle shoal, sediment input from TM_shoalw is minor, primarily because the transport direction between the middle shoal and the west shoal is westward (as shown in Figure 7). The sediment movement from TM_channel to TM_shoalm is influenced by multiple factors. Firstly, salt intrusion at the bottom during the wet season amplifies this transport. Secondly, the enhanced river discharge from May to July causes the saltwater front to recede seaward, preventing sediment from reaching TM_shoalm. This suggests that sediment transport from TM_channel to TM_shoalm is contingent upon the establishment of stratification during the wet season and the location of the estuarine front.
Peaks in sediment transport arise from extreme short-term weather events. For instance, our results suggest that a tropical storm leads to significant sediment transport from TM_channel to TM_ shoalm (Figures 12D, F).
In summary, during the wet season, the presence of stratification and the anti-clockwise circulation of the PRE promotes a ‘TM_channel-TM_shoalm-TM_shoalw’ sediment transport pathway across the three ETMs and a ‘TM_channel-TM_shoalw’ pathway between two ETMs. In the dry season, as stratification diminishes, these transport pathways become less stringent, and sediment exchange between TM_channel and TM_shoalm becomes more active (Figure 13).
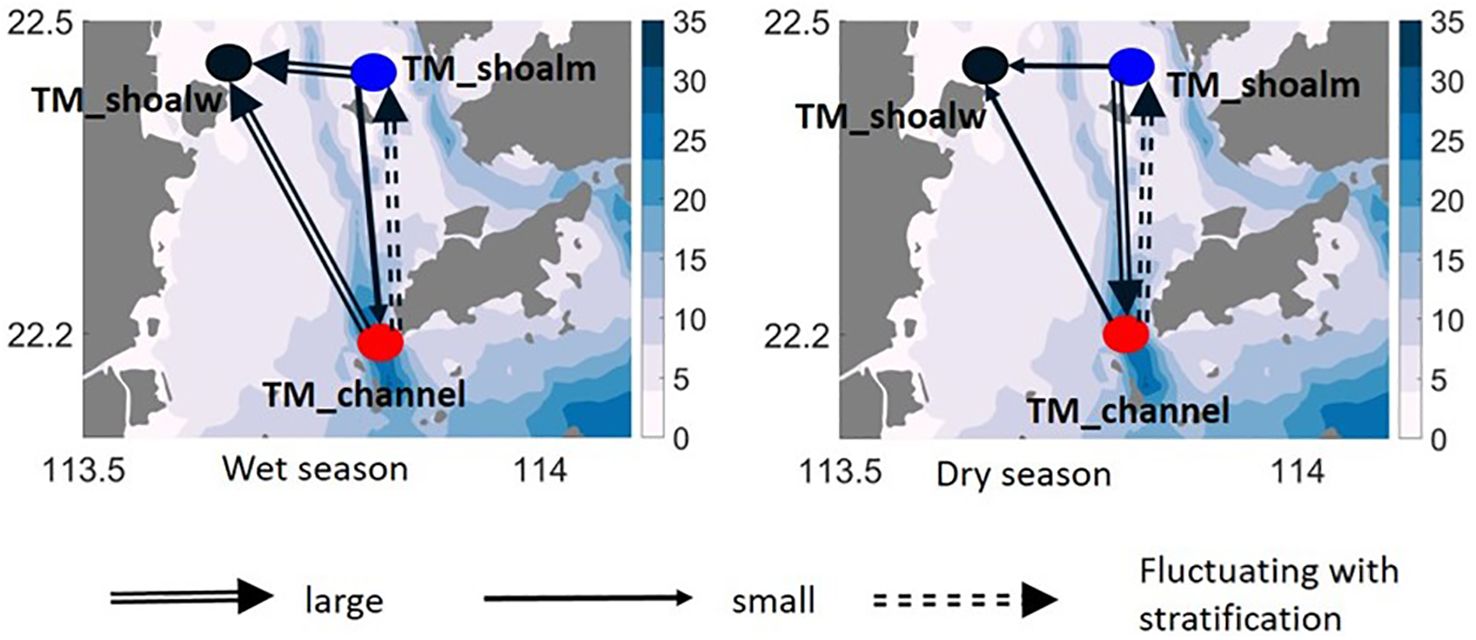
Figure 13 The interconnections between the ETMs in PRE. The seasonal average volume of sediment transport is categorized into two tiers, ‘large’ and ‘small’, using a threshold of .
5 Discussion
5.1 Impact of morphology on ETM
Our modeling outcomes underscore the pivotal influence of morphological characteristics on the spatial distribution of ETMs within the PRE. Specifically, the two upstream ETMs (TM_shoalw and TM_shoalm) are situated in the west shoal and middle shoal, respectively, while the downstream ETM (TM_channel) is centered in the west channel, with an extension towards the west shoal. While prior research has identified ETM zones, the majority have been singularly focused on individual zones (Geyer et al., 2001; Sommerfield and Wong, 2011; Hua et al., 2020). Our model captures all three ETMs in the PRE, offering an opportunity for deepening the understanding of SPM distribution shaped by the interplay between morphological features and the estuarine circulation as well as interconnections among ETMs.
Tidal pumping-induced residual flow and sediment transport are pivotal in maintaining the ETM at the head of saltwater intrusion (Sommerfield and Wong, 2011; Li et al., 2014; Yu et al., 2014; Wan and Zhao, 2017). Moreover, ETMs are also observed at bathymetric transition zones (Schoellhamer, 2000; Geyer et al., 2001; Chen et al., 2015). The genesis of such ETMs can be attributed to topographical trapping (Burchard et al., 2018). Both formation mechanisms mentioned are manifested in this study. The two ETMs developed on the shoals, namely TM_shoalw and TM_shoalm, are sustained at the salinity fronts where residual transport from offshore and onshore directions converge (Figure 5). Despite that the formation of these two ETMs is caused by transport convergence, local resuspension contributes to a major portion of SPM in the ETMs (Figure 6). Interestingly, both ETMs are located on the eastern side of the islands, and the enhanced tidal currents in the island proximity are responsible for maintaining a high level of SSC in the two ETMS. Because these two ETMs are formed by the transport convergence at the front, their size variation is largely controlled by the movement of the salinity front between dry and wet seasons. By contrast, the ETM in the channel (TM_channel) is formed by topographic trapping and exhibits an extension towards the west shoal (Figure 4) during dry seasons whereas a shrinks in wet seasons. The extension of TM_channel results from lateral circulation driven by the baroclinic pressure gradient (Zhang et al., 2021a; Gong et al., 2022). The inversely co-varying dynamics between the ETMs in the upstream (TM_shoalw and TM_shoalm) and the ETM in the downstream promote an active exchange of sediment among the ETMs as shown in our simulation results.
5.2 Effect of stratification on ETMs and their interconnections
As described in section 4, the spatial variation of the ETMs and their interconnections are largely affected by stratification. While SPM transport from TM_shoalm to TM_shoalw and from TM_channel to TM_shoalw both intensify during the wet season, their transport pathways differ. The SPM transport from TM_shoalm to TM_shoalw is facilitated by the bay-wide anti-clockwise circulation (Xu et al., 2021). In contrast, the TM_channel to TM_shoalw transport route is not straightforward but via lateral circulation which is dependent on the salinity gradient. Despite the distinct transport pathways, the anti-clockwise circulation and the lateral circulation between the channel and the shoal are both amplified by enhanced stratification (Mao et al., 2004).
Remarkably, SPM transport from TM_shoalm to TM_channel intensifies during the dry season, which is associated with reduced river runoff. This enhanced transport is attributed to the diminished stratification during the dry season, leading to a dissolution of the front (Ma et al., 2023) which acts as a barrier between TM_shoalm and TM_channel, thereby augmenting SPM transport.
The SPM transport from TM_channel to TM_shoalm is not merely governed by the intensity of stratification. It is also associated with the latitudinal oscillation of the stratification. As shown in Figure 10, elevated river runoff in May and June (right after the dry season) results in pronounced stratification and diminishes the SPM transport from TM_channel to TM_shoalm. This phenomenon is attributed to the significant river runoff advancing the salinity front between TM_channel and TM_shoalm toward offshore, impeding the SPM transport from TM_channel to TM_shoalm.
In summary, the interconnections among the ETMs hinge not just on the intensity of stratification but also on the latitudinal oscillation of the estuarine front. Amid alterations in stratification, attributed to driving factors such as sea level rise, dredging, land reclamation (Schoellhamer, 2000; Wang et al., 2021; Cox et al., 2022; Ma et al., 2023), and/or deltaic land subsidence (Wang et al., 2017; Cao et al., 2021), it is also important to conder not only the effects of stratification intensity on ETMs (Geyer, 1993) but also the ramifications of shifts in stratification position and oscillation patterns.
The investigation of the interconnection of ETMs reveals that when multiple ETMs exist in an estuary, sediment management in the estuary must consider not only the formation mechanism and sediment source of a single ETM but also the dynamic mechanism that links various ETMs to each other.
5.3 Effect of flocculation on ETMs
Cohesive sediment, which typically ranges in size from 0.98 to 63 µm (Hjulström, 1935), is composed of particulate matter that is susceptible to aggregation, breakup, deposition, and erosion processes (Maggi, 2005; Manning et al., 2010). Turbulent mixing of the fluid causes the suspended aggregates to come in contact, inducing further aggregation and causing the growth of large aggregates. The frequency with which particles collide, grow, and break up is largely dependent on the intensity of turbulence (Malcherek, 1995; Maggi, 2005). To assess the effect of flocculation on the ETMs, we adopted the formulation (Equation 14) by Arlinghaus et al. (2022), which links the settling velocity of cohesive sediment to turbulence:
where is a reference settling velocity in still water (Table 1) depending on the particle grain size, and are empirical constants, and G is the turbulence shear.
Results are compared with the reference simulation (Figure 6) presented in previous parts of our study. The comparison indicates that in the dry season, with inclusion of the flocculation effect in the simulation, the spatial distribution of all three ETMs is quite similar to the reference simulation, only with a slight decrease of SSC in the channel (Figure 14). In the wet season, SSC in two ETMs (TM_shoalw and TM_shoalm) exhibits similar pattern with the reference result, whilst SSC in the TM_channel is lower than the threshold level (100 mg L-1) for an ETM, albeit with locally elevated SSC in the same location. The similar distribution pattern of ETMs between simulations with and without flocculation in the PRE demonstrates that flocculation affects SSC in the ETMs, but it is not the driving mechanism for formation of ETMs. This result is consistent with studies in other estuaries (Manning et al., 2010; Xu et al., 2010).
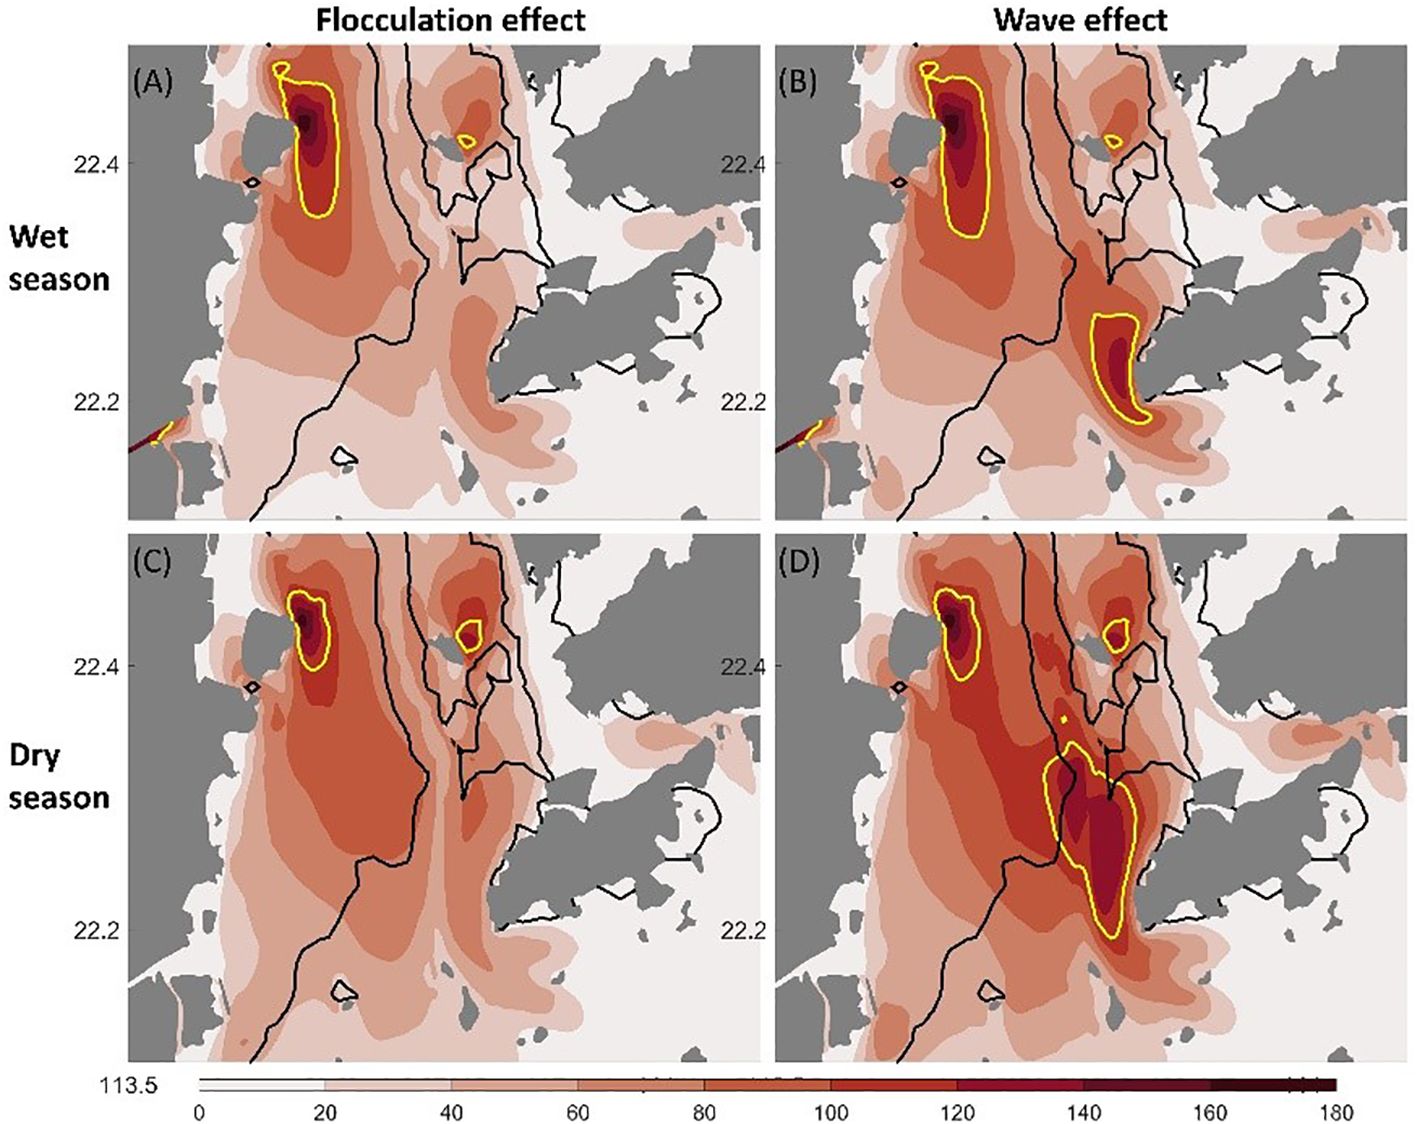
Figure 14 SSC in the bottom layer during the wet (top panel) and dry seasons in the sensitivity simulations. (A, C) SSC in the simulation with flocculation included; (B, D) SSC in the simulation with wind-waves included. The yellow line indicates the 100 mg L-1 contour line of SSC. The black line indicates the 7-m isobaths.
5.4 Effect of wind-waves on ETMs
Surface wind-waves may alter the residual flow, water mixing and bottom stress, which in turn affects the transport and distribution of sediment in estuaries (Uncles and Stephens, 1997; Gong et al., 2022, 2023). A comparison between model results with and without wind-wave effect revealed that the overall SSC on the west shoal and in the west channel is enhanced by wave effect in both wet and dry seasons (Figure 14). This increase is believed to be attributed to the elevated bed shear stress, as shown in Supplementary Figure S11. In the simulation with wave effect, the bed shear stress exhibited a notable increase on the west shoal, resulting in an elevated SSC. A notable increase in SSC is also seen in the area between the west channel and west shoal, which is consistent with the findings of Zhang et al. (2021a) that waves enhance the sediment exchange between the shoal and the channel by eroding sediment on the side bank of west channel. The eroded sediment is subsequently transported toward the west shoal by tidal pumping. It is worthy of note that despite the notable increase in SSC within the estuary, the nucleus of the three ETMs remained the same in the simulations with and without wave effect.
5.5 Future scenarios of the ETMs in the PRE
According to a previous study by the authors (Ma et al., 2023), a dramatic historical change in the morphology of the PRE caused by human activities (land reclamation, channel dredging, and dumping, sand excavation) from the 1970s to 2010s has resulted in a bay-wide enhancement of stratification by up to four times, with maximum enhancement (up to seven times) on the western shoal of the Lingding Bay where TM_shoalw is located. In recent years, extensive human interventions including sand excavation and land reclamation have been banned. However, other local-scale human activities such as channel maintenance by dredging and indirect interventions such as reduced sediment discharge by river damming are likely to continue in the future (Liu et al., 2018). In this context, future change of stratification is likely to be driven mainly by sea level rise, land subsidence of the Pearl River delta as well as river runoff associated with monsoon intensity. The stratification is projected to be further strengthened albeit to a less extent than in past decades (Ma et aL., 2023). The projected future enhancement of stratification would possibly lead to an enhancement of the bay-wide anti-clockwise circulation and the lateral circulation, promoting SPM transport between the ETMs and their interconnections.
Besides the impact of stratification, the largely reduced sediment input from rivers may also impact the ETMs to a considerable extent. Despite that sediment directly delivered by the river plumes contributes to only a small portion of the SPM in the ETMs (Figure 6), locally resuspended sediment in the ETMs may also have a terrestrial origin due to the fact that more than 80% of riverine sediment is initially deposited within the estuary. The reduction of riverine sediment supply would possibly lead to a deterioration of the deltaic deposit (Wu et al., 2016) and consequently impact the sediment source for the ETMs.
The elevated wave energy near the coast due to sea level rise and the narrowing of the estuary (Wei et al., 2021) indicate the potential for an increased influence of wave effect on sediment transport and distribution. Despite the numerous studies that have demonstrated the significant impact of wave effect on sediment transport (Madsen and Grant, 1976a; 1976b; Green and Coco, 2014; Chen et al., 2019) and the influence of flocculation on sediment distribution (Xu, 2009; Manning et al., 2010; Xu et al., 2010), impact of interactions between various factors, such as tides, wind-waves and flocculation, on the fate of ETMs has yet to be understood. Because of a nonlinear response of ETMs to changes in hydrodynamics and sediment supply, to what extent these climatic and anthropogenic drivers would lead to spatial and temporal variation of ETMs in the future remains to be explored.
6 Summary and conclusion
A high-resolution 3-dimensional hydrodynamics-sediment transport model was applied to investigate the sediment transport and dynamics of ETMs in the PRE from 2017 to 2020. Based on the simulation results that are confirmed by observation, the relative contribution of specific physical mechanisms for the formation of the ETMs, the temporal and spatial dynamics of the ETMs as well as their interconnections were investigated. The following main conclusions are drawn from the study:
1. Three ETMs exist in the Lingding Bay of the PRE, and they are formed by different physical mechanisms. The two upstream ETMs (TM_shoalw and TM_shoalm) situated on the shoals are a result of convergence of residual flow and sediment transport associated with tidal pumping. The downstream ETM located in the west channel (TM_channel) is formed mainly by topographical trapping.
2. All three ETMs exhibit distinct seasonal and spatial variations. Advection and tidal pumping are the main processes mediating the sediment flux of the ETMs. These factors are largely influenced by river runoff and stratification dynamics. The TM_shoalw exhibits spatial extension in wet seasons and shrinks in dry seasons, whereas TM_channel and TM_shoalm show an opposite pattern.
3. The ETMs are interconnected through sediment exchange. In the wet season, a ‘TM_channel-TM_shoalm-TM_shoalw’ sediment transport pathway across the three ETMs and a ‘TM_channel-TM_shoalw’ pathway between two ETMs are prominent. In the dry season, these transport pathways become less stringent, and sediment exchange between TM_channel and TM_shoalm becomes more active.
In the context of evolving estuarine dynamics, it is imperative to underscore the profound influence of both climate change and human activities on estuarine geomorphology and ecological systems. The ETM emerges as a salient component within this framework. Our findings elucidate that alterations in estuarine stratification, driven by climate changes and human activities, directly impact the formation of ETM, encompassing its spatial distribution, SPM concentration, and compositional attributes. It is paramount for future research endeavors to evaluate the multifaceted response of ETM to both climatic and anthropogenic challenges.
Data availability statement
The original contributions presented in the study are included in the article/Supplementary Material. Further inquiries can be directed to the corresponding authors.
Author contributions
MM: Conceptualization, Data curation, Methodology, Software, Validation, Writing – original draft, Writing – review & editing. LP: Data curation, Methodology, Writing – review & editing. CS: Supervision, Writing – review & editing. WZ: Methodology, Supervision, Writing – review & editing.
Funding
The author(s) declare financial support was received for the research, authorship, and/or publication of this article. This study is a contribution to the Helmholtz PoF program “The Changing Earth -Sustaining our Future” on its Topic 4: Coastal zones at a time of global change. It also contributes to the theme “C3: Sustainable Adaption Scenarios for Coastal Systems” of the Cluster of Excellence EXC 2037 ‘CLICCS -Climate, Climatic Change, and Society’ -Project Number: 390683824 funded by the Deutsche Forschungsgemeinschaft (DFG, German Research Foundation) under Germany’s Excellence Strategy. WZ acknowledges the support of the project “Morphological evolution of coastal seas -past and future” funded by the Deep-time Digital Earth program (https://www.ddeworld.org/) and the Sino-German Mobility Program: CHESS-Chinese and European Coastal Shelf Seas Ecosystem Dynamics-A Comparative Assessment (M-0053).
Acknowledgments
Many thanks to Peter Arlinghaus for his help in the early stage of model build-up and comments on scientific questions.
Conflict of interest
The authors declare that the research was conducted in the absence of any commercial or financial relationships that could be construed as a potential conflict of interest.
Publisher’s note
All claims expressed in this article are solely those of the authors and do not necessarily represent those of their affiliated organizations, or those of the publisher, the editors and the reviewers. Any product that may be evaluated in this article, or claim that may be made by its manufacturer, is not guaranteed or endorsed by the publisher.
Supplementary material
The Supplementary Material for this article can be found online at: https://www.frontiersin.org/articles/10.3389/fmars.2024.1385382/full#supplementary-material
References
Arlinghaus P., Zhang W., Schrum C. (2022). Small-scale benthic faunal activities may lead to large-scale morphological change-A model based assessment. Front. Mar. Sci. 9, 1011760. doi: 10.3389/fmars.2022.1011760
Brenon I., Le Hir P. (1999). Modelling the turbidity maximum in the seine estuary (France): identification of formation processes. Estuarine Coast. Shelf Sci. 49 (4), 525–544. doi: 10.1006/ecss.1999.0514
Burchard H., Schuttelaars H. M., Ralston D. K. (2018). Sediment trapping in estuaries. Annu. Rev. Mar. Sci. 10, 371–395. doi: 10.1146/annurev-marine-010816-060535
Cao A., Esteban M., Valenzuela V. P. B., Onuki M., Takagi H., Thao N. D., et al. (2021). Future of Asian Deltaic Megacities under sea level rise and land subsidence: current adaptation pathways for Tokyo, Jakarta, Manila, and Ho Chi Minh City. Curr. Opin. Environ. Sustainab 50, 87–97. doi: 10.1016/j.cosust.2021.02.010
Chen W.-B., Liu W.-C., Hsu M.-H., Hwang C.-C. (2015). Modeling investigation of suspended sediment transport in a tidal estuary using a three-dimensional model. Appl. Math. Model. 39, 2570–2586. doi: 10.1016/j.apm.2014.11.006
Chen Y., Chen L., Zhang H., Gong W. (2019). Effects of wave-current interaction on the Pearl River Estuary during Typhoon Hato. Estuarine Coast. Shelf Sci. 228, 106364. doi: 10.1016/j.ecss.2019.106364
Cheng L. I. U., Jueyi S. U. I., Yun H. E., Hirshfield F. (2013). Changes in runoff and sediment load from major chinese rivers to the pacific ocean over the period 1955–2010. Int. J. Sediment Res. 28 (4), 486–495. doi: 10.1016/S1001-6279(14)60007-X
Cox J., Lingbeek J., Weisscher S., Kleinhans M. (2022). Effects of sea-level rise on dredging and dredged estuary morphology. J. Geophys. Research: Earth Surface 127, 1–20. doi: 10.1029/2022JF006790
Cui Y., Wu J., Tan E., Kao S. J. (2022). Role of particle resuspension in maintaining hypoxic level in the Pearl River Estuary. J. Geophys. Research: Oceans 127, e2021JC018166. doi: 10.1029/2021JC018166
Dong Y., Dehai S., Xianwen B. (2020). Spring-neap tidal variation and mechanism analysis of the maximum turbidity in the Pearl River Estuary during flood season. J. Trop. Oceanograph. 39, 20–35. doi: 10.11978/2019035
Dyer K. R. (1974). The salt balance in stratified estuaries. Estuar. Coast. Mar. Sci. 2, 273–281. doi: 10.1016/0302-3524(74)90017-6
Dyer K. R. (1988). “Fine sediment particle transport in estuaries,” in Physical processes in estuaries (Berlin, Heidelberg: Springer Berlin Heidelberg), 295–310.
Dyer K. R. (1995). “Sediment transport processes in estuaries,” in Developments in sedimentology (Elsevier), 423–449. doi: 10.1016/S0070-4571(05)80034-2
Etcheber H., Taillez A., Abril G., et al. (2007). Particulate organic carbon in the estuarine turbidity maxima of the gironde, loire and seine estuaries: origin and lability. Hydrobiologia 588, 245–259. doi: 10.1007/s10750-007-0667-9
Garel E., Pinto L., Santos A., Ferreira Ó. (2009). Tidal and river discharge forcing upon water and sediment circulation at a rock-bound estuary (Guadiana estuary, Portugal). Estuarine Coast. Shelf Sci. 84, 269–281. doi: 10.1016/j.ecss.2009.07.002
Geyer W. R. (1993). The importance of suppression of turbulence by stratification on the estuarine turbidity maximum. Estuaries 16, 113–125. doi: 10.2307/1352769
Geyer W. R., Woodruff J. D., Traykovski P. (2001). Sediment transport and trapping in the Hudson River estuary. Estuaries 24, 670–679. doi: 10.2307/1352875
Gong W., Wang J., Zhang G., Zhu L. (2023). Effect of axial winds and waves on sediment dynamics in an idealized convergent partially mixed estuary. Mar. Geology 107015. doi: 10.1016/j.margeo.2023.107015
Gong W., Zhang G., Zhu L., Zhang H. (2022). Effects of swell waves on the dynamics of the estuarine turbidity maximum in an idealized convergent partially mixed estuary. J. Mar. Syst. 235, 103784. doi: 10.1016/j.jmarsys.2022.103784
Green M. O., Coco G. (2014). Review of wave-driven sediment resuspension and transport in estuaries. Rev. Geophysics 52, 77–117. doi: 10.1002/rog.v52.1
Hjulström F. (1935). Studies of the morphological activity of rivers as illustrated by the River Fyris (Doctoral dissertation). The Geological institution of the University of Upsala, Sweden.
Hua X., Huang H., Wang Y., Yu X., Zhao K., Chen D. (2020). Seasonal estuarine turbidity maximum under strong tidal dynamics: three-year observations in the changjiang river estuary. Water 12, 1854. doi: 10.3390/w12071854
Jilan S., Kangshan W. (1986). The suspended sediment balance in Changjiang Estuary. Estuarine Coast. Shelf Sci. 23, 81–98. doi: 10.1016/0272-7714(86)90086-7
Largier J. L. (1993). Estuarine fronts: how important are they? Estuaries 16, 1–11. doi: 10.2307/1352760
Leuven J. R. F. W., Pierik H. J., Vegt M., Bouma T. J., Kleinhans M. G. (2019). Sea-level-rise-induced threats depend on the size of tide-influenced estuaries worldwide. Nat. Climate Change 9, 986–992. doi: 10.1038/s41558-019-0608-4
Li M., Ge J., Kappenberg J., Much D., Nino O., Chen Z. (2014). Morphodynamic processes of the Elbe River estuary, Germany: the Coriolis effect, tidal asymmetry and human dredging. Front. Earth Sci. 8, 181–189. doi: 10.1007/s11707-013-0418-3
Lin S., Liu G., Niu J., Wei X., Cai S. (2021). Responses of hydrodynamics to changes in shoreline and bathymetry in the Pearl River Estuary, China. Continental Shelf Res. 229, 104556. doi: 10.1016/j.csr.2021.104556
Liu F., Hu S., Guo X., Luo X., Cai H., Yang Q. (2018). Recent changes in the sediment regime of the Pearl River (South China): Causes and implications for the Pearl River Delta. Hydrological Processes 32, 1771–1785. doi: 10.1002/hyp.11513
Liu R., Wang Y., Gao J., Wu Z., Guan W. (2016). Turbidity maximum formation and its seasonal variations in the Zhujiang (Pearl River) Estuary, southern China. Acta Oceanologica Sin. 35, 22–31. doi: 10.1007/s13131-016-0897-7
Ma M., Zhang W., Chen W., Deng J., Schrum C. (2023). Impacts of morphological change and sea-level rise on stratification in the Pearl River Estuary. Front. Mar. Sci. 10. doi: 10.3389/fmars.2023.1072080
MacVean L. J., Stacey M. T. (2011). Estuarine dispersion from tidal trapping: A new analytical framework. Estuaries Coasts 34, 45–59. doi: 10.1007/s12237-010-9298-x
Madsen O. S., Grant W. D. (1976a). “Quantitative description of sediment transport by waves,” in Coastal engineering, vol. 1976, 1092–1112. doi: 10.1061/9780872620834.065
Madsen O. S., Grant W. D. (1976b). Sediment transport in the coastal environment. Cambridge, Mass.: Ralph M. Parsons Laboratory for Water Resources and Hydrodynamics, Dept. of Civil Engineering, Massachusetts Institute of Technology.
Maggi F. (2005). Flocculation dynamics of cohesive sediment (Delft University of Technology: Faculty of Civil Engineering and Geosciences).
Malcherek A. (1995). Mathematische Modellierung von Strömungen und Stofftransportprozessen in Ästuaren. Dissertation, Institut für Strömungsmeehanik und Elektronisch Rechnen im Bauwesen der Universiüit Hannover, Bericht Nr. 44/1995.
Manning A., Langston W., Jonas P. (2010). A review of sediment dynamics in the Severn Estuary: influence of flocculation. Mar. pollut. Bull. 61, 37–51. doi: 10.1016/j.marpolbul.2009.12.012
Mao Q., Shi P., Yin K., Gan J., Qi Y. (2004). Tides and tidal currents in the Pearl River Estuary. Continental Shelf Res. 24, 1797–1808. doi: 10.1016/j.csr.2004.06.008
Moriarty J. M., Friedrichs M. A. M., Harris C. K. (2021). Seabed resuspension in the chesapeake bay: Implications for biogeochemical cycling and hypoxia. Estuaries Coasts 44, 103–122. doi: 10.1007/s12237-020-00763-8
North E. W., Houde E. D. (2001). Retention of white perch and striped bass larvae: biological-physical interactions in Chesapeake Bay estuarine turbidity maximum. Estuaries 24, 756–769. doi: 10.2307/1352883
Pinto L., Fortunato A., Zhang Y., Oliveira A., Sancho F. (2012). Development and validation of a three-dimensional morphodynamic modelling system for non-cohesive sediments. Ocean Model. 57, 1–14. doi: 10.1016/j.ocemod.2012.08.005
Porz L., Zhang W., Schrum C. (2021). Density-driven bottom currents control development of muddy basins in the southwestern Baltic Sea. Mar. Geology 438, 106523. doi: 10.1016/j.margeo.2021.106523
Ralston D. K., Geyer W. R., Warner J. C. (2012). Bathymetric controls on sediment transport in the Hudson River estuary: Lateral asymmetry and frontal trapping. J. Geophys. Research: Oceans 117 (C10). doi: 10.1029/2012JC008124
Rao V. P., Shynu R., Kessarkar P. M., Sundar D., Michael G., Narvekar T., et al. (2011). Suspended sediment dynamics on a seasonal scale in the Mandovi and Zuari estuaries, central west coast of India. Estuarine Coast. Shelf Sci. 91, 78–86. doi: 10.1016/j.ecss.2010.10.007
Schoellhamer D. H. (2000). “Influence of salinity, bottom topography, and tides on locations of estuarine turbidity maxima in northern San Francisco Bay,” in Proceedings in marine science (Amsterdam: Elsevier). 3, 343–357. doi: 10.1016/S1568-2692(00)80130-8
Scully M. E., Friedrichs C. T. (2007). Sediment pumping by tidal asymmetry in a partially mixed estuary. J. Geophys. Research: Oceans 112 (C7). doi: 10.1029/2006JC003784
Shepard F. P. (1954). Nomenclature based on sand-silt-clay ratios. J. sedimentary Res. 24, 151–158. doi: 10.1306/D4269774-2B26-11D7-8648000102C1865D
Sommerfield C. K., Wong K. C. (2011). Mechanisms of sediment flux and turbidity maintenance in the Delaware Estuary. J. Geophys. Research: Oceans 116 (C1). doi: 10.1029/2010JC006462
Teng L., Cheng H., Zhang E., Wang Y. (2022). Lateral variation of tidal mixing asymmetry and its impact on the longitudinal sediment transport in turbidity maximum zone of salt wedge estuary. J. Mar. Sci. Eng. 10, 907. doi: 10.3390/jmse10070907
Uncles R., Stephens J. (1997). Dynamics of turbidity in the Tweed estuary. Estuarine Coast. Shelf Sci. 45, 745–758. doi: 10.1006/ecss.1997.0232
Uncles R. J., Stephens J. A. (1989). Distributions of suspended sediment at high water in a macrotidal estuary. J. Geophys. Res.: Oceans 94 (C10), 14395–14405. doi: 10.1029/JC094iC10p14395
Vinh V. D., Ouillon S. (2021). The double structure of the Estuarine Turbidity Maximum in the Cam-Nam Trieu mesotidal tropical estuary, Vietnam. Mar. Geology 442, 106670. doi: 10.1016/j.margeo.2021.106670
Wai O., Wang C., Li Y. S., Li X. (2004). The formation mechanisms of turbidity maximum in the Pearl River estuary, China. Mar. pollut. Bull. 48, 441–448. doi: 10.1016/j.marpolbul.2003.08.019
Wan Y., Zhao D. (2017). Observation of saltwater intrusion and ETM dynamics in a stably stratified estuary: the Yangtze Estuary, China. Environ. Monit. Assess. 189, 1–14. doi: 10.1007/s10661-017-5797-6
Wang H., Chen Q., Hu K., La Peyre M. K. (2017). A modeling study of the impacts of Mississippi River diversion and sea-level rise on water quality of a deltaic estuary. Estuar. coasts 40, 1028–1054. doi: 10.1007/s12237-016-0197-7
Wang J., Dijkstra Y. M., de Swart H. E. (2022). Turbidity maxima in estuarine networks: Dependence on fluvial sediment input and local deepening/narrowing with an exploratory model. Front. Mar. Sci. 9, 940081. doi: 10.3389/fmars.2022.940081
Wang J., Tong Y., Feng L., Zhao D., Zheng C., Tang J. (2021). Satellite-observed decreases in water turbidity in the Pearl River Estuary: Potential linkage with sea-level rise. J. Geophys. Research: Oceans 126, e2020JC016842. doi: 10.1029/2020JC016842
Wang P., Li Q., Li C.-F. (2014). Sedimentology (Amsterdam: Elsevier). doi: 10.1016/B978-0-444-59388-7.00004-4
Warner J. C., Sherwood C. R., Signell R. P., Harris C. K., Arango H. G. (2008). Development of a three-dimensional, regional, coupled wave, current, and sediment-transport model. Comput. geosciences 34, 1284–1306. doi: 10.1016/j.cageo.2008.02.012
Wei X., Cai S., Zhan W. (2021). Impact of anthropogenic activities on morphological and deposition flux changes in the Pearl River Estuary, China. Sci. Rep. 11, 16643. doi: 10.1038/s41598-021-96183-0
Winterwerp J., Van Kesteren W., Van Prooijen B., Jacobs W. (2012). A conceptual framework for shear flow–induced erosion of soft cohesive sediment beds. J. Geophys. Research: Oceans 117 (C10). doi: 10.1029/2012JC008072
Wu Z. Y., Saito Y., Zhao D. N., Zhou J. Q., Cao Z. Y., Li S. J., et al. (2016). Impact of human activities on subaqueous topographic change in Lingding Bay of the Pearl River estuary, China, during 1955-2013. Sci. Rep. 6, 37742. doi: 10.1038/srep37742
Xia X., Li Y., Yang H., Wu C., Sing T., Pong H. (2004). Observations on the size and settling velocity distributions of suspended sediment in the Pearl River Estuary, China. Continental Shelf Res. 24, 1809–1826. doi: 10.1016/j.csr.2004.06.009
Xu F. (2009). Modeling study of flocculation effects on sediment transport in estuaries (State University of New York at Stony Brook). PhD Thesis, Stony Brook University, Stony Brook, United States.
Xu F., Wang D.-P., Riemer N. (2010). An idealized model study of flocculation on sediment trapping in an estuarine turbidity maximum. Continental Shelf Res. 30, 1314–1323. doi: 10.1016/j.csr.2010.04.014
Xu H., Shen J., Wang D., Luo L., Hong B. (2021). Nonlinearity of subtidal estuarine circulation in the Pearl River Estuary, China. Front. Mar. Sci. 8, 629403. doi: 10.3389/fmars.2021.629403
Yang J., Liu W. (2015a). Evolution of the Maximum Turbidity Zone in the Lingding Bay of Pearl River Estuary over past 30 years. Pearl River Water Transport (16), 58–62.
Yang J., Liu W. (2015b). Variation of the maximum turbidity zone during the flood season in the Pearl River Estuary over the past 30 years. China Acad. J. doi: 10.14125/j.cnki.zjsy.2015.16.034
Yu Q., Wang Y., Gao J., Gao S., Flemming B. (2014). Turbidity maximum formation in a well-mixed macrotidal estuary: The role of tidal pumping. J. Geophys. Research: Oceans 119, 7705–7724. doi: 10.1002/2014JC010228
Yuan R., Zhu J., Wang B. (2015). Impact of sea-level rise on saltwater intrusion in the Pearl River Estuary. J. Coast. Res. 31, 477–487. doi: 10.2112/JCOASTRES-D-13-00063.1
Zhang G., Chen Y., Cheng W., Zhang H., Gong W. (2021a). Wave effects on sediment transport and entrapment in a channel-shoal estuary: the pearl river estuary in the dry winter season. J. Geophys. Research: Oceans 126, e2020JC016905. doi: 10.1029/2020JC016905
Zhang G., Cheng W., Chen L., Zhang H., Gong W. (2019). Transport of riverine sediment from different outlets in the Pearl River Estuary during the wet season. Mar. Geology 415, 105957. doi: 10.1016/j.margeo.2019.06.002
Zhang Y., Ren J., Zhang W. (2020). Flocculation under the control of shear, concentration and stratification during tidal cycles. J. hydrol. 586, 124908. doi: 10.1016/j.jhydrol.2020.124908
Zhang Y., Ren J., Zhang W., Wu J. (2021b). Importance of salinity-induced stratification on flocculation in tidal estuaries. J. Hydrol. 596, 126063. doi: 10.1016/j.jhydrol.2021.126063
Zhang Y. J., Ye F., Stanev E. V., Grashorn S. (2016). Seamless cross-scale modeling with SCHISM. Ocean Model. 102, 64–81. doi: 10.1016/j.ocemod.2016.05.002
Keywords: estuarine turbidity maximum, advection, tidal pumping, interconnection, model sensitivity
Citation: Ma M, Porz L, Schrum C and Zhang W (2024) Physical mechanisms, dynamics and interconnections of multiple estuarine turbidity maximum in the Pearl River estuary. Front. Mar. Sci. 11:1385382. doi: 10.3389/fmars.2024.1385382
Received: 13 February 2024; Accepted: 09 May 2024;
Published: 24 May 2024.
Edited by:
Wb Cheng, Center, TaiwanReviewed by:
Maarten Van Der Vegt, Utrecht University, NetherlandsYu-Pei Chang, National Central University, Taiwan
Copyright © 2024 Ma, Porz, Schrum and Zhang. This is an open-access article distributed under the terms of the Creative Commons Attribution License (CC BY). The use, distribution or reproduction in other forums is permitted, provided the original author(s) and the copyright owner(s) are credited and that the original publication in this journal is cited, in accordance with accepted academic practice. No use, distribution or reproduction is permitted which does not comply with these terms.
*Correspondence: Mengyao Ma, bWVuZ3lhby5tYUBoZXJlb24uZGU=; Wenyan Zhang, d2VueWFuLnpoYW5nQGhlcmVvbi5kZQ==