 David Lévesque
 Michel Lebeuf
 Michel Starr
- 1Maurice Lamontagne Institute, Fisheries and Oceans Canada, Mont-Joli, QC, Canada
- 2Québec-Océan, Université Laval, Québec, QC, Canada
Coastal hypoxia, driven by remineralization of chlorophyllic particulate organic matter (POM) in dark environments, poses a threat to deep estuarine and shelf ecosystems. To better understand the fate of POM along a depth gradient, we investigated the degradation of chloropigments, particulate organic carbon (POC), and nitrogen (PON) across the water column in the St. Lawrence Estuary, one of the largest and deepest estuarine system in the world that is facing strong persistent and increasing hypoxia. Our objectives were to establish causal relationships among suspended POM descriptors and assess the potential of a chlorophyll-based degradation index, known as the chlorin index (CI), in evaluating OM degradation within the water column. The CI, ranging from 0.2 for pure chlorophyll to almost 1 for highly degraded pigments, was initially developed for uses in the sediments. Water samples from multiple depths were collected, characterized, and statistically analyzed with a combination of variation partitioning, non-linear regressions and piecewise structural equation modeling (pSEM). We found that the combined influence of chloropigments and depth explained 84.0% of POC and 90.0% of PON variations; the pure fraction attributed to chloropigments accounted for 73.4% and 75.6% (R2 adj, both with p< 0.001), respectively. The decline of chloropigments, PON, and POC with increasing depth was reflected by the concomitant increase in CI, whose rate decreases as particles sink resulting in reduced degradation due to less labile organic matter. The pSEM causal model indicated that CI increased with depth and POC concentration, while it decreased in the presence of elevated PON concentrations, known for their high reactivity. The direct effect of depth on CI could be linked to the distinct water column properties influencing particle residence time and thus the degradation potential by biotic and abiotic factors. Finally, CI explained 86% (R2) of the apparent oxygen utilization highlighting the strong connection between POM degradation and hypoxia of deep coastal ecosystems. Our study underscores the utility of the chlorin index as a simple yet robust tool for monitoring OM degradation in the water column, particularly in the St. Lawrence Estuary.
1 Introduction
The importance of organic matter (OM) in the biochemical cycles of major elements, particularly carbon and nitrogen, holds profound implications, especially within estuaries and shelves. Despite covering only about 8% of the entire ocean surface, these ecosystems make a disproportional contribution to carbon sequestration (Borges et al., 2005). On a global scale, the sum of organic and inorganic carbon flux across estuaries and shelves (0.95 Pg C/yr) is ~30% smaller than the combined inputs from rivers (0.95 Pg C/yr) and the atmosphere (0.4 Pg C/yr) emphasizing the significance of carbon sequestration in coastal ocean environments estimated at approximately 0.35 Pg C/yr (Regnier et al., 2022). Carbon sequestration occurs primarily within the illuminated water column, where primary producers, predominantly phytoplankton, convert dissolved inorganic carbon and nutrients into OM via photosynthesis. A fraction of this biologically fixed carbon, combined with lateral transport of terrigenous particulate organic matter by rivers and adjacent ecosystems, sinks to greater depths in the form of particles composed of intact phytoplankton cells, fecal pellets, and aggregates. Depending on the depth and latitude, five to 100% of this OM is exported below the photic zone (Dunne et al., 2005; Laws et al., 2011), where degradation through microbial respiration occurs. This degradation can oxidize OM to intermediate organic compounds or directly to carbon dioxide (carbon remineralization) that is then available to cycle through the biological pump again. The duration of this sequestration at depth varies from month to millennia and significantly impact climate regulation (DeVries et al., 2012; Boyd et al., 2019). Because it is considered a central mechanism in ocean functioning, the biological pump has been studied thoroughly from a quantitative point of view (Boyd and Trull, 2007; Nowicki et al., 2022) and from a theoretical angle to disentangle biological and physical processes implicated (Claustre et al., 2021; Siegel et al., 2023), but little is known on the environmental drivers influencing this crucial process.
Moreover, the remineralization of particulate organic matter (POM) in the dark aquatic environments leads to oxygen consumption. In stratified coastal waters receiving anthropogenic inputs of nutrients and OM, this O2 depletion can become important enough to tip the bottom water balance toward hypoxia (< 2 mg/L) (Diaz and Rosenberg, 2008; Rabalais et al., 2014). This degradation process is influenced by both the intrinsic properties of the organic matter, including the chemical structure of POM, and environmental factors, as recently pointed out for dissolved OM by Berggren et al. (2022). A partial degradation of particulate organic carbon (POC) and nitrogen (PON) can be tracked while sinking through the water column and sediments by measuring chlorophyll and its decomposition products, specifically phaeophytins and chlorins (Caron et al., 2004; Schubert et al., 2005; Legendre et al., 2015). The simple view where particles either sink or are consumed by zooplankton before being recycled by microbes have been complexified to account for physical processes (Boyd et al., 2019), aggregation/disaggregation (Lam and Marchal, 2015), including the role of transparent exopolymer (Passow and Alldredge, 1994), while the importance of the suspended fraction has grown in scale (Hemsley et al., 2023). Furthermore, the microbial respiration-driven degradation of POC and PON, directly linked to oxygen consumption, can be investigated with apparent oxygen utilization (AOU) as an indicator (Aristegui et al., 2002; Shetye et al., 2021).
In this context, there is a critical need to investigate the fate of chlorophyllic POC and PON along a depth gradient in deep estuaries and shelf ecosystems to better understand its role on coastal hypoxia. While POC and PON relationships with depth have been used to derive remineralization depth estimates from satellite imagery (Moreau et al., 2020; Maniaci et al., 2022), and to track carbon along the food chain (Wassmann, 1997; Legendre and Michaud, 1999), there has been comparatively less research focusing on the connection between the fate of chlorophyllic matter, OM respiration and deoxygenation (Suess, 1980; Doval and Hansell, 2000; Zhang, 2022). Gaining knowledge in this area could provide valuable insights into the dynamics of coastal ecosystems and guidance to inform management strategies.
In this study, the degradation of POC, PON and chlorophyll across the water column was investigated within the large and deep estuary of the St. Lawrence River. The specific objectives were twofold: 1) to establish causal relationships among suspended OM descriptors (POC, PON and chlorophyll) that are involved in the biological pump, and 2) to evaluate the potential of a chlorophyll-based degradation index, known as the chlorin index (CI), for assessing OM degradation within the water column and its relationship to deoxygenation. The chlorin index has been previously developed for uses in the sediments (Schubert et al., 2005). Depth is expected to mediate the concentration of chlorophyll, which is anticipated to serve as a predictor of particulate organic carbon (POC) and particulate organic nitrogen (PON). These latter should influenced the CI differently, with a positive effect for POC and a negative effect for PON, as nitrogen is preferentially degraded. Finally, CI is expected to reflect the state of particulate organic matter degradation, which should exhibit a positive relationship with deoxygenation.
2 Methods
2.1 Study area
The St. Lawrence Estuary is a notable estuarine system, distinguished by its substantial depth and size, ranking among the largest worldwide (El-Sabh and Silverberg, 1990). It can be divided into two distinct zones based on ecosystem properties: the upper St. Lawrence Estuary (USLE) and the lower St. Lawrence Estuary (LSLE) (Figure 1). The USLE is formed by the expansion of the St. Lawrence River near Quebec City and stretches approximately 200 km to the mouth of the Saguenay Fjord. Downstream from the Saguenay Fjord mouth, the LSLE begins, stretching seaward for about 250 km seaward until it reaches Pointe-des-Monts, where it joins the Gulf of St. Lawrence. Along its course, the LSLE gradually widens from 20 km to 50 km. The bathymetry of the LSLE is distinguished by the presence of the Laurentian channel, an extensive sound with depths ranging from 300 to 500 m, extending over a distance of 800 km to Cabot Strait in the Gulf. At the head of the Laurentian channel, an abrupt rise in the seafloor forms a shallow sill (< 40 m) acting as a barrier that separates the LSLE from the USLE. The former exhibits an estuarine circulation system with three layers. The surface water layer (0–40 m) flows seaward, while the intermediate layer (40–140 m) consists of a cold water mass formed during winter (Galbraith, 2006). The dense and nutrient rich deep-water layer (> 140 m) flows landward along the bottom of the Laurentian Strait. This landward flow ceases when it encounters the sill, and it partially propagates upwards, giving rise to various hydrodynamic processes near the mouth of the Saguenay Fjord (Saucier and Chassé, 2000). The deep-water layer originates from the Atlantic Ocean and is a mixture of the Labrador current and the Gulf Stream (Claret et al., 2018). Consequently, the LSLE displays more oceanic characteristics compared to most other estuaries (El-Sabh and Silverberg, 1990). The LSLE is a highly productive region (Therriault et al., 1990; Le Fouest, 2005) supporting a high biodiversity and important commercial fisheries (Savenkoff et al., 2007). However, over the last century, the dissolved oxygen concentrations of the deep waters of the LSLE have undergone a dramatic decline, plummeting from 4 mg/L to less than 1 mg/L, resulting in severe and permanent hypoxic conditions (Gilbert et al., 2005; Blais et al., 2023). The primary driver of this decline seems to be the changes in the large-scale ocean circulation which are bringing more warm oxygen-poor water from the Gulf Stream over the cold oxygen-rich water of the Labrador Current, due to climate change (Claret et al., 2018; Jutras et al., 2023). A related consequence of the warming of the waters is the increase in bacterial respiration, fuelled by the substantial nutrients and OM discharge from the St. Lawrence River (Hudon et al., 2017) and influx from the Gulf and ocean in the deep layer (Lévesque et al., 2023). Overall, these conditions provide a unique opportunity to investigate the link between the degradation of POC and PON originating from chlorophyll and the phenomenon of deoxygenation.
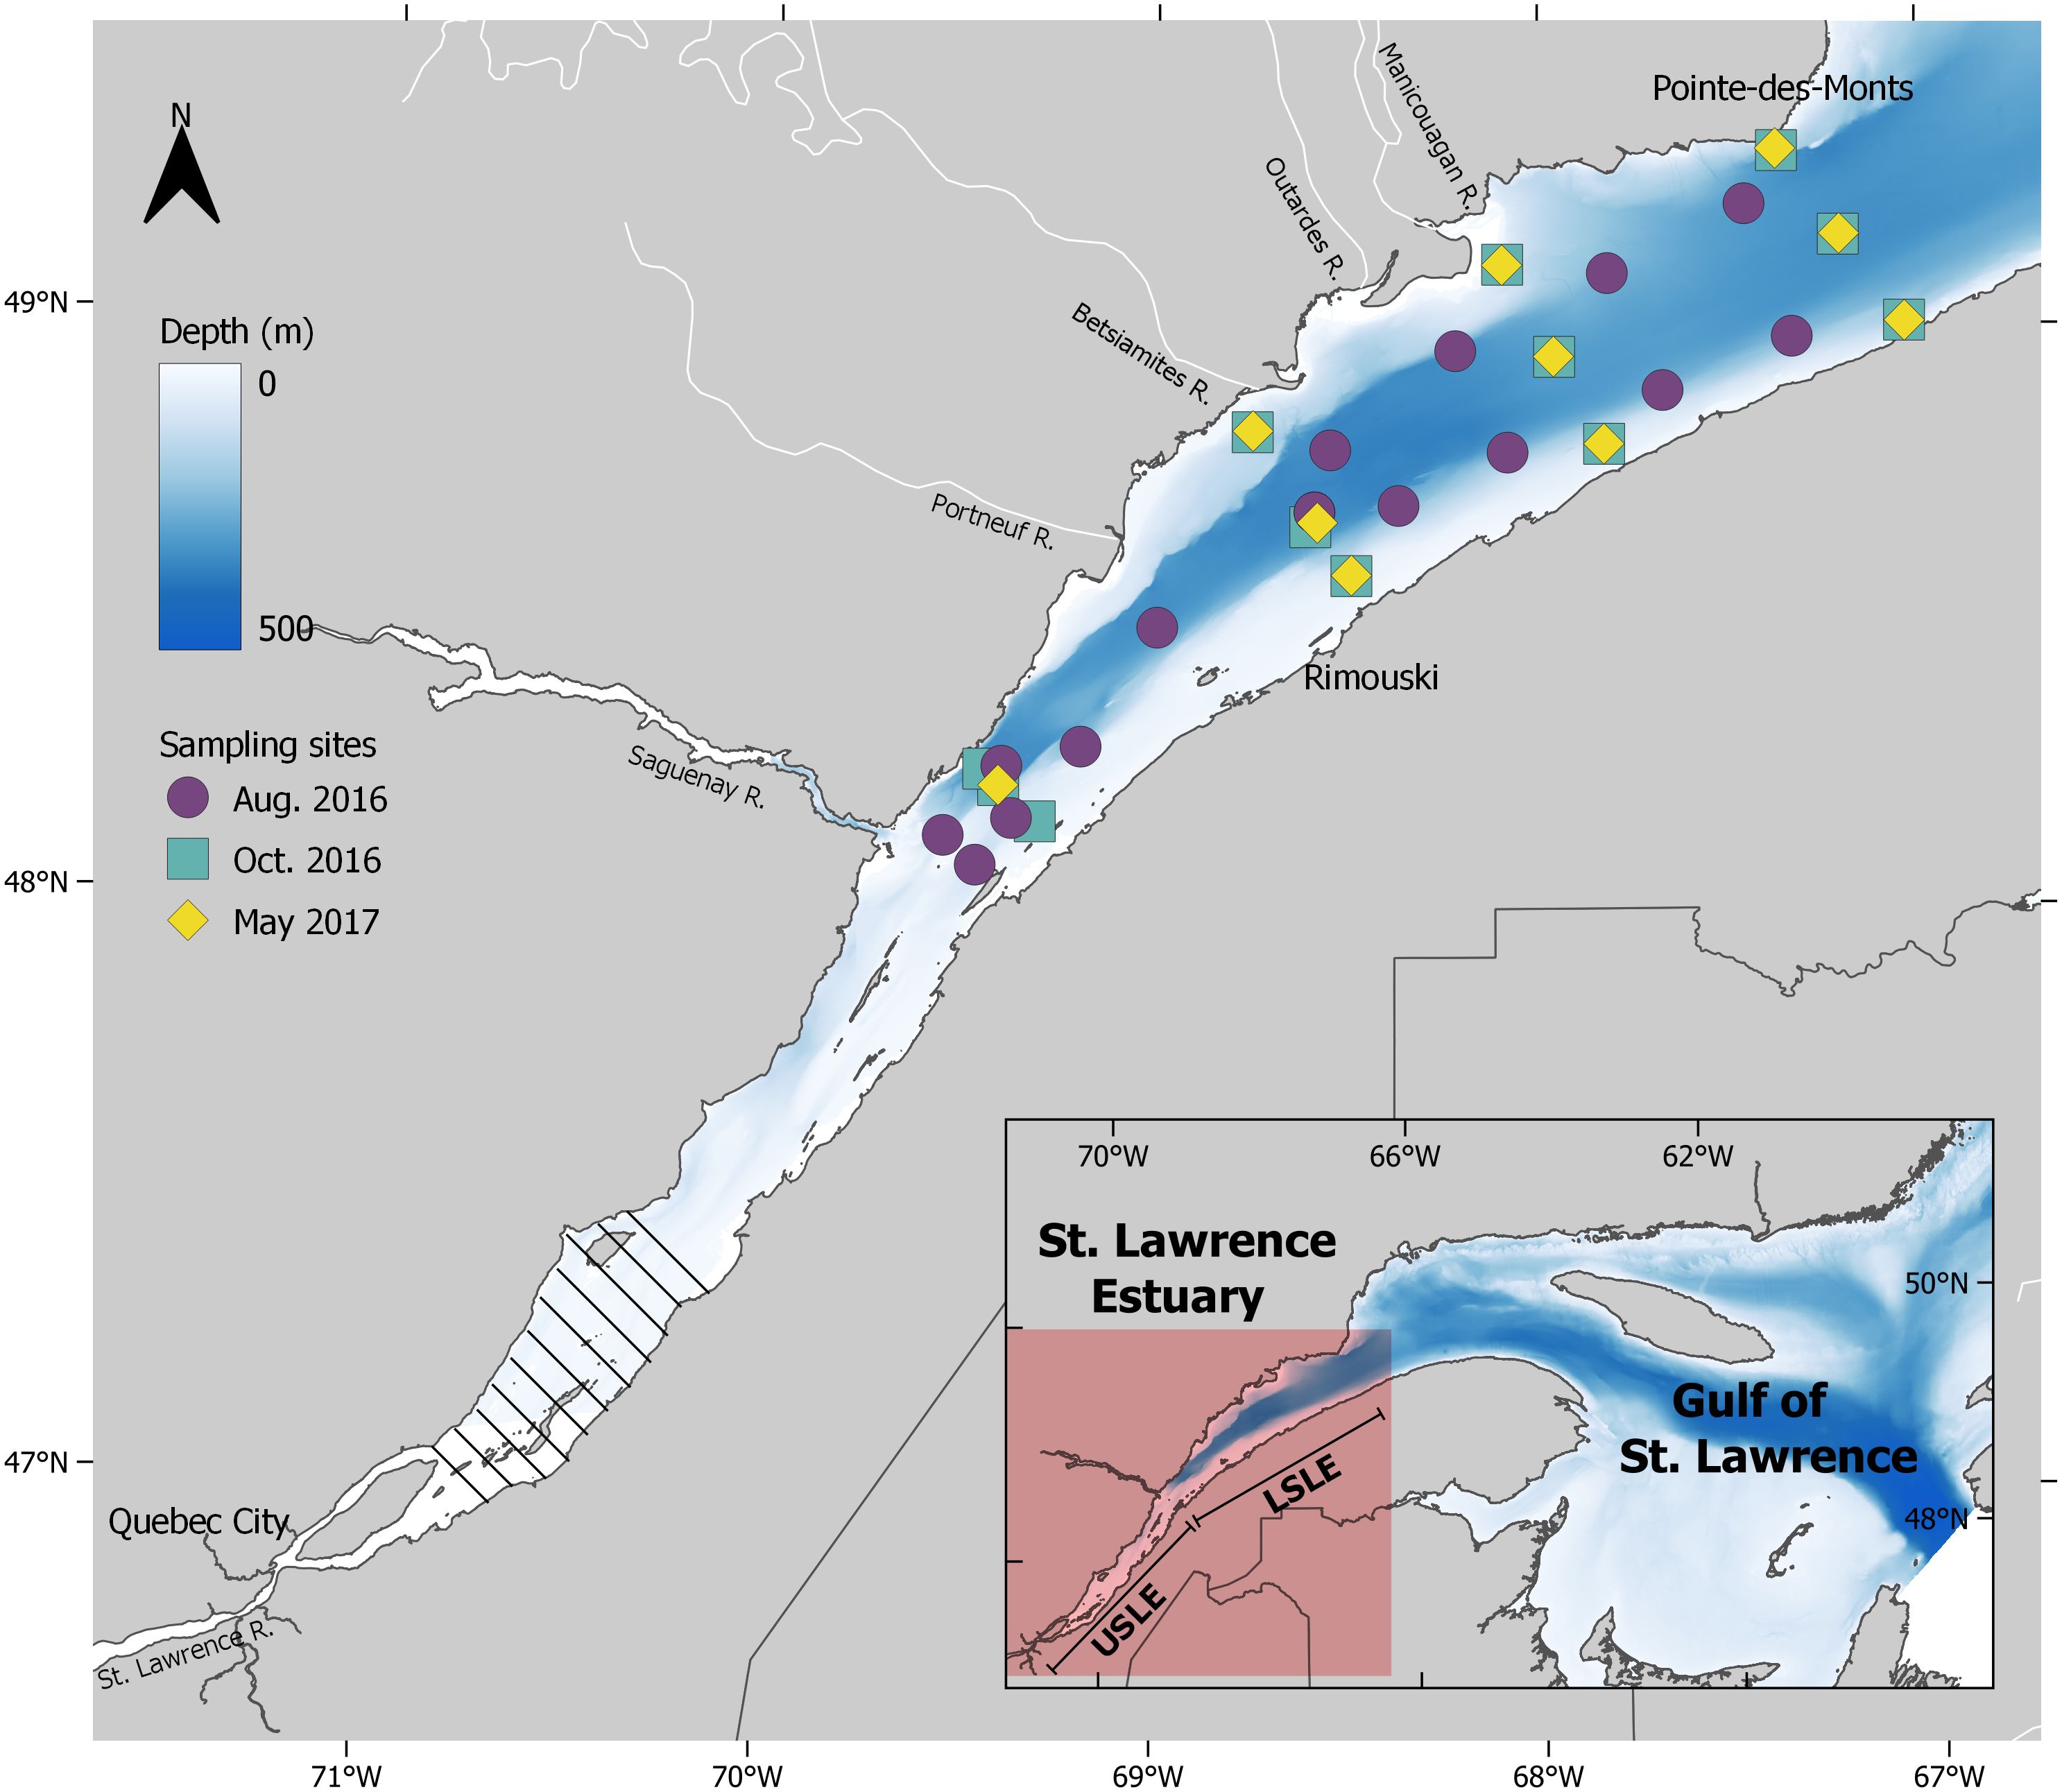
Figure 1 Sampling sites for the August 2016, October 2016 and May 2017 time periods in the lower St. Lawrence Estuary downstream of the maximum turbidity zone (hatched area). Modified from Lévesque et al., 2023.
2.2 Sampling
Water samples were collected from the LSLE during three distinct time periods: in August 2016 and May 2017 onboard the Canadian Coast Guard ship Frederick G. Creed, and in October 2016 onboard the Canadian Coast Guard ship Hudson (Figure 1). A conductivity-temperature-depth (CTD, seabird, SBE 19plus V2 SeaCAT) profiler attached to a rosette equipped with either 5.5 or 10 L Niskin bottles was deployed at each station. Additionally, auxiliary sensors measuring turbidity (ECO FLNTU, range of 0–20 NTU) and dissolved O2 (SBE 43 Dissolved Oxygen Sensor) were integrated into equipment. The rosette was lowered to approximately 10 m above the sediments, and water samples were collected during its ascent. Upon retrieval, the collected water was passed through a 180 µm sieve and stored in a 7.8 L insulated container for subsequent processing aboard the ship. In total, 203 water samples were collected, with the number of samples per station carefully selected to adequately represents the presence of each of the three layers (surface: 0–40 m, intermediate layer: > 40–140 m, and deep layer: > 140 m). Consequently, the number of samples ranged from four to eight depending on the water column depth.
2.3 Chemical analyses
Total suspended matter (TSM) and particulate inorganic matter (PIM) concentrations in the water samples were determined by filtering triplicates using pre-combusted and pre-weighted GF/F filters (Whatman, 25 mm, 0.7 μm pore sizes). To assure homogeneity, the water samples were thoroughly mixed by inversion inside the insulated container before filtration. The filtered volume ranged from 0.6 L to 1.9 L depending on the TSM load present in the sample. Afterward, the filters were rinsed twice with 15 ml of ultrapure Millipore-Q water to remove any salt residues. Filters were then stored at −20°C until they could be dried at 70°C for weight measurement on a microbalance. Following drying, the filters were combusted at 450°C for 5 h to determine the weight of PIM. A coefficient of variation of< 20% served as the acceptance criterion for both TSM and PIM, resulting in a precision of 6.2 ± 4.8% and 6.9 ± 5.9%, respectively.
The concentration of POC (mg C/L) and PON (mg N/L) in the samples were determined by filtering the water through pre-combusted 25 mm glass fiber filters (GF/F, Whatman, 0.7 μm pore sizes). Approximately 25% of the samples were analyzed as laboratory duplicates. The filters were placed facing up in a Petri dish, wrapped in aluminum foil, and frozen at –20°C before the analysis. Afterward, the filters were dried at 70°C for 4 h, cooled in a desiccator and encapsulated in an acetone-cleaned tin sheet before being analyzed with a Costech ECS 4010 analyzer. The analytical precision, expressed as the coefficient of variation, was 6.2 ± 5.8% for POC and 7.8 ± 9.5% for PON.
Chlorophyll a (µg/L) and phaeopigment concentrations were measured by filtering water through 25 mm glass fiber filters (GF/F, Whatman, 0.7 μm pore sizes). Phaeopigments are chlorophyll degradation products resulting mainly from algal cell senescence and zooplankton grazing. The filters were stored in a Petri dish, wrapped in aluminum foils, and frozen at –80°C prior to analysis. Subsequently, the filters were extracted in 10 ml of 90% acetone for 18 h under dark conditions at 4°C, and then centrifuged 10 minutes at 1470 rpm. The resulting extract was measured fluorometrically using a Turner Design Trilogy model before and after acidification (Arar and Collins, 1997). Active chlorophyll a and phaeopigment (inactive) concentrations in the extracts were calculated according to Arar and Collins (1997). Laboratory duplicates were analyzed for about 25% of the samples. In the present paper, the sum of active chlorophyll a (chla) and phaeopigments, termed chloropigments has been used as an indicator of the total pool of pigment in the water column. Chlorin index (CI) was measured following Schubert et al. (2005) as the ratio of the fluorescence measurement of the acidified extract to that of the original extract. The CI scale ranges from 0.2 for pure chlorophyll to almost 1 for highly degraded pigments. It serves as an indicator of organic matter degradation in sediments (Schubert et al., 2005; Alkhatib et al., 2012), and was tested for its relevance to TSM in the water column of lakes (Köllner et al., 2013). Dissolved oxygen levels (mg O2/L) were assessed by the Winkler titration method (Hansen, 1999) at multiple (≥ 2) depths for each station. These measurements further served to calibrate the SBE-43 oxygen sensor for each profile.
2.4 Statistical analysis
2.4.1 Vertical structure of LSLE
Vertical environmental heterogeneity in the LSLE was examined through principal component analysis (PCA) using the FactoMineR package (Lê et al., 2008). To ensure comparability, the variables were standardized to unit variance. Highly collinear variables were excluded from the multivariate analysis; turbidity was kept in the analysis over TSM (mg/L) and PIM (mg/L) based on Pearson’s correlation of 0.97 and 0.98, respectively. The LSLE is typically characterized by three vertical layers exhibiting distinct temperature and salinity characteristics. In this study, dissimilarities among these layers were investigated by incorporating additional environmental parameters including turbidity, chloropigments (µg/L), chloropigments/TSM (‰), CI, and PIM/TSM (%) through a linear discriminant analysis (LDA) using the MASS package (Venables and Ripley, 2002). The objective of the LDA was to assess the respective contributions of these variables in discriminating between the three layers.
Additionally, to investigate the vertical environmental structure within the LSLE, environmental variables and POM (POC, PON, POC/TSM, PON/TSM) were compared among depth layers (Surface, intermediate, deep) using a nonparametric Kruskal-Wallis test from the stat package (R Core Team, 2021). In cases where Kruskal-Wallis test yielded significant results (p< 0.05), a subsequent Dunn’s test was utilized for conducing multiple comparisons. To account for multiple testing, a Holm’s correction was applied to the p-values (FSA package) (Ogle et al., 2023).
2.4.2 POM as a sinking chlorophyll product
Changes in POC and PON concentrations were examined separately through multiple regressions and variation partitioning (Borcard et al., 1992). This analytical approach facilitated the exploration of the interrelationship among POM concentrations, chloropigments, and depth within LSLE. The variation in POM was divided among the explanatory variables, allowing us to determine the portion of the variance explained by each variable individually, collectively, purely, jointly, and the portion that remained unexplained (vegan package) (Oksanen et al., 2022). Permutation tests were used to assess the statistical significance of these fractions, excluding the jointly explained fraction, which was obtained by difference and thus cannot be tested (Legendre and Legendre, 2012). Additionally, the influence of seasonality was accounted for by incorporating the Julian day of sampling, while spatial structure was modelled from the geographical coordinates of sampling sites with trend surface analysis.
2.4.3 Relationship between chlorin index and depth
Considering the substantial explanatory power of chlorophyll degradation in accounting for variations in POM concentration (see results), we explored the potential utility of an index based on chlorophyll degradation state, termed the Chlorin Index (CI), for estimating POM levels. The relationship between CI and depth was investigated through nonlinear asymptotic regression, expressed as , using the stat package (R Core Team, 2021). This regression model was chosen to provide a mechanistic understanding of the organic matter degradation process. In the equation, CI exhibited a rise from its lowest values in surface water, towards its asymptotic value. The slope (c) represented the decreasing rate of CI as chlorophyll degraded further with increasing depth. The parameter b represents the intercept, indicating the CI value at the surface estimated by the model. The asymptote was hypothesized to represent a threshold beyond which organic matter degradation ceased in the water column, either due to reaching bottom or the OM becoming highly recalcitrant. To calculate the degradation rate at a specific depth (cdepth), the first derivative was applied, given by .
2.4.4 Relationship between chlorin index and POM
Similarly, the impact of the degradation of POC and PON on CI was examined through an asymptotic exponential decay model expressed as using the drc package (Ritz et al., 2015). In this equation, X denotes the concentration (mg At/L) of POC or PON. CI is at its lowest in water with high POM concentration, and it increases as POM concentration decreases, indicating decreased reactivity. The asymptote corresponds to the highest CI values of the LSLE. The parameter b represents the intercept, indicating the CI value when POM concentration reaches zero. The parameter k represents the relative reduction in CI for every 1 mg At/L increase in POM concentration. The degradation rate at a specific depth (cdepth), obtained from the first derivative, can be calculated as .
2.4.5 Linking chlorin index to POM degradation in the water column
The goal here was to investigate the potential utility of CI as an index for assessing organic matter degradation in the water column. To achieve this, a piecewise structural equation modelling (pSEM) approach was employed following the methodology outlined by Lefcheck and Freckleton (2015). This approach allowed us to examine the relative strengths of direct and indirect relationships among CI, POC, PON, chloropigments, and depth. Piecewise structural equation modelling enables the integration of various regression models into a cohesive causal network (Grace et al., 2012; Lefcheck and Freckleton, 2015).
Briefly, a causal network connecting all studied variables is initially hypothesized. Then individual regression models are built with the flexibility to incorporate hierarchical structure, interactions, random effects, and correlation structures (Shipley, 2009; Lefcheck and Freckleton, 2015). Subsequently, nonsignificant paths (p ≥ 0.05) are removed to obtain the best-supported model while ensuring that no essential links are omitted. This selection procedure is accomplished by assessing the chi-squared statistic, which compares the difference in log-likelihood of each submodel and the model containing all possible paths (Shipley and Douma, 2020). Upon completion, this procedure yields a framework that facilitates the standardized comparison of various indirect and direct causal effects. In the selected pSEM model, standardized path coefficients represents the strength of the relationship linking two variables. When the standardized path coefficient approaches 1 or −1, it indicates a strong relationship. Conversely, when it is close to 0, the path of effect is weak. Furthermore, an R² value is generated for each response variable. Individual (multiple) regression models were built using glm function of the stat package. The pSEM analysis was conducted using the piecewiseSEM (Lefcheck and Freckleton, 2015) and semEff (Murphy, 2022) packages within the R software.
2.4.6 Relationship between apparent oxygen utilization and chlorin index
Apparent oxygen utilization (AOU) is defined as the difference between measured oxygen concentration and the oxygen solubility values at saturation. Typically, this difference is attributed to biological processes, i.e., respiration, assuming that the water mass is not subject to mixing. Apparent oxygen utilization (mg O/L) was calculated using the equation developed by Benson and Krause (1984). The package gsw was used to compute absolute salinity, potential temperature, and density as intermediate steps in the calculation process (Kelley et al., 2022).
Furthermore, the relationship between AOU and CI was examined using a nonlinear Weilbull regression with three parameters. This model is represented as , where d represents the asymptote associated to the maximum values of AOU in LSLE, b is a coefficient that reflects the steepness of the slope, and e denotes the inflection point of the function. This analysis aimed to explore the association between OM degradation and oxygen depletion in the LSLE.
3 Results
3.1 Vertical structure of LSLE
Vertical structure in the environmental conditions within the LSLE was investigated using PCA (Figure 2). The first two axes explained 70.7% of the total variance in the environmental conditions. Along the first axis, accounting for 52.0% of the variance, the sampling points in the surface layer exhibited a more extensive distribution and were positioned in contrast to the ones of the deep layer. The various sampling points in the intermediate layer occupied an intermediate position between the other two layers on the first axis, exhibiting a greater overlap with the deep layer. The spread of some of the surface layer sites was associated to the spring freshet on the first axis and to the fall mixing on the second axis. Water temperature, POC, PON, chloropigments, and chloropigments/TSM were inversely related to PIM/TSM, depth, and salinity on the first PCA axis. This gradient reflected the high primary production in surface waters associated with elevated temperatures, transitioning towards more degraded matter, as indicated by higher CI values, and increased inorganic content with increasing depth. On the second PCA axis, contributing to 19.4% of the variance, an increase in turbidity and PIM/TSM was associated with a decrease in salinity.
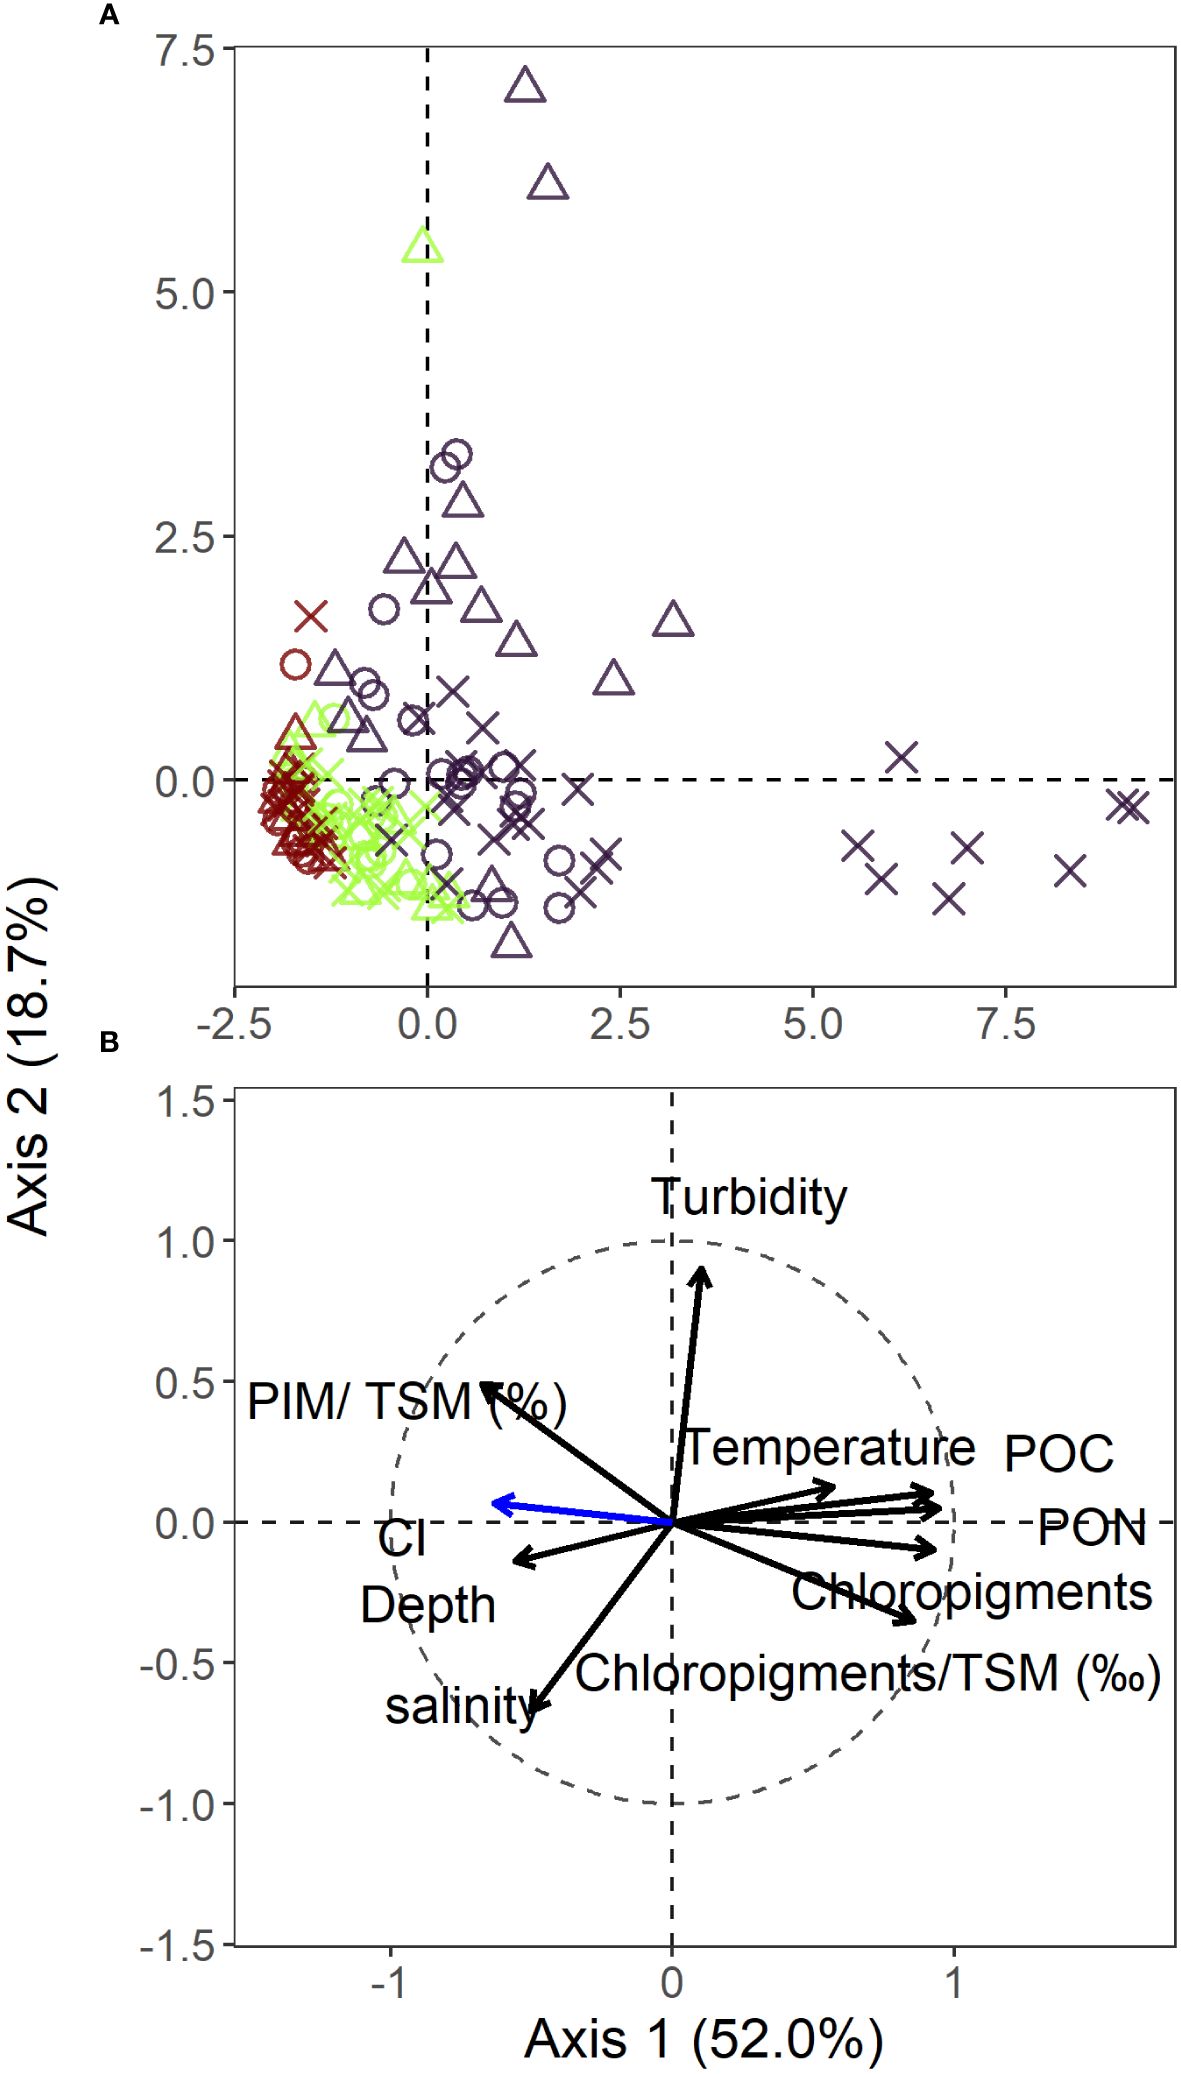
Figure 2 Principal component analysis (PCA) biplot based on correlations among environmental variables of the LSLE (n = 239). Sites (A) and environmental variables (B) are represented separately. CI (blue arrow) was added as a supplementary variable in the ordination space and, thus, was not included in the eigenvalue calculations since it is considered a response variable. Dark purple = surface, green = intermediate layer, dark red = deep layer. × = spring freshet, empty circle = summer lowflow, empty triangle = fall mixing.
The LDA analysis provided strong evidence for classifying the LSLE into three distinct layers with a classification accuracy of 89.2% for the surface layer, 72.4% for the intermediate layer, and 100.0% for the deep layer. Chlorin index and salinity emerged as the most important discriminating factor in the first canonical axis, explaining 80.0% of the variation among groups. The second axis, contributing to 20.0% of the variation among groups, was primarily influenced by temperature and salinity.
Consistent with these findings, temperature and salinity exhibited variations across the different layers as determined by Kruskal-Wallis nonparametric analysis of variance followed by Dunn’s test (Table 1, Supplementary Figure 1). Salinity levels increased from a median value of 28.60 in the freshwater-influenced surface layer to 34.27 in the deep layer. Temperature decreased from the surface layer (median of 5.68 ˚C) to the intermediate layer (median of 2.04 ˚C), while the deep layer fell in between (median of 5.16˚C). Turbidity levels and concentrations of TSM and PIM were high in the surface layer (respectively with a median of 0.723 NTU, 1.124 mg/L, and 0.725 mg/L), low in the intermediate layer (median of 0.319 NTU, 0.323 mg/L, and 0.251 mg/L, respectively), and in between in the deep layer (median of 0.461 NTU, 0.501 mg/L and 0.415 mg/L, respectively). The PIM/TSM ratio was lower in the surface and intermediate layers, with median values of 71.1% and 75.8%, respectively, compared to the deep layer (median of 85.2%). Finally, dissolved O2 concentrations were highest in the surface and intermediate layers (median of 9.90 and 9.35 mg O2/L, respectively), with significantly lower values observed in the deep waters (median of 2.08 mg O2/L) (Table 1, Supplementary Figure 1).
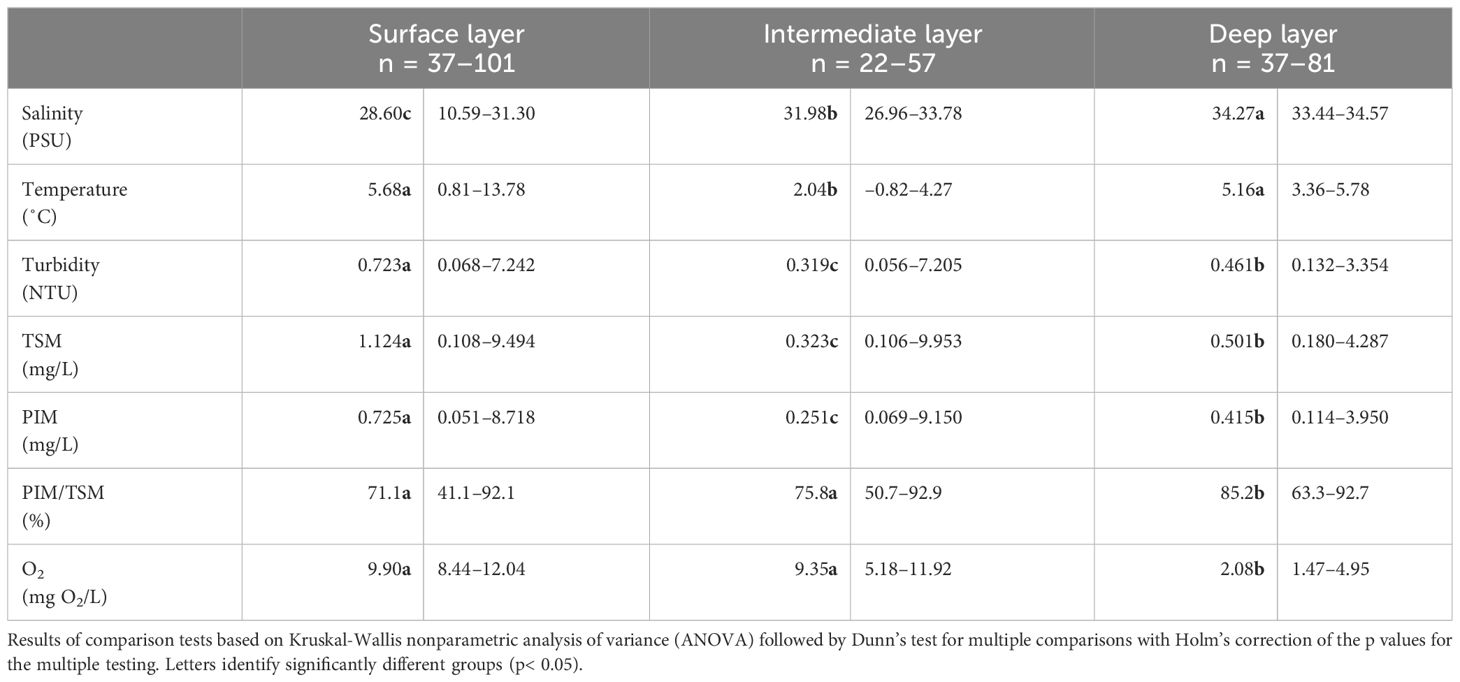
Table 1 Median and range of physical and chemical properties in the water column of the LSLE.
The concentrations of POC and PON were highest in the surface layer (median of 0.120 mg C/L and 0.020 mg N/L), moderate in the intermediate layer (median of 0.047 mg C/L and 0.006 mg N/L), and at their minimum in the deep layers (median of 0.037 mg C/L and 0.002 mg N/L) as determined by Kruskal-Wallis nonparametric analysis of variance followed by Dunn’s test (Table 2, Supplementary Figure 2). When normalizing their concentrations by the amount of particles (POC/TSM and PON/TSM), highest values were found in the surface (median of 16.9% and 2.90%, respectively) and intermediate (median of 12.4% and 1.94%, respectively) layers, while the lowest values were recorded in the deep layer (median of 5.3% and 0.61%, respectively). Median chloropigment concentrations and chloropigments/TSM ratios were highest in the surface layer (2.11 µg/L and 2.89 ‰) and exhibited a gradual decline as depth increased, through the intermediate layer (0.34 µg/L and 1.12 ‰), reaching their nadir in the deep layer (0.18 µg/L and 0.29 ‰) (Table 2, Supplementary Figure 2). Conversely, CI exhibited an inverse pattern, increasing with depth with median values ranging from 0.4 at the surface to 0.66 in the deep layer.
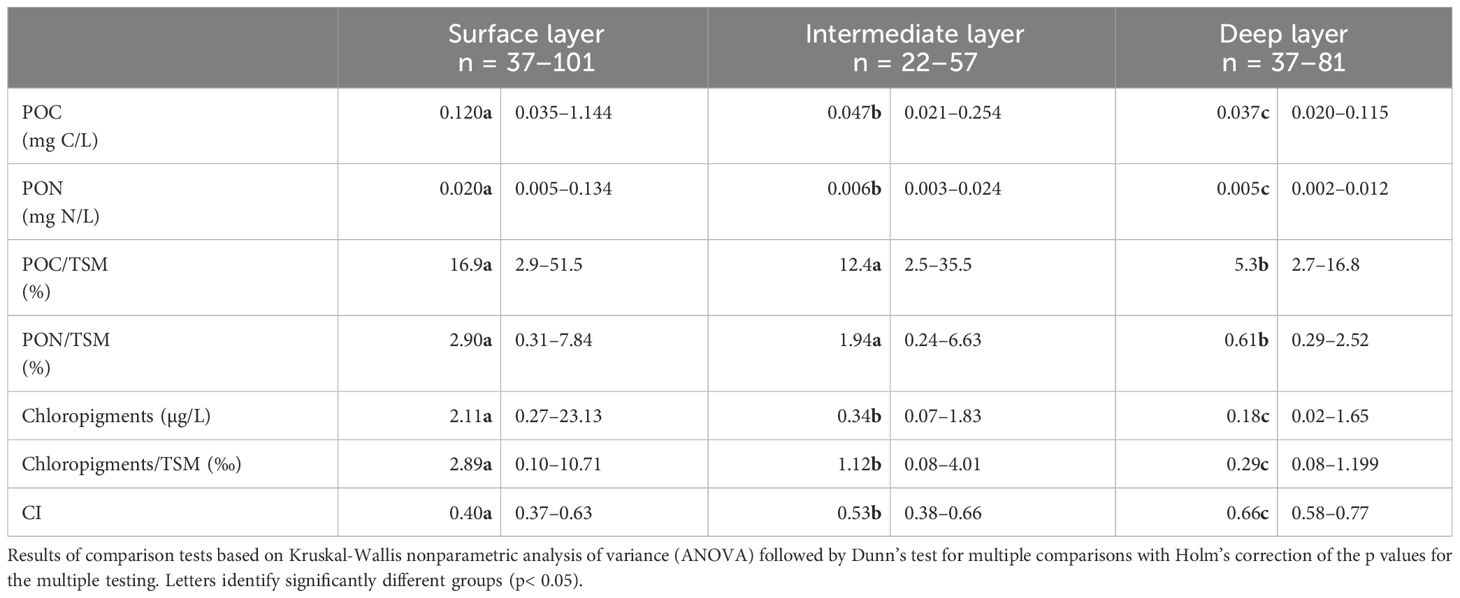
Table 2 Median and range of POM indicators and concentrations in the LSLE.
3.2 POM as a sinking chlorophyll product
Multiple regression models, combined by variation partitioning, revealed that chloropigments exerted a positive effect, while depth had negative influence, affecting both POC and PON. The combined influence of chloropigments and depth explained up to 84.0% of POC and 90.0% of PON variations within the LSLE (Table 3). Specifically, the pure fraction attributed to chloropigments accounted for 73.4% and 75.6% (R2 adj, both with p< 0.001) of the variation in POC and PON (Supplementary Figure 3), respectively, while the pure contribution of depth was negligible, explaining 0% (p > 0.05) of POC variation and only 0.4% (p = 0.04) of PON variation. The fraction explained jointly by chloropigments and depth accounted for 10.6% of the variation in POC and 14.0% in PON (this fraction cannot be tested for its significance with variation partitioning per se). Neither space nor time exhibited significant effects in the model selection process.
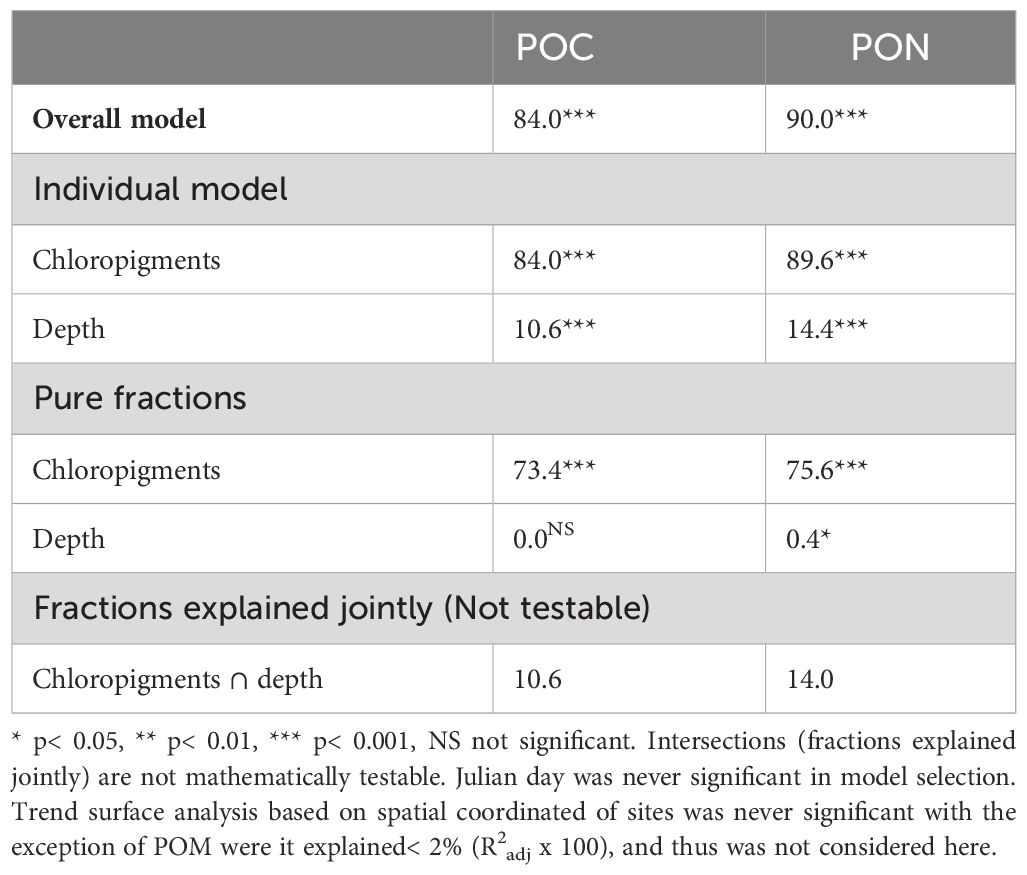
Table 3 Variation partitioning (R2 adj × 100) of POC (mg C/L) and PON (mg N/L) using chloropigments (μg/L) and depth (m).
3.3 Relationship between chlorin index and depth
In the LSLE, CI ranged from 0.37 for fresh organic matter at the surface to 0.77 for degraded OM at depth. A non-linear asymptotic regression model (Figure 3A) provided the best fit for the relationship between CI and depth, explaining 85% (R2) of the CI variation. Certain measurements taken near the seabed appear to display resuspension events, resulting in values that exceed the curve. This implies a more degraded POM (higher CI) than what is predicted based on depth. The degradation rate ranged from 0.0028/m at the surface to 0.000192/m at 320 m, representing a 14.6-fold decrease. Incorporating hydroperiod as a random effect did not improve the relationship, indicating its universality for off-ice season.
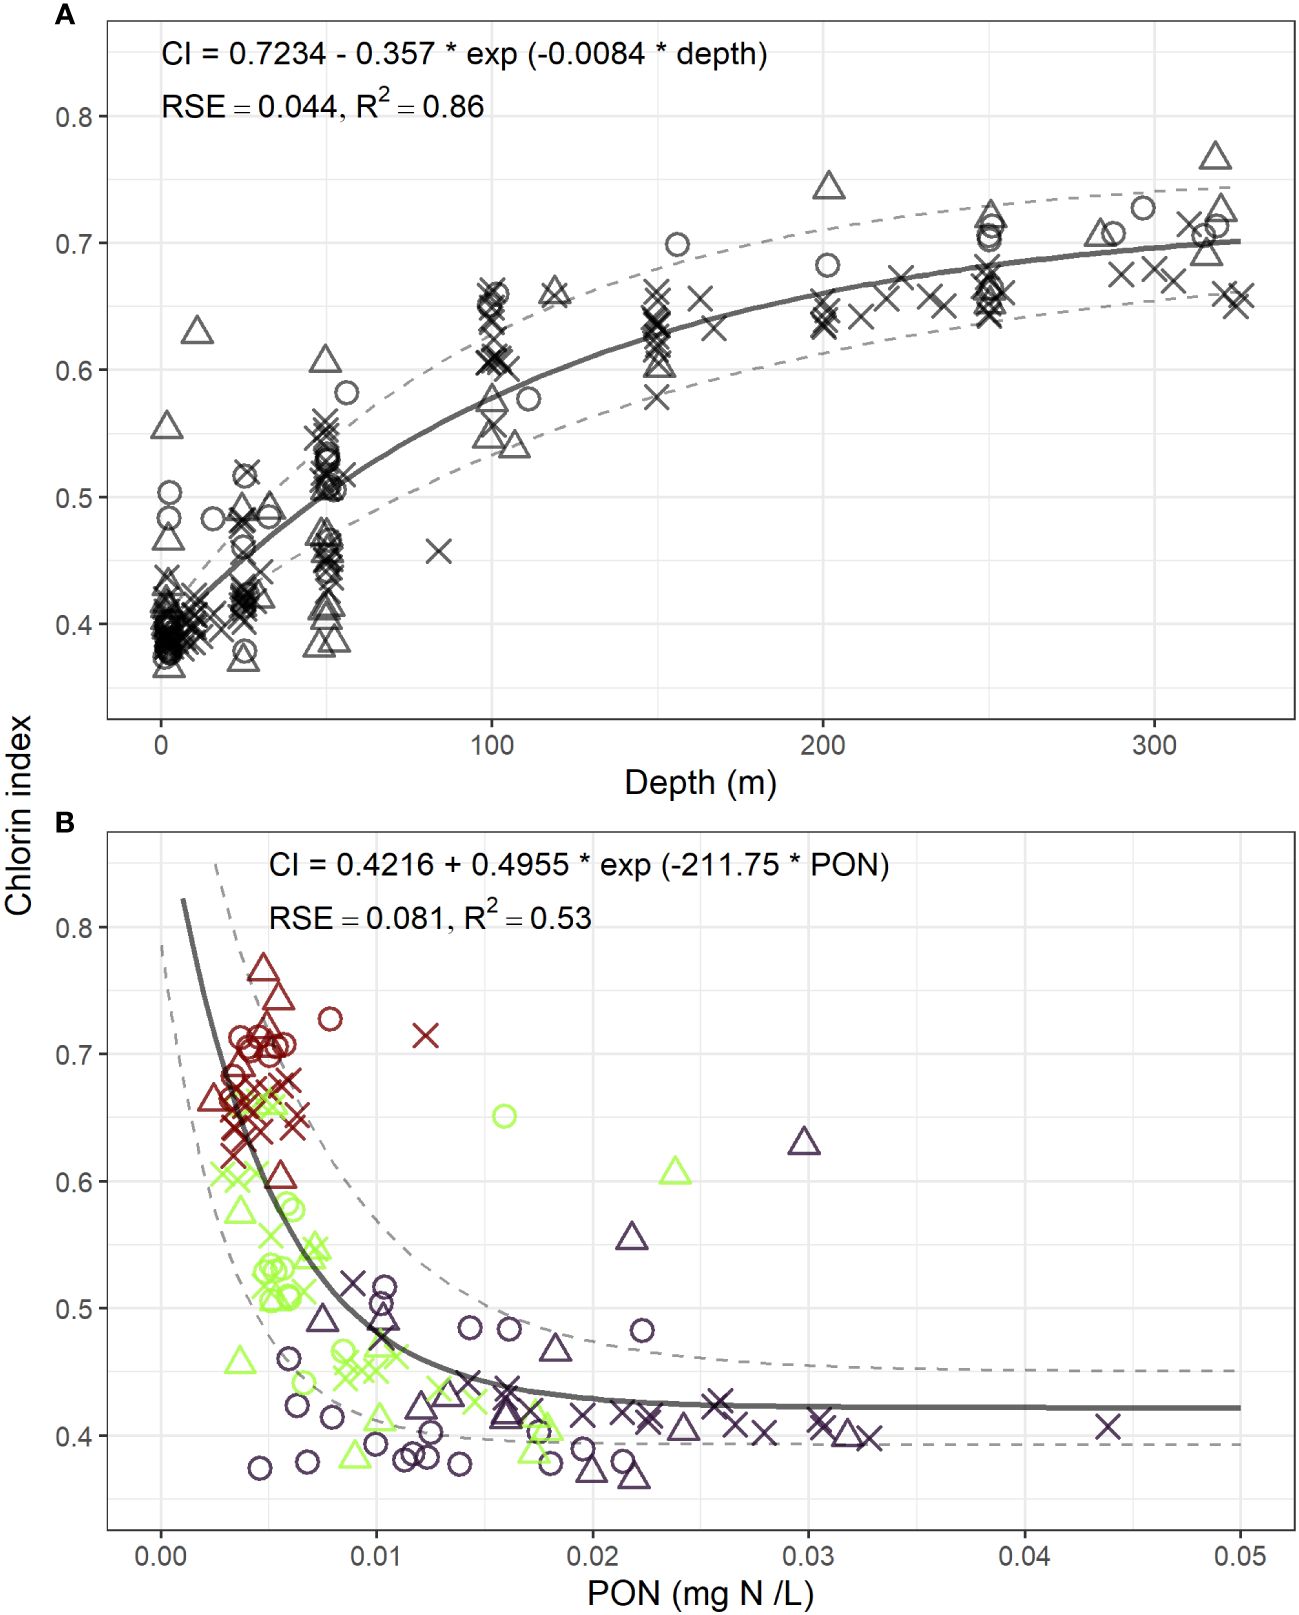
Figure 3 The relationship between Chlorin Index and depth using a nonlinear asymptotic regression model (A), and the relation between CI and PON using an asymptotic exponential decay model (B). Dark purple = surface, green = intermediate layer, dark red = deep layer. × = spring freshet, empty circle = summer lowflow, empty triangle = fall mixing.
3.4 Relationship between chlorin index and POM
The most robust relationship between POM and CI is depicted in Figure 3B and is best described by an exponential decay model with a non-zero limit. In this model, PON explained 53% of the variability in CI. The model for POC yielded quite similar but slightly less compelling results, with an R2 value of 0.46. The degradation rates associated to PON concentrations ranged from −68.7 mg N/L/m at a PON concentration of 0.002 mg N/L to −0.12 mg N/L/m at 0.032 mg N/L, reflecting a 572-fold decrease. The intercept of the model was 0.92, surpassing the maximum CI value of 0.766. The inclusion of hydroperiod as a random effect did not enhance the relationship.
3.5 Linking chlorin index to POM degradation in the water column
The final piecewise structural equation model (pSEM) was constructed by integrating four individual regression models. Firstly, given that pSEM is incompatible with asymptotic linear regression models like the exponential decay, the relationship between depth and chloropigments was modelled using a general linear mixed model (GLMM) with a gamma family and an inverse link function, incorporating hydroperiod as a random effect (Table 4). The global model accounted for a substantial amount of the chloropigments variation (R2conditional = 0.85), and the part related to fixed effects alone (R2marginal) was 0.81. Incorporating the random effect for hydroperiod provided predicted values for the intercept of 1.33, 25, and 0.91 µg/L of chloropigments for the freshet, low flow, and fall mixing, respectively. This aligns with the higher summer low-flow surface chloropigments compared to the freshet and fall mixing periods. The effect of depth was positive (beta = 0.02, steepness of the curve), but chloropigments demonstrated a quick nonlinear decrease as depth increased. Secondly, a linear model was used to predict PON based on chloropigments and depth (R2 = 0.90, p< 0.001) (Table 4). Chloropigments had a positive effect (beta = 0.0076), and depth had a negative effect (beta = −0.0000187). Thirdly, POC was modelled using a linear regression (R2 = 0.84, p< 0.001) with a positive effect of chloropigments (beta = 0.054) (Table 4). Lastly, a linear model (R2 = 0.80, p< 0.001) was employed to predict the chlorin index (CI). This model exhibited a positive effect for POC (beta = 0.234) and depth (beta = 0.00097), and a negative effect for PON (beta = −2.38) (Table 4).
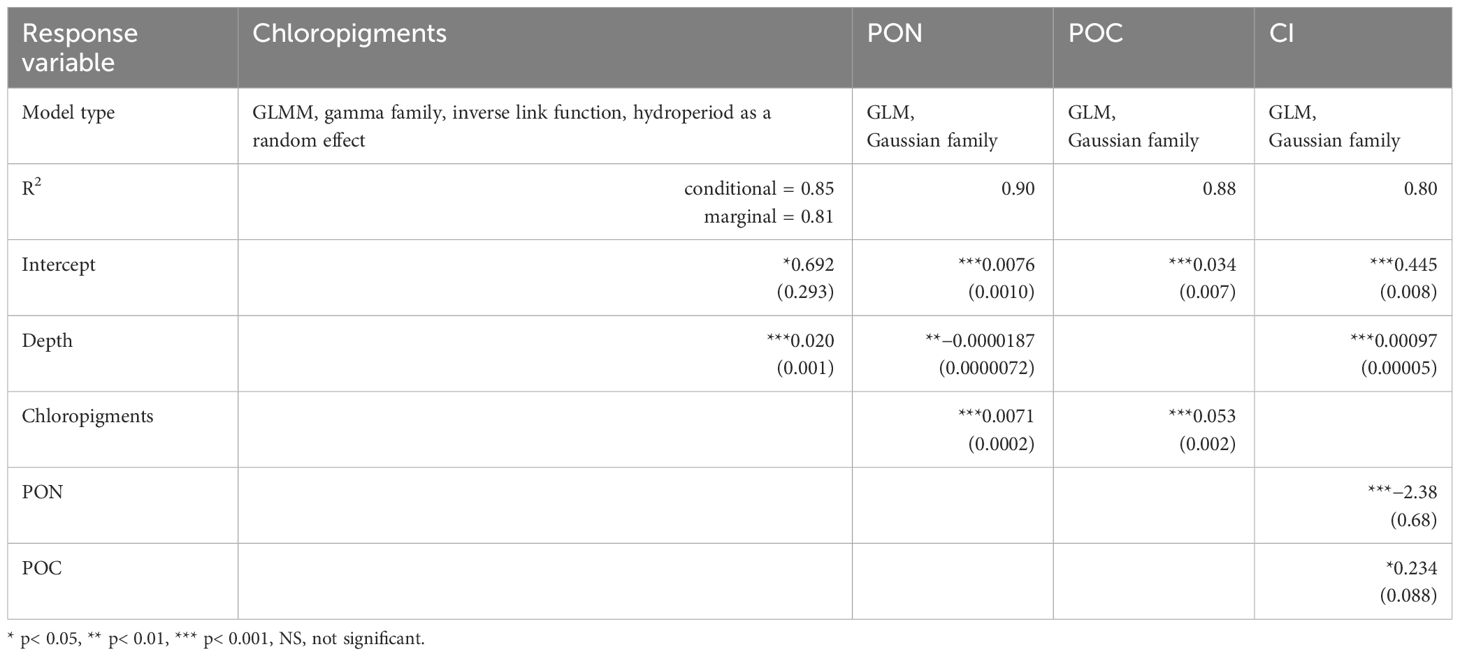
Table 4 Four individual (multiple) regression models used to build the final pSEM model with their model types, goodness of fit based on the R2 and coefficients (standard errors).
The final pSEM model (Figure 4) exhibited acceptable to good support based on the R2 values for the response variables: chloropigments (0.58), POC (0.91), PON (0.88), and CI (0.81). The model indicated that CI increased with depth and POC concentration, while it exhibited a decrease in the presence of elevated PON concentrations, which is typically more reactive. The direct effect of depth on CI was stronger (standardized coefficient = 0.813) than the indirect effects through chloropigments, POC, and PON, calculated as the product of the standardized coefficient, which was 0.35.
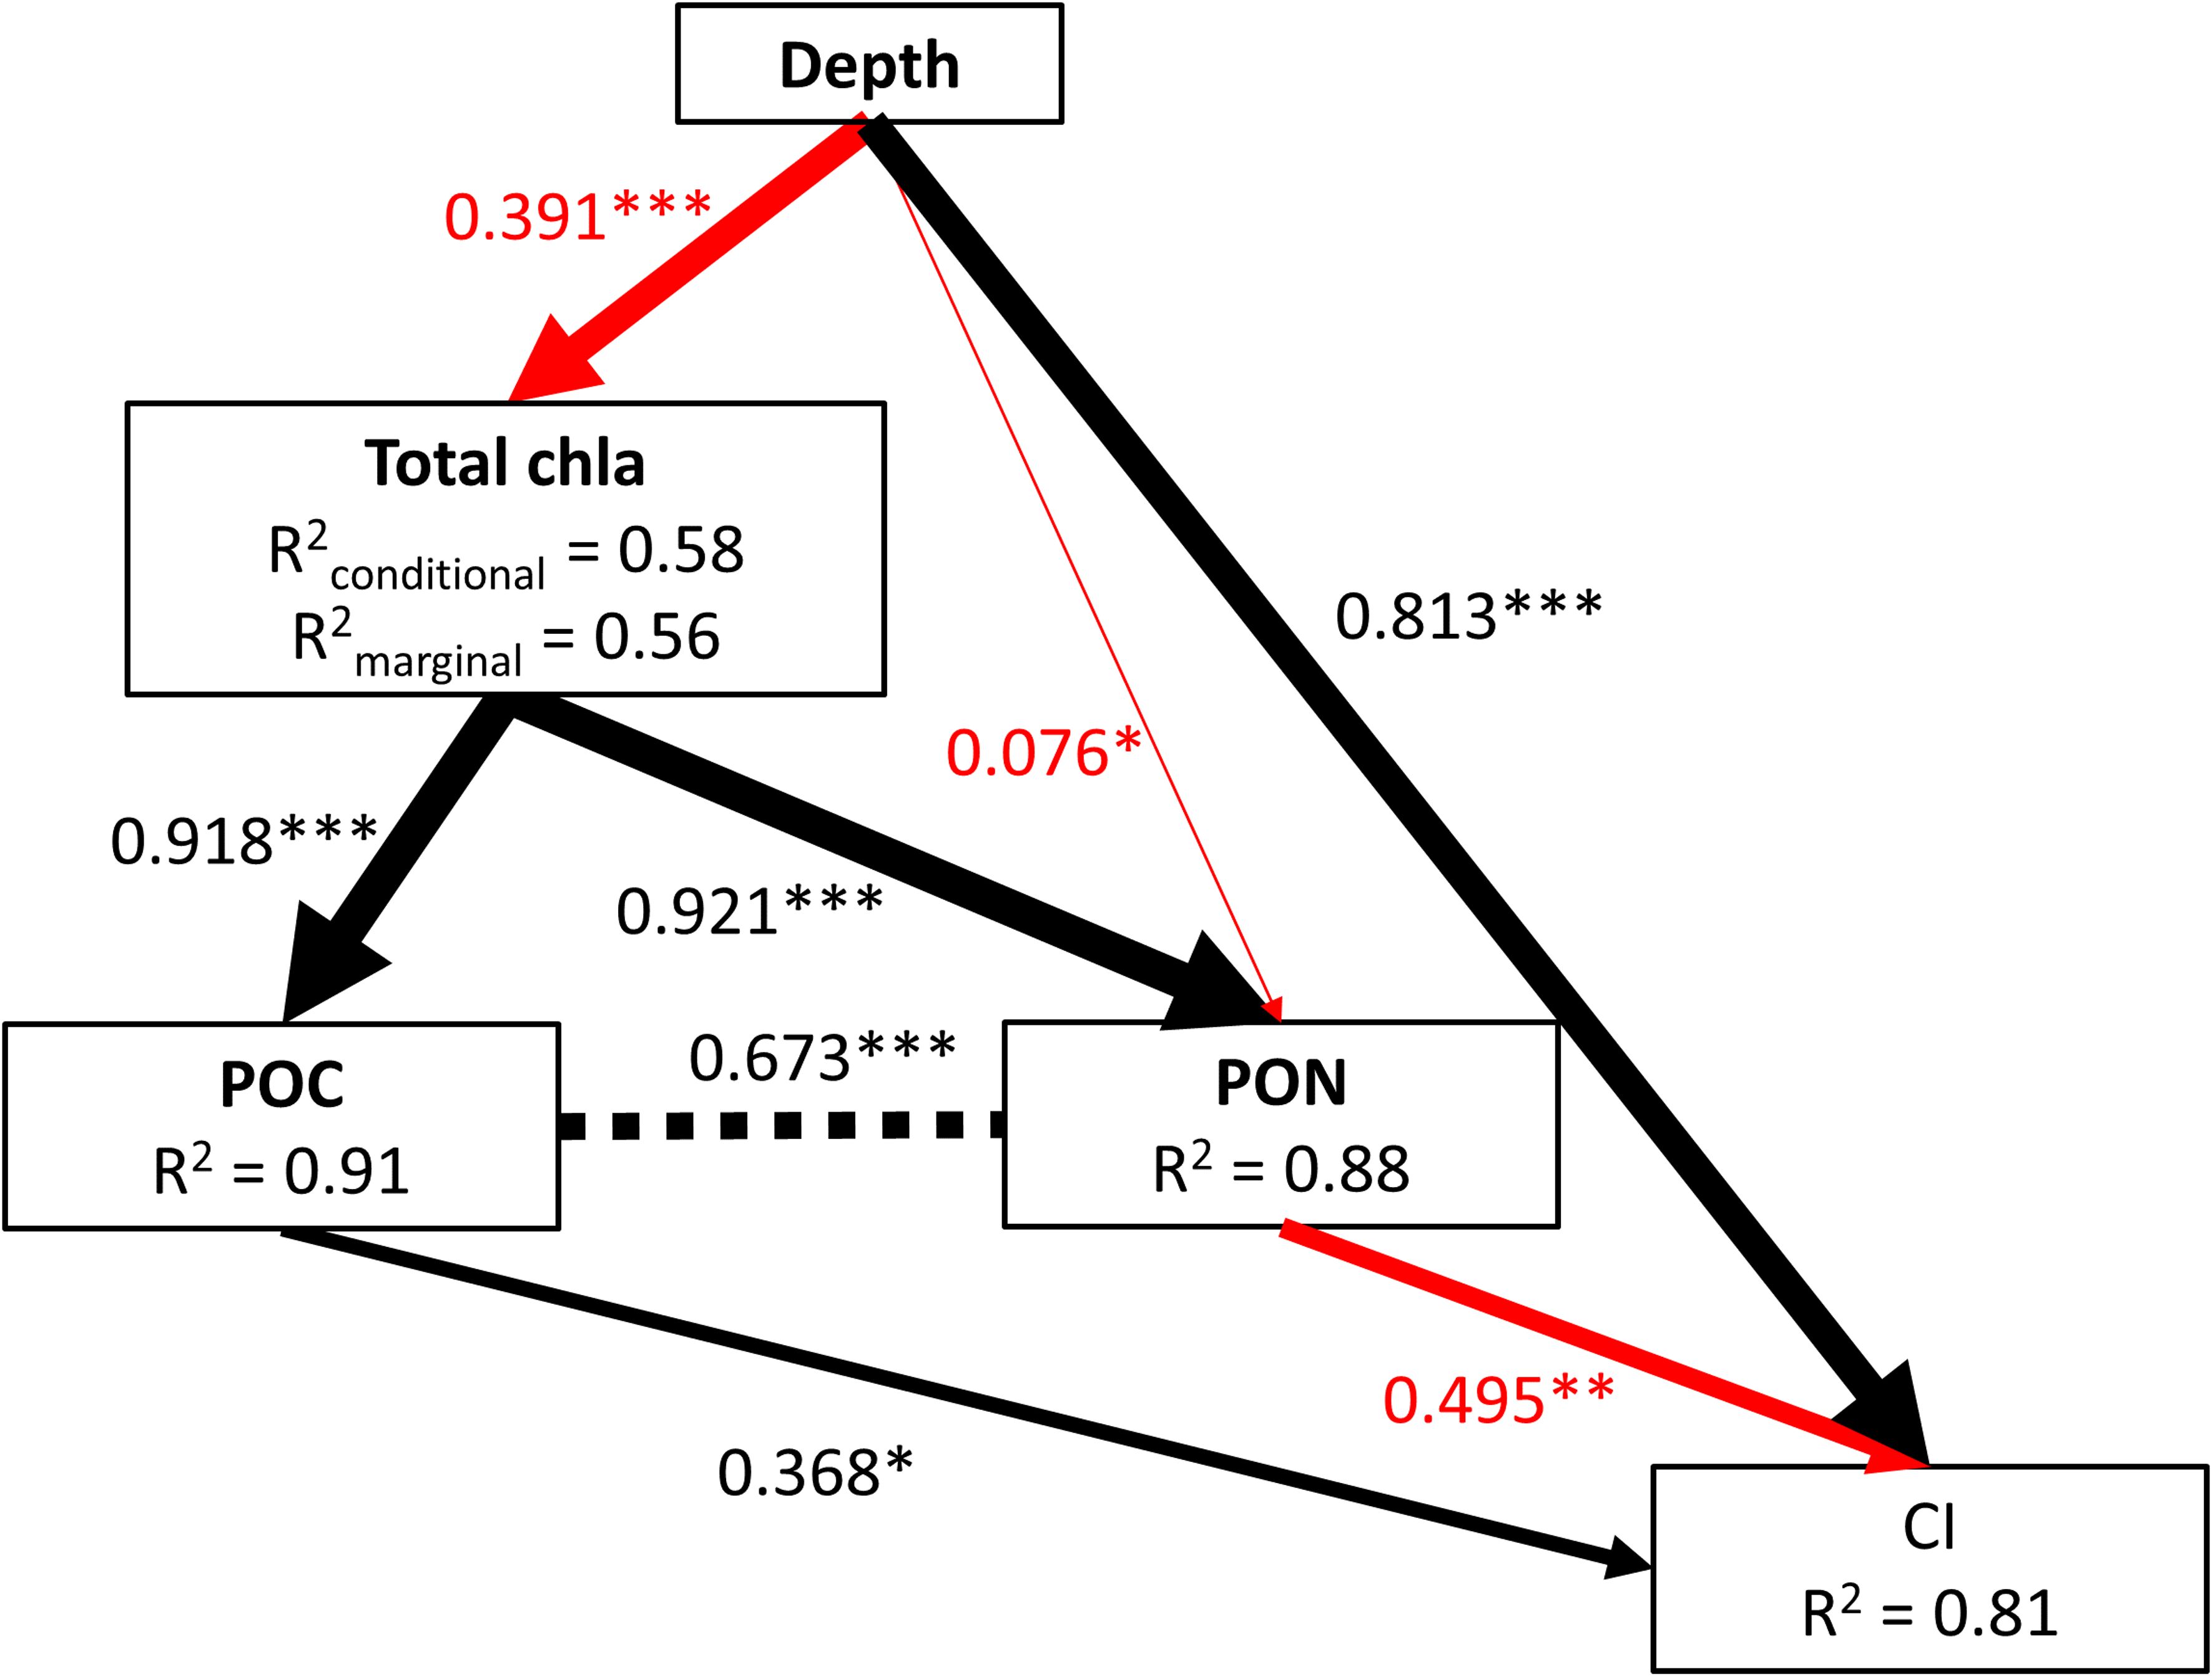
Figure 4 Final piecewise structural equation model of the direct and indirect effects of depth, chloropigments, POC and PON on chlorin index in 128 samples from surface to bottom of the LSLE. Black arrows represent positive and red arrows show negative effects derived from pSEM analysis. Arrow thickness corresponds to the size of path coefficients. Standardized path coefficients are reported next to the arrows and R2 values are reported for all response variables within boxes (for GLMM conditional as well as marginal R2 are reported); * p < 0.05; ** p< 0.01, ***, p< 0.001. Chloropigments rapidly decreased with depth thus the path of effect is shown as negative although in the GLMM gamma model, the coefficient is positive as the curve form is controlled by the shape and scale parameters.
3.6 Relationship between apparent oxygen utilization and chlorin index
A non-linear Weilbull type-2 regression with three parameters (Figure 5) yielded the best fit, explaining 86% (R2) of the AOU variation. The asymptote was at 11.576 mg O2/L, which was slightly higher than the maximum values found in LSLE, but did not exceed the solubility at saturation, which was around 12.03 mg O2/L. However, at a unit of CI, its theoretical maximum, AOU would be 11.42 mg O2/L. The inflection point was at a CI value of 0.7. This relationship is coherent with depth (Figure 5) as lower value of AOU and CI correspond to near-surface depths while highest values are associated with greater depths. Incorporating hydroperiod as a random effect did not improve the relationship.
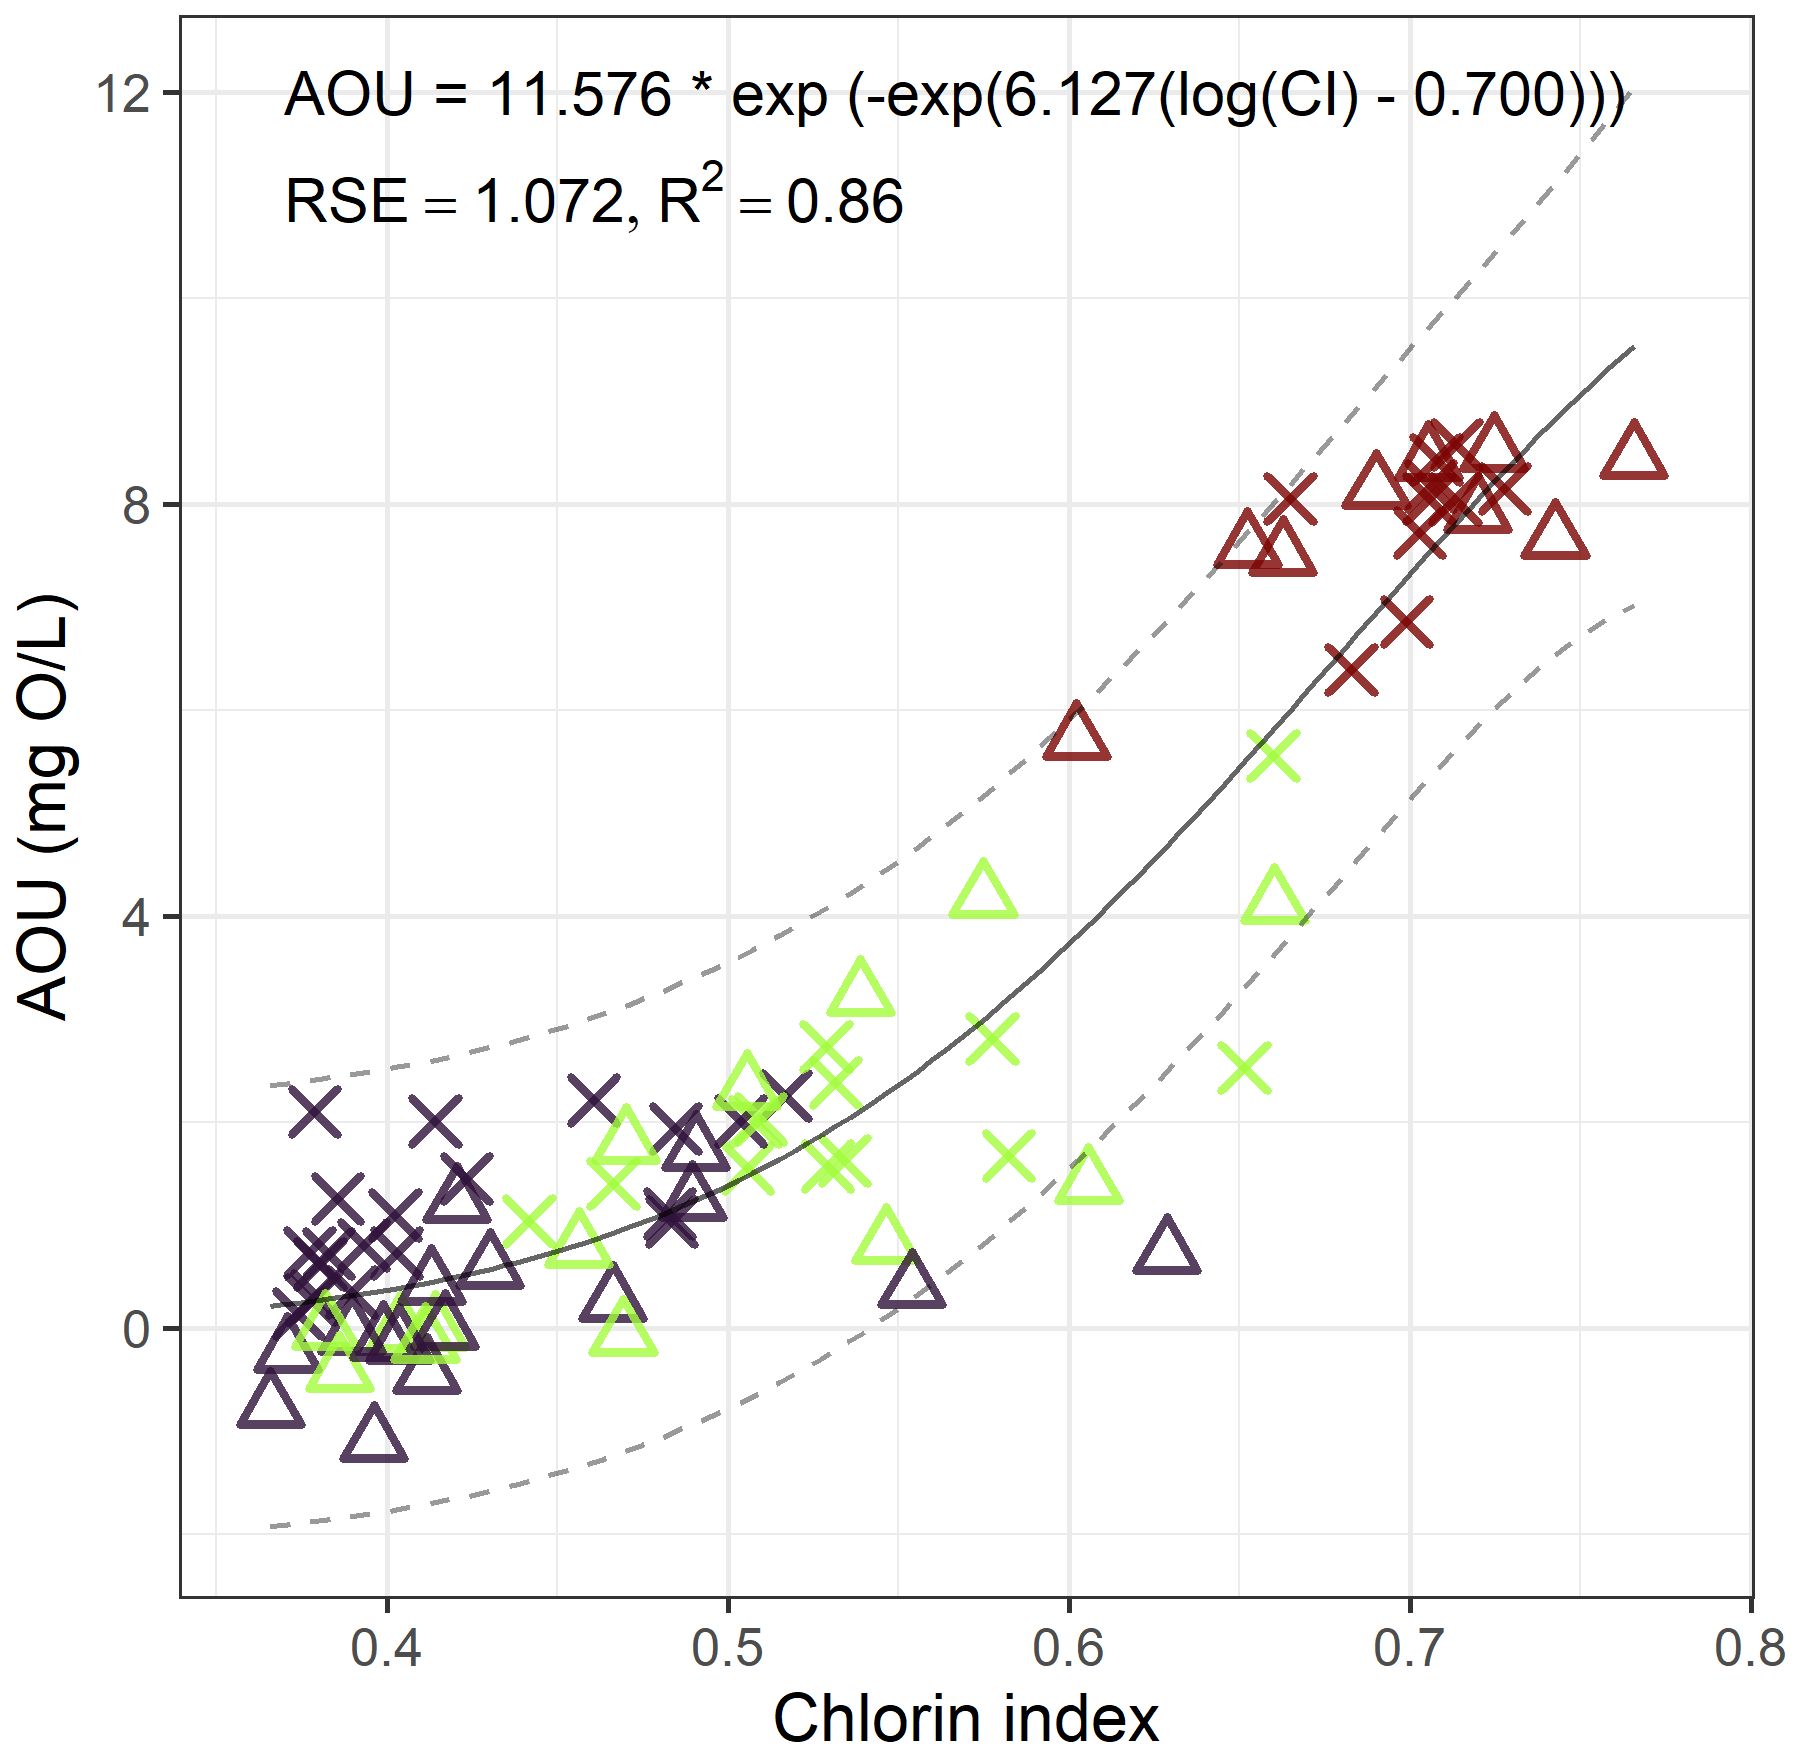
Figure 5 Nonlinear Weilbull regression with three parameters describing the relation between apparent oxygen utilization and chlorin index. Dark purple = surface, green = intermediate layer, dark red = deep layer. × = spring freshet, empty triangle = fall mixing.
4 Discussion
4.1 Vertical structure in waters of LSLE
Our results support the established spring to fall three-layer vertical stratification of the St. Lawrence Estuary based on temperature and salinity (Gilbert and Pettigrew, 1997; Galbraith, 2006). This physicochemical stratification generates distinct biochemical conditions, discernible through our univariate Kruskal-Wallis analysis of POC, PON, chloropigments, CI, turbidity, TSM, and PIM. Dissolved O2 did not exhibit significant difference between surface and intermediate layer. Scaling POC and PON by TSM indicates that the ratio of organic to inorganic particles only changes between the intermediate layer and deep layer due to an increase of PIM at depth (Lebeuf et al., 2019; Fabris et al., 2021). The multivariate approach based on the LDA yielded superior results, making it easier to distinguish between each layer. CI emerged as the most discriminating factor, highlighting significant differences in the state of organic matter decomposition among these layers. The surface layer was the most heterogenous based on PCA, influenced directly by watershed exports (Lévesque et al., 2023). During the spring freshet, some sites exhibited high chlorophyll, POC and PON values, while others, during fall mixing, showed high turbidity and low salinity, indicatives of sites with a substantial particle load (Lebeuf et al., 2019). The second axis of the PCA could be related to the influenced of tributary inputs. Hence, the surface layer, with a young ventilation age, comprises a mix of new autochthonous particles from primary production and inputs from the watershed. During the off-ice season, a cold intermediate layer is established (Koutitonski and Bugden, 1990). Consequently, the waters in this intermediate layer should exhibit ventilation ages ranging from 5 to less than 12 months, defining the maximum limit for the age of OM particles of this layer. Finally, the ventilation age of the deep layer of the LSLE has been estimated between 12 and 19 years (Mucci et al., 2011); although the age of OM particles is likely lower due to the generally rapid (< 6d) turnover rate for the disaggregation of particles (Lam and Marchal, 2015). The distinction between surface and intermediate layers being solely seasonal could be a reason for the difficulty in distinguishing from both water masses.
4.2 Chlorin index as an indicator of the degradation of sinking/suspended chlorophyll product
Tracking the chloropigment content in the water column serves to characterize the pigment pool originating from primary producers, and its degradation state drives the chlorin index. The latter being primarily developed for uses in sediments (Schubert et al., 2005) appears sensitive enough for uses in the water column, reflecting the reactivity of POM through the ratio of the non-labile pigments to the overall pool. The positive correlation between chloropigments (or chlorophyll) and POM (Figure 4 and Supplementary Figure 3) is a result of the composition of POM which includes heterotrophic bacteria, phytoplankton, zooplankton and detritus (Legendre and Michaud, 1999) from both autochthonous and allochthonous sources. The composition of POM and sources of chloropigments at a specific location and time accounts for the wide spread in their relationships (Legendre and Michaud, 1999; Sathyendranath et al., 2009; Thomalla et al., 2017). In the LSLE, allochthonous sources contribute to surface chla concentrations as evidenced by similar concentrations of chla in both the tributaries (with a monthly median of 1.23 mg/L at Quebec city, ranging from 0.42 to 16 mg/L, Hudon et al., 2017) and the LSLE sites (with a median surface layer concentration of 1.74 mg/L, ranging from 0.16 to 86 mg/L, this study). However, chla integrated over a depth of 40 meters is drastically higher in the LSLE than the amount exported by tributaries. A similar conclusion can be drawn for POM, since monthly tributary contributions vary between 12–65 Gg of POC and between 1.8–6.7 Gg of PON compared to the LSLE inventory of 77–139 Gg for POC and 10.5–20.7 Gg for PON (Lévesque et al., 2023). Despite these figures, tributaries can still have important local effects.
Both Chla and POM exhibit maximum values near the surface and decrease at varying rates with depth, following the pattern of Martin curves (Martin et al., 1987). The shape of our POM profiles with depth was analogous to that reported for chla by Llewellyn and Mantoura (1996) at different latitudes in the northwest Atlantic. Most types of particles in the water column follow a similar first-order reaction with depth (Lam and Marchal, 2015). As fresh POM is consumed or respired in the trophic chain, the total pool of pigments (chloropigments) decreases with depth. Therefore, the degradation of chloropigments is indicative of POM degradation, and this relationship can be used to estimate the available food for the rest of the trophic chain (Legendre and Michaud, 1999; Thomalla et al., 2017). The decline of chloropigments and PON and POC with increasing depth (Figure 3) was reflected by the concomitant increase in CI, whose rate decreases as particles sink resulting in reduced degradation due to less labile OM. The observed 14.6-fold decrease in degradation rates with depth mirrors the drop in electron transport system activity (ETS), a proxy for microbial respiration, between surface and bottom in the LSLE (median 22.6-fold, range: 6.5–52.4, N = 9, 1989–1991) (calculated from data in Devine et al. (1997)). Furthermore, the POC/chloropigments ratio increased from 57 at the surface to 138 in the intermediate layer, reaching a median value of 206 in the deep layer. This suggests a more rapid consumption of N-rich chloropigments molecules compared to C-rich compounds.
In our models, certain CI measurements taken near the seabed appear to display resuspension events, resulting in values that exceed their relationship with both depth and PON. This implies a more degraded POM (higher CI) than what would be predicted based on either depth or PON. Other CI measurements fell below the predicted values based on both depth and PON. Most of these measurements were taken in the 25–50 m depth region and were associated to low PIM values (a median of 0.30 mg/L compared to 0.73 mg/L for surface and 0.42 mg/L for the intermediate layer in Table 1). This low PIM may be associated to sites and depths where flagellates have a higher relative abundance compared to diatoms, which are typically the dominant group (Blais et al., 2019). The ratios of PIM to chlorophyll fluctuate depending on the phytoplankton group, with diatoms having higher ratios than flagellates. The intercept value for CI at the surface was 0.3664, corresponding to the freshest and most reactive organic matter typically found in this layer. At the sediment level, Alkhatib et al. (2012) found CI values ranging from ~0.65 to ~0.72 in LSLE surface sediments, indicating more degraded material. These align with the top CI asymptote of our data (0.72), suggesting that POM reaches the LSLE bottom before full-water column degradation. This is further supported by the continued degradation of settled organic matter in LSLE sediment cores, reaching values near one at around 5 cm depth (Alkhatib et al., 2012).
Respiration by bacteria attached to particles is not the only degradation path as various biological (grazing, egesting) and physical (erosion, pressure, fracture, solubilization) processes are also implicated. Zooplankton play a pivotal role by breaking down aggregates and transferring a portion into suspended POM, while another part is excreted as fecal pellets (Burd et al., 2010; Cavan et al., 2019). Zooplankton pellets are indirectly accounted for by tracking chloropigments and CI in the water column. Indeed, grazing experiments, realized with Calanus sp. shown an average conversion of chlorophyll to pheopigments of 100% (molar) (Shuman and Lorenzen, 1975). However, this transfer rate has been found to vary significatively from complete to negligible, influenced by factors such as location, season and species composition of zooplankton and phytoplankton (Lopez et al., 1988; Landry et al., 1994).
Only a fraction of autochthonous or laterally transported POM from the surface layer is exported at depth (Ducklow et al., 2001; Laws et al., 2011). It has been estimated that as much as 99% of the Chla flux can be degraded before reaching the sediments (Leavitt, 1993), but the reverse situation is also possible with near 100% settling at the bottom (Dunne et al., 2005; Laws et al., 2011). According to the 1-D model results by Tian et al. (2000), based on primary production and the trophic chain dynamics in the LSLE, only 23% of the total organic carbon exported from the euphotic zone reaches the deep layer, while the remaining 77% is presumed to undergo remineralization within the intermediate layer. We showed that CI drop by around 75% from the surface to 140 m, marking the beginning of the deep layer (Figure 3). This reduction aligns with the typical vertical structure of remineralization that has been observed in estuaries, shelves and open oceans (Suess, 1980; Martin et al., 1987; Buesseler et al., 2020). Our results corroborate the findings of Lucotte et al. (1991) in LSLE, where approximately 70% of photosynthetic carbon was recycled within the water column, as deduced from concentration and isotopic carbon composition of suspended particulate matter and surface sediments. Similarly, Pocklington (1988) and Savenkoff et al. (1996) estimated that 76% and 90%, respectively, of the organic matter in the Gulf of SLE is remineralized before reaching the deep waters.
The notion that suspended particles play a more pivotal role than sinking ones is not novel (Karl et al., 1988), but recent research provided new insights into this topic (Baltar et al., 2010; Herndl and Reinthaler, 2013). Typically, three pools of POM are considered, which are the suspended, the fast sinking and the slow sinking particles (Riley et al., 2012). Despite considerable temporal and spatial variability (Baker et al., 2017; Cavan et al., 2017), the importance of the suspended pool can be dominant reaching ~90% of the overall pool (García-Martín et al., 2021; Hemsley et al., 2023). In the temperate shelf of the Celtic Sea, the suspended particulate matter sustains a respiration rate one to three orders of magnitude higher than the slow sinking and fast sinking particles (García-Martín et al., 2021). A hypothesis to consider is the microbial gardening, proposing that zooplankton could fragment large detrital particles to promote their transformation into smaller particles with higher microbial biomass content, thereby increasing the nutritional value of POM for subsequent consumption (Mayor et al., 2014). Fragmentation could account for 49 ± 22% of the observed POC flux loss in the upper mesopelagic, roughly corresponding to the intermediate layer, using data collected by Biogeochemical-Argo floats from multiple ocean regions (Briggs et al., 2020). In LSLE, diatoms, the predominant phytoplankton group (Blais et al., 2023), are renowned for their rapid sinking rate, sometimes exceeding 200 m/d (Asper and Smith, 2003). Diatoms, prolific producers of transparent exopolymers (TEPs) (Nosaka et al., 2017), promote the formation of aggregates which could be quickly fragmented by the abundant zooplankton communities (Plourde et al., 2002; Blais et al., 2023). This may result in a substantial amount of suspended particles persisting in this pool for weeks, months, or even years (Druffel et al., 2003) before being degraded or aggregated, and recommencing the sinking process. Indeed, chlorophyll and TEP carbon equivalent were found to account for 83% of the surface layer and 35% of the intermediate layer of POC in a study conducted at an LSLE site between May-October (Annane et al., 2015).
4.3 Causality relationship between Chlorin index and POM degradation in the water column
To transcend the traditional carbon-focused view of the biological pump (Iversen, 2023), a piecewise structural equation model was used to confirm the potential of CI as simple and useful indicator of OM degradation. Our findings reveal that CI exhibits strong direct dependence on depth, POC, and PON. Additionally, it shows indirect paths to chloropigments. These intrinsic drivers (POC, PON, chloropigments), varying with depth, form a network of direct and indirect pathways that statistically control CI. The direct effect of depth on CI could be linked to the distinct properties of water column layers, which influences the residence time of particles and thus the degradation potential by biotic and abiotic factors. The strength of the indirect depth effect on CI, with a value of 0.35, surpasses expectations given it is mediated by two steps, i.e., chloropigments, and POC and PON. Previous studies in lacustrine systems has attributed CI variations in the water column to the decreasing relationship between atmospheric exchange with depth and biotic processes that consume both oxygen and OM (Köllner et al., 2013). The negative link between CI and PON, which represent more reactive matter, and the positive relation with POC, associated to less reactive matter, exemplify the preferential degradation of nitrogen over carbon. This is supported by the Schneider et al. (2003) work, revealing an increase in POC/PON ratio with depth worldwide. These findings probably apply to hypoxic waters, such as the deep layer of the LSLE, as observed in the eastern tropical North Atlantic (Engel et al., 2022). In addition, Bourgoin and Tremblay (2010) suggest that, in the LSLE and Gulf, driven by strong mineralization of POM, a substantial carbon loss (27–53% decrease) is accompanied by an even greater degradation of N (54–77% lost). The indirect depth effect on CI, which is not directly linked to chloropigments, but rather mediated by PON and POC, further supports CI as an indicator of OM degradation. The indirect impact of depth on CI can be attributed to the absence of light, which restricts primary production, but allows degradation to occur. It can also be related to the loss of reactivity as OM becomes recalcitrant.
4.4 Relationship between apparent oxygen utilization and chlorin index
The robust non-linear relationship observed between AOU and CI substantiates the link between organic matter degradation and dissolved O2 consumption. Indeed, the respiration processes is intrinsically connected to the biological conversion OM back into nutrients and carbon dioxide through stoichiometry (Engel et al., 2022). The respiration of organic matter below the euphotic zone serves as the primary driver for oxygen depletion, potentially leading to conditions of hypoxia or anoxia if resupply of oxygen through mixing falls behind the rate of depletion (Bourgault et al., 2012; Rabalais et al., 2014). Consequently, the positive relationship between AOU, a surrogate for respiration, and CI, an indicator of the degradation state of OM was anticipated. Within the LSLE, the observed relationship is dependent on depth since the three stratified layers exhibit distinct particle ages and ventilation times.
Apparent oxygen utilization has been extensively used to quantify the depletion of dissolved O2 at depth (e.g., Ogura, 1970; Doval and Hansell, 2000; Druffel et al., 2003). The contribution of OM remineralization to changes in AOU appears to vary considerably, ranging from< 20% to ~70% (Pan et al., 2014; Calleja et al., 2019). Azzaro et al. (2006) noted that about 63% of organic carbon remineralized by respiration derived from POC pool. By combining data from this paper with DOC values from Lévesque et al. (2023), and applying a C:O Redfield ratio of 0.68 (or 0.52 by mass) (Anderson and Sarmiento, 1994), it can be calculated that DOC only accounts for a median value of 18% (min-max: 14–27, n=19) of the remineralization observed in the deep layer. The remaining portion is attributable to POC, suspended particles and the sedimentary contributions. Likewise, the utilization of DOC was found to contribute globally to less than 10% of AOU in the mesopelagic realm (Aristegui et al., 2002). The findings of this study indirectly support the idea that particulate organic carbon plays a key role in sustaining respiratory processes in the aphotic marine environment.
Our results should be considered in the light of the current hypoxic conditions prevalent in the deep layer of the LSLE, where water oxygen levels are as low as 1 mg O2/L (Jutras et al., 2023). Under these conditions, it has been suggested that particle mixing and bioturbation of sediments may be nearly absent, likely in response to changes in infauna community assemblage and a lower metabolic activity (Pascal et al., 2023). In the water column, reduced degradation of organic matter by heterotrophic communities could occur at low oxygen concentrations leading to higher export at depth (Engel et al., 2017). As the volume of hypoxic water increases, more POM will likely reach the seafloor, further complicating the understanding of where OM is remineralized. On the one hand, Lehmann et al. (2009) using O-isotope indicated that 36% of the total respiration occurred in the water column within 100 m above the seafloor, with the major part of the O2 being respired in sediments. On the other hand, Bourgault et al. (2012) using a modelling approach stated that ~83% of the respiration must occur in the 100 m above the sediment. In both cases, these approximations would be higher considering the whole depth of the deep layer, which is approximately 180 m.
5 Conclusion
Our study demonstrates the utility of the chlorin index as a simple yet robust tool for monitoring OM degradation in the water column, particularly in the LSLE. The chlorin index provides valuable insights into the fate of organic matter across depth gradients. We showed how chloropigments influence suspended POC and PON, which in turn affects CI values, while considering the preferential degradation of N. Depth was a significant extrinsic factor driving CI values through both direct and indirect pathways. By using the chlorin index, we were able to calculate degradation rates at various depths, evaluate export across layers, and anticipate oxygen loss based on AOU. Therefore, this index represents a promising approach that warrants further testing for monitoring organic matter degradation in the water column for deep estuaries, shelves, and seas.
Data availability statement
The raw data supporting the conclusions of this article will be made available by the authors, without undue reservation.
Author contributions
DL: Writing – review & editing, Writing – original draft, Validation, Methodology, Investigation, Formal Analysis, Data curation. ML: Writing – review & editing, Validation, Supervision, Project administration, Methodology, Investigation, Funding acquisition, Data curation, Conceptualization. MS: Writing – review & editing, Validation, Methodology, Investigation, Conceptualization.
Funding
The author(s) declare financial support was received for the research, authorship, and/or publication of this article. This research was supported by DFO through the Strategic Program for Ecosystem Research and Advice (SPERA). This project is an endorsed Decade Action entitled “No.70.2 - St. Lawrence Estuary Research and Observation Plan” part of the Decade programme “No. 76. Global Ocean Oxygen Decade (GOOD)” of UNESCO’s Ocean Decade. This work is part of the St. Lawrence Action Plan (SLAP).
Acknowledgments
The authors would like to thank the captains and crews of the CCGS Creed and Hudson. We acknowledge the support of DAISS, specifically Francçois Villeneuve and is team for CTD deployments and nutrients analyses. Special thanks to Domynick Maltais, Sylvie St-Pierre and Heíleína Talbot for their work in the laboratory and in the preparation of the field work. We also thank the editors and reviewers for their valuable comments.
Conflict of interest
The authors declare that the research was conducted in the absence of any commercial or financial relationships that could be construed as a potential conflict of interest.
Publisher’s note
All claims expressed in this article are solely those of the authors and do not necessarily represent those of their affiliated organizations, or those of the publisher, the editors and the reviewers. Any product that may be evaluated in this article, or claim that may be made by its manufacturer, is not guaranteed or endorsed by the publisher.
Supplementary material
The Supplementary Material for this article can be found online at: https://www.frontiersin.org/articles/10.3389/fmars.2024.1399961/full#supplementary-material
References
Alkhatib M., Schubert C. J., del Giorgio P. A., Gelinas Y., Lehmann M. F. (2012). Organic matter reactivity indicators in sediments of the St. Lawrence Estuary. Estuarine Coast. Shelf Sci. 102–103, 36–47. doi: 10.1016/j.ecss.2012.03.002
Anderson L. A., Sarmiento J. L. (1994). Redfield ratios of remineralization determined by nutrient data analysis. Global Biogeochemical Cycles 8, 65–80. doi: 10.1029/93GB03318
Annane S., St-Amand L., Starr M., Pelletier E., Ferreyra G. A. (2015). Contribution of transparent exopolymeric particles (TEP) to estuarine particulate organic carbon pool. Mar. Ecol. Prog. Ser. 529, 17–34. doi: 10.3354/meps11294
Arar E. J., Collins G. B. (1997). “Method 445.0 In Vitro Determination of Chlorophyll a and Pheophytin a in Marine and Freshwater Algae by Fluorescence” (Washington, DC: U.S. Environmental Protection Agency).
Aristegui J., Duarte C. M., Agusti S., Doval M., Alvarez-Salgado X., Hansell D. A. (2002). Dissolved organic carbon support of respiration in the dark ocean. Science 298, 1967. doi: 10.1126/science.1076746
Asper V. L., Smith W. O. (2003). Abundance, distribution and sinking rates of aggregates in the Ross Sea, Antarctica. Deep Sea Res. Part I: Oceanographic Res. Papers 50, 131–150. doi: 10.1016/s0967–0637(02)00146–2
Azzaro M., La Ferla R., Azzaro F. (2006). Microbial respiration in the aphotic zone of the Ross Sea (Antarctica). Mar. Chem. 99, 199–209. doi: 10.1016/j.marchem.2005.09.011
Baker C. A., Henson S. A., Cavan E. L., Giering S. L. C., Yool A., Gehlen M., et al. (2017). Slow-sinking particulate organic carbon in the Atlantic Ocean: Magnitude, flux, and potential controls. Global Biogeochemical Cycles 31, 1051–1065. doi: 10.1002/2017GB005638
Baltar F., Arístegui J., Sintes E., Gasol J. M., Reinthaler T., Herndl G. J. (2010). Significance of non-sinking particulate organic carbon and dark CO2 fixation to heterotrophic carbon demand in the mesopelagic northeast Atlantic. Geophysical Res. Lett. 37. doi: 10.1029/2010GL043105
Benson B. B., Krause D. (1984). The concentration and isotopic fractionation of oxygen dissolved in freshwater and seawater in equilibrium with the atmosphere. Limnology Oceanography 29, 620–632. doi: 10.4319/lo.1984.29.3.0620
Berggren M., Guillemette F., Bieroza M., Buffam I., Deininger A., Hawkes J. A., et al. (2022). Unified understanding of intrinsic and extrinsic controls of dissolved organic carbon reactivity in aquatic ecosystems. Ecology 103, e3763. doi: 10.1002/ecy.3763
Blais M., Galbraith P. S., Plourde S., Lehoux C. (2023). “Chemical and biological oceanographic conditions in the estuary and gulf of St. Lawrence during 2022 in Can. Tech. Rep. Hydrogr. Ocean Sci (Fisheries and Oceans Canada, Mont-Joli, Canada).
Blais M., Galbraith P. S., Plourde S., Scarratt M., Devine L., Lehoux C. (2019). “Chemical and Biological Oceanographic Conditions in the Estuary and Gulf of St. Lawrence during 2017,” in Can. Tech. Rep. Hydrogr. Ocean Sci (Fisheries and Oceans Canada, Mont-Joli, Canada).
Borcard D., Legendre P., Drapeau P. (1992). Partialling out the spatial component of ecological variation. Ecology 73, 1045–1055. doi: 10.2307/1940179
Borges A. V., Delille B., Frankignoulle M. (2005). Budgeting sinks and sources of CO2 in the coastal ocean: Diversity of ecosystems counts. Geophysical Res. Lett. 32, L14601. doi: 10.1029/2005GL023053
Bourgault D., Cyr F., Galbraith P. S., Pelletier E. (2012). Relative importance of pelagic and sediment respiration in causing hypoxia in a deep estuary. J. Geophysical Research: Oceans 117, C08033. doi: 10.1029/2012JC007902
Bourgoin L.-H, Tremblay L. (2010). Bacterial reworking of terrigenous and marine organic matter in estuarine water columns and sediments. Geochimica et Cosmochimica Acta 74 (19), 5593–5609. doi: 10.1016/j.gca.2010.06.037
Boyd P. W., Claustre H., Levy M., Siegel D. A., Weber T. (2019). Multi-faceted particle pumps drive carbon sequestration in the ocean. Nature 568, 327–335. doi: 10.1038/s41586-019-1098-2
Boyd P. W., Trull T. W. (2007). Understanding the export of biogenic particles in oceanic waters: Is there consensus? Prog. Oceanography 72, 276–312. doi: 10.1016/j.pocean.2006.10.007
Briggs N., Dall’Olmo G., Claustre H. (2020). Major role of particle fragmentation in regulating biological sequestration of CO2 by the oceans. Science 367, 791–793. doi: 10.1126/science.aay1790
Buesseler K. O., Boyd P. W., Black E. E., Siegel D. A. (2020). Metrics that matter for assessing the ocean biological carbon pump. Proc. Natl. Acad. Sci. 117, 9679–9687. doi: 10.1073/pnas.1918114117
Burd A. B., Hansell D. A., Steinberg D. K., Anderson T. R., Arístegui J., Baltar F., et al. (2010). Assessing the apparent imbalance between geochemical and biochemical indicators of meso- and bathypelagic biological activity: What the @$♯! is wrong with present calculations of carbon budgets? Deep Sea Res. Part II: Topical Stud. Oceanography 57, 1557–1571. doi: 10.1016/j.dsr2.2010.02.022
Calleja M. L., Al-Otaibi N., Moran X. A. G. (2019). Dissolved organic carbon contribution to oxygen respiration in the central Red Sea. Sci. Rep. 9, 4690. doi: 10.1038/s41598–019-40753-w
Caron G., Michel C., Gosselin M. (2004). Seasonal contributions of phytoplankton and fecal pellets to the organic carbon sinking flux in the North Water (northern Baffin Bay). Mar. Ecol. Prog. Ser. 283, 1–13. doi: 10.3354/meps283001
Cavan E. L., Laurenceau-Cornec E. C., Bressac M., Boyd P. W. (2019). Exploring the ecology of the mesopelagic biological pump. Prog. Oceanography 176. doi: 10.1016/j.pocean.2019.102125
Cavan E. L., Trimmer M., Shelley F., Sanders R. (2017). Remineralization of particulate organic carbon in an ocean oxygen minimum zone. Nat. Commun. 8, 14847. doi: 10.1038/ncomms14847
Claret M., Galbraith E. D., Palter J. B., Bianchi D., Fennel K., Gilbert D., et al. (2018). Rapid coastal deoxygenation due to ocean circulation shift in the NW Atlantic. Nat. Climate Change 8, 866–872. doi: 10.1038/s41558-018-0263-1
Claustre H., Legendre L., Boyd P. W., Levy M. (2021). The oceans’ biological carbon pumps: Framework for a research observational community approach. Front. Mar. Sci. 8. doi: 10.3389/fmars.2021.780052
Devine L., Savenkoff C., Vézina A. F., Chanut J. P., Roy S., Comeau L., et al. (1997). “Compilation des données biologiques et chimiques dans l’estuaire maritime du Saint-Laurent: Programme COUPPB 1989, 1990 et 1991 in Rapport statistique canadien sur l’hydrographie et les sciences océanique (Pêches et Océans Canada, Mont-Joli, Canada).
DeVries T., Primeau F., Deutsch C. (2012). The sequestration efficiency of the biological pump. Geophysical Res. Lett. 39, L13601. doi: 10.1029/2012GL051963
Diaz R. J., Rosenberg R. (2008). Spreading dead zones and consequences for marine ecosystems. Science 321, 926–929. doi: 10.1126/science.1156401
Doval M. D., Hansell D. A. (2000). Organic carbon and apparent oxygen utilization in the western South Pacific and the central Indian Oceans. Mar. Chem. 68, 249–264. doi: 10.1016/S0304-4203(99)00081-X
Druffel E. R. M., Bauer J. E., Griffin S., Hwang J. (2003). Penetration of anthropogenic carbon into organic particles of the deep ocean. Geophysical Res. Lett. 30. doi: 10.1029/2003GL017423
Ducklow H., Steinberg D., Buesseler K. (2001). Upper ocean carbon export and the biological pump. Oceanography 14, 50–58. doi: 10.5670/oceanog.2001.06
Dunne J. P., Armstrong R. A., Gnanadesikan A., Sarmiento J. L. (2005). Empirical and mechanistic models for the particle export ratio. Global Biogeochemical Cycles 19, GB4026. doi: 10.1029/2004GB002390
El-Sabh M. I., Silverberg N. (1990). “The St. Lawrence estuary: Introduction,” in Oceanography of a large-scale estuarine system: The St. Lawrence. Eds. El-Sabh M. I., Silverberg N. (SpringerVerlag, New-York, NY), 1–9.
Engel A., Kiko R., Dengler M. (2022). Organic matter supply and utilization in oxygen minimum zones. Annu. Rev. Mar. Sci. 14, 355–378. doi: 10.1146/annurev-marine-041921-090849
Engel A., Wagner H., Le Moigne F. A. C., Wilson S. T. (2017). Particle export fluxes to the oxygen minimum zone of the eastern tropical North Atlantic. Biogeosciences 14, 1825–1838. doi: 10.5194/bg-14-1825-2017
Fabris A.-S., Larouche P., Montero-Serrano J.-C. (2021). Characterization of suspended matter size and composition in the St. Lawrence Estuary (eastern Canada). Regional Stud. Mar. Sci. 45. doi: 10.1016/j.rsma.2021.101838
Galbraith P. S. (2006). Winter water masses in the Gulf of St. Lawrence. J. Geophysical Res. 111. doi: 10.1029/2005jc003159
García-Martín E. E., Davidson K., Davis C. E., Mahaffey C., McNeill S., Purdie D. A., et al. (2021). Low contribution of the fast-sinking particle fraction to total plankton metabolism in a temperate shelf sea. Global Biogeochemical Cycles 35. doi: 10.1029/2021gb007015
Gilbert D., Pettigrew B. (1997). Interannual variability, (1948–1994) of the CIL core temperature in the Gulf of St. Lawrence. Can. J. Fisheries Aquat. Sci. 54, 57–67. doi: 10.1139/f96–160
Gilbert D., Sundby B., Gobeil C., Mucci A., Tremblay G. H. (2005). A seventy-two-year record of diminishing deep-water oxygen in the St. Lawrence estuary: The northwest Atlantic connection. Limnology Oceanography 50, 1654–1666. doi: 10.4319/lo.2005.50.5.1654
Grace J. B., Schoolmaster D. R., Guntenspergen G. R., Little A. M., Mitchell B. R., Miller K. M., et al. (2012). Guidelines for a graph-theoretic implementation of structural equation modeling. Ecosphere 3. doi: 10.1890/ES12-00048.1
Hansen H. P. (1999). “4 Determination of oxygen,” in Methods of Seawater Analysis: Third, Completely Revised and Extended Edition. Eds. Grasshoff K., Kremlingi K., Ehrhardt M. (Wiley-VCH Verlag GmbH, Weinheim, Germany), 75–89.
Hemsley V., Füssel J., Duret M. T., Rayne R. R., Iversen M. H., Henson S. A., et al. (2023). Suspended particles are hotspots of microbial remineralization in the ocean’s twilight zone. Deep Sea Res. Part II: Topical Stud. Oceanography 212. doi: 10.1016/j.dsr2.2023.105339
Herndl G. J., Reinthaler T. (2013). Microbial control of the dark end of the biological pump. Nat. Geosci. 6, 718–724. doi: 10.1038/ngeo1921
Hudon C., Gagnon P., Rondeau M., Hébert S., Gilbert D., Hill B., et al. (2017). Hydrological and biological processes modulate carbon, nitrogen and phosphorus flux from the St. Lawrence River to its estuary (Quebec, Canada). Biogeochemistry 135, 251–276. doi: 10.1007/s10533-017-0371-4
Iversen M. H. (2023). Carbon export in the ocean: A biologist’s perspective. Annu. Rev. Mar. Sci. 15, 357–381. doi: 10.1146/annurev-marine-032122-035153
Jutras M., Mucci A., Chaillou G., Nesbitt W. A., Wallace D. W. R. (2023). Temporal and spatial evolution of bottom-water hypoxia in the St Lawrence estuarine system. Biogeosciences 20, 839–849. doi: 10.5194/bg-20-839-2023
Karl D. M., Knauer G. A., Martin J. H. (1988). Downward flux of particulate organic matter in the ocean: a particle decomposition paradox. Nature 332, 438–441. doi: 10.1038/332438a0
Kelley D., Richards C., SCOR/IAPSO W. (2022). gsw: Gibbs sea water functions (R package version 1.1–1). Vienna, Austria: CRAN. Available at: https://CRAN.R-project.org/package=gsw.
Köllner K. E., Carstens D., Schubert C. J., Zeyer J., Bürgmann H. (2013). Impact of particulate organic matter composition and degradation state on the vertical structure of particle-associated and planktonic lacustrine bacteria. Aquat. Microbial Ecol. 69, 81–92. doi: 10.3354/ame01623
Koutitonski V. G., Bugden G. L. (1990). The physical oceanography of the Gulf of St. Lawrence: A review with emphasis on the synoptic variability of the motion. Can. Special Publ. Fisheries Aquat. Sci. 113, 57–90.
Lam P. J., Marchal O. (2015). Insights into particle cycling from thorium and particle data. Annu. Rev. Mar. Sci. 7, 159–184. doi: 10.1146/annurev-marine-010814-015623
Landry M. R., Lorenzen C. J., Peterson W. K. (1994). Mesozooplankton grazing in the Southern California Bight. II. Grazing impact and particulate flux. Mar. Ecol. Prog. Ser. 115, 73–85. doi: 10.3354/meps115073
Laws E. A., D’Sa E., Naik P. (2011). Simple equations to estimate ratios of new or export production to total production from satellite-derived estimates of sea surface temperature and primary production. Limnology Oceanography: Methods 9, 593–601. doi: 10.4319/lom.2011.9.593
Lê S., Josse J., Husson F. (2008). FactoMineR: anRPackage for multivariate analysis. J. Stat. Software 25. doi: 10.18637/jss.v025.i01
Leavitt P. R. (1993). A review of factors that regulate carotenoid and chlorophyll deposition and fossil pigment abundance. J. Paleolimnology 9, 109–127. doi: 10.1007/BF00677513
Lebeuf M., Maltais D., Larouche P., Lavoie D., Lefaivre D., Starr M., et al. (2019). Recent distribution, inventories and temporal trends of suspended particulate matter in the St. Lawrence Estuary, Canada. Regional Stud. Mar. Sci. 29. doi: 10.1016/j.rsma.2019.100664
Lefcheck J. S., Freckleton R. (2015). piecewiseSEM: Piecewise structural equation modelling in r for ecology, evolution, and systematics. Methods Ecol. Evol. 7, 573–579. doi: 10.1111/2041–210x.12512
Le Fouest V. (2005). Seasonal versus synoptic variability in planktonic production in a high-latitude marginal sea: The Gulf of St. Lawrence (Canada). J. Geophysical Res. 110. doi: 10.1029/2004JC002423
Legendre P., Legendre L. (2012). Numerical ecology, 3rd english edition. (Amsterdam, the Netherlands: Elsevier Science BV).
Legendre L., Michaud J. (1999). Chlorophyll a to estimate the particulate organic carbon available as food to large zooplankton in the euphotic zone of oceans. J. Plankton Res. 21, 2067–2083. doi: 10.1093/plankt/21.11.2067
Legendre L., Rivkin R. B., Weinbauer M. G., Guidi L., Uitz J. (2015). The microbial carbon pump concept: Potential biogeochemical significance in the globally changing ocean. Prog. Oceanography 134, 432–450. doi: 10.1016/j.pocean.2015.01.008
Lehmann M. F., Barnett B., Gelinas Y., Gilbert D., Maranger R. J., Mucci A., et al. (2009). Aerobic respiration and hypoxia in the Lower St. Lawrence Estuary: Stable isotope ratios of dissolved oxygen constrain oxygen sink partitioning. Limnology Oceanography 54, 2157–2169. doi: 10.4319/lo.2009.54.6.2157
Lévesque D., Lebeuf M., Maltais D., Anderson C., Starr M. (2023). Transport inventories and exchanges of organic matter throughout the St. Lawrence Estuary continuum (Canada). Front. Mar. Sci. 9. doi: 10.3389/fmars.2022.1055384
Llewellyn C. A., Mantoura R. F. C. (1996). Pigment biomarkers and particulate carbon in the upper water column compared to the ocean interior of the northeast Atlantic. Deep Sea Res. Part I: Oceanographic Res. Papers 43, 1165–1184. doi: 10.1016/0967–0637(96)00043-x
Lopez M. D. G., Huntley M. E., Sykes P. F. (1988). Pigment destruction by Calanus pacificus: impact on the estimation of water column fluxes. J. Plankton Res. 10, 715–734. doi: 10.1093/plankt/10.4.715
Lucotte M., Hillaire-Marcel C., Louchouarn P. (1991). First-order organic carbon budget in the St Lawrence Lower estuary from 13C data. Estuarine Coast. Shelf Sci. 32, 297–312. doi: 10.1016/0272-7714(91)90022-4
Maniaci G., Brewin R. J. W., Sathyendranath S. (2022). Concentration and distribution of phytoplankton nitrogen and carbon in the Northwest Atlantic and Indian Ocean: A simple model with applications in satellite remote sensing. Front. Mar. Sci. 9. doi: 10.3389/fmars.2022.1035399
Martin J. H., Knauer G. A., Karl D. M., Broenkow W. W. (1987). VERTEX: carbon cycling in the northeast Pacific. Deep Sea Res. Part A. Oceanographic Res. Papers 34, 267–285. doi: 10.1016/0198-0149(87)90086-0
Mayor D. J., Sanders R., Giering S. L., Anderson T. R. (2014). Microbial gardening in the ocean’s twilight zone: detritivorous metazoans benefit from fragmenting, rather than ingesting, sinking detritus: fragmentation of refractory detritus by zooplankton beneath the euphotic zone stimulates the harvestable production of labile and nutritious microbial biomass. Bioessays 36, 1132–1137. doi: 10.1002/bies.201400100
Moreau S., Boyd P. W., Strutton P. G. (2020). Remote assessment of the fate of phytoplankton in the Southern Ocean sea-ice zone. Nat. Commun. 11, 3108. doi: 10.1038/s41467-020-16931-0
Mucci A., Starr M., Gilbert D., Sundby B. (2011). Acidification of lower St. Lawrence Estuary bottom waters. Atmosphere-Ocean 49, 206–218. doi: 10.1080/07055900.2011.599265
Murphy M. V. (2022). semEff: Automatic calculation of effects for piecewise structural equation models (R package version 0.6.1). Vienna, Austria: CRAN. Available at: https://CRAN.R-project.org/package=semEff.
Nosaka Y., Yamashita Y., Suzuki K. (2017). Dynamics and origin of transparent exopolymer particles in the Oyashio region of the western subarctic Pacific during the Spring diatom bloom. Front. Mar. Sci. 4. doi: 10.3389/fmars.2017.00079
Nowicki M., DeVries T., Siegel D. A. (2022). Quantifying the carbon export and sequestration pathways of the ocean’s biological carbon pump. Global Biogeochemical Cycles 36, e2021GB007083. doi: 10.1029/2021GB007083
Ogle D. H., Doll J. C., Wheeler A. P., Dinno A. (2023). FSA: Simple Fisheries Stock Assessment Methods (R package version 0.9.4). Available at: https://CRAN.R-project.org/package=FSA.
Ogura N. (1970). The relation between dissolved organic carbon and apparent oxygen utilization in the Western North Pacific. Deep Sea Res. Oceanographic Abstracts 17, 221–231. doi: 10.1016/0011-7471(70)90016-1
Oksanen J., Simpson G., Blanchet F., Kindt R., Legendre P., Minchin P., et al. (2022). vegan: Community ecology package (R package version 2.6–4). Vienna, Austria: CRAN. Available at: https://CRAN.R-project.org/package=vegan.
Pan X., Achterberg E. P., Sanders R., Poulton A. J., Oliver K. I. C., Robinson C. (2014). Dissolved organic carbon and apparent oxygen utilization in the Atlantic Ocean. Deep Sea Res. Part I: Oceanographic Res. Papers 85, 80–87. doi: 10.1016/j.dsr.2013.12.003
Pascal L., Cool J., Archambault P., Calosi P., Cuenca A. L. R., Mucci A. O., et al. (2023). Ocean deoxygenation caused non-linear responses in the structure and functioning of benthic ecosystems. Global Change Biol. 30 (1), e16994. doi: 10.1111/gcb.16994
Passow U., Alldredge A. L. (1994). Distribution, size and bacterial colonization of transparent exopolymer particles (TEP) in the ocean. Mar. Ecol. Prog. Ser. 113, 185–198. doi: 10.3354/meps113185
Plourde S., Dodson J. J., Runge J. A., Therriault J. C. (2002). Spatial and temporal variations in copepod community structure in the lower St. Lawrence Estuary, Canada. Mar. Ecol. Prog. Ser. 230, 211–224. doi: 10.3354/meps230211
Pocklington R. (1988). “Organic matter in the Gulf of St. Lawerence,” in Chemical oceanography in the Gulf of St. Lawerence. Ed. Strain P. M. (Department of Fisheries and Oceans, Ottawa, Canada), 49–58.
Rabalais N., Cai W.-J., Carstensen J., Conley D., Fry B., Hu X., et al. (2014). Eutrophication-driven deoxygenation in the coastal ocean. Oceanography 27, 172–183. doi: 10.5670/oceanog.2014.21
R Core Team (2021). R: A language and environment for statistical computing (Vienna, Austria: R Foundation for Statistical Computing).
Regnier P., Resplandy L., Najjar R. G., Ciais P. (2022). The land-to-ocean loops of the global carbon cycle. Nature 603, 401–410. doi: 10.1038/s41586-021-04339-9
Riley J. S., Sanders R., Marsay C., Le Moigne F. A. C., Achterberg E. P., Poulton A. J. (2012). The relative contribution of fast and slow sinking particles to ocean carbon export. Global Biogeochemical Cycles 26, GB1026. doi: 10.1029/2011GB004085
Ritz C., Baty F., Streibig J. C., Gerhard D. (2015). Dose-response analysis using R. PloS One 10, e0146021. doi: 10.1371/journal.pone.0146021
Sathyendranath S., Stuart V., Nair A., Oka K., Nakane T., Bouman H., et al. (2009). Carbon-to-chlorophyll ratio and growth rate of phytoplankton in the sea. Mar. Ecol. Prog. Ser. 383, 73–84. doi: 10.3354/meps07998
Saucier F. J., Chassé J. (2000). Tidal circulation and buoyancy effects in the St. Lawrence Estuary. Atmosphere-Ocean 38, 505–556. doi: 10.1080/07055900.2000.9649658
Savenkoff C., Castonguay M., Chabot D., Hammill M. O., Bourdages H., Morissette L. (2007). Changes in the northern Gulf of St. Lawrence ecosystem estimated by inverse modelling: Evidence of a fishery-induced regime shift? Estuarine Coast. Shelf Sci. 73, 711–724. doi: 10.1016/j.ecss.2007.03.011
Savenkoff C., Vezina A. F., Packard T. T., Silverberg N., Therriault J. C., Chen W., et al. (1996). Distributions of oxygen, carbon, and respiratory activity in the deep layer of the Gulf of St. Lawrence and their implications for the carbon cycle. Can. J. Fisheries Aquat. Sci. 53, 2451–2465. doi: 10.1139/f96-198
Schneider B., Schlitzer R., Fischer G., Nöthig E. M. (2003). Depth-dependent elemental compositions of particulate organic matter (POM) in the ocean. Global Biogeochemical Cycles 17. doi: 10.1029/2002GB001871
Schubert C. J., Niggemann J., Klockgether G., Ferdelman T. G. (2005). Chlorin Index: A new parameter for organic matter freshness in sediments. Geochemistry Geophysics Geosystems 6, Q03005. doi: 10.1029/2004GC000837
Shetye S. S., Kurian S., Vidya P. J., Gauns M., Shenoy D. M., Aparna S. G., et al. (2021). Total organic carbon and its role in oxygen utilization in the eastern Arabian Sea. Mar. pollut. Bull. 163, 111939. doi: 10.1016/j.marpolbul.2020.111939
Shipley B. (2009). Confirmatory path analysis in a generalized multilevel context. Ecology 90, 363–368. doi: 10.1890/08-1034.1
Shipley B., Douma J. C. (2020). Generalized AIC and chi-squared statistics for path models consistent with directed acyclic graphs. Ecology 101, e02960. doi: 10.1002/ecy.2960
Shuman F. R., Lorenzen C. J. (1975). Quantitative degradation of chlorophyll by a marine herbivore. Limnology Oceanography 20, 580–586. doi: 10.4319/lo.1975.20.4.0580
Siegel D. A., DeVries T., Cetinic I., Bisson K. M. (2023). Quantifying the ocean’s biological pump and its carbon cycle impacts on global scales. Ann. Rev. Mar. Sci. 15, 329–356. doi: 10.1146/annurev-marine-040722-115226
Suess E. (1980). Particulate organic-carbon flux in the oceans - Surface productivity and oxygen utilization. Nature 288, 260–263. doi: 10.1038/288260a0
Therriault J.-C., Legendre L., Demers S. (1990). “Oceanography and ecology of phytoplankton in the st. Lawrence estuary,” in Oceanography of a large–scale estuarine system, the st. Lawrence. Eds. El-Sabh M. I., Silverberg N. (Springer-Verlag, New York, NY), 269–290.
Thomalla S. J., Ogunkoya A. G., Vichi M., Swart S. (2017). Using optical sensors on gliders to estimate phytoplankton carbon concentrations and chlorophyll-to-carbon ratios in the southern ocean. Front. Mar. Sci. 4. doi: 10.3389/fmars.2017.00034
Tian R. C., Vézina A., Legendre L., Ingram R. G., Klein B., Packard T., et al. (2000). Effects of pelagic food-web interactions and nutrient remineralization on the biogeochemical cycling of carbon: a modeling approach. Deep Sea Res. Part II: Topical Stud. Oceanography 47, 637–662. doi: 10.1016/S0967-0645(99)00121-6
Venables W. N., Ripley B. D. (2002). Modern applied statistics with S. Fourth edition. (New York: Springer).
Wassmann P. (1997). Retention versus export food chains: processes controlling sinking loss from marine pelagic systems. Hydrobiologia 363, 29–57. doi: 10.1023/A:1003113403096
Keywords: organic matter, chlorophyll, degradation, remineralization, St. Lawrence Estuary, hypoxia, chloropigments, Chlorin Index
Citation: Lévesque D, Lebeuf M and Starr M (2024) Using chlorophyllic organic matter degradation in the deep St. Lawrence Estuary as an indicator of water column remineralization. Front. Mar. Sci. 11:1399961. doi: 10.3389/fmars.2024.1399961
Received: 12 March 2024; Accepted: 29 April 2024;
Published: 22 May 2024.
Edited by:
Xianbiao Lin, Ocean University of China, ChinaReviewed by:
Dongdong Zhu, Ocean University of China, ChinaDengzhou Gao, Fujian Normal University, China
Copyright © 2024 Lévesque, Lebeuf and Starr. This is an open-access article distributed under the terms of the Creative Commons Attribution License (CC BY). The use, distribution or reproduction in other forums is permitted, provided the original author(s) and the copyright owner(s) are credited and that the original publication in this journal is cited, in accordance with accepted academic practice. No use, distribution or reproduction is permitted which does not comply with these terms.
*Correspondence: David Lévesque, RGF2aWQuTGV2ZXNxdWVAZGZvLW1wby5nYy5jYQ==