 Eric C. Orenstein
 Benjamin Woodward
 Lonny Lundsten
 Kevin Barnard
 Brian Schlining
 Kakani Katjia
- 1Research and Development, Information and Technology Dissemination, Monterey Bay Aquarium Research Institute, Moss Landing, CA, United States
- 2Research and Development, National Oceanography Centre, Southampton, United Kingdom
- 3Research and Development, CVision AI, Medford, MA, United States
Marine scientists have been leveraging supervised machine learning algorithms to analyze image and video data for nearly two decades. There have been many advances, but the cost of generating expert human annotations to train new models remains extremely high. There is broad recognition both in computer and domain sciences that generating training data remains the major bottleneck when developing ML models for targeted tasks. Increasingly, computer scientists are not attempting to produce highly-optimized models from general annotation frameworks, instead focusing on adaptation strategies to tackle new data challenges. Taking inspiration from large language models, computer vision researchers are now thinking in terms of “foundation models” that can yield reasonable zero- and few-shot detection and segmentation performance with human prompting. Here we consider the utility of this approach for ocean imagery, leveraging Meta’s Segment Anything Model to enrich ocean image annotations based on existing labels. This workflow yields promising results, especially for modernizing existing data repositories. Moreover, it suggests that future human annotation efforts could use foundation models to speed progress toward a sufficient training set to address domain specific problems.
1 Introduction
Ocean scientists have been capturing images and video to observe marine organisms for decades (Jaffe, 2014; Robison et al., 2017). The instruments that collect this visual data have become progressively more efficient with improved battery technology and the advent of digital sensors and storage. Researchers now regularly collect terabytes of images, perhaps representing 100s of thousands of observations, over a single field campaign (Bell et al., 2022). The sheer amount of raw data precludes fully manual annotation and has inspired marine scientists to invest time and effort into automating the process.
Marine scientists have leveraged recent advances in supervised machine learning (ML) models, training and deploying a neural network or vision transformer architecture. These tools learn a feature space directly from a set of annotated image or video data, obviating the need for hand-engineered features tailored to a particular data set. Scientists iteratively tune a model until it achieves acceptable performance on an independent validation set and then deploy it to process new data collected in the field. Crucially, this entire process relies on expertly annotated data to ensure that the model learns a robust mapping between the input images and the desired output concepts.
Creating a high-quality, taxonomically-correct set of labeled data for training ML models remains an extremely time-consuming task (Van Horn et al., 2015). Highly-trained annotators must spend 100s of hours examining images and footage to identify a sufficient number of animals to appropriately tune modern models (Hughes et al., 2018). The degree of difficulty, and hence number of necessary human hours, for these annotation tasks increases significantly when experts must also localize objects with bounding boxes, polygons, or segmentation masks (Katija et al., 2022). Unfortunately, this is typically an open-ended process: most supervised models fail when applied to data collected in new regions with different equipment, thus requiring continuing manual annotation efforts as scientists seek to work in new regions or with different tools (Beery et al., 2018; Orenstein et al., 2020).
These challenges are not unique to oceanographic or marine biological applications of ML. Computer scientists are increasingly looking to develop methods to adapt models to new data distributions, often with the explicit inclusion of humans in the workflow. This type of approach is common in Natural Language Processing where researchers have embraced the development of “foundation models,” any large model trained on a large corpus of annotated data that generalizes well to new tasks (Bommasani et al., 2021). The strong performance in few- and zero-shot scenarios—situations where limited or no training data is available—is often achieved via prompt engineering, where humans interact with the model to generate a valid response to the task at hand. Computer vision researchers are now developing foundation models for image annotation tasks like object detection and segmentation. The goal is to produce trained models that are general enough to yield useful output based on a simpler, human-generated prompt (e.g. a point, bounding box, or text description) that specifies what to localize in an image. The resulting localized data can then be used to fine-tune a model for a downstream, domain-specific task.
The utility of foundation models for ocean imaging is manifest; they could be leveraged to speed a human annotator’s first pass through a dataset or to enrich existing annotations. In this paper, we present and analyze the output of Meta AI’s Segment Anything Model (SAM; Kirillov et al., 2023) on four ocean-specific dataset enrichment tasks: (1) selecting regions from point annotations on images collected from a tow sled running transects around Antarctica (Jansen et al., 2023); (2) converting point annotations to bounding boxes on images from the Station M abyssal monitoring station (Smith and Druffel, 1998); (3) returning segmentation masks from a set of bounding boxes of fish in images collected at a cabled observatory 4-km off the coast of Spain (Francescangeli et al., 2023); and (4) creating segmentation masks from bounding boxes around the inner filters of larvaceans in images drawn from FathomNet (Katija et al., 2022). These datasets represent diverse habitats, sampling methodologies, and target organisms. In all cases, SAM is not attempting to output a taxonomic label. Instead, the model attempts to create a localization—drawing either a box or outline—around an object based on a point selected by a human. While we are programmatically feeding SAM pre-existing annotations, the prompts could equivalently be interactively supplied by a human annotator.
We underscore that these results are an early exploration of an extremely powerful new tool. Our work should be viewed as an engineering test, an attempt to understand how to apply foundation models to assist human annotators in a principled and clear-eyed manner. These results should be taken as illustrative rather than conclusive; there are many remaining avenues to explore and challenges to address. With that caveat, we believe our results are compelling enough to suggest that foundation models should quickly become a standard part of expert human annotation workflows for marine visual data.
1.1 Related work
Foundation models can be thought of as a human-AI system that attempts to alleviate some of the annotation burden for human experts. The body of work is akin to human-in-the-loop systems used to speed manual classification of imagery by leveraging model output to presort data or ask annotators guiding questions. In the question setting, the computer selects maximally informative questions to ask users based on the image itself and the annotators’ previous responses (Branson et al., 2010). This technique has been used effectively for fine grained classification, especially of birds (Wah et al., 2011). More recently, representation models have been trained to presort image data ecological studies. The MegaDetector is a general purpose terrestrial object detector that finds animals in camera trap data but does not ascribe a label, effectively removing empty frames from a raw dataset (Norouzzadeh et al., 2021). The MAIA method was developed specifically for marine imagery and uses a series of unsupervised and semi-supervised steps to bootstrap annotations in a new dataset (Zurowietz et al., 2018). The goal of these systems is to pre-filter data automatically for human verification and, eventually, training of a dataset-specific model (Russakovsky et al., 2015).
Foundation models can be used in an identical manner, generating region proposals automatically for expert review, but have the additional capability of operating directly with a human-in-the-loop. Instead of asking users questions or prefiltering data, foundation models ingest direct human input to parse a generic feature representation of a given image. While technologically different, the approaches are conceptually similar: get a human to help the machine interpret an image with minimal effort. SAM in particular has shown promise for domain science applications like drone-based remote sensing for detecting aquaculture infrastructure (Ren et al., 2023). Janowski and Wróblewski (2024) applied SAM to analyze a diversity of seabed data collected by several sampling systems. The pipeline they articulate uses SAM without human prompting and is targeting bathymetric features along the seabed. We believe our work is the first to measure SAM’s performance on marine biological images based on human prompts.
The methods described in this paper belong to the broad field of computer vision. We rely on technical terms throughout the paper and have attempted to describe them as concisely as possible in the main paper. We have provided a glossary in Supplementary Table S1 as a quick reference for terms that show up throughout the text. We also point readers to excellent primers on computer vision for animal ecology by Weinstein (2018) and a more specific treatment for marine biology in Belcher et al. (2023).
2 Methods
2.1 Segment Anything Model
The Segment Anything Model (SAM) is an image segmentation foundation model, a system that is trained on a broad corpus of annotated images so it can easily generalize to new scenarios (Kirillov et al., 2023). Importantly, SAM was designed to be applied to a range of downstream tasks using prompt engineering, explicitly meant to function in zero- and few-shot environments with human input. SAM was trained on SA-1B, an enormous dataset of 1 billion segmentation masks drawn from 11 million images. The scale of SA-1B dwarfs previous libraries of segmentation masks, with approximately 400x more masks than previously released datasets (Kirillov et al., 2023). The dataset is composed of high resolution images of everyday objects, collected around the world, taken with a variety of cameras, and licensed from a third party photo provider. There are some images of marine organisms in this data, but none collected underwater nor drawn from scientific datasets.
The SAM framework consists of a Vision Transformer model used as an image encoder, a prompt encoder that maps inputs to an embedding space, and a decoder that combines image and prompt embeddings to generate output masks. The developers tested SAM’s zero-shot performance with point prompts on 23 datasets covering a range of domains, including two underwater image datasets: Northumberland Dolphin Dataset (NDD20), a set of DSLR and GoPro images, and TrashCan, a subset of the JAMSTEC Deep-sea Debris Database of ROV video data (Trotter et al., 2020; Hong et al., 2020). NDD20 segmentation masks are annotated both at the coarse level of ‘dolphin’ and identified as individuals. TrashCan images are labeled with 7 morphotaxonomic classes and 8 types of human detritus found on the sea floor. SAM produced reasonable masks on both of these datasets as measured by both Intersection over Union and a qualitative survey distributed to annotators (Kirillov et al., 2023).
2.2 Deployment
We deployed SAM with the ViT-L backbone trained on the SB-1 dataset1 the first release of the model (Kirillov et al., 2023). We used the model as-is, with no hyperparameter tweaking or fine tuning. We wrote a wrapper function to feed SAM prompts in a standard format and retrieve region proposals to simulate a human annotator interacting with SAM. This workflow was devised to make use of existing human annotations and assess what SAMs output might be should those annotations have been done with a foundation model.
We deployed SAM on a server based NVIDIA RTX A6000. All wrapper code written for this project to feed images and prompts into the model and analyze results are available on GitHub2. We note we are not able to make the endpoint publicly available to run new images through the model. Users will need access to their own GPU to run SAM.
2.3 Datasets
We drew data from four datasets containing a diversity of images from around the world, collected in different habitats with different approaches to target different organisms (Table 1). In all cases, we took a small subset from each repository, selected by a random number generator. Our team did not create any new human annotations for prompting; we adhere to the taxonomies and labeling schemes used by the original data annotators.
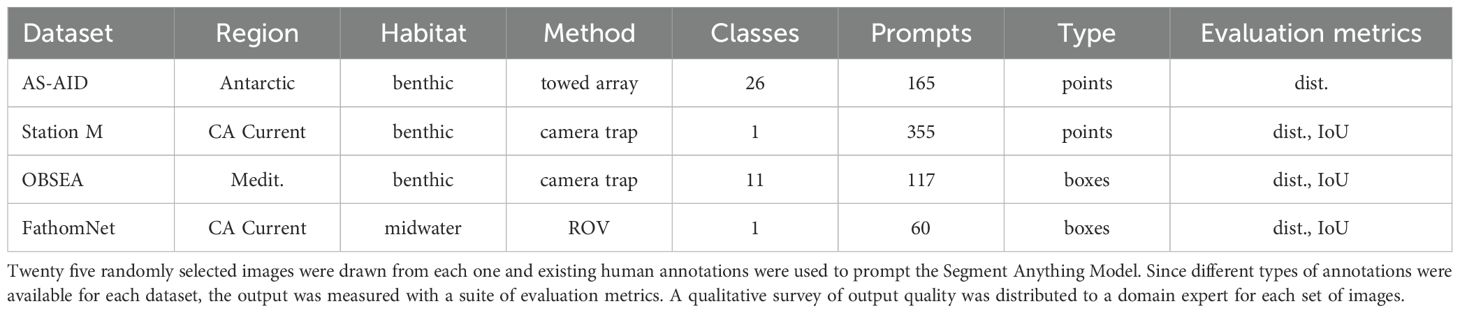
Table 1. Summary of datasets considered.
2.3.1 The Antarctic Seafloor Annotated Imagery Database
The Antarctic Seafloor Annotated Image Database (AS-AID) is a set of images collected from downward facing camera on a tow sled in the waters around Antarctica between 1985 and 2019 (Jansen et al., 2023). The dataset represents 80 classes of animals and substrate collected in diverse high latitude habitats. Domain experts used a point-grid annotation scheme to estimate percent coverage of substrates and organisms. Grid sampling is an approach for making relatively unbiased population estimates in a spatial region within some uncertainty bound. For image-based sampling, the dimensions of the sample grid are determined by the image size and the desired sampling statistics (Perkins et al., 2016). The ASAID annotators overlaid a 9 x 12 grid of points and identified the substrate or organism found at that single pixel for a total of 108 point annotations of animals and objects in each frame. The team used the CoralNet web-based GUI and its label suggestion function to do their manual labeling (Chen et al., 2021). All organism labels were based on the Collaborative and Annotation Tools for Analysis of Marine Imagery (CATAMI) hierarchical classification scheme (Althaus et al., 2015). In the current work, we ignore substrate labels and focus only on organism point annotations for prompting SAM.
2.3.2 Station M benthic camera trap
Station M is an abyssal monitoring station established in 1989 off the coast of Central California to study seafloor processes over time and better quantify energetic relationships between the surface and the benthos (Smith and Druffel, 1998; Sherman and Smith, 2009). Images are taken every hour, and a subsample has been point annotated in MBARI’s Video Annotation and Reference System (VARS) for 15 classes by a team of experts in the regional benthic fauna (Schlining and Stout, 2006). The taxonomic names adhere to the World Register of Marine Species (WoRMS) knowledge database (Horton et al., 2021). We focused on the jellyfish Benthocodon spp., one of the most common organisms at Station M, for the purposes of the current work. The point annotations for Benthocodon spp. in each subsampled image were used to prompt SAM. For the purpose of evaluation for the current work, a human expert from the MBARI Video Lab made bounding box annotations around the previously identified points.
2.3.3 OBSEA Image Dataset
The Seafloor Observatory (OBSEA) Image Dataset is an annotated subsample of image data collected by a cabled video-platform deployed in a marine protected area 4 km off the coast of Barcelona, Spain (Francescangeli et al., 2023). Images were collected every 30 minutes over a two year period from 2013 to 2015 with a camera observing an artificial reef structure at about 20 m depth. Two different cameras were used over the course of the deployment and images were JPEG compressed for storage. The OBSEA research team built a custom python-based annotation tool to draw bounding boxes oriented along the major axis of target fish (Marini, 2022). The classification adhered to the FishBase hierarchy and included an “unknown” category for out of focus targets (Froese and Pauly, 2000). Since the OBSEA data was originally annotated with bounding boxes, we use those localizations rather than points to prompt SAM to generate segmentation masks. The boxes were rotated to align with the image axes for the purpose of these experiments.
2.3.4 FathomNet imagery
FathomNet is a global image database that hosts human-verified annotated marine images, collected in all marine habitats, from the surface to the benthos and the coast to the open ocean (Katija et al., 2022). We selected annotated images of Bathochordaeus mcnutti, a species of filter feeding larvacean found in the midwater, from the broader FathomNet repository (Sherlock et al., 2017; Katija et al., 2017). These images often had multiple bounding box localizations per individual highlighting the animal itself, the inner filter, and outer filter where present. The midwater habitat and the shapes of the filters are very unlike anything originally used to train SAM. The annotations were made with the VARS-Localize interface according to WoRMS accepted taxonomic designations (Barnard, 2020; Horton et al., 2021). For the purposes of our tests, we selected images collected from 2018 to 2024 and prompted SAM with just localizations of the inner filter.
2.4 Evaluation
Bounding boxes and masks suggested by SAM were evaluated with three metrics. Intersection over Union (IoU) and Euclidean distance measurements are fairly standard in image processing and computer vision. A qualitative survey, akin to the one distributed by the SAM authors, was given to our expert human annotators.
2.4.1 Intersection over Union
Intersection over Union (IoU) is the ratio between the area correctly identified by the computer and the total number of pixels between the proposal and the ground truth:
where A is the region proposed by SAM and B is the ground truth localization. A ∩ B is the number of pixels shared between the regions and A∪B is the total number of pixels in both. IoU is bounded between 0 and 1, with IoU = 0 indicating the regions are entirely disjoint and IoU = 1 indicating they are perfectly aligned (Rezatofighi et al., 2019). IoU was computed between each proposal and ground truth annotation. These values are subsequently averaged to yield a score for a collection of images.
IoU was used to evaluate the output on the Station M, OBSEA, and FatomNet datasets (Equation 1). The images from AS-AID only have point annotations and thus IoU cannot be computed for those proposals.
2.4.2 Distance
The Euclidean distance was computed between the ground truth point annotation or center of the human localized bounding box and the center of the bounding box output by SAM:
where the point (x1,y1) represents the ground truth point annotation or center of the bounding box. (x2,y2) is the center of the bounding box proposed by SAM. The SAM output for each dataset was evaluated with dist (Equation 2).
3 Results
3.1 AS-AID
After removing substrate labels, SAM was prompted with 414 annotated points from 25 randomly selected images in the AS-AID dataset and returned bounding boxes and segmentation masks (Figures 1a, 2a). The foundation model output was filtered by an area threshold of one million pixels to remove localizations that were larger than a third of the full frame image, removing 121 proposals for a return rate of ∼70%. After filtering by region area, the average distance between the SAM bounding box proposals and the original annotation point was 66.0 pixels (Figure 1b). The mean distance is larger than the other datasets considered in this work.
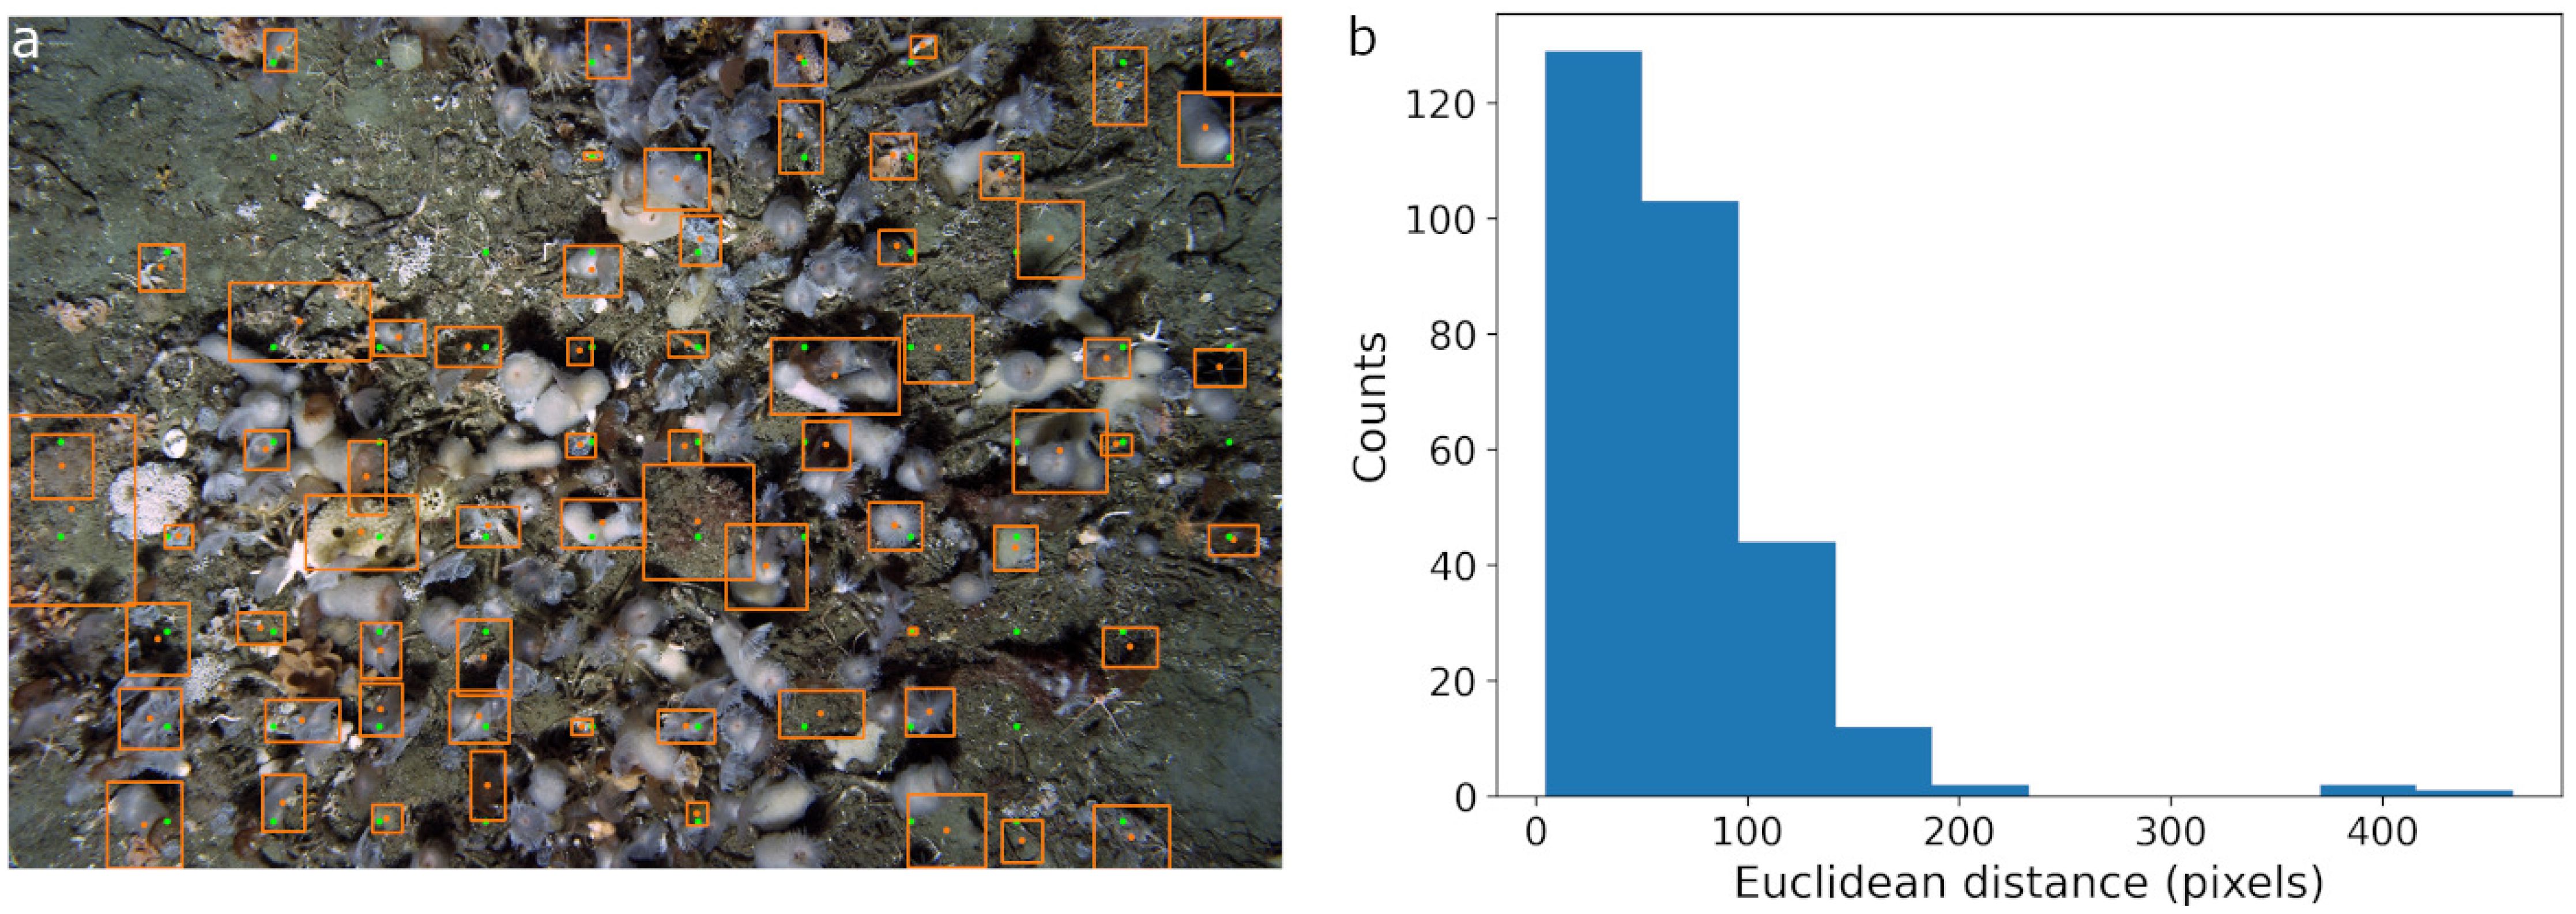
Figure 1. SAM performance on AS-AID image data. The model was prompted with points annotated by grid sampling. For all plots, clearly incorrect region proposals have been removed based on the empirical area threshold. (a) SAM region proposals are plotted in orange with the output bounding boxes and their respective center points. Green circles are the original point annotations. (b) The distribution of Euclidean distance in pixels between the center point of the SAM region proposals and the original point annotations after removing obvious incorrect, large proposals.
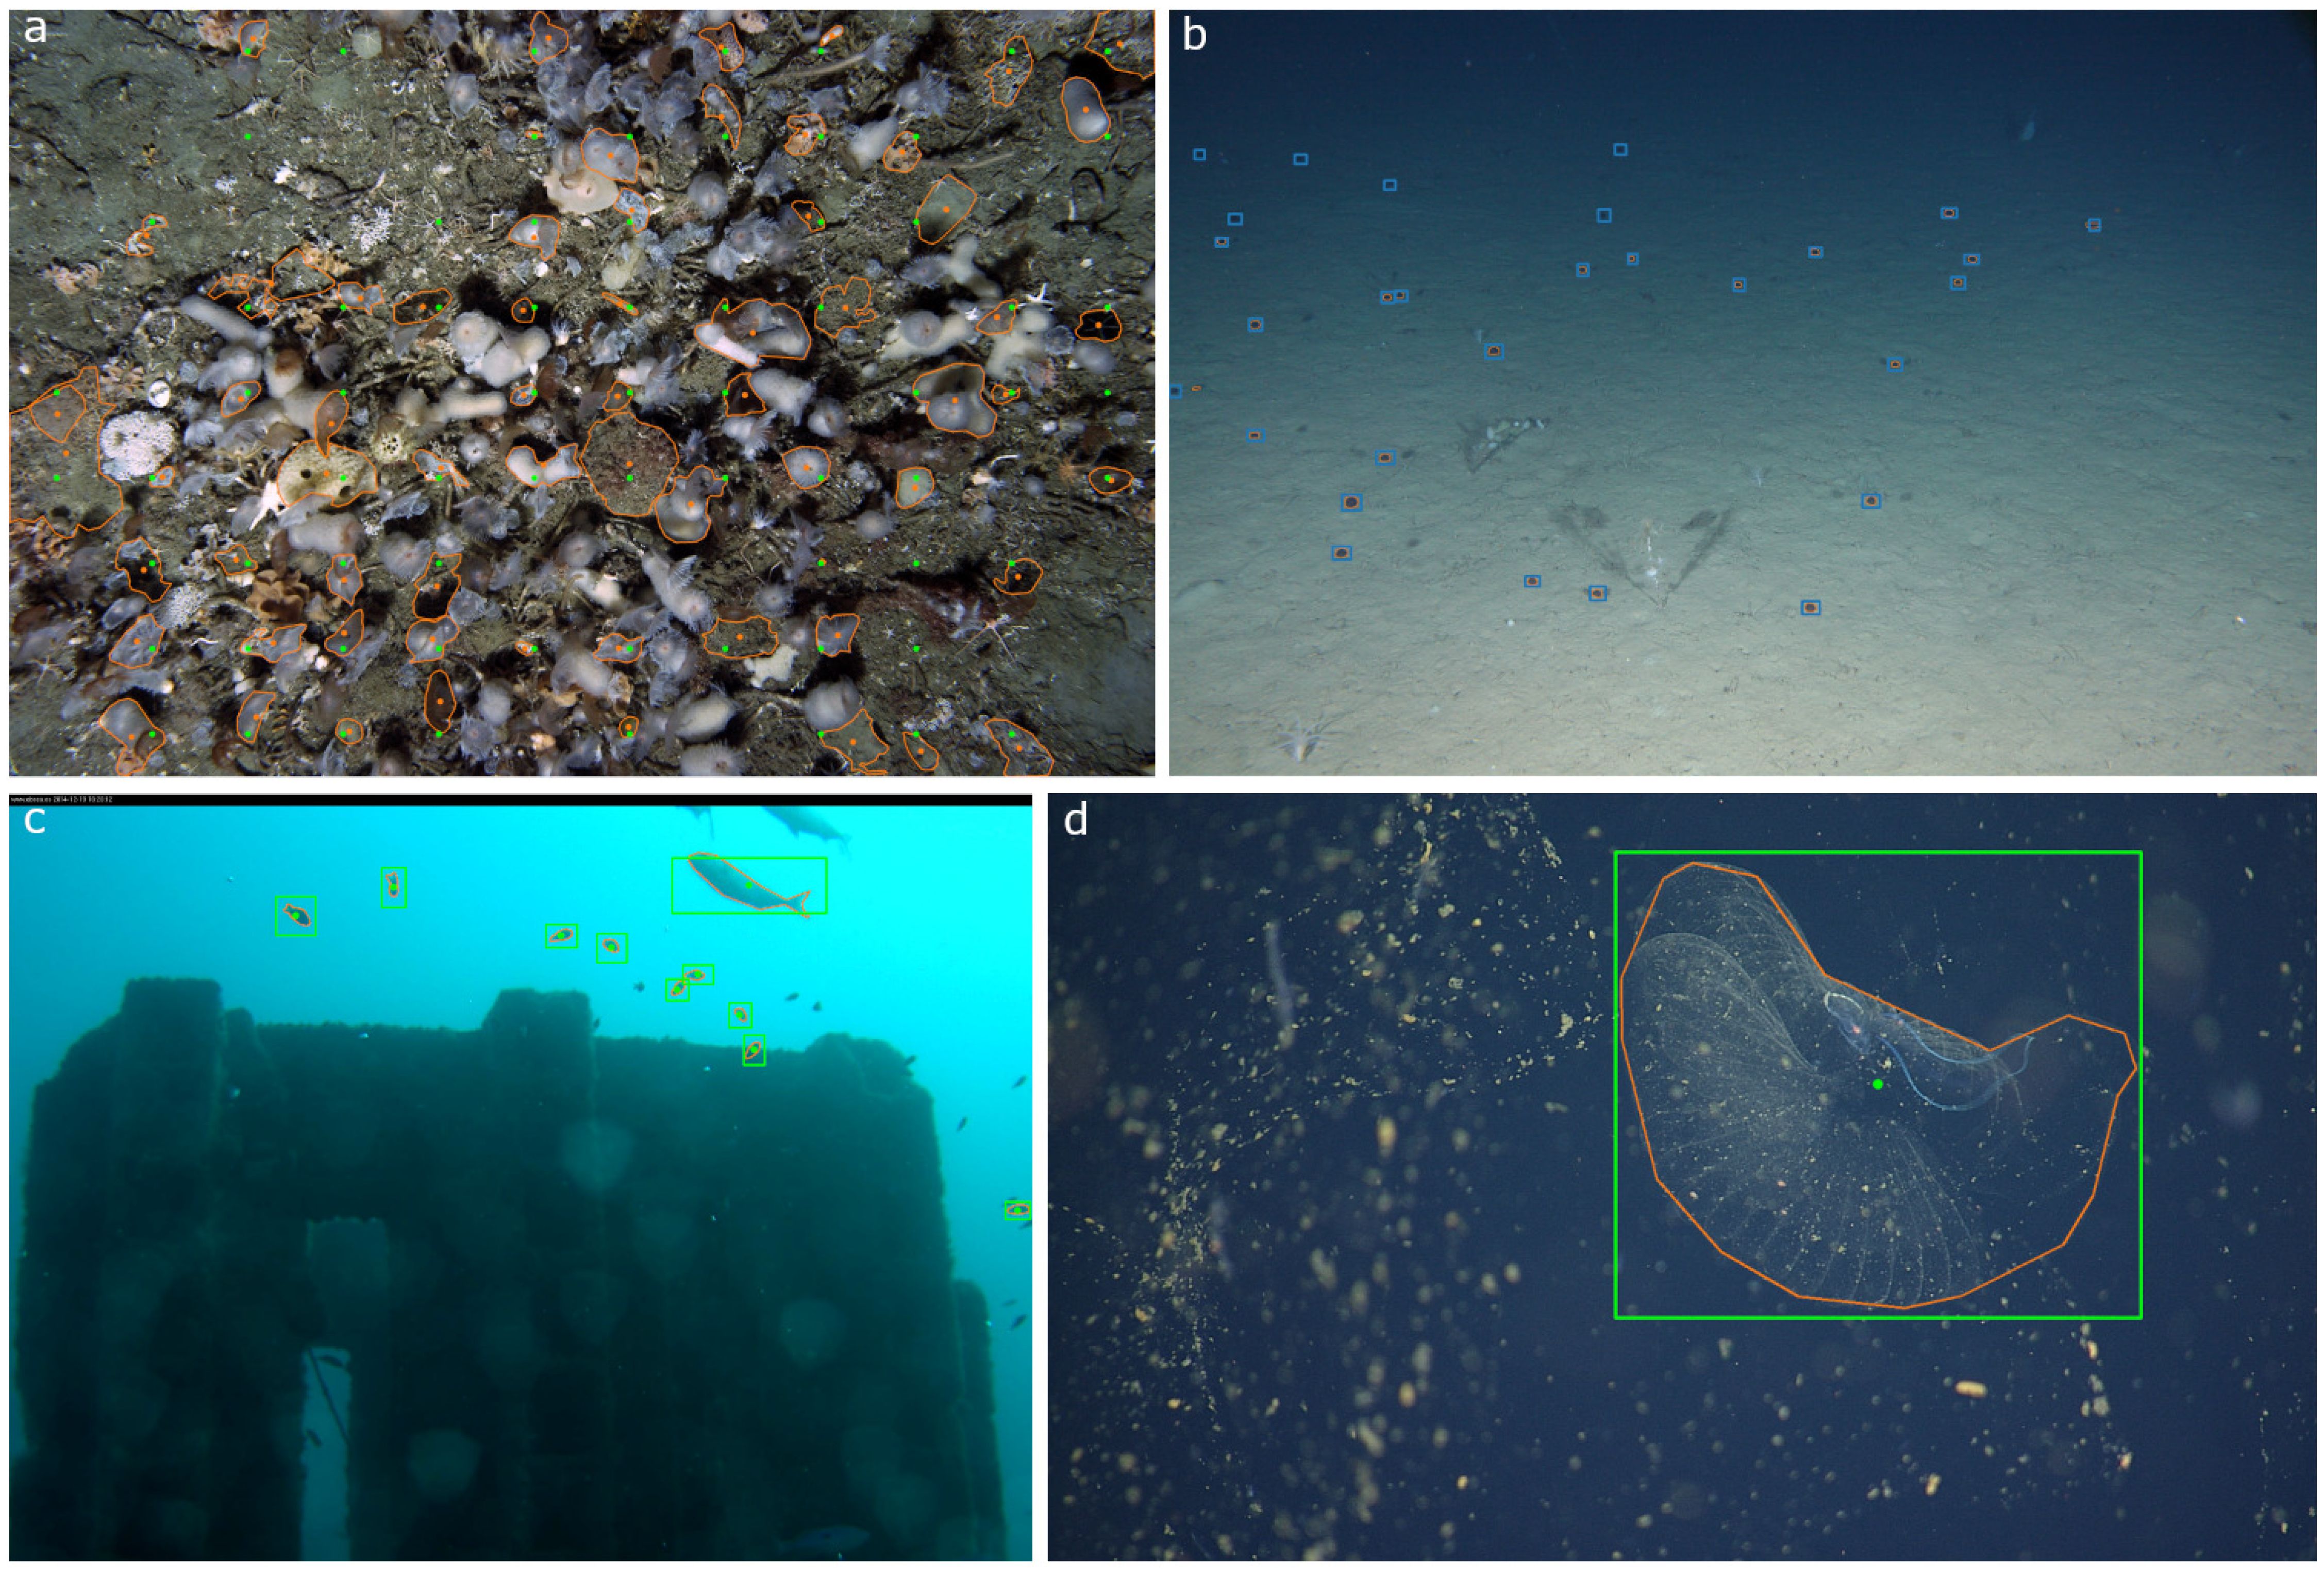
Figure 2. SAM segmentation masks on all four datasets. The model was prompted with points or bounding boxes as described in Section 2.2. The output was filtered as described in Section 3. In all figures, the green boxes and points represent ground truth annotations while orange outlines are SAM segmentation mask proposals. (a) AS-AID. (b) Station-M. (c) OBSEA. (d) FathomNet.
3.2 Station M
SAM was prompted with 335 ground truth point annotations and returned bounding boxes and segmentation masks (Figures 2b, 3). The output was thresholded by area to retain region proposals with an area of less than one million pixels squared. The threshold was chosen based on the size of the original images (2256 x 1504) and set to exclude any bounding boxes larger than a third of the entire image area. This threshold was chosen empirically by observing the outputs and filtering out localizations over a given size.
Figure 3. SAM performance on image data collected at Station M. The SAM model was prompted with point annotations created by human expert annotators. For all plots, clearly incorrect region proposals have already been removed based on the empirical area threshold. (a) SAM region proposals are plotted in orange with both the output bounding boxes and center points. Green circles are the original point annotations. Blue boxes are the ground truth regions made by a human expert for this project. Note that there are instances where the human expert drew boxes where the original human annotator did not indicate a jellyfish Benthocodon spp. (b) The distribution of Euclidean distance in pixels between the center point of the SAM region proposals and the original point annotations. (c) The distribution of Intersection over Union scores between the human expert’s bounding boxes and the SAM proposals. Note that no comparison was made between the new regions identified by the human if there is not a corresponding point label.
After applying the area threshold, SAM returned 284 region proposals from 335 original prompts, a return rate of approximately 85%. SAM typically missed low contrast examples of Benthodocon sp. in the far-field (approximately the upper third of images) and sometimes returned localizations that included shadows cast by the camera’s strobes (Figure 3a). The average Euclidean distance between the original point annotations and the center of the SAM bounding boxes proposals was approximately 15 pixels (Figure 3b). The average IoU between the human generated bounding boxes and the SAM proposals was 0.42 (Figure 3c).
3.3 OBSEA
The 25 image subset of the OBSEA dataset contained 117 bounding box labels. SAM was prompted with the manually drawn boxes and returned both bounding boxes and segmentation masks (Figures 2c, 4a). No area threshold was applied since SAM did not return any obviously incorrect region proposals with an area close to the frame size. The average distance between the center of the manually drawn bounding boxes was 6.3 pixels (Figure 4b). The average IoU between the groundtruth and SAM proposals was 0.39 (Figure 4c). The relatively low IoU was a function of the rectified groundtruth localizations; aligning the boxes to the x-axis rather than the major axis of an individual fish clipped off extremities.
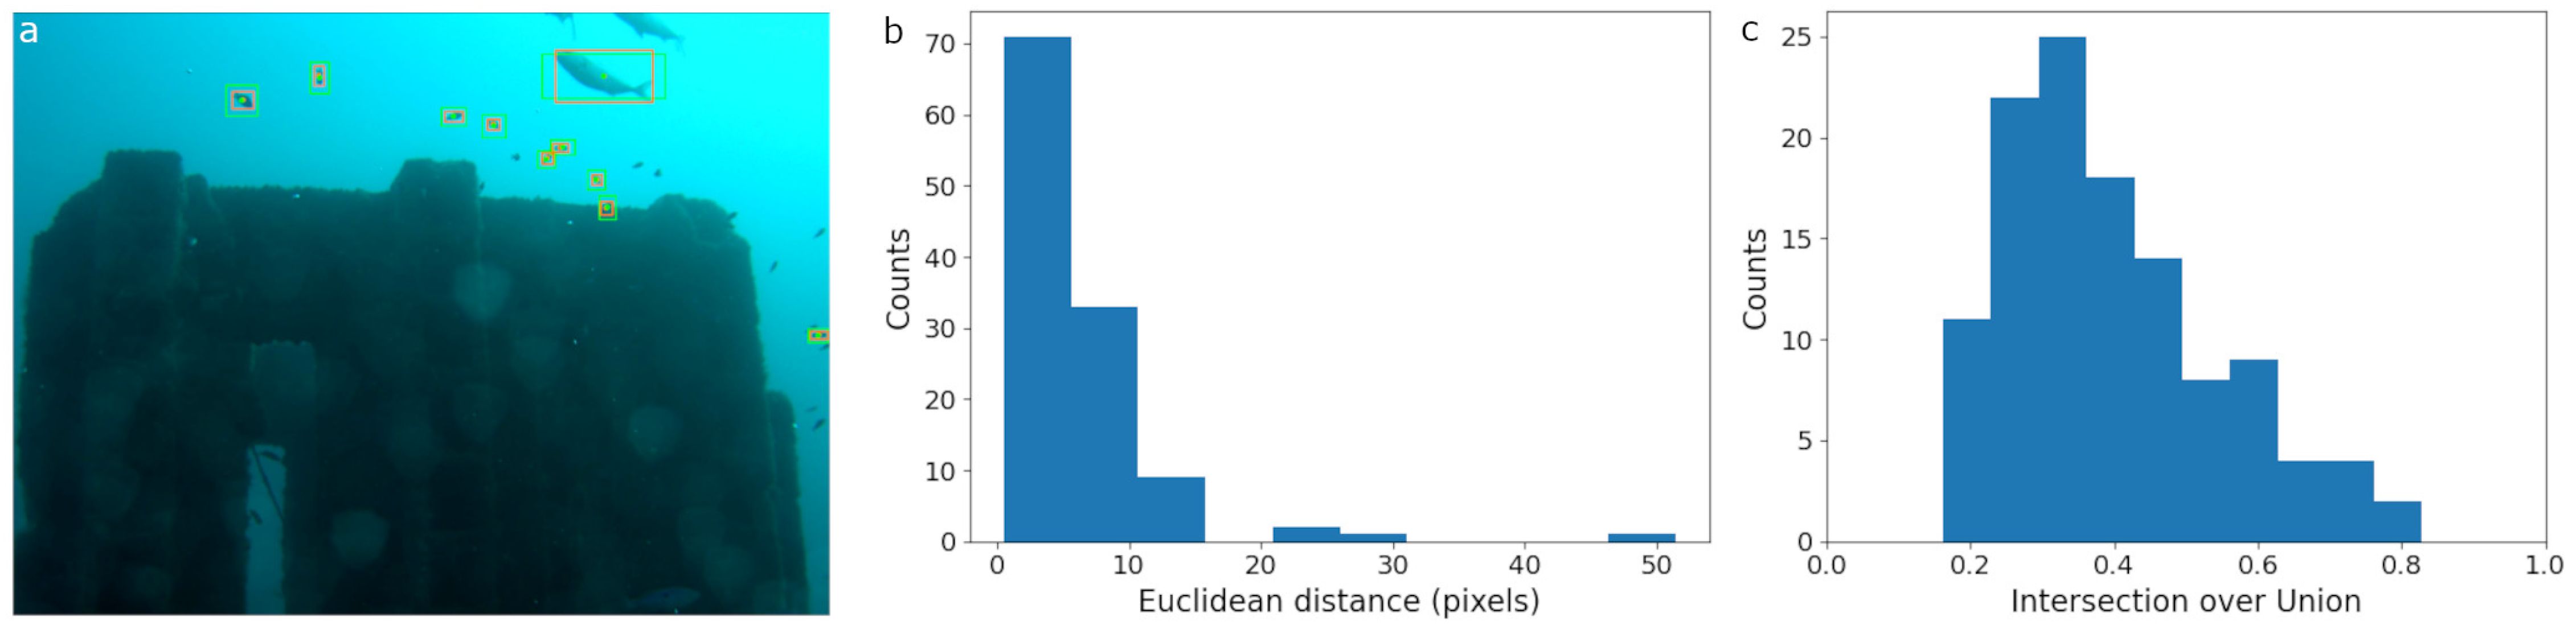
Figure 4. SAM performance on OBSEA imagery. The SAM model was prompted with bounding boxes created by human expert annotators. (a) SAM region proposals are plotted in orange with both the output bounding boxes and center points. Green boxes are the original human annotations and the green circles are the box centers. (b) The distribution of Euclidean distance in pixels between the center point of the SAM bounding box proposals and the center of the human made bounding boxes. (c) The distribution of Intersection over Union scores computed from the overlap between the human ground truth and SAM region proposals.
3.4 FathomNet
The 60 image subset of FathomNet data contained 60 bounding box ground truth labels of the inner filter of Bathochordaeus mcnutti. SAM returned both bounding boxes and segmentation masks based on the manually drawn input localizations (Figures 2d, 5a). Again, SAM did not return any obviously incorrect region proposals and did not require filtering. The average distance between the centers of the region proposals and ground truth bounding boxes was 5.9 pixels (Figure 5b). The mean IoU between the proposals and human generated boxes was 0.88 (Figure 5c).
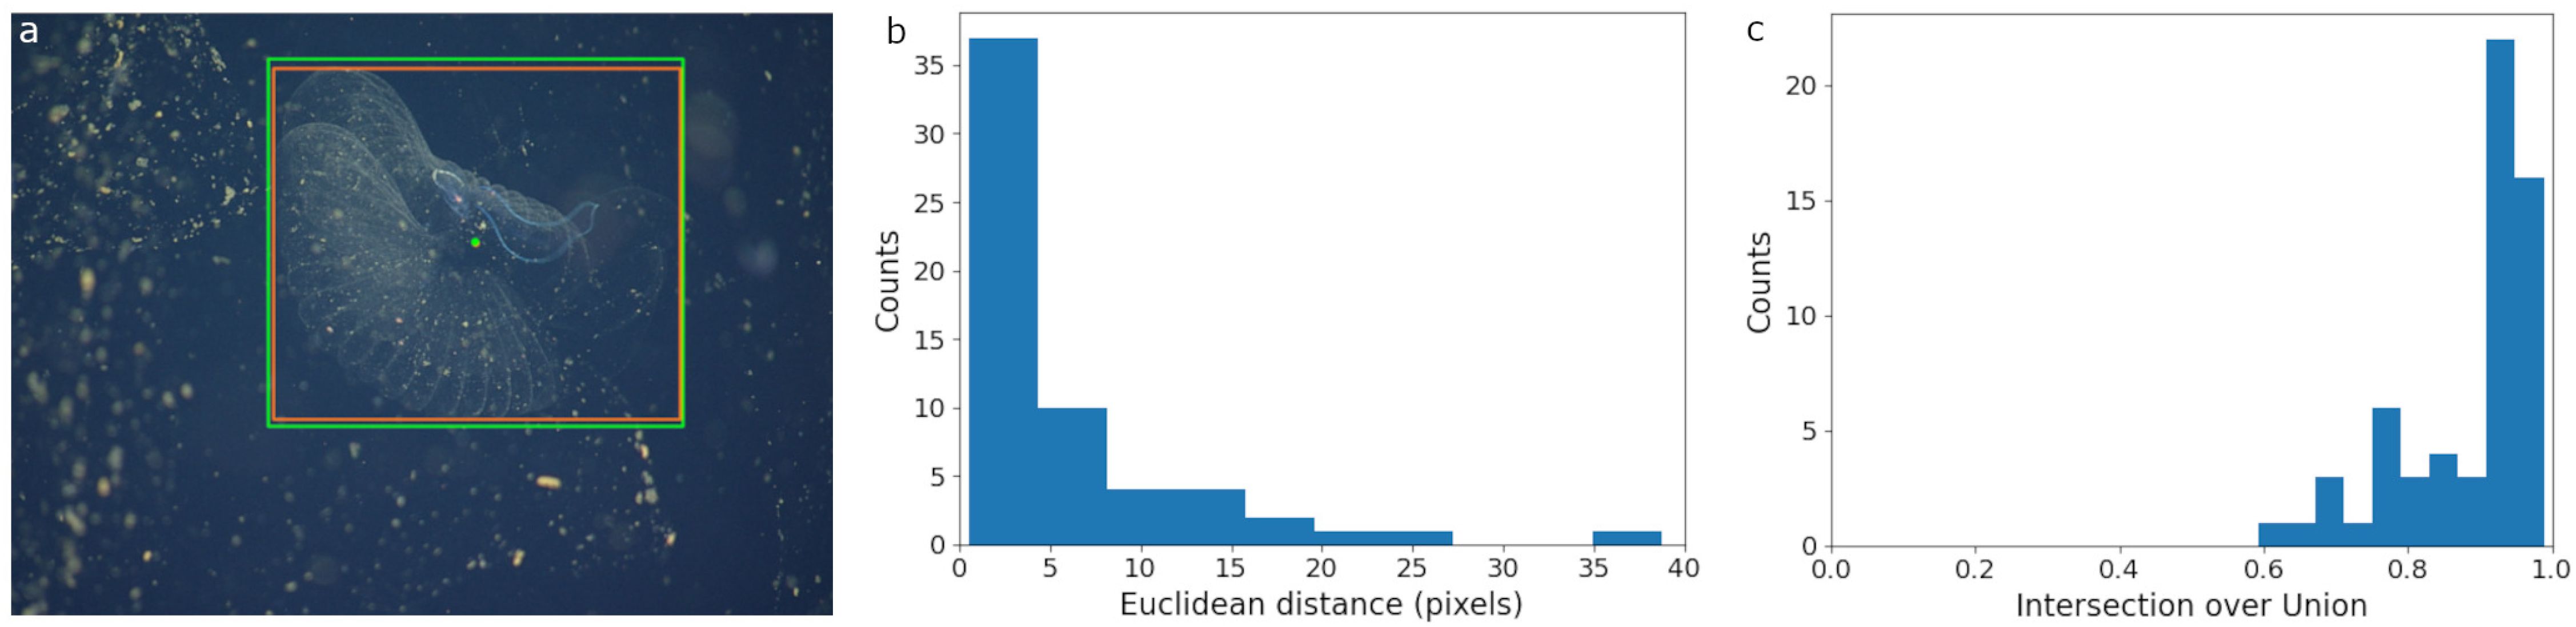
Figure 5. SAM performance on FathomNet imagery of Bathochordaeus mcnutti. The SAM model was prompted with bounding boxes drawn around the inner filter by human expert annotators. (a) The SAM region proposal is plotted in orange and the original human annotation is shown in green. The dots represent the centers of the bounding boxes. (b) The distribution of Euclidean distance in pixels between the center points of the SAM proposals and the ground truth bounding boxes. (c) The distribution of Intersection over Union scores between the human ground truth and SAM region proposals.
4 Discussion
In this paper, we experimented with Meta AI’s Segment Anything Model on four ocean-specific dataset enrichment tasks, testing its ability to return localizations from minimal human prompts. While the model was not perfect, it often produced reasonable bounding box and segmentation proposals from a given point or bounding box prompt as compared to localizations created by human experts. SAM had several important, dataset-dependent failure modes. When it struggled, the errors frequently manifested as boxes or masks with areas close to that of the full frame image. Such obviously incorrect localizations are easy to filter with an empirical area threshold. There are, however, patterns to these errors that give clues as to how foundation models might be most effectively used for enrichment of historic datasets and future annotation assistance.
The AS-AID imagery was the most challenging for SAM to work with. These point annotations were collected from an overhead perspective that is not well represented in the SAM training data. Moreover, the habitat represented in AS-AID is biologically diverse, including animals with complex morphologies imaged over variable substrate. 30% of the prompts caused SAM to return erroneous segmentations over the empirical size threshold. Organisms that are closely grouped in space were often segmented as a single animal. Likewise, since the prompts were from a gridded human annotation workflow, the points were not always on or near the centroid of the target. The model would then sometimes return the negative space formed by a coral branch or between the limbs of an echinoderm. The most egregious errors are easy to filter out with an area threshold, but many failures are difficult to spot with high level metrics and must be corrected by a human operator. Given SAM’s performance on the AS-AID data, the model might be most effective for annotation enrichment when used to target particular organisms like worms, sponges, echinoderms, and certain kinds of bryozoans that occur on their own rather than in colonies. Further experiments are needed to assess SAM’s reliability when prompted manually with points closer to the center of each object.
SAM was able to reliably produce quality proposals from point annotations in the fore- and middle-ground of Station M camera trap images. The model struggled with small objects far from the camera trap and animals with heavy shadows from the strobes. In the first case, SAM would missegment and return a localization above the empirical area threshold. This seems to be a consistent issue with small, relatively low contrast objects – they blend into the background, obscuring edges and making segmentation difficult. In these experiments, about 15% of all annotations returned incorrect localizations on the scale of the entire image. Benthocodon sp. nearer the camera often appeared with bold shadows on both sides, an effect of the strobes. Because Station M is on sandy substrate, these shadows manifest as dark regions on a light background, leading SAM to return horizontally elongated region proposals that include the animal and both shadows. The wide region proposals drove the lower IoU scores relative to the output from the other datasets. This type of error is not easy to filter by simple thresholding and suggests that size estimates from SAM-derived proposals might be suspect without further inspection.
SAM yielded qualitatively excellent results on the OBSEA dataset, returning bounding boxes that included the entire animal and segmentation masks that adhered tightly to the outline of the target fish. The high quality results from SAM are perhaps a function of fish-like objects being present in the original training set. Indeed, the SAM developers reported high zero-shot results on the NDD20 dolphin dataset. SAM occasionally missed heavily shadowed portions of targets in the OBSEA data, losing tails and fins. These are again subtle errors that are difficult to filter with simple thresholds. Fortunately, the errors are rare for the OBSEA data and would mostly affect size estimates from the SAM output.
The model did well with the Bathochordaeus mcnutti data drawn from FathomNet. The bounding boxes were typically tight with the inner filter and aligned well with the ground truth. Segmentation masks likewise were tight to object outline, though tended to include the larvacean itself and occasionally cut off small edges of the filter. While the morphology of the larvacean is quite distinct from the objects used to train SAM, the animal and filter present as light pixels on a dark background; SAM functioned as a very effective edge detector. These results indicate that a foundation model might help annotators quickly create masks and boxes with several clicks. The output would be sufficient for training certain types of AI models, but perhaps not immediately usable for filter volume estimates.
Across the four datasets, SAM was most successful on images in the midwater. The relatively simple, uniform background was easy for the model to parse even when the target morphology (like the larvacean) was different from most of SAM’s training data. The model likewise did well with fish, a concept and morphology it is familiar with from its training data. Both of the tested benthic environments caused distinct issues for SAM. The complexities of the organisms, the variability of the substrate, and distinctive overhead angle in AS-AID caused missegmentations in many cases. The angle and illumination of the Station-M camera system caused shadows and resulted in many far field, small targets that resulted in erroneous localizations from SAM.
While there are many important caveats, SAM’s output in these tests is promising. One should not assume it will work out-of-the-box in all cases, but can anticipate using it to help human annotators do their job more efficiently Awais et al. (2025). With the right user interface, a user could feed SAM unannotated marine image data and prompts to generate region proposals Crosby et al. (2023); Zurowietz et al. (2019). The annotator can then accept or adjust the proposals to get an accurate bounding box or segmentation mask. This workflow will initially be most effective in sparse environments, like midwater image data where object edges are easier to detect, or when asked to find targets like fish that the model is likely already familiar with. Eventually SAM, and other foundation models, will be better able to handle data from complex marine environments with additional human feedback and marine-specific annotations Zhao et al. (2025).
5 Conclusion
The results on these four very different marine image datasets suggests that SAM, and other foundation models, have potential for assisting human experts when creating localized annotations. While SAM’s zero-shot results are very impressive in this domain case study, they are not good enough to be trusted in a fully operational manner; human experts should be prepared to check any data enrichment outputs and manipulate region proposals generated with direct user input. Researchers should exercise caution when attempting to apply the system as-is and spend time determining which organisms, deployment strategies, or regions might effectively leverage the model’s strengths.
There is lots of potential for further studies and calibration of foundation model performance for marine applications. We reiterate our study is best viewed as preliminary. Larger, more comprehensive studies are needed to properly establish efficacy and efficiency, both for annotator assistance and full automated deployment. Future work might include, for example: evaluating the potential of other available foundation models for segmentation; comparing foundation model output directly against a bespoke segmentation model trained directly on the target data distribution; determining foundation model efficacy in noise environments and establishing abilities on old, lower resolution marine image data; execute a humancomputer interactions study to measure the efficiency gains realized when an expert human works with a foundation model to generate new annotations Siriborvornratanakul (2024). We note that executing such projects requires access to enormous annotated datasets, larger than the ones we used for this study. Indeed, the most effective solution may eventually be training of a foundation model specifically for marine images Zhao et al. (2025).
If properly applied, SAM and other foundation models could be very effective for enriching previously annotated image datasets like we did in this study. Such models could also be helpful in a fully interactive manner for new annotations. The output of foundation models will certainly improve with fine-tuning after an appropriately large number of expert-annotated ocean imagery has been collected. Likewise, fully automated models, foundation or otherwise, will continue to require expert-annotated, domain-specific imagery. But existing generic foundation models can already help speed marine scientists toward such bespoke models.
Data availability statement
The original contributions presented in the study are included in the article/Supplementary Material. Further inquiries can be directed to the corresponding author.
Author contributions
EO: Conceptualization, Data curation, Formal analysis, Investigation, Methodology, Software, Visualization, Writing – original draft, Writing – review & editing. BW: Methodology, Software, Writing – original draft, Writing – review & editing. LL: Data curation, Writing – original draft, Writing – review & editing. KB: Data curation, Software, Writing – original draft, Writing – review & editing. BS: Data curation, Software, Writing – original draft, Writing – review & editing. KK: Conceptualization, Funding acquisition, Supervision, Writing – original draft, Writing – review & editing.
Funding
The author(s) declare that financial support was received for the research and/or publication of this article. This work was supported by the National Science Foundation Convergence Accelerator Track E Phase I and II (ITE-2137977 and ITE-2230776). Additional support comes from the Monterey Bay Aquarium Research Institute through generous support from the David and Lucile Packard Foundation.
Acknowledgments
The authors gratefully acknowledge the Station M team at MBARI for providing the annotated benthic camera trap images used in this study.
Conflict of interest
Author BW was employed by CVision AI.
The remaining authors declare that the research was conducted in the absence of any commercial or financial relationships that could be construed as a potential conflict of interest.
Publisher’s note
All claims expressed in this article are solely those of the authors and do not necessarily represent those of their affiliated organizations, or those of the publisher, the editors and the reviewers. Any product that may be evaluated in this article, or claim that may be made by its manufacturer, is not guaranteed or endorsed by the publisher.
Supplementary material
The Supplementary Material for this article can be found online at: https://www.frontiersin.org/articles/10.3389/fmars.2025.1469396/full#supplementary-material
Footnotes
- ^ sam_vit_l_0b3195.pth available at: https://dl.fbaipublicfiles.com/segment_anything/sam_vit_l_0b3195.pth
- ^ https://github.com/bioinspirlab/deepsea-sam-experiments.git
References
Althaus F., Hill N., Ferrari R., Edwards L., Przeslawski R., Schönberg C. H., et al. (2015). A standardised vocabulary for identifying benthic biota and substrata from underwater imagery: the catami classification scheme. PloS One 10, e0141039. doi: 10.1371/journal.pone.0141039
Awais M., Naseer M., Khan S., Anwer R. M., Cholakkal H., Shah M., et al. (2025). Foundation models defining a new era in vision: a survey and outlook. IEEE Trans. Pattern Anal. Mach. Intell 47, 2245–2264. doi: 10.1109/TPAMI.2024.3506283
Barnard K. (2020). VARS-Localize. Available online at: https://github.com/mbari-org/vars-localize (Accessed July 02, 2023).
Beery S., Van Horn G., and Perona P. (2018). Recognition in Terra Incognita. In Ferrari V., Hebert M., Sminchisescu C., and Weiss Y. (Eds.), Computer vision – ECCV 2018 (Lecture Notes in Computer Science), Vol. 11220, 456–473. Cham: Springer. doi: 10.1007/978-3-030-01270-0_28
Belcher B. T., Bower E. H., Burford B., Celis M. R., Fahimipour A. K., Guevara I. L., et al. (2023). Demystifying image-based machine learning: a practical guide to automated analysis of field imagery using modern machine learning tools. Front. Mar. Sci. 10, 1157370. doi: 10.3389/fmars.2023.1157370
Bell K. L. C., Quinzin M. C., Poulton S., Hope A., and Amon D. (Eds.) (2022). The 2022 Global Deep-Sea Capacity Assessment. Ocean Discovery League. Saunderstown, USA. doi: 10.21428/cbd17b20.48af7fcb
Bommasani R., Hudson D. A., Adeli E., Altman R., Arora S., von Arx S., et al (2021). On the opportunities and risks of foundation models. Stanford University Human-Centered Artificial Intelligence 2108, 07258. doi: 10.48550/arXiv.2108.07258. Retrieved from https://crfm.stanford.edu/report.html
Branson S., Wah C., Schroff F., Babenko B., Welinder P., Perona P., et al. (2010). “Visual recognition with humans in the loop,” In Daniilidis K., Maragos P., and Paragios N. (eds) Computer Vision – ECCV 2010. Lecture Notes in Computer Science Springer, Berlin, Heidelberg, 6314, 438–451. doi: 10.1007/978-3-642-15561-1_32
Chen Q., Beijbom O., Chan S., Bouwmeester J., and Kriegman D. (2021). “A new deep learning engine for coralnet,” in 2021 IEEE/CVF International Conference on Computer Vision Workshops (ICCVW). Montreal, BC, Canada, 3686–95. doi: 10.1109/ICCVW54120.2021.00412.
Crosby A., Orenstein E. C., Poulton S. E., Bell K. L., Woodward B., Ruhl H., et al. (2023). “Designing ocean vision AI: An investigation of community needs for imaging-based ocean conservation,” in Proceedings of the 2023 CHI Conference on Human Factors in Computing Systems (CHI ’23). New York, NY, USA: Association for Computing Machinery, Article 535, 1–16. doi: 10.1145/3544548.3580886.
Francescangeli M., Marini S., Martínez E., Del Río J., Toma D. M., Nogueras M., et al. (2023). Image dataset for benchmarking automated fish detection and classification algorithms. Sci. Data 10, 5. doi: 10.1038/s41597-022-01906-1
Froese R. and Pauly D. (2000). FishBase 2000: concepts designs and data sources Vol. 1594 (WorldFish). ICLARM, Los Banos, Laguna, Philippines. 344 p.
Hong J., Fulton M., and Sattar J. (2020). Trashcan: A semantically-segmented dataset towards visual detection of marine debris. arXiv preprint arXiv:2007.08097. doi: 10.48550/arXiv.2007.08097
Horton T., Kroh A., Ahyong S., Bailly N., Boyko C., Brandão S., et al. (2021). (World Register of Marine Species (WoRMS). Available online at: http://www.marinespecies.org (Accessed 2021-01-30).
Hughes A. J., Mornin J. D., Biswas S. K., Beck L. E., Bauer D. P., Raj A., et al. (2018). Quanti. us: a tool for rapid, flexible, crowd-based annotation of images. Nat. Methods 15, 587–590. doi: 10.1038/s41592-018-0069-0
Jaffe J. S. (2014). Underwater optical imaging: the past, the present, and the prospects. IEEE J. Oceanic Eng. 40, 683–700. doi: 10.1109/JOE.48
Janowski Ł. and Wróblewski R. (2024). Application and evaluation of the ai-powered segment anything model (sam) in seafloor mapping: A case study from puck lagoon, Poland. Remote Sens. 16, 2638. doi: 10.3390/rs16142638
Jansen J., Shelamoff V., Gros C., Windsor T., Hill N. A., Barnes D. K., et al. (2023). The Antarctic seafloor annotated imagery database. bioRxiv 2023.02 16, 528770. doi: 10.1101/2023.02.16.528770
Katija K., Orenstein E., Schlining B., Lundsten L., Barnard K., Sainz G., et al. (2022). Fathomnet: A global image database for enabling artificial intelligence in the ocean. Sci. Rep. 12, 15914. doi: 10.1038/s41598-022-19939-2
Katija K., Sherlock R. E., Sherman A. D., and Robison B. H. (2017). New technology reveals the role of giant larvaceans in oceanic carbon cycling. Sci. Adv. 3, e1602374. doi: 10.1126/sciadv.1602374
Kirillov A., Mintun E., Ravi N., Mao H., Rolland C., Gustafson L., et al. (2023). Segment anything. EEE/CVF International Conference on Computer Vision (ICCV), Paris, France, 3992–4003. doi: 10.1109/ICCV51070.2023.00371.
Norouzzadeh M. S., Morris D., Beery S., Joshi N., Jojic N., and Clune J. (2021). A deep active learning system for species identification and counting in camera trap images. Methods Ecol. Evol. 12, 150–161. doi: 10.1111/2041-210X.13504
Orenstein E. C., Kenitz K. M., Roberts P. L., Franks P. J., Jaffe J. S., and Barton A. D. (2020). Semi-and fully supervised quantification techniques to improve population estimates from machine classifiers. Limnology Oceanography: Methods 18, 739–753. doi: 10.1002/lom3.10399
Perkins N. R., Foster S. D., Hill N. A., and Barrett N. S. (2016). Image subsampling and point scoring approaches for large-scale marine benthic monitoring programs. Estuarine Coast. Shelf Sci. 176, 36–46. doi: 10.1016/j.ecss.2016.04.005
Ren Y., Yang X., Wang Z., Yu G., Liu Y., Liu X., et al. (2023). Segment anything model (SAM) assisted remote sensing supervision for mariculture—using liaoning province, China as an example. Remote Sens. 15, 5781. doi: 10.3390/rs15245781
Rezatofighi H., Tsoi N., Gwak J., Sadeghian A., Reid I., and Savarese S. (2019). “Generalized intersection over union: A metric and a loss for bounding box regression,” in Proceedings of the IEEE/CVF conference on computer vision and pattern recognition (CVPR). Long Beach, CA, USA 2019, 658–666doi: 10.1109/CVPR.2019.00075
Robison B. H., Reisenbichler K. R., and Sherlock R. E. (2017). The coevolution of midwater research and ROV technology at MBARI. Oceanography 30, 26–37. doi: 10.5670/oceanog.2017.421
Russakovsky O., Li L. -J., and Fei-Fei L. (2015). “Best of both worlds: human-machine collaboration for object annotation,” in 2015 IEEE Conference on Computer Vision and Pattern Recognition (CVPR). Boston, MA, USA 2015, 2121–2131. doi: 10.1109/CVPR.2015.7298824
Schlining B. and Stout N. J. (2006). “MBARI’s video annotation and reference system,” in OCEANS 2006 (Boston, MA, USA: IEEE) 2006, 1–5. doi: 10.1109/OCEANS.2006.306879
Sherlock R., Walz K., Schlining K., and Robison B. (2017). Morphology, ecology, and molecular biology of a new species of giant larvacean in the eastern north pacific: Bathochordaeus mcnutti sp. nov. Mar. Biol. 164, 1–15. doi: 10.1007/s00227-016-3046-0
Sherman A. D. and Smith J. K. (2009). Deep-sea benthic boundary layer communities and food supply: A long-term monitoring strategy. Deep Sea Res. Part II: Topical Stud. Oceanography 56, 1754–1762. doi: 10.1016/j.dsr2.2009.05.020
Siriborvornratanakul T. (2024). “Reducing human annotation effort using self-supervised learning for image segmentation,” In Degen H. and Ntoa S. (eds) Artificial Intelligence in HCI. Lecture Notes in Computer/series, 14734. (Cham: Springer), 436–445. doi: 10.1007/978-3-031-60606-9_26
Smith J. K. and Druffel E. (1998). Long time-series monitoring of an abyssal site in the NE Pacific: an introduction. Deep Sea Res. Part II: Topical Stud. Oceanography 45, 573–586. doi: 10.1016/S0967-0645(97)00094-5
Trotter C., Atkinson G., Sharpe M., Richardson K., McGough A. S., Wright N., et al. (2020). NDD20: A large-scale few-shot dolphin dataset for coarse and fine-grained categorisation. arXiv preprint arXiv:2005.13359. doi: 10.48550/arXiv.2005.13359
Van Horn G., Branson S., Farrell R., Haber S., Barry J., Ipeirotis P., et al. (2015). “Building a bird recognition app and large scale dataset with citizen scientists: The fine print in fine-grained dataset collection,” in 2015 IEEE Conference on Computer Vision and Pattern Recognition (CVPR). Boston, MA, USA, 2015, 595–604. doi: 10.1109/CVPR.2015.7298658
Wah C., Branson S., Perona P., and Belongie S. (2011). “Multiclass recognition and part localization with humans in the loop,” in 2011 International Conference on Computer Vision (Barcelona, Spain: IEEE) 2011 2524–2531. doi: 10.1109/ICCV.2011.6126539
Weinstein B. G. (2018). A computer vision for animal ecology. J. Anim. Ecol. 87, 533–545. doi: 10.1111/1365-2656.12780
Zhao T., Gu Y., Yang J., Usuyama N., Lee H. H., Kiblawi S., et al. (2025). A foundation model for joint segmentation, detection and recognition of biomedical objects across nine modalities. Nat. Methods 22, 166–176. doi: 10.1038/s41592-024-02499-w
Zurowietz M., Langenkämper D., Hosking B., Ruhl H. A., and Nattkemper T. W. (2018). Maia—a machine learning assisted image annotation method for environmental monitoring and exploration. PloS One 13, e0207498. doi: 10.1371/journal.pone.0207498
Keywords: foundation model, marine imagery, segmentation, object detection, human-in-the-loop
Citation: Orenstein EC, Woodward B, Lundsten L, Barnard K, Schlining B and Katjia K (2025) Assisting human annotation of marine images with foundation models. Front. Mar. Sci. 12:1469396. doi: 10.3389/fmars.2025.1469396
Received: 23 July 2024; Accepted: 25 June 2025;
Published: 24 July 2025.
Edited by:
Matthias Obst, University of Gothenburg, SwedenReviewed by:
Wang Minxiao, Chinese Academy of Sciences (CAS), ChinaLukasz Janowski, Gdynia Maritime University, Poland
Carla Cherubini, Politecnico di Bari, Italy
Copyright © 2025 Orenstein, Woodward, Lundsten, Barnard, Schlining and Katjia. This is an open-access article distributed under the terms of the Creative Commons Attribution License (CC BY). The use, distribution or reproduction in other forums is permitted, provided the original author(s) and the copyright owner(s) are credited and that the original publication in this journal is cited, in accordance with accepted academic practice. No use, distribution or reproduction is permitted which does not comply with these terms.
*Correspondence: Eric C. Orenstein, RXJpYy5PcmVuc3RlaW5Abm9jLmFjLnVr